1 1-24-04 wp/figure jnp-4b
TRANSCRIPT

1 1-24-04 WP/Figure JNP-4B
Qualified Costs Components
Original Amount ($000)
Description
NBV Gen Assets excl Exc Mitig&Environ.
Excess Mitigation Refunded
Market Value Generation Assets
Environmental Expenditures
Regulatory Assets (SFAS 109)
Deferred Debits (SFAS 71)
Above Market Purchase Power Costs
CTC on GLO Tariff
True-up of Capacity Auction Proceeds + Interest
Final Fuel Balance
Price To Beat True-up
Interest
ADFIT Reduction
Securitization Costs Total
$3,379.717 $469,684
($3,417,428)
$71 7.63
$150,473
$25,279
$48,344
($984)
$1,059,134
($75,253) ($1 76,600)
$121,028
($1 10,499)
$21.782
$2,212,311
CNP's Statewide Stranded Costs > $5 Billion $0
800

n f 8
m
(D W t
801

L
n z I- * c
802

A
v d
3 I 9%::- P m
w r - w c o m o o ~ W O N * N r-
m r - w m l - 0 0 6 O N * d N I=
10 r - * r - r n o o ~ O l c r 0 b N 00
r- sd m t d O O O
osr- d. =;N *Wr-
803
r
a'
c c
a z I- * c
Lu
L e v)
I
I N- ni
E 8 3 m o m
- c i
804

h e
N 69
SO5
uj E 4
806

% *
* a 3 C al > d
m m
807

a, r- a, 2 9 F
a, r- a, N r 9 7
a, r- a, c! 9 r
a, k a, $! 9 r
t - o t - m o t - g 8 a," 0 - d a- 3
I a,
Y
o m m a Y
808

d I-
In 69
I--
In co Cr) 69 '9
Q) In z
f
809
I
I
810

s
c 3: r
811

m m O
OD (4 w w
h N w w
812
813

II n
9 W
814
s 0 0 0
8 s1
815

816
i u
h I- * CO 2 r
E
817

0
818

.- d, U
819

v 0.
b a v)
r- Q) v)
3 s d - d
820

821

0 0
tii 0 P cv
822

PUC DOCKET NO. 21665 FTNANCING ORDER PAGE 40 OF 71
76. Using the pmdures described in Finding of Fact No. 75, $1,803,000 of the $740 million
approved for securitization in this Fmcing Order was allocated to Texas-New Mexico Power
(TNMP). This amount is to be recovefed fnnn TNMP out of existing base rates during the
remaining term of the TNMP contract. No portion of this amount will be included in any true-up
adjustment.
- >
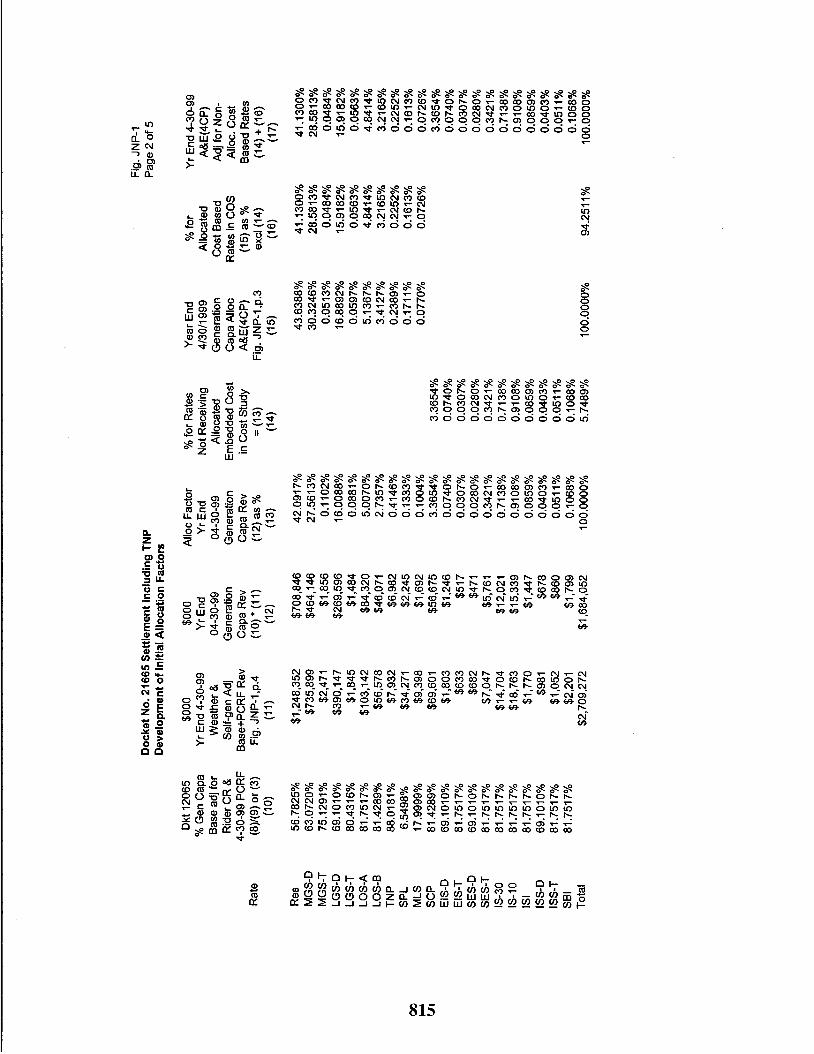
77. The Settlement Agreement included the following initial WS: CIasS RAAF
Residential 35.5763% MGS
LGS
LOS-A
LOS-B SCP
Non-Metered Lighting Standby Electric Service -Distribution
Intemptible Service Supplemental- Distribution
Standby Elecaic Service-Transmission htemptible Service 30-Minute Notice
Interruptible Service lO-h!linute Notice
Interruptible Service Instantaneous Inkmptible Service Supplemental-Transmission Standby Intemptible Service
3 1.054496
17.4076%
5.2845%
3.4886%
3.6578% 0.2536%- 0.0304% 0-0606%
03718%
1.075296
1.37208
0.1294%
0.0769%
0.1609%
Total lOO.OODO%
78. As of the date for customcz choice under PURA 839.102, new customers will be
assigned to the transition change classes listed above based on the definitions and proceduns
described in Schedule TC.
823

Blank Page
824

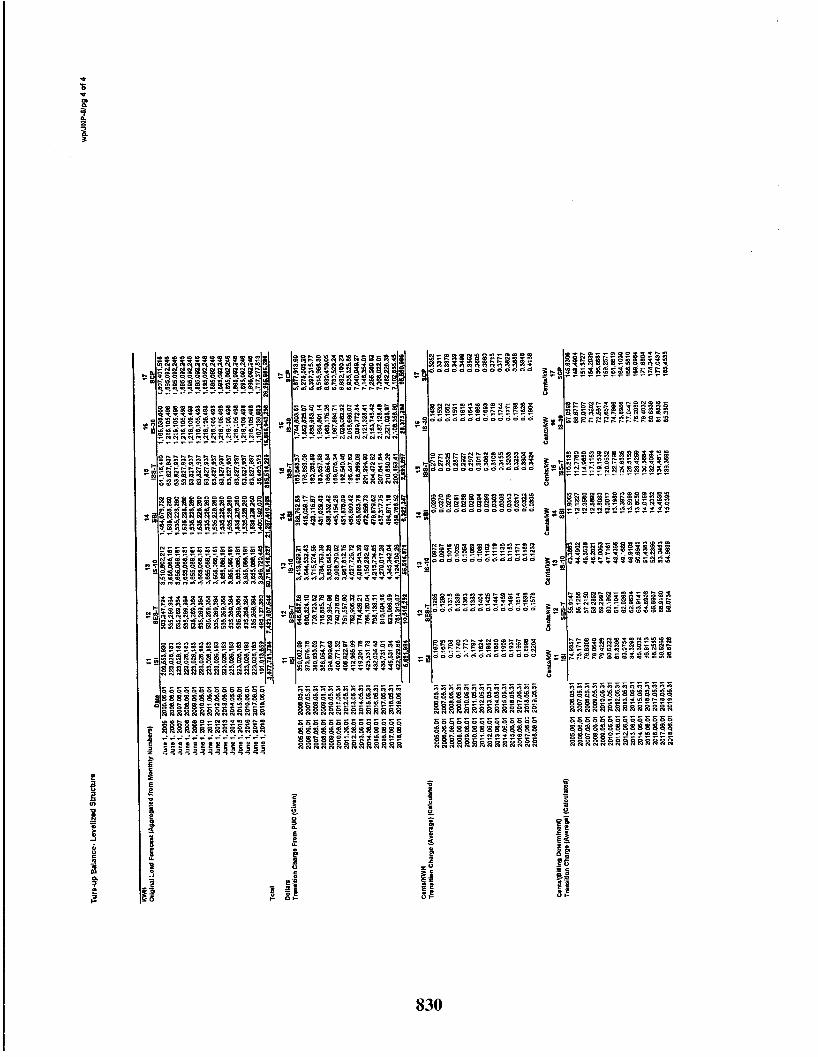
1 1-24-04 Calculation of Phase-in TC2 Charges
TC2 Billing Group
Residential
MGS-D MGS-T
LGS-D LGS-T LOS-A
LOS-B Lighting SCP
SES-D SES-T IS-30
IS-10 IS1 ISS-D
ISS-T SBI Total
TC2 Allocator
31.5813%
33.2241% 0.2146% 19.0397%
0.1405% 5.14 1 0%
3.600 1 Yo
0.4350% 3.0481%
0.0290% 0.3353% 0.9048%
1.7702%
0.1 815% 0.0673%
0.0859% 0.2016%
100.0000%
Qualified Cost by TC2 Billing Group ( TC2 Allocator
* First Year Revenue Requirement )
$14,212
$14,951
$97 $8,568
$63 $2,3 13
$1,620 $196
$1,372
$13 $151
$407 $797
$82
$30 $3 9 $9 1
$45,000
Billing Determinants
23,431,239,212
18,813,557,252
862,090 26,498,086
116,601 9 3 10,43 1
3,847,042
272,373,119 4,030,645
166,259
1,156,382 2,601,863 7,867,985
467,070 130,968 150,161
3,265,140 42,577,840,306
WP I Fig JNP-5 I Phase-in Charges
TC2 Charges
( First Year Revenue Requirement I Billing
Determinants )
$0.000607 $0.000795 $0.112018 $0.323339
$0.542234
$0.243254 $0.421 114
$0.000719 $0.340304
$0.078492
$0.130480 $0.156488 $0.101244
$0.174867 $0.23 1240 $0.257424 $0.027784
$1 kWh $lkWh $IkW $ I kVa S/kW $/kW $lkW $ / kWh $lkW $IkW $lkW SIkW $/kW $lkW $ikW $IkW SIkW
825
11-24-04
TC2 Billing Group
Residential
MGS-D MGS-T LGS-D LGS-T
LOS-A
LOS-B Lighting
SCP SES-D SES-T
IS-30 IS-10
IS1 ISS-D ISS-T SBI Total
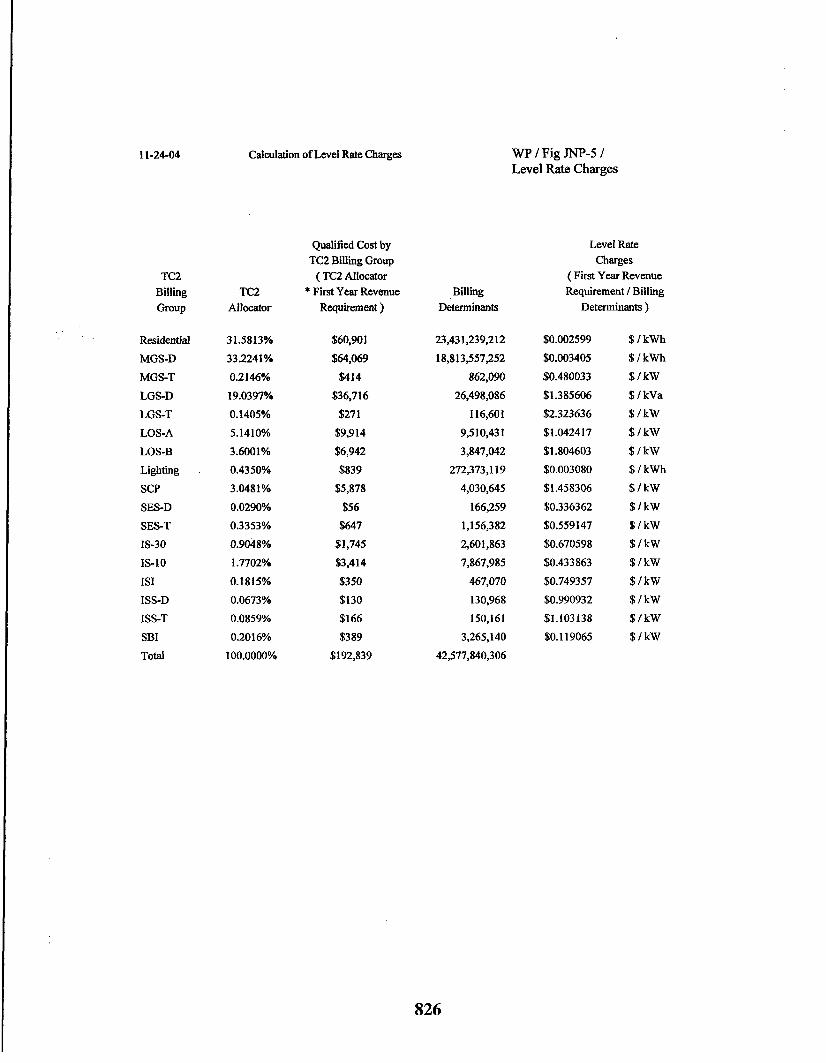
Calculation of Level Rate Charges
TC2 Atlocator
31.5813% 33.224 1 %
0.2146%
19.0397% 0.1405% 5.1410%
3.6001% 0.4350% 3.0481% 0.0290% 0.3353%
0.9048% 1.7702Yo
0.1815%
0.0673% 0.0859% 0.201 6%
100.0000%
Qualified Cost by TC2 Billing Group ( TC2 Allocator
* First Year Revenue Requirement )
$60,901
$64,069
$414 $36,716
$271 $9,914 $6,942
$839 $5,878
$56
$647 $1,745 $3,414
$350 $130 $166
$389 $192,839
Billing Determinants
23,43 1,239,2 12 18,813,557,252
862,090
26,498,086 116,601
9 3 10,43 1
3,847,042 272,373,119
4,030,645
166,259 1,156,382 2,601,863 7,867,985
467,070 130,968 150,161
3,265,140
42,577,840,306
WP 1 Fig JNP-5 / Level Rate Charges
Level Rate Charges
( First Year Revenue Requirement I Billing
Determinants )
$0.002599 $0.003405 $0.480033
$1.385606 $2.323636 $1.04241 7
$1.804603 $0.003080
$1.458306
$0.336362 $0.559147 $0.670598
$0.433863 $0.749357
$0.990932 $1.103 138
$0.1 19065
$ / kWh $ / k w h $ /kW
$ I kVa % / k W $ / k W $ / k W $ I kWh $ / k W
$ / k W
$ / k W S I k W $ l k W
$ /kW $ / k W $ / k W $ / k W
826

827

P r
828
829
830
WORKPAPERS TO SCHEDULES
831

832
833
$ t
-\ SL 3
834
.J--- 1

3 I
e
'L a 3 h- 1 h
..-
835

dr
836

i! t
3
A a
837
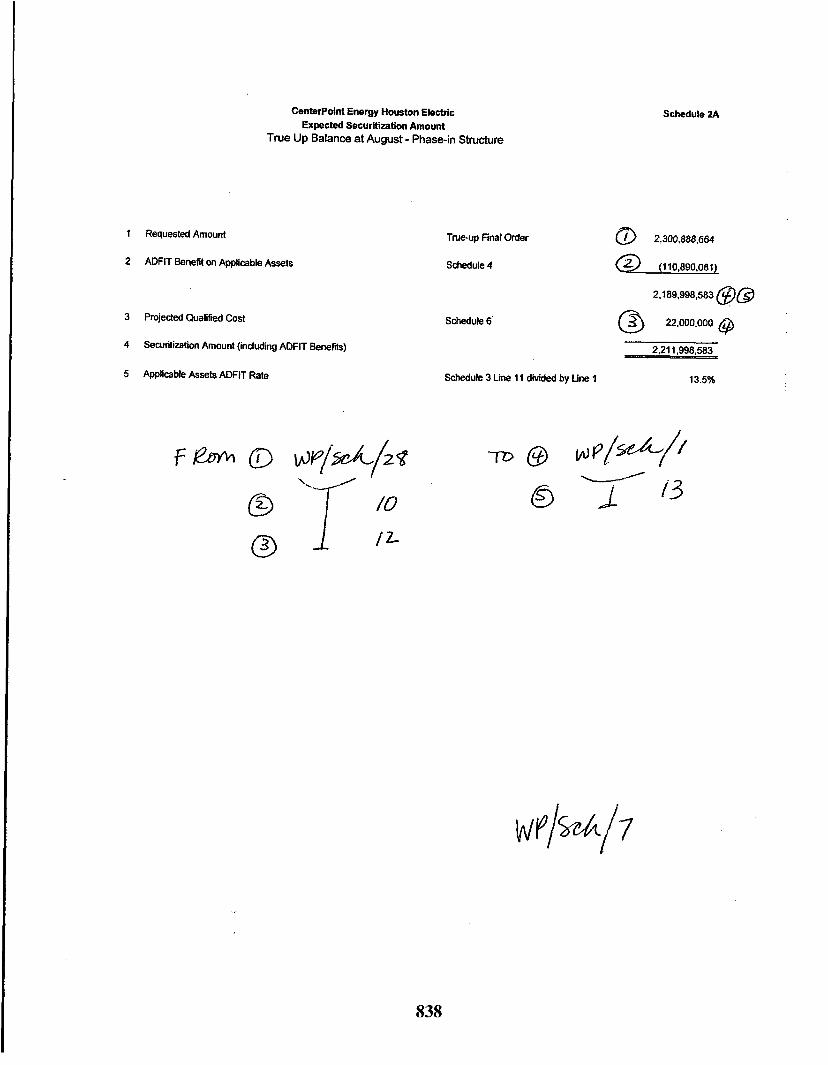
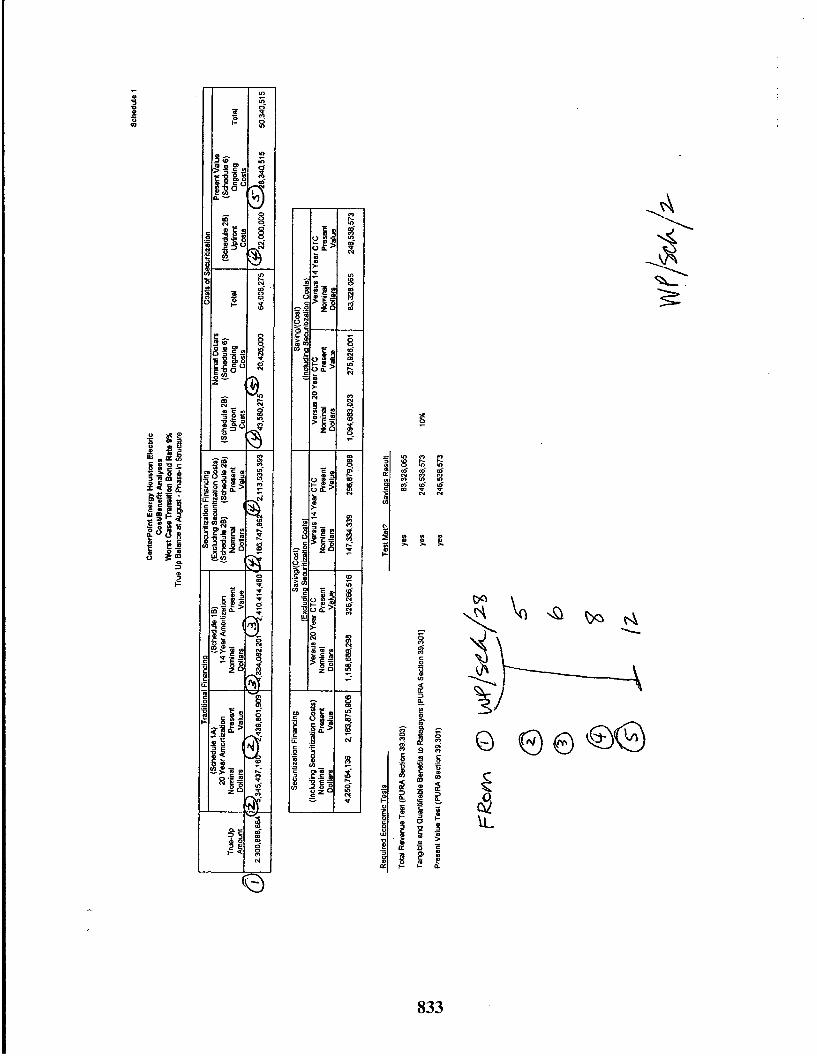
CenterPoint Energy Houston Electric Expected Securitization Amount
True Up Balance at August - Phase-in Structure
Schedule 2A
1 Requested Amount
2 ADFlT Benefit on Applicable Assets
3 Projected Qualified Cost
4
5 Applicable Assets ADFIT Rate
Secunlization Amount (mduding ADFIT Benefits)
" 1 0 :"L
Tme-up Final Order
Schedule 4
Schedule 6'
a 2,300,888.664
@ (110,890,081~
@@
Q
2,189,998,583
@ 22,000,000
2,211,998,583
13.5% Schedule 3 Line 11 divided by Line 1
838
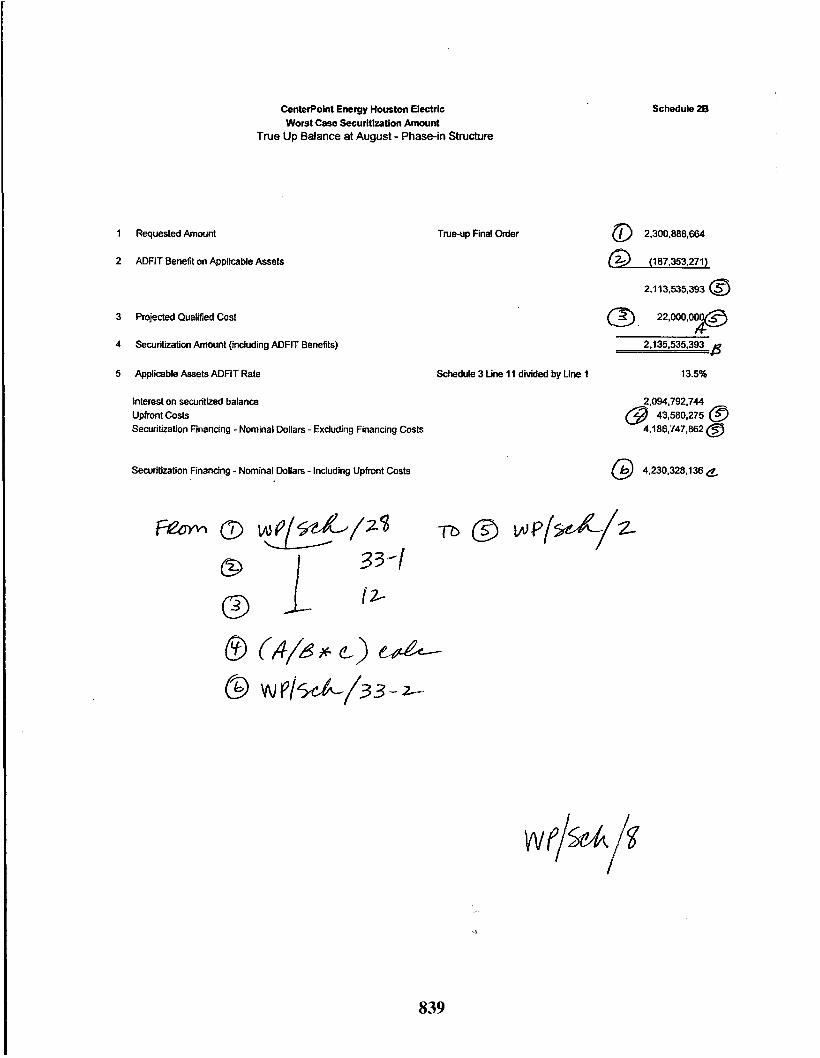
CenterPoint Energy Houston Electric Worst Case Securitization Amount
True Up Balance at August - Phase-in Structure
1 Requested Amount
2 ADFIT Benefit on Applicable Assets
3 Projected Qualified Cost
4
5 Applicable Assets ADFIT Rate
Securitization Amount (induding ADFIT Benefits)
Interest on securitized balance Upfront Costs Securitizalion Financing - Nominal Dollars - Exduding Financing Costs
Securitization Finandng - Nominal Dcllars - Including Upfront Costs
True-up Final Order
Schedule 3 Line 11 divided by Line 1
Schedule 28
a 2,300,888,664
2,113,535,393 @ 22,000.000@
A b 2.1 35,535,393
13.5%
2,094,792,744 @ 43.580.275 Q
4,186,747,862 @
@ 4,230,328,136
839
1
2
3
4
5
6
7
8
9
10
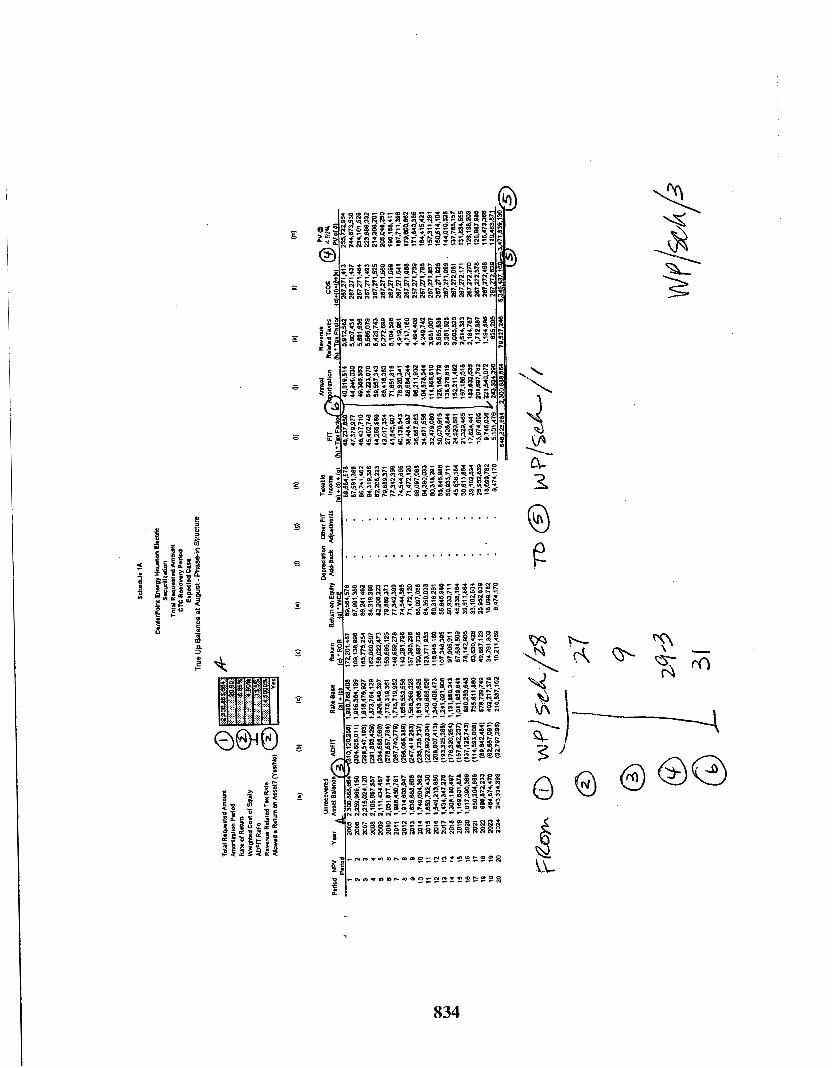
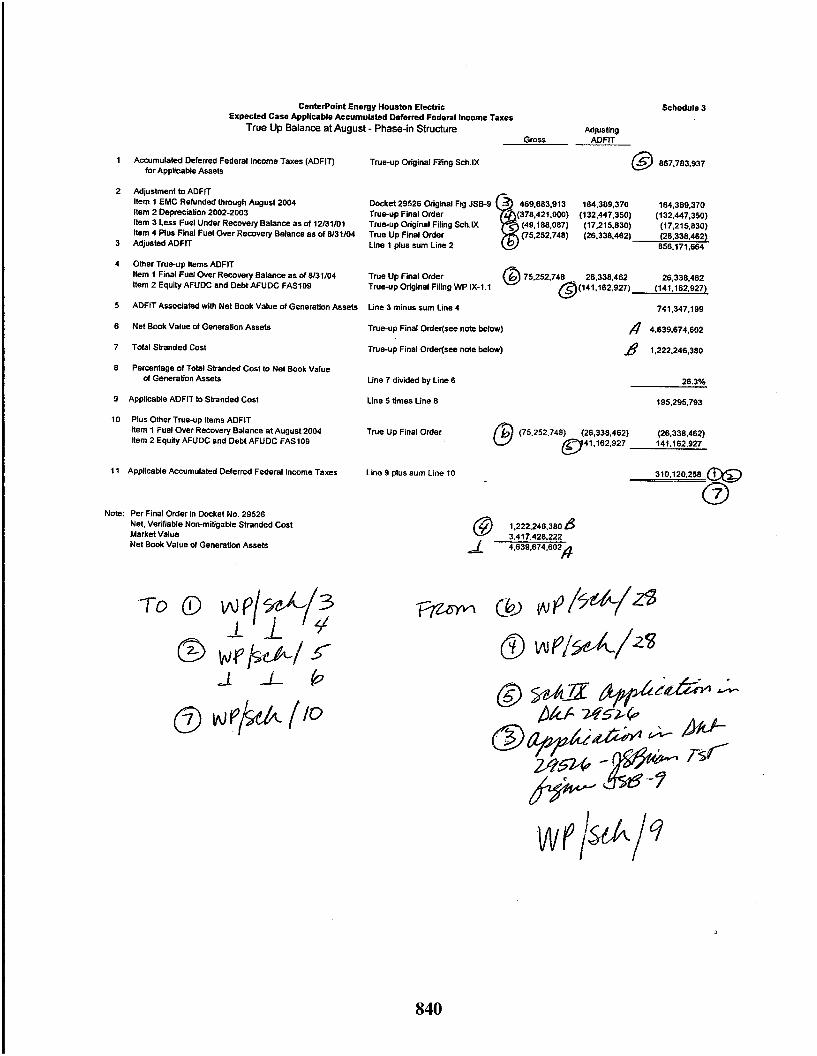
Centerpoint Energy Houston Electric Expected Case Applicable Accumulated Deferred Federal Income Taxes
True Up Balance at August - Phase-in Structure Gmss
Accumulated Deferred Federal Income Taxes (ADFIT) True-up Original Filing Sch.lX for Applicable Assets
Adjustment to ADFIT Item 1 EMC Refunded through August 2004 Item 2 Depreciation 2002-2003 Item 3 Less Fuel Under Recovery Balance as of 12/31/01 Item 4 Plus Final Fuel Over Recovery Balance as of 8/31/04 Adjusted ADFIT
Docket 29526 Original Fig JSB-9
(49,188,087) (75,252,748)
T ~ e - u p Final Order TNe-Up Original Filing Sch.lX True Up Final Order Line 1 plus sum Line 2
Schedule 3
Adjusting ADFIT
@ 867,783.937
164,389,370 164,389.370 (132,447,350) (132.447.350)
(17.21 5.830) (1 7.21 5.830) (26.338.462) (26.338.462)
856.171.664
Other True-up Items ADFIT Item 1 Final Fuel Over Recovery Balance as of 8/31/04 Item 2 Equity AFUDC and Debt AFUDC FAS109
ADFIT Associated with Net Book Value of Generation Assets
26.338.462 (141.162.927) (141,162,927)
741 347.199
True Up Final Order T r u w p Original Filing WP IX-1.1
Line 3 minus sum Line 4
Net Book Value of Generalion Assets
Total Stranded Cost
Percentage of Total Stranded Cost to Net Book Value of Generation Assets
Applicable ADFIT to Stranded Cost
Plus Other True-up Items ADFIT Item 1 Fuel Over Recovery Balance at August 2004 Item 2 Equity AFUDC and Debt AFUDC FAS109
11 Applicable Accumulated Deferred Federal Income Taxes
Note: Per Final Order in Docket No. 29526 Net, Verifiable Non-mitigable Stranded Cost Market Value Net Book Va lued Generation Assets
True-up Final Order(see note below)
T N W p Final Order(see note below)
Line 7 divided by Line 6
Line 5 times Line 8
4 4.639.674.602
8 1,222246,380
28.3%
195,295,793
(26.338.462) 141.162.927 41.162.927
True Up Final Order
Line 9 plus sum Line 10
@ 1,222.246.380 B 3.417.428.222 4.639.674.602 A
310.120.258 00 0
840

Centerpoint Energy Houston Electric Expected Case ADFIT Benefit on Applica True Up Balance at August - Phase-in Structure
Period
ft- Applicable ADFIT @I 310,120,258 I
0.583 1.583 2.583 3.583 4.583 5.583 6.583 7.583 8.583 9.583 10.58 11.58 12.58 13.58 14.58 15.58
Year
2005 2006 2007 2008 2009 201 0 201 1 2012 201 3 201 4 201 5 201 6 201 7 201 8 201 9 2020
ADFIT pv @
PV of (I) Payment 4.70%
(4,972,848) (4,841,385) (10,276,191) (9,555,423)
4,838,047 4,296,760 19,451,287 16,499,574 20,853,455 16,894,904 22,247,057 17,214,864 23,673,835 17,496,572 251 79,457 17,773,953 26,858,474 1 8,108,076 28,710,726 18,487,938 30,667,402 18,861,429 32,730,381 19,226,578 34,915,673 19,589,560 37,516,270 20,103,757 17,727,232 9,073,019
Schedule 4
.# 310,120,258 199,230,177
ADFIT Benefit 11 0,890,081 @ N te: Discount rate was assumed to be 4.7% to facilitate iterations of the bond issuance 8 and in the final issuance advice letter will equal the average bond issuance cost.
841

Year
Centerpoint Energy Houston Electric Expected Case Amortization Stream
True Up Balance at August - Phase-in Structure
Securitized Interest Principal Payments Payments Payments
(r3- Principal & Interest
(20,987.962) (44,333.250) 107,412.879 288,956,087 246,205,445 250,171.942 253,981,635 270,602,521 343.1 92,551 265,759.363 269,842,045 274.01 2,089 278,292,225 284,317,942 129,589,629
2005 112Year 2006 2007 2008 2009 2010 201 1 2012 2013 2014 2015 2016 2017 2018 2019 IRYear
14,481,954 28,963,908 72.904.462
150,215,565 97,463,655 91,489,981 85.122.871 91,004,584
151,618,660 60,973,883 51,100.150 40,555,545 29,248,615 16,725.009 3.146.299
___l_j
(35,469.916) (73,297,158)
138,740,522 148,741,790 158,681,961 168,858,764 179,597,937 191,573.891 204,785,480 2 1 8,74 1,895 233,456,544 249,043,610 267,592,933 126,443,330
34,50a,417
TOTAL 3,197,Ol 5,141 985.015.141 2.212.000.000
Upfront costs 31,796,73501
Securitization Nominal Bond Rate Excl Sec costs
Amortization % Expected Case
-1.60% -3.31% 1.56% 6.27% 6.72% 7.17% 7.63% 8.12% 8.66% 9.26% 9.89%
10.55% 1 1.26% 12.10% 5.72%
100.00%
a 4.52%
Schedule 5
OC Acct 5,000,000
10,000,000 5,333,333
666,666 666,666 666,666 666,666 666,666 666.666 666,666 666,666 666,666 666.666 666,666
(27,666.659)
.:,
842

CenterPoin1 Energy Houston Elechic Projected Qualiiied Cost
TNE Up Balanca a( August - Phasein Shuclure
UDfrmI Cost
ilem 1 Undemrilen' Fees Rem 2
Item 13 T~ee 's fhs tee 's Couwel Fees and
Rem 3 Legal FseslExp for Undemrilws' Counsel Hem 4 Fee for Commissim's F m i a l Advisa Rem 5 Raliing Agency Fees Rem 6 Fee for Company's Financial Advisor IIem 7 PrWrglEdgarizii Exp~lses Rem 8 SEC R e g i s W i Fee llem 9 Securitizalion Proceeding Expanses Item 10 Miscellanecus AdminisIralive Costs Item H Acmnlanrs F ~ S Item 12 Servicer Sat-up Costs
Item 14 Legal Fees for Commission's C-l
& 11277,281 Legal FmsiExp for Company'snssuah
1,600,000 1 . 0 5 0 . ~
375.000 350.000 280.219 130.000
75.000 1o.ooo
lo.m
W Ne( Present Value of Ongoing Costs al Bond Rate Net Present Value of Ongoing Costs at Worst Case Bond Rate
Remked Ombrs Cost
Ongoing Servieer Fee (CEHE as Servicer) (0 05% of principal a m d ) OrgDing Servieer Fee (Third Party as Servicer) (0.60% of principal amount) Adminishation Fee Accaunlanls' Fee Legal Fms/Expenses rw CompWMssWs Counsel TNstae's/TNstee's Counsel Fees and Expenses Independent Managers' Fee Raling Agency Fees PrinIngEDGARiiation Expenses Miscellaneous
TOTAL (CEHE as Swvicer)
TOTAL (Third Party as Servicer)
Schedule 6
Onaoino Cost
Onqoima Cast NPV 02: @:$ ) m PV of (I)
2005 @ 729.500 710.500 0.5 713.556 694.981 2006 1,459,000 1,421.000 1.5 1.365.467 1.329.903 2007 1.459.000 1.421.WO 25 1.3C6.467 1.272.439 2oM) 1.459.000 . 1,421.000 3.5 1,250,016 1.217.459
2010 1,459,ooO 1.421.M 5.5 1,144,327 1.114.522 2009 1.459.m 1.421.M 4.5 1.196.004 1.164.854
mi1 1.459.W 1.421.000 6.5 1,094.882 1.066.365 2012 1.459.000 1.421.wO 7.5 1.047.573 1,020,289
2014 1.459.000 1.421.M 9.5 9ss.001 934,023 2013 1.459.0(10 1.421.000 8.5 1.w2.309 976.204
2015 1.459.000 1.421.000 10.5 917,563 893.665 2016 1.459,WO 1,421.0M) 11.5 877.917 855.051 2017 1,459.WO 1,421.000 12.5 839.983 818.106 2018 1,459.000 1,421,000 13.5 803.609 782,758
729.500 710.500 14.5 384.481 374,467 14.903.244 14.515,085
OC ACa @ 9.538.780 B13.825.43O 24.440.003 28,340.515
- a A- @ 4.52% & 24,440,003
Expeaed Wont
1W.WO 75.000
4 . m 3.500
50,000 50.WO 2 0 . m 20.000
$1,459,000 $1.421.000
$1 3.625.000 $1 3.169.000
I
'3 2- @"7' 0 1 30
843

CenterPoint Energy Houston Electric Pro-Forma Capital Structure For Regulated Transmission and Distribution Company True Up Balance at August - Phase-in Structure ($ millions) Use of
Collateralized Term Loan
Less: Debt Cost Total Long-term Debt
Common Equity
Other Notes Payable
Schedule 7
1,310 1,310 - 2 2
(148) (148) 2,757 1,310 1,447 60%
1,843 880 963 40%
Note: Until exact timing of bond issuance is known, final Capital Structure will not be known.
844

845

3 '
846

E 23 00
s
- e
e
\".- s P 3
a47

8
S z
848

B
s
E
849