091015 the impact of exceptional events 'unusual … · the impact of exceptional events...
TRANSCRIPT

The Impact of Exceptional Events ‘Unusual Winds’ on PM10 Concentrations in Arizona
Air Quality Division
October 15, 2009

2
This page is intentionally blank.

TABLE OF CONTENTS Page
1.0 INTRODUCTION………………………………… ....................................................................... 1 2.0 SPATIAL AND TEMPORAL VARIABILITY OF WINDBLOWN DUST EVENTS…………...1 3.0 THRESHOLD FRICTION VELOCITIES AND THRESHOLD WIND SPEEDS………….……3 4.0 BEST AVAILABLE CONTROL MEASURES (BACM) EFFECTIVNESS…………………….9 5.0 OTHER INFLUENTIAL FACTORS IN THE FORMATION AND IMPACT OF………………9 WINDBLOWN DUST 6.0 THE EFFECT OF PARTICLE SIZE AND TURBULENCE ON DUST SETTLING…………..10 RATES 7.0 LITERATURE CONCLUSION……………………………………………………………….…11 8.0 EXAMINATION OF HISTORICAL WIND & PARTICULATE MATTER…………...………11 DATA IN ARIZONA – WIND THRESHOLD EFFECT 9.0 UNUSUAL WINDS…………………………………………………………………………..….15 LIST OF TABLES Page Table 1 Frequency of Dust Episodes from Various Studies for Yuma, AZ…………...…………..2 Table 2 Threshold Friction Velocities for Typical Desert Surface Types……..……..……..……..4 Table 3 Aerosol Emission Test Results…………. .......................................................................... 5 Table 4 Site Surface and Textural Characteristics …………. .......................................................... 7 Table 5 Threshold Dust-lofting Wind Speed in Various Desert Environments…………………...8 Table 6 Cross-tabulation of Average Wind Speed and PM Concentrations………………...……13 Table 7 Cross-tabulation of Hourly Maximum Wind Gust and PM Concentration………..…….14 REFERENCES..………….………….…………….………….………….………….…………….……..12

4

This page is intentionally blank.

1
1.0 Introduction Windblown dust has been and continues to be a pollutant of concern throughout the deserts of Arizona and southeastern California. The Arizona Department of Environmental Quality (ADEQ) requests that these dust episodes are excluded from regulatory decisions when the dust is associated with non-anthropogenic emissions or when control measures are overwhelmed by strong winds. During the last several years, these requests have increased substantially due to a greater deployment of continuous particulate matter (PM) monitors throughout Arizona. To supplement the exceptional event analyses for high wind and blowing dust events in Arizona, a review of historical meteorological and environmental data was conducted. Additionally, literature concerning the effects of strong winds on particulate emissions was examined. This literature review focused on (1) the theory behind dust suspension caused by wind; (2) laboratory experiments documenting wind speed thresholds that suspend soil particles; and (3) the frequency with which blowing dust occurs in the desert southwest as determined from meteorological data and observations of blowing dust. The Western Regional Air Partnership (WRAP) conducted a thorough review of literature relating to impacts of fugitive dust on air quality. Much of this information was compiled into WRAP’s Fugitive Dust Handbook (FDH) (WRAP FDH, 2006). While the handbook does not apply to ambient air quality monitoring, it does include specific information about various control measures for agricultural activity, construction activity, paved and unpaved roads, and more. Sections of this handbook cover the windblown suspension of dust from both anthropogenic and natural, barren areas. The FDH (2006) defines anthropogenic dust as “solids and dissolved solids entrained by wind passing over surfaces that have been disturbed or altered by humans beyond a natural range”. The handbook gives examples of such anthropogenic sources of dust including construction and mining sites, agricultural activities, material storage piles, landfills, vacant lots, roadways, and parking lots. The FDH defines natural dust as “solids and dissolved solids entrained by wind passing over surfaces that have not been disturbed or altered by humans beyond a natural range” (WRAP FDH, 2006). Examples of these natural dust sources include naturally dry riverbeds and lakebeds, barren lands, sand dunes, and non-agricultural grass, range, or forest lands. It is important to note that “natural and anthropogenic dust will often be indistinguishable and may occur simultaneously”, which means that while natural areas may emit dust during high wind events, those same areas will emit more dust when their surfaces have been or are in the process of being disturbed by human activities (WRAP FDH, 2006). One example of this would be a dry riverbed (a natural dust source) that has recently been the site of all-terrain vehicle activity (an anthropogenic influence). While wind generated emissions may result from open dust sources during high wind events, those emissions can exhibit a high degree of variability from one site to another, and may fluctuate widely at any given site. The FDH gives two groups of site characteristics that can cause such variability:
(a) Properties of the exposed surface material from which the dust originates (b) Measures of energy expended by wind interacting with the erodible surface
In addition to these site specific characteristics, the spatial and temporal variances in the interaction of the atmosphere with the surface also contribute to the variability of windblown dust emissions. 2.0 Spatial and Temporal Variability of Windblown Dust Events Several studies have been conducted on the spatial and temporal variability of dust episodes associated with high wind events in Arizona and California. Dust events have been defined by a reduction in visibility to less than 11 km (Orgill and Sehmel, 1976; McTanish and Pitblado, 1987). Additionally, events with visibilities ≤ 1 km may have significant impacts on atmospheric pollution, health hazards, and

2
environmental air quality (Jauregui, 1989a cited by Bach et al. 1996; Middleton, 1989a cited by Bach et al. 1996). Many studies have used these < 11 km and ≤1 km visibility criteria to assess the temporal and spatial variability of windblown dust events. From the literature reviewed, the one location that overlaps a majority of the studies is Yuma, AZ. Descriptive statistics of annual average dust events in Yuma range from 9.6 events per year to 27 events per year (Bach et al. 1996; Holcombe et al. 1996; Brazel and Nickling 1987; Brazel and Nickling 1984). Brazel and Nickling’s (1984) calculation of 9.6 events per year appears to be a low outlier in view of other studies. The disparity is likely due to differences in data and/or methodology and does not appear to be associated with the temporal coverage of the analyses. Brazel and Nickling’s (1984) results are likely an underestimate of blowing dust events in Arizona (personal communication, Brazel). When using the 11 km visibility criteria, most studies report annual dust episodes in Yuma to range from 22.4 to 27 events per year (Bach et al. 1996; Holcombe et al. 1996; Brazel and Nickling 1987). When using the 1 km visibility criteria, annual average dust episodes in Yuma range from 1.6 events per year to 4.7 events per year (Bach et al. 1996; Brazel and Nickling 1987; Brazel and Nickling 1984). The use of the different criteria indicates that the occurrence of dust episodes of varying severity in the desert southwest has been an ongoing phenomenon since observations have been taken. The more severe 1 km visibility criteria episodes likely make up a majority of the windblown dust PM10 exceedances in Yuma, AZ. While these events do not occur every day, it is not uncommon for blowing dust episodes to affect a single location several times over the course of any given year.
Table 2 – Frequency of Dust Episodes from Various Studies for Yuma, AZ
Annual Average Dust Episodes Source Time Period Vis < 11 km Vis < 1 km Bach et al (1996) 1973-1984 22.4 2.6 Holcombe et al (1996) 1948-1978 27 N/A Brazel and Nickling (1987) 1942-1982 23.9 4.7 Nickling and Brazel (1984) 1965-1980 9.4 1.6
While much of the research on dust episodes in Arizona has focused on Yuma, AZ, Brazel and Nickling (1984) also analyzed data for other regions of Arizona (i.e., Winslow, Tucson, and Phoenix). Their analysis determined that dust episodes occur more frequently in Yuma and Phoenix in comparison to Tucson and Winslow. While Phoenix and Yuma experience blowing dust episodes on a yearly basis, the characteristics of these episodes can be quite different between the two locations. For example, while Yuma experiences more moderately intense dust storms (i.e. visibilities < 11 km but ≥ 1 km) in any given year, Phoenix experiences more intense dust storms (i.e. visibility ≤ 1 km). On the other hand, Phoenix and Yuma contain a similar distribution in dust episodes throughout a given year with peak occurrences in August and April respectively. Brazel and Nickling (1986) further analyzed these dust episodes and associated them with differing weather types. In general, dust episodes in Yuma are most often associated with synoptic weather patterns, specifically frontal passages. These episodes occur most often in the spring months when the mid latitude storm track reaches furthest south. Phoenix is affected most by dust episodes associated with thunderstorm outflow boundaries during the monsoon season in July and August. Phoenix is more often affected by short duration, high intensity dust storms due to its proximity to the Mogollon Rim and SE Arizona, where thunderstorms develop more frequently. Typical storm motion during the monsoon season is from east to west, but storms can also approach from the north and south. Essentially, storms can approach from an area starting at 0° (north) and rotating clockwise to the 180° (south) azimuth. This is illustrated well in Brazel and Nickling’s (1986) Figure 9(c). It should be noted, however, that dust episodes in Yuma are also associated with thunderstorm outflow boundaries during the monsoon season. Similarly, Phoenix is also affected by non-monsoonal dust storms associated with frontal passages. While dust episodes caused by high winds are most common in the spring and
3
summer for Yuma and Phoenix, respectively, these dust events can occur throughout the year for either location. Dust storms associated with different weather types will also have differing characteristics based on the weather type. For example, dust storms associated with synoptic scale weather types (i.e. frontal passages or trough passages) typically are longer in duration (on the order of several hours to 10 hours) and less intense (i.e. visibilities between 2 and 11 km). Dust storms that are associated with mesoscale weather types (i.e. thunderstorm outflow boundaries) tend to be shorter in duration (1 hour to several hours) but are more intense (visibilities between ¼ mile and 5 miles). While each hour of a synoptic scale driven dust storm may be less intense than an hour in a mesoscale driven dust storm, the effect on human health when averaged over the entire day may be very similar (i.e. 24-hr average PM10 concentrations may be similar for the two types of dust storms). It should be noted that dust storms produced by synoptic type weather patterns are deemed synoptic because the area of high winds is typically fairly large. In many cases, however, the area of blowing dust may be much smaller than the extent of high winds due to the variability in soil characteristics throughout the region or the influences of local topography which can enhance wind speeds at a particular location. This is most often seen in areas such as El Centro, CA and Imperial, CA, and to a lesser degree, Yuma, AZ.
The susceptibility to blowing dust varies greatly over the Sonoran Desert region of the southwestern United States. Holcombe, Ley, and Gillette (1996) determined that mountains, irrigated agricultural areas, wetlands, rivers and lakes, and urban areas all can be characterized as having a low susceptibility to blowing dust. Meanwhile, basin areas have susceptibilities ranging from low to moderate while dry riverbeds and lakebeds and non-irrigated portions of the Colorado River delta are highly susceptible to blowing dust, especially in areas where desert pavement is disturbed exposing fine-grained sediments from beneath (Holcombe et al., 1996). 3.0 Threshold Friction Velocities and Threshold Wind Speeds Another factor that has received some attention in the literature is the dependence of soil type characteristics on particle movement by wind (e.g. Nickling, 1988; Gillette et al., 1980; Gillette et al., 1982; Gillette, 1988; Nickling and Gillies, 1989; WRAP, 2006). There are three ways by which wind can transport soil particles: saltation, surface creep and suspension (Lyles 1988; Nickling 1988). Saltation normally occurs with particles that are too large to be suspended for a long period of time in the atmosphere. The process of saltation involves particles ranging from about 75 to 500 μm in diameter that are lifted from the surface and bounce within a layer close to the boundary between the air and the surface. Particles that are transported by surface creep can range from about 500 to 1,000 μm in diameter and move very close to the ground due to their larger size. Both wind friction and saltating particles can provide the mechanism for particles to move by surface creep (WRAP FDH, 2006). Generally, particles less than about 75 μm in diameter may be suspended in the atmosphere, and these particles tend to follow air currents given strong enough surface winds. The threshold wind speed for the onset of saltation, which helps cause wind erosion leading to windblown dust emissions, is dependant on soil texture and particle size (Nickling, 1988). Thus, smaller dimension particles tend to have the lowest threshold friction velocities and threshold wind speeds at 10m above the surface. The saltation process causes particles to collide resulting in the release of particles in the PM10 size range that are typically bound by surface forces to larger clusters of sediment (WRAP FDH, 2006; Lyles, 1988). WRAP developed a wind blown dust model in addition to creating the FDH. The model was based upon the characterization of various land types and soil conditions. To create this model, a number of assumptions were made, including a threshold wind velocity of 20 mph that is independent of land use and soil texture. This threshold wind speed assumption was based upon previous research measuring
4
both surface and ten meter threshold friction velocities and threshold wind speeds (WRAP, 2006; Lyles 1988). In order to calculate friction velocities or threshold wind speeds the Prandtl Equation is used:
⎟⎟⎠
⎞⎜⎜⎝
⎛=⎟⎟
⎠
⎞⎜⎜⎝
⎛
o
z
zz
uu
κ1
*
Equation (1)
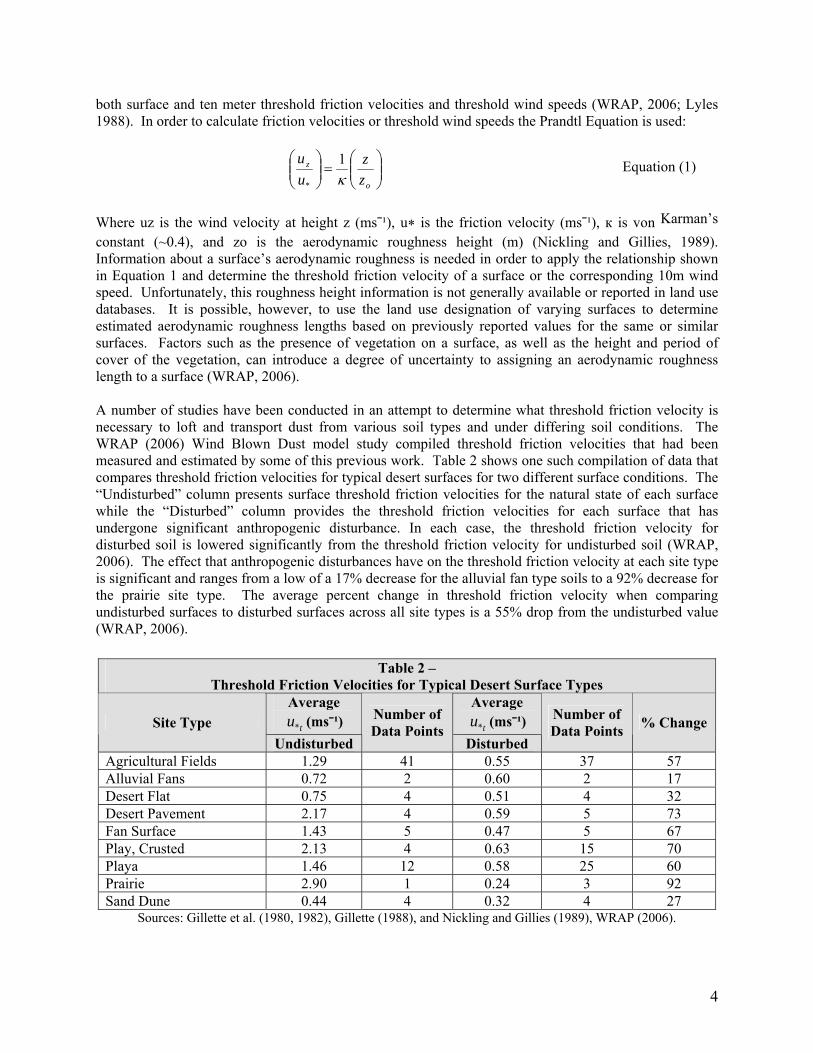
Where uz is the wind velocity at height z (ms¯¹), u* is the friction velocity (ms¯¹), к is von Karman’s constant (~0.4), and zo is the aerodynamic roughness height (m) (Nickling and Gillies, 1989). Information about a surface’s aerodynamic roughness is needed in order to apply the relationship shown in Equation 1 and determine the threshold friction velocity of a surface or the corresponding 10m wind speed. Unfortunately, this roughness height information is not generally available or reported in land use databases. It is possible, however, to use the land use designation of varying surfaces to determine estimated aerodynamic roughness lengths based on previously reported values for the same or similar surfaces. Factors such as the presence of vegetation on a surface, as well as the height and period of cover of the vegetation, can introduce a degree of uncertainty to assigning an aerodynamic roughness length to a surface (WRAP, 2006). A number of studies have been conducted in an attempt to determine what threshold friction velocity is necessary to loft and transport dust from various soil types and under differing soil conditions. The WRAP (2006) Wind Blown Dust model study compiled threshold friction velocities that had been measured and estimated by some of this previous work. Table 2 shows one such compilation of data that compares threshold friction velocities for typical desert surfaces for two different surface conditions. The “Undisturbed” column presents surface threshold friction velocities for the natural state of each surface while the “Disturbed” column provides the threshold friction velocities for each surface that has undergone significant anthropogenic disturbance. In each case, the threshold friction velocity for disturbed soil is lowered significantly from the threshold friction velocity for undisturbed soil (WRAP, 2006). The effect that anthropogenic disturbances have on the threshold friction velocity at each site type is significant and ranges from a low of a 17% decrease for the alluvial fan type soils to a 92% decrease for the prairie site type. The average percent change in threshold friction velocity when comparing undisturbed surfaces to disturbed surfaces across all site types is a 55% drop from the undisturbed value (WRAP, 2006).
Sources: Gillette et al. (1980, 1982), Gillette (1988), and Nickling and Gillies (1989), WRAP (2006).
Table 2 – Threshold Friction Velocities for Typical Desert Surface Types
Average tu* (ms¯¹)
Average tu* (ms¯¹) Site Type
Undisturbed
Number of Data Points
Disturbed
Number of Data Points % Change
Agricultural Fields 1.29 41 0.55 37 57 Alluvial Fans 0.72 2 0.60 2 17 Desert Flat 0.75 4 0.51 4 32 Desert Pavement 2.17 4 0.59 5 73 Fan Surface 1.43 5 0.47 5 67 Play, Crusted 2.13 4 0.63 15 70 Playa 1.46 12 0.58 25 60 Prairie 2.90 1 0.24 3 92 Sand Dune 0.44 4 0.32 4 27

5
Nickling and Gillies (1989) used a portable wind tunnel at thirteen study sites, twelve of which were located in Arizona with one in Algodones, California, in order to analyze threshold friction velocities at sites exhibiting an array of different characteristics. Threshold friction velocities were determined by slowly raising the wind velocity in the portable wind tunnel until movement of particles was noted by observers. This process was repeated multiple times at each site to produce a reliable dataset. Resultant velocities were found to vary significantly across the 13 sampled surfaces. Surface threshold friction velocities ranged from 17.2 cms¯¹ to 58.2 cms¯¹. These threshold friction velocities were then used to calculate the equivalent 10m threshold friction velocities. The threshold wind velocities at the 10m level varied from lows of 5.11 ms¯¹ (11.43 mph) at a mine tailings site in Hayden, AZ and 6.68 ms¯¹ (14.94 mph) in the dry Salt River channel in Mesa, AZ to highs of 16.59 ms¯¹ (37.11 mph) at a Yuma, AZ agricultural site and 18.31 ms¯¹ (40.96 mph) at the dune flats of Algodones, CA (Nickling and Gillies, 1989). Full descriptions of the test sites and results of the wind tunnel studies conducted by Nickling and Gillies (1989) are included in Table 3 and Table 4 below.
Table 3 –
Aerosol Emission Test Results
Site u*
(m/sec) u10m
(m/sec) zo (cm)Mean
Grain Size (μm)
% Silt & Clay
% Aggregates >
.84 mm Mesa, AZ (Agricultural) 0.569 15.63 0.0331 1077.0 18.6 26.8
Maricopa, AZ (Agricultural) 0.578 13.82 0.1255 749.3 11.2 37.3
Yuma, AZ (Agricultural) 0.582 16.59 0.0224 642.6 8.8 18.5
Casa Grande, AZ (Abandoned Agricultural) 0.246 7.80 0.0067 234.4 26.6 2.4
Glendale, AZ (Construction Site) 0.530 14.69 0.0301 1275.1 24.7 27.9
Tucson, AZ (Construction Site) 0.251 7.26 0.0191 1010.9 14.3 21.0
Ajo, AZ (Mine Tailings) 0.228 6.68 0.0176 335.3 8.9 0.5
Hayden, AZ (Mine Tailings) 0.172 5.11 0.0141 271.8 27.3 3.0
Algodones, CA (Dune Flats) 0.625 18.31 0.0166 2794.0 15.2 60.3
Yuma, AZ (Scrub Desert) 0.386 11.33 0.0163 1038.8 17.2 22.4
Yuma, AZ (Disturbed Scrub) 0.320 8.11 0.0731 591.8 3.2 7.7
Tucson, AZ (Santa Cruz River Terrace) 0.180 7.26 0.0204 1950.7 20.9 37.4
Mesa, AZ (Salt River Channel) 0.218 6.68 0.0100 398.7 27.7 11.3
Source: Nickling and Gillies, 1989.
It is interesting to note that of the four agricultural sites tested, the abandoned site in Casa Grande had the lowest threshold friction velocity (Table 3). Based upon the site descriptions, this may be a result of the abandoned field being relatively smooth with a weakly crusted surface. In addition, the abandoned field

6
appears to have lacked the large clods covering its surface that the other three active agricultural fields possessed. Equally interesting is that the sand dune flats of Algodones, California had the highest average threshold friction velocity and 10m wind speed (Table 3). The authors note a relation between aggregate grain size distribution and threshold velocities, and this may explain why the dune flats threshold velocity was found to be so high. The dune flats site had the highest percentage of aggregate particles greater than 0.84mm in size of all the test sites. Interestingly, previous research has suggested that the Algodones Dunes are likely the source for blowing dust that is commonly reported in Yuma, AZ (Brazel and Nickling 1986). Holcombe et al. (1996), on the other hand, hypothesized that the source for observational reports of blowing dust in Yuma may be the East Mesa area instead. All studies show that observational reports of blowing dust in Yuma were associated with wind speeds substantially lower than the Algodones 10m threshold velocity reported by Nickling and Gillies (1989). With the source areas in such close proximity to one another, it becomes difficult to determine which source area is responsible for blowing dust in Yuma, AZ. Other potential explanations for the above results may lie in the soil moisture content of each site, which would tend to vary both by site and by time of year. Neither of these important pieces of information was examined nor reported in the Nickling & Gillies (1989) study. Upon first glance, the threshold velocity results from Nickling & Gillies (1989) might lead one to believe that wind erosion could be initiated at many of the sites under normally occurring winds, but a number of relatively high threshold values at three of the agricultural sites as well as test sites in Mesa, Maricopa, Yuma, AZ and a construction area in Glendale, AZ suggest that a major wind blown dust event would be a relatively infrequent occurrence. It is unclear from the study as to what extent the higher threshold values at these sites can be attributed to any specific control measures that may have been in place. Additionally, natural factors such as recent precipitation, mean grain size, or soil type may have played a role in causing the higher threshold values.

7
Table 4 – Site Surface and Textural Characteristics
Site Site Characteristics Mesa, AZ (Agricultural)
Flat, laser leveled for irrigation; no vegetation or surface trash; double disked 2 days prior to testing; large clods of varying size covering the surface.
Maricopa, AZ (Agricultural)
Flat, laser leveled for irrigation; no vegetation or surface trash; secondary tillage operations in preparation for cotton planting; large clods of varying size covered the surface.
Yuma, AZ (Agricultural)
Flat, laser leveled for irrigation; no vegetation or surface trash; surface was loose and friable with few large clods.
Casa Grande, AZ (Abandoned Agricultural)
Flat, smooth, laser leveled at some previous time; sparse vegetation; primarily annual grasses; weakly crusted surface; easily disturbed.
Glendale, AZ (Construction Site)
Flat, smooth, machine-leveled surface; no vegetation; surface soil heavily pulverized by earthmoving machinery and regularly watered for dust control; easily disturbed by vehicular traffic.
Tucson, AZ (Construction Site)
Very flat, machine-leveled surface; no vegetation; surface soil heavily pulverized by earthmoving; fetch length over 1 km in all directions; regularly watered for dust control.
Ajo, AZ (Mine Tailings)
Extremely flat, extensive copper mine tailings; no vegetation; mainly unconsolidated sediment with some sparsely intermixed crusted areas; fetch lengths greater than 1 km.
Hayden, AZ (Mine Tailings)
Extremely flat copper tailings; no vegetation; light crust is easily disturbed; fetch lengths greater than 1 km.
Algodones, CA (Dune Flats)
Relatively flat, extensive outwash deposits adjacent to Algodones Dune complex; sparse vegetation cover; surface weakly crusted; lag of fine pebbles; heavily disturbed by off-road vehicles.
Yuma, AZ (Scrub Desert)
Relatively flat; sparse vegetation cover; surface is weakly crusted; lag of fine pebbles; heavily disturbed by off-road vehicles.
Yuma, AZ (Disturbed Scrub)
Slightly undulating surface; sparse vegetation cover; primarily annual grasses, sagebrush and creosote bush; surface soil is very loose with little cohesive structure; heavily disturbed by off-road vehicles.
Tucson, AZ (Santa Cruz River Terrace)
Flat terrace deposits adjacent to river; sparse vegetation cover; high silt content with fin gravel lag deposit.
Mesa, AZ (Salt River Channel)
Slightly undulating river bed; no vegetation; surface is very loose with no evidence of crusting; heavily disturbed by off-road vehicles.
Source: Nickling and Gillies, 1989. Nickling and Gillies (1989) stresses an increased potential for aerosol (lofted dust) production at those sites which experience a periodic disturbance of soil such as the river channels and mine tailing sites, as they tended to exhibit lower threshold friction velocities. This was also a point of emphasis in the WRAP (2006) Wind Blown Dust model work that compared threshold friction velocities for disturbed and undisturbed soil of various study sites by compiling available data from previous research such as that done by Nickling and Gillies. Precipitation is another factor to consider, as periodic rains help to build up and maintain a surface crust on the soil by redistributing clay particles on the surface, creating a seal as they are left behind after infiltration and evaporation processes occur (Nickling and Gillies (1989). It is also possible that severe precipitation in the form of brief heavy rain or hail may serve to break up an already developed surface crust and naturally disturb the soil, leading to a greater possibility of a windblown dust event. It has also been shown that individual sites can have vastly different soil conditions based upon any soil vegetation, moisture, or the overall proportion of larger sized grains. That
8
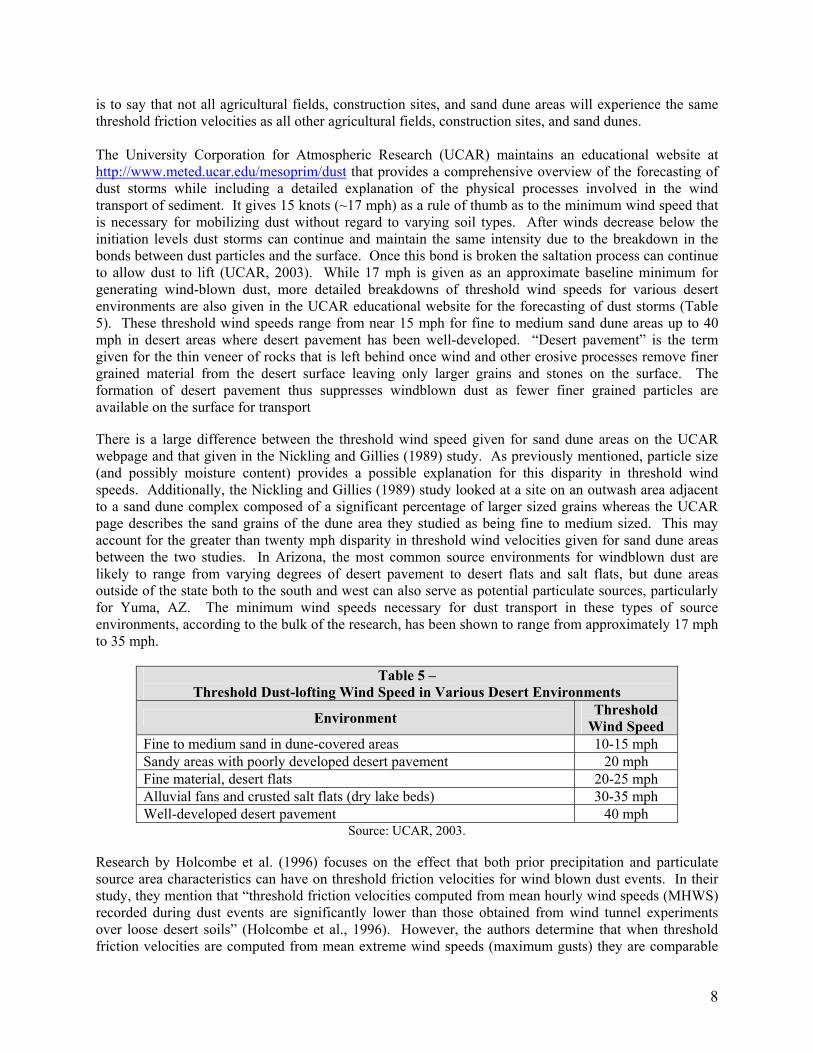
is to say that not all agricultural fields, construction sites, and sand dune areas will experience the same threshold friction velocities as all other agricultural fields, construction sites, and sand dunes. The University Corporation for Atmospheric Research (UCAR) maintains an educational website at http://www.meted.ucar.edu/mesoprim/dust that provides a comprehensive overview of the forecasting of dust storms while including a detailed explanation of the physical processes involved in the wind transport of sediment. It gives 15 knots (~17 mph) as a rule of thumb as to the minimum wind speed that is necessary for mobilizing dust without regard to varying soil types. After winds decrease below the initiation levels dust storms can continue and maintain the same intensity due to the breakdown in the bonds between dust particles and the surface. Once this bond is broken the saltation process can continue to allow dust to lift (UCAR, 2003). While 17 mph is given as an approximate baseline minimum for generating wind-blown dust, more detailed breakdowns of threshold wind speeds for various desert environments are also given in the UCAR educational website for the forecasting of dust storms (Table 5). These threshold wind speeds range from near 15 mph for fine to medium sand dune areas up to 40 mph in desert areas where desert pavement has been well-developed. “Desert pavement” is the term given for the thin veneer of rocks that is left behind once wind and other erosive processes remove finer grained material from the desert surface leaving only larger grains and stones on the surface. The formation of desert pavement thus suppresses windblown dust as fewer finer grained particles are available on the surface for transport There is a large difference between the threshold wind speed given for sand dune areas on the UCAR webpage and that given in the Nickling and Gillies (1989) study. As previously mentioned, particle size (and possibly moisture content) provides a possible explanation for this disparity in threshold wind speeds. Additionally, the Nickling and Gillies (1989) study looked at a site on an outwash area adjacent to a sand dune complex composed of a significant percentage of larger sized grains whereas the UCAR page describes the sand grains of the dune area they studied as being fine to medium sized. This may account for the greater than twenty mph disparity in threshold wind velocities given for sand dune areas between the two studies. In Arizona, the most common source environments for windblown dust are likely to range from varying degrees of desert pavement to desert flats and salt flats, but dune areas outside of the state both to the south and west can also serve as potential particulate sources, particularly for Yuma, AZ. The minimum wind speeds necessary for dust transport in these types of source environments, according to the bulk of the research, has been shown to range from approximately 17 mph to 35 mph.
Table 5 – Threshold Dust-lofting Wind Speed in Various Desert Environments
Environment Threshold Wind Speed
Fine to medium sand in dune-covered areas 10-15 mph Sandy areas with poorly developed desert pavement 20 mph Fine material, desert flats 20-25 mph Alluvial fans and crusted salt flats (dry lake beds) 30-35 mph Well-developed desert pavement 40 mph
Source: UCAR, 2003. Research by Holcombe et al. (1996) focuses on the effect that both prior precipitation and particulate source area characteristics can have on threshold friction velocities for wind blown dust events. In their study, they mention that “threshold friction velocities computed from mean hourly wind speeds (MHWS) recorded during dust events are significantly lower than those obtained from wind tunnel experiments over loose desert soils” (Holcombe et al., 1996). However, the authors determine that when threshold friction velocities are computed from mean extreme wind speeds (maximum gusts) they are comparable
9
to resultant threshold wind speeds obtained from wind tunnel experiments. That is to say that the friction velocities computed from mean extreme winds, i.e., maximum wind gusts, are more in line with wind tunnel studies than are threshold friction velocities computed from MHWS, and thus maximum wind gust data may be a better predictor of windblown dust (or at least the threshold friction velocities that are required to begin the saltation process which can lead to dust emissions) than are mean hourly wind speeds (Holcombe et al., 1996). 4.0 Best Available Control Measures (BACM) Effectiveness WRAP’s Fugitive Dust Handbook (FDH, 2006) contains a plethora of information relating to the numerous strategies available to control dust emissions. The FDH goes into great detail in describing the different control measures and breaks them down into several source categories. Common control strategies for wind erosion include:
• Planting trees or shrubs as a windbreak • Create cross-wind ridges • Erect artificial wind barriers • Apply dust suppressant or gravel • Revegetate; apply cover crop • Water exposed area before high winds
These control measures have differing reported control efficiencies ranging from 25% (planting trees or shrubs) to 90% (revegetating and watering exposed areas before high winds). In addition to the control efficiencies reported in the FDH, two field studies were performed for the South Coast Air Quality Management District (Fitz, 1996; MRI, 1995) that specifically mention wind speeds at which BACM becomes overwhelmed. Fitz (1996) concluded that BACM appeared to be effective at reducing PM10 emissions at wind speeds up to 18 m/s (about 40 mph); however, the small sample size in this study makes it difficult for these results to be conclusive. Additionally, this study was specific to emissions generated from a local landfill in California. It is not clear how factors mentioned in sections 2.0,3.0, and 5.0 would affect this defined wind speed. Information from Tables 3 and 4 (specifically data and metadata from the Tucson and Glendale construction sites) may suggest that wind speeds at which BACM becomes overwhelmed would also be highly variable from one site to another. In another study on the effective of BACM, the Midwest Research Institute (MRI, 1995) simply concluded that even moist soils became erodible at higher wind speeds. The emissions from moist soils became similar to that of dry soils when the moist soils were subjected to wind speeds 15-20 mph higher than winds impinging on dry soil. However, by looking at the data tables from this study, it is difficult to determine the different threshold velocities for moist and dry soils. With the limited research that has been conducted on this specific topic and the lack of detail in the few studies that have been performed, it does not seem appropriate to define a critical wind speed in which BACM becomes overwhelmed. Furthermore, such a critical wind speed would likely differ for each soil type and/or land use type. A more detailed review of general BACM effectiveness and control efficiencies can be found in “High Wind Exceptional Events and Control Measures for PM10 Areas”. 5.0 Other Influential Factors in the Formation and Impact of Windblown Dust Data from Holcombe et al. (1996) suggest that a wide range of wind speeds is capable of producing blowing and/or suspended dust in the Yuma area. Of the dust episodes in Yuma, 95% contain hourly mean wind speeds that range from 2.9 m/s to 12.96 m/s. This compares to a range of 3.8 m/s to 15.7 m/s at Blythe, indicating that dust may become suspended more easily in the Yuma area compared to Blythe. This may be a factor of Yuma receiving slightly less precipitation and/or various differences in soil
10
characteristics and available dust sources between Yuma and Blythe. In an attempt to determine the effect of prior precipitation on blowing dust episodes in Yuma, MacKinnon et al. (1990) used Nickling’s (1988) wind tunnel data to calculate a 10 meter threshold wind speed of 9 m/s, which is similar to the median wind speed obtained from observational reports in the Holcombe et al. (1996) study. In general, dust episodes in Yuma are most common with 10 meter wind speeds between 5 m/s and 13 m/s with a median of 9 m/s. The large range in wind speeds is likely due to the variability in precipitation, prevailing wind direction, vegetation, anthropogenic sources, and other factors. Bach et al. (1987) reported that annual precipitation explains about 20% of the variance in the incidence of blowing dust. When antecedent precipitation (previous winter’s rainfall) is taken into consideration the explained variance increases to 26.5%. When taking the winter precipitation from previous 2 years into account, the explained variance increases to 42.3%. This effect of antecedent precipitation likely also includes a vegetative coverage factor with it. The general rule appears to be that the more rainfall a region receives the more vegetation grows and the greater its ability to keep soils from becoming suspended by high winds. Holcombe et al. (1996) concludes that precipitation can be an important factor in limiting soil suspension. They do, however, note that in places like Yuma where threshold MHWSs lie well below MHWSs recorded during most dust events, local mean annual precipitation could likely increase substantially without significantly reducing the occurrence of blowing dust episodes. While prior precipitation events do help explain some of the variance in dust events, there is a fair amount of variance that is still not explained by precipitation. This variance can likely be attributed to other factors such as soil type, prevailing wind direction, anthropogenic activity, control measures, and changes in land use / land cover. While wind speed is obviously important for dust suspension, a number of articles also point out that the directional component of the wind is also important as it is an indicator of potential dust sources (MacKinnon et al. 1990; Holcombe et al. 1996; Brazel and Nickling 1986). The Holcombe et al. (1996) paper is particularly interesting as it attempts to apply a vulnerability index to each of the 16 directions. This type of analysis seems to be fairly effective at determining potential dust sources. Several articles indicate that for Yuma, the west and west-northwest directions are associated with high vulnerability and high frequency, while high winds from the east contain a high vulnerability but a low frequency. Conversely, high winds from the south-southeast and northerly directions frequently occur, but have a low vulnerability. The differences in vulnerability in relation to wind direction are an indication that soil characteristics may be an important factor in dust episodes. While not explicitly stated in the study, one could even define differing threshold friction velocities for each direction. 6.0 The Effect of Particle Size and Turbulence on Dust Settling Rates Thus far the literature has suggested that the meteorological phenomena required to produce dust events in the desert southwest are highly variable. In fact, factors such as wind speed, wind direction, antecedent precipitation, vegetation coverage, anthropogenic activity, and the location of dust sources all may potentially contribute to the variability in blowing dust episodes. The UCAR dust forecasting education website discusses dispersion and settling rates of lofted dust in relation to buoyancy turbulence (UCAR, 2003). While such turbulence can work to help disperse an existing dust plume, it can also act to keep dust particles in suspension for a longer period of time. Given extremely turbulent flow, it is possible for dust to be lofted to heights well above 3000m (10000 ft.). As long as the upward lift acting on a particle is greater than that particles terminal velocity, the particle should remain aloft. The terminal velocity of a particle is directly proportional to its size, and as gravity acts to accelerate a dust particle downwards, atmospheric resistance acts against it as it falls. Acceleration continues only until the particle reaches its terminal velocity, and from that point on, the particle falls at a constant rate so long as no other factors such as atmospheric turbulence or precipitation influence it (Bagnold, 1984 cited by Wilkerson, 1991). UCAR (2003) states that “without sustained turbulence, dust generally settles at a rate of 1000 feet per
11
hour”. This means that if dust is lofted to 5000 ft in extremely turbulent flow (i.e. downdrafts from thunderstorms), it may take the at least 5 hours to settle once turbulent winds decrease to below terminal velocity (i.e., light and variable winds). This can result in dust, once initially suspended by turbulent flow, remaining elevated in the atmosphere and being transported by light winds to impact areas that do not experience the extremely turbulent winds that initialized the dust event. This scenario most often occurs during the monsoon season in July and August when turbulent flow produced by thunderstorms is highly variable across space and time. While dust episodes driven by synoptic scale weather types would likely have similar wind speeds at the source area compared to the point where wind measurements are taken, this assumption may not apply to dust produced from mesoscale storms as the wind speed at the source area may be substantially different than the wind speed measured at the observation point (MacKinnon et al. 1990). The 1000 ft/hr settling rate has been reported for particles between the sizes of 10 to 50 micrometers; however this rate is highly dependent upon various environmental conditions (Larson, 1971 cited in Wilkerson, 1991). These dust settling rate factors include turbulence, humidity, and precipitation. Other studies have reported settling rates ranging from over 10000 ft/hr for particles greater than 150 microns to 36 ft/hr for particles as small as 5 microns (Greveris, 1977 cited in Wilkerson, 1991). Moisture is especially important in limiting the ability of dust to remain lofted in the atmosphere given the hygroscopic nature of most dust particles. 7.0 Literature Conclusion In reviewing the literature, most studies have focused on the meteorological conditions that produce blowing dust. Specifically, wind speed is the most important factor; however, wind direction and antecedent precipitation also contribute to characteristics of dust emissions. There is also speculation that other factors such as vegetation and soil types affect dust emissions as well by raising threshold friction velocities and thus threshold wind speeds at 10m above the surface. While this information is important, for exceptional event purposes one must be able to show that a dust event is ‘natural and unavoidable’ or at least that there was an attempt to control dust emissions. For the ‘natural and unavoidable’ case, the prior studies contain some very useful information, particularly in the case of Yuma, AZ where the Algodones dunes (a natural dust source) are the suspected source of dust emissions. However, within an urban setting where Best Available Control Measures (BACM) are required to suppress dust emissions, it no longer becomes important to simply determine the wind speed at which dust emissions occur, but instead, the speed at which BACM is overwhelmed. While there is some literature on the effectiveness of BACM (i.e. WRAP Fugitive Dust Handbook, 2006), there appears to be very few studies that relate this effectiveness to wind speeds. With several factors influencing threshold friction velocities, defining exact wind speeds for overwhelming BACM or even dust suspension in general becomes a complicated process. Perhaps, the results from this literature review are best summarized by Nickling’s (1988) conclusion which states, “The observations of this study suggest that the threshold of most natural sediments should not be defined by a finite value but by a range of threshold shear velocities.” 8.0 EXAMINATION OF HISTORICAL WIND & PARTICULATE MATTER DATA IN ARIZONA - WIND THRESHOLD EFFECTS Part of the justification for flagging an elevated particulate matter event associated with blowing dust is to show the winds were “unusual.” This term is used in the preamble of the Exceptional Events Rule. The literature review provided significant justification for what constitutes unusual from various contexts. In order to place perspective on the issue for monitors in Arizona, an analysis of wind and particulate matter data is needed. An examination of the measurements from several monitors where hourly measurements of the average wind speed, the maximum wind gust during the hour, and the average PM10 concentration from TEOM
12
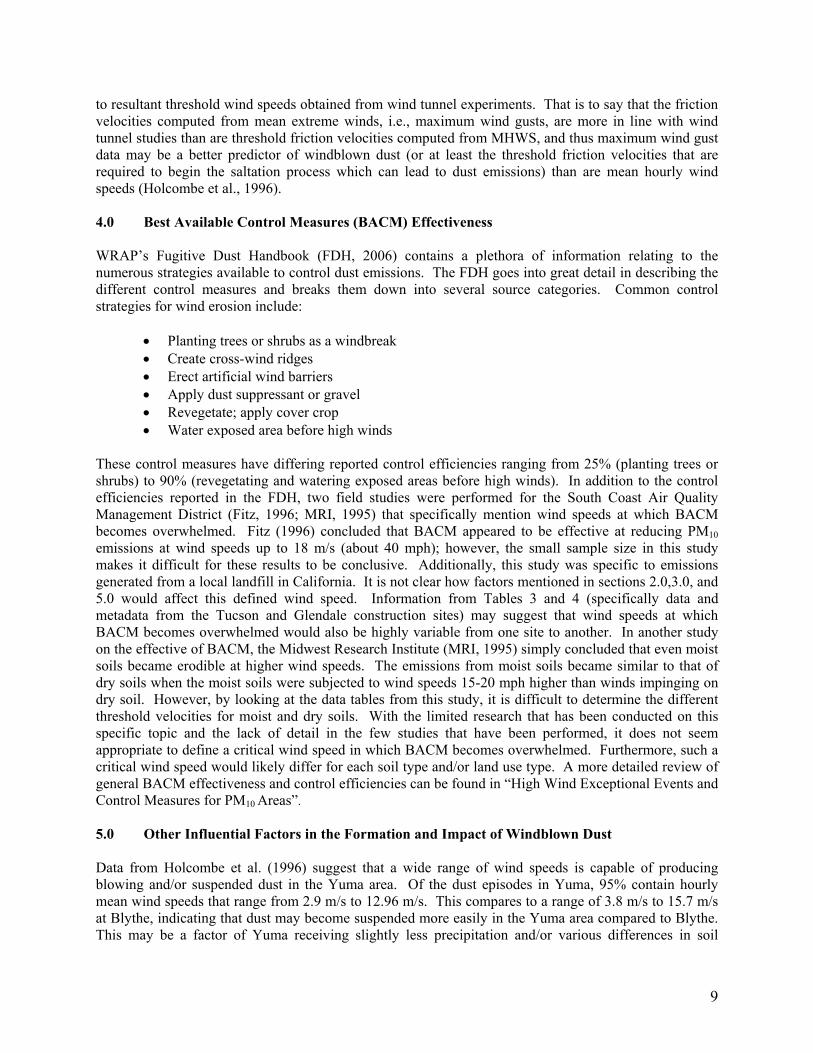
monitors was performed. Data from April 1, 2005, through August 31, 2009, for four monitors operated by the Maricopa County Air Quality Department (MCAQD) over a broad geographic region were used in the analysis. These monitors were chosen because of the availability of a very long continuous record of data (38,000+ hours) for each monitor. The monitors included a monitor to the far west of the Phoenix area (Buckeye), two monitors in the central basin near the Salt River (West Forty Third Avenue and Durango Complex), and one monitor in the far east Valley (Higley). All of these monitors have experienced high ambient concentrations of particulate matter. The monitoring data were extracted from the ADEQ Air Assessment Ambient Database (AAAD) which archives these readings on a daily basis. The winds speeds were rounded to the nearest 1 mile per hour, and the ambient PM10 concentrations were rounded to the nearest 1 microgram per cubic meter (μg/m3). The ambient concentration data tend to be log-normally distributed. It was decided to create a simple cross-tabulation of the raw wind speed and particulate matter data for each monitor. In order to develop a useful consolidation of the data, wind and particulate matter values were transformed into categories. The following transformations were used to compute the categories: For Wind: WindCat = 10.0*Log10(Speed_mph + 1.0) (rounded to the nearest whole number) For PM10: PMCat = 5.0*Log10(PM_ug/m3 + 1.0) (rounded to the nearest whole number) The choice of the scaling was to generate approximately 17 categories over the normal range of values found in the database. In examining the cross-tabulated information, one would expect to observe two phenomena. For monitors in the central part of the valley, there could be a slight “stagnation” effect observed in the data. This would be where the mode of the distribution for a given wind speed category would go down as the wind speed increased from very low levels to moderate levels. Also, for all monitors, there should be a threshold effect, where the mode of the particulate matter concentration data for a given wind speed category should increase as the wind speed category increases. Between these two extremes, there would be little correlation between wind speed and particulate matter concentration. Table 6 presents the cross-tabulated information for hourly average wind speed versus the particulate matter concentrations for the four monitors. The orange/pink highlighting in the figure is where the median of the distribution occurs for each wind speed category. The yellow highlighting shows the range where 80% of the data reside. The green highlighting shows the frequency of the higher wind speeds. It is noted that these represent approximately the highest 5% of the wind data (approximately 2,000 out of 40,000 observations). All four monitors demonstrate a strong “threshold” effect for wind speed when hourly average wind speeds exceed 10 miles per hour. Also, the West Forty Third Avenue and Durango Complex monitors appear to have a slight “stagnation” effect compared to the Buckeye and Higley monitors. Table 7 presents the same cross-tabulated information as Table 6, except that instead of using average wind speeds, maximum hourly wind gusts are used to display the relationship between wind and PM10 concentrations. The same highlighting scheme used in Table 6 is also applied to Table 7. All four monitors demonstrate a strong “threshold” effect for wind speed when hourly wind gusts exceed 20 miles per hour. It should be noted that there is not a “bright-line” in this type of data, only statistical tendencies. During some events, relatively low local wind speeds could be associated with very high particulate matter concentrations if dust is transported over a long distance. This is typical of a haboob, where local winds in the area of the storm may exceed 70 miles per hour, and create a wall of dust. The wind speed diminishes during transport but the suspended dust can be delivered over very long distances.

STATION
PM10 Category < 1 1 mph 2 mph 3 mph 4 mph 5-6 7 mph 8-10 11-13 14-16 17-21 22-27 28-34 TOTAL 1995-3161 ug/m3 - - - - - - - - 1 - 1 2 - 4 1258-1994 ug/m3 - - 1 - - 1 - 3 - - 1 - - 6 794-1257 ug/m3 - - 3 4 3 - 1 - - 1 2 5 - 19 501-793 ug/m3 1 5 6 6 3 5 1 5 14 10 13 6 - 75 316-500 ug/m3 5 19 11 9 6 6 4 17 26 19 28 3 1 154 199-315 ug/m3 24 43 40 31 27 32 7 22 30 48 42 8 1 355 125-198 ug/m3 65 206 186 167 128 149 48 89 65 87 37 9 - 1,236 79-124 ug/m3 228 522 607 520 415 575 171 296 170 77 53 4 - 3,638 50-78 ug/m3 436 998 1,183 1,076 859 1,193 401 741 260 94 27 3 - 7,271 31-49 ug/m3 438 1,218 1,546 1,438 1,282 1,852 605 1,091 330 80 21 - - 9,901 19-30 ug/m3 298 942 1,220 1,253 1,136 1,735 599 956 254 54 12 1 - 8,460 12-18 ug/m3 122 505 603 679 552 1,091 350 544 121 23 4 2 - 4,596 7-11 ug/m3 58 189 258 258 267 397 133 217 64 16 2 - - 1,859 5-6 ug/m3 7 40 53 45 46 86 34 56 24 8 - 1 - 400 3-4 ug/m3 9 21 27 29 29 54 19 31 6 7 1 - - 233 1-2 ug/m3 1 12 16 11 16 34 9 20 8 1 1 - - 129 <1 ug/m3 1 7 13 12 8 20 16 13 8 2 2 - - 102 TOTAL 1,693 4,727 5,773 5,538 4,777 7,230 2,398 4,101 1,381 527 247 44 2 38,438
PM10 Category < 1 1 mph 2 mph 3 mph 4 mph 5-6 7 mph 8-10 11-13 14-16 17-21 22-27 28-34 TOTAL 1995-3161 ug/m3 - - - - - - - - 1 - - - 1 1258-1994 ug/m3 - - - - - - 1 1 - 1 4 2 9 794-1257 ug/m3 - 1 2 4 1 - 1 1 1 5 21 5 42 501-793 ug/m3 2 13 6 1 - 4 1 6 7 22 38 4 104 316-500 ug/m3 20 101 74 25 9 9 4 10 24 50 28 2 356 199-315 ug/m3 68 380 349 153 54 39 9 32 70 72 22 1 1,249 125-198 ug/m3 106 794 883 470 165 169 29 88 158 98 21 1 2,982 79-124 ug/m3 193 1,384 1,547 850 403 438 112 288 235 72 6 - 5,528 50-78 ug/m3 255 1,515 1,754 1,274 828 847 272 634 274 48 1 - 7,702 31-49 ug/m3 192 1,333 1,791 1,383 1,165 1,519 441 894 232 28 1 - 8,979 19-30 ug/m3 114 777 1,080 1,120 906 1,367 432 655 109 16 - - 6,576 12-18 ug/m3 49 362 454 492 451 567 194 271 47 11 - - 2,898 7-11 ug/m3 11 134 183 190 161 235 65 120 25 4 2 - 1,130 5-6 ug/m3 5 26 34 36 32 40 25 26 5 1 - - 230 3-4 ug/m3 2 12 22 22 20 32 18 22 5 2 - - 157 1-2 ug/m3 - 8 14 9 9 14 8 8 3 - - - 73 <1 ug/m3 1 8 4 6 6 9 4 5 4 - - - 47 TOTAL 1,018 6,848 8,197 6,035 4,210 5,289 1,616 3,061 1,200 430 144 15 38,063
PM10 Category < 1 1 mph 2 mph 3 mph 4 mph 5-6 7 mph 8-10 11-13 14-16 17-21 22-27 28-34 TOTAL 1995-3161 ug/m3 - 1 - - - - - - 1 1 - - 3 1258-1994 ug/m3 - 1 - - - - - - - - - - 1 794-1257 ug/m3 - 2 3 1 - - 1 1 - 3 6 3 20 501-793 ug/m3 2 7 4 - - 2 3 10 7 9 13 - 57 316-500 ug/m3 36 67 46 13 3 5 3 14 26 19 10 1 243 199-315 ug/m3 82 310 169 56 12 16 7 33 47 32 26 - 790 125-198 ug/m3 187 932 526 198 89 66 19 85 67 65 14 - 2,248 79-124 ug/m3 377 1,622 1,123 535 298 321 80 178 126 72 6 - 4,738 50-78 ug/m3 314 1,942 1,724 1,034 686 916 284 535 238 38 - - 7,711 31-49 ug/m3 310 1,713 1,866 1,451 1,142 1,615 542 948 247 21 - - 9,855 19-30 ug/m3 142 927 1,288 1,150 1,033 1,510 515 785 151 9 - - 7,510 12-18 ug/m3 44 354 531 545 488 707 228 317 57 3 - - 3,274 7-11 ug/m3 16 162 203 204 197 258 86 115 16 5 - - 1,262 5-6 ug/m3 2 21 50 41 40 60 25 27 8 1 - - 275 3-4 ug/m3 1 18 24 33 19 36 18 29 3 1 - - 182 1-2 ug/m3 - 11 9 18 11 22 8 11 4 - - - 94 <1 ug/m3 - 11 14 12 7 11 - 17 1 - - - 73 TOTAL 1,513 8,101 7,580 5,291 4,025 5,545 1,819 3,105 999 279 75 4 38,336
PM10 Category < 1 1 mph 2 mph 3 mph 4 mph 5-6 7 mph 8-10 11-13 14-16 17-21 22-27 28-34 TOTAL 3162+ ug/m3 - - - - - - - - - - 1 - - 1
1995-3161 ug/m3 - - - - - - - - 2 - 1 1 - 4 1258-1994 ug/m3 - - - - - - - 1 - - 1 - - 2 794-1257 ug/m3 - - 1 - 1 - - 1 2 2 5 2 1 15 501-793 ug/m3 1 1 2 3 3 8 - 6 11 17 14 - - 66 316-500 ug/m3 3 30 19 16 11 15 8 22 20 28 20 - - 192 199-315 ug/m3 10 79 97 72 63 71 14 31 43 40 13 - - 533 125-198 ug/m3 52 240 264 240 196 276 58 89 68 53 9 - - 1,545 79-124 ug/m3 76 427 656 618 533 595 132 189 133 54 6 - - 3,419 50-78 ug/m3 110 772 1,233 1,356 1,135 1,244 236 399 135 31 9 - - 6,660 31-49 ug/m3 128 845 1,596 1,933 1,769 2,031 460 582 172 36 1 - - 9,553 19-30 ug/m3 73 680 1,308 1,681 1,638 2,071 501 582 109 10 1 - - 8,654 12-18 ug/m3 49 388 704 876 876 1,092 232 314 57 15 - - - 4,603 7-11 ug/m3 24 190 322 351 353 432 124 160 27 9 1 - - 1,993 5-6 ug/m3 4 40 54 68 70 107 31 55 10 2 - - - 441 3-4 ug/m3 4 13 34 33 40 66 17 38 6 2 - - - 253 1-2 ug/m3 3 4 14 23 12 30 10 16 2 - - - - 114 <1 ug/m3 - 7 6 9 9 10 10 9 1 - - - - 61 TOTAL 537 3,716 6,310 7,279 6,709 8,048 1,833 2,494 798 299 82 3 1 38,109
HIG
LEY
WIND SPEED CATEGORY (HOURLY AVERAGE WINDS - miles per hour)
BU
CK
EYE
WES
T 43
RD
AVE
Table 6. Crosstabulation of Average Wind Speed and PM ConcentrationsD
UR
AN
GO
CO
MPL
EX

STATION
PM10 Category < 1 1 mph 2 mph 3 mph 4 mph 5-6 7 mph 8-10 11-13 14-16 17-21 22-27 28-34 35-43 44+ TOTAL1995-3161 ug/m3 - - - - - - - - - - - - 1 - 1 2 1258-1994 ug/m3 - - - - - - - 1 1 1 - 2 - - 1 6 794-1257 ug/m3 - - - - - 3 - 7 - 1 - - - 3 5 19 501-793 ug/m3 - - - 3 1 7 4 8 1 - 2 9 16 16 8 75 316-500 ug/m3 - - 1 4 9 21 9 10 5 6 2 11 43 29 3 153 199-315 ug/m3 1 2 3 15 26 68 23 35 13 9 16 36 60 41 6 354 125-198 ug/m3 3 9 9 43 121 285 112 216 102 66 53 92 101 23 1 1,236 79-124 ug/m3 7 10 29 123 318 879 348 738 415 225 237 178 112 19 - 3,638 50-78 ug/m3 18 20 48 230 535 1,704 793 1,558 941 512 522 301 76 13 - 7,271 31-49 ug/m3 10 15 47 247 581 2,063 1,051 2,402 1,497 894 718 310 61 7 - 9,903 19-30 ug/m3 13 7 45 145 369 1,449 866 2,186 1,512 908 689 227 39 5 - 8,460 12-18 ug/m3 - 1 10 54 183 700 423 1,124 933 586 457 110 13 2 2 4,598 7-11 ug/m3 3 1 5 19 87 245 162 469 375 239 192 52 9 1 - 1,859 5-6 ug/m3 - 1 1 3 16 41 28 91 91 55 49 22 1 1 - 400 3-4 ug/m3 - - 1 3 10 28 19 54 48 32 24 11 2 1 - 233 1-2 ug/m3 - - - - 3 10 6 36 30 14 24 5 1 - - 129 <1 ug/m3 - - - - 1 6 7 23 21 14 15 10 3 2 - 102 TOTAL 55 66 199 889 2,260 7,509 3,851 8,958 5,985 3,562 3,000 1,376 538 163 27 38,438
PM10 Category < 1 1 mph 2 mph 3 mph 4 mph 5-6 7 mph 8-10 11-13 14-16 17-21 22-27 28-34 35-43 44+ TOTAL1995-3161 ug/m3 - - - - - - - - - - - - - - - - 1258-1994 ug/m3 - - - - - - - - - - 2 - - 7 - 9 794-1257 ug/m3 - - 1 - - 3 1 - 1 - 3 1 12 14 5 41 501-793 ug/m3 - 1 2 5 8 5 1 - 1 2 6 6 33 27 6 103 316-500 ug/m3 - 1 1 25 74 94 11 19 4 2 5 25 59 25 6 351 199-315 ug/m3 - 4 9 93 252 468 89 91 14 9 25 82 86 16 1 1,239 125-198 ug/m3 1 4 31 214 562 1,054 242 358 90 42 70 181 103 13 1 2,966 79-124 ug/m3 - 15 60 399 912 1,738 528 758 320 159 275 263 60 8 - 5,495 50-78 ug/m3 - 29 63 393 951 1,897 721 1,399 732 470 654 275 47 3 1 7,635 31-49 ug/m3 - 21 68 277 656 1,640 715 1,912 1,414 992 976 235 17 5 2 8,930 19-30 ug/m3 - 20 27 138 287 780 461 1,511 1,443 1,006 714 117 13 3 1 6,521 12-18 ug/m3 - 10 16 59 127 340 185 679 647 450 286 57 12 - - 2,868 7-11 ug/m3 - 8 5 15 34 129 97 276 228 169 117 34 3 1 - 1,116 5-6 ug/m3 - 1 1 7 10 24 19 57 50 28 21 9 - - - 227 3-4 ug/m3 - - 1 1 7 14 9 35 35 25 23 7 - - - 157 1-2 ug/m3 - 1 - - 3 12 2 10 22 10 11 2 - - - 73 <1 ug/m3 - - - - 1 7 3 9 7 7 10 2 - - - 46 TOTAL 1 115 285 1,626 3,884 8,205 3,084 7,114 5,008 3,371 3,198 1,296 445 122 23 37,777
PM10 Category < 1 1 mph 2 mph 3 mph 4 mph 5-6 7 mph 8-10 11-13 14-16 17-21 22-27 28-34 35-43 44+ TOTAL1995-3161 ug/m3 - - - - 1 - - - - - - - - - 1 2 1258-1994 ug/m3 - - 1 - - - - - - - - - - - - 1 794-1257 ug/m3 - - - - - 3 2 - 1 - 2 - 2 5 3 18 501-793 ug/m3 - - 1 2 5 4 - - - 4 7 4 10 16 4 57 316-500 ug/m3 - - 7 39 57 34 13 9 4 1 7 18 29 22 3 243 199-315 ug/m3 1 4 35 109 175 204 43 44 13 6 18 47 67 20 2 788 125-198 ug/m3 2 4 90 355 490 608 164 186 64 29 61 94 84 15 2 2,248 79-124 ug/m3 - 1 169 659 809 1,210 394 657 306 111 164 166 79 11 2 4,738 50-78 ug/m3 - 3 127 634 909 1,670 660 1,514 838 474 501 315 60 5 1 7,711 31-49 ug/m3 - 3 91 429 732 1,575 721 2,199 1,700 1,090 945 333 31 5 1 9,855 19-30 ug/m3 - 2 31 159 313 809 498 1,685 1,631 1,207 946 209 18 3 - 7,511 12-18 ug/m3 - - 11 47 109 275 197 740 779 571 457 75 9 3 - 3,273 7-11 ug/m3 - - 5 16 36 110 92 325 282 217 150 25 2 2 - 1,262 5-6 ug/m3 - - - 1 5 17 17 71 69 48 35 10 2 - - 275 3-4 ug/m3 - - - 2 2 15 10 36 51 24 31 10 1 - - 182 1-2 ug/m3 - - - 1 2 4 3 26 20 13 20 5 - - - 94 <1 ug/m3 - - - - - 11 1 20 15 13 11 2 - - - 73 TOTAL 3 17 568 2,453 3,645 6,549 2,815 7,512 5,773 3,808 3,355 1,313 394 107 19 38,331
PM10 Category < 1 1 mph 2 mph 3 mph 4 mph 5-6 7 mph 8-10 11-13 14-16 17-21 22-27 28-34 35-43 44+ TOTAL3162+ ug/m3 - - - - - - - - - - - - - - 1 1
1995-3161 ug/m3 - - - - - - - - - - - - - 2 2 4 1258-1994 ug/m3 - - - - - - - - - - - - 1 - - 1 794-1257 ug/m3 - - - - - - - 1 - - 1 - 4 5 3 14 501-793 ug/m3 - - - 1 1 4 - 6 1 2 4 6 20 16 4 65 316-500 ug/m3 - - 2 12 14 29 5 19 4 4 8 21 42 24 5 189 199-315 ug/m3 - 1 4 26 50 113 50 99 40 12 17 51 52 16 2 533 125-198 ug/m3 4 - 17 78 129 356 193 382 111 41 52 96 69 15 1 1,544 79-124 ug/m3 5 2 30 127 255 862 423 898 289 115 156 162 76 14 1 3,415 50-78 ug/m3 - 1 25 204 444 1,603 884 1,933 617 297 353 234 54 8 - 6,657 31-49 ug/m3 3 - 30 187 510 1,755 1,145 2,760 1,354 815 647 297 40 4 - 9,547 19-30 ug/m3 1 - 11 113 327 1,233 789 2,374 1,702 1,058 814 205 22 3 - 8,652 12-18 ug/m3 2 - 3 54 153 622 422 1,210 940 664 426 96 8 2 1 4,603 7-11 ug/m3 - - 4 24 68 290 187 562 391 270 149 42 6 2 - 1,995 5-6 ug/m3 - - - 4 17 51 40 107 101 63 36 16 6 - - 441 3-4 ug/m3 - - - 1 6 24 21 63 52 47 29 8 2 - - 253 1-2 ug/m3 - - - 1 1 15 9 23 26 21 16 2 - - - 114 <1 ug/m3 - - - - - 5 2 16 13 9 16 - - - - 61 TOTAL 15 4 126 832 1,975 6,962 4,170 10453 5,641 3,418 2,724 1,236 402 111 20 38,089
WIND GUST CATEGORY (MAXIMUM WIND GUST DURING HOUR - miles per hour)
BU
CK
EYE
WES
T 43
RD
AVE
Table 7. Crosstabulation of Hourly Maximum Wind Gust and PM ConcentrationsD
UR
AN
GO
CO
MPL
EXH
IGLE
Y

15
9.0 Unusual Winds For exceptional events purposes, “unusual winds” can be defined as any wind that has the ability to create wind blown dust. Literature and data from monitors indicate that the phenomenon of blowing dust can occur over a broad range, but generally is associated with hourly averaged wind speeds that are above 10 miles per hour, which are commonly associated with wind gusts above 20 miles per hour. The National Weather Service (NWS) only includes “wind gust” information in the routine observations when the observed wind gust exceeds 15 miles per hour. As such, there is no bright-line indicator as to what constitutes unusual winds from the stand-point of a specific wind velocity, but the NWS generally uses 15 miles per hour as a significance point for wind gusts. The data analyzed in this study suggest that hourly averaged wind speeds greater than 10 miles per hour (which are commonly associated with wind gusts over 20 miles per hour) occur less than 5% of the time, and are thus, not common, and can be considered ‘unusual’ for exceptional events purposes. ADEQ’s analysis of tabular wind summaries, which use highlighting criteria of 15 and 25 miles per hour for the maximum winds during the hour, are consistent with the literature reviewed, the data analyzed, and the NWS criteria for significance of winds
16
REFERENCES Bach, A. J., Brazel, A. J., and Lancaster, N. 1996. Temporal and Spatial Aspects of Dust in the
Mojave and Colorado Deserts of Southern California, 1973-1994. Physical Geography 17: 329-353.
Brazel, A. J. and Nickling, W. G. 1986. The Relationship of Weather Types to Dust Storm
Generation in Arizona (1965-1980). Journal of Climatology. 6: 255 -275. Gillette, D.A., Adams, J., Endo, E. and Smith, D., 1980. Threshold Velocities for Input of Soil
Particles into the Air by Desert Soils, Journal of Geophysical Research 85(C10): 5621- 5630.
Gillette, D.A., Adams, J., Muhs, D. and Kihl, R., 1982. Threshold Friction Velocities and Rupture Moduli for Crusted Desert Soils for the Input of Soil Particles into the Air.
Journal of Geophysical Research 87(C10): 9003-9015 Gillette, D.A., 1988. Threshold Friction Velocities for Dust Production for Agricultural Soils.
Journal of Geophysical Research 93(D10): 12645-12662. Holcombe, T. L. Ley, T. and Gillette, D. A. 1996. Effects of Prior Precipitation and Source Area
Characteristics on Threshold Wind Velocities for Blowing Dust Episodes, Sonoran Desert 1948-1978. Journal of Applied Meteorology. 36: 1160-1175.
Lyles, L. 1988. Basic Wind Erosion Processes. Agriculture, Ecosystems, and Environment 22/23: 91-101. MacKinnon D. J., Elder, D. F., Helm, P. J., Tuesink, M. F., and Nist, C. A. 1990. A Method of Evaluating Effects of Antecedeant Precipitation on Duststorms and its Application to Yuma, Arizona, 1981-1988. Climatic Change. 17: 331-360. McTainish G. H. and Pitblado, J. R. 1987. Dust Storms and Related Phenomena Measured from Meteorological records in Australia. Earth Surface Processes and Landforms 12: 415- 424. Nickling, W. G. & Brazel, A.J. 1984. Temporal and Spatial Characteristics of Arizona Dust Storms
(1965-1980). Journal of Climatology. 4: 645-660. Nickling, W. G. 1988. The Initiation of Particle Movement by Wind. Sedimentology 35: 499- 511. Nickling, W.G. and Gillies, J.A., 1989. Emission of Fine Grained Particulate from Desert Soils,
in: Paleoclimatology and Paleometeorology: Modern and Past Patterns of Global Atmospheric Transport. M. Leinen and M. Sarnthein (Editors), Kluwer Academic Publishers, pp. 133-165.
Orgill, M. M. and Sehmel, G. A. 1976. Frequency and Diurnal Variation of Duststorms in the Continental U.S.A. Atmospheric Environment 10: 310 Wilkerson, W. D., 1991. Dust and sand forecasting in Iraq and adjoining countries, AWS/TN—91/001, Air Weather Service, Scott AFB, IL, 63 pp.

17
WRAP, 2006. Fugitive Dust Handbook. http://www.wrapair.org/forums/dejf/fdh/. University Corporation for Atmospheric Research / COMET Program. 2003. Forecasting Dust
Storms. http://www.meted.ucar.edu/mesoprim/dust/print.htm.

This page is intentionally blank.