083q as recorded - ibm · pdf file3q 2008 summary thanks for joining us today. last week, we...
TRANSCRIPT
INTRODUCTION
Thank you. This is Patricia Murphy, Vice President of Investor Relations for IBM. I’m here with Mark Loughridge, IBM’s Senior Vice President and Chief Financial Officer. Thank you for joining our third quarter earnings presentation.
The prepared remarks will be available in roughly an hour, and a replay of this webcast will be posted to our Investor Relations website by this time tomorrow. Our presentation includes certain non-GAAP financial measures, in an effort to provide additional information to investors. All non-GAAP measures have been reconciled to their related GAAP measures in accordance with SEC rules. You will find reconciliation charts at the end, and in the Form 8-K submitted to the SEC. Let me remind you that certain comments made in this presentation may be characterized as forward looking under the Private Securities Litigation Reform Act of 1995. Those statements involve a number of factors that could cause actual results to differ materially. Additional information concerning these factors is contained in the company’s filings with the SEC. Copies are available from the SEC, from the IBM web site, or from us in Investor Relations.
Now, I’ll turn the call over to Mark Loughridge.

3Q 2008 Summary Thanks for joining us today. Last week, we reported our third quarter revenue, profit, earnings per share, and free cash flow results. At that time, we also reaffirmed our full year guidance. Today, I want to take you through the details behind the results. This is a tough environment, but we were ready for it. We are executing a play that we called some time ago. It has two major elements – First, we have been investing to capture opportunities in the emerging markets. You can see the benefit in our results again this quarter, with double-digit revenue growth and good returns. Second, in the more established markets – our goal has been to drive productivity. We’ve been systematically attacking our spending base, taking out infrastructure costs, reducing our cost and expense levels, and improving our efficiency. Because of these actions we have a more efficient structure. So in the third quarter, when the revenue growth in the major markets slowed, we had great margin performance and hit our profit objectives. These ongoing actions to address spending shore up the base in tough times. But they also improve our balance point over the long run. Our focus on continuous improvement is an element of our model, and an important driver of our 2010 earnings-per-share roadmap. Now there’s another important aspect of our model -- and that’s the balance between annuity and transaction-type businesses. We have a number of annuity businesses – like outsourcing, maintenance, and the majority of software – that not only provide a good revenue foundation, but also provide a steady source of profit and cash. We’ve been building these businesses, and their recurring revenue streams, for years. They’re part of our DNA. And they provide a distinct advantage in today’s environment.
So our annuity base, together with our ongoing structural changes in the business, resulted in solid profit performance in the quarter. We’ve been focused on this for some time, and it was clearly the right game plan for the third quarter. We’ll continue this same operational plan in the fourth quarter and into 2009, as we focus on delivering solid profit and cash. For the year, we expect earnings per share of at least $8.75, which is up 22 percent over last year. And while the current environment is challenging, we have the right operational plan to drive double-digit revenue growth in emerging markets, substantial productivity in major markets, and continue to extract cost and expense from our spending base and drive ongoing improvements, to meet our full year objectives. So now let’s get into the third quarter performance – starting with the Financial Summary.
3Q 2008 Financial Summary Our revenue was $25.3 billion, up 5 percent as reported, and 2 percent at constant currency. We had outstanding margin performance. Gross margin expanded 2 points, led by services and software. Together with focused expense management, we grew pre-tax income 19 percent over last year, and PTI margin expanded 1.8 points.
And with ½ point improvement in our tax rate, net income grew 20 percent, and margin expanded to over 11 percent. Bottom line, we delivered $2.05 of earnings per share, up 22 percent year to year. Our balance sheet and capital structure are also on very solid ground. We finished the quarter with almost $10 billion in cash on hand, and we demonstrated strong access to the debt markets by raising an additional $4 billion last week. Our liquidity position is also very strong -- I’ll address cash, balance sheet and liquidity later in the webcast. Let’s get into the details of the quarter with a few different views of our revenue.

Revenue by Geography I’ll start with a geographic view. Our total geographic revenue was up 6 percent as reported, 3 percent at constant currency. Europe had the strongest performance, up 4 percent at constant currency, while Americas was up 2 percent, and Asia Pacific up 1 percent.
I’ll discuss these results through the lens of our major market and growth market organizations. In the more established markets, that we address through our major markets organization, we are uniquely positioned to assist enterprise clients with high value transformational projects, as they retool for efficiency and cost savings. Our model in these markets is based on delivering high value solutions and driving productivity. This quarter, major markets grew 5 percent as reported and 1 percent at constant currency. Now let me give you a sense of how some of the larger countries performed at constant currency. Of the G7, Canada had the fastest growth for the second consecutive quarter with 6 percent growth. The UK grew 3 percent, while Italy, Germany and France each grew 2 percent. The US grew 1 percent and Japan declined. Now in the emerging markets we’ve been investing heavily to capture opportunities to build out public and private infrastructures. Our growth markets organization grew 13 percent as reported and 10 percent at constant currency, representing 19 percent of IBM’s geographic revenue in the quarter.
The BRIC countries, a subset of our growth markets, grew 19 percent as reported and 12 percent at constant currency with strong double-digit growth in Brazil, Russia and India.

However our results in China slowed to 3 percent growth, down 4 percent at constant currency.
The Olympics were a tremendous success for China, however, we do believe the focus caused a delay in IT spending decisions, and we did not fully anticipate the breadth and duration of this delay. We believe that the fundamental growth opportunity in China continues to be compelling and we are continuing to invest in capabilities to capture the growth. I should note that the growth markets organization excluding China grew over 12 percent at constant currency, in line with their first half growth.

Revenue by Key Industry Sales Unit Turning to another perspective on revenue, the business from our industry sales units was up 6 percent, or 3 percent at constant currency. I’ll comment on a few of the sectors. We had strength in the Public sector, driven by government and healthcare industries. Healthcare growth accelerated this quarter as clients continue to look for more cost effective business models. In Government we had good growth in both major and growth markets. In the US, our government business grew 7 percent. In our growth markets, revenue grew 33 percent as governments in these countries use technology for national development.
Lagging overall performance was the Industrial sector, as concerns with the credit markets and margin pressures impacted near term spending decisions. Worldwide Financial Services results were roughly in-line with our total sector performance for the fourth consecutive quarter. I’ll remind you that about 60 percent of our Financial Services revenue is in annuity businesses. The US revenue was down 1 percent, slightly better than our second quarter performance. However, outside the US, where we generate over 75 percent of our business, revenue was up 10 percent, or 4 percent at constant currency. Globally, we had growth in banking and insurance, but financial markets revenue was down at constant currency.

Financial Services Perspective
There have been some comments recently about closings and consolidations in the financial services sector. I’d like to address those comments now. Earlier this month The New York Times, using Bloomberg data, published a timeline of buy-out and takeover activities of major financial institutions in the US and Europe since the middle of last year. There were 21 companies in total – you can see the names here – and we have included the original exhibit from the article in our supplemental charts. The amount of revenue IBM generates from these institutions is only about one percent of IBM’s total revenue – and about the same portion of our outstanding receivables. This should give you some perspective on the amount of business we do with these firms, as it compares to IBM’s total business. So now let’s look at our revenue by segment.

Revenue by Segment
From a segment perspective, software had the best growth rate, leveraging a solid annuity base as well as acquisitions. Services revenue continued to be driven by good short term signings performance. Systems and Technology was most impacted by a slowdown in transactions at the end of the quarter – though we had strong demand for high end systems as customers looked to optimize their infrastructures through virtualization and consolidation. In Global Financing, financing revenue was up 6 percent, though this was more than offset by a decline in the sales of used equipment. I’ll come back to our financing business a little later. So now let’s turn to Expense.

Expense Summary
Total Expense and Other Income was up 6 percent. Approximately 4 points of growth was due to currency. And we estimate that 5 points of growth is from acquisitions, driven primarily by Cognos and Telelogic. So operational expense actually improved by 4 points year to year.
Underneath this we’re executing our investment strategy and allocating our spending to areas where we see the best opportunity. In our growth markets, where we’re investing to capture the fast growing opportunity, SG&A excluding currency and acquisitions was up 15 percent. While in the rest of the world it improved 4 percent year to year, reflecting our focus to drive productivity in our major markets organization. Our emphasis is not just on expense, but on our entire spending base, and you see the benefit of these operational actions in our margins. Let me give you an example of the types of things we’re working on. We spend over 15 percent of our $90 billion spend base on what we call Global Support Functions – think of it as back office functions like Finance, Human Resources, and Sales Support. Our objective is to drive 5 percent savings annually. We’re well on our way to achieve our 2008 target, having reduced our spending by 4 percent through the first three quarters. And by the end of this year, we will have reduced our spending by $1.4 billion since the end of 2006. We are continuing the same approach to improve our spending structure and drive efficiency into the fourth quarter and 2009. Before I show our margins by segment, I want to comment on the items that significantly impacted our profit growth this quarter. First, we took additional specific reserves against our accounts receivable balance – reflecting the current economic environment in many industries. This contributed to a year-to-year increase in AR Provisions of about $125 million -- and increased our reserve coverage on accounts receivable to 2 percent -- up 50 basis points from a year ago – and up 30 basis points from June.

Second, retirement-related plans generated about $380 million of cost and expense in the quarter, for a savings of about $275 million year to year. For the full year, retirement-related cost is expected to be $1.5 billion, which is $1.1 billion better than 2007. This includes the termination of the Career Choice Retirement Plan in Japan in the fourth quarter -- that will result in a one-time benefit in retirement-related costs of approximately $100 million. This will be largely offset by fourth quarter workforce actions in Japan – designed to improve Japan’s structural competitiveness.
Margins by Segment Now, before getting into the segments, I’ll quickly show you our margin performance by segment. You can see that we had good margin performance in both services segments -- and in software. Despite a benefit from mix, hardware margins were down due primarily to the performance of our industry standard servers. Overall, gross margin was up 2 points, and pre-tax margin up 1.8 points. This is driven by our ongoing cost and expense initiatives. I just talked about one to address expense, let me mention another to drive a more efficient cost structure. Global Technology Services service delivery contributes over $1 billion of annual productivity savings by shifting resources to global delivery centers, improving our processes, and improving our tools - all designed for more efficient support to our clients. You can see the benefit to our services margins, GTS was better by over 2 points year to year. So now I’ll move on to a broader discussion of our Services segment.

Global Services Segments Our two Global Services segments leveraged their very strong margin performance to drive strong profit growth this quarter. Together, pre-tax profit was up 23 percent on revenue growth of 8 percent as reported and 4 percent at constant currency. This was the highest level of Services pre-tax margin in six years, it’s especially important given that we did it in the seasonally challenging third quarter. Signings were $12.7 billion at actual rates, down 4 percent, while at constant currency, signings were $11.1 billion, down 5 percent year to year. Overall short term signings were up 13 percent at actual rates and up 8 percent at constant currency. Short term signings were up in both the growth markets and the major markets. Long term signings were down 16 percent at actual rates, and down 15 percent at constant currency coming off very strong performance last year. But we had good long term signings performance in the growth markets, up almost 60 percent.
We signed nine deals larger than $100 million, and our backlog was an estimated $114 billion. So let me tell you what we’re seeing in the marketplace. There are a lot of enterprises dealing with a tough environment, looking for ways to reduce costs, conserve capital, and in some cases – just to survive. So there’s a lot of good services opportunity out there. But frankly, there are also many deals that have very unattractive economics, and while these may be interesting to some of our competitors, they’re not to us. It’s not hard to drive revenue in a services business on a weak book of business. But we’ve built a strong and profitable business – and we’re not going to put that at risk just to show a higher level of signings.
I think the most impressive aspect of the business this quarter was the margin expansion and profit growth. This is a function of the quality of our portfolio of contracts, and our ongoing programs to drive operational efficiencies and structural changes to our cost base.

Over the past few years we’ve talked quite a bit about the changes we’re making to our delivery structure in Services. We’ve built a delivery platform that takes advantage of the best skills and costs globally. It’s a platform that maximizes flexibility – enabling us to put our people where the work is. The end result is higher utilization, and the ability to get optimal pricing while continuing to deliver value to our clients.
These changes have contributed to our recent profit performance, but more importantly, we will continue to drive structural changes that will result in a more efficient delivery cost base by focusing on ongoing process efficiency and productivity. So now I’ll go to a few specifics on the segment results. For Global Technology Services, revenue was up 8 percent and 5 percent at constant currency. Short term signings were up 19 percent at actual rates, while long term signings were down 17 percent. Our Strategic Outsourcing revenue was up 8 percent. We had very strong performance in the growth markets – up 21 percent – however, growth in the major markets moderated as we wrapped on a number of large contracts, and we were impacted by the lower level of long term signings over the last few quarters.
Integrated Technology Services revenue was up 11 percent. Signings were up a very strong 19 percent, as the momentum in our ITS key infrastructure plays continues. We had signings growth in all geographies and all sectors. Our Global Technology Services pre-tax profit was up 16 percent, and margin was 11.6 percent, up .8 points year to year. This margin expansion was driven by improved cost structure, a mix to higher offerings in ITS, and year-to-year savings in retirement-related costs.
Turning to Global Business Services, revenue was up 7 percent as reported and 3 percent at constant currency. Our revenue growth was impacted by year-to-year declines in two countries. Japan and Australia combined were down 13 percent at constant currency. The rest of Global Business Services was up 8 percent at constant currency.
Short term signings were up 10 percent at actual rates. Signings were up in Europe and Asia, but down in the Americas.

Long term signings were down 16 percent at actual rates. In the third quarter last year long term signings for GBS were up more than 85 percent year to year at actual rates, so it was a very tough compare.
Global Business Services delivered a record level of profit. Pre-tax profit was up 39 percent and margin expanded 3.3 points to 14 percent, their best ever. About 2 points of this improvement was driven by better utilization, pricing, and cost and expense management, with the remainder coming from lower retirement-related costs.

Systems and Technology Turning to Systems & Technology, revenue of $4.4 billion was down 10 percent year to year, or 11 percent at constant currency. We continue to see strong performance in our high-end systems. Customer demand for virtualization and consolidation drove double-digit revenue growth in System z and high-end System p. However, this was more than offset by declines in our low-end products and in Storage. Building on the momentum established in the first half of the year, System z had another quarter of solid performance. MIPS grew 49 percent, and revenue was up 25 percent, with double-digit growth in all geographies. System z continues to sell very well, even in a tough environment, thanks to its ability to consolidate the workloads done by many different servers onto a single, virtualized platform. Specialty MIPS grew over 120 percent as customers exploit the capabilities of System z to bring new Linux and Java applications to this highly efficient and cost effective platform. We are also seeing customers in emerging countries leveraging this platform’s stability and efficiency. For example, the Philippine Savings Bank consolidated seven on-line transaction processing applications, spread across multiple servers to just one Linux partition, resulting in better productivity and energy savings. System z performance reflects its strong value statement in this environment and good sales execution, and we believe we gained market share. Converged System p was up 7 percent, reflecting strong demand for IBM’s virtualization technology and energy-saving capabilities. This is the ninth consecutive quarter of revenue growth, again gaining share and extending its market leadership position. High-end servers were up 19 percent year to year, and midrange servers were up 21 percent. Legacy System i revenue declined about 80 percent year to year as we continued to transition our customer base to the converged POWER platform. This is a very small piece of our portfolio reflecting prior generation technology.

System x server revenue declined 18 percent year to year, and blades were down 8 percent. This quarter’s weakness was driven by sales execution issues, a very competitive pricing environment and a continuation of the slowdown in the x86 market. We expect to see improvement in the first quarter of next year. Our Storage revenue declined 3 percent year to year after a first half of strong growth. Disk grew 1 percent, and our high-end DS8000 increased 2 percent driven by our strong System z performance. Tape declined 11 percent, as customers decided to purchase additional media to expand the utilization of their existing devices rather than commit to new capital. Gross profit margin in Systems and Technology was down 2.4 points year to year driven primarily by industry standard servers.
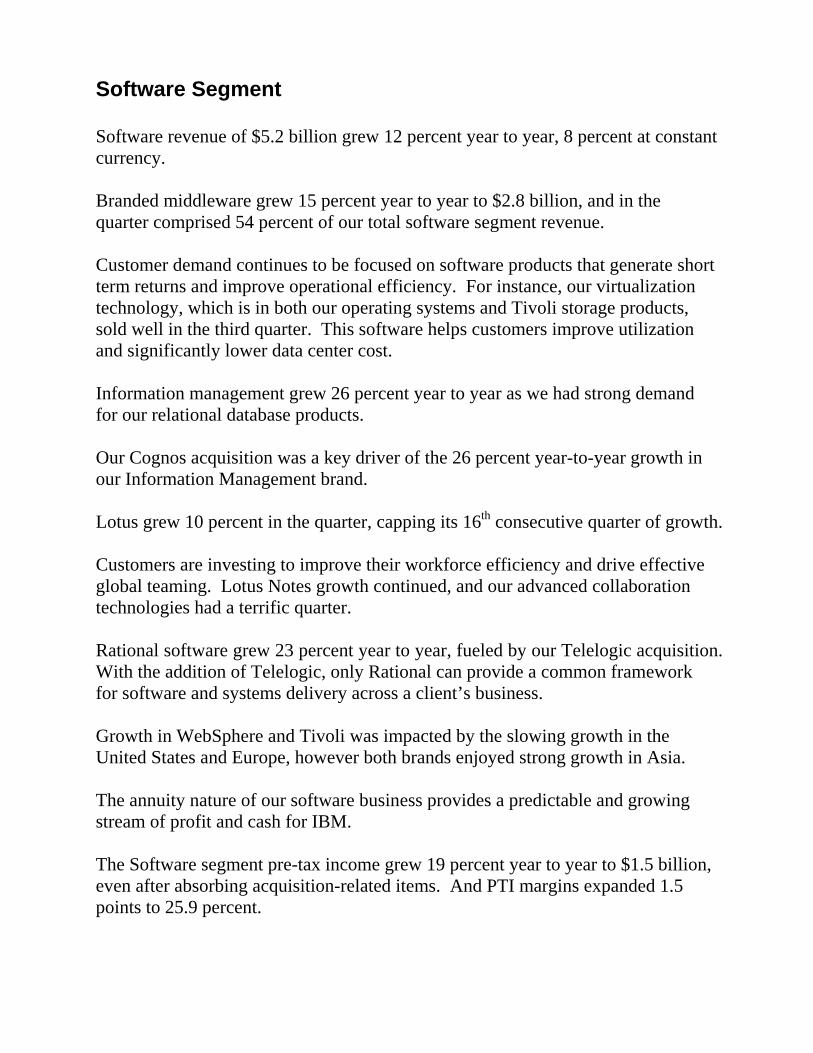
Software Segment Software revenue of $5.2 billion grew 12 percent year to year, 8 percent at constant currency. Branded middleware grew 15 percent year to year to $2.8 billion, and in the quarter comprised 54 percent of our total software segment revenue. Customer demand continues to be focused on software products that generate short term returns and improve operational efficiency. For instance, our virtualization technology, which is in both our operating systems and Tivoli storage products, sold well in the third quarter. This software helps customers improve utilization and significantly lower data center cost. Information management grew 26 percent year to year as we had strong demand for our relational database products. Our Cognos acquisition was a key driver of the 26 percent year-to-year growth in our Information Management brand. Lotus grew 10 percent in the quarter, capping its 16th consecutive quarter of growth. Customers are investing to improve their workforce efficiency and drive effective global teaming. Lotus Notes growth continued, and our advanced collaboration technologies had a terrific quarter. Rational software grew 23 percent year to year, fueled by our Telelogic acquisition. With the addition of Telelogic, only Rational can provide a common framework for software and systems delivery across a client’s business. Growth in WebSphere and Tivoli was impacted by the slowing growth in the United States and Europe, however both brands enjoyed strong growth in Asia. The annuity nature of our software business provides a predictable and growing stream of profit and cash for IBM. The Software segment pre-tax income grew 19 percent year to year to $1.5 billion, even after absorbing acquisition-related items. And PTI margins expanded 1.5 points to 25.9 percent.

Cash Flow Turning to IBM’s cash performance, we generated $2.1 billion of Free Cash Flow in the quarter, which was down $500 million from last year’s third quarter, but we were up $1.3 billion year to date. The decline in the current period was primarily driven by working capital. In particular, our inventory levels increased due to our hardware performance. That said, our collections performance was excellent. DSO improved three days year to year and resulted in the best third quarter DSO level in eight years. And our collections remained strong throughout the quarter. Through the first three quarters, our Free Cash Flow was $6.4 billion. As I said, this was up $1.3 billion year to year. Turning to uses for the year, we have invested $6 billion in acquisitions. We’ve also returned $11.8 billion to shareholders. We bought back over 83 million shares for $9.8 billion, including $2.7 billion this quarter. And at the end of September we had $6.3 billion remaining from our last board authorization.
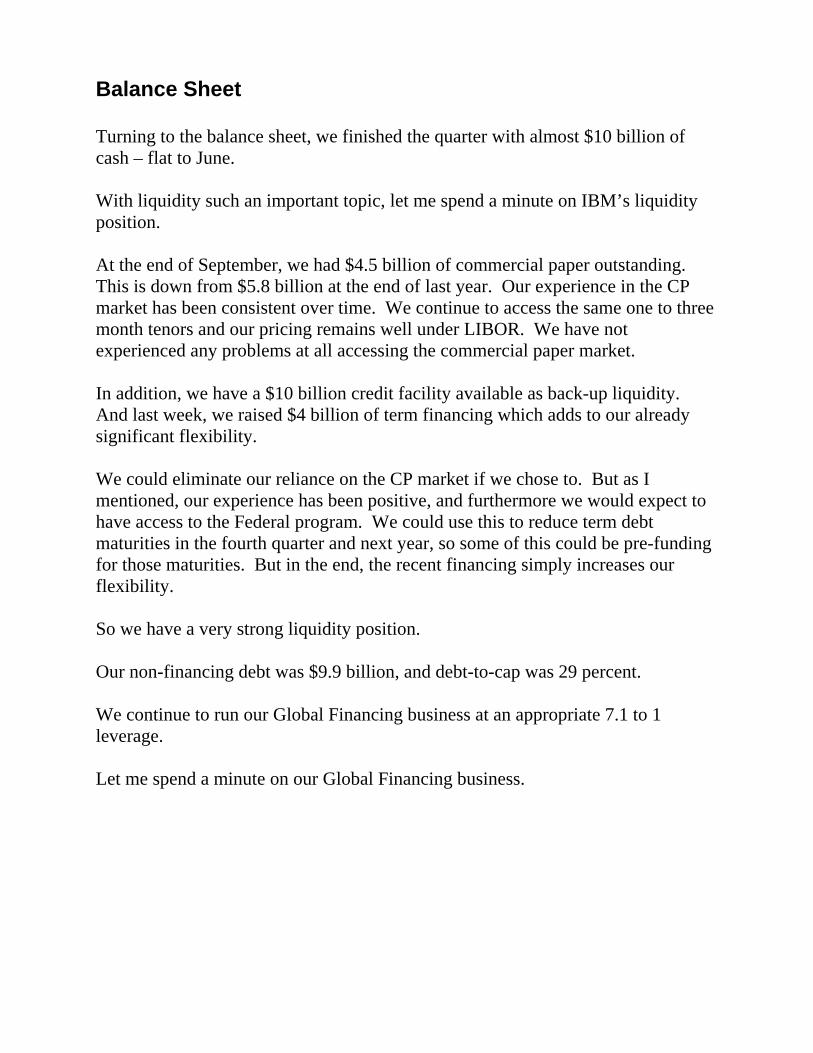
Balance Sheet Turning to the balance sheet, we finished the quarter with almost $10 billion of cash – flat to June. With liquidity such an important topic, let me spend a minute on IBM’s liquidity position. At the end of September, we had $4.5 billion of commercial paper outstanding. This is down from $5.8 billion at the end of last year. Our experience in the CP market has been consistent over time. We continue to access the same one to three month tenors and our pricing remains well under LIBOR. We have not experienced any problems at all accessing the commercial paper market. In addition, we have a $10 billion credit facility available as back-up liquidity. And last week, we raised $4 billion of term financing which adds to our already significant flexibility. We could eliminate our reliance on the CP market if we chose to. But as I mentioned, our experience has been positive, and furthermore we would expect to have access to the Federal program. We could use this to reduce term debt maturities in the fourth quarter and next year, so some of this could be pre-funding for those maturities. But in the end, the recent financing simply increases our flexibility. So we have a very strong liquidity position. Our non-financing debt was $9.9 billion, and debt-to-cap was 29 percent. We continue to run our Global Financing business at an appropriate 7.1 to 1 leverage. Let me spend a minute on our Global Financing business.
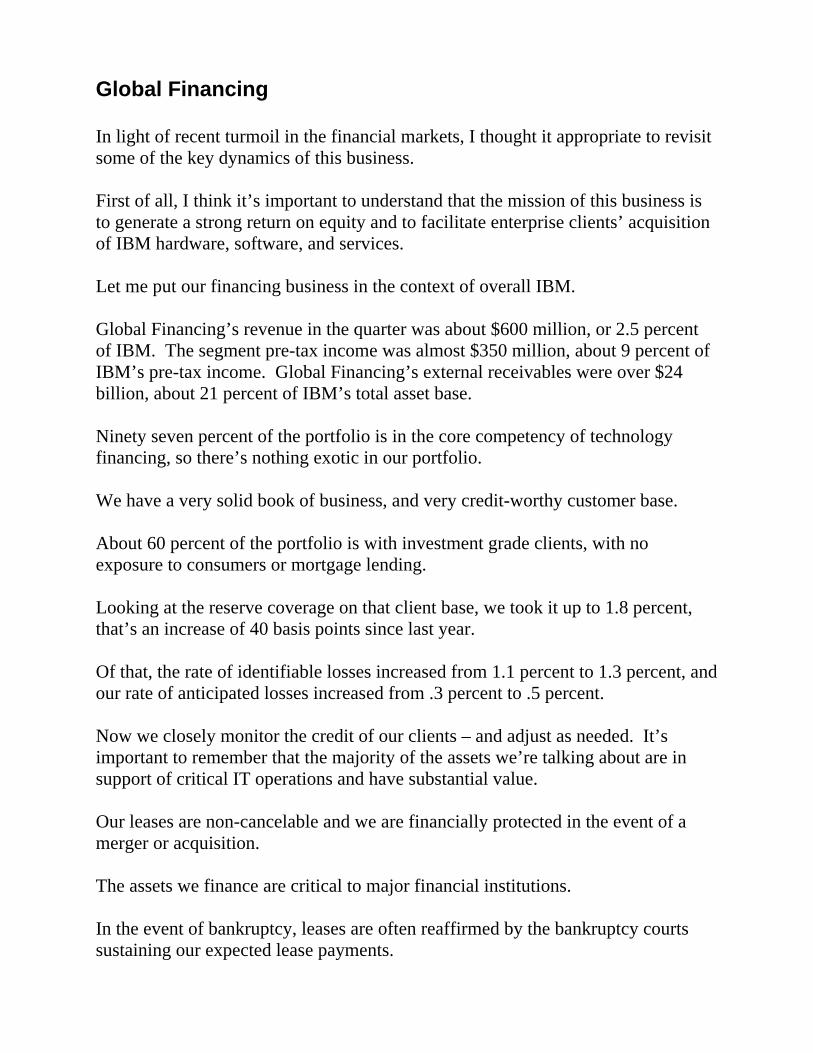
Global Financing In light of recent turmoil in the financial markets, I thought it appropriate to revisit some of the key dynamics of this business. First of all, I think it’s important to understand that the mission of this business is to generate a strong return on equity and to facilitate enterprise clients’ acquisition of IBM hardware, software, and services. Let me put our financing business in the context of overall IBM. Global Financing’s revenue in the quarter was about $600 million, or 2.5 percent of IBM. The segment pre-tax income was almost $350 million, about 9 percent of IBM’s pre-tax income. Global Financing’s external receivables were over $24 billion, about 21 percent of IBM’s total asset base. Ninety seven percent of the portfolio is in the core competency of technology financing, so there’s nothing exotic in our portfolio. We have a very solid book of business, and very credit-worthy customer base. About 60 percent of the portfolio is with investment grade clients, with no exposure to consumers or mortgage lending.
Looking at the reserve coverage on that client base, we took it up to 1.8 percent, that’s an increase of 40 basis points since last year. Of that, the rate of identifiable losses increased from 1.1 percent to 1.3 percent, and our rate of anticipated losses increased from .3 percent to .5 percent.
Now we closely monitor the credit of our clients – and adjust as needed. It’s important to remember that the majority of the assets we’re talking about are in support of critical IT operations and have substantial value. Our leases are non-cancelable and we are financially protected in the event of a merger or acquisition. The assets we finance are critical to major financial institutions. In the event of bankruptcy, leases are often reaffirmed by the bankruptcy courts sustaining our expected lease payments.
If necessary, the financed assets can be recovered and resold through our highly refined marketing operations, which extract significant value in the event we have to repossess the equipment. So we have the ability to manage our risks. Let me put this in the context of recent events, if you take those same 21 financial institutions that I referenced during the sector discussion, IGF had exposure to ten of them, and we have not been adversely impacted at all.
Overall, this is a very solid business and gives us a competitive advantage in the marketplace.

3Q2008 EPS Bridge
Now let me start to wrap up with a discussion of the drivers of our 22 percent earnings per share growth. We had revenue growth of 5 percent, including 3 points of currency benefit. At constant mix and margin, this 5 percent revenue growth contributed 8 cents of year-to-year EPS growth. By far, the biggest driver of our earnings growth was gross margin expansion, led by services and software. Gross margin improvement contributed 27 of the 37 cents of EPS growth in the quarter. Of that, about 9 cents was due to the year-to-year benefit from our retirement-related plans that flowed to cost. Our expense growth impacted EPS by 3 cents, though as I mentioned earlier, our operational expense that is without currency and acquisitions, was better year to year.
Our 4 cent contribution from share repurchase was less than we’ve seen in the last few quarters, as we wrapped around on the benefit from last year’s accelerated share repurchase. And finally, a 50 basis point year-to-year reduction in our tax rate yielded the last penny. When you look at this chart, it’s obvious that the growth came from margin expansion, the result of an ongoing focus on increasing operational efficiencies and good, tactical cost and expense management. Before moving on, I want to address one other item that is embedded in the EPS bridge above – and that is currency. We report the top line impact from currency each quarter, and we provide an estimate of future quarters based on current spot rates. Typically, there is not much movement in currency rates over the course of the quarter – we’ve seen this in the last six quarters. But in the third quarter, we saw a significant strengthening of the dollar, and rather than the 6 to 7 point benefit to revenue growth that we would have expected, currency added only 3 points of year-to-year growth. The difference was $800 million.

At current spot rates, currency will shift from a tailwind to a headwind. So in the fourth quarter, as compared to the 3 point benefit to revenue growth we had in the third quarter, at current spot rates we could have a 4 point hurt to revenue growth from currency in the fourth. Now in terms of currency impact on EPS, we can’t precisely determine the currency contribution to the bottom line because we don’t know how much of the currency impact is passed on to our customers in price, or how it affected our sourcing decisions. In the third quarter, we estimate that currency, net of the hedging activity, was not more than about 20 percent of our total EPS growth. But in our experience, pricing and sourcing actions reduce this – so you can think of this as a hypothetical upper limit. Now, let me wrap up.

IBM Well-Positioned in Current Environment
This is a tough market, but we have a lot of things going for us in this environment. We have a very strong liquidity position. We have $4.5 billion of commercial paper, with continued access to the market at sub-LIBOR pricing in one to three month maturities, just as we’ve always done. So we’ve had absolutely no problems at all with access to the market. Now let me reassure you we’re not reliant on CP. We ended the quarter with nearly $10 billion in cash and we maintain a $10 billion back-up credit facility. That is $20 billion that we could access at any time. So if we wanted to exit the CP market because of some macro event, we certainly could. Last week, we demonstrated substantial access to the term debt markets by raising an additional $4 billion of cash across five, ten, and thirty year maturities. We think it’s smart to go long in this environment – if you can. So with our cash balance, now enhanced by our recent term debt issuance, and our backup credit facility, it is clear we are not reliant on the short term commercial paper markets for funding our business. To continue to build our balance sheet, we have a business model that is designed to deliver profit and cash. An important element of that model is our disciplined approach to aligning investments to growth, so just as we aggressively invest in high growth markets, we’re driving productivity from the more established markets.
We’ve been managing the major markets to deliver productivity for some time. We have made a lot of progress in our initiatives, but still have a lot of opportunity to continue to improve our balance point. Earlier I gave you a few examples of actions we've been taking to optimize our spending profile. Let me give you a flavor of what we're working on going forward. In Global Technology Services service delivery we will continue to generate $1 billion annually in productivity.

In addition, we have aggressive plans in place to accelerate our shift of resources to global delivery centers. In 2009 we plan to increase our global delivery center population by 25 percent. Within our supply chain function, we expect to reduce spending by another $3 billion to $4 billion in 2009. This is consistent with what we’ve done in the past. Now, some of this goes to price and some goes to offsetting increasing labor costs, so not all goes to the bottom line. Let me give you a couple of specific initiatives we’re working on -- Product design teams will reduce supply chain cost by eliminating redundant components and substituting lower cost alternatives. Our procurement team is consolidating the number of suppliers to leverage our spending, and working closely with these suppliers to improve cost and eliminate waste. This work, combined with our investments in decision support tools and improved processes to enable us to optimize our worldwide supplier base, have already identified over $300 million in future savings. Now in our Global Support functions, we will continue to expect 5 percent annual reductions. I've mentioned in the past that within my function, Finance, more than 40 percent of the function is located in Centers of Excellence both in the US and around the world. Our goal is to improve this to 50 percent by 2010. And other functions are making similar shifts. By 2010, our IT function will increase the number of people in Centers of Excellence by 17 percent. HR will increase 9 percent, and our Sales Support function will increase 16 percent. All of this drives better productivity and efficiency with our functions while enabling us to reach our cost objectives. These initiatives are useful in getting you through tough times. This quarter, they helped to deliver 2 points of gross margin improvement and 4 points of operational expense improvement. In other words, they paid off on the bottom line.

And they have another benefit, they ultimately improve our balance point. So that when the market turns we’ll get better leverage off a leaner cost base.
Overall, we feel confident in our ability to deliver at least $8.75 of earnings per share for the full year 2008. Now Patricia and I will take your questions.
CLOSING
Thanks, Mark. Before we begin the Q&A I’d like to remind you of a couple of items. First, we have supplemental charts at the end of the deck that complement Mark’s prepared remarks. Second, I’d ask you to refrain from multi-part questions. When we conclude the Q&A, I’ll turn the call back to Mark for some final remarks.