081203 2009 preview - strategy outlook · 2008-12-03 · uralsib research team:...
TRANSCRIPT

URALSIB research team: [email protected]
December 2008
Strategy Russia ’09: Darkest Before Dawn
Investing For a Recovery
Russian Equity Research

STRATEGY RUSSIA ’09: DARKEST BEFORE DAWN
TABLE OF CONTENTS RUSSIA ‘09: DARKEST BEFORE DAWN ...................................................1 INVESTING FOR A RECOVERY.................................................................1 THE BIG PICTURE .................................................................................2 MAIN ASSUMPTIONS FOR 2009..............................................................3 MAIN RISKS FOR 2009 ..........................................................................5 SECTOR THEMES FOR 2009 ..................................................................6 DEFENSIVE PORTFOLIO STOCK PICKS ...................................................7 “PHOENIX RISING” STOCKS ...................................................................9 2008 IN REVIEW .................................................................................10 POSITIVE 1ST HALF – COLLAPSE IN 2ND ..............................................10 RUSSIA RELATIVE TO WORLD/GEM.....................................................11 THEMES .............................................................................................11 STOCK PERFORMANCE .......................................................................12 STRONG FIRST HALF ..........................................................................12 COMPLETE CHANGE IN SECOND HALF .................................................13 GREATER VOLATILITY .........................................................................13 TOUGH 1H09 FOLLOWED BY AN IMPROVEMENT....................................14 MACRO OVERVIEW .............................................................................14 BANKING ............................................................................................17 OIL & GAS..........................................................................................19 UTILITIES............................................................................................25 METALS & MINING ..............................................................................29 FERTILIZERS.......................................................................................32 AUTOMOTIVE ......................................................................................36 TRANSPORT .......................................................................................41 TELECOMS .........................................................................................45 CONSUMER GOODS & RETAIL .............................................................50 REAL ESTATE .....................................................................................54

STRATEGY
RUSSIAN EQUITY RESEARCH
URALSIB does, and seeks to do, business with the companies covered in their research reports. Consequently, investors should be aware that URALSIB may have a conflict of interest that could affect the objectivity of this report. This report should not be used as the only single factor governing investment decisions. Disclosures and analyst certifications are located at the end of the body of this report. © URALSIB Capital 2008
URALSIB research team, [email protected]
RUSSIA ’09: DARKEST
BEFORE DAWN INVESTING FOR A RECOVERY
High beta Russia. Conditions in the Russian economy will get worse before recovering in third or fourth quarter of next year. The equity market will remain weak, with volatility driven by a combination of domestic news and the trend in global – especially emerging – equity markets and commodities. But most of the blue chips and corporate debt issues are now pricing in an even worse case scenario. This is an excessive reaction considering that the country and the largest corporations are well positioned to survive the economic whirlwind, even as growth is collapsing over the medium term. Investing into some equities and debt issues that are now priced at distressed levels will prove very profitable beyond this period of weakness. The current valuations pay investors for the timing uncertainty. At this stage, the most reasonable scenario is for continued weakness in asset prices through the first half of 2009, with a strong recovery in the second half. The downside risk is an even deeper global recession than expected, while the risk to the upside is that investors will anticipate recovery earlier and buy into high-beta markets such as Russia.
Phoenix Rising. We recommend two portfolios for investors: First, the defensive portfolio, which is comprised of high conviction stocks that we believe are very well placed to deliver strong relative performance during the expected tough first half market conditions. These stocks should also be amongst the first to rise in absolute terms when the market rallies. We recommend buying these stocks today. The second portfolio, the phoenix rising portfolio, is comprised of the highest conviction stocks along with others that we expect to remain weak during down markets, but which are well positioned for strong gains when the rally starts. We recommend buying these shares during the down days in the first quarter.
Mirror image of 2008. In 2009 we expect the Russian investment climate to form a mirror image of that seen in 2008. Prices through 1H09 will remain very volatile and, despite some bear market rallies, generally weak. We anticipate very bad economic and corporate news in 1H09 and the equity markets may again test the recent lows in that period. Although the outlook for the start of the year is bad, the case is improving for a much more favorable investment backdrop in 2H09. The massive amount of liquidity that governments around the world are pumping into their economies and the measures being taken to prevent a prolonged recession should have a positive impact in 2H09, in our view. That, plus output cuts that materials and commodities producers are making, should produce a real inflationary boost to economies and commodity prices later in the year.
RTS target ranges. It is very difficult to specify a realistic target for the RTS Index over the next year as there are simply far too many variables and possible scenarios, both externally and for the domestic economy. A year-end rally may yet occur this year given the optimism generated by the US President-elect Barack Obama’s proposals to stimulate the economy and similar packages put in place by other governments. A reality check is inevitable in the first and second quarters of next year. Given recent volatility, the RTS could close out this year anywhere in the range 550 to 800. The trading range in 1H09 is again likely to be very wide, possibly between 500 on the downside and 1,200 on the upside. Although we expect a very volatile and mainly weak 1Q09 we do expect a stronger end to first half. We expect a mid-year level closer to the upper end of that range. How the market closes out the full year will depend on how the global economy performs, how oil and other commodities trade and how investors perceive investment risk in Russia.
Defensive Stocks
AFK Sistema Comstar-UTS
Federal Grid Company Gazprom
Gazprom Neft Magnit
MTS OGK-4
Polyus Gold Raspadskaya Raven Russia
RusHydro Silvinit comm Silvinit pref
TMK * Stocks that we believe are best placed to weather an economic whirlwind during 1H09 (in alphabetical order)
Note: Market data as of 21 November 2008

2
STRATEGY DARKEST BEFORE DAWN
Tough conditions, but survivable. Russia has enough financial resources to weather the economic storm over the winter months, although economic growth will certainly deteriorate very sharply. The country is also sufficiently adaptable to withstand a long period of global downturn, in our view. The fact that the economy has not yet achieved any real trade or investment integration with the rest of the world can be a virtue in such periods. Had the current debt and commodity crisis occurred in, say another three to four years’ time, the destructive effects would have been much greater. For now, the extent of contagion is limited and will allow the country to batten down the hatches to survive the hurricane. Of course the major external contagion is the price of oil. Oil (and gas) revenues are very critical for the Russian economy and to investor perception of currency risk and overall country risk. We expect continued weakness in the oil price into early 2009 before it sees some stability and a recovery later in the year.
Picking the stocks best placed for a recovery. In this note we review the current trading conditions for each sector and set out our macro overview to assess the operating outlook for each in 2009. From this we identify the companies that are best placed today to outperform both the economy and the rest of the stock market through the turbulence expected over the next six months. These stocks are listed in the table above on the right. The investment case for each is set out later in this note. We also identify the stocks that in our opinion are best placed to lead a market rally in 2H09. These are our favored long-term plays and are also set out in the table below on the right.
THE BIG PICTURE Assets now priced at distressed levels. The basic investment case for Russia – the reason to buy assets – is that the country will survive this financial and economic crisis. The economy will experience a severe downturn and many companies will face major difficulties. Not all the current major owners will be able to hold on to their equity, and we are likely to see major restructuring in the banking, real estate and some consumer sectors. But no major bank will fail and no major corporation will default on its debt. At current levels the market is assuming a worst-case scenario, with many companies valued barely above distressed levels. We believe this is a complete exaggeration and these valuations will recover once the financial crisis ends and the shoots of recovery appear in 2H09.
More emphasis on reforms. We hope the Russian government will treat the crisis as a wake-up call and place greater emphasis on reforms once the dust has settled. To maintain the government’s aim of increasing investment in the country and ensuring greater economic diversity, Russia will need to attract greater inflows of foreign investment. This can only be done with a much improved business climate and business practices. The pace of reform has moved far too slowly up until now but will hopefully pick up in 2009. Reform of the financial markets can now be included in the list of much needed, and now obvious, reforms – not just how the markets operate, but why Russia lacks a sizeable domestic investor base (i.e. pension funds). The latter problem has contributed to the extreme volatility in the markets since September. Prime Minister Vladimir Putin’s call for legislation to ban insider trading is a positive indicator of that.
“Phoenix Rising” Stocks
Stocks in defensive portfolio, plus
DIXY Group EVRAZ
LSR Group LUKOIL Mechel NLMK
Norilsk Nickel PIK Group Sberbank
TNK-BP Holding VimpelCom
VTB X5 Retail Group
* Stocks that we believe are well placed to benefit from the expected recovery in commodities, economic activity and investor sentiment through 2H09 (in alphabetical order).

3
STRATEGY DARKEST BEFORE DAWN
MAIN ASSUMPTIONS FOR 2009 Key assumptions. We make a number of assumptions in our analysis and forecast of economic trends and in assessing each sector outlook. These assumptions can be split into two groups: international and domestic.
International. Our assumptions for the global climate include:
Growth. The IMF projects a severe downturn in the US economy in 4Q08 and through to 1Q09 followed by a gradual climb to a positive growth number in 3Q09 and leading to stronger growth in 4Q09. The fund does warn that the extent of the decline may be worse than it expects and the steepness of the recovery line more shallow, but its expectations for investment markets and commodity prices are generally in line with ours.
Inflation. The huge financial packages put in place in the major economies (with more likely to come) plus drastic cuts in interest rates will inevitably lead to higher inflation across the globe. This would eventually be good for asset price appreciation and for commodities.
US dollar. The US dollar will likely remain relatively strong against the euro and most major currencies into early 2009 but will then weaken significantly through the course of the year as President-elect Obama plans to spend enormous sums of money to bail out stricken industries, such as the auto-makers, and to fund major public projects. Printing money on a large scale will inevitably weaken the dollar. We expect the yen to remain the strongest international currency, with sterling performing better relative to both the dollar and the euro. Even though the UK economy is declining faster than the eurozone, it is likely to emerge quicker due to less contagion and fewer political problems than exist inside the eurozone.
Oil. The price of oil will likely test new lows and generally remain weak over the next few months. This is because demand is falling fast and any move by OPEC and other producers are, of necessity, behind the curve. There are also some holders of oil-derivative instruments that still need to unwind into the year-end and early 2009. But from mid 1Q09 the extent of the demand destruction should be clearer and production better balanced. Our other major assumption is that OPEC discipline will hold and that the cartel will adhere to its promised production levels. In this scenario, price weakness would be followed by a strengthening in 2H09. We assume an average price for Brent of between $70 and $75/bbl through 2009 and 2010, with Urals trailing by between $3 and $4/bbl.
Gold. The price of gold (and to a lesser extent, silver) is set to rise in 1H09 as the dollar weakens and economic and corporate news flow reflects the deteriorating conditions this winter. Gold will emerge as a strong savings haven. Expect to see new record highs in 1H09.
Metals. In keeping with our global macro, inflation and currency assumptions, we expect to see stronger metal prices in 2H09. The fact that many big producers, including in Russia, are cutting output and closing some units will accelerate the pace of the price recovery when it comes.
IMF assumes a decline in global growth until next summer then stability before a late-year recovery.
Gold looks set to shine in 2009
US dollar is expected to weaken in 2009 as the new administration prints dollars to fund the huge bailout packages
We expect Brent to average close to $70/bbl through 2009 but with continued volatility, and price strength only in 2H09

4
STRATEGY DARKEST BEFORE DAWN
Domestic. Our main domestic assumptions include:
Default risk. There is zero risk of a sovereign default or a default by any state owned/controlled company and very low risk of a technical default from any major enterprise. The main risk lies with ruble issues of smaller companies; we expect some technical defaults at least.
Banks. No high-street bank will fail, but the share of non-performing loans will increase significantly. Bad debt write-offs will inevitably increase.
Economic growth. GDP growth will continue to fall through to 1Q09. This will entail further job losses and company closures. Macroeconomic news flow is likely to be at its worst in late 1Q09 and early 2Q. But as commodity prices rally in 2H09 and confidence rebuilds, we expect the economy to improve. (Note: our main economic assumptions are set out in the Macro Overview section later in this note.)
Consumer. The economic crisis spells the end, for a time, to consumption growth in Russia and by Russians in foreign markets.
Real estate. The price of real estate, both commercial and residential, will fall a lot more than already seen. The market will likely reach a bottom in 2Q09.
Ruble. The gradual widening of the CBR’s currency basket will continue and the government will allow the foreign currency reserves to decline until at least mid-January. At that point a major reassessment will be made and any change of course revealed. At present the government appears resolved to hold the ruble steady, albeit with regular widening of the “basket” trading band.
Inflation. The government will not achieve single-digit inflation in 2009 given the massive liquidity injection into the economy. The prospects for inflation far below 10% in 2010 are not too promising, either.
Budget. We anticipate the government will conduct a major review of its budget assumptions for 2009 and 2010, sot likely in February, when there will hopefully be a clearer picture with regard to economic trends and revenue projections (i.e. the oil price).
Oil production. We expect a production decline of at least 2% in 2009, with a drop of up to 5% also possible. This would mean a loss of production and exports of between 200,000 and 500,000 bpd by the end of the year. The lower production will be due to large cuts in oil field spending by the oil majors prompted by lower cash flows, the lower oil price and high taxes.
Equity issuance. Equity issuance will be zero or negligible in 1H09, with volumes picking up in 2H09. Only around $2.6 bln of the $100 bln of new equity originally targeted for 2008 and 2009 has so far been placed. The outlook for 2009 is for around $10 bln; all hopes of that figure being exceeded rest with a bullish 4Q09.
M&A. We anticipate a surge in mergers and acquisitions in 2009 as companies and investors with cash use the opportunity to acquire assets from financially strapped owners. Industry consolidation is already underway in the banking sector and is expected in the consumer sector and others. Many companies will have to combine in order to survive.
Considerable problems to be overcome at home
Chasing oil Ruble/US$ and Urals $/bbl
Source: Bloomberg
22232425262728
01/0
8
02/0
8
03/0
8
04/08
05/0
8
06/08
07/0
8
08/08
09/0
8
10/08
11/0
8
-150-125-100-75-50-250RUB/$ L.H.
OIL Urals*(-1) R.H. Scale

5
STRATEGY DARKEST BEFORE DAWN
MAIN RISKS FOR 2009 Economy. If the financial packages being put in place in the US and elsewhere do not stop the global economy slipping into a deeper, longer recession, the hoped-for bounce in commodity prices would be delayed. This would also have a negative impact on the domestic economy and pull growth lower this winter, which would also mean more job losses and business closures than currently anticipated.
Oil and the ruble. If global economic growth drops by more than expected and/or OPEC does not match lower demand with production cuts, the price of crude will fall closer to the long-run average of $30/bbl. In this event, it is unlikely that Russia would have enough financial reserves, or indeed be willing to burn them at a faster pace, making devaluation inevitable.
Oil spike. A spike cannot be ruled out. This would of course require a supply shock, such as an attack against Iran and it then retaliating or a major conflict in Nigeria. Right now the prospects are low but they cannot be completely ignored.
Political stability. If the ruble undergoes a devaluation and, at the same time, the economy slips into recession with more widespread job losses and company failures, this would be reflected in an inevitable collapse in public confidence in the government and senior ministers. Political instability, and changes, would follow.
China. A sharp drop in Chinese growth would hit the prospects for a rally in commodities, and in Asian economies, through the second half and would push prices much lower in the interim. The risk of social instability would also rise, which would delay any recovery in both China and in commodity-dominated countries such as Russia.
Conflicts. Any conflict similar to that with Georgia would further damage Russia’s position with the EU. Relations between Russia and the EU are likely to be particularly sensitive in the first six months of next year, when the Czech Republic holds the rotating presidency.
Czech presidency. The Czech Republic takes over the EU presidency from 1 January. Although Brussels and the larger EU countries have the greater say in dealings with Moscow, the Czech presidency will give the East European countries a greater voice, with the obvious potential for conflict.
Corporate governance. We have already witnessed a deterioration in corporate governance standards, which is affecting how investors view Russia risk. If this trend continues and minority investors’ interest are harmed, the investment risk premium will rise further. Uralkali. How the issue surrounding Uralkali turns out will have a very direct and long lasting impact on the perception of Russia risk.
Relations with the EU may be tougher next year
Corporate governance standards starting to slip

6
STRATEGY DARKEST BEFORE DAWN
SECTOR THEMES FOR 2009 Main themes. The backdrop of a slowing economy and generally weak commodity prices will of course provide the main investment theme through at least 1H09. The other main themes, which we have incorporated into our review of each industry sector and stock selection, include:
Ruble weakness against the dollar and euro. This factor will increase the value of export earnings for industries such as oil, gas and other commodities. It will also increase the cost of servicing foreign debt and the cost of imported goods. That, in turn, may help companies competing against imported goods, such as food manufacturers.
Cost reduction. Industries with a high cost content in materials, such as cement, coal, pipes and steel, will see a big drop in costs in 2009. We are already seeing evidence of this and it will become much more apparent in the costs of oil companies, for example, in 1H09.
Consolidation. Already evident in the banking and financial sectors, we may see more acquisitions and mergers across other industries, such as the retail sector.
Regional variations. Regions dominated by one large industry will be more obviously affected by the slowdown than other regions that are either are dependant on federal budget support or have a more diversified economy.
Consumer industries. Russia’s retailers are facing into a much tougher 1H09, with already evident slowing in spending expected to get much worse. The trend will be towards lower priced goods, particularly in food retailing, with discounters expected to outperform the higher priced outlets.
Utilities. The main risks to the sector come from reduced electricity demand as the economy slows and an expected drop in deregulated wholesale prices. We favor the more efficient operators in this environment. We expect the distribution companies to face a tough environment because of a likely drop in connection fees. These fees made up to 22% of total revenues for Moscow distribution companies and 28% for Lenenergo. The Federal Grid Company is the best protected from the expected downturn in revenues.
Banking. The big challenge facing all banks in 2009 will be the rising level of non-performing loans and bad debts. The creditworthiness of corporations and individuals will worsen as the economy slows and unemployment rises. Industry consolidation will step up a pace as the stronger banks take out the weaker/troubled banks.
Manufacturing. This sector is heading for a major downturn with industries such as auto manufacturers already announcing production and staff cuts. A late recovering sector.
Media. Likely to suffer from a drop in advertising as the economy slows and companies scale back spending. RBC took a big hit with stock market investments, an issue that raises corporate governance risk.
Metals & Mining. The industry is suffering from a lack of demand, falling prices, rising bad debts and limited access to trade finance. The outlook for the 1H09 looks dreadful and most companies will report very bad 1H09 results. The major hope is for a recovery in 2H09, if demand picks up a little but against a backdrop of reduced supply, as producers continue to scale back capacity in 1Q09. Gold is expected to be preferred as a safe haven play (silver to a lesser extent), and that will be positive for sentiment towards the gold producers.
Banks will face the challenge of higher non-performing loans
Expected big drop in material costs will help boost profits

7
STRATEGY DARKEST BEFORE DAWN
Oil and gas. The oil stocks are likely to underperform during 1H09, as we expect the present tough operating conditions to affect the financial results for 4Q08 and 1Q09. These results will not be reported until next summer and will affect investor perceptions. Costs are beginning to fall across the industry, as the price of materials such as cement drop. This should provide a more positive backdrop for 2H09. Longer-term drivers include diversification into the more profitable retail segment and the use of new technologies. The big question mark, apart from the oil price, is oil taxation, with the industry continuing to lobby for bigger cuts and the Finance Ministry opposing it.
Real estate. If history repeats itself (in line with other economic slowdowns, e.g. Asia 1997/1999) then this will be the last sector to recover. Raven Russia is in our conviction list because of its unique specialization in industrial warehousing. That segment is very under supplied, leaving the company with plenty of scope for growth even in a declining economy.
Telecoms. The mobile telecom stocks are relatively well positioned in a slowing economy, as the bulk of their revenue is for basic services. The example from other countries that have entered a slowdown earlier than Russia is that basic mobile activity holds up relatively well. That said, 4Q results are usually the weakest for seasonal reasons, and that will be a negative for the sector during late 1Q09 when the results are announced. Sentiment towards the regional telecom shares will continue to be affected by uncertainty over the fate of Svyazinvest. No significant progress is expected during 1H09, at least.
Transport. This is one of the most exposed industries to slowing disposable income and business activity, although this is not yet reflected in the rating of stocks such as Aeroflot. Considerable downside risk exists.
DEFENSIVE PORTFOLIO STOCK PICKS
Stock Ticker Price,* Mkt Cap*, Free Target Upside***, 2009E$ $ mln float, % price, $ % P/E
Comstar-UTS CMST LI 1.8 746 35 13 643 1.3Federal Grid Co FEES 0.004 1,667 20 NR n/a n/aGazprom GSPBEX 3.4 81,292 40 NR n/aGazprom Neft SIBN 1.5 7,230 3 NR n/aMagnit MGNT 10.3 738 19 UR n/aOGK-4 OGKD 0.010 630 1 0 536 21.7MTS MBT US 21.7 8,639 41 94 334 3.0Polyus Gold PLZL 15.0 2,636 45 50 233 7.5Raspadskaya RASP 1.1 859 18 12 991 0.7Raven Russia RUS LN 0.4 192 21 1 192 3.2RusHydro HYDR 0.015 3,749 21 0 684 3.2Silvinit comm SILV 465.0 3,639 11 NR 7.4Silvinit pref SILVP 160.0 85 NR n/aAFK Sistema SSA LI 4.0 1,930 19 42 950 1.8TMK TMKS LI 1.8 393 23 UR - 0.3* priced as of close November 28; ** based on DCF analysis; Source: Bloomberg, URALSIB estimates
High-Conviction Portfolio
*** upside to DCF target price Comstar-UTS. Comstar-UTS’s core business is highly profitable and relatively well protected against a slowdown in the economy. Regional expansion offers good growth potential. The company has a strong management team, a good balance sheet and healthy cash flows. It may benefit from the state buying of its stake in Svyazinvest for cash and MGTS shares.
Federal Grid Co. The Federal Grid Co. does not have any connection fees to worry about (this revenue stream will fall for others) and is looking at a relatively safe 20% increase in transmission revenues for 2009. While cost growth is expected to exceed inflation, the company will still enjoy positive cash flow growth in 2009. It has a good balance sheet.
Oil industry faces a challenge from lower capex spending

8
STRATEGY DARKEST BEFORE DAWN
Gazprom. Gazprom’s business is based on fixed-supply contracts that will secure its income through 1H09. These contracts may be reduced in 2H09 if the oil price remains low. The company is moving ahead with plans to develop major new projects with international partners, who will share the costs.
Gazprom Neft. Gazprom Neft is the best positioned of the oil majors in terms of a balance between costs, output and cash flows. The free float is very small but Gazprom has declared big ambitions for the company. Hence, Buy when any stock is available.
Magnit. Russia’s second-largest food retailer is well prepared for the slowing consumer spending to come. It has the best balance sheet in the sector and no US dollar debt. Its price-sensitive product range should sell well in a downturn and help it win market share from more expensive competitors.
OGK-4. Unlike other generators, OGK-4 and RusHydro are not facing the problem of rising non-performing loans and bad debts. They are the most efficient operators in the industry, with good balance sheets and cash flows for 2009 based on tariff increases.
MTS. Mobile services are much more resilient that other parts of the consumer sector during a downturn, especially basic voice services. The company will generate strong cash flows and will pay a big dividend to its major shareholder (AFK Sistema) and to minorities. Its debt position is much better than that of VimpelCom.
Polyus Gold. The best Russian equity proxy for the gold price. The price of gold is expected to rise as investors buy into it as a haven in the midst of financial turmoil, dollar weakness and general economic uncertainty through 1H09.
Raspadskaya. Raspadskaya has defensive qualities as its cash holdings are five times the size of its short-term debt.
Raven Russia. Russia has a massive shortage of class A warehouse space, even with the expected cooling of economic activity over the next two quarters. The company is on course to add 900,000 sqm of new space by 2010 to bring its total space to 1.2 mln sqm. The company pays a dividend equivalent to a 17% yield and will raise this to a yield equivalent (based on the current share price) of 20% by 2010.
RusHydro. Unlike other generators, OGK-4 and RusHydro are not facing the problem of rising non-performing loans and bad debts. They are the most efficient operators in the industry, with good balance sheets and cash flows for 2009 based on tariff increases.
Silvinit common. Stable potash prices and a 60% EBITDA margin should allow the company to generate positive net income, with a high tolerance, through both halves of 2009, even if output drops.
Silvinit pref. Silvinit is expected to pay out 10% of RAS profit to preferred shareholders – a yield of 15% and 19% for 2008 and 2009, respectively.
AFK Sistema. This stock trades at a very substantial discount to its sum-of-parts because the market is overestimating its short-term debt problems and is linking that with obvious problems at Sistema-HALS. The stock has very big upside once the debt issue is clarified/resolved.
TMK. TMK has a very good business model and demand for pipes is expected to remain high as demand from Gazprom, Transneft and the export market is still high. Net debt is high but very manageable considering anticipated cash flows.
Silvinit will pay a big dividend
OGK 4, RusHydro and Federal Grid Co are best placed in the power utilities sector

9
STRATEGY DARKEST BEFORE DAWN
“PHOENIX RISING” STOCKS These are the shares that we believe are well positioned to lead a rally in the markets during 2H09, along with the defensive portfolio (high-conviction) stocks listed above. See the individual sector summaries for details of our analysts’ view of these stocks.
Stock Ticker Price,* Mkt Cap*, Free Target Upside***, 2009E$ $ mln float, % price, $ % P/E
Dixy Group DIXY 1.72 103 18 UR n/a n/aEvraz EVR LI 3.9 1,433 14 - - 0.3 LSR Group LSRG LI 1.45 679 13 - - 1.1 LUKOIL LKOH 27.3 23,220 50 NR n/a n/aMechel MTL US 3.66 1,524 24 - - 0.4 NLMK NLMK LI 5.2 3,116 18 - - 0.7 Norilsk Nickel GMKN 68 12,963 45 - - 2.3 PIK Group PIK LI 0.49 242 17 33 0.2 Sberbank SBER 0.82 18,128 44 5 510 2.6 TNK-BP TNBP 0.515 8,316 3 NR n/a n/aVimpelCom VIP US 6.99 7,169 26 32 358 3.1 VTB VTBR LI 1.98 6,876 23 NR n/a n/aX5 FIVE LI 4.01 868 25 UR n/a n/a* priced as of close November 28; ** based on DCF analysis; Source: Bloomberg, URALSIB estimates
"Phoenix Rising" Portfolio
*** upside to DCF target price
10
STRATEGY DARKEST BEFORE DAWN
2008 IN REVIEW POSITIVE 1ST HALF – COLLAPSE IN 2ND
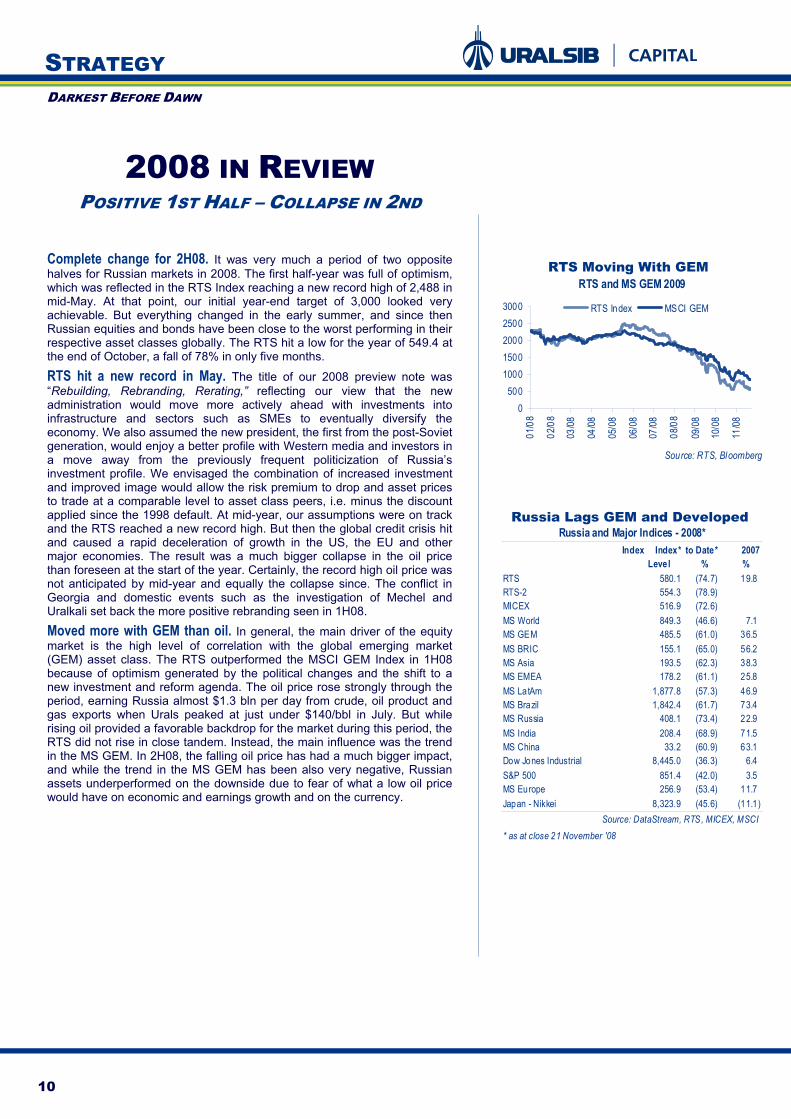
Complete change for 2H08. It was very much a period of two opposite halves for Russian markets in 2008. The first half-year was full of optimism, which was reflected in the RTS Index reaching a new record high of 2,488 in mid-May. At that point, our initial year-end target of 3,000 looked very achievable. But everything changed in the early summer, and since then Russian equities and bonds have been close to the worst performing in their respective asset classes globally. The RTS hit a low for the year of 549.4 at the end of October, a fall of 78% in only five months.
RTS hit a new record in May. The title of our 2008 preview note was “Rebuilding, Rebranding, Rerating,” reflecting our view that the new administration would move more actively ahead with investments into infrastructure and sectors such as SMEs to eventually diversify the economy. We also assumed the new president, the first from the post-Soviet generation, would enjoy a better profile with Western media and investors in a move away from the previously frequent politicization of Russia’s investment profile. We envisaged the combination of increased investment and improved image would allow the risk premium to drop and asset prices to trade at a comparable level to asset class peers, i.e. minus the discount applied since the 1998 default. At mid-year, our assumptions were on track and the RTS reached a new record high. But then the global credit crisis hit and caused a rapid deceleration of growth in the US, the EU and other major economies. The result was a much bigger collapse in the oil price than foreseen at the start of the year. Certainly, the record high oil price was not anticipated by mid-year and equally the collapse since. The conflict in Georgia and domestic events such as the investigation of Mechel and Uralkali set back the more positive rebranding seen in 1H08.
Moved more with GEM than oil. In general, the main driver of the equity market is the high level of correlation with the global emerging market (GEM) asset class. The RTS outperformed the MSCI GEM Index in 1H08 because of optimism generated by the political changes and the shift to a new investment and reform agenda. The oil price rose strongly through the period, earning Russia almost $1.3 bln per day from crude, oil product and gas exports when Urals peaked at just under $140/bbl in July. But while rising oil provided a favorable backdrop for the market during this period, the RTS did not rise in close tandem. Instead, the main influence was the trend in the MS GEM. In 2H08, the falling oil price has had a much bigger impact, and while the trend in the MS GEM has been also very negative, Russian assets underperformed on the downside due to fear of what a low oil price would have on economic and earnings growth and on the currency.
RTS and MS GEM 2009
Source: RTS, Bloomberg
0500
10001500200025003000
01/0
8
02/0
8
03/08
04/08
05/0
8
06/0
8
07/08
08/0
8
09/0
8
10/0
8
11/08
RTS Index MSCI GEM
RTS Moving With GEM
Index Index* to Date* 2007Level % %
RTS 580.1 (74.7) 19.8RTS-2 554.3 (78.9)MICEX 516.9 (72.6)MS World 849.3 (46.6) 7.1MS GEM 485.5 (61.0) 36.5MS BRIC 155.1 (65.0) 56.2MS Asia 193.5 (62.3) 38.3MS EMEA 178.2 (61.1) 25.8MS LatAm 1,877.8 (57.3) 46.9MS Brazil 1,842.4 (61.7) 73.4MS Russia 408.1 (73.4) 22.9MS India 208.4 (68.9) 71.5MS China 33.2 (60.9) 63.1Dow Jones Industrial 8,445.0 (36.3) 6.4S&P 500 851.4 (42.0) 3.5MS Europe 256.9 (53.4) 11.7Japan - Nikkei 8,323.9 (45.6) (11.1)
Russia and Major Indices - 2008*
Source: DataStream, RTS, MICEX, MSCI* as at close 21 November '08
Russia Lags GEM and Developed

11
STRATEGY DARKEST BEFORE DAWN
RUSSIA RELATIVE TO WORLD/GEM Big under-performance in 2H08. The table on the previous page shows the performance of Russian equities and the major emerging market and world indices in 2007 and year-to-date. In 1H08 the RTS performance was almost neutral, outperforming the MS GEM Index by almost 20%. Year-to-date the index is down almost 75%, while the MS GEM Index is off 61% and the world average down 47%. Hence, global equities are having a bad year on credit losses and growth concerns, emerging markets are worse because of the perception of higher risk in developing economies (and less developed financial structures), the contagion effects from a global slowing and, especially, the hit on commodity prices. Russia under-performed even more due its high dependency on commodities and a higher risk perception, which resulted from events associated with Georgia and Mechel.
THEMES Power utilities was bad all year. All industry sectors have been hit badly this year. But consistently the worst performing theme throughout the year has been the power utilities sector. It underperformed by 24% in the first half against an almost flat market. Since 1 July, the industry sector index is down another 82% to bring the year-to-date decline to 86.5%. The breakup of UES, the very complicated industry restructuring that resulted and the uncertainty over future tariffs, led most investors to avoid the theme in the first half. Traders did get involved with the sum-of-the-parts play, and many did so with borrowed cash. Hence, when the shares from the dissolution of UES started to arrive from July, when those traders were forced to dump them into a falling market. Since then, concerns over the future tariff regime, capex costs and a deterioration of corporate governance (as deals are cancelled) have also weighed on the sector.
Metals rolled over. The metals and mining sector was the best performing of the first half as the price of commodities, including steel and coal, reached new records. But it has been the second-worst performer since July, as commodity prices have been collapsing and demand falling away. Many companies have already announced capacity cuts and job losses. The banks have mirrored the problems in the global financial sector and, even though Russian banks are not exposed to the sort of mortgage and derivative losses of their western counterparts, the share prices have tracked lower with them. The telecom sector tracked lower in the first half as the mobiles moved down with the US equity markets and the fixed line operators were hit with uncertainties over Svyazinvest, etc.
Oil and gas has been relatively good. The consumer sector held up well in the first half year, as the industry was viewed as defensive and enjoyed steady growth in the expanding domestic economy. That changed in recent months as worries grow over operating margins and business growth. Many of the owners/major shareholders of the main operators are also highly leveraged and that has added to the risk in the sector. The oil and gas theme has been the best this year (up until the end of November pricing date). The announcement, in May, that the government was to cut oil taxes, boosted the sector by almost 20% through May and helped the first half performance. In the second half, even though the price of oil has collapsed, state buying of shares in Gazprom and Rosneft has helped prevent a collapse similar to that of the metals and mining sector.
Real estate the worst. The worst performing sector has been real-estate. Falling prices of residential and commercial properties, project closures as demand dries up and high leverage in some companies has led to a major stock market value collapse for almost all companies.
Index 1H '08 2H '08*r to Date*Level* % % %
Oil & Gas 376.5 3.6 (71.5) (70.5)Metals & Mining 213.5 9.8 (86.4) (85.1)Consumer 280.2 (10.0) (74.3) (76.9)Power Utilities 134.1 (24.4) (82.1) (86.5)Telecom 321.8 (21.4) (72.3) (78.2)Banks** 152.3 (16.0) (77.1) (80.8)
Industry Sector Performance
Source: Uralsib Research, RTS
Power Utilities consistently bad
Real Estate Props The Table
Price* Year to Date* $ p/s %
Chelyabinsk Steel 340 (5.8)Chelyabinsk Pipe 3.5 (16.9)Lebedyansky 73 (20.7)TGK-2 0.00074 (26.0)TGK-10 2.9 (29.1)TGK-4 0.0008 (35.5)Aeroflot 2 .12 (42.5)Baltika 27 (46.0)Irkutskenergo 0.55 (53.8)Surgutneftegas 0.54 (56.5)RTS 580.12 (74.7)LSR Group 1.01 (92.5)Yuzhuraln ickel 100 (92.9)OGK-6 0.0085 (93.3)OGK-1 0.008 (93.5)Evraz 4.5 (94.2)Pharmacy 36.6 4 (94.5)Integra 0.91 (94.6)OGK-2 0.006 (96.1)PIK Group 0.5 (98.4)Sistema-Hals 0.112 (98.9)
Leaders & Laggards in 2008*
Source: RTS, Bloomberg
* Prices as at close 21 November '08

12
STRATEGY DARKEST BEFORE DAWN
STOCK PERFORMANCE Surgutneftegas the best performer among oils. The table in the side column shows the ten best and worst share price performances so far this year. The top of the list is a collection of companies that have traded little, in volume terms. The only major stock is Surgutneftegaz as investors hope that its large cash/investment portfolio places it in a relatively better position to that of its peers. The bottom of the list reflects the problems in the real-estate sector, in the steel companies and also the fears over Integra’s debt position.
Sistema-HALS was worst. The second table in the side column shows the performance of the most liquid blue chip stocks. Sistema-HALS loss of almost 99% of its market value since January reflects investor expectations that the company cannot survive. Evraz’s loss of 94% reflects the fear that the company might have problems refinancing its debt. However, the recently announced loan of $1.8 bln from VEB has addressed that.
STRONG FIRST HALF Global market influence. The main drivers of the relatively favorable – compared to global markets – first half performance were:
The political transition that took place very seamlessly with Vladimir Putin’s favored candidate easily winning a majority of the public vote in the March election. To investors that represented the ideal combination of the young reformer (Dmitry Medvedev) in the Kremlin and political stabilizer (Putin) in the Prime Minister’s role in the White House.
Apart from the political stability that ensued from the “managed” transition, the program for government adopted by the new President and his team was viewed as very investment friendly and growth orientated. He promised to substantially increase spending in infrastructure and to develop new industries, especially technology. He also promised to more actively push reforms in the judiciary and the bureaucracy and to tackle corruption.
The surging price of oil, gas and most other commodities was directly favorable for the Russian economy and the outlook for earnings growth. As the graph on the side shows, the rising price did not directly pull the RTS higher but it did provide the favorable backdrop that allowed the market to outperform other markets.
That contributed to the strong growth in the economy during the first half with GDP growing 8.5% in the 1Q08 and 7.5% in the 2Q08. Earnings growth across most industries was comfortably in double digits and well above the global average.
Strong fund flows. That combination of political stability, rising oil and a growing economy led to high levels of fund flows into Russia in the first half, as global investors increased exposure via Russia dedicated funds. In the first six months of the year, over $3 bln was invested into those funds that report their flows on a weekly basis. That compares, for example, with over $7 bln withdrawn from China funds for the period. Other capital flows into Russia were also net positive. Having suffered a net outflow of $24 bln in the first quarter, flows in the second quarter were positive by $34 bln.
Russia China** Brazil India GEM BRIC $ mln $ mln $ mln $ mln $ mln $ mln
2007 1,348 (2,028) 4,041 (629) 12,551 2,7381H '08 3,030 (7,230) 597 (620) (536) (577)2H '08* (1,349) 1,406 (1,097) (2,222) (3,272) (3,182)
Fund Flows 2008*
Source: EPFR Global* year to 21 November '08
Price* Year to Date* $/Sh %
Surgutneftegaz 0.54 (56.5)Rostelecom 5.1 (56.6)Polyus 15 (67.3)LUKoil 28.3 (67.5)Rosneft 2.98 (68.9)Novatek GDR 22 (71.4)Gazpromneft 1.775 (72.0)Tatneft 1.6 (73.6)Norilsk Nickel 67 (74.7)RTS 580.12 (74.7)Gazprom 3.32 (76.4)MTS 22.96 (77.4)TNK-BP 0.5 (77.6)RusHydro 0.0183 (78.0)Novolipetsk 0.87 (78.5)Magnit 10.5 (79.2)VTB 2.1 (79.4)Sberbank 0.84 (80.1)Vimpelcom 7.67 (81.6)Comstar 2 (84.1)Eurasia Drilling 4.1 (84.8)TMK 1.5 (86.3)Mechel 4.06 (87.5)X5 Retail Group 4.39 (88.0)Magnitogorsk Steel 0.15 (88.5)AFI Development 1 (89.0)WBD 13.68 (89.6)Uralkali 0.8 (89.7)Severstal 2.2 (90.3)Sistema 4 (90.4)LSR Group 1.01 (92.5)Evraz 4.5 (94.2)Integra 0.91 (94.6)PIK Group 0.5 (98.4)Sistema Hals 0.112 (98.9)
Blue Chip Leaders & Laggards in 2008*
Source: RTS, Bloomberg
* Prices as at close 21 Novemner '08
Main Traded Shares
RTS and Urals 2H'09
Source: RTS, Bloomberg
200
700
1200
1700
2200
2700
07/0
8
07/08
07/0
8
08/0
8
08/0
8
09/0
8
09/08
10/0
8
10/08
11/0
8
11/08
RTS Index OIL Ura ls
Equities Follow Oil Lower
Russia Was Best in 1H09

13
STRATEGY DARKEST BEFORE DAWN
COMPLETE CHANGE IN SECOND HALF More domestic in the second half. All that changed in 2H08 for the following reasons:
The situation in the global financial markets deteriorated quickly with institutions such as Freddie Mac, Fannie Mae, Bear Stearns and AIG having to be bailed out, while Lehman Brothers failed. Similar problems and rescues across Europe undermined investor confidence in all markets, hitting those with a higher risk profile, i.e. developing economies, the hardest. In recent months, the Russian government has put over $230 bln in place to ensure that no high-street banks fail and that the country’s most important enterprises can refinance their debts.
Fears over recession in the US and in most major economies hit valuations everywhere and undermined the high commodity prices as demand destruction started.
The domestic economy was in danger of overheating in the early summer with PPI at over 30% and consumer inflation at 15%. The very big fall in industrial production (to + less than 1.0%) at the end of June was a big surprise and reflected just how expensive the cost base in Russia had become.
The price of Brent crude peaked at just under $140/bbl on 11 July and since then it has fallen by 161% to $53.6/bbl. That has led to widespread fears over currency stability, much slower growth and has under-mined the key assumptions that had supported the more favorable first half view. The government has committed itself to a stable ruble policy, but as the price of oil falls and the dollar strengthens, the cost of that policy has jumped to over $20 bln per week.
The BP / AAR dispute over TNK grabbed headlines across the world for many months, with a lot investors viewing it as a sign of either a lack of power by the pro-business, reformer President, or a lack of interest.
The Prime Minister’s July attack against Mechel, in particular, and against the spiraling cost of materials was interpreted by investors as meaning that the state would impose price, aka profit, controls in the major sectors of the economy. Of course, that was not an issue for long as the price of metals collapsed globally. That event resulted in a drop of about 5% for the market and a spike in the withdrawal of money from Russia funds.
The conflict with Georgia in early August had a similar effect in terms of the market and fund outflows, as investors feared that the conflict would damage Russia’s international relationships and, therefore, trade and investment flows.
The reinvestigation of Uralkali over a mine accident in 2006, with a possible fine of $50 bln in the offing, has been interpreted as a second YUKOS, i.e. an attempted at nationalization or forced ownership change in a profitable enterprise. How this plays out will have a major impact on how investors view Russia risk and the credibility of President Medvedev’s reformist government.
GREATER VOLATILITY Spike from August. The table below shows the volatility trend for the RTS and especially the spike from August to September. The big increase in volatility is one reason why investors have been shy of Russia investment over recent months.
Risk Perception Spikes VolatilityRTS Volatility vs RTS Index
Source:RTS
0
50
100
150
200
1/1/2
007
4/1/
2007
7/1/2
007
10/1
/200
7
1/1/
2008
4/1/
2008
7/1/20
08
10/1
/200
8
050010001500200025003000RTS Volatility (GARCH)
Long Run VolatilityLower boundaryUpper boundaryRTS Index

14
STRATEGY DARKEST BEFORE DAWN
TOUGH 1H09 FOLLOWED
BY AN IMPROVEMENT MACRO OVERVIEW
Few countries likely to escape the credit crisis. The level of uncertainty that currently surrounds the global economic outlook leaves a lot of room for gloomy forecasts. Indeed, many of these forecasts may well prove correct, particularly since we have yet to witness the impact of the credit crisis on the real global economy. Anecdotal evidence suggests that this impact will be strong and few countries – if any – will be spared.
LOW CRUDE OIL PRICES WILL HURT, BUT NOT
THAT BADLY Crisis may only have a mild impact on Russia ... With its heavy dependence on global commodity markets as a source of the bulk of government and private sector revenues, there is little doubt that Russia is also going to share the pain. The big issue is how strong and protracted this crisis will be for Russia. We believe that Russia will endure a relatively mild crisis and its economy may escape recession and suffer only limited negative consequences for its social and political stability.
… thanks to strong growth momentum … There are three main reasons which lead us to support this view. Firstly, in previous years Russia has managed to gain significant growth momentum – in 2006 GDP grew by 7.4%YoY and by 8.1% in 2007 and 2008 growth is likely to come in at 7.2%. Even under the most pessimistic macroeconomic scenario it would require a significant amount of time to force an economy moving at such speed to a complete standstill. Given the inertia of macroeconomic trends we believe that even under the most unfavorable scenario for Russia, it would take at least 2-3 quarters for this growth to completely vanish (also, this scenario does not factor in any existing or future government measures to support growth).
… and government support … Secondly, the vulnerability of Russia’s growth pattern, which has been almost totally depended on external factors, might be offset by conservative RF Government fiscal policies. For a number of years the government has opted for quite stringent budgetary planning policy and has managed to accumulate a significant reserve fund. A large amount of Russia’s economic growth of the past few years has been funded via two sources: high returns from commodity exports and cheap global credit. However, both of these sources are no longer available. That said, growth has also been driven to a large extent by purely domestic factors such as, construction and consumption, services which could be – and are being – supported by targeted injections of state funds. While we are not holding our breath in expectation of extremely effective government investment or crisis management policies, we do think that the already-announced aid package which is equal in size to 15-20% of Russia’s GDP is capable of halting the development of the current crisis in Russia. Furthermore, it may even be sufficient to prevent the Russian economy slipping into the doldrums during the severest part of the ongoing global crisis.
Growth Could Accelerate in 2010GDP growth rate, YoY %
Source: Rosstat, URALSIB estimates
0.0
2.0
4.0
6.0
8.0
10.0
1Q04
4Q04
3Q05
2Q06
1Q07
4Q07
3Q08
2Q09
1Q10
4Q10
2006 2007 1H08 2008F 2009FGDP (% YoY) 7.4 8.1 8.0 7.2 4.3Industrial output (% YoY) 6.3 6.3 5.9 4.8 3.4Fixed investment (% YoY) 13.5 21.1 17.9 11.3 -1.8CPI (% YoY) 9.0 11.9 15.1 13.9 10.5Real incomes (% YoY) 10.2 10.7 8.5 7.6 0.5Retail sales (% YoY) 13.9 16.1 15.6 14.2 7.4Exports ($ bln) 303.6 354.4 237.3 459.6 374.7Imports ($ bln) 164.3 223.5 135.4 289.5 212.1Current account ($ bln) 94.3 76.2 63.6 93.6 78.1RUB/USD (eop) 26.3 24.6 23.4 27.5 26.8USD/EUR (eop) 1.32 1.47 1.53 1.20 1.40Urals crude oil average ($/bbl) 61.6 69.7 105.4 97.0 70.0
URALSIB macroeconomic forecast, Nov-08
Sources: Rosstat, Bloomberg, URALSIB estimates
Economic Slowdown Unavoidable

15
STRATEGY DARKEST BEFORE DAWN
…and an economy that remained largely closed to the world. The third reason is the relatively closed nature of the Russian economy which in many ways has not moved that far away from its Soviet heritage. As a result Russia may prove far better positioned to avoid the impact of the most negative external developments than many other emerging market economies. This is not without a certain irony since, Russia’s very low level of integration into the global economy were previously seen as one of the biggest stumbling blocks for its development. However, this very weakness could prove to be one of its biggest strengths in a time of crisis. It is also worth noting that Russia managed to pull through the 1998 crisis in which it was in a far weaker position than today. At that time, the country was lumbered with massive foreign debt and an almost nil level of investor trust following the default. To make matters worse, back in 1998 it had almost depleted reserves, an incapable president, an inexperienced and extremely inefficient bureaucracy and far higher dependence on consumer and food imports. What it did have though was a (albeit very inefficient) working economy and within twelve months of the crisis, the Russian economy was growing at a strong pace and providing its population with essentials.
Russia will be more resilient to crisis than a decade ago. Over the past decade, Russia has managed to modernize key sections of its economy namely, food, retail, and consumer and machinery manufacturing production assets as well as improving in many other areas, particularly within the state sector. All this means that today, Russia is simply far better prepared to withstand the negative fallout from a possible global recession – or a further slide in commodity prices – than it was a decade ago.
MACRO OVERVIEW: GDP GROWTH TO SLOW ON
LOWER DEMAND AMID HIGH INFLATION GDP growth expected to fall from 7.2% to 4.3%YoY. While Russia is, in our view, far better positioned to withstand the global crisis than many other emerging markets, it does not follow that it will emerge entirely unscathed. As a country with a strong dependence on commodity export revenues, Russia will be adversely affected by a downturn in global growth. In fact, it already has been. We anticipate that Russia’s export revenues and correspondingly, budget revenues will fall. This in turn will halt and could even reverse, domestic consumer and investment demand growth. As a consequence, national economic growth rates are likely to contract significantly. Based on a $70/bbl Urals crude oil forecast for 2009, GDP growth rate could fall from an estimated 7.2%YoY this year to only 4.3%. We expect growth dynamics to decelerate right up until mid-2009 with the low point in 2Q09 with 3.9%YoY GDP growth. In the second half of 2009 we expect a gradual improvement on the back of slightly higher crude oil prices (a forecast average of $78/bbl vs. $61/bbl in 1H09).
Softer domestic demand means a larger state role. Weaker global demand and commodity prices would mean some significant changes to the economic growth pattern in Russia. The two key growth drivers of the past 2-3 years – investment and consumer demand – are likely to lose much of their appeal. In 2009 we expect the volume of fixed investment to fall by 1.8%YoY and real income growth to slow dramatically to 0.5%YoY (vs. an estimated 7.6%YoY this year). The outcome is likely to be that the economy will become far more reliant on government spending to support growth and industrial output. Additionally, we forecast that industrial output will remain positive in 2009 at 3.4%YoY.
Lower Domestic Demand ...YoY %
Source: Rosstat, URALSIB estimates
-5.0
0.0
5.0
10.0
15.0
20.0
25.0
2002
2003
2004
2005
2006
2007
2008
F
2009
F
2010
F
Real incomesRetail salesFixed investment
State: 99Foreign 39Ruble 60
Banks: Foreign 193Corporations 741
Foreign 187Domestic 481R.Bonds 73
Individuals 230Total Debt 1263Total Foreign Debt 488
Total Russia Debt ExposureTotal Russian Debt -Official Record*
Source: Central Bank, Uralsib estimates
... Will Support Trade SurplusTrade and current account balances: fact and forecast ($ bln)
Source: Rosstat, CBR, URALSIB estimates
020406080
100120140160180
2000
2001
2002
2003
2004
2005
2006
2007
2008
F
2009
F
2010
F
0
20
40
60
80
100
120Trade balanceCurrent accountUrals crude oil, $/bbl (RHS)
16
STRATEGY DARKEST BEFORE DAWN
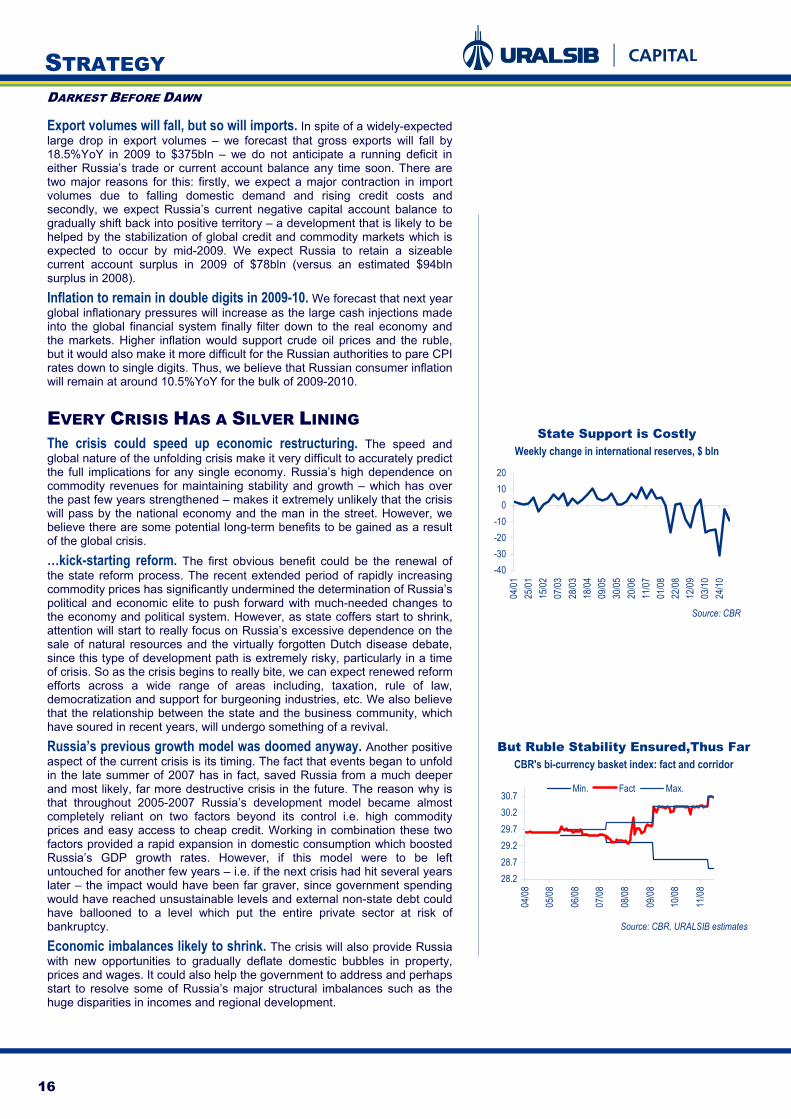
Export volumes will fall, but so will imports. In spite of a widely-expected large drop in export volumes – we forecast that gross exports will fall by 18.5%YoY in 2009 to $375bln – we do not anticipate a running deficit in either Russia’s trade or current account balance any time soon. There are two major reasons for this: firstly, we expect a major contraction in import volumes due to falling domestic demand and rising credit costs and secondly, we expect Russia’s current negative capital account balance to gradually shift back into positive territory – a development that is likely to be helped by the stabilization of global credit and commodity markets which is expected to occur by mid-2009. We expect Russia to retain a sizeable current account surplus in 2009 of $78bln (versus an estimated $94bln surplus in 2008).
Inflation to remain in double digits in 2009-10. We forecast that next year global inflationary pressures will increase as the large cash injections made into the global financial system finally filter down to the real economy and the markets. Higher inflation would support crude oil prices and the ruble, but it would also make it more difficult for the Russian authorities to pare CPI rates down to single digits. Thus, we believe that Russian consumer inflation will remain at around 10.5%YoY for the bulk of 2009-2010.
EVERY CRISIS HAS A SILVER LINING The crisis could speed up economic restructuring. The speed and global nature of the unfolding crisis make it very difficult to accurately predict the full implications for any single economy. Russia’s high dependence on commodity revenues for maintaining stability and growth – which has over the past few years strengthened – makes it extremely unlikely that the crisis will pass by the national economy and the man in the street. However, we believe there are some potential long-term benefits to be gained as a result of the global crisis.
…kick-starting reform. The first obvious benefit could be the renewal of the state reform process. The recent extended period of rapidly increasing commodity prices has significantly undermined the determination of Russia’s political and economic elite to push forward with much-needed changes to the economy and political system. However, as state coffers start to shrink, attention will start to really focus on Russia’s excessive dependence on the sale of natural resources and the virtually forgotten Dutch disease debate, since this type of development path is extremely risky, particularly in a time of crisis. So as the crisis begins to really bite, we can expect renewed reform efforts across a wide range of areas including, taxation, rule of law, democratization and support for burgeoning industries, etc. We also believe that the relationship between the state and the business community, which have soured in recent years, will undergo something of a revival.
Russia’s previous growth model was doomed anyway. Another positive aspect of the current crisis is its timing. The fact that events began to unfold in the late summer of 2007 has in fact, saved Russia from a much deeper and most likely, far more destructive crisis in the future. The reason why is that throughout 2005-2007 Russia’s development model became almost completely reliant on two factors beyond its control i.e. high commodity prices and easy access to cheap credit. Working in combination these two factors provided a rapid expansion in domestic consumption which boosted Russia’s GDP growth rates. However, if this model were to be left untouched for another few years – i.e. if the next crisis had hit several years later – the impact would have been far graver, since government spending would have reached unsustainable levels and external non-state debt could have ballooned to a level which put the entire private sector at risk of bankruptcy.
Economic imbalances likely to shrink. The crisis will also provide Russia with new opportunities to gradually deflate domestic bubbles in property, prices and wages. It could also help the government to address and perhaps start to resolve some of Russia’s major structural imbalances such as the huge disparities in incomes and regional development.
State Support is CostlyWeekly change in international reserves, $ bln
Source: CBR
-40-30-20-10
01020
04/01
25/01
15/02
07/03
28/03
18/04
09/05
30/05
20/06
11/07
01/08
22/08
12/09
03/10
24/10
But Ruble Stability Ensured,Thus FarCBR's bi-currency basket index: fact and corridor
Source: CBR, URALSIB estimates
28.228.729.229.730.230.7
04/08
05/08
06/08
07/08
08/08
09/08
10/08
11/08
Min. Fact Max.

17
STRATEGY DARKEST BEFORE DAWN
BANKS TO GAIN ONCE THE
WORST IS BEHIND US TRADING AT 50% OF EQUITY; SET TO REBOUND
Situation not as bad as the market has priced in. All of Russia’s listed banks are currently valued by the market below their 2008E shareholders’ equity and are trading below 1.0 on 2008E P/BV. Under normal conditions this would signal that the market expects a marked deterioration in the Russian banking sector – a worst-case scenario consisting of a substantial rise in non-performing loans, a steep slowdown in loan growth, increased market risk and further uncertainty over sources of funding. In our view the Russian banks do not warrant such low valuations as the major players in particular are benefiting from state support which is mitigating risk. For this reason we believe the shares of the most liquid banking names are well set for a strong rebound in 2H09. At present we see risks more on the upside than on the downside.
Low risk profile, liquidity and state support are in focus. The banks best placed to rebound in 2H09 are those with low risk, good share liquidity and access to state support. We believe that as domestic liquidity improves all the Russian banking stocks are set to rebound, with the state-owned behemoths Sberbank and VTB poised to bounce first thanks to their superior share liquidity and higher degree of state support.
LOW DOWNSIDE RISK FOR BANKS, BUT
PRESSURE MAY CONTINUE Sberbank best placed for the rebound. Sberbank, Russia’s largest bank, is the best option for investors looking to take positions ahead of a possible recovery in the equity markets in 2H09 as it is a major recipient of government funds ($20 bln in subordinated loans) and does not bear as much risk as VTB or other private banks. Sberbank shares are trading at a 2008E P/BV of 0.6 vs. 0.4-0.5 for other Russian banks. This 20-40% premium is justified in our view by Sberbank’s lower risk exposure. Meanwhile, taking into account the high equity risk premium of at least 15% that investors are now applying to the Russian market, Sberbank is the only liquid name in the Russian banking universe likely to post profitability above this level in the medium term. State banks best placed to weather the storm in 2009
Comparative Valuations 2008E 2009E* P/E P/BV P/E P/BV Sberbank 3.4 0.6 2.6 0.5 VTB 12.5 0.4 7.5 0.4 Vozrozhdenie 2.6 0.5 1.9 0.4 Bank St. Petersburg 2.1 0.4 1.7 0.4
Source: Bloomberg, URALSIB estimates * Based on the assumptions presented below; may differ from official forecasts
Our 2009 Top Picks Sberbank
VTB
A firm grip on each segmentMarket Shares of Sberbank and VTB, 1H08, %
Source: Sberbank, VTB
30.4
50.2
31.619
114.7 7.5 10.9
0102030405060
Corp
orate
loans
Retai
lde
posit
s
Retai
loans
Corp
orate
depo
sits
Sberbank VTB

18
STRATEGY DARKEST BEFORE DAWN
NPLS TO INCREASE RAPIDLY … Economic downturn raises risk for banks. The crisis of confidence among banks, falling commodity prices and shortage of liquidity have placed significant strain on the Russian economy, which is reflected in our updated macro assumptions for 2009 (see Economics section). We believe the main risk for Russian banks during these tumultuous times comes from the worsening creditworthiness of domestic companies and individuals, especially as interest rates are on the rise. The downsizing of collateral on the back of the equity sell-off and negative revaluation of other assets is an additional issue for Russian banks that is causing them to build additional loan provisions. We believe the market is pricing in a worst-case scenario and that Sberbank and Bank St. Petersburg have the lowest credit risk exposure at present. Sberbank has a more conservative lending policy than the other banks and is therefore less vulnerable to credit risk.
Sberbank has a low risk profile Breakdown of Risks Facing Russia's Listed Banks as of 1H08 (IFRS)
Risks NPLs/gross Securities/ Retail deposits/ Wholesale funding/ Retail loans/ loans, % assets, % liabilities, % liabilities, % loans, % Sberbank 1.5 8.5 60.0 7.70 14.0 VTB 1.7 10.0 13.5 49.0 16.0 Vozrozhdenie 2.3 6.1 46.0 13.7 19.0 Bank St. Petersburg 1.4 16.6 28.0 18.9 10.5
Source: Company data, URALSIB estimates
… BUT WILL BE OFFSET BY MARGIN GROWTH We expect NIM to rise by at least 100 bps. Interest rates are set to increase on the back of huge demand for credit from Russian corporates and stricter lending policies. We believe the Russian banks will be able to pass on the increased costs to borrowers, who have no choice but to refinance debt via local banks and the state. As of end-1H08 Sberbank had the highest NIM of 6.9% among Russian banks, and this figure is set to increase on the back of the rising interest rate environment.
Supportive factors for Sberbank Comparison of Supportive Ratios as of 1H08 (IFRS)
NIM ROAE,% CAR,% Cost/income ratio,% State support Sberbank 6.9 20.2 13.4 50.9 High VTB 4.8 8.0 15.8 57.1 High Vozrozhdenie 6.4 25.0 14.4 57.5 Moderate Bank St. Petersburg 6.0 21.0 12.8 35.7 Moderate
Source: Company data, URALSIB estimates
… AND STATE SUPPORT Focus on the state-owned liquid names. Our top picks in the sector are Sberbank and VTB – both of which are state-owned and have the highest levels of share liquidity. Both banks are benefiting from state support, which in addition to widening interest margins will likely offset rising credit risk. Sberbank is in line to receive $20 bln in subordinated loans from the CBR and VTB will receive $7.3 bln from VEB, which should boost their capital ratios to above 20%. These loans will amount to more than 10% of Sberbank’s liabilities and 8% of VTB’s. We recommend that investors focus on Sberbank and VTB as best placed for a rebound in 2H09. We prefer Sberbank over VTB due to its lower risk profile.
Sberbank boosted by the stateSubordinated Loans as % of Liabilities
Source: URALSIB estimates
10.2%
8.0%
0%2%4%6%8%
10%12%
Sberbank VTB
19
STRATEGY DARKEST BEFORE DAWN
OIL & GAS SECTOR COST CONTROL, IMPROVED RETAIL, STRONG
CASH AND LOW DEBT
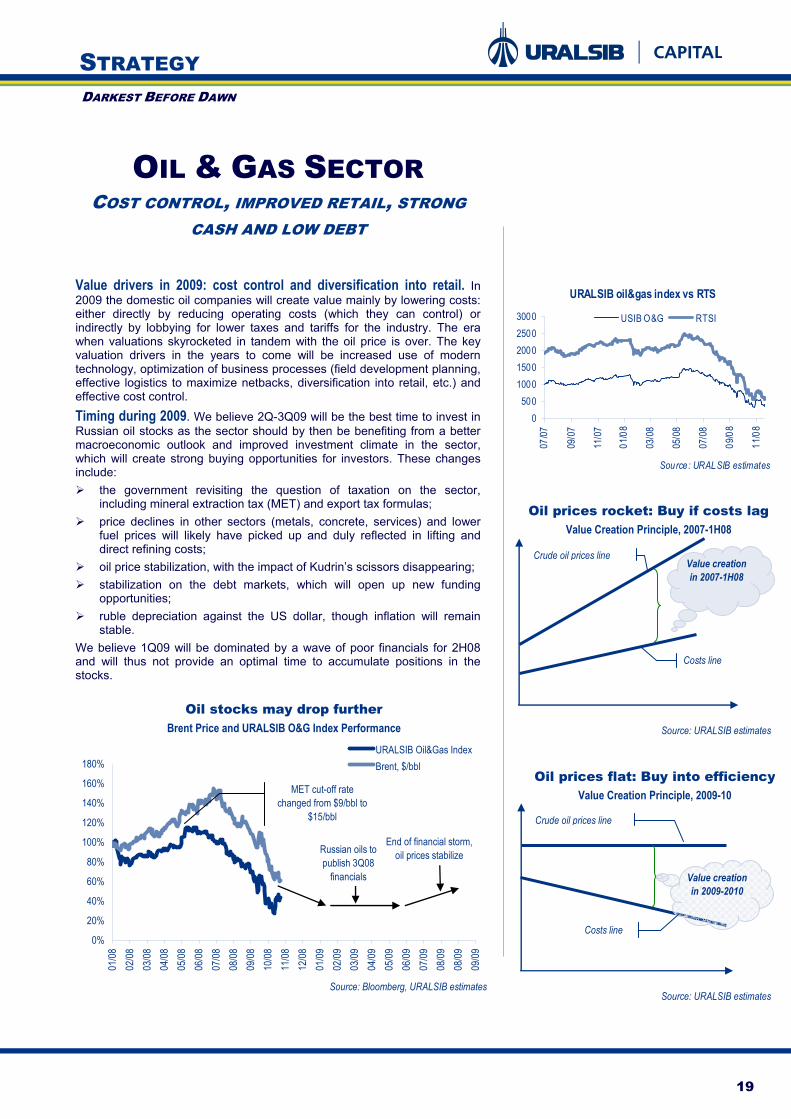
Value drivers in 2009: cost control and diversification into retail. In 2009 the domestic oil companies will create value mainly by lowering costs: either directly by reducing operating costs (which they can control) or indirectly by lobbying for lower taxes and tariffs for the industry. The era when valuations skyrocketed in tandem with the oil price is over. The key valuation drivers in the years to come will be increased use of modern technology, optimization of business processes (field development planning, effective logistics to maximize netbacks, diversification into retail, etc.) and effective cost control.
Timing during 2009. We believe 2Q-3Q09 will be the best time to invest in Russian oil stocks as the sector should by then be benefiting from a better macroeconomic outlook and improved investment climate in the sector, which will create strong buying opportunities for investors. These changes include:
the government revisiting the question of taxation on the sector, including mineral extraction tax (MET) and export tax formulas;
price declines in other sectors (metals, concrete, services) and lower fuel prices will likely have picked up and duly reflected in lifting and direct refining costs;
oil price stabilization, with the impact of Kudrin’s scissors disappearing; stabilization on the debt markets, which will open up new funding
opportunities; ruble depreciation against the US dollar, though inflation will remain
stable. We believe 1Q09 will be dominated by a wave of poor financials for 2H08 and will thus not provide an optimal time to accumulate positions in the stocks.
Oil stocks may drop furtherBrent Price and URALSIB O&G Index Performance
Source: Bloomberg, URALSIB estimates
0%
20%
40%
60%
80%
100%
120%
140%
160%
180%
01/08
02/08
03/08
04/08
05/08
06/08
07/08
08/08
09/08
10/08
11/08
12/08
01/09
02/09
03/09
04/09
05/09
06/09
07/09
08/09
08/09
09/09
URALSIB Oil&Gas IndexBrent, $/bbl
Russian oils to publish 3Q08
financials
End of financial storm, oil prices stabilize
MET cut-off rate changed from $9/bbl to
$15/bbl
Oil prices flat: Buy into efficiencyValue Creation Principle, 2009-10
Source: URALSIB estimates
Value creation in 2009-2010
Crude oil prices line
Costs line
Oil prices rocket: Buy if costs lagValue Creation Principle, 2007-1H08
Source: URALSIB estimates
Value creation in 2007-1H08
Crude oil prices line
Costs line
URALSIB oil&gas index vs RTS
Source: URALSIB estimates
0500
10001500200025003000
07/07
09/0
7
11/0
7
01/0
8
03/0
8
05/0
8
07/0
8
09/0
8
11/0
8
USIB O&G RTSI

20
STRATEGY DARKEST BEFORE DAWN
Oil price is set flat at $70/bbl. We set our long-term Brent price flat at $70/bbl; we also assume Brent will remain flat in 2009-10. We do not share the argument that prices will return to $100-150/bbl levels in the long term as cheap reserves are depleted and extraction costs are growing. We believe these trends will be countered by the increased use of more modern extraction methods and improved geological surveys, interpretation and modeling. We also do not believe that anticipated production cuts across the globe will eventually drive prices to high levels within the next 3-5 years as we expect demand to adjust accordingly. Nevertheless, we will continue to monitor the USD/EUR rate, as a weakening dollar could trigger a rebound in the oil price. Our Urals forecast is based on Urals/Brent discount analysis and assumes a flat discount of 2%.
2009E YoY 2009E to spot price
Value drivers YtD Average Spot Scenario estimate % %RUB/USD 24.4 27.4 26.14 7 (5)PPI, % 22.3 n/a 15.5 (30) n/aBrent, $/bbl 104 47 70 (33) 50Urals NW, $/bb l 101 44 68 (32) 57Gasoline, $/ton 903 409 617 (32) 51Jet fue l, $/ton 1,045 587 668 (36) 14Diesel, $/ton 1,013 576 601 (41) 4Fuel o il, $/ton 470 184 291 (38) 58
Forecast of core oil macroeconomic data No return to 2008 levels, but we may see a rebound
2008E
Source: URALSIB estimates
THE INVESTMENT CASE FOR 2009 Value gains through cost control and efficient retail. We believe the valuation paradigm will change in the years to come. In recent years the oil price has been the core value driver, but going forward we expect further valuation gains on the cost side from lower taxes, milder tariffs and improved control of operating costs. We also believe the companies diversified into retail oil product sales will benefit in the current environment of oil price volatility as domestic retail prices remain less volatile, the retail market itself is poorly penetrated by integrated companies and demand is inelastic.
AMBITIOUS PRE-CRISIS STRATEGY… Clarity over oil sector taxation. We believe the government will
review the tax burden on the oil sector next year. The oil companies have been fighting not just for tax cuts but for fundamental changes to the way in which MET and export duties are calculated. Sector taxes currently comprise up to 50% of total costs, hence profitability is highly dependant upon the companies’ lobbying ability and the government’s willingness to cut the tax burden.
Ruble weakening. A mild weakening of the ruble vs. the US dollar will increase sector profitability in dollar terms.
Deflation in other sectors set to seep through to oils. The oil companies have yet to benefit from a recent drop in domestic prices for metals, cement, etc as the goods, materials and services they are using in their operating activities were stocked before the crisis. We believe the effect of declining prices in the other sectors will feed into lower operating costs in the oil sector within six months.
Valuations P/E EV/EBITDA P/E EV/EBITDAGazprom 2.1 2.3 1.7 2.3Rosneft 2.8 2.5 2.7 4.2LUKoil 1.6 1.7 1.8 3.5TNK-BP 1.0 1.5 1.4 3.9Surgutneftegas 4.3 1.9 4.5 5.1Gazprom Neft 1.4 1.2 1.7 3.1Tatneft 1.5 1.6 2.0 1.5Average 2.1 1.7 2.3 3.6Median 1.5 1.7 1.9 3.7
2008E
Source: Company data, Bloomberg, URALSIB estimates
* Based on the assumptions presented below, may differ from official forecasts
Sector revaluation aheadComparative Valuations
2009E*
21
STRATEGY DARKEST BEFORE DAWN
Tariffs. We expect the oil companies will try to lobby for slower growth in tariffs or even a decrease for certain transportation routes. As we understand the oil companies have particularly targeted railroad tariffs and Transneft tariffs. In 2008 exports continued to decline due to falling demand and a relative drop in prices. Exports via railroad and pipeline decreased substantially in 4Q08. In the first half of November crude oil exports via pipeline declined as much as by 25% relative to October, according to Transneft.
Direct costs. Direct costs (controllable costs) should be the oil companies’ main priority. In light of the crisis many companies have already announced substantial cost cuts. We believe 2009-10 will see the companies applying the very latest technology to benefit first place.
GROWTH VIA RETAIL Retail segment is fragmented. The domestic retail market will provide additional shareholder value on the revenue side. The retail market is highly underpenetrated, so although we may see a slowdown in the consumption of petrol products next year, the oil companies have substantial scope to grow by raising their share of the domestic retail market. The integrated oil companies account for only 50% of the retail business. Over each of the last five years the integrated companies have posted double-digit growth in domestic retail sales of petroleum products, and we believe they could double the size of this business again over the next five years. In terms of filling stations, the oil companies control about 40% of the retail market. Other stations are operated by independents, which rarely control more then 10 outlets. Their efficiency varies substantially, depending upon several unpredictable factors. We believe the market share of the most inefficient independent retailers will be captured by the integrated oil companies.
TOP PICKS We like Gazprom, whatever the weather. In our view Gazprom will outperform the domestic oil peer group in 1Q09 as it is likely to be the only company capable of demonstrating strong results for 3Q-4Q08.
The company stands to benefit from a financial standpoint as the calculation for European export gas prices is based on oil, diesel and fuel oil prices and follows them with a lag of 6-9 months.
The planned deregulation of the domestic gas market will lead to rising prices on the domestic market.
The presence of the Russian government as Gazprom’s main shareholder implicitly guarantees the company’s obligations and allows it to borrow at low rates, which is extremely important during these testing times.
While we expect Gazprom’s partners to request that the gas pricing formula be reset on the back of the oil price decline, we believe the company’s fundamentals are strong, and current multiplies indicate substantial upside.
Gazprom Neft is our top oil pick. Gazprom Neft has a geographically well-diversified network of filling
stations, a developed lubricant, airplane and bunkering business and is in a healthy financial position (2008E net debt/EBITDA of 0.2).

22
STRATEGY DARKEST BEFORE DAWN
The company can break its declining production trend by using modern technology and acquiring other producers. A delay to the development of the Priobskoye field in 2003 was the main reason for the production shortfall over recent years. Priobskoye is Gazprom Neft’s core output growth driver and is expected to reach peak production in 2010-11. Since Gazprom Neft does not have large fields that can sustain long-term production growth, we believe it will look for M&A ideas to reverse the declining production trend. We believe the easiest way would be through a merger between Gazprom Neft, Slavneft and TNK-BP. Slavneft and TNK-BP have a significant number of large greenfields that are in the early stages of production or have yet to be undeveloped. Slavneft is 49% controlled by Gazprom Neft (another 49% is owned by TNK-BP International). In addition such a merger could be of interest to TNK-BP’s main shareholders – AAR (Alfa, Access Industries and Renova) and BP – as political risks would be covered by state-controlled Gazprom Neft. We would recommend TNK-BP and Slavneft shares - to gain exposure to the possible merger, but would warn about their low liquidity.
We also like LUKOIL. We like LUKOIL for its developed domestic downstream operations, promising gas business, international upstream and downstream diversification, and healthy financials.
LUKOIL has the most diversified downstream business among the Russian oils that includes a worldwide network of 6,000 filling stations and 60 mln tons of refining capacity.
The company is bidding to develop full chain “upstream-downstream” gas assets. LUKOIL’s core gas projects are the Nakhodkinskoye field in West Siberia and Kandym-Khauzak-Shady in Uzbekistan. The gas business will support the company’s financials on the back of the liberalization of the domestic gas market and an anticipated rise in Central Asian gas prices to the European export level. In addition, LUKOIL has huge oil projects in the CIS (e.g. Karachaganak, Kumkol and Tengiz in Kazakhstan).
This year LUKOIL has created a southern value chain, with production assets in southern Russia, Kazakhstan, and in the future on the Caspian Sea shelf and downstream assets in Central and Southern Europe.
LUKOIL’s balance sheet is healthy: The company’s debt/equity ratio is just 11%, while we estimate its 2008E net debt/EBITDA at 0.4.
MAIN RISKS IN 2009 Debt level. Oil and gas projects have a long pay-off period (7-10 years
on average) and are highly capital-intensive, which means they require substantial external funding. Rosneft’s $20 bln acquisition of YUKOS assets were financed through the debt markets. Many independent E&Ps and OFS companies have financed development with substantial borrowings. The problems of refinancing debt and meeting both interest and principal payments have become a priority for many companies.
o State companies have high debt loads. Gazprom is Russia’s most leveraged company, with total debt of $62 bln, $22 bln of which is short-term debt. Around $20 bln of this is owed to Gazprombank, which is supposed to be deconsolidated from the group in 2009. Rosneft has total debt of $20.8 bln, 41% of which is short-term debt, and it is desperately trying to find external funding. The Chinese government may provide a $15 bln loan to Rosneft (subject to negotiations with the Russian government) that would help solve Rosneft’s debt problems over the medium term. In any case, we would expect the Russian government to extend financial support to any of these companies if needed.

23
STRATEGY DARKEST BEFORE DAWN
o Small E&P and OFS companies: high risk, high reward. Russia’s independent E&P and OFS companies depend heavily on external funding and typically have high debt burdens and thin cash flows. In our view, of this group only Integra and Urals Energy represent attractive buying opportunities. Integra is down 95% YtD while Urals Energy has lost 98% due to increased debt risk aversion. Should the companies roll over their short-term debt, we would expect the stocks to skyrocket.
Total Short-term Cash Debt / Capex FCF FCFCompany Data as of debt debt EBITDA 09E 2009E 2008E 2009ERosneft 3Q08 20,789 8,415 1,191 2.3 (9,298) (6,016) 5,381LUKOIL 1H08 8,745 2,311 1,664 0.9 (14,864) (3,752) 6,147Gazprom Neft 1H08 2,299 753 1,263 0.6 (5,165) (2,912) 465TNK-BP Holding 1H08 2,099 188 848 0.6 (5,301) (2,284) 653Tatneft 2Q08 761 166 907 1.1 (1,786) 744 1,110SurgutNG 3Q08 RAS 3 3 635 0.0 (6,844) 912 2,900Gazprom 1Q08 61,946 22,075 15,331 1.1 35,990 3,752 8,342NOVATEK 3Q08 982 156 577 0.5 923 166 895Sibir Energy 1H08 440 158 161 1.4 92 (72) (37)Urals Energy 1H08 624 624 23 7.8 196 (44) (26)Imperial Energy 1H08 155 0 219 1.5 248 (339) (168)West Siberian Resources 1H08 935 440 483 1.9 460 (385) (294)Integra 1H08 535 397 99 1.7 169 (23) 114CAToil 1H08 9 9 14 0.1 32 45 116EDC 1H08 296 150 317 0.6 260 122 227Transneft 2Q08 7,718 3,243 1,452 1.3 3,650 (1,570) 137
Source: Company data, Bloomberg, URALSIB estimates
Debt, Cash and Cash Flow Summary, $ mlnState owned and small E&P companies the most leveraged
Surgutneftegas’ cash position. Surgutneftegas has a huge investment portfolio, the structure of which has never been disclosed. In the wake of the collapse of the debt and equity markets it is almost certain that the company will have to book substantial non-cash revaluation losses. For this reason, when analyzing the company’s cash position we only consider cash at hand, not investments. We therefore estimate Surgutneftegas’ cash position not at $20.1 bln (cash, long-term and short-term investments, plus other assets), as widely reported, but at just $597 mln as of 3Q08.
Corporate governance … few dividend plays. We expect the oil companies to minimize dividend payments by deconsolidating profits from the parent companies to the subsidiaries. By doing so, the oil companies will be able to increase the cash at the subsidiaries and subsequently use it to fund capex. In the meantime they will minimize net income at the parent companies, which by law should be the source for dividends.
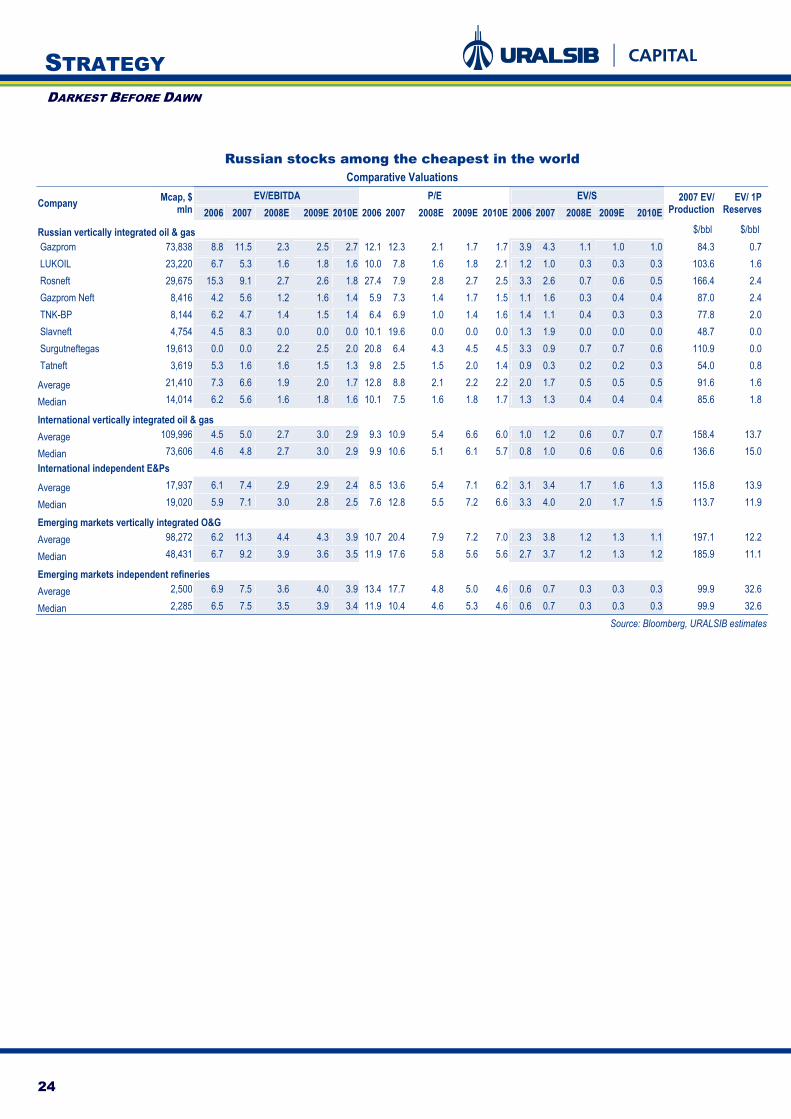
24
STRATEGY DARKEST BEFORE DAWN
Russian stocks among the cheapest in the world Comparative Valuations
EV/EBITDA P/E EV/S Company Mcap, $ mln 2006 2007 2008E 2009E 2010E 2006 2007 2008E 2009E 2010E 2006 2007 2008E 2009E 2010E
2007 EV/ Production
EV/ 1P Reserves
Russian vertically integrated oil & gas $/bbl $/bbl Gazprom 73,838 8.8 11.5 2.3 2.5 2.7 12.1 12.3 2.1 1.7 1.7 3.9 4.3 1.1 1.0 1.0 84.3 0.7 LUKOIL 23,220 6.7 5.3 1.6 1.8 1.6 10.0 7.8 1.6 1.8 2.1 1.2 1.0 0.3 0.3 0.3 103.6 1.6 Rosneft 29,675 15.3 9.1 2.7 2.6 1.8 27.4 7.9 2.8 2.7 2.5 3.3 2.6 0.7 0.6 0.5 166.4 2.4 Gazprom Neft 8,416 4.2 5.6 1.2 1.6 1.4 5.9 7.3 1.4 1.7 1.5 1.1 1.6 0.3 0.4 0.4 87.0 2.4 TNK-BP 8,144 6.2 4.7 1.4 1.5 1.4 6.4 6.9 1.0 1.4 1.6 1.4 1.1 0.4 0.3 0.3 77.8 2.0 Slavneft 4,754 4.5 8.3 0.0 0.0 0.0 10.1 19.6 0.0 0.0 0.0 1.3 1.9 0.0 0.0 0.0 48.7 0.0 Surgutneftegas 19,613 0.0 0.0 2.2 2.5 2.0 20.8 6.4 4.3 4.5 4.5 3.3 0.9 0.7 0.7 0.6 110.9 0.0 Tatneft 3,619 5.3 1.6 1.6 1.5 1.3 9.8 2.5 1.5 2.0 1.4 0.9 0.3 0.2 0.2 0.3 54.0 0.8
Average 21,410 7.3 6.6 1.9 2.0 1.7 12.8 8.8 2.1 2.2 2.2 2.0 1.7 0.5 0.5 0.5 91.6 1.6
Median 14,014 6.2 5.6 1.6 1.8 1.6 10.1 7.5 1.6 1.8 1.7 1.3 1.3 0.4 0.4 0.4 85.6 1.8
International vertically integrated oil & gas
Average 109,996 4.5 5.0 2.7 3.0 2.9 9.3 10.9 5.4 6.6 6.0 1.0 1.2 0.6 0.7 0.7 158.4 13.7
Median 73,606 4.6 4.8 2.7 3.0 2.9 9.9 10.6 5.1 6.1 5.7 0.8 1.0 0.6 0.6 0.6 136.6 15.0 International independent E&Ps
Average 17,937 6.1 7.4 2.9 2.9 2.4 8.5 13.6 5.4 7.1 6.2 3.1 3.4 1.7 1.6 1.3 115.8 13.9
Median 19,020 5.9 7.1 3.0 2.8 2.5 7.6 12.8 5.5 7.2 6.6 3.3 4.0 2.0 1.7 1.5 113.7 11.9
Emerging markets vertically integrated O&G
Average 98,272 6.2 11.3 4.4 4.3 3.9 10.7 20.4 7.9 7.2 7.0 2.3 3.8 1.2 1.3 1.1 197.1 12.2
Median 48,431 6.7 9.2 3.9 3.6 3.5 11.9 17.6 5.8 5.6 5.6 2.7 3.7 1.2 1.3 1.2 185.9 11.1
Emerging markets independent refineries
Average 2,500 6.9 7.5 3.6 4.0 3.9 13.4 17.7 4.8 5.0 4.6 0.6 0.7 0.3 0.3 0.3 99.9 32.6
Median 2,285 6.5 7.5 3.5 3.9 3.4 11.9 10.4 4.6 5.3 4.6 0.6 0.7 0.3 0.3 0.3 99.9 32.6 Source: Bloomberg, URALSIB estimates

25
STRATEGY DARKEST BEFORE DAWN
GENERATION TO REBOUND ELECTRICITY DEMAND WEAKENING ON SLOWING
ECONOMY, BUT RECOVERY AHEAD IN 2H09
First signs of economic slowdown. Domestic electricity consumption slowed by 6% YoY in the first two weeks of November, mainly due to a sharp production fall in the metals sector. Lower demand in November caused the wholesale electricity price in the European and Urals price zone to drop by 26%, from $29.5/MWh to $21.4/MWh. We assume electricity demand will remain at current levels through 2009. Under this assumption, the domestic generation stocks appear to be fairly valued. We expect the global economy to remain under pressure in 1H09 and, as such, we see downside risk for the shares in the first half of the year.
Stocks to buy for a bounce in 2H09. The good news is that the liberalization of the wholesale electricity market will continue as planned: from 1 July 2009 the share of the liberalized market will increase from 35% to 50%. This development will be particularly positive for the more efficient generation companies. In addition to market liberalization we expect global demand to recover on the back of central bank liquidity injections, and electricity consumption will likely increase toward the middle of 2009. This should result in higher wholesale electricity prices, which will drive up earnings estimates and the shares in 2H09. We would be looking to build positions in RusHydro and OGK-4 to take advantage of a recovery in 2H09.
LIBERALIZATION: THE POTENTIAL WINNERS Focus on highly efficient generators. The table on the right details our target prices for the generation companies and potential upside. The target prices are calculated using macroeconomic and sector-specific drivers (presented on the following page) that are heavily influenced by wholesale electricity prices. Under our base-case scenario, OGK-4 and RusHydro offer value and can be considered defensive going into 1H09, while OGK-1, OGK-2 and OGK-6 look attractive but have high corporate governance risk and further downside risk in 1H09. OGK-4 and RusHydro are the best bets if the market recovers in 2H09 as they stand to benefit the most from the liberalization of the wholesale electricity market in the form of higher operating cash flows. A comparison of P/E and EV/EBITDA multiples does not provide a clear picture of the Russian generation companies until 2011, when the wholesale electricity market will be fully liberalized. At this stage we believe a DCF-based valuation is the most reliable valuation metric despite the current wild fluctuations in cost of capital and uncertain outlook for long-term prices and currency movements, etc.
Avoid names with high corporate governance risk. OGK-1, OGK-2 and OGK-6 appear to be attractively valued but we are concerned by above-average dilution risk for minority shareholders in light of the current depressed market price resulting from the need to generate funds to meet capex obligations. We would also steer clear of OGK-3 due to its above-average corporate governance risk as the controlling shareholders are looking to strip the company of cash.
Our 2009 Top Picks
RusHydro OGK-4
Current price Target price Upside, %RusHydro 0.017 0.120 602OGK-1 0.006 0.047 719OGK-2 0.007 0.017 138OGK-3 0.009 0.026 178OGK-4 0.009 0.064 603OGK-5 0.040 0.071 79OGK-6 0.007 0.022 210
Most efficient will gain the most
Source: URALSIB estimates
* Based on the assumptions presented below, may differ from official forecasts
Generation Companies' Target Price Forecasts, $
Slowdown in electricity consumptionElectricity Consumption, GWh
Source: System Operator
2,5002,6002,7002,8002,9003,0003,100
22-O
ct
26-O
ct
30-O
ct
3-No
v
7-No
v
11-N
ov
15-N
ov
19-N
ov
2008 2007
URALSIB utilties index vs RTS
Source: URALSIB estimates
0500
10001500200025003000
07/07
09/0
7
11/0
7
01/0
8
03/08
05/08
07/08
09/0
8
11/0
8
USIB PWR RTSI
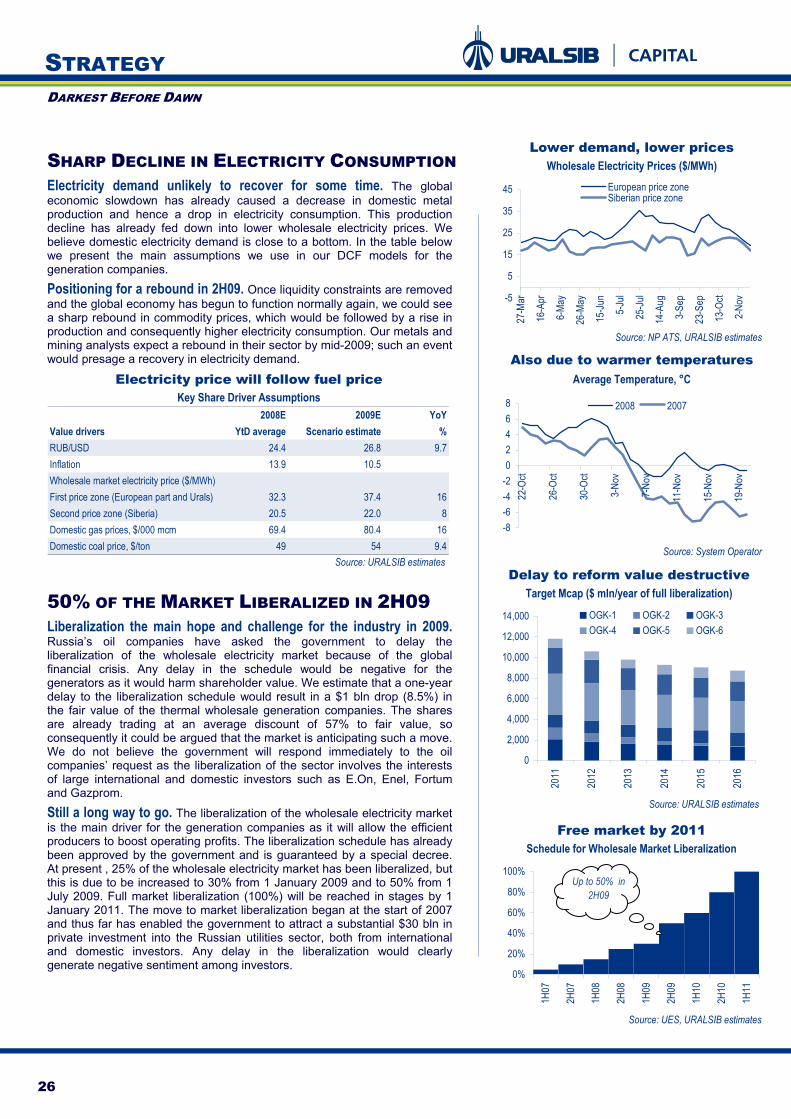
26
STRATEGY DARKEST BEFORE DAWN
SHARP DECLINE IN ELECTRICITY CONSUMPTION Electricity demand unlikely to recover for some time. The global economic slowdown has already caused a decrease in domestic metal production and hence a drop in electricity consumption. This production decline has already fed down into lower wholesale electricity prices. We believe domestic electricity demand is close to a bottom. In the table below we present the main assumptions we use in our DCF models for the generation companies.
Positioning for a rebound in 2H09. Once liquidity constraints are removed and the global economy has begun to function normally again, we could see a sharp rebound in commodity prices, which would be followed by a rise in production and consequently higher electricity consumption. Our metals and mining analysts expect a rebound in their sector by mid-2009; such an event would presage a recovery in electricity demand.
2008E 2009E YoYValue drivers YtD average Scenario estimate %RUB/USD 24.4 26.8 9.7Inflation 13.9 10.5Wholesale market electricity price ($/MWh)First price zone (European part and Urals) 32.3 37.4 16Second price zone (Siberia) 20.5 22.0 8Domestic gas prices, $/000 mcm 69.4 80.4 16Domestic coal price, $/ton 49 54 9.4
Electricity price will follow fuel priceKey Share Driver Assumptions
Source: URALSIB estimates
50% OF THE MARKET LIBERALIZED IN 2H09 Liberalization the main hope and challenge for the industry in 2009. Russia’s oil companies have asked the government to delay the liberalization of the wholesale electricity market because of the global financial crisis. Any delay in the schedule would be negative for the generators as it would harm shareholder value. We estimate that a one-year delay to the liberalization schedule would result in a $1 bln drop (8.5%) in the fair value of the thermal wholesale generation companies. The shares are already trading at an average discount of 57% to fair value, so consequently it could be argued that the market is anticipating such a move. We do not believe the government will respond immediately to the oil companies’ request as the liberalization of the sector involves the interests of large international and domestic investors such as E.On, Enel, Fortum and Gazprom.
Still a long way to go. The liberalization of the wholesale electricity market is the main driver for the generation companies as it will allow the efficient producers to boost operating profits. The liberalization schedule has already been approved by the government and is guaranteed by a special decree. At present , 25% of the wholesale electricity market has been liberalized, but this is due to be increased to 30% from 1 January 2009 and to 50% from 1 July 2009. Full market liberalization (100%) will be reached in stages by 1 January 2011. The move to market liberalization began at the start of 2007 and thus far has enabled the government to attract a substantial $30 bln in private investment into the Russian utilities sector, both from international and domestic investors. Any delay in the liberalization would clearly generate negative sentiment among investors.
Margin Note
Free market by 2011Schedule for Wholesale Market Liberalization
Source: UES, URALSIB estimates
0%
20%
40%
60%
80%
100%
1H07
2H07
1H08
2H08
1H09
2H09
1H10
2H10
1H11
Up to 50% in 2H09
Delay to reform value destructiveTarget Mcap ($ mln/year of full liberalization)
Source: URALSIB estimates
0
2,000
4,000
6,000
8,000
10,000
12,000
14,000
2011
2012
2013
2014
2015
2016
OGK-1 OGK-2 OGK-3OGK-4 OGK-5 OGK-6
Also due to warmer temperaturesAverage Temperature, °C
Source: System Operator
-8-6-4-202468
22-O
ct
26-O
ct
30-O
ct
3-No
v
7-No
v
11-N
ov
15-N
ov
19-N
ov
2008 2007
Lower demand, lower pricesWholesale Electricity Prices ($/MWh)
Source: NP ATS, URALSIB estimates
-5
5
15
25
35
45
27-M
ar
16-A
pr
6-Ma
y
26-M
ay
15-Ju
n
5-Ju
l
25-Ju
l
14-A
ug
3-Se
p
23-S
ep
13-O
ct
2-No
v
European price zoneSiberian price zone

27
STRATEGY DARKEST BEFORE DAWN
Impact of the state on the sector. At this point the main risk facing the generation companies is the implementation of their investment programs. All the generation companies and thermal wholesale generation companies have ambitious investment programs (totaling $19.3 bln). According to initial plans the generation companies must boost operating profit to raise the substantial debt needed to finance their capex commitments. With this in mind the government could support the generators by sticking to the liberalization schedule and extending long-term loans at reasonable rates. The generators have already applied to the state-owned banks for loans and could also issue special infrastructure bonds that would be guaranteed by the government.
SHORT-TERM DEBT REMAINS A CHALLENGE Only capex at risk. We consider the debt situation in the Russian utilities sector to be healthy in general as the companies did not accumulate substantial debt in the course of the industry restructuring that took place over the past few years. However, the recent sharp rise in the cost of borrowing will slow investment, as current operating cash flows are insufficient to finance capex alone. The thermal generation companies have signed agreements with the market regulator that obliges them to bring new generation capacity online by 2012. Generators that fail to meet their obligations could be fined up to 25% of the construction costs (a total of $17 bln, according to our estimates.
Little debt pressure on our top picks. OGK-4 and RusHydro – our top picks – are the safest bets as they carry low short-term debt and have strong cash positions (net cash of $1.06 bln and $229 mln, respectively).
Names with some risk. The sector has some relatively risky names that have a high short-term pressure. The table on the following page shows that TGK-2, MRSK Center and OGK-1 carry the highest short-term debt and can consequently be considered as risky due to the liquidity shortage.
CONCLUSION Fundamentals strong and short-term debt low. We believe OGK-4 and RusHydro are well positioned heading into 1H09 and the economic slowdown. Both have strong balance sheets and stand to benefit more than peers from the wholesale market liberalization as they have the most efficient assets in the sector. In anticipation of a recovery in 2H09, we would be looking to build positions in these two names.

28
STRATEGY DARKEST BEFORE DAWN
Total debt, Short-term Cash, Net Debt/ Capex FCF 08E, FCF 09E,Company Data as of $ mln debt, $ mln $ mln EBITDA 09E 09E, $ mln $ mln $ mlnMoscow Unified Electricity Co. RAS 3Q08 1,814 65 373 1.05 2,750 (1,242) (1,750)Lenenergo RAS 3Q08 405 9 164 0.33 1,520 (648) (982)MRSK North-West RAS 3Q08 104 82 12 0.51 181 (27) (50)MRSK Center & Volga RAS 3Q08 326 18 96 0.55 362 (88) (57)MRSK Center RAS 3Q08 303 105 3 0.64 390 (103) (45)MRSK South RAS 1H08 227 41 15 0.86 204 (183) (24)MRSK Siberia RAS 3Q08 195 33 1 1.36 526 (69) (422)MRSK Volga RAS 3Q08 207 54 35 2.05 217 (176) (156)MRSK Ural RAS 3Q08 196 31 54 1.23 253 (234) (168)
OGK-1 RAS 3Q08 334 188 23 0.73 1,387 (12) (1,124)OGK-2 RAS 3Q08 273 91 105 0.70 1,259 (1,024) (1,144)OGK-3 RAS 3Q08 36 36 2,114 neg 740 (408) (683)OGK-4 RAS 3Q08 17 0 1,080 neg 1,652 (1,654) (1,223)OGK-5 RAS 3Q08 193 8 17 0.60 408 (290) (169)OGK-6 RAS 3Q08 138 32 273 neg 769 (525) (611)
TGK-1 RAS 3Q08 101 18 60 0.15 1,242 (895) (1,033)TGK-2 RAS 3Q08 315 170 12 2.27 272 (199) (174)Mosenergo RAS 3Q08 599 52 573 0.03 417 (752) 152 TGK-4 RAS 3Q08 230 97 302 neg 637 (416) (467)TGK-5 RAS 3Q08 87 82 377 neg 119 (224) (41)TGK-6 RAS 3Q08 142 44 408 neg 118 (93) (6)TGK-7 RAS 3Q08 275 181 163 0.39 310 (172) (97)TGK-8 RAS 3Q08 11 3 400 neg 367 (555) (300)TGK-9 RAS 3Q08 480 480 677 neg 871 (326) (695)TGK-10 RAS 3Q08 296 0 1,509 neg 698 (467) (558)TGK-11 RAS 3Q08 77 68 20 0.82 117 (43) (66)Kuzbassenergo RAS 3Q08 58 34 133 neg 435 (270) (350)TGK-13 RAS 3Q08 40 0 22 0.17 204 (52) (123)TGK-14 RAS 3Q08 20 20 162 neg 13 11 16
RusHydro RAS 3Q08 659 13 888 neg 2700 (1,814) (1,384)FSK RAS 3Q08 1,114 279 4,025 neg 8654 (6,346) (6,486)
5.823.382.02Average for emerging market hydropower generators
Source: Company data, Bloomberg, URALSIB estimates
Free cash flow squeezed by huge capexDebt, Cash and Cash Flow Summary
Average for emerging market thermal generatorsAverage for developed market thermal operators

29
STRATEGY DARKEST BEFORE DAWN
METALS UNDER FIRE SETTING UP FOR 2H09 RALLY
Exercise initial caution in 1H09. Falling demand, lack of finance, increased trade receivables, and low product prices are the greatest challenges facing the Russian metals sector going into 2009. We have assumed that on average steel prices will fall by 40% YoY in 2009 and nickel prices by 46% YoY in 2009. Despite these assumptions, following the decimation of share prices, the Russian steel and coal sectors offer value, but Norilsk Nickel appears expensive. Despite the apparently attractive valuations, we expect the stocks to remain under pressure in 1H09 until we get a clear picture of the extent to which trading will normalize. TMK and NLMK stand out as particularly well positioned to weather the downturn due to their high value-added product offerings and efficient assets. Polyus Gold may be a good ‘insurance’ bet as investors turn to gold as a safe haven.
Stocks to buy for a bounce in 2H09. The good news is that as the flood of liquidity (dollars) pumped into the global financial system by the world’s central banks starts to circulate, it is likely that the price of all assets will be inflated. Demand for commodities will likely be supported by government investment in domestic infrastructure. As such, supply/demand balances should tighten considerably. Consequently, we believe a 2H09 rally in commodity prices can be expected. This should result in a resumption of trade and demand that could drive earnings estimates and share prices higher. Norilsk Nickel, Mechel, Evraz and Severstal would benefit most. These are stocks to watch for 2H09.
GOLD AND PIPES FOR FIRST HALF Focus on high value-added producers. In the table below, we present the 2008E and 2009E and PE and EV/EBITDA multiples calculated using the conservative assumptions presented on the next page. Under this scenario, NLMK, Raspadskaya and TMK offer most value and can be considered defensive going into 1H09. For a gold company, Polyus Gold on a 2009E EV/EBITDA multiple of 3.9 looks attractive. Norilsk Nickel stands out as expensive.
Valuations P/E EV/EBITDA P/E EV/EBITDAEvraz 0.3 1.2 1.1 3.0MMK 0.9 0.4 11.6 2.4NLMK 1.1 0.6 3.3 1.3Severstal 0.7 1.3 10.7 4.6Mechel 0.7 1.6 4.4 4.7TMK 0.7 3.0 0.8 2.8Raspadskaya 1.4 1.1 2.6 1.7Belon 1.3 1.5 1.8 2.0Polyus Gold 12.7 5.1 8.5 3.9Norilsk Nickel 4.0 2.6 193.0 10.9
Source: URALSIB estimates* Based on the assumptions presented below, may differ from official forecasts
TMK, NLMK and Polyus Gold the best bets for 2009Norilsk Nickel, Severstal and Mechel looking most over valued for 2009
2008E 2009E*
Weary of debt burdens. Companies with significant debt burdens such as Evraz, Mechel, Belon and TMK have 2009E EV/EBITDA multiples that are greater than the PE multiples. This highlights additional risk, however we believe the government will provide refinancing options to the sector. Corporate governance is a concern at Norilsk Nickel; although the truce between Potanin and Deripaska could be a sign of better things to come.
Our 2009 Top Picks TMK
NLMK Raspadskaya Polyus Gold
URALSIB metals&mining index vs RTS
Source: URALSIB estimates
0500
10001500200025003000
07/07
09/0
7
11/0
7
01/0
8
03/08
05/08
07/08
09/0
8
11/0
8
USIB M&M RTSI

30
STRATEGY DARKEST BEFORE DAWN
COMMODITY PRICES NEARING THE BOTTOM No major recovery assumed at this stage. We believe that commodity prices are approaching a bottom, as the spot prices are below the cash production costs of the high cost producers. Evidence of this is the wide spread capacity closures in all extractive industries worldwide. We expect commodities to remain under pressure through 1H09. In the table below, we present our value driver assumptions used in calculating the 2009E PE and EV/EBITDA multiples above. We assume that commodity prices will be down 20%-50% YoY on average in 2009. We also assumed that volumes would be down 20% YoY in 2009.
Setting up for a 2H09 rebound. If/when liquidity constraints are removed and the global economy begins to function again, we could see a sharp rebound in commodity prices as the world is awash with dollars printed by the US in an attempt to extract itself from the financial crisis. Fundamentally, it is likely that productive capacity and inventories will be further reduced in the coming months. Consequently, when demand recovers there could be a shortage of supply. This could happen by mid-2009.
2009E YoYValue drivers YtD Average Spot Scenario estimate %RUB/USD 24.4 27.5 26.14 7 Domestic iron ore concentrate, $/ton 91 74 74 (19) Domestic coking coal concentrate, $ /ton 181 151 140 (23) Domestic rebar, $/ton 937 475 536 (43) Domestic HRC, $/ton 918 750 553 (40) Average OCTG pipe price, $/ton 2,050 2,150 1,600 (22) Nickel, $/ton 22,298 10,108 12,000 (46) Copper, $ /ton 7,360 3,565 3,800 (48) Pallad ium, $/ton 373 182 220 (41) Platinum, $/ton 1,662 820 850 (49)
Commodities decimated in 2009Pipe and coal prices could hold up relatively well
2008E
Source: URALSIB estimates
CHALLENGES GIVE RISE TO OPPORTUNITY Demand destruction – the greatest challenge in 2009. Falling demand due to a lack of finance, increased trade receivables, and low product prices are the greatest challenges facing the global metals and mining sector in 2009. Russia is no exception. Consequently, we are likely to see companies reducing capex, extending accounts payable, shelving new projects and shutting down high cost capacity.
Out of the ashes opportunities arise. The upside of forced supply side discipline is that when the world financial markets begin to function again and demand for commodities begins to grow, we are likely to find ourselves facing supply shortages. This could well result in sharply rising commodity prices and may well be coupled with US dollar weakness as the US rolls the printing presses. As such, we would not be surprised to see a spectacular rally in 2H09. Norilsk Nickel, Evraz and Mechel would be the best plays in a rising commodity price environment.
Increased state participation. The credit crisis has forced companies to fall back on the Russian state for financial support. Rusal has pledged its 25% stake in Norilsk Nickel as collateral to get a $4.5 bln loan from VEB. This may well open the door for the first step towards a state controlled metals mining giant in Russia. Evraz and TMK are also likely to be bank rolled by VEB loans as they seek to refinance short term borrowing. We would not be surprised to see others following suit. The state will also play a crucial role in stimulating demand through infrastructure spending. This may well be a theme worldwide in 2009. This will of course benefit the whole sector.

31
STRATEGY DARKEST BEFORE DAWN
SHORT TERM DEBT BECOMING A HEADACHE Short-term debt obligations revisited. In the last few weeks we have seen short-term debt concerns becoming more of an issue in the Russian metals and mining sector. This is a function of reduced sales volumes and prices coupled with increasing working capital as customers are not paying suppliers. Mechel, Severstal, Evraz and TMK have the greatest net debt/EBITDA ratio’s. Although a ratio around three times seems manageable and there is still scope for capex reductions. In addition, we believe we have been conservative in our cash flow estimates, applying a 20%-50% price reductions and a 20% reduction in volume.
VEB to provide a back stop. As mentioned on the previous page, the sector has found the state to be supportive, with the VEB and VTB prepared to refinance short-term commitments of Rusal, Evraz and TMK so far. We believe that others such as Mechel may also seek and find state support. Consequently, we do not see debt refinancing issues as a major risk to the sector at this stage.
Some concerns as cash flow estimates fall Debt, Cash and Cash Flow Summary
Total debt Short-term Cash, Net debt/ Capex 09E, Company Data as of $ mln debt, $ mln $ mln EBITDA09E $ mln FCF '08 FCF '09 Severstal 3Q08 7,709 1,853 3,362 2.9 1,555 (1,485) 1,046 Evraz 3Q08 10,214 4,143 623 2.6 890 540 2,824 NLMK 1H08 1,685 1,608 1,504 0.0 1,715 1,130 1,141 MMK 1H08 1,295 1,103 1,523 neg. 1,871 (802) (217) Mechel est current 4,800 2,000 100 3.4 1,051 109 402 TMK est current 3,350 2,000 89 2.5 150 (191) 1,210 Norilsk Nickel 1H08 6,904 1,332 4,938 1.3 1,647 3,582 302 Polyus Gold 1H08 0 0 1,424 neg. 420 (260) (8) Raspadskaya 1H08 327 26 156 0.3 100 427 488 Belon 2007 461 188 33 1.1 95 266 247
Source: Company data, URALSIB estimates
IN CONCLUSION Exercise caution in 1H09. Enjoy the ride in 2H09. We believe that TMK and NLMK are well positioned to weather the global economic slowdown heading into 1H09. Raspadskaya is illiquid, but has defensive characteristics. Polyus Gold is good bet on gold as a safe haven. In 2H09, we would be looking to switch into Evraz, Mechel and Norilsk Nickel to take advantage of rising commodity prices. We expect a bumpy ride in 2009 with above average share price volatility.

32
STRATEGY DARKEST BEFORE DAWN
FERTILIZERS PLAYING ON POTASH
Fertilizer segment - recovery may outpace other segments. The fertilizer sector was among the first to be affected by financial crunch and we believe it will be one of the first to recover. Food demand coupled with a shortage of soil nutrients should boost demand for fertilizers in 2H09 or 1H10 at the very latest. We forecast that by the second half of next year fertilizer production is likely to have returned to pre-crisis levels, although prices may remain soft until 2010 and are unlikely to hit August-peak levels in the foreseeable future.
Potash producers are in a unique position. The potash segment continues to stand apart from other fertilizer products because of the price-setting ability of the major players. We expect potash producers to make efforts to keep prices at their 3Q08 level of $600-650 per ton throughout 4Q08 and 2009. On the output side, the recent drop in demand for fertilizers has resulted in a production cut of 1.2 mln by the majors (or 8% of 4Q08 global potash consumption) and producers may make further cuts in 1H09. We assume the potash market to recover in 2H09.
Silvinit preferred shares – best play. In the current environment, we favor Silvinit, which is the most defensive play in the sector, particular its preferred stock that offers a dividend yield of over 15%. Should the anticipated bounce in the fertilizer market materialize in 2H09 it would benefit Acron’s financials as a result of expected higher output. However, low prices are likely to keep the company’s bottom line negative until 2010. This in turn, makes it currently expensive at an 11.4 2009E EV/EBITDA. In addition, we advise investors to avoid Uralkali because of the heightened risk associated with the reinvestigation of a mine-flooding accident back in 2006.
TESTING FINANCIALS FOR A BOUNCE IN 2H09 Acron: biggest challenges for 2009 are low prices and demand. Global demand for fertilizers has fallen as agricultural producers struggle with liquidity. As a result, Acron has been forced to cut output by nearly 50% since November. It has also been hit by the introduction of protectionist export duties by China, as nearly a fifth of its production facilities are located there. According to the company, the new Chinese export duties of 135-185%, which came into effect in April 2008 have massively increased domestic competition and pushed down domestic fertilizer prices. Meanwhile, export prices for the bulk of its fertilizer products have fallen around 50% from their peak in August. We expect the same situation to extend into 1H09 and believe that the first signs of recovery will only emerge during 2H09. Our 2H09 recovery scenario envisions a roughly 10% increase in average prices coupled with pre-crisis production levels for the company.
Valuations P/E EV/EBITDA P/E EV/EBITDASilvinit 4.6 3.6 7 .4 3.6Ura lka li 1.9 1.4 2 .2 1.5Acron 1.1 1.9 neg 11.4
Source: URALSIB estimates
Uralkali, Silvinit - well placed for 2009Mulltiple analysis
2008E 2009E
Our 2009 Top Picks SILVP RU SILV RU
Prices down 50%+ since august peakAverage Fertilizer prices, $ per ton
Source: B loomberg, Company data, URALSIB estimates
0
150
300
450
600
750
1Q07
2Q07
3Q07
1Q08
2Q08
3Q08
4Q08
E
1H09
E
2H09
E
Ammonia Azophoska (NPK)Carbamide Ammonium nitrate
NPK - major product for AcronAcron, sales breakdown, % (as of 2007)
Source: Company data, URALSIB estimates
NPK50%
Ammonium Nitrate25%
Urea8%
Ammonia7%
Bulk Blends7%
Compound Fertilizers
(NP)3%

33
STRATEGY DARKEST BEFORE DAWN
Silvinit and Uralkali: Lower output but stable prices. In our analysis of the outlook for Silvinit and Uralkali, we assume lower potash output in 2008 and 1H09 followed by a potential increase in 2H09 and flat price dynamics at 3Q08’s level of $600-650 throughout 4Q08 and the whole of 2009. (Even in the unlikely event of decline in potash export prices – should the financial crisis deepen – we assume this would come at a slower rate than the 50%+ drop for other fertilizers since August.) The above fact as well as the better financial liquidity of potash producers should leave them in a better position than other fertilizer producers. Importantly, in the medium-term, while potash output may return to pre-crisis levels, underinvestment in new projects in 2008-09 as a result of the crisis and tighter financial liquidity for many producers, including Russia’s Acron and Eurochem, and Australia’s Rio Tinto will keep supply tight in the medium-term and prices most likely higher.
Potash segment is defensive: Acron is not a good play in near term. In the table below we provide our approximate six-month estimates for the main P&L lines for Silvinit, Uralkali and Acron as well as their 2008E and 2009E EV/EBITDA and P/E ratios (based on the assumptions outlined previously). Our analysis indicates that Silvinit and Uralkali look fairly defensive with a 2009E EV/EBITDA of 3.6 and 1.5 and a P/E of 7.4 and 2.2, respectively. In contrast, however, Acron could face further downside risk over this period. We forecast that Acron will become EBITDA negative in 1H09. Moreover, since the fertilizer sector is unlikely to recover before 2H09 it is only then we can expect improvements in Acron’s operations and financials. Even so, we take a cautious approach to the stock, as we forecast a 2009E net loss of $530 mln and a 2009E EV/EBITDA ratio of 11.4.
1H08 2H08E 1H09E 2H09ESilvinitRevenues 1,008 1,132 733 1,352Costs, excluding DDA 282 310 248 310EBITDA 727 822 485 1,042EBITDA margin, % 72 73 66 77Planned Capex 164 136 150 150EBITDA-Capex 563 686 335 892(EBITDA-Capex) /EBITDA, % 77 83 69 86Debt interest payment 13 300 300 300UralkaliRevenues 1,194 1,331 818 1,593Costs, excluding DDA 432 519 415 519EBITDA 762 812 403 1,074EBITDA margin, % 64 61 49 67Planned Capex 218 295 300 300EBITDA-Capex 544 517 103 774(EBITDA-Capex) /EBITDA, % 71 64 26 72Debt interest payment 26 - 40 40AcronRevenues 933 786 350 818Costs, excluding DDA 506 556 501 556EBITDA 428 230 (150) 262EBITDA margin, % 46 29 neg 32Planned Capex 64 86 150 150Debt interest payment 25 21 270 270
Sensitivity analysisFertilizer Producers, $ mln
Source: Company data, URALSIB estimates
Production plans revised downUralkali and Silvinit production plans, mln of tons (KCl)
Source: Company data, URALSIB estimates
Uralkali, 4.9
Uralkali, 5.4
Uralkali, 4.1
Uralkali, 5.5
Silvinit, 5.1
Silvinit, 5.6 Silvinit,
4.5
Silvinit, 6.0
0123456789
101112
2008
E
prev
ious
2008
plan
2009
E
prev
ious
2009
plan
Uralkali Silvinit

34
STRATEGY DARKEST BEFORE DAWN
2009E FY09/9M08Value drivers 9M Average 4Q08 2009 average Chg, %RUB/USD 24.4 27.4 26.1 7Potash domestic price , $/tone 159.9 159.9 163.1 2.0Potash export price, $/tone 468.2 587.9 587.8 25.6NPK average price, $/tone 542.4 368.3 392.0 (27.7)Ammonia average price, $/tone 573.9 457.1 487.9 (15.0)Ammonia nitrate average price, $ /tone 625.7 475.9 512.6 (18.1)Urea, $/tone 462.6 401.1 431.5 (6.7)
Negative price dynamics, except for potash9M08 average and spot prices provided for comparison
2008E
Source: Company data, URALSIB estimates
SHORT-TERM DEBT IS NOT A RISK Acron: lower revenue, short-term debt of $540 mln in 2009 implies lower capex and no dividends. Based on our estimate of negative EBITDA of $150 mln in 1H09 and a debt servicing requirement of about $270 mln in both 1H09 and 2H09, we believe that Acron may well have to postpone its 2009 $300 mln investment program and dividend payments. Moreover, we believe that in order to support financial liquidity, it could be forced to sell off some of its non-controlling assets (21% in Sibneftegas, or 8% of Silvinit) or a share in its new potash mining project (it acquired a license for the Talitsky deposit at an auction in March 2008). That said, we believe that Acron’s ability to manage its liquidity constraints with lower capex or asset disposals, alongside a cash balance of $140 mln at the end of 9M08, means that it faces no serious near-term risks to its operations. A potential rebound of the fertilizer market in 2H09 further supports our view that Acron might turn EBITDA positive in 2H09.
Silvinit and Uralkali: No major near-term risks. Uralkali’s $170 mln net debt position, 2009E operating cash flow of $1.5 bln and a debt servicing requirement of only $80 mln makes it relatively well protected against the liquidity crisis on financial markets. However, this does not include the risk of new fines and penalties being by the state. Silvinit also looks fairly well protected in spite of its short-term debt of $600 mln. We estimate that even in the unlikely event of a 30% slump in global potash prices, Silvinit would be able to manage its financial liquidity by lowering its capex.
SILVINIT – A GOOD DIVIDEND PLAY Silvinit pref shares – good dividend yields. Silvinit preferred shares offer a good dividend yield, as under Russian law the company is obliged to pay out 10% of its RAS net income to preferred shareholders. We forecast preferred dividends of $42/share in 2008 and $39/share in 2009. To date, the company has announced a 9M08 dividend of $16 per preferred share (the cut off date has already passed). This implies a 2008 residual dividend of $26 per preferred share, which equate to a 2008 dividend yield of 15%. The expected cut off date is the end of April 2009. In 2009, we forecast a preferred dividend yield of 19%.

35
STRATEGY DARKEST BEFORE DAWN
URALKALI: RE-INVESTIGATION OF MINE
ACCIDENT CREATES UNCERTAINTY State might force Uralkali to pay compensation for an accident at Mine-1 in 2006. The flooding of Mine-1 in October 2006 was at the time classified as a force majeure by Rostekhnadzor (The Federal Service for Environmental, Technological and Nuclear Supervision) and the Federal Chamber of Commerce and Industry. According to a Uralkali statement, at a meeting with Deputy Prime Minister, Igor Sechin, in October 2008, it was decided to reinvestigate the accident in order to determine the precise cause of the flooding. The investigation will be presided over by a special commission and the findings will be made known in December 2008.
The company could face a sizeable compensation payout. Under a best-case scenario, mandatory compensation would take the form of costs incurred by the State for the resettlement of residents of Berezniki and the relocation of the railway line, power and heat supply systems. We estimate that these costs could total up to $1 bln, which would not be an insurmountable burden for the company in view of estimated 2009 (EBITDA-Capex) of $878 mln and only $170 mln of net debt. However, under a worst-case scenario, the company might also be required to pay compensation to the state for loss of potash reserves. This could amount to as much as $12 bln based on the flooding of the 20 mln tons of reserves and a current potash price of $600 per ton (and the eventual figure could be even higher). If this scenario were to transpire, the company could find it itself unable to meet compensation payments.
Worst-case scenario is a major risk. Leaving aside all the legal and political nuances, in our view there exists a significant chance that the worst-case scenario will be realized. We cannot identify a minimum fair value for Uralkali under a worst-case scenario as it could result in a change of ownership and/or uncertainty regarding Uralkali’s strategy and prospects.
CONCLUSION Acron shares: expensive even under 2H09 bounce scenario. We have a pessimistic near-term view regarding Acron, which has already suffered from the financial crisis. Although a potential recovery of the fertilizer industry in 2H09 would add value, Acron shares still look expensive at a 2009E EV/EBITDA of 11.4.
Silvinit prefs are a good play on the solid fundamentals of the potash segment and dividend yields. In our view, potash producers are better positioned for the current economic slowdown. Silvinit shares look preferable to Uralkali given the recent re-investigation of a previous mine-flooding incident. In addition, Silvinit preferred shareholders are guaranteed to receive a dividend of 10% of its RAS net income. We forecast a 15% dividend yield in 2008 and 19% in 2009.
Uralkali has strong downside risk. We see a high valuation risk for Uralkali shares, despite an 87% decline in the name since the end of October. For those who are looking to invest in the company on the grounds of its low pricing we recommend to stay on the sidelines. While our best-case scenario offers a potential upside of over 200% on its current market valuation, our worst-case scenario has no minimum limit for Uralkali’s valuation and makes the company’s future prospects unclear.
Silvinit prefs: attractive dividend play Forecasted dividend yields of Russian companies
Source: RTS, Bloomberg, URALSIB estimates
0 10 20 30 40 50 60 70
TNK-BP common
TNK-BP preffered
SurgutNG common
SurgutNG preffered
MTS
VimpelCom
Si lvinit preferred
Raven Russia
Next dividend yie ld, % 2009E d ividend yie ld, %

36
STRATEGY DARKEST BEFORE DAWN
AUTOMOTIVE SECTOR TAKING ONE STEP BACK
Short-term liquidity risks will persist in 2009. Incorporating our new macroeconomic forecasts into our projections, we expect lower GDP growth and lower disposable income growth coupled with low consumer confidence to reduce car and truck demand in 2009. Short-term weakening of the ruble will also mean dollar sales will take an additional currency risk hit. Despite some relief on the cost side from an expected 40% decline in steel prices, we expect margins will not improve at a commensurate pace, as labor costs will not fall in line with lower output. Additionally, in 1H09, we expect output declines to be significant due to the prolonged New Year’s holiday period and reduced working weeks at the start of the year. For KAMAZ and GAZ Group, a seasonal demand slump from industrial customers will also hurt 1H09 results. We expect short-term liquidity risks to remain a concern for carmakers throughout 2009 on the back of lower overall volumes and lower operating cash. Under this scenario, we believe carmakers’ common share prices are facing further downside risk in 2009.
Delayed development capex will lead to lower competitiveness in the longer term. Although we expect some recovery in lending activity and up-turn in demand due to seasonality by 2H09, our forecast suggests car market volumes will not have returned to steady growth until 2010. Until then, we expect domestic carmakers to postpone long-term product modernization capex. As a result, on a demand rebound, we expect domestic carmakers will have to once again revisit the issue of development capex. In this situation domestic auto manufacturers will again be susceptible to foreign competition.
VALUATIONS REMAIN DEPRESSED Cash flow risks continue to depress valuations. In 2H08, working capital deficiencies has become carmakers’ key concern, as dealers of cars have battled slowing sales and have been unable to foot 100% prepayment for new inventory, while truck makers were already forced to cut output on slower industrial demand. Carmakers have begun to move to longer payment periods for dealers to stimulate demand and were accessing new short-term funding to finance working capital. As a result of these measures, carmakers are entering 2009 with more leverage, while at the same time cash flow risks have intensified. Sluggish demand will continue to drive top-lines down in 2009 and a weakening ruble will further depress sales in dollar terms. We expect dollar revenues to decline by up to 24% for GAZ Group in 2009, 22% for KAMAZ, and 19% for AvtoVAZ. Carmakers will see relief on the variable cost side, as we estimate steel will become 40% cheaper in 2009 compared to 2008 levels. Despite an estimated boost to EBITDA profitability from this cost decline, however, we expect this effect will be offset by slower decreases in labor costs, as carmakers will not be able to cut labor expenses to match the rates of output declines. An increase in the receivables collection period with overall higher non-payment risks as retail demand weakens will also squeeze operating cash. Further, required debt service payments in 2009 will add to cash flow pressure. As a result of pressures on cash flows, valuations will remain depressed in 2009, in our view.
Valuations P/E EV/EBITDA P/E EV/EBITDAAvtoVAZ n/a 3.7 n/a 4.0GAZ Group n/a 4.8 n/a 6.2KAMAZ 3.1 3.2 n/a 5.2Sollers* 2.1 2.9 n/a 5.4
Source: RTS, Company data, URALSIB estimates, Bloomberg* Based on mid-market quotes
Facing downside risk in 2009Valuations for Key Carmakers
2008E 2009E

37
STRATEGY DARKEST BEFORE DAWN
OPERATING CASH ISSUES PARAMOUNT IN 2009 Weaker ruble an advantage for domestic producers … We have already seen new car sales slowing in 2H08 for both domestic and foreign makes. In October, a report from the Association for European Business in Russia showed a 5.7% MoM decline in sales of foreign-made cars in Russia. Going forward, slower growth of disposal incomes will lead to the slower replacement of aging vehicles, in our view, resulting in a contraction in new car unit sales in 2009. As local producers are mainly dependent on CIS countries for export sales, we also expect them to post weaker dynamics in 2009. Industrial demand typically experiences a seasonal slump in the first half, and this will add to the short-term operating risks facing truck manufacturers KAMAZ and GAZ Group in 2009. In anticipation of a reduction in unit sales, we expect the carmakers, both foreign and domestic, will come under pressure to maintain competitive pricing. We expect the local manufacturers to benefit from ruble weakening (by 6% vs. the dollar in 2009, according to our macroeconomic forecasts), in contrast to foreign assembly plants in Russia and foreign imports. Notably, in October foreign compact cars saw the largest decline in sales as this segment is very sensitive to pricing and dependent on lending activity and is typically among the first to react to any drop in new consumer lending. Meanwhile, AvtoVAZ recorded a 44% MoM increase in unit sales in October for its B-class model, the Lada Kalina. Although the Lada Priora and Lada Kalina lead their respective segments in unit sales, AvtoVAZ continues to generate the bulk of revenues from its older models. Therefore, the short-term momentum in sales of the Kalina and Priora is unlikely to provide material growth in 2009 against the backdrop of contracting demand for new cars. Recent media reports indicate that AvtoVAZ is considering raising prices by 2-3% in 2009. Such a step would be in line with price increases announced by dealers of foreign imports on the back of the weaker rouble. However, going forward, as AvtoVAZ’s pricing policy depends on those of foreign competitors, the company may be forced to lower prices during the year if price are reduced for imported cars. Although the potential price increases would support revenues in the short term – especially in Russia’s regions, where AvtoVAZ’s has traditionally retained a stronger position than in central cities – we are concerned that such a move would eat into AvtoVAZ’s unit sales market share in 2009 as a whole.
… but operating cash flow will suffer in 2009. The local car manufacturers announced production cuts in 2H08 which we expect will take a toll on revenues going into 2009. AvtoVAZ will extend the New Year holiday period by nine days; KAMAZ has introduced a four-day working week; and GAZ Group will introduce a three-day working week in 2009. We therefore expect GAZ Group to post higher production cuts than its competitors in 2009 of 17% vs. 15% for KAMAZ and 12% for AvtoVAZ. On a positive note, we expect steel prices to decline by around 40% in 2009, following an increase of 37% in 2008. With materials accounting for up to 78% of the automakers’ cost of goods sold and steel making up 20-22% of material costs, we calculate that this could translate into a 5-7 ppt EBITDA margin boost for the carmakers. However, we expect this will be offset by an inability to lower labor costs in line with the projected production declines. As a result, we expect that dollar earnings will deteriorate in 2009 from 2008 levels. With dealers facing contracting demand, cash conversion cycles lengthening for carmakers and non-payment risks rising, steel cost savings alone will be insufficient to offset working capital concerns on lower operating volumes in 2009.

38
STRATEGY DARKEST BEFORE DAWN
2009E YoYValue drivers Scenario estimate %RUB/USD 24.6 26.1 7GDP growth, % 7.2 4.3 (2.9) pptReal d isposable income growth, % 7.6 0.5 (7.1) pptSteel HRC domestic, $ /ton 943.2 553.0 (41.4)PPI, % 22.3 15.5 (6.7) pptCPI, % 13.9 10.5 (3.4) ppt
Lower steel price to benefit carmakers in 2009Key Industry Drivers
2008E
Source: URALSIB estimates
SHORT-TERM LIQUIDITY STILL AT RISK Higher debt service payments, imminent puts increase cash flow risk. The local carmakers managed to access new short-term financing arrangements in 9M08. We saw evidence of this in the companies’ 9M08 results: AvtoVAZ’s RAS 9M08 results, which exclude the company’s subsidiaries, indicate that the company increased short-term debt by $200 mln to $614 mln as of the end of the period. Meanwhile, KAMAZ increased its short-term debt by 45% to $547 mln. GAZ Group refinanced $1.5 bln in short-term debt, according to the company’s 1H08 IFRS results. Going forward, we these increased debt volumes to pose a liquidity risk given the lower output volumes. In addition, the automakers are facing a combined $380 mln in upcoming put options on outstanding bond issues: GAZ Group faces a put on a $150 mln issue in February, while AvtoVAZ will need to navigate a put on a $40 mln issue due in March and a put on a $190 mln bln issue in May.
State support likely to remain AvtoVAZ and KAMAZ’s lifeline in the near term. Access to short-term liquidity is of vital importance for the domestic carmakers. As the companies’ access to refinancing has narrowed, we believe they will have to rely more on state support to secure funding. Recent media reports suggested that local banks have resumed short-term lending to some carmakers at 13-16% following a meeting between industry representative and Deputy Prime Minister Igor Sechin in October. KAMAZ and AvtoVAZ are reportedly among the recipients, although GAZ Group has yet to receive a response to an application for a $400 mln loan, according to management. Media also reported that AvtoVAZ received approximately $260 mln in short-term financing from VTB and Globex Bank in 4Q08. We believe the state will continue to support AvtoVAZ with access to financing, which will enable the company to focus on operations. Meanwhile, GAZ will continue to be vulnerable to liquidity issues in 1H09, in our view. Given that weak operating cash flow will barely be adequate to support scheduled debt repayments, much less leave any room for capex, we view the industry’s cash position as a significant risk.
Hopes for 2008 dividends fading. We do not expect potential dividends to drive the domestic carmakers’ shares ahead of record dates in 1H09. We do not expect KAMAZ to pay dividends on its common shares as it has made no payments in recent years either. Dividends from GAZ Group, although desirable for key shareholder Russian Machines, are now at risk due to the company’s difficult cash flow situation, while AvtoVAZ posted net income of just $35 mln in 9M08 and a $27 mln net loss in 3Q08 (both under RAS), which indicates that the company may post a net loss for 2008. A net loss under RAS would be particularly detrimental for AvtoVAZ prefs, which have been driven recently by expectations of a new charter provision setting out a standard dividend payout of 10% of RAS net income.

39
STRATEGY DARKEST BEFORE DAWN
Data Total ST Net debt / Capex FCF FCFCompany as of debt debt Cash EBITDA09E 2009E 2008E 2009EAvtoVAZ 3Q08 RAS 1,004 691 390 1.2 190 (210) (78)GAZ Group 1H08 IFRS 1,516 1029 184 5.4 150 (300) (80)KAMAZ 1H08 IFRS 586 354 39 2.3 80 (73) (30)Sollers 1H08 IFRS 688 273 115 4.1 120 (105) (45)
Source: Company data, URALSIB estimates, Bloomberg
Carmakers facing short-term liquidity issuesDebt, Cash and Cash Flow Summary, $ mln
LONG-TERM COMPETITIVENESS IN JEOPARDY Liquidity crisis will take the industry one step back. The main negative impact of the liquidity crunch has been the halt to domestic carmakers’ modernization plans. Modernization had become the key strategic objective for the local carmakers as they sought to improve competitiveness. The automakers will continue to struggle with sluggish demand in the short term and will postpone development capex until later as operating cash flow has tightened. This will take them one step back in terms of development. At the same time, we believe foreign competition (e.g. foreign manufacturers and component producers such as Magna) could take a strong foothold in Russia. The domestic auto manufacturers will thus re-emerge in the medium term once again vulnerable to foreign competition, with technologically inferior products and fewer resources to capture an upswing in demand.
AvtoVAZ delaying the launch of a new model on the Logan platform. To give its product range a long-awaited overhaul, AvtoVAZ sold a blocking stake to Renault and reached an agreement to buy industrial licenses from Renault for EUR220 mln, with the hope of launching a new model based on the Logan platform by 2009. Given the difficult operating environment, AvtoVAZ has now delayed the launch of the new model until 2011. In the interim, we expect the company will try to replace the anticipated revenues from the planned new model with increased sales of the Lada Kalina; however, this model accounts for only 23% of AvtoVAZ’s revenues and does not represent a sustainable short-term growth driver. As such, state support is likely to remain the key factor for AvtoVAZ. KAMAZ to revisit capacity expansion on a demand upswing. KAMAZ, although relatively better positioned as no foreign competitors in its product segment have assembly plants in Russia, is also facing a long road to recovery, in our view, as enterprises are cutting investment and spending on equipment, and uncertainty reigns over its longer-term plans. The company had been in talks to sell a 42% stake to Daimler and had planned to invest $300 mln in expanding production capacity. The financial crisis brought an abrupt halt to these plans, and Daimler is now considering buying only a 10% stake. In effect, once demand rebounds KAMAZ will have to revisit the issue of modernizing its product line once again. We see some relief in the form of higher government spending: Defense Ministry orders currently account for 12% of KAMAZ’s output, but in any event the effect will be marginal in overall sales volume.

40
STRATEGY DARKEST BEFORE DAWN
GAZ remains vulnerable in the short term. Of the domestic automaker, GAZ Group is in the most vulnerable position, in our view. The company has already seen demand declining and cashflow turn negative in 1H08, when the tightening liquidity situation had not yet been felt throughout the economy. Light commercial vehicles and construction equipment account for the bulk of GAZ Group’s output and will be most deeply affected by the economic slowdown. GAZ Group does not have a sizeable passenger car division and depends on industrial demand, which is unlikely to recover before wide-scale commercial lending normalizes. GAZ Group is relying on Russian Machines’ 20% stake in Magna to develop a new component base and has invested $300 mln to launch its Volga Siber model on the Chrysler Sebring platform. Recently, Russian Machines reportedly relinquished its stake in Magna following a margin call. In the absence of the required project funding (reportedly amounting to $1.7 bln), GAZ Group will likely also have to forgo its plans to develop Euro-3 and Euro-4 compliant engine designs and develop a proprietary diesel engine, which would once again prompt a review of its strategic plans to accommodate a demand rebound in the longer term. In this situation, it is possible that we may see changes in GAZ Group’s ownership structure.

41
STRATEGY DARKEST BEFORE DAWN
TRANSPORT AIR TRAVEL A LUXURY FEWER CAN AFFORD
Existing fleet addition plans a risk to value in 1H09 on lower operating volume. Russia’s airliners have enjoyed double-digit growth rates in 2007 and in the first 10 months of 2008, fuelled by rising incomes and growing business activity. However, the economic downturn will likely bring an end to this growth in 1H09. In our assumption, we have incorporated a new macroeconomic forecast to reflect the changing economic conditions and anticipated slowdown in disposable income growth and business activity. We believe consumers and corporates will cut spending on air travel and become much more sensitive to pricing in 2009. Should our belief that the number of flights per person will decline by an average of 10% in 2009 transpire then carriers will ne forced to reduce average fares, which in turn will reduce revenue. Nevertheless, in 1H09 we expect margins to benefit from a drop in jet fuel prices that began in 2H08. The jet fuel price is forecast to drop some 30% in 1H09 from 2008E levels; however, this will be offset by an expected decline in traffic volumes. As a result, existing fleet expansion plans pose a liquidity risk if they are not put on hold, as operating cash outflows and capex related to these additions could turn the company free cash flow negative.
Recovery in airline industry unlikely before 2010. Airlines are unlikely to witness any recovery in 2H09, as a seasonal second half downturn will have a negative on passenger volumes. Profit margins are also unlikely to recover in 2H09, as we do not expect any substantial reductions in jet fuel prices for this period. Cash flows problems will delay recovery in the sector, in our view. Positive sentiment may be strengthened by expectations of a potentially stronger 1H10, but this would only start to drive future earnings estimates higher towards the end of 2H09. Under this scenario, we see downside risk to Aeroflot’s share price at current levels: the company currently trades at a 2009E EV/EBITDA of 5.3.
DOWNSIDE RISK IN THE SHORT-TERM Aeroflot still not cheap despite higher expected profitability in 2009. We project that Aeroflot’s 2009E revenue will decline 11% YoY to $3.9 bln due to an expected 8.7% YoY drop in passengers and lower average fares. While an expected decline in the jet fuel price will help Aeroflot improve profitability in 1H09, the company still does not appear cheap on a relative valuation basis (2009E EV/EBITDAR of 5.3) if capitalized operating leases are included in EV calculation. We also note that expected ruble appreciation next year should also have a positive affect on Aeroflot’s operating profitability in 2009E.
Valuations P/E EV/EBITDA P/E EV/EBITDAAeroflot n/a 11.3 7.7 5.3
Source: RTS, company data, URALSIB estimates
Aeroflot does not appear cheapKey Valuations
2008E 2009E*
Our 2009 Top Picks Aeroflot

42
STRATEGY DARKEST BEFORE DAWN
Suspension of fleet expansion could boost cash flow. Cash flow generation will remain a challenge for Aeroflot in 2009 in light of the expected drop in demand for flights next year. We estimate the company’s 2009E operating cash outflow and capex requirement will $400 mln (for aircraft additions) become value-destructive and result in negative free cash flow. The main capex items are aircraft purchases and associated duties and VAT: Aeroflot pays 41.6% VAT and import duties on the value of all imported aircraft – including purchases and finance leases. The next major capex item is construction of the Sheremetyevo-3 terminal, scheduled for launch in 1H09. We estimate that this project will account for 50% of 2009E capex of $160 mln. Duties and taxes on planned operating leases for aircraft could amount to $100 mln in 2009E as part of the required operating cash outflow. Aeroflot could delay fleet additions under operating lease contracts, if necessary, without any detrimental effects to its balance sheet or cash flow. This would reduce cash flow requirements and boost free cash flow in the short term.
2009E YoYValue drivers Scenario estimate %RUB/USD 24.6 26.1 7GDP growth, % 7.2 4.3 (2.9) p.p.Real d isposable income growth 7.6 0.5 (7.1) p.p.Jet fuel abroad, $/ton 1,042.0 621.0 (37.4)Jet fuel domestic, $/ton 995.0 564.0 (43.0)Passengers, mln 10.8 9.9 (8.7)
Weaker demand in 2009, but jet fuel costs to easeKey industry drivers
2008E
Source: URALSIB estimates
STATE ASSITANCE FOR SHORT-TERM FINANCING
WOULD BE WELCOME BUT NOT CRUCIAL State support positive for cash flow in the short term. According to Aeroflot management, as of end-1H08 the company’s short-term debt stood at $148 mln and its long-term debt at $468 mln. Much of the company’s long-term debt is in dollars and provided by VTB (7.8%) and VEB (10.6%) primarily to finance the construction of Sheremetyevo-3. Aeroflot management does not expect any disruptions in these financing arrangements. In addition, we expect Aeroflot to maintain approximately $500 mln in lease obligations at end-2008. We estimate that debt and finance lease obligations will yield interest payment requirements of $120 mln for 2009E. Our projections imply that lower levels of operating cash flow will barely meet these payments. If Aeroflot’s existing development plans for 2009E remain unchanged, then the company will have to find alternative sources of financing. This should not prove too difficult a task, given the government’s stake in the company and its status as Russia’s flagship national carrier. The government has expressed a general readiness to provide carriers with access to financing. Management has stated that Aeroflot does not currently require state support and is able to access financing at LIBOR+2-3%, an attractive rate given the limited access to liquidity at the moment. If, however, financing options narrow further, government support might become an important lifeline for Aeroflot.
ST Debt Net Debt /Company Data as of Total Debt due in 1 yr Cash EBITDA09E Capex 09E FCF '09EAeroflot 2008E IFRS 1,150 150 3 1.8 254 (43)S7 (Sibir) 3Q08 RAS 458 96 5 n/a 103 n/aUTair 3Q08 RAS 600 170 5 n/a 90 n/a
Cashflows under pressure in 2009Debt, Cash and Cash Flow Summary, mln
Source: Company data, URALSIB estimates

43
STRATEGY DARKEST BEFORE DAWN
Long-term debt a risk on weakening ruble. Aeroflot changed its functional currency from the dollar to the ruble in 2007. Based on base scenario, we expect this change to positively affect the company’s financials in the short-term due to a stronger expected ruble at year-end 2009E compared to year-end 2008 against the dollar. On the other hand, as our sensitivity analysis below shows, a weaker ruble at year-end 2009 would result in forex losses. Approximately 20% of Aeroflot’s revenue is ruble-driven, while ruble expenses account for approximately 83% of total costs. The company’s aircraft acquisitions and leases are typically denominated in dollars and Aeroflot’s long-term debt position is currently entirely dollar-denominated. Furthermore, fleet-related capex is entirely dollar-denominated, and we estimate this item will amount to approximately 75% of 2009E capex. Our sensitivity analysis for 2009E shows that if the ruble were to weaken in 2009, currency exchange exposure would have a positive effect on Aeroflot’s operating margin. However, if debt exposure is maintained, we expect foreign exchange losses to have a detrimental impact on Aeroflot’s bottom line in the event of a weaker ruble. For 2008, we estimate that the company’s long-term debt and finance lease exposure, if maintained, could result in currency exchange losses of $111 mln, based on our macro forecast for RUB/$ exchange rates. This would wipe out exchange gains of $42.6 mln in 1H08 and turn Aeroflot loss-making for 2008 under IFRS. For 2009, under our base case forecasted RUB/$ exchange rate, debt exposure would result in currency exchange gains.
Base case RUB stronger RUB weakerRUB/$, EoP 26.79 24.11 29.47RUB/$, average 26.14 23.53 28.75Sales 3783 3931 3661Operating costs (2901) (3059) (2772)Depreciation (195) (215) (178)Operating lease expenses (255) (255) (255)Operating income 432 402 456Operating margin , % 11.42 10.24 12.47FX gains/(losses) 30 138 (59)Interest payments (72) (75) (70)Capita l lease interest payments (44) (44) (44)EBT 346 422 283Income tax (83) (101) (68)Income before minorities 263 321 215Minority interest (8) (10) (6)Net income 255 311 209Net margin, % 13.47 7.92 5.70
Weaker ruble would boost operating margins, depress net marginSensitivity of Aeroflot's 2009E financials to changes in RUB/$ exchange rate
Source: Company data, URALSIB estimates
Currency losses jeopardize RAS net income and dividends in 2008. Currency losses could mean that Aeroflot ends the year with an RAS net loss, which would force it to forgo 2008 dividends. If, however, a RAS net income is recorded in 2008, Aeroflot may be forced to pay 25% of RAS net income as dividends – a general recommendation for companies where State Property Agency holds a stake. However, in light of the currently tight cash flows, payment of 2008 dividends would only exacerbate Aeroflot’s cash deficit in 2009 and reduce free cash flow by a further $22 mln. We, therefore, do not expect 2008 dividends to become a catalyst for Aeroflot’s share price performance around the expected cut-off date in 1H09.

44
STRATEGY DARKEST BEFORE DAWN
ROSAVIA, A SERIOUS COMPETITIVE THREAT Consolidation trend set to continue in 2009. Under the current market conditions of weaker demand for air travel, expensive fleet upgrade programs that were initiated before the crises to avail of the long-term expected growth in air travel will create cash flow risk for the carrier. The collapse of Air Union in September due to its failure to meet fuel expenses heralded the start of consolidation in the industry and the creation of Rosavia. The new entity combined civil aviation assets of Rostechnologies (including Air Union assets transferred to Rostechnologies’ control), headed by Sergei Chemezov) and Moscow government-owned Atlant-Soyuz. Rosavia has not yet commenced operations as an integrated entity and cannot yet rival Aeroflot on route development, fleet composition, or passenger traffic. Nevertheless, Rosavia possesses substantial administrative support that may challenge that of Aeroflot.
Operating efficiency should be key focus, as competition intensifies. Rosavia is likely to use administrative support as its key resource during early stages of development. This strategy, while bearing no true operating competitive risk to Aeroflot, may weaken Aeroflot’s competitive position in the long-term. In our view, Rosavia stakeholders are likely to object to the transfer of a state-owned blocking stake in S7 Airlines, Russia’s second-largest airline, to Aeroflot – an initiative long nurtured by Aeroflot. Rosavia has already challenged Aeroflot’s role of collecting royalty payments from foreign airlines on behalf of the state (these royalty payments amount to up to 12% of Aeroflot’s top line). Furthermore, in the longer-term, we believe that Rosavia might attempt to be included in inter-government agreements and become a designated carrier on international routes – currently Aeroflot’s domain. Consolidation of component airlines’ operations within Rosavia will also lead to intensified competitive pressures on domestic routes for Aeroflot. If state support is extended to Rosavia, Aeroflot’s market position could weaken. It is thus imperative for Aeroflot to focus on improving operational efficiency in 2009.

45
STRATEGY DARKEST BEFORE DAWN
OVERSHADOWED BY THE
BIGGER PICTURE FUNDAMENTALS STILL INTACT
Cautious sentiment to prevail for next couple of quarters. In our view, an economic slowdown will have a limited effect on the demand for telecommunications services, which are primarily a basic service. Telecoms constitute only a relatively small share of household expenses, thus large reductions are unlikely as consumers will likely focus on cost cuts elsewhere. However, some slowdown might be seen in demand from corporate customers and for relatively expensive services such as roaming or mobile internet. Having incorporated our latest macro scenario, we expect mobile operators to face a 9% reduction in usage relative to our previous forecast in 2009 (although usage will still grow by 12% relative to 2008) accompanied by 2% decline in the average price per minute. In our view, currency dynamics is the major driver putting fundamentals of Russian telecom companies at risk. Even assuming a 6% decline in the average RUB/USD rate for 2009, we still see all Russian telcos as highly undervalued. That said, in the short term the market is unlikely to fully appreciate this fact and will likely continue to focus on issues such as liquidity, deterioration of corporate governance or solvency. In addition, in the next two quarters telecom operations will be affected by traditional seasonal weaknesses. As a result we expect investment sentiment around the sector to continue ignoring fundamentals and remain fairly pessimistic in 1H09.
But in 2H09 strong fundamentals no longer should be ignored. Expected operational improvements in telecom sector driven by higher service usage in 2Q09 should be reflected in better quarterly financials which should trigger unlocking fundamentals of the telecoms. We assume that 1Q-2Q09 will be a right time to systematically build up positions in fundamentally strong names such as MTS, VimpelCom and Comstar-UTS. Sistema may also present an interesting play as concerns over its debt situation should be removed in 1H09. As uncertainty over Svyazinvest future will continue to prevail over sound inter-regionals’ (IRs) fundamentals, these companies will likely remain risky plays in 1H09.
MOBILES OFFER BEST DEFENSIVE PLAY IN 1H09 Mobiles and Comstar-UTS: good value with limited risk. We believe that from a fundamental perspective most Russian telecom companies still look undervalued, even under our revised macro forecast, which is more pessimistic than the previous one. In the telecom sector, we prefer mobile operators (MTS and VimpelCom) and Comstar-UTS, as they offer combination of:
good fundamental value; strong corporate governance; adequate liquidity; and a strong financial position.
We thus consider these stocks to represent reasonable defensive plays. As confirmed by our 2009E P/E and EV/EBITDA multiples analysis summarized in the table below, Russian mobile operators are trading at extremely low valuations (46% below international peers based on 2009E EV/EBITDA).
Our 2009 Top Picks MTS
AFK Sistema Comstar-UTS
We believe that 1Q-2Q09 will be the right time to build positions in MTS, VimpelCom and Comstar-UTS
URALSIB telecoms index vs RTS
Source: URALSIB estimates
0500
10001500200025003000
07/07
09/0
7
11/0
7
01/0
8
03/08
05/08
07/08
09/0
8
11/0
8
USIB TLC RTSI

46
STRATEGY DARKEST BEFORE DAWN
Inter-regionals: high risk, high return plays. In our view, IRs represent high-risk, high-reward plays that are best avoided under the current market environment. Although inter-regional telecoms have lost an average of 86% YtD, their fundamental performance thus far this year has not indicated any sign of weakness. As a result, IRs are trading on very low multiples from a fundamental perspective: at an average 2009E EV/EBITDA of 1.9 and 2009E P/E of 3.2. However, considering the dilution risks that face IRs from the potential restructuring of Svyazinvest, we would urge caution if investing in these names. With mixed signals coming from the government (such as statements from the ministries of economy and of communications over the need for the restructuring of Svyazinvest) the prospect of Svyazinvest privatization looks – at best – as uncertain as ever. Such a view is indirectly supported by AFK Sistema’s intention to sell its 25%+ one share stake in Svyazinvest. In the event of Svyazinvest being restructured (consolidating the subsidiaries into one operating company) the effect on minorities would be strongly dependant upon details of the deal. Under a best case scenario, (consolidation at fair values) the fundamental upside of IRs would be unlocked and further enhanced by increases in liquidity and potential improvement in management’s efficiency at the consolidated operator. However, under a negative scenario (consolidation under market rates), minorities of IRs would be diluted, wiping out upside potential.
AFK Sistema: debt situation not as bad as some might say. Although some of Sistema’s subsidiaries face problems servicing short-term debt, the problems are not insurmountable and the overall debt situation is manageable – although the holding will need to sacrifice some investments and divert cash from its telecom subsidiaries in favor of other businesses. In our view, the market has priced in a worst case scenario for AFK Sistema stock, which is unlikely to be realized; hence, the chances of a recovery in the name are high. If Sistema can overcome its short-term liquidity dilemma, it could trigger the catalyst needed for a revaluation of not only its share price, but also those of Comstar-UTS and the holding’s public subsidiaries to levels more consistent with a) the overall risk perception of the Russian market and b) with AFK Sistema holding’s sum-of-the-parts valuation.
Valuations P/E EV/EBITDA P/E EV/EBITDAMTS 4.4 2.3 3.9 2.1VimpelCom 5.2 3.1 4.5 2.7CenterTelecom 4.8 2.3 4.4 2.2North-West Telecom 4.9 1.2 4.2 1.1SouthTelecom 5.4 3.8 3.1 3.3Uralsvyazinform 6.0 2.8 4.4 2.6VolgaTelecom 2.6 1.7 2.0 1.5Sibirtelecom 3.1 1.7 2.7 1.5Far East Telecom 1.9 1.6 1.6 1.4Comstar-UTS 3.8 2.2 3.3 2.0
Source: URALSIB estimates* Based on the assumptions presented below, may d iffer from official forecasts
Valuations fundamentally unjustifiedMTS and Comstar Are Best Placed To Weather The Storm in 2009
2008E 2009E*
IRs represent high-risk, high-reward plays that are best avoided under the current market environment
Value Of Sistema Stake* % Of total
MTS 4,833 93Comstar UTS 435 8Other telcos (SkyLink, MTT) 253 5Total Telecoms 5,521 106Banking (MBRD) 271 5Technology (Sitronics) 136 3Real Estate (Sistema HALS) 18 0Bashkir Oil & Refinery 1,418 27Retail (Detsky Mir) 155 3Other (Travel, Media etc.) 100 2Sistema EV 7,618 147Sistema Corporate Net Debt (2,434) (47)Equity Value 5,184 100Discount for holding structure, % 10Equity Value @ 10% Discount 4,665Current Market Cap 1,930Discount to SOP, % (59)
Huge discountSistema SOP Valuation, $ mln
Source: Bloomberg; URALSIB estimates*Market value for public, est. for non public

47
STRATEGY DARKEST BEFORE DAWN
DEMAND UNLIKELY TO DECLINE TOO MUCH Customers will continue using mobile phones. In our view, demand for telecom services is likely to remain robust in spite of the ongoing financial crisis. Voice telecommunication services have effectively become a necessity for households and still account for a relatively small share of total household expenses. Demand for this service is therefore inelastic, thus we do not expect a noticeable reduction in mobile traffic in the short term, unless the economy enters a recession and unemployment reaches really high numbers. We note that private customers account for about 90% of the total revenue of mobile operators. Our revised macro scenario implies a 9% decline in mobile MOU, relative to our previous forecast, to 241 min (which is still up 12% YoY) and a 2% decline in APPM to 0.057$/min. A slowdown in demand is possible in some segments, including corporate or ‘expensive’ services such as mobile internet or roaming. In the case of inter-regional telecoms or Comstar-UTS, basic service tariffs are capped by the government and could even increase, while subscriber churn will only be limited. That said, there might be some slowdown in revenue growth from broadband (currently IRs key source of growth) due to the lower growth rates of broadband customers; we expect broadband customer bases of IRs to increase by 30% YoY 2009, 18 ppt lower than our previous forecast. However, the potential damage for Comstar-UTS in this area will be fairly limited, as the company has already a large customer base (near one million as of the end of 2008) in Moscow, the most lucrative market in Russia, thus a slowdown in the growth of its customer base will be less dramatic (13% growth in 2009 vs. 16% that we previously forecast). Moreover, the company’s accelerated expansion into the regions this year should mitigate any slowdown in its broadband customer growth in Moscow next year.
2009E YoYValue drivers Average Spot Scenario estimate %RUB/USD 24.6 27.5 26.14 7Inflation, % 13.9 n/m 10.5 (3.4 ppt)Average MOU, min 210 221 241 15Average APPM, $/min 0.060 0.060 0.057 (5.7)
Usage on the rise2008 YtD and Spot Provided For Comparison
2008E
Source: URALSIB estimates Forex poses a major risk, although demand will remain robust. The major fundamental risk facing Russian telecom operators comes from forex fluctuations. Telecoms is effectively a domestic industry with most of the revenue and costs in local currencies (Russian ruble foremost), but a large chunk of the debt load is denominated in dollars. This could potentially result in both non-cash forex losses from revaluation of liabilities and dilution of net margin because dollar-based interest expenses increase relative to ruble-based revenue. We estimate that the 6% decline in the average ruble rate from 24.6 to 26.1 RUB/$ implies that 2009E EBITDA will fall by 13% for both operators and net income will drop by 19% and 25%, respectively, for MTS and VimpelCom.
Demand for telecom services is likely to remain robust in spite of the ongoing financial crisis
Given the telco industry’s relative maturity, we do not expect capex reduction to put revenue generation (or even growth) at risk
48
STRATEGY DARKEST BEFORE DAWN
OPERATIONS: CRISIS NOT TOO LARGE A THREAT Keeping an eye on cash flows. Naturally, Russian telecom operators are likely to readjust their short-term strategies in response to the crisis, and err on the side of caution rather than growth. Svyazinvest has already indicated that its inter-regional subsidiaries will reduce investments by 30% in 2009. Comstar-UTS will fund its capex program only from its own cash flows; it has already streamlined it planned capex program through the implementation of the most up-date technology for network modernization in Moscow and this should reduce investments on this purpose 30% less than its previous plan. Both mobile and fixed-line operators indicated they are ready to cut their capex in 2009. Given the industry’s relative maturity, we do not expect capex reduction to put revenue generation (or even growth) at risk. For example, MTS recently announced it would cut its 2009 capex plans by 20% to $2 bln. But, as its maintenance capex is only about $500 mln per year, MTS still has scope for further reduction, if need be. Cost cutting efforts will be undertaken elsewhere too, such as personnel optimization and better terms from suppliers. Operators will also likely abandon/review their riskier projects, such as expansion into foreign markets where Russian operators do not have experience or a convincing competitive advantage. For example, Russia’s third-largest mobile operator, MegaFon, has already reversed its plan to enter the Iranian market. A partial switch of debt into rubles – a move already undertaken by MTS, which has recently placed two RUR10 bln bond issues – is yet another anti-crisis measure aimed at reducing currency-related risk. As a result, the crisis might even help telecom operators to improve their financials and avoid risky decisions. Besides, capex and staff reductions as well as other cash saving measures should enable telecom operators to more actively use their own zonal and long-distance networks to transmit calls from their clients and stimulate intra-net calls, which should reduce their interconnect expenses.
Stronger companies may use crisis for their benefit. Strong players with solid financial positions such as MTS, VimpelCom and Comstar-UTS might actually benefit from the crisis by seeking expansion via M&A activity. Moreover, having sufficient funds could generate better negotiating power against potential sellers given the decline in asset valuations across the market and the financial constraints faced by owners of assets to be sold. Mobile operator SMARTS is a good example of such an asset: all the Big-3 Russian mobile operators expressed interest in buying it, but the deal never took place as the asking price was too high.
FUNDAMENTALS SHOULD RETURN TO THE FORE Sentiment anticipated to improve in 2H09. With liquidity being pumped into the system we expect the global financial situation to improve in 2H09. This should alleviate market concerns on issues that are currently dampening sentiment such as solvency, debt and refinancing. The market is also likely to become less cautious over currencies by then too. Essentially, in 2H09 we expect to see a positive outcome emerge from the preventative measures that are being undertaken at the moment. By then the market should also have a better understanding of the benefits, costs and risks that expansion into the retail sector (mobile phones and accessories) has in store for mobile operators. Finally, 2H09 will be the reporting season for 2Q09 and 3Q09 results, which – anticipated to strong on seasonality factors – should become catalyst for recovery in the share prices of Russian telecom operators in 2H09.
Strong players such as MTS, VimpelCom and Comstar-UTS might benefit from the crisis by seeking expansion via M&A activity
With liquidity being pumped into the system we expect the global financial situation to improve in 2H09
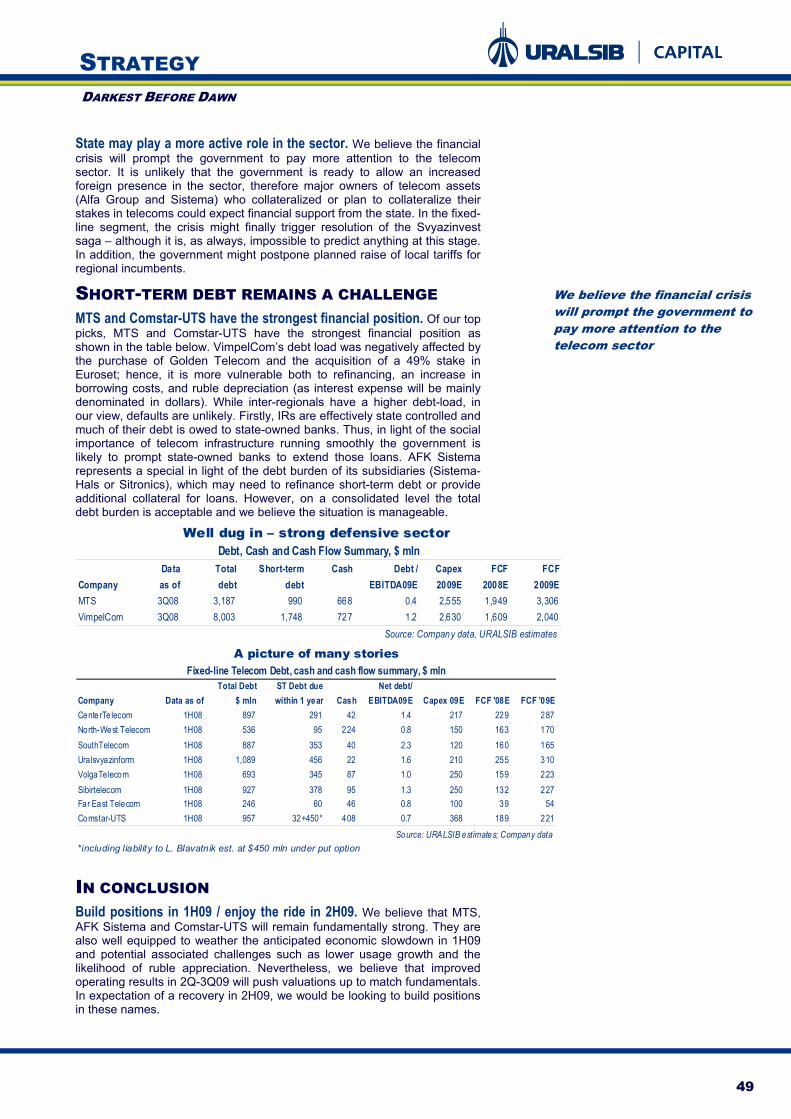
49
STRATEGY DARKEST BEFORE DAWN
State may play a more active role in the sector. We believe the financial crisis will prompt the government to pay more attention to the telecom sector. It is unlikely that the government is ready to allow an increased foreign presence in the sector, therefore major owners of telecom assets (Alfa Group and Sistema) who collateralized or plan to collateralize their stakes in telecoms could expect financial support from the state. In the fixed-line segment, the crisis might finally trigger resolution of the Svyazinvest saga – although it is, as always, impossible to predict anything at this stage. In addition, the government might postpone planned raise of local tariffs for regional incumbents.
SHORT-TERM DEBT REMAINS A CHALLENGE MTS and Comstar-UTS have the strongest financial position. Of our top picks, MTS and Comstar-UTS have the strongest financial position as shown in the table below. VimpelCom’s debt load was negatively affected by the purchase of Golden Telecom and the acquisition of a 49% stake in Euroset; hence, it is more vulnerable both to refinancing, an increase in borrowing costs, and ruble depreciation (as interest expense will be mainly denominated in dollars). While inter-regionals have a higher debt-load, in our view, defaults are unlikely. Firstly, IRs are effectively state controlled and much of their debt is owed to state-owned banks. Thus, in light of the social importance of telecom infrastructure running smoothly the government is likely to prompt state-owned banks to extend those loans. AFK Sistema represents a special in light of the debt burden of its subsidiaries (Sistema-Hals or Sitronics), which may need to refinance short-term debt or provide additional collateral for loans. However, on a consolidated level the total debt burden is acceptable and we believe the situation is manageable.
Data Total Short-term Cash Debt / Capex FCF FCFCompany as of debt debt EBITDA09E 2009E 2008E 2009EMTS 3Q08 3,187 990 668 0.4 2,555 1,949 3,306VimpelCom 3Q08 8,003 1,748 727 1.2 2,630 1,609 2,040
Source: Company data, URALSIB estimates
Well dug in – strong defensive sector Debt, Cash and Cash Flow Summary, $ mln
Total Debt ST Debt due Net debt/Company Data as of $ mln within 1 year Cash EBITDA09E Capex 09E FCF '08E FCF '09ECenterTelecom 1H08 897 291 42 1.4 217 229 287North-West Telecom 1H08 536 95 224 0.8 150 163 170SouthTelecom 1H08 887 353 40 2.3 120 160 165Uralsvyazinform 1H08 1,089 456 22 1.6 210 255 310VolgaTelecom 1H08 693 345 87 1.0 250 159 223Sibirtelecom 1H08 927 378 95 1.3 250 132 227Far East Telecom 1H08 246 60 46 0.8 100 39 54Comstar-UTS 1H08 957 32+450* 408 0.7 368 189 221
*including liability to L. Blavatnik est. at $450 mln under put option Source: URALSIB estimates; Company data
A picture of many storiesFixed-line Telecom Debt, cash and cash flow summary, $ mln
IN CONCLUSION Build positions in 1H09 / enjoy the ride in 2H09. We believe that MTS, AFK Sistema and Comstar-UTS will remain fundamentally strong. They are also well equipped to weather the anticipated economic slowdown in 1H09 and potential associated challenges such as lower usage growth and the likelihood of ruble appreciation. Nevertheless, we believe that improved operating results in 2Q-3Q09 will push valuations up to match fundamentals. In expectation of a recovery in 2H09, we would be looking to build positions in these names.
We believe the financial crisis will prompt the government to pay more attention to the telecom sector
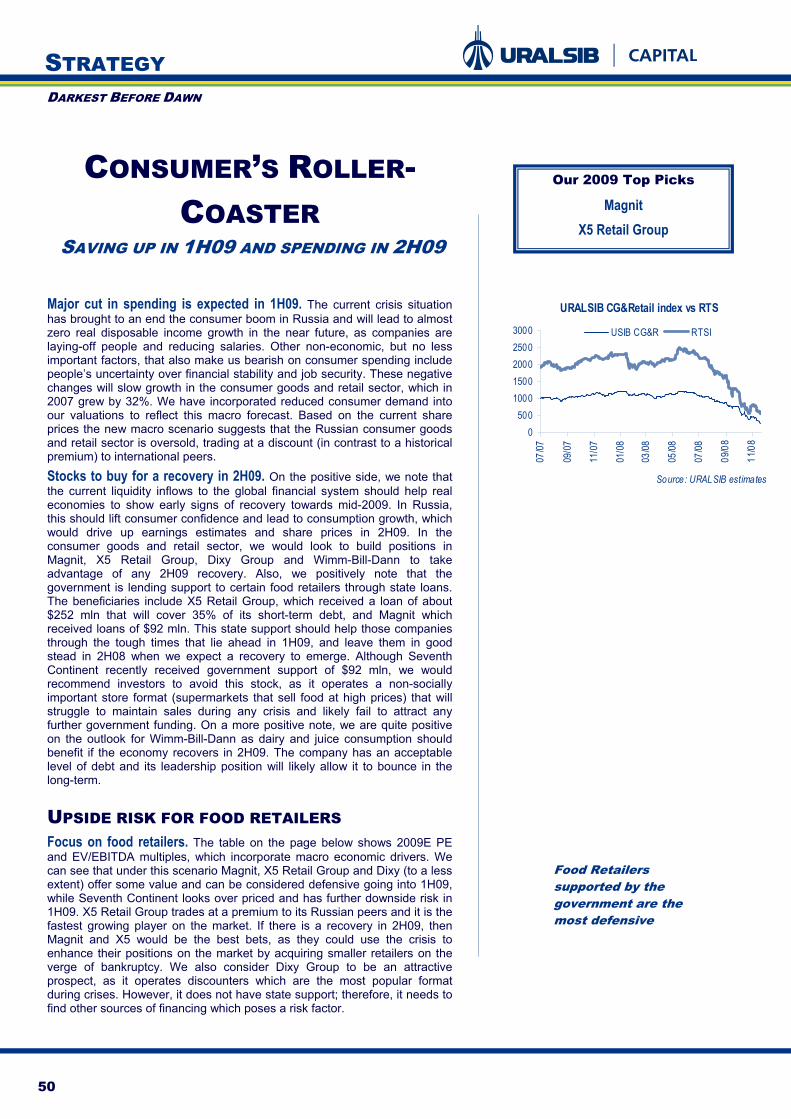
50
STRATEGY DARKEST BEFORE DAWN
CONSUMER’S ROLLER-COASTER
SAVING UP IN 1H09 AND SPENDING IN 2H09
Major cut in spending is expected in 1H09. The current crisis situation has brought to an end the consumer boom in Russia and will lead to almost zero real disposable income growth in the near future, as companies are laying-off people and reducing salaries. Other non-economic, but no less important factors, that also make us bearish on consumer spending include people’s uncertainty over financial stability and job security. These negative changes will slow growth in the consumer goods and retail sector, which in 2007 grew by 32%. We have incorporated reduced consumer demand into our valuations to reflect this macro forecast. Based on the current share prices the new macro scenario suggests that the Russian consumer goods and retail sector is oversold, trading at a discount (in contrast to a historical premium) to international peers.
Stocks to buy for a recovery in 2H09. On the positive side, we note that the current liquidity inflows to the global financial system should help real economies to show early signs of recovery towards mid-2009. In Russia, this should lift consumer confidence and lead to consumption growth, which would drive up earnings estimates and share prices in 2H09. In the consumer goods and retail sector, we would look to build positions in Magnit, X5 Retail Group, Dixy Group and Wimm-Bill-Dann to take advantage of any 2H09 recovery. Also, we positively note that the government is lending support to certain food retailers through state loans. The beneficiaries include X5 Retail Group, which received a loan of about $252 mln that will cover 35% of its short-term debt, and Magnit which received loans of $92 mln. This state support should help those companies through the tough times that lie ahead in 1H09, and leave them in good stead in 2H08 when we expect a recovery to emerge. Although Seventh Continent recently received government support of $92 mln, we would recommend investors to avoid this stock, as it operates a non-socially important store format (supermarkets that sell food at high prices) that will struggle to maintain sales during any crisis and likely fail to attract any further government funding. On a more positive note, we are quite positive on the outlook for Wimm-Bill-Dann as dairy and juice consumption should benefit if the economy recovers in 2H09. The company has an acceptable level of debt and its leadership position will likely allow it to bounce in the long-term.
UPSIDE RISK FOR FOOD RETAILERS Focus on food retailers. The table on the page below shows 2009E PE and EV/EBITDA multiples, which incorporate macro economic drivers. We can see that under this scenario Magnit, X5 Retail Group and Dixy (to a less extent) offer some value and can be considered defensive going into 1H09, while Seventh Continent looks over priced and has further downside risk in 1H09. X5 Retail Group trades at a premium to its Russian peers and it is the fastest growing player on the market. If there is a recovery in 2H09, then Magnit and X5 would be the best bets, as they could use the crisis to enhance their positions on the market by acquiring smaller retailers on the verge of bankruptcy. We also consider Dixy Group to be an attractive prospect, as it operates discounters which are the most popular format during crises. However, it does not have state support; therefore, it needs to find other sources of financing which poses a risk factor.
Our 2009 Top Picks
Magnit X5 Retail Group
Food Retailers supported by the government are the most defensive
URALSIB CG&Retail index vs RTS
Source: URALSIB estimates
0500
10001500200025003000
07/07
09/0
7
11/0
7
01/0
8
03/08
05/08
07/08
09/0
8
11/0
8
USIB CG&R RTSI

51
STRATEGY DARKEST BEFORE DAWN
For instance, recently Dixy had to raise capital through an equity issue that was at a big discount to the then share price, suggesting that the company has no other source of financing. On a different note, we positively observed that recently the refinancing risks for X5 (which had $713 mln of short-term debt outstanding as of end-1H08) were reduced, as it received government support from VTB and now has sufficient funds to cover its short-term obligations (until the end of 1H09). We note that X5’s PE and EV/EBITDA multiples are considered more appropriate than a DCF-based valuation at this stage given the wild fluctuations in the cost of capital and the uncertain outlook for long-term external financing and currencies.
Risks of food retailers. We highlight the following risks for investors: the government made it clear that it is unconcerned that the core shareholders of large food retailers might change as a result of margin calls on holdings they have pledged, signaling that the owners cannot rely on soft loans from the state banks. This obviously is a cause of risks to minorities: current major shareholders might change and we do not know what their strategy towards minorities will be.
2008E 2009E* 2009*Valuations P/E P/E EV/EBITDASeventh Continent 12.5 11.4 7.3X5 Retail group 11.6 13.5 4.7Magnit 4.3 3.8 2.4Dixy 5.1 4.3 2.6Wimm-Bill-Dann 5.1 3.9 2.4Baltika 4.0 3.6 2.1Pharmacy Chain 36,6 neg neg 2.4Cherkizovo Group 2.3 1.6 3.5Kalina 4.4 3.4 3.0Razgulay 3.5 2.0 3.0
Source: Bloomberg, URALSIB estimates* Based on the assumptions presented below, may d iffer from official forecasts
Magnit best placed to weather the storm in 2009Comparative Valuations
DEBT RISKS IS A PROBLEM FOR SOME PLAYERS High leverage means high risks. Despite apparently attractive valuations, Cherkizovo, Kalina and Razgulay should be approached with caution, as they have high short-term debt burdens. We would be particularly cautious with Pharmacy Chain 36.6, as it was still loss making at the end of 1H08 and has severe liquidity problems that prevent it from making payments to some of its major suppliers. Regarding Baltika, the major concern is its low liquidity.
Wimm-Bill-Dann. Wimm-Bill-Dann is certain to face tough times in the event of a consumption downturn due to the current high prices for dairy and juices. However, we believe that an acceptable level of debt, strong management team and leadership positions on the market will help it get through 1H09. We also positively view that the company has strong corporate governance and received a 7+ GAMMA rating from S&P.
Consumption likely to drop after the New Year’s holidays
Russia has potential to growFood Retail Market in 2007, $bln
Source: Company Data
262221 212
11693
190
050
100
150200250
300
UK
Fran
ce
Germ
any
Italy
Spai
n
Russ
ia

52
STRATEGY DARKEST BEFORE DAWN
CONSUMPTION HITS THE BOTTOM IN 1H09 Major consumer spending cuts are still to come. We believe that after the New Year holiday season people will cut their spending considerably, as 0.5% real income growth in 1H09 will be the slowest since 2002. Consequently, we expect that food retailers will show low sales growth (15-25%) from the beginning of 2009, as consumers minimize their average checks and change their baskets away from the consumption of expensive groceries (including meat and certain types of dairy products, as these prices have more than tripled during the past year), which is negative for Cherkizovo and Wimm-Bill-Dann. For instance, after the previous crisis 68% of Russian citizens questioned admitted to cutting expenses for everyday needs. In the table below, we present our value driver assumptions used in calculating the 2009E P/E and EV/EBITDA multiples above.
Setting up for a 2H09 rebound. If liquidity constraints are removed and the global economy begins to function again, we could see growth in the real economy and businesses could start re-hiring people, which would boost consumer confidence. Undoubtedly, this would benefit companies in the retail sector, as they are very dependant on consumer spending. Should retail sales start to grow again it would give retailers confidence to pick up the pace on slowed expansion plans and reap the benefits from the unsaturated Russian food retail market (as of the end of 2007 it equaled $191 bln, vs $262 bln for the UK). This process could be re-launched as early as mid-2009.
2008E 1H09E 2H09EValue driversRUB/USD 24.6 26.14 26.14Inflation YoY% 14 11 11PPI YoY% 22 16 8Real Income growth YoY% 8 0.5 4Wages YoY% 30 0 0
Macro drivers forecast
Scenar io estimate
Source: URALSIB estimates
Real income growth is the main driver
2H09 SHOULD PROVIDE EXCEPTIONAL RETURNS Low consumption is the main challenge facing the industry in 1H2009. High leverage (especially in dollars), poor consumption, the replacement of high-margin purchases with low-margin ones, rising interest rates and a depreciating ruble are challenges facing the CG&Retail sector in 1H2009. Consequently, due to deficit in financing we are likely to see companies reducing capex, extending accounts payable (which is very risky, as it might result in shrinkage of product ranges and lead to empty shelves), laying-off employees, cutting salaries, freezing high cost production and curtailing expansion projects.
Large players could acquire smaller ones at discounted prices. For the stronger and larger companies in the sector such as X5 Retail Group and Magnit, we see opportunities for inexpensive acquisitions in the market. The retail sector is very fragmented, with the largest player occupying just 3.5% of the market and companies could use the current crisis to expand. We believe companies will reduce the pace of new store openings in order to save money and acquire established chains at discounted prices, especially in regions where successful acquisitions will enable companies to increase market shares faster than organic growth. The government, on which retailers are heavily dependent, favors industry consolidation as it will be easier to control, but in any case the government cannot save all small players.
Low consumption, rising interest rates, and depreciating ruble are among the main challenges
Market is very fragmentedRussian Food Retail Market 2007
Source: X5 Retail Group
Lenta 1% Auchan 2% Magnit 2%
Dixy 1%
Seventh Continent
1%
O’Key 1%
X5 & Karusel 3% Viktoria 1%
Kopeya 1%
Metro 2%
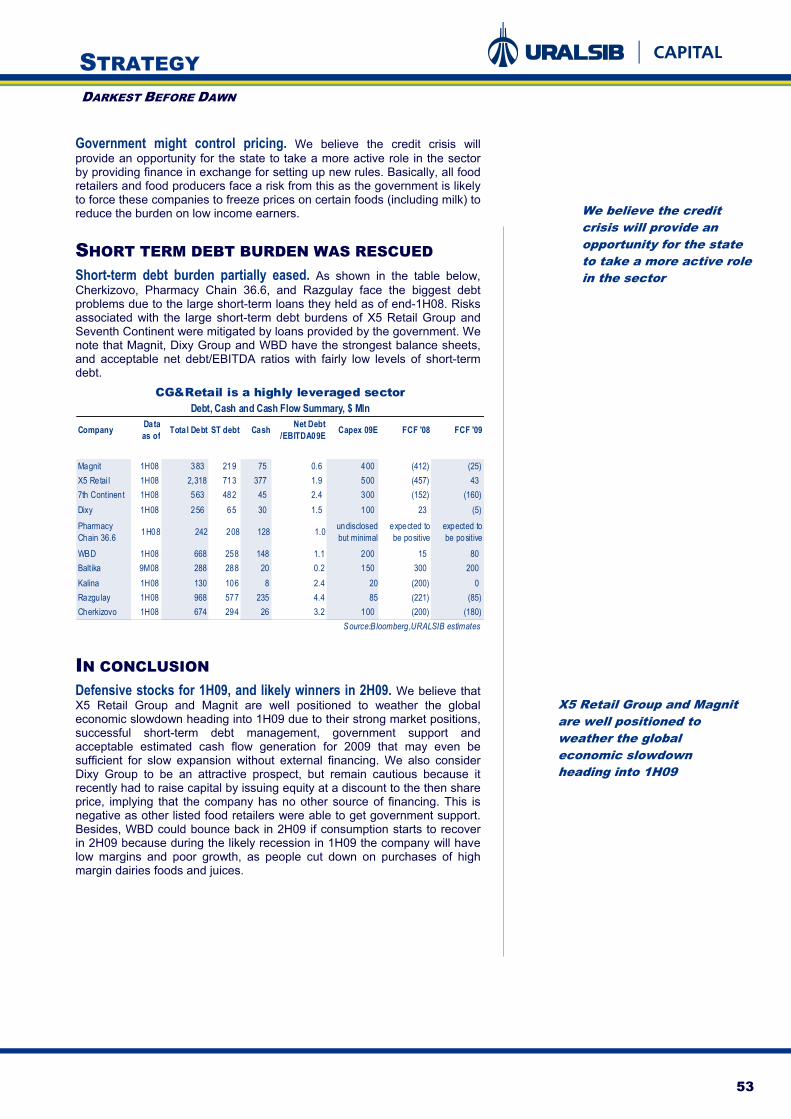
53
STRATEGY DARKEST BEFORE DAWN
Government might control pricing. We believe the credit crisis will provide an opportunity for the state to take a more active role in the sector by providing finance in exchange for setting up new rules. Basically, all food retailers and food producers face a risk from this as the government is likely to force these companies to freeze prices on certain foods (including milk) to reduce the burden on low income earners.
SHORT TERM DEBT BURDEN WAS RESCUED Short-term debt burden partially eased. As shown in the table below, Cherkizovo, Pharmacy Chain 36.6, and Razgulay face the biggest debt problems due to the large short-term loans they held as of end-1H08. Risks associated with the large short-term debt burdens of X5 Retail Group and Seventh Continent were mitigated by loans provided by the government. We note that Magnit, Dixy Group and WBD have the strongest balance sheets, and acceptable net debt/EBITDA ratios with fairly low levels of short-term debt.
Company Data as of Total Debt ST debt Cash Net Debt
/EBITDA09E Capex 09E FCF '08 FCF '09
Magnit 1H08 383 219 75 0.6 400 (412) (25)X5 Retai l 1H08 2,318 713 377 1.9 500 (457) 437th Continent 1H08 563 482 45 2.4 300 (152) (160)Dixy 1H08 256 65 30 1.5 100 23 (5)Pharmacy Chain 36.6 1H08 242 208 128 1.0 undisclosed
but minimalexpected to be positive
expected tobe positive
WBD 1H08 668 258 148 1.1 200 15 80Baltika 9M08 288 288 20 0.2 150 300 200Kalina 1H08 130 106 8 2.4 20 (200) 0Razgu lay 1H08 968 577 235 4.4 85 (221) (85)Cherkizovo 1H08 674 294 26 3.2 100 (200) (180)
CG&Retail is a highly leveraged sectorDebt, Cash and Cash Flow Summary, $ Mln
Source:Bloomberg,URALSIB estimates
IN CONCLUSION Defensive stocks for 1H09, and likely winners in 2H09. We believe that X5 Retail Group and Magnit are well positioned to weather the global economic slowdown heading into 1H09 due to their strong market positions, successful short-term debt management, government support and acceptable estimated cash flow generation for 2009 that may even be sufficient for slow expansion without external financing. We also consider Dixy Group to be an attractive prospect, but remain cautious because it recently had to raise capital by issuing equity at a discount to the then share price, implying that the company has no other source of financing. This is negative as other listed food retailers were able to get government support. Besides, WBD could bounce back in 2H09 if consumption starts to recover in 2H09 because during the likely recession in 1H09 the company will have low margins and poor growth, as people cut down on purchases of high margin dairies foods and juices.
We believe the credit crisis will provide an opportunity for the state to take a more active role in the sector
X5 Retail Group and Magnit are well positioned to weather the global economic slowdown heading into 1H09

54
STRATEGY DARKEST BEFORE DAWN
REAL ESTATE DE-LEVERAGING
Expect more volatility in 1H09. Russian real estate firms will continue to be tested by shrinking consumer demand and a lack of access to new debt, as the fall out from the credit crisis hits the real economy. We anticipate more volatility in 1H09 as investors assume the worst; developers struggle to prove their solvency and poor transaction volumes keeps the market in the dark on prices. Our revised company models include new macro assumptions that reflect the full impact of the credit crisis. We forecast that 2009 office rental and residential sales volumes will be down 40%, rental sales will fall 15% and residential sales will shrink by 20%. Even under this bearish scenario, the sector looks convincingly oversold. However, uncertainty about access to capital will continue to put pressure on real estate sector share prices in 1H09.
Recovery in late 2009. Once the sector gets past short-term debt issues, we expect the market to stabilize in mid-2009 (with or without government support). At this point a clearer picture will emerge of the real supply/demand equation. At the same time, developers will resume growth, albeit at a more tempered pace. For investors with longer time horizons, we recommend building positions in homebuilder’s LSR and PIK upon confirmation of their ability to repay debt and ahead of the market stabilization which we forecast will occur in late 2009.
WORST SEEMS PRICED IN Stay with homebuilders LSR and PIK. At the top of the table below, we compare LSR and PIK’s 2009 ‘price to presales cash’ and ‘price to free cash flow’ multiples, which are calculated using our new macroeconomic and real estate sector drivers (presented on the following page). These multiples better convey the actual changes in the companies’ financial positions during these two periods, as they are unfortunately impossible to capture using IFRS results due to the accrual accounting time lag. PIK looks cheap compared to LSR, which in our view reflects the market concerns over the redemption of its short term debt. To compare our commercial developers, we use ‘price to net asset value’ and ‘book value to net asset value’ multiples. Under our bearish scenario, AFI’s roughly equal P/NAV compared to OPIN makes it seem attractive thanks to its much higher quality real estate portfolio. We also point out that Raven looks very attractive given its hefty 20% implied dividend yield.
P/Cash from P/Cash fromResidential presales presales
PIK Group 0.20 1.36 0.35 7.76LSR Group 1.01 0.88 2.01 2.07
Commercial P/NAV BV/NAV P/NAV BV/NAVOpen Investments 0.19 1.35 0.27 1.93AFI Development 0.09 0.46 0.28 1.36Sistema-HALS 0.02 0.67 0.06 1.89Raven Russia 0.24 1.40 0.30 1.75
** Our pro-forma FCFF estimate is more reflective of economic activity in that period than IFRS
Source: URALSIB estimates* Based on the assumptions presented below, may differ from official forecasts
Safe with HomebuildersLSR and PIK best in sector in 2009
2008E 2009E*P/pro forma
FCFF**P/pro forma
FCFF**
Our 2009 Top Picks LSR PIK
RAVEN
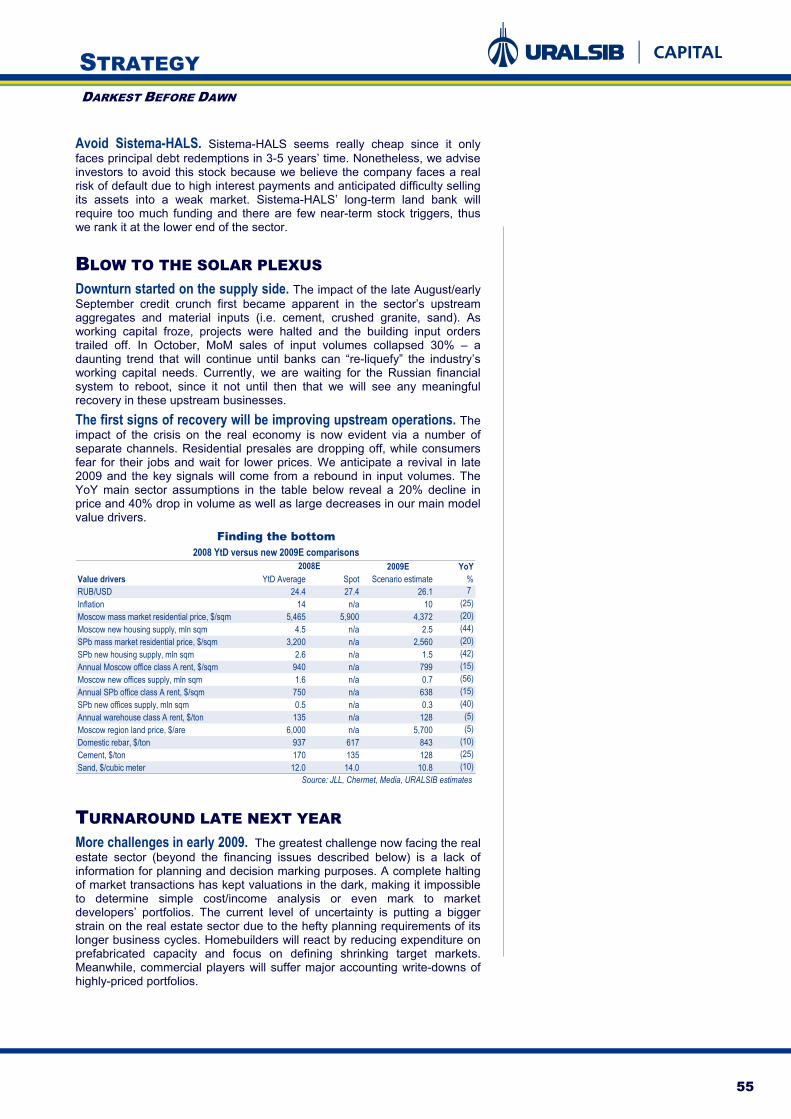
55
STRATEGY DARKEST BEFORE DAWN
Avoid Sistema-HALS. Sistema-HALS seems really cheap since it only faces principal debt redemptions in 3-5 years’ time. Nonetheless, we advise investors to avoid this stock because we believe the company faces a real risk of default due to high interest payments and anticipated difficulty selling its assets into a weak market. Sistema-HALS’ long-term land bank will require too much funding and there are few near-term stock triggers, thus we rank it at the lower end of the sector.
BLOW TO THE SOLAR PLEXUS Downturn started on the supply side. The impact of the late August/early September credit crunch first became apparent in the sector’s upstream aggregates and material inputs (i.e. cement, crushed granite, sand). As working capital froze, projects were halted and the building input orders trailed off. In October, MoM sales of input volumes collapsed 30% – a daunting trend that will continue until banks can “re-liquefy” the industry’s working capital needs. Currently, we are waiting for the Russian financial system to reboot, since it not until then that we will see any meaningful recovery in these upstream businesses.
The first signs of recovery will be improving upstream operations. The impact of the crisis on the real economy is now evident via a number of separate channels. Residential presales are dropping off, while consumers fear for their jobs and wait for lower prices. We anticipate a revival in late 2009 and the key signals will come from a rebound in input volumes. The YoY main sector assumptions in the table below reveal a 20% decline in price and 40% drop in volume as well as large decreases in our main model value drivers.
2009E YoYValue drivers YtD Average Spot Scenario estimate %RUB/USD 24.4 27.4 26.1 7 Inflation 14 n/a 10 (25) Moscow mass market residential price, $/sqm 5,465 5,900 4,372 (20) Moscow new housing supply, mln sqm 4.5 n/a 2.5 (44) SPb mass market residential price, $/sqm 3,200 n/a 2,560 (20) SPb new housing supply, mln sqm 2.6 n/a 1.5 (42) Annual Moscow office class A rent, $/sqm 940 n/a 799 (15) Moscow new offices supply, mln sqm 1.6 n/a 0.7 (56) Annual SPb office class A rent, $/sqm 750 n/a 638 (15) SPb new offices supply, mln sqm 0.5 n/a 0.3 (40) Annual warehouse class A rent, $/ton 135 n/a 128 (5) Moscow region land price, $/are 6,000 n/a 5,700 (5) Domestic rebar, $/ton 937 617 843 (10) Cement, $/ton 170 135 128 (25) Sand, $/cubic meter 12.0 14.0 10.8 (10)
Finding the bottom2008 YtD versus new 2009E comparisons
2008E
Source: JLL, Chermet, Media, URALSIB estimates
TURNAROUND LATE NEXT YEAR More challenges in early 2009. The greatest challenge now facing the real estate sector (beyond the financing issues described below) is a lack of information for planning and decision marking purposes. A complete halting of market transactions has kept valuations in the dark, making it impossible to determine simple cost/income analysis or even mark to market developers’ portfolios. The current level of uncertainty is putting a bigger strain on the real estate sector due to the hefty planning requirements of its longer business cycles. Homebuilders will react by reducing expenditure on prefabricated capacity and focus on defining shrinking target markets. Meanwhile, commercial players will suffer major accounting write-downs of highly-priced portfolios.

56
STRATEGY DARKEST BEFORE DAWN
Survivors will harvest remaining market share. For big homebuilders like PIK and LSR, once past the short-term debt hump, they will be in an excellent position to garner market share in an already fragmented industry. This in turn should expedite the recovery process. State quietly providing handouts. The Russian Federal government and local municipal governments have a strong interest in keeping house building capacity intact. The government has large legacy obligations to provide new housing and replace unsuitable housing, which some experts estimate at 30% of total housing stock. However, the terms of these bailouts are being kept quiet to reduce the bargaining leverage of individual industry borrowers and stop opportunists jumping on the bandwagon. We are certain that PIK and LSR will receive some form of government financial assistance, since they as they are both of critical importance to their respective regions. However, commercial developers like HALS, OPIN and Raven are likely to be left to fend themselves and locate financing independently.
CONCERNS OVER SHORT TERM DEBT Waiting for proof of solvency. The abrupt onset of the credit crisis in early September meant that developers were virtually unable to revise 2008 investment plans. However, in 2009 we expect capex to be slashed to close to zero, as companies de-leverage balance sheets and get over the short-term credit hump. PIK is in the worst position over the near term and HALS will struggle just to pay next year’s interest payments. LSR has boldly stated that it will have no problems paying down near-term debt. Meanwhile OPIN and Raven have plenty of cash to pay off their entire debt.
Future looks less bright with only organic funding. Without future access to refinancing, Russian developers will have to drastically scale back their ambitions. We estimate that without leverage, annual real estate sector growth would shrink from 100% (2007) to only 20%.
Company Data as of Total debt, $ mln Short term debt, $ mln Cash, $ mln Net debt /EBITDA09E Capex 09E, $ mln FCF '09 Net debt/NAV07PIK Group 1H08 1,586 1,107 267 0.7 - (1,585) 0.1LSR Group 1H08 1,412 534 323 6.4 - 29 0.2AFI Development 1H08 406 271 796 neg. - (61) neg.Sistema-HALS 1H08 1,216 174 34 31.2 - 414 0.4Open Investments 1H08 404 109 460 neg. - 105 neg.Raven Russia 1H08 266 17 317 neg. - 156 neg.
Source: URALSIB estimates
Debt, cash and cash flow summaryBankruptcy not an option
IN CONCLUSION Prove solvency in 1H09, then stay with homebuilder’s LSR and PIK. Our top picks for the sector are homebuilders LSR and PIK which offers the following solid advantages:
state support more flexible intergrated business models lower dependence on external financing
However, for investors with a longer time investment horizon (1-2 years) we advise that they start building positions now.
URALSIB Securities Ltd URALSIB Capital LLC Auerbach Grayson & Co. Tower 42, 25 Old Broad St., London EC2N 1HQ, UK 8 Efremova Street, Moscow, Russia 119048 25 West 45th Street, 16th Fl., New York, Telephone: +44 (0) 20 7562 8000 Telephone: + 7 (495) 788 0888 New York 10036 Fax +44 (0) 20 7562 8099 Fax: + 7 (495) 705 7010 Tel: +1 (212) 557-4444, Fax: +1 (212) 557-9066 Authorized and Regulated by FSA Member Firm London Stock Exchange
Disclaimer The views expressed in this report accurately reflect the personal views of the undersigned lead analyst(s) about the subject. The lead analyst(s) has not and will not receive any compensation for providing a specific recommendation or view in this report. Opinions, estimates and projections in this report constitute the present judgment of the undersigned lead analyst(s) as at the date of the report. They do not necessarily reflect the opinions of URALSIB and are subject to change without notice. Name of lead analysts: Chris Weafer (Strategy & Politics), Vladimir Tikhomirov (Economics), Victor Mishnyakov (Oil & Gas), Matvey Taits (Utilities), Konstantin Chernyshev (Telecoms, IT&Media), Michael Kavanagh (Metals & Mining), Anna Kupriyanova (Industrials), Barry Schumaker (Real Estate) and Leonid Slipchenko (Banking)
This report is provided for informational purposes only. Under no circumstances is it to be used or considered as an offer or a solicitation of an offer to buy or sell securities.
Information and opinions contained in this report have been compiled by URALSIB from sources believed to be reliable and while all reasonable care has been taken in the preparation of this report, URALSIB makes no representation or warranty, express or implied, to its accuracy or completeness. Neither URALSIB nor its principals, employees, agents or affiliates accept any liability for any direct or consequential loss arising from any use of this report or its contents. Investors should make their own investment decisions using their own independent advisors, as they believe necessary and based upon their specific financial situations and investment objectives when investing. The information is the exclusive property of “URALSIB Capital LLC” and may not be reproduced or distributed without prior written permission.
URALSIB, their principals, employees, agents or affiliates may have positions or effect transactions in the securities referred to in this report and may engage in securities transactions with respect to securities covered by this report. They may also sell to or buy from customers on a principal basis and may serve as a director of issuers of such securities. Disclosures of conflicts of interest, if any, are listed below.
Investing in Russia and Russian securities may not be suitable for all investors and involves a high degree of risk. Investors should perform their own due diligence before investing, having due regard to their investment objectives and financial situation. Exchange rate fluctuations may affect the value of, and/or income from, securities denominated in currencies other than an investor’s currency. Past performance is not an indication of future results necessarily. Prices of securities, income from an investment, liquidity and availability of securities are subject to change without notice. URALSIB has no obligation to modify, amend or update this report, nor to otherwise notify a reader of this report should any opinion, projection, forecast, estimate or other matter change or subsequently becomes inaccurate or if research coverage of the company by URALSIB ceases.
This report is not intended for the use of Private Customers as that term is defined under the Financial Services and Markets Act 2000. This report has been approved for publication in the United Kingdom by URALSIB Securities Limited, authorised and regulated by the Financial Services Authority and a member firm of the London Stock Exchange.
Additional information available upon request.
© URALSIB Capital 2008
This report has been prepared by the correspondent of Auerbach Grayson & Company Incorporated named above on the date listed above. We are distributing the report in the U.S. and accept responsibility for its content subject to the terms as set within the report. Any U.S. person receiving this report and wishing to effect transactions in any security discussed herein should do so only with a representative of Auerbach Grayson & Company Incorporated. Additional information on recommended securities is available on request.

-
RESEARCH +7 (495) 723-7020
Head of Research
Konstantin Chernyshev, [email protected]
Strategy & Politics Metals & Mining Chris Weafer, [email protected] Michael Kavanagh, [email protected] Leonid Slipchenko, [email protected] Dmitry Smolin, [email protected] Economics Nikolay Sosnovsky, [email protected] Vladimir Tikhomirov, PhD, [email protected] Banking Natalia Maiorova, [email protected] Leonid Slipchenko, [email protected] Oil & Gas Natalia Maiorova, [email protected] Victor Mishnyakov, [email protected] Real Estate Mikhail Zanozin, [email protected] Barry Schumaker, [email protected] Utilities Eldar Vagabov, [email protected] Matvey Taits, [email protected] Industrials Alexander Seleznev, [email protected] Anna Kupriyanova, [email protected] Telecommunications, IT & Media Natalia Sorokina, [email protected] Konstantin Chernyshev, PhD, [email protected] Irina Irtegova, [email protected] Konstantin Belov, [email protected] Consumer Goods & Retail Olesya Vlasova, [email protected] Natalia Smirnova, [email protected] Market Data Analysis Fixed Income Andrey Bogdanovich, [email protected] Denis Poryvai, [email protected] Vasiliy Degtyarev, [email protected] Stanislav Bozhenko, [email protected] Vladimir Kosyakov, [email protected] Nadezhda Myrsikova, [email protected]
Editorial & Production English Language Editions Russian Language Editions John Walsh, [email protected] Julia Prokopenko, [email protected] Nathan Gardener, [email protected] Andrey Pyatigorsky, [email protected] Caroline Messecar, [email protected] Julia Kryuchkova, [email protected] Design Olga Simkina, [email protected] Andrey Goncharov, [email protected] Yevgeny Grinkrug, [email protected]
EQUITY BROKERAGE
+7 (495) 788-0888
Head: Mark Temkin, [email protected]
MOSCOW LONDON NEW YORK Robert Noworyta Ken Williams Harold Warren
Direct: +1 (212) 453-3529 +7 (495) 723 7026 +44 (0)20 7562 8012
Trading: +1 (212) 557-4444 E-Mail: [email protected] E-Mail: [email protected] E-Mail: [email protected]