080318 修正 machine industry in japanjspmi.sakura.ne.jp/material/3/39/chapter1.pdf · 1. trend of...
TRANSCRIPT
1. Trend of the Machine Industry in Japan
1
1. Trend of the Machine Industry in Japan
1.1 Trend of the production, shipment, etc. of the machine industry
(1) Trend of the machine industry in the past five years
The production of the machine industry (excluding steel vessels and railway vehicles) in 2006 showed a high growth of 10.0% over the previous year. It can be pointed out that the factors behind this were the fact that in addition to the steady situation of transportation machines, the output of electronic parts and devices increased by 19.9% year on year and that information and communication machines, which had been sluggish in the past two years, entered upon a revival phase. The shipment was also favorable with an increase rate of 9.4%.
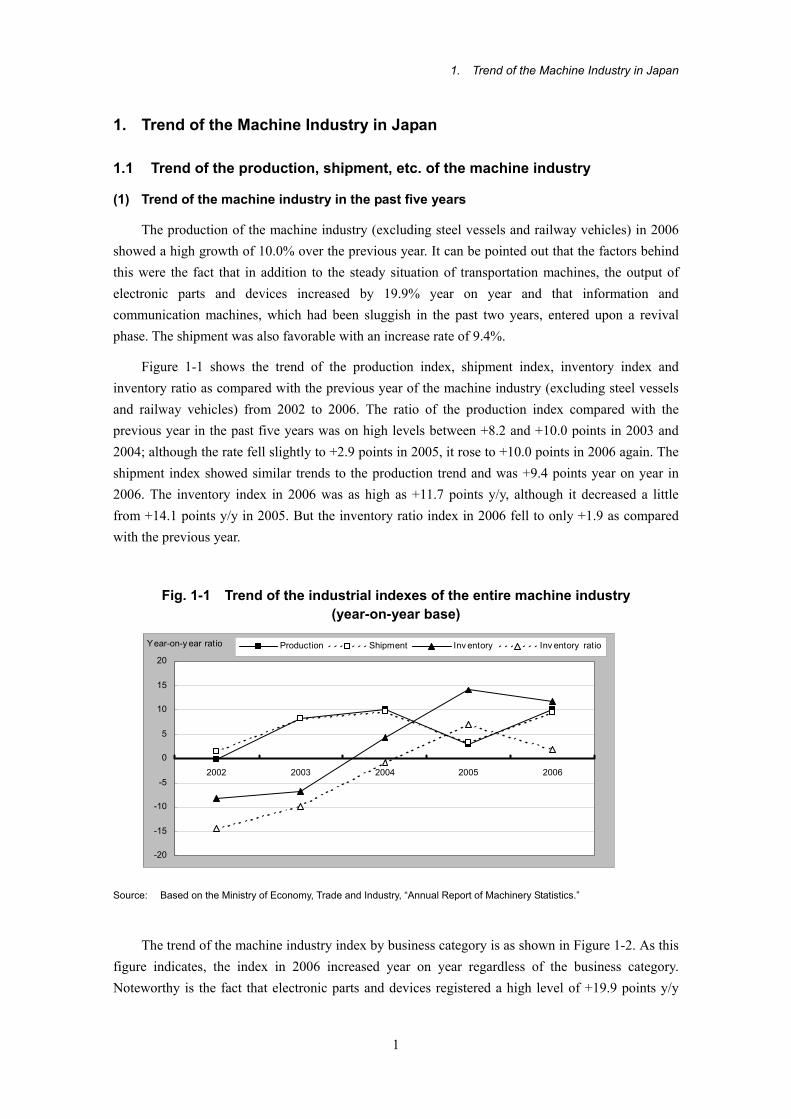
Figure 1-1 shows the trend of the production index, shipment index, inventory index and inventory ratio as compared with the previous year of the machine industry (excluding steel vessels and railway vehicles) from 2002 to 2006. The ratio of the production index compared with the previous year in the past five years was on high levels between +8.2 and +10.0 points in 2003 and 2004; although the rate fell slightly to +2.9 points in 2005, it rose to +10.0 points in 2006 again. The shipment index showed similar trends to the production trend and was +9.4 points year on year in 2006. The inventory index in 2006 was as high as +11.7 points y/y, although it decreased a little from +14.1 points y/y in 2005. But the inventory ratio index in 2006 fell to only +1.9 as compared with the previous year.
Fig. 1-1 Trend of the industrial indexes of the entire machine industry (year-on-year base)
Source: Based on the Ministry of Economy, Trade and Industry, “Annual Report of Machinery Statistics.”
The trend of the machine industry index by business category is as shown in Figure 1-2. As this figure indicates, the index in 2006 increased year on year regardless of the business category. Noteworthy is the fact that electronic parts and devices registered a high level of +19.9 points y/y
-20
-15
-10
-5
0
5
10
15
20
2002 2003 2004 2005 2006
Year-on-y ear ratio Production Shipment Inv entory Inv entory ratio

1. Trend of the Machine Industry in Japan
2
and that information and communication machines, which had had negative year-on-year ratios, showed +4.5 points in 2006, suggesting a noticeable recovery trend. Transportation machines achieved a stable growth, keeping a steady tendency with +8.0 points, while +6.0 points (general machines), +6.2 points (electric machines) and +6.6 points (precision machines) year on year, respectively.
Fig. 1-2 Trend of the production index of the machine industry by business category (year-on-year base)
Source: Same as that for Fig. 1-1.
Figures 1-3 and 1-4 show the trend of the production and shipment indexes of the machine industry (excluding steel vessels and railway vehicles) as a whole and by business category supposing that the figure for 2000 were 100. First, the production index of the entire machine industry entered an upward trend in 2004, stood at 109.5 points in 2005 and further increased to as much as 120.5 points in 2006.
Then for the production index by business category in 2006, the figure indicates that the index of electronic parts and devices substantially rose to 141.3 points. While transportation machines continued to keep a high level of 127.6 points, general machines also attained a high level of 114.2 points. More noteworthy is that precision machines, which had been below the 2000 level until 2005, registered 103.3 points in 2006, exceeding the 2000 mark first. Electric machines also showed a steady growth with 109.4 points. The only exception was information and communication machines; this sector’s index was 87.6 points, which was still below the 2000 level although a little higher than the figure for 2005.
-20
-15
-10
-5
0
5
10
15
20
25
2002 2003 2004 2005 2006
Year-on-y ear ratio
General machinesElectric machinesinf ormation and communication machinesElectronic parts and dev icesTransportation machinesPrecision machines

1. Trend of the Machine Industry in Japan
3
Fig. 1-3 Trend of the production index of the machine industry (2000=100)
Source: Same as that for Fig. 1-1.
The shipment index of the entire machine industry (excluding steel vessels and railway vehicles) in 2006 supposing the figure for 2000 to be 100 was 124.0 points, a higher level than in 2005. This suggested the favorable condition of this industry.
By business category, electronic parts and devices recorded a growth of 153.6 points in 2006, higher than the 129.5 points achieved in 2005, indicating that the industry of this sector was very buoyant. Transportation machines, general machines and electric machines enjoyed a stable growth, too, registering 117.9 points and 114.7 points, respectively. By contrast, information and communication machines and precision machines continued to suffer lower marks than the 2000 level with 92.7 points and 83.2 points, respectively.
70
75
80
85
90
95
100
105
110
115
120
125
130
135
140
145Production index(2000=100)
Machine industry(excluding steel v esselsand railway v ehicles)
89.4 96.7 106.4 109.5 120.5
General machines 81.9 87.8 102.4 107.7 114.2
Electric machines 87.3 92.5 101 103 109.4
inf ormation andcommunication machines
80.9 84.4 84 83.8 87.6
Electronic parts anddev ices
87.6 103.2 116.9 117.8 141.3
Transportation machines(excluding steel v esselsand railway v ehicles)
105.2 108.5 113.5 118.2 127.6
Precision machines 80.1 82.1 94.1 96.9 103.3
2002 2003 2004 2005 2006

1. Trend of the Machine Industry in Japan
4
Fig. 1-4 Trend of the shipment index of the machine industry (2000=100)
Source: Same as that for Fig. 1-1.
(2) Trend of the general machine industry
The production of the general machine industry (civil engineering and construction machines, special industrial machines, conveying and carrying machines, industrial robots, farm machines, metal machine tools, metal working machines, textile machines, office equipment, freezers and applied products, dies and other general machines) in 2006 registered +6.0 points year on year, achieving an increase for the fourth consecutive year. Main reasons for this are, as described later, that although office equipment suffered a substantial decline and freezers and applied products, conveying and carrying machines and other general machines decreased, civil engineering and construction machines remained favorable and special industrial machines, textile machines, etc. recovered greatly.
The production index, shipment index, inventory index and inventory ratio of the general machine industry in 2006 as compared with the previous year are as shown in Figure 1-5.
70
75
80
85
90
95
100
105
110
115
120
125
130
135
140
145
150
155Production index(2000=100)
Machine industry(excluding steel v esselsand railway v ehicles)
92.7 100.2 109.8 113.3 124
General machines 85 91.2 105.8 111.2 117.9
Electric machines 89.6 95.4 104.6 108.2 114.7
inf ormation andcommunication machines
85.6 89.1 91.9 90.1 92.7
Electronic parts anddev ices
90.8 109.1 124.6 129.5 153.6
Transportation machines(excluding steel v esselsand railway v ehicles)
104.9 108.3 113 116.4 126
Precision machines 80 76.3 81.6 81.7 83.2
2002 2003 2004 2005 2006

1. Trend of the Machine Industry in Japan
5
The year-on-year ratio of the production index of the general machine industry rose to +16.6 points in 2004 and remained on a relatively high level thereafter: +5.2 points in 2005 and +6.0 points in 2006. The shipment index showed a similar trend. The inventory index was +9.7 points y/y in 2005 but fell to +0.4 point in 2006, while the inventory ratio went down to +1.7 in 2006.
Fig. 1-5 Trend of industrial indexes of the general machine industry (year-on-year base)
Source: Same as that for Fig. 1-1.
The trend of the production index of the general machine industry by business category is as shown in Figure 1-6. As seen in this figure, office equipment registered -28.3 points y/y in 2006, a decline greater than in 2005, indicating this sector’s marked sluggishness. Freezers and applied products (-2.0 points), other general machines (-0.8 points) and conveying and carrying machines (-0.1 point) experienced a downward trend, too. On the other hand, civil engineering and construction machines (+14.7 points) kept a high level equivalent to that in 2005, and special industrial machines and textile machines registered over +12.0 points as compared with the figure for 2005, showing a good recovery tendency. Industrial robots achieved roughly the same points as in the previous year, and dies tended to recover somewhat. Metal machine tools managed to show a positive figure but decreased substantially to +2.4 points.
-25
-20
-15
-10
-5
0
5
10
15
20
2002 2003 2004 2005 2006
Year-on-y ear ratioProduction index Shipment indexInv entory index Inv entory ratio

1. Trend of the Machine Industry in Japan
6
Fig. 1-6 Trend of the production index of the general machine industry by business category (year-on-year base)
Source: Same as that for Fig. 1-1.
(3) Trend of the electric machine industry
Figure 1-7 shows the industrial indexes of the electric machine industry (rotary electric machines, stationary electric machines, switching devices and equipment, consumer electric machines, wiring/lighting appliances, electronic application devices, electric measuring instruments and batteries) as compared with the previous year. The production index and shipment index fell to +2.0 points in 2005 but were +6.2 points in 2006, suggesting signs of recovery. The shipment index in 2006 stood at +6.0 points, showing a similar trend to the production index. The inventory index had remained on a negative level of -0.8 point in 2005 but increased to +4.0 points in 2006. The inventory ratio entered a downward phase again.
-40
-30
-20
-10
0
10
20
30
40
50
2002 2003 2004 2005 2006
Year-on-y ear ratio
Civ il engineering and construction machines Special industrial machinesConv ey ing and carry ing machines Industrial robotsFarm machines Metal machine toolsMetal working machines Textile machinesOf f ice equipment Freezers and applied productsDies Other general machines

1. Trend of the Machine Industry in Japan
7
Fig. 1-7 Trend of industrial indexes of the electric machine industry (year-on-year base)
Source: Same as that for Fig. 1-1.
The trend of the production index of the electric machine industry by business category is as shown in Figure 1-8 (excluding wiring/lighting appliances). As seen in this figure, the year-on-year ratio of the indexes in 2006 were positive on the whole, and batteries recorded +11.9, a high-level equivalent to that in 2005. Electronic application devices were steady at +8.4 points, though smaller than in 2005. Stationary electric machines grew sharply from -7.1 points in 2005 to +7.4 points in 2006, while rotary electric machines recovered from a negative level to +5.3 points, too. Switching devices and equipment rose to +6.9 points. Consumer electric machines registered +1.2 points, showing an upward trend though not very powerful.
Fig. 1-8 Trend of the production index of the electric machine industry by business category (year-on-year base)
Source: Same as that for Fig. 1-1.
-15
-10
-5
0
5
10
15
2002 2003 2004 2005 2006
Year-on-y ear ratioProduction index Shipment indexInv entory index Inv entory ratio
-15
-10
-5
0
5
10
15
20
25
2002 2003 2004 2005 2006
Year-on-y ear ratio
Rotary electric machines Stationary electric machinesSwitching dev ices and equipment Consumer electric machinesElectronic application dev ices Batteries

1. Trend of the Machine Industry in Japan
8
(4) Trend of the information and communication machine industry
The trend of the industrial indexes of the information and communication machine industry (communication machines, consumer electronic machines and electronic computers) is shown in Figure 1-9. As seen from this figure, the industry registered a production index of +4.5 points y/y in 2006, achieving a positive figure first in three years. The shipment index was a negative one in 2005 but became +2.9 in 2006. By contrast, the inventory index rose to +9.5 points y/y in 2005 but entered a downward phase again in 2006 with -8.0 points. The inventory ratio jumped from -1.7 points in 2005 to +9.0 points in 2006.
Fig. 1-9 Trend of the industrial indexes of the information and communication machine industry (year-on-year base)
Source: Same as that for Fig. 1-1.
Figure 1-10 shows the trend of the production index of the information and communication machine industry by business category. As evident from this figure, consumer electronic machines showed a stable growth, rising to +12.7 points as compared with the previous year. Communication machines were still in a downward phase in 2005 but exhibited slight signs of recovery in 2006, registering +0.6 point. Similarly, electronic computers recorded +0.5 point, indicating a slow upward trend.
-25
-20
-15
-10
-5
0
5
10
15
2002 2003 2004 2005 2006
Year-on-y ear ratioProduction index Shipment indexInv entory index Inv entory ratio

1. Trend of the Machine Industry in Japan
9
Fig. 1-10 Trend of the production index of the information and communication machine industry by business category (year-on-year base)
Source: Same as that for Fig. 1-1.
(5) Trend of the electronic parts and device industry
Figure 1-11 shows the industrial indexes of the electronic parts and device industry. In 2006, this industry enjoyed a substantial increase in the production index of +19.9 points y/y, showing a recovering tendency. The shipment index moved in a similar way to the production index, increasing from +3.9 points y/y in 2005 to +18.6 points in 2006. The inventory index recorded a high after 2004, jumping from -2.3 points y/y in 2005 to +37.7 points in 2006. By contrast, the inventory ratio substantially fell from +17.7 points in 2005 to +6.4 points in 2006.
Fig. 1-11 Trend of the industrial indexes of the electronic parts and device industry (year-on-year base)
Source: Same as that for Fig. 1-1.
-25
-20
-15
-10
-5
0
5
10
15
20
2002 2003 2004 2005 2006
Year-on-y ear ratioCommunication machinesConsumer electronic machinesElectronic computers
-40
-30
-20
-10
0
10
20
30
40
50
2002 2003 2004 2005 2006
Year-on-y ear ratioProduction index Shipment indexInv entory index Inv entory ratio

1. Trend of the Machine Industry in Japan
10
The production index of the electronic parts and device industry by business category is as shown in Figure 1-12. The production index in 2006 as compared with the previous year turned positive in all the business categories. Integrated circuits showed an especially remarkable rise from -2.2 points in 2005 to +21.8 points in 2006. Semiconductor parts rose from +8.3 points in 2005 to +22.9 points in 2006, electronic parts, from +5.0 points in 2005 to +18.8 points in 2006, and semiconductor devices, from -8.2 points in 2005 to +9.7 points in 2006.
Fig. 1-12 Trend of the production index of the electronic parts and device industry by business category (year-on-year base)
Source: Same as that for Fig. 1-1.
(6) Trend of the transportation machine industry
Figure 1-13 shows the trend of the industrial indexes of the transportation machine industry. As seen in this figure, the production index registered a steady growth of +8.0 points in 2006. Similarly, the shipment index also rose from +3.0 points in 2005 to +8.2 points in 2006. On the other hand, the inventory index showed a substantial increase of +46.3 points in 2005 but fell to +12.3 points in 2006, while the inventory ratio decreased from +8.7 points in 2005 to +3.1 points in 2006.
-15
-10
-5
0
5
10
15
20
25
30
35
2002 2003 2004 2005 2006
Year-on-y ear ratioElectronic parts Semiconductor dev icesIntegrated circuits Semiconductor parts

1. Trend of the Machine Industry in Japan
11
Fig. 1-13 Trend of the industrial indexes of the transportation machine industry
Source: Same as that for Fig. 1-1.
The trend of the production index of the transportation machine industry is as shown in Figure 1-14. As the figure indicates, in 2006, passenger cars were more favorable at +11.4 points, and automotive parts were steady at +6.7 points. By contrast, two-wheeled vehicles declined from +12.8 points in 2005 to +2.3 points in 2006. Similarly, buses and industrial vehicles suffered decreases in 2006. Trucks were still sluggish.
Fig. 1-14 Trend of the production index of the transportation machine industry (year-on-year base)
Source: Same as that for Fig. 1-1.
-20
-10
0
10
20
30
40
50
2002 2003 2004 2005 2006
Year-on-y ear ratioProduction index Shipment indexInv entory index Inv entory ratio
-15
-10
-5
0
5
10
15
20
2002 2003 2004 2005 2006
Year-on-y ear ratioPassenger cars BusesTrucks Automotiv e partsTwo-wheeled v ehicles Industrial v ehicles
1. Trend of the Machine Industry in Japan
12
(7) Trend of the precision machine industry
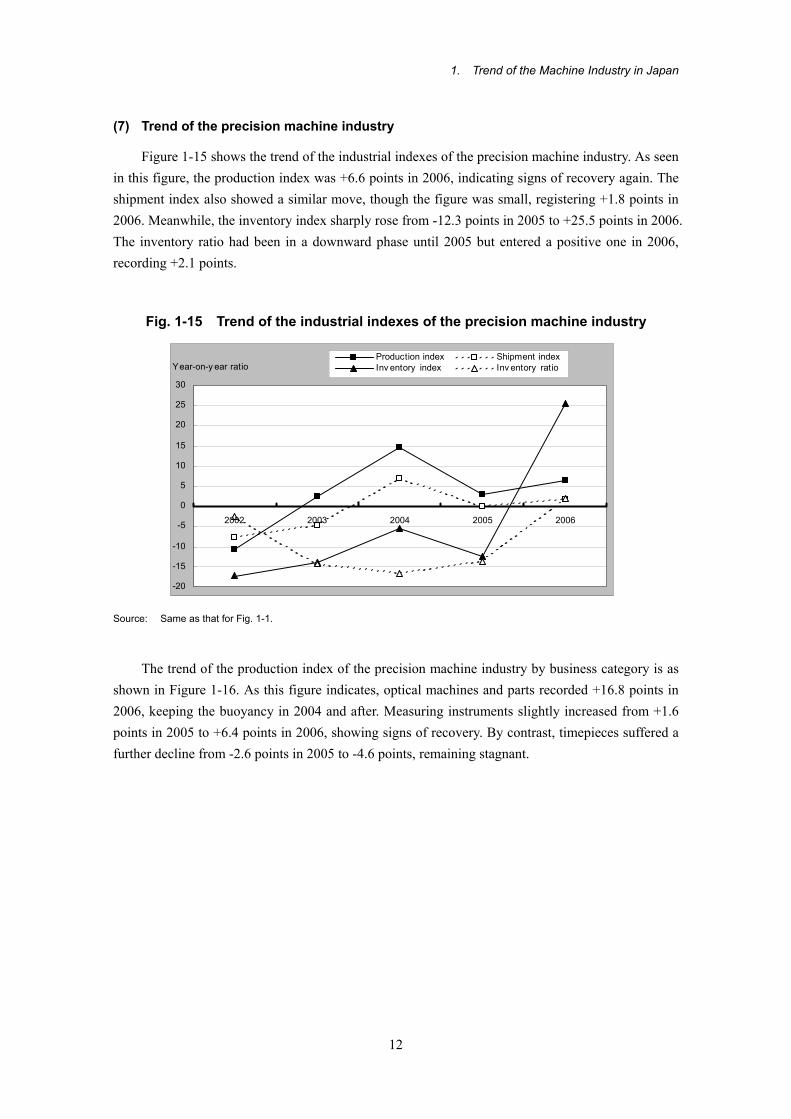
Figure 1-15 shows the trend of the industrial indexes of the precision machine industry. As seen in this figure, the production index was +6.6 points in 2006, indicating signs of recovery again. The shipment index also showed a similar move, though the figure was small, registering +1.8 points in 2006. Meanwhile, the inventory index sharply rose from -12.3 points in 2005 to +25.5 points in 2006. The inventory ratio had been in a downward phase until 2005 but entered a positive one in 2006, recording +2.1 points.
Fig. 1-15 Trend of the industrial indexes of the precision machine industry
Source: Same as that for Fig. 1-1.
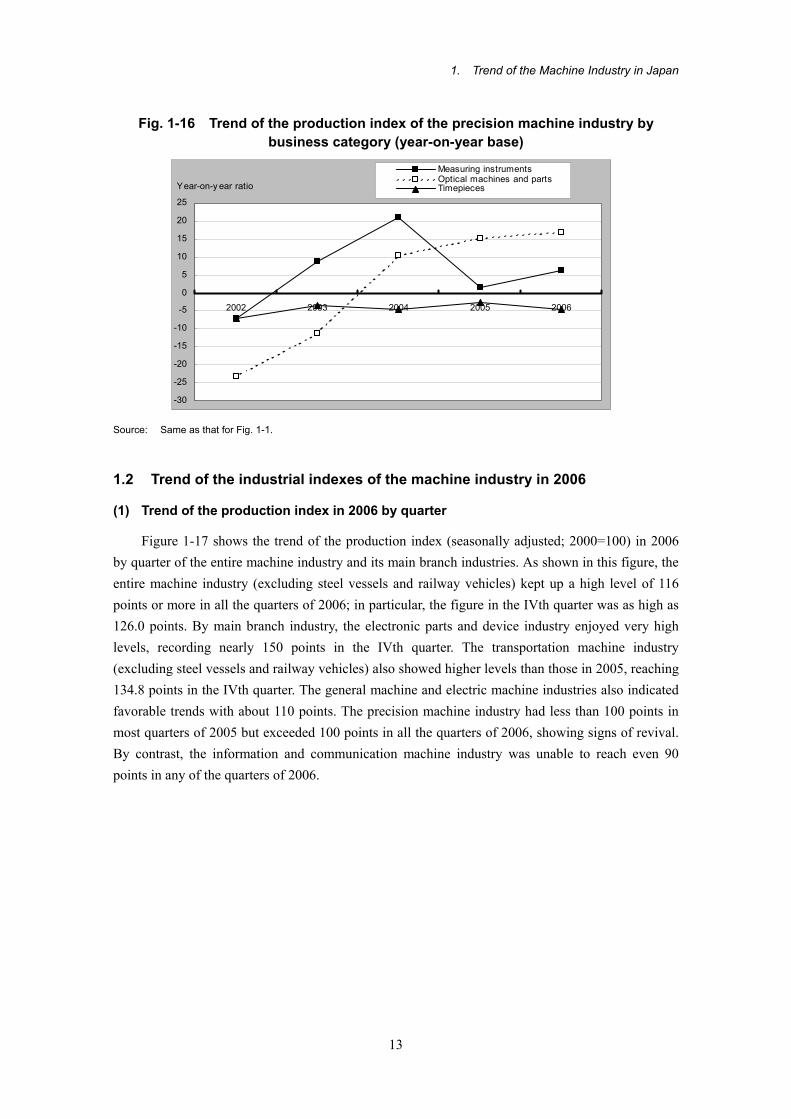
The trend of the production index of the precision machine industry by business category is as shown in Figure 1-16. As this figure indicates, optical machines and parts recorded +16.8 points in 2006, keeping the buoyancy in 2004 and after. Measuring instruments slightly increased from +1.6 points in 2005 to +6.4 points in 2006, showing signs of recovery. By contrast, timepieces suffered a further decline from -2.6 points in 2005 to -4.6 points, remaining stagnant.
-20
-15
-10
-5
0
5
10
15
20
25
30
2002 2003 2004 2005 2006
Year-on-y ear ratioProduction index Shipment indexInv entory index Inv entory ratio
1. Trend of the Machine Industry in Japan
13
Fig. 1-16 Trend of the production index of the precision machine industry by business category (year-on-year base)
Source: Same as that for Fig. 1-1.
1.2 Trend of the industrial indexes of the machine industry in 2006
(1) Trend of the production index in 2006 by quarter
Figure 1-17 shows the trend of the production index (seasonally adjusted; 2000=100) in 2006 by quarter of the entire machine industry and its main branch industries. As shown in this figure, the entire machine industry (excluding steel vessels and railway vehicles) kept up a high level of 116 points or more in all the quarters of 2006; in particular, the figure in the IVth quarter was as high as 126.0 points. By main branch industry, the electronic parts and device industry enjoyed very high levels, recording nearly 150 points in the IVth quarter. The transportation machine industry (excluding steel vessels and railway vehicles) also showed higher levels than those in 2005, reaching 134.8 points in the IVth quarter. The general machine and electric machine industries also indicated favorable trends with about 110 points. The precision machine industry had less than 100 points in most quarters of 2005 but exceeded 100 points in all the quarters of 2006, showing signs of revival. By contrast, the information and communication machine industry was unable to reach even 90 points in any of the quarters of 2006.
-30
-25
-20
-15
-10
-5
0
5
10
15
20
25
2002 2003 2004 2005 2006
Year-on-y ear ratio
Measuring instrumentsOptical machines and partsTimepieces

1. Trend of the Machine Industry in Japan
14
Fig. 1-17 Production index of the machine industry in 2006 by quarter
Source: Same as that for Fig. 1-1.
(2) Trend of the shipment index in 2006 by quarter
The shipment index (seasonally adjusted; 2000=100) in 2006 by quarter is as shown in Figure 1-18. As indicated in this figure, the entire machine industry (excluding steel vessels and railway vehicles) enjoyed remarkably favorable performance of about 120 points in all the quarters, registering nearly 130 points in the IVth quarter. By main branch industry, the electronic parts and device industry attained high levels in all the quarters and reached 160 points in the IVth quarter. The transportation machine industry (excluding steel vessels and railway vehicles) was always at over 120 points maintaining higher levels than those in 2005. The general machine and electric machine industries were also on high levels at 110-120 points. On the other hand, the precision machine industry showed some indications of recovery in the production index but was only at about 80 points in all the quarters in the shipment index, and went down in 78.7 points in the IVth quarter. Similarly, the information and communication machine industry had a little higher points than those in 2005 but was unable to return to the 2000 level staying only at the first half of the 90 point-range.
80
90
100
110
120
130
140
150Seasonally adjusted
index
Machine industry (excludingsteel v essels and railwayv ehicles)
116.2 118.5 121.2 126
General machines 109.6 115.4 114.3 117.5
Electric machines 107.5 107.7 110 112.5
Inf ormation andcommunication machines
86.1 87.2 88.3 88.5
Electronic parts and dev ices 136.2 135.8 143.8 149.1
Transportation machines(excluding steel v essels andrailway v ehicles)
123.5 124.7 127.9 134.8
Precision machines 100.3 101.4 105.8 105.4
Ist quarter IInd quarter IIIrd quarter IVth quarter

1. Trend of the Machine Industry in Japan
15
Fig. 1-18 Shipment index of the machine industry in 2006 by quarter
Source: Same as that for Fig. 1-1.
1.3 Situation of capital investment of the machine industry
(1) Situation of capital investment of the general machine industry
Figure 1-19 shows the situation of capital investment of the general machine industry from the Ist quarter of 2005 to the Ist quarter of 2007. As evident from this figure, the capital investment of the general machine industry decreased to ¥227.7 billion in the IInd quarter of 2005 but thereafter entered an upward phase again; it increased to ¥413.5 billion in the Ist quarter of 2006 and then to ¥521.9 billion in the Ist quarter of 2007. From this it is supposed that from 2005 to 2006, the investment of the general machine industry had cyclic changes but entered an upward phase as a result of very vigorous investment activities.
70
80
90
100
110
120
130
140
150
160Seasonally adjusted
index
Machine industry(excluding steel v esselsand railway v ehicles)
119.7 122.7 125.3 128
General machines 113.7 119.5 117.7 120.5
Electric machines 113.3 113.2 115.2 116.9
Inf ormation andcommunication machines
90.3 91.4 94.7 93.8
Electronic parts anddev ices
147.6 147.9 157.8 160
Transportation machines(excluding steel v esselsand railway v ehicles)
122.1 124.9 126.5 131.2
Precision machines 84.4 84.4 84.7 78.7
Ist quarter IInd quarter IIIrd quarter IVth quarter

1. Trend of the Machine Industry in Japan
16
Fig. 1-19 Situation of capital investment of the general machine industry
Note: Increase rate figures are those as compared with the same quarter of the previous year. Source: Based on the Ministry of Finance, “Statistical Survey of Incorporated Enterprises.”
(2) Situation of capital investment of the electric machine industry
Figure 1-20 shows the situation of the capital investment of the electric machine industry from the Ist quarter of 2005 to the Ist quarter of 2007 (The sum of the investment in electric machines and information and communication machines is used). As seen in the figure, the capital investment of the electric machine industry substantially increased to ¥1,115.2 billion in the Ist quarter of 2006 and then entered an upward phase, reaching a very high level of ¥1,283.8 billion in the Ist quarter of 2007. This suggests that the industry’s capital investment activities have become more positive.
Fig. 1-20 Situation of capital investment of the electric machine industry
Source: Same as that for Fig. 1-19.
3,115
2,277
3,018
3,5623,785
4,230
5,219
2,772
4,135
-6.7
34.2
40.4
32.8
25.4
18.8
42.1
21.726.2
0
1,000
2,000
3,000
4,000
5,000
6,000
Ist Q2005
IInd Q2005
IIIrd Q2005
IVth Q2005
Ist Q2006
IInd Q2006
IIIrd Q2006
IVth Q2006
Ist Q2007
-10
0
10
20
30
40
50Inv estmentIncrease rate
Investment (¥100 million) Increase rate (%)
9,683
7,820 8,002
11,152
9,782
12,83812,178
9,2829,740
3.2 2.1
-8.5
-1.7
15.2
25.121.7
31.2
15.1
0
2,000
4,000
6,000
8,000
10,000
12,000
14,000
Ist Q2005
IInd Q2005
IIIrd Q2005
IVth Q2005
Ist Q2006
IInd Q2006
IIIrd Q2006
IVth Q2006
Ist Q2007
-15
-10
-5
0
5
10
15
20
25
30
35Inv estmentIncrease rate
Investment (¥100 million) Increase rate (%)

1. Trend of the Machine Industry in Japan
17
(3) Situation of capital investment of the transportation machine industry
Figure 1-21 shows the situation of the capital investment of the transportation machine industry from the Ist quarter of 2005 to the Ist quarter of 2007. In this industry, the amount of investment was ¥925.4 billion in the Ist quarter of 2005 and reached ¥1,024.2 billion in the Ist quarter of 2006 after repeating increases and decreases. But in the IInd quarter of 2006 and after, this industry’s investment decreased to the ¥600.0-700.0 billion mark and also showed marked slowdowns on year-on-year base. In the Ist quarter of 2007, the investment was expanded again to ¥1,066.4 billion, keeping the cyclic characteristic of investment activities concentrated in the Ist quarter.
Fig. 1-21 Situation of capital investment of the transportation machine industry
Source: Same as that for Fig. 1-19.
1.4 Situation of export of the machine industry
(1) Situation of export of the entire machine industry
Figure 1-22 shows the trend of the amount and growth rate (year-on-year) of the export of machines and equipment (general machines, electric machines, transportation machines and precision machines) from 2002 to 2006. As this figure indicates, the export of machines and equipment was on the ¥37,500.0 billion mark in 2002 and grew to the ¥43,700.0 billion mark in 2004. It continued high growth thereafter and reached nearly ¥51,700.0 billion in 2006.
9,254
8,047
10,664
8,773
10,242
5,620 6,328
7,461 7,694
18.9
34.5
49.1
10.7 12.6
-4.4
4.1
-15
21.8
0
2,000
4,000
6,000
8,000
10,000
12,000
Ist Q2005
IInd Q2005
IIIrd Q2005
IVth Q2005
Ist Q2006
IInd Q2006
IIIrd Q2006
IVth Q2006
Ist Q2007
-20
-10
0
10
20
30
40
50
60Inv estmentIncrease rate
Investment (¥100 million) Increase rate (%)

1. Trend of the Machine Industry in Japan
18
Fig. 1-22 Situation of export of machines and equipment
Note: Growth rate figures are those as compared with the previous year. Source: Based on the Japan External Trade Organization (JETRO), “Trade Statistics Data Base.”
(2) Situation of export of general machines
Figure 1-23 shows the situation of export of general machines. As seen in this figure, the export of these machines greatly decreased by -24.61% y/y to ¥7,633.1 billion in 2002. But it favorably entered a revival phase after that and expanded to the ¥10 trillion level in 2005 and to about ¥12 trillion in 2006, which suggests that the general machine industry’s ability to export became greater.
Fig. 1-23 Situation of export of general machines
Source: Same as that for Fig. 1-22.
375,416 392,968437,001 456,820
516,989
5.684.54
13.7
11.21
4.68
0
50,000
100,000
150,000
200,000
250,000
300,000
350,000
400,000
450,000
500,000
550,000
2002 2003 2004 2005 20060
5
10
15
20Export amountGrowth rate
Total export (¥100 million) Growth rate (%)
76,33184,110
99,791 107,114120,457
10.19
18.64
12.467.34
-24.61
0
20,000
40,000
60,000
80,000
100,000
120,000
140,000
2002 2003 2004 2005 2006-30
-25
-20
-15
-10
-5
0
5
10
15
20
25Export amountGrowth rate
Total export (¥100 million) Growth rate (%)

1. Trend of the Machine Industry in Japan
19
(3) Situation of export of electric machines
Figure 1-24 shows the situation of export of electric machines. As evident from this figure, the export of electric machines in 2005 was ¥15,400.0 billion and tended to stagnate. But in 2006, it recorded a high level of nearly ¥17 trillion and the growth rate was 9.54%, the highest after 2003. Thus it is considered that there has been a growing tendency for the electric machine industry to regain the ability to export.
Fig. 1-24 Situation of export of electric machines
Source: Same as that for Fig. 1-22.
(4) Situation of export of transportation machines
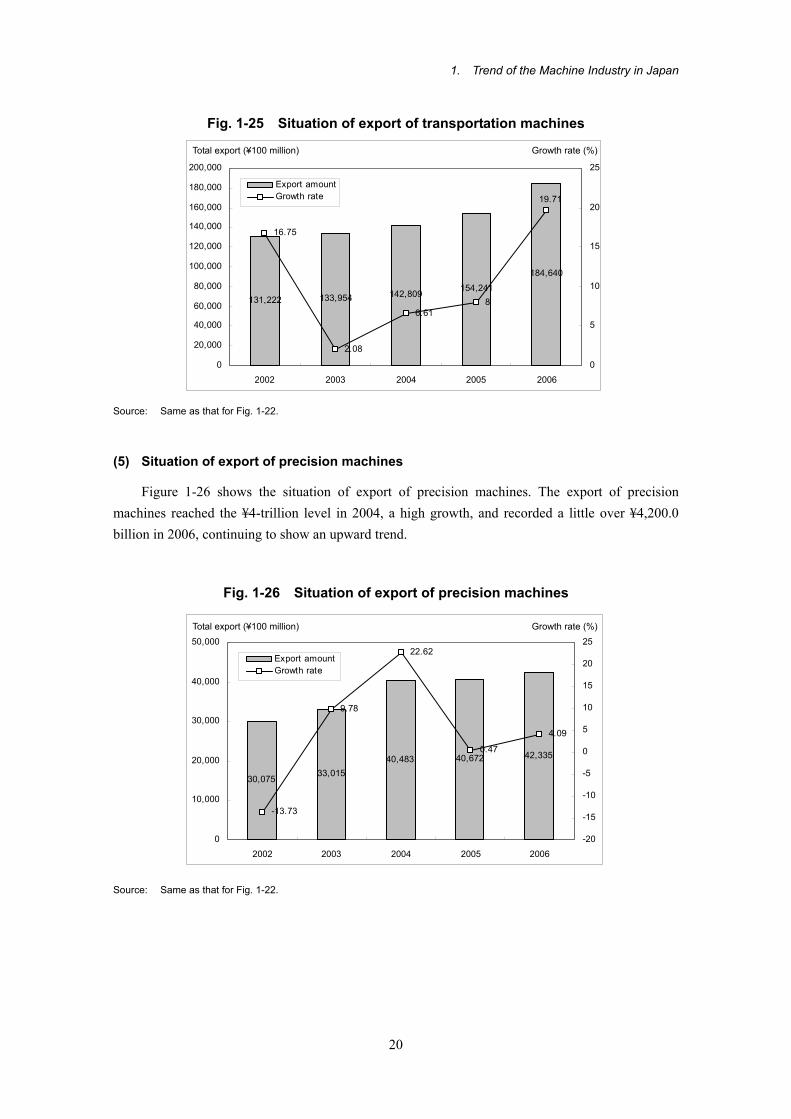
Figure 1-25 shows the situation of export of transportation machines. The export of these machines had lower growth rates in 2002 and after, but in 2006 increased to nearly ¥18,500.0 billion and the growth rate reached 19.71%, too.
137,789 141,889153,918 154,793
169,556
2.980.57
9.54
29.08
8.48
0
20,000
40,000
60,000
80,000
100,000
120,000
140,000
160,000
180,000
2002 2003 2004 2005 2006
0
5
10
15
20
25
30
35Export amountGrowth rate
Total export (¥100 million) Growth rate (%)
1. Trend of the Machine Industry in Japan
20
Fig. 1-25 Situation of export of transportation machines
Source: Same as that for Fig. 1-22.
(5) Situation of export of precision machines
Figure 1-26 shows the situation of export of precision machines. The export of precision machines reached the ¥4-trillion level in 2004, a high growth, and recorded a little over ¥4,200.0 billion in 2006, continuing to show an upward trend.
Fig. 1-26 Situation of export of precision machines
Source: Same as that for Fig. 1-22.
131,222 133,954 142,809154,241
184,640
16.75
2.08
6.618
19.71
0
20,000
40,000
60,000
80,000
100,000
120,000
140,000
160,000
180,000
200,000
2002 2003 2004 2005 2006
0
5
10
15
20
25
Export amountGrowth rate
Total export (¥100 million) Growth rate (%)
30,07533,015
40,483 40,672 42,335
-13.73
9.78
22.62
0.47
4.09
0
10,000
20,000
30,000
40,000
50,000
2002 2003 2004 2005 2006
-20
-15
-10
-5
0
5
10
15
20
25
Export amountGrowth rate
Total export (¥100 million) Growth rate (%)
1. Trend of the Machine Industry in Japan
21
1.5 Situation of import of the machine industry
(1) Situation of import of the entire machine industry
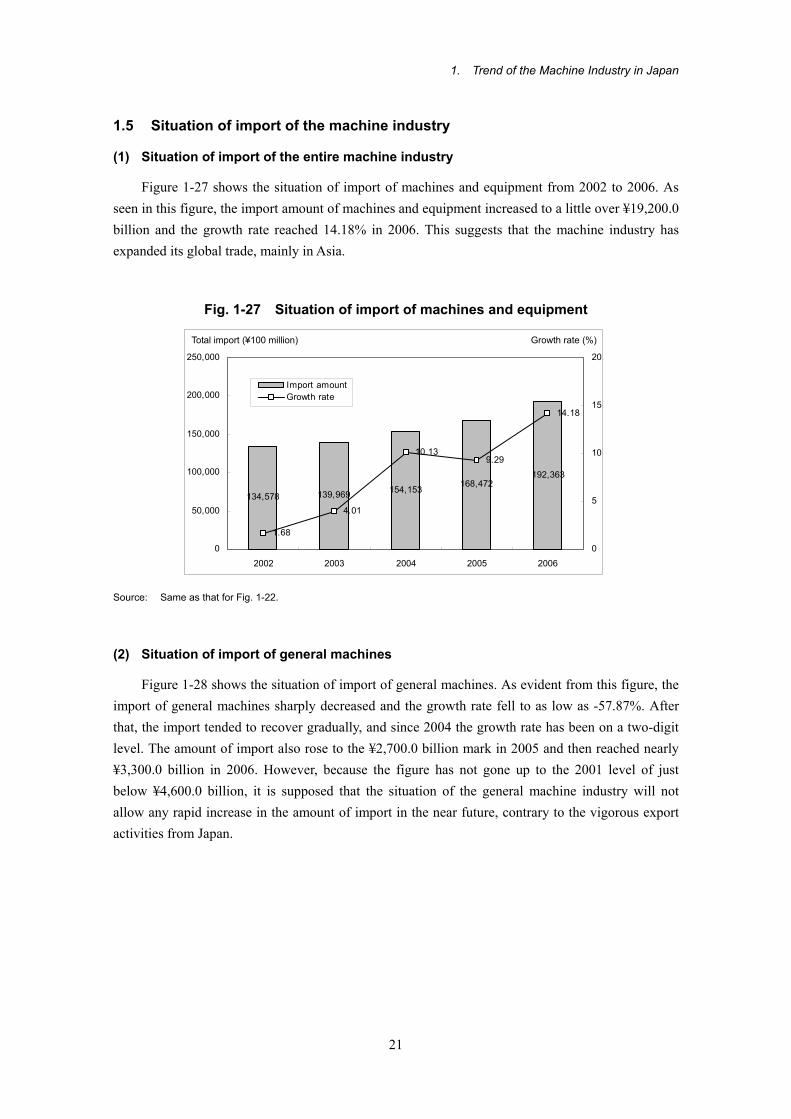
Figure 1-27 shows the situation of import of machines and equipment from 2002 to 2006. As seen in this figure, the import amount of machines and equipment increased to a little over ¥19,200.0 billion and the growth rate reached 14.18% in 2006. This suggests that the machine industry has expanded its global trade, mainly in Asia.
Fig. 1-27 Situation of import of machines and equipment
Source: Same as that for Fig. 1-22.
(2) Situation of import of general machines
Figure 1-28 shows the situation of import of general machines. As evident from this figure, the import of general machines sharply decreased and the growth rate fell to as low as -57.87%. After that, the import tended to recover gradually, and since 2004 the growth rate has been on a two-digit level. The amount of import also rose to the ¥2,700.0 billion mark in 2005 and then reached nearly ¥3,300.0 billion in 2006. However, because the figure has not gone up to the 2001 level of just below ¥4,600.0 billion, it is supposed that the situation of the general machine industry will not allow any rapid increase in the amount of import in the near future, contrary to the vigorous export activities from Japan.
134,578 139,969 154,153168,472
192,363
1.68
4.01
10.139.29
14.18
0
50,000
100,000
150,000
200,000
250,000
2002 2003 2004 2005 20060
5
10
15
20
Import amountGrowth rate
Total import (¥100 million) Growth rate (%)

1. Trend of the Machine Industry in Japan
22
Fig. 1-28 Situation of import of general machines
Source: Same as that for Fig. 1-22.
(3) Situation of import of electric machines
The import of electric machines in Figure 1-29 shows that favorable growth was achieved, though not to the extent of the sharp increase in 2002, and that the import reached ¥10,700.0 billion in 2006. This suggests that the global trade of the electric machine industry was growing very brisk.
Fig. 1-29 Situation of import of electric machines
Source: Same as that for Fig. 1-22.
(4) Situation of import of transportation machines
The situation of import of transportation machines in Figure 1-30 shows that the import reached the ¥2-trillion level in 2005 and registered a stable growth rate thereafter, too, and that the figure
19,341 20,17123,562
27,00332,887
-57.87
21.7916.81
14.6
4.29
0
10,000
20,000
30,000
40,000
2002 2003 2004 2005 2006-70
-60
-50
-40
-30
-20
-10
0
10
20
30
Import amountGrowth rate
Import amount (¥ 100 million) Growth rate (%)
78,585 81,42189,575
96,257107,194
3.61
10.017.45
11.36
48.15
10,000
30,000
50,000
70,000
90,000
110,000
2002 2003 2004 2005 2006
0
10
20
30
40
50
60Import amountGrowth rate
Import amount (¥ 100 million) Growth rate (%)

1. Trend of the Machine Industry in Japan
23
came up to nearly ¥2,300.0 billion in 2006. It is considered that the tendency like this suggests more active global trade in the transportation industry and diversified needs in the domestic market.
Fig. 1-30 Situation of import of transportation machines
Source: Same as that for Fig. 1-22.
(5) Situation of import of precision machines
As Figure 1-31 shows, the import of precision machines recorded a growth rate of over 10% in 2004 and after. The amount of import reached a little over ¥2,400.0 billion in 2005 and then approached ¥3 trillion in 2006 with a growth rate of 21.28%.
Fig. 1-31 Situation of import of precision machines
Source: Same as that for Fig. 1-22.
18,003 18,956 19,515 20,98422,897
22.26
5.29
2.95
7.53 9.12
0
5,000
10,000
15,000
20,000
25,000
2002 2003 2004 2005 20060
5
10
15
20
25Import amountGrowth rate
Import amount (¥ 100 million) Growth rate (%)
18,64921,501
24,22729,384
19,421
12.68
21.28
-0.19
10.71
4.14
0
5,000
10,000
15,000
20,000
25,000
30,000
35,000
2002 2003 2004 2005 2006-5
0
5
10
15
20
25
Import amountGrowth rate
Import amount (¥ 100 million) Growth rate (%)