074-2007: predictive modeling in higher education · predictive modeling in higher education tom...
TRANSCRIPT
Paper 074-2007
Predictive Modeling in Higher Education Tom Bohannon, Baylor University
ABSTRACT Data mining can be defined as advanced methods for exploring and modeling relationships in large amounts of data. Data mining has been used by universities in a number of areas, including but not limited to enrollment management, retention and graduation analysis, donation prediction, and faculty retention. This presentation will provide an overview of the data mining process, with an emphasis on its use in predictive modeling in higher education.
INTRODUCTION This paper will discuss the various application of predictive modeling in higher education. The paper will concentrate on enrollment management, retention analysis, and donor giving. An analytic objective, a description of variables in the modeling process, as well as the process of constructing the data set will be discussed.
ENROLLMENT MANAGEMENT MODELS The development of enrollment prediction models has been an integral part in higher education for many years. These models have become an important source of information for recruiters and administrator as they try to meet the enrollment goals of the institution. The recruitment and enrollment process is composed of the following stages at Baylor University, they are: inquiry, application, accepted, deposit, net deposit, and enrollment. This paper will discuss building a predictive model that produces the likelihood of a student moving from the inquiry stage to the net deposit stage. Enrollment inquiry predictive models are employed in the early fall semester to score students and student scores are updated until the following fall semester. Another model that is built finds the likelihood of a student moving from accepted to enrollment. Models from any two stages could be build and utilized by administrators. Note that at each stage of this process there is more information available for modeling proposes. Today’s college applicants are more knowledgeable than applicants in previous years. Easy access to information about colleges, online applications, low application fees, and increased opportunity for financial aid and scholarships has made recruiting much more difficult. Because of this, students are applying to several schools, some as many as twenty or more. In many cases, these students are shopping for the best package. All of these changes illustrate the importance of predictive modeling in assisting college administrators secure a class of students with desirable qualities. At Baylor University, predictive modeling is utilized in the recruitment process to assign resources to meet the universities enrollment goals. The predictive modeling process at Baylor University for enrollment begins with building an inquiry model for the upcoming fall semester, from last year’s data. The inquiry pool of over a hundred thousand names is formed by purchasing lists of students from various sources and combining those names with university lists. Early in the process, very little is known about these applicants and their records are updated during the next ten to eleven months. These inquiries will be scored from a model built on previous year’s data. This model will produce a score in a range of 0 to 1 for each applicant, which can be interpreted as the likelihood to enroll. These scores are used to rank students to be used by recruitment and admissions in their communications and other decision making processes. In this manner, these scores are used to leverage resources in such a manner as to provide the greatest benefit. As noted, the model for scoring the current year’s inquiry pool is build from last year’s results. Certainly, the modeler will want to evaluate last year’s model in terms of performance. What was the distribution of scores of those students who enrolled as compared to the distribution of scores of those students who didn’t enroll?
To accomplish all the tasks associated with a data mining project, Baylor University selected SAS
to perform the modeling tasks and utilized the SAS System to build the data set and score applicants. This was a logical decision, since the Office of Institutional Research and Testing (IRT) at Baylor University had been a SAS user for over twenty years. The most time consuming task is building the data set, this includes defining the target variable and identifying variables that are potential predictors. The majority of the work associated with building the data set is accomplished outside of SAS Enterprise Miner and then brought into SAS Enterprise Miner for modeling. This is the case for all of modeling projects that will be discussed n this paper.
1
SAS Global Forum 2007 Data Mining and Predictive Modeling

In this paper, we will build a predictive model for the 2006 Texas inquiries and discuss some of the features of SAS
. Research and past experience indicates that behaviors of instate and out-of-state students are different in terms of enrollment. Thus, a model for Texas students and a model for out of state students are build each fall. The diagram below shows a process flow used to accomplish data mining tasks associated with this project.
In this illustration, the inquiry Texas data set for 2006 contained 65,179 observations and the percentage of students that enrolled as new freshmen was about 3%. In this example, we have over sampled to achieve a target value of 1 to be about 15%. The code used to create this new dataset in the SAS Code node and in the diagram is labeled, Build Inq_Tex_Sub and is a source of documentation for the project. The graphic below illustrates some of the exploratory capability of SAS . Note that in the bar chart for Net_Deposit_IND, which is the target variable, the bar for 1 has been selected and the other variable charts shows the distribution of 1’s. These charts indicate that Premiere and Stuemail are probably good predictors. Below is a list and description of some of the variable used in the modeling process.
2
SAS Global Forum 2007 Data Mining and Predictive Modeling

3
SAS Global Forum 2007 Data Mining and Predictive Modeling

Following the Data Node in the process flow, a transform node is used to perform some transformations on variables. This is followed by the impute node which imputes values for missing values. There any number of imputation methods to choose from, most of the time changing methods yield very little difference in the model results. In this illustration, the tree method is used for both interval and class variables. The Tree Node precedes the Imputation Node, since it handles missing values without omitting the observations with missing values. In this process flow, there are four models being run: a decision tree, a backward regression, a stepwise regression, and a neural network. The neural network has no variable selection procedure and is using the variables selected by stepwise regression to build a model. Each model node provides results that help you evaluate the model, below are results for the Decision Tree Node.
Expanding the Fit Statistics panel, allows examination of various fit statistics for both training and validation datasets.
4
SAS Global Forum 2007 Data Mining and Predictive Modeling

Enlarging the Tree panel and reducing the tree view, yields the graphic below. This shows the variables and values that were used for the splits. One of the nice features of a decision tree is that it produces a series of if-then statements indicating the splitting criteria.
- Below is a portion of the Output report, which lists variable importance.
Each model produces a reports showing similar statistics, these statistics are compiled by the Model Comparison Node and allows the user to easily compare models. Below are some reports and graphs produced by this node.
5
SAS Global Forum 2007 Data Mining and Predictive Modeling

For these models there appears to be very little difference between them and in cases like this a model is chosen based on simplicity or previous experience with models of that type. In this case, backward logistic regression was chosen and the variables selected are shown below. In the process flow diagram, the Model Comparison node is used to select the model for scoring. Inquires from Texas in 2007 are scored by this model and a separate model for out of state inquires.
6
SAS Global Forum 2007 Data Mining and Predictive Modeling

The scoring code produced by his model will now be placed in production and used to score inquiries. As noted, these inquiry scores will be updated nightly. These results are posted in our warehouse for web access by recruiters and administrators.
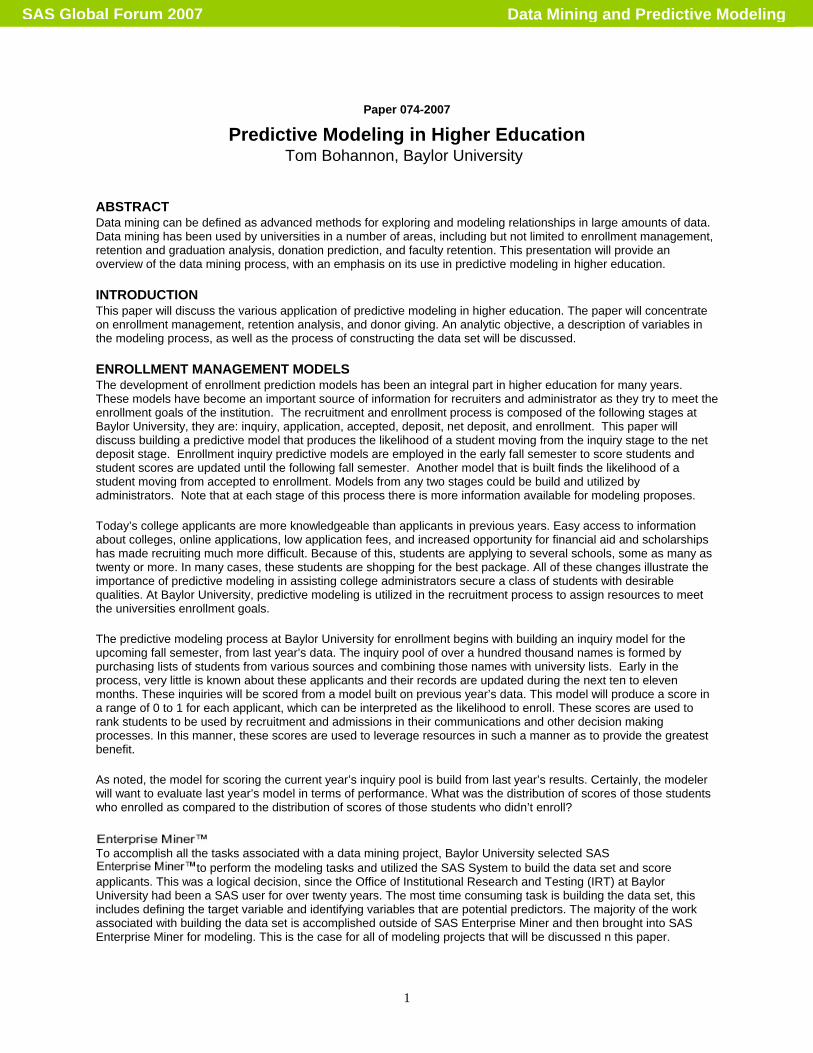
RETENTION MODELS Retention of enrolled students at institutions of higher education is a high priority of college administrators nationally. Resources are allocated to service areas in universities to counsel with students on academic and personal matters, with the goal of helping students and improving retention rates. To assist these service areas at Baylor University, predictive models are constructed to identify those students who are most likely not to return for a specified semester. These models are built for fall to spring retention, fall to fall retention, and spring to fall retention. This paper will discuss the construction a model for predicting those new freshmen enrolling in Fall 2006 and enrolled in Spring 2007, who will most likely not enroll in Fall 2008. Since athletes and provisional students are automatically assigned to academic counseling services, these students were excluded from the analysis. The modeling data set is constructed from the previous two year’s data, that is, the fall 2005 and 2006 freshmen who enrolled in following spring. The modeler has more information to use in the modeling process for these freshmen who enrolled in the spring semester. In addition to information that was available at enrollment, information gathered during the fall semester can be utilized in the modeling process. The information includes hours attempted, courses taken, courses dropped, hours earned, GPA, and engagement in social activities. Variables are now created related to retention, such as; retention of students by major, retention of students by high school, did they request an official transcript, and difficulty index for spring enrolled courses. Below is a partial list of potential predictor variables and the flow process used in the model building process.
7
SAS Global Forum 2007 Data Mining and Predictive Modeling
8
SAS Global Forum 2007 Data Mining and Predictive Modeling

The two regression models appear to be performing about the same. The stepwise model was chosen for this application and the parameter estimates are shown below. The variables chosen are: difficultly of courses taken in the fall, fall GPA, high school retention rate, and did the students request an official transcript.
The table below shows correct and incorrect classifications and yields a misclassification rate of about 26%.
9
SAS Global Forum 2007 Data Mining and Predictive Modeling

The pie chart below shows a measure of the contribution of each of the variables towards prediction.
Fall 2006 new freshmen who enrolled in Spring 2007 will now be scored by this model and this information will be used determining communications to students regarding counseling. In fall 2007, this model will be evaluated how well the model predicted students that would return and those that would not return.
UNIVERSITY DEVELOPMENT MODELS The majority of nonprofit organizations rely heavily on donor contributions to carry out activities supporting their mission. Because of the large number of these nonprofit organizations and their increased efforts in fundraising, it is becoming more difficult for nonprofit organizations to meet their fundraising goals. Predictive modeling offers a methodology for identifying individuals or households most likely to make a contribution to the organization. Universities have built in prospect pools composed of graduates, parents, friends of the university, and past donors and thus do not have to purchase lists of prospective donors. However, in some cases these lists may be purchased to supplement their existing prospect pool. Universities have fairly detailed demographic information on their past students, and past donors. Other information such as major, degree, university functions attended, membership in university clubs or organizations is also useful in modeling. Information such as job profession, income, home value, and other measures of wealth may be purchased.
10
SAS Global Forum 2007 Data Mining and Predictive Modeling
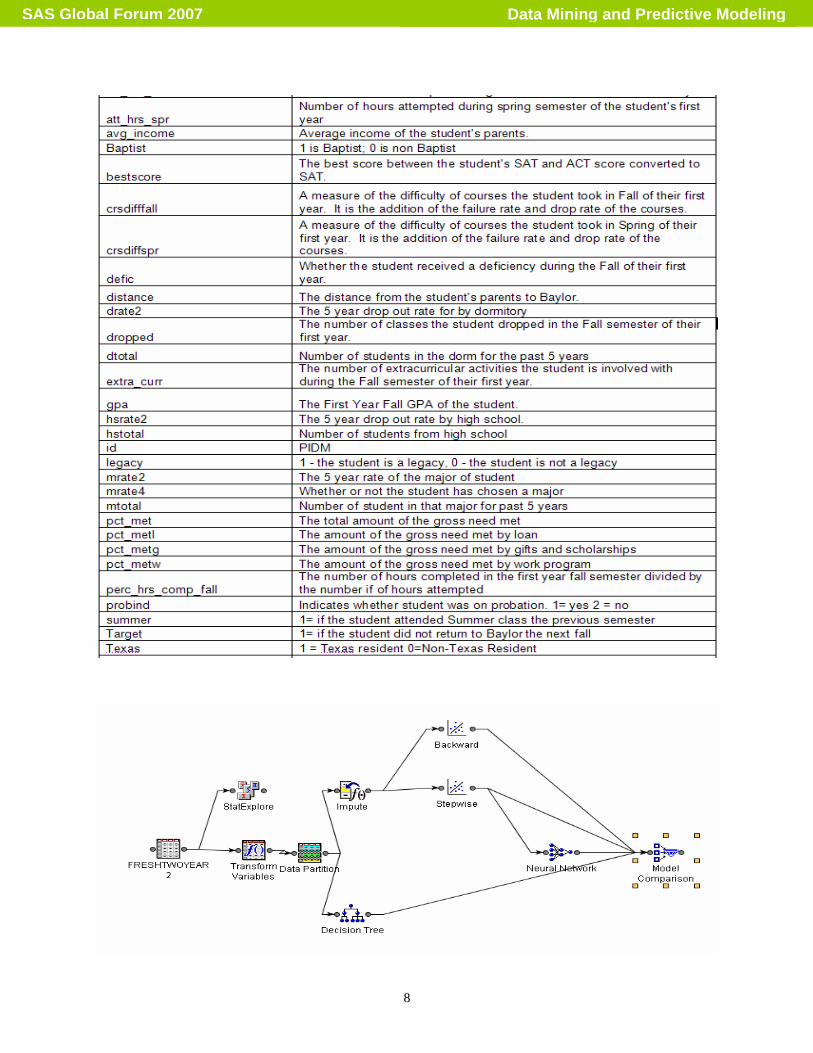
The giving history of donors in the data base provides richest information for building predictive variables, but variables in the database can be used to identify new donors. At Baylor University, several models have been built or will be built to assist in decisions regarding fundraising. These models are: annual giving model, retention model for donors, major gift donor model, reactivation model, two-stage model, and new acquisition model. This paper will discuss the retention model and the construction of predictive variables for this model. Household was the modeling unit used to construct donor predictive models; this unit consists of a primary and a secondary donor in a household or just a primary donor. This study only considered donations from households and not donations from other organizations. This paper examines the model built from data in the database from 2005 and back ten years. The target variable was defined by if a household made a donation in 2005 or not. There were a total of 96 possible fields in the modeling dataset. These fields or variables can be placed into one of the following categories: biographic or demographic, contact information, degree information, activities, gift information, and external rating information.
In the diagram below, the stepwise regression model was chosen to score the prospective donors for 2006. Again, by examining the ROC chart and other comparison statistics, there appears to be very little difference in these models. These scores were used by the Development Office to assign resources for communication with donors with low scores. Donors who gave in 2005 and had given in the first six months of 2006 were ranked by these scores and assigned to development officers for follow up. By using scores in this manner, retention rates of various donor segments should improve.
11
SAS Global Forum 2007 Data Mining and Predictive Modeling

12
SAS Global Forum 2007 Data Mining and Predictive Modeling
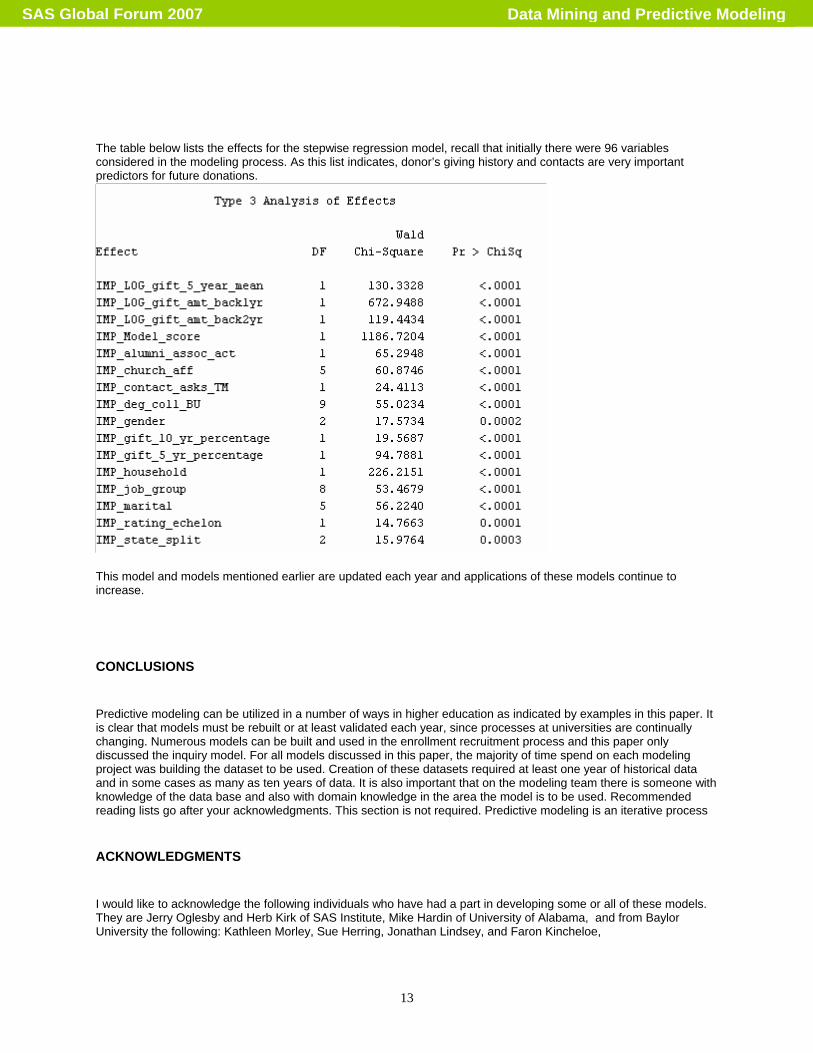
The table below lists the effects for the stepwise regression model, recall that initially there were 96 variables considered in the modeling process. As this list indicates, donor’s giving history and contacts are very important predictors for future donations.
This model and models mentioned earlier are updated each year and applications of these models continue to increase.
CONCLUSIONS
Predictive modeling can be utilized in a number of ways in higher education as indicated by examples in this paper. It is clear that models must be rebuilt or at least validated each year, since processes at universities are continually changing. Numerous models can be built and used in the enrollment recruitment process and this paper only discussed the inquiry model. For all models discussed in this paper, the majority of time spend on each modeling project was building the dataset to be used. Creation of these datasets required at least one year of historical data and in some cases as many as ten years of data. It is also important that on the modeling team there is someone with knowledge of the data base and also with domain knowledge in the area the model is to be used. Recommended reading lists go after your acknowledgments. This section is not required. Predictive modeling is an iterative process
ACKNOWLEDGMENTS
I would like to acknowledge the following individuals who have had a part in developing some or all of these models. They are Jerry Oglesby and Herb Kirk of SAS Institute, Mike Hardin of University of Alabama, and from Baylor University the following: Kathleen Morley, Sue Herring, Jonathan Lindsey, and Faron Kincheloe,
13
SAS Global Forum 2007 Data Mining and Predictive Modeling

CONTACT INFORMATION Your comments and questions are valued and encouraged. Contact the author at:
Tom Bohannon Baylor University Robinson Tower, Institutional Research Waco, Texas 76798 Work Phone: 254-710-2061 Fax: 254-710-2062 E-mail: [email protected]
SAS and all other SAS Institute Inc. product or service names are registered trademarks or trademarks of SAS Institute Inc. in the USA and other countries. ® indicates USA registration. Other brand and product names are trademarks of their respective companies.
14
SAS Global Forum 2007 Data Mining and Predictive Modeling