070515 ubs miami
TRANSCRIPT

4th UBS Latin America4th UBS Latin AmericaFixed Income ConferenceFixed Income Conference
Miami, May 17/18, 2007

2 2
Low OperatingCosts
UndisputableBetter Service
CompetitivePrices
Sustainable Strategyto Maintain Market
Leadershipand Profi tabil i ty
TAM is a low cost company with better service at competitive prices
3 3
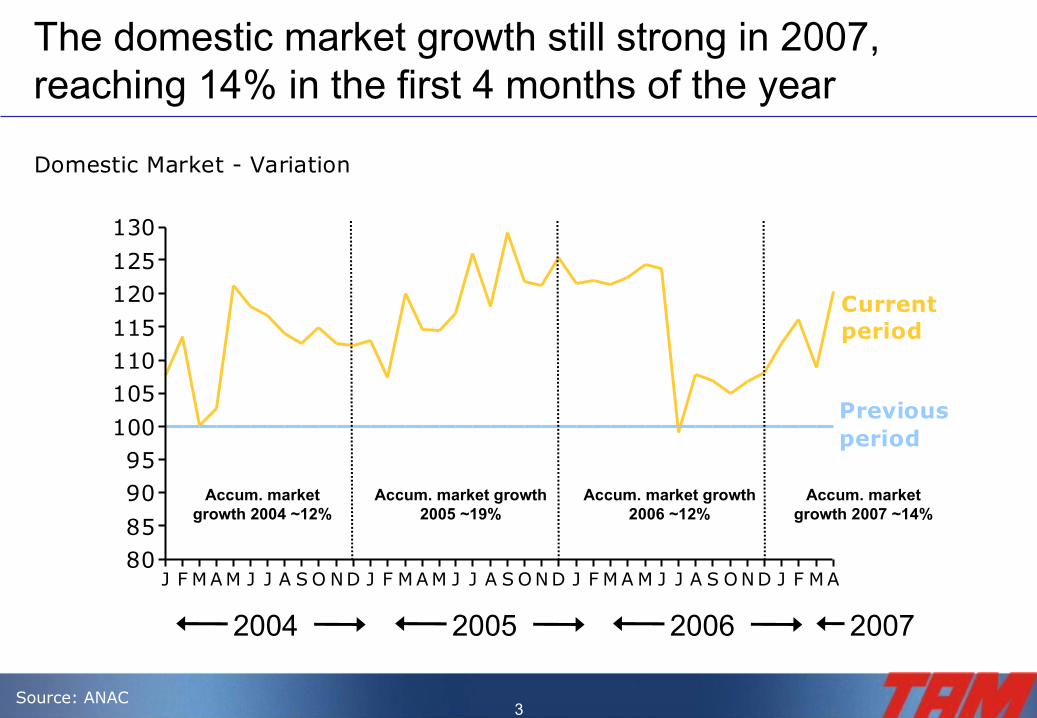
Previousperiod
Currentperiod
J F M A M J J A S O ND J F M A M J J A S O ND J F M A M J J A S O ND J F M A8085
9095
100
105110115
120125
130
Domestic Market - Variation
2004
Source: ANAC
Accum. market growth 2006 ~12%
The domestic market growth still strong in 2007, reaching 14% in the first 4 months of the year
Accum. market growth 2005 ~19%
Accum. market growth 2004 ~12%
Accum. market growth 2007 ~14%
2005 2006 2007

4 4
33,0%35,8%
47,8% 49,0%43,5%
2003 2004 2005 2006 Jan - Apr
TAM 50,70%
GOL39,1%
Other 3,3%
Varig 4,3%
BRA 2,6%
We have been domestic market leaders since 2003, ending April with 50,7%
Domestic Market Share - Apr/07
Domestic Market Share (RPK’s)
Source: ANAC
BRA 3,4%
Varig 4,6%
Other 5,1%
TAM 48,5%
GOL 38,5%
Domestic Market Share – 1Q07

5 5
Previousperiod
Market
TAM
J F M A M J J A S O ND J F M A M J J A S O N D J F M A M J J A S O ND J F M A40
60
80
100
120
140
160
180
International Market - Variation(vs previous year)
Source: ANAC
The international market (among the Brazilian carriers) has been diminishing…
Accum. market growth 2004 ~8%
Accum. market growth 2005 ~7%
Accum. market
decrease 2006 ~30%
2004 2005 2006 2007
Accum. market
decrease 2007 ~39%
Acum TAM 2006~41% Acum TAM 2007
~78%
Acum TAM 2005~40%
Acum. TAM 2004~30%

6 6
12,00% 14,3%
37,3%
63,5%
18,8%
2003 2004 2005 2006 Jan - Apr
Varig9,3%
TAM69,7%
GOL14,5%
Other6,5%
International Market Share– Apr/07
International Market Share
Since July 2006, we are international market leaders among the Brazilian companies
Source: ANAC
TAM 60,9%
Varig12,1%
GOL 17,9%
Other9,1%
International Market Share – 1Q07
7 7
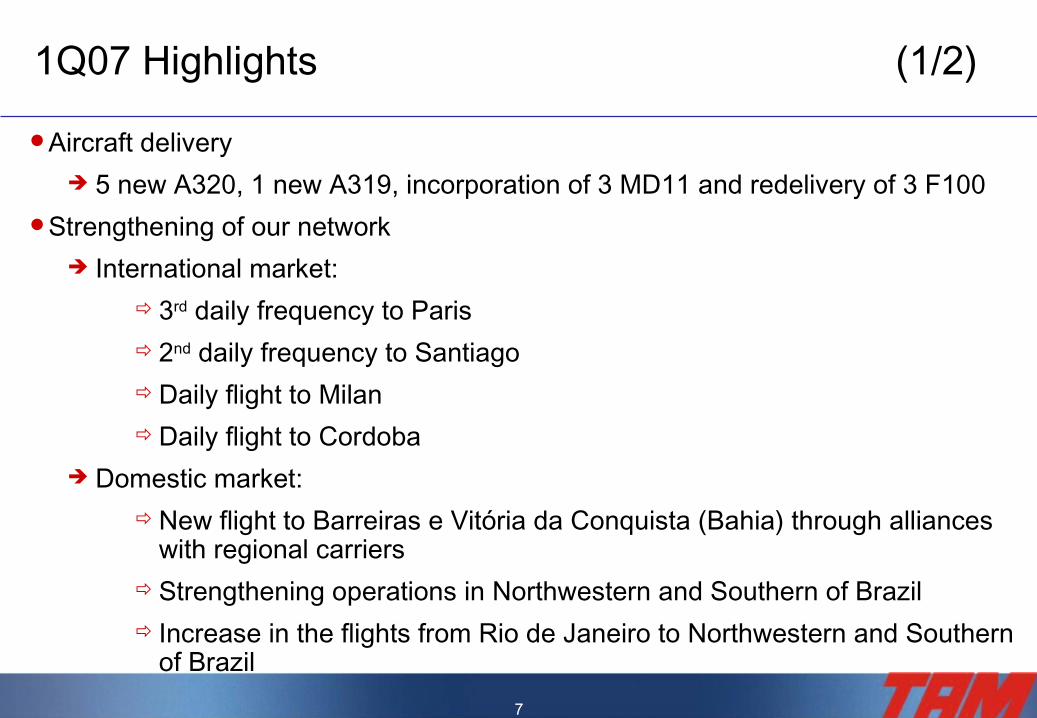
Aircraft delivery 5 new A320, 1 new A319, incorporation of 3 MD11 and redelivery of 3 F100
Strengthening of our network International market:
3rd daily frequency to Paris 2nd daily frequency to Santiago Daily flight to Milan Daily flight to Cordoba
Domestic market: New flight to Barreiras e Vitória da Conquista (Bahia) through alliances
with regional carriers Strengthening operations in Northwestern and Southern of Brazil Increase in the flights from Rio de Janeiro to Northwestern and Southern
of Brazil
1Q07 Highlights (1/2)

8 8
1Q07 Highlights (2/2)
Increase in operational efficiency Increase in block hours per aircraft/day by 4.8% yoy, from 12.4 hours to 13.0
hours Average load factor in 1Q07 of 70.8% (yoy decrease of 1.7 p.p.)
Entered into IOSA Registry (IATA Operational Safety Audit Registration )
Finalized process to obtain the Sarbanes-Oxley Act (SOX) certification
Offering of US$300 million 7.375% Senior Notes due 2017
Reelected the airline with the newest fleet in Brazil, according with Airplane Revue Magazine
Elected Best Airline of the Year, according with Airplane Revue magazine

9 9
86
103
287
1,188
158
157
506
1,093
1Q06 1Q07
1,664
1,913
0
500
1,000
1,500
2,000
Gross Revenues (R$ M)
Dom.Pax
Int.Pax
CargoOther
15%
Domestic passenger revenue growth 8%
RPK growth 22%ASK growth 22%
International passenger revenue growth 76%
RPK growth 64%ASK growth 78%
Cargo revenue growth 52% Other revenue growth 85%
Increase of sales of Loyalty Program points and expired tickets compensated by the sub-leasing
Strong revenue growth quarter over quarter

10 10
Our price differential to the second player decreased to 5%
GOLTAM
2001 2002 2003 2004 2005 2006 1Q0715
20
25
30
35
Yield scheduled domesticR$ Cents
GAP 60% 30% 18% 13% 15% 14% 5%
Note: Gol’s yield da GOL grossed up 1.05x to include taxes

11 11
1Q06
19.8
20.2
68.4
31.0
14.3
77.5
18.5
8.5
4Q06
19.3
17.5
69.7
26.4
16.6
73.7
22.6
10.6
1Q07
16.7
14.5
69.3
22.0
14.1
71.3
19.8
9.6
1Q06 vs 1Q07
-15.4%
-28.2%
0.8 p.p.
-29.0%
-1.5%
-6.2 p.p.
7.2%
13.6%
4Q06 vs 1Q07
-13.3%
-17.1%
-0.3 p.p.
-16.7%
-15.2%
-2.4 p.p.
-12.4%
-8.7%
Our total RASK reduced 15%, mainly because of the domestic yield decrease of 29%
RASK Total1
RASK Scheduled Domestic2
LF Scheduled Domestic
Yield Scheduled Domestic3
RASK Scheduled International2
LF Scheduled International
Yield Scheduled International3 (em R$)
Yield Scheduled International3 (em USD)
1 Includes charter, cargo and Other revenues, net of taxes2 Net of taxes3 Gross of taxes

12 12
CASKex-fuel
1Q06 2Q06 3Q06 4Q06 1Q07
17.4318.69 18.43
16.9815.92
0
5
10
15
20
Total CASK (BR GAAP - R$ cents)
1Q06 vs 1Q07
-7.5%
-8.7%
...and our CASK decreased 8.7% compared to 1Q06

13 13
RASKCASK
2002 2003 2004 2005 2006 1T0715
20
25
RASK/CASK (R$ Cents)BR GAAP
EBITMargin
Spread
-7.1%
-1.1
-0.9%
-0.2
6.5%
1.4
7.5%
1.5
13.6%
2.8
4.8%
0.9
The strong decline in revenue decreased the spread (RASK – CASK)…
14 14
1Q06 1Q07
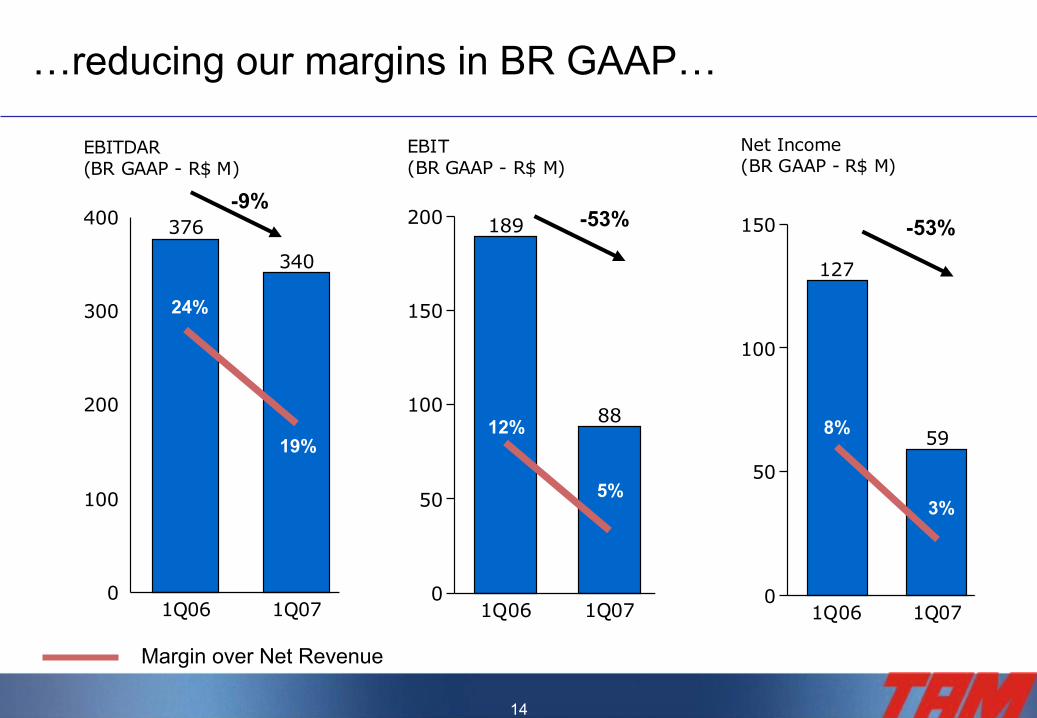
376
340
0
100
200
300
400
EBITDAR(BR GAAP - R$ M)
1Q06 1Q07
189
88
0
50
100
150
200
EBIT(BR GAAP - R$ M)
Margin over Net Revenue
1Q06 1Q07
127
59
0
50
100
150
Net Income(BR GAAP - R$ M)
-9%-53% -53%
24%
19%12%
5%3%
8%
…reducing our margins in BR GAAP…
15 15
1Q06 1Q07
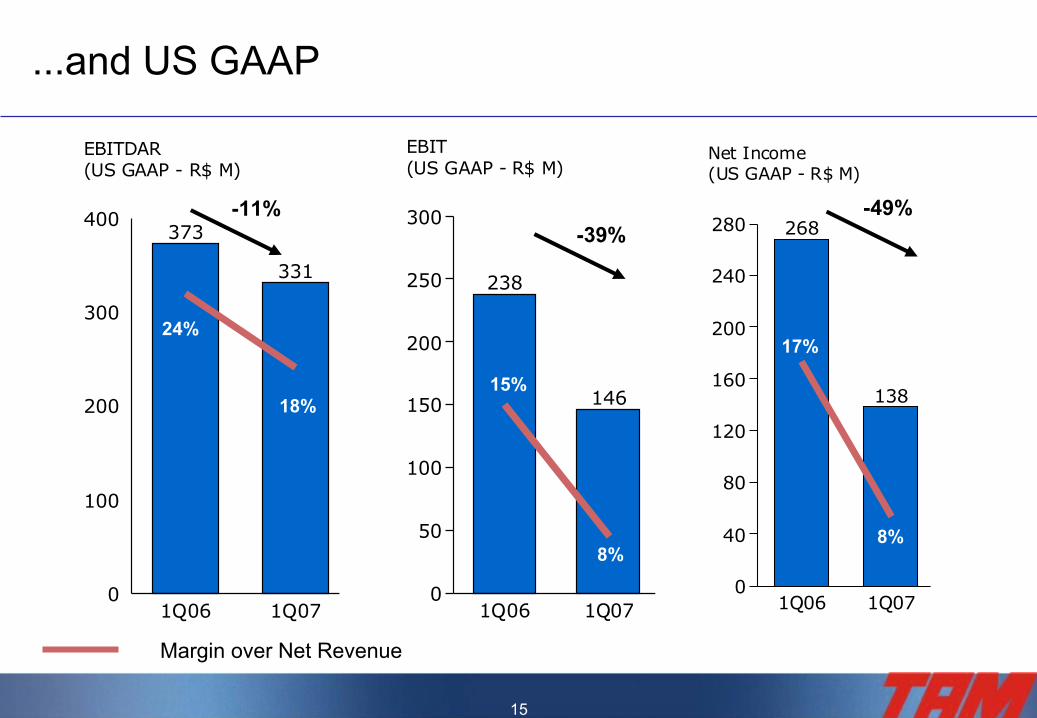
373
331
0
100
200
300
400
EBITDAR (US GAAP - R$ M)
1Q06 1Q07
238
146
0
50
100
150
200
250
300
EBIT(US GAAP - R$ M)
24%
15%
8%
18%
1Q06 1Q07
268
138
0
40
80
120
160
200
240
280
Net Income(US GAAP - R$ M)
8%
-11%
17%
...and US GAAP
Margin over Net Revenue
-49%-39%
16 16
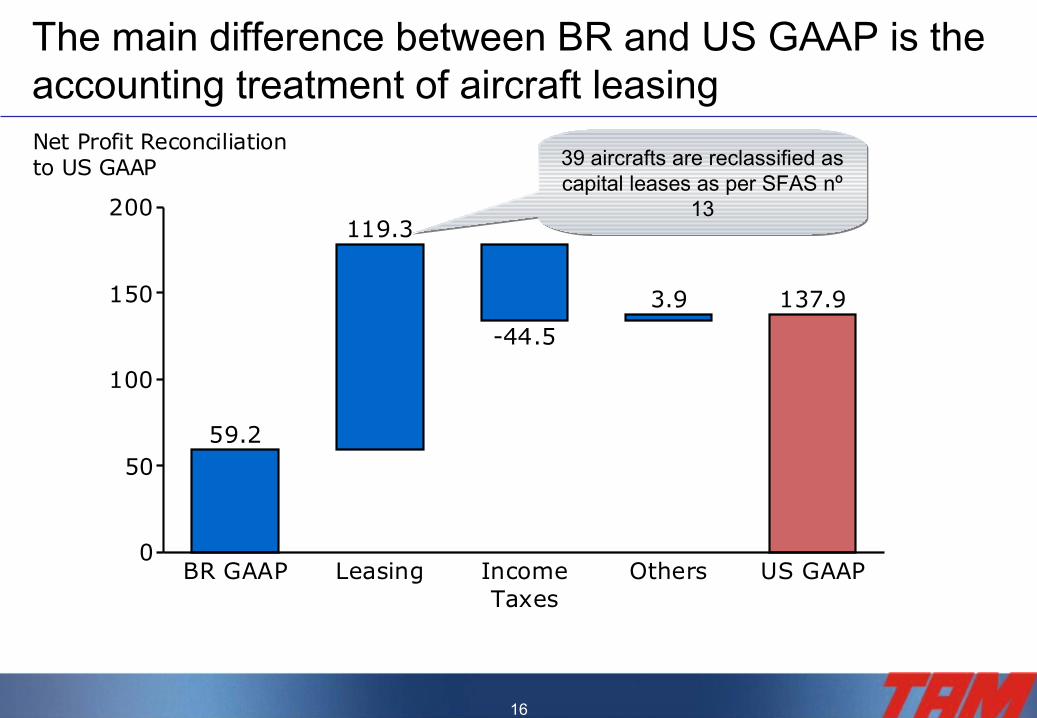
BR GAAP Leasing IncomeTaxes
Others US GAAP
59.2
119.3
-44.5
3.9 137.9
0
50
100
150
200
Net Profit Reconciliationto US GAAP 39 aircrafts are reclassified as
capital leases as per SFAS nº 13
The main difference between BR and US GAAP is the accounting treatment of aircraft leasing

17 17
1Q06 1Q07
0.85
0.39
Earnings per shareBR GAAP (R$)
1Q06 1Q07
1.80
0.92
Earnings per shareUS GAAP (R$)
Our earnings per share decreased
-54% -49%
18 18
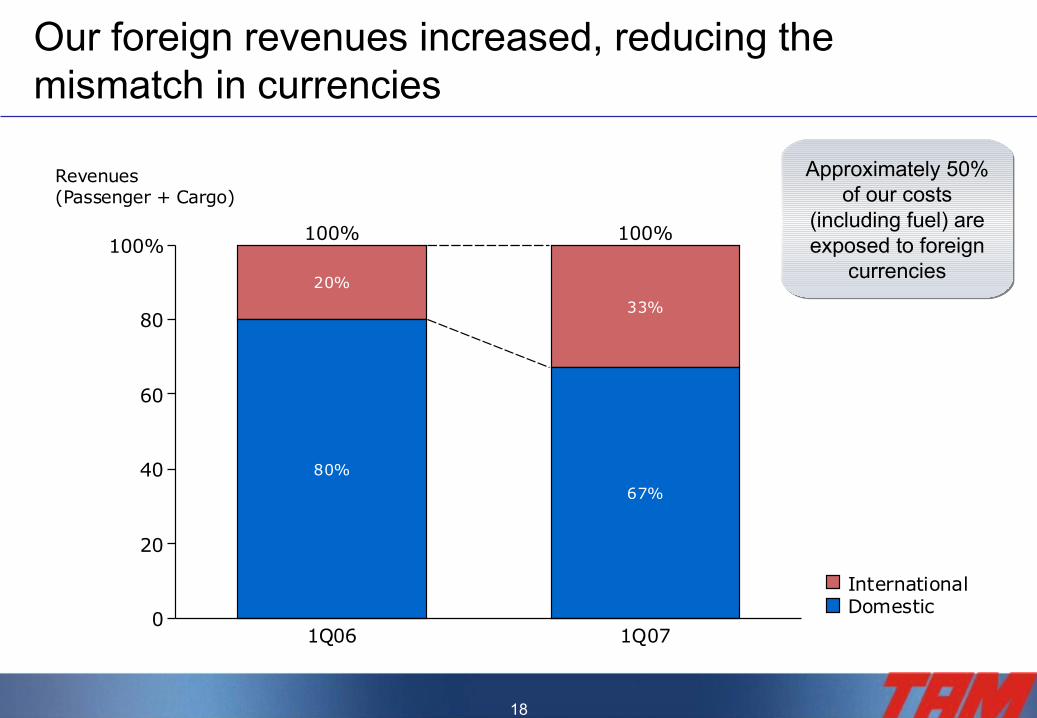
Our foreign revenues increased, reducing the mismatch in currencies
20%
80%
33%
67%
1Q06 1Q07
100% 100%
0
20
40
60
80
100%
Revenues(Passenger + Cargo)
DomesticInternational
Approximately 50% of our costs
(including fuel) are exposed to foreign
currencies
19 19
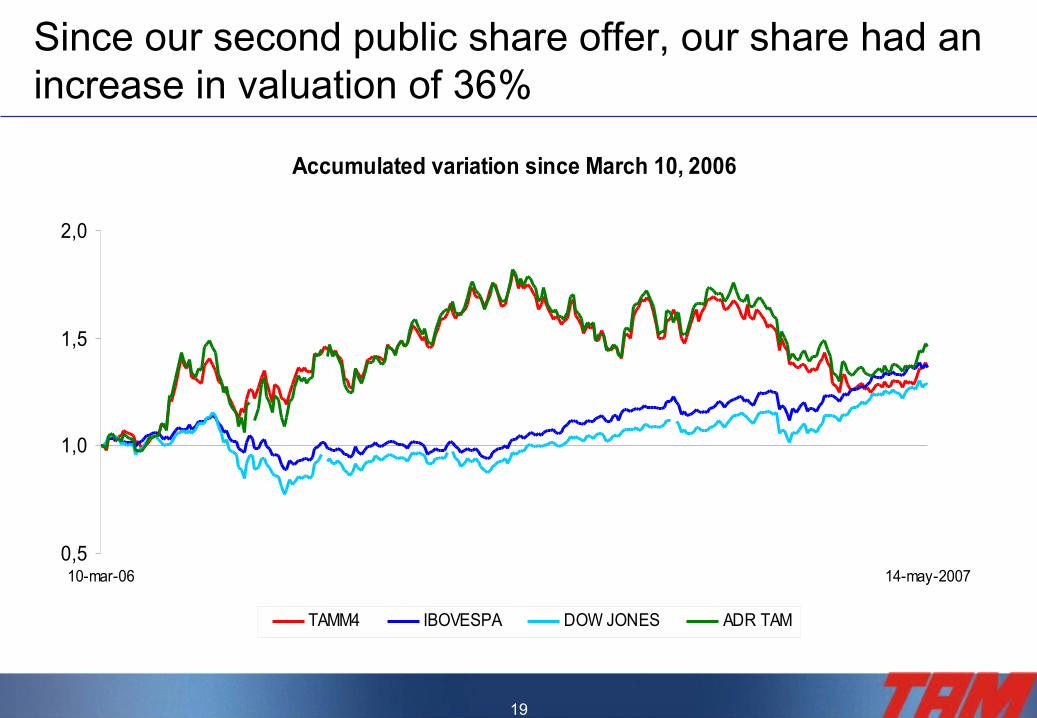
Since our second public share offer, our share had an increase in valuation of 36%
Accumulated variation since March 10, 2006
0,5
1,0
1,5
2,0
10-mar-06 14-may-2007
TAMM4 IBOVESPA DOW JONES ADR TAM

20 20
Average domestic market share above 50% Average domestic load factor at approximately 70% Aircraft utilization per day (block hour) higher than
13 hours Reduction of 7% in total CASK ex-fuel in BR GAAP
yoy Opportunity in the international market
Third frequency to ParisInauguration of two new international long haul
frequencies
Market demand growth from 10% to 15% (in RPK terms)
Guidance 2007
TAM
Market
Our expectations for 2007, disclosed in December 2006, are still the same
13.8%*
1Q07
• Since January• Milan since
March
49.0%*
72.1%*13,0
7.5%
* Jan – Apr Accumulated

21 21
Domestic Market 2007 International Market 2007
~30% increase in ASKs At least an additional 3 destinations Strengthening of international
gateways for domestic market Guarulhos Galeão
Increasing of frequency on main domestic markets Brasília Congonhas Confins
Implementing overhub flights: new city-pairs
~60-70% increase in ASKs
Additional daily frequency to Paris beginning in January
New flight to Milan in 1S07
Additional longhaul frequency or destination to be disclosed
Strengthening of Latin American presence, both frequencies and destinations
In 2007, we will be expanding both frequencies and destinations

22 22
Due to international market opportunity, we are strengthening our international partnerships...
Code-share with TAP staring operation on July: Flying to the following destinations in Portugal:
Lisbon, Porto, Faro, Funchal, Horta, Pico, Ponta Delgada, Porto Santo and Terceira; departing from the following destinations in Brazil: Rio de Janeiro, São Paulo and Brasilia.
Linkage of the companies' mileage programs, TAM's Fidelidade and TAP's Victoria
Commercial alliance with LAN to unlimited seats sell to South America: Brazil,
Chile, Argentina, Peru, Venezuela Linkage of the companies' mileage programs,
TAM's Fidelidade and LAN PASS

23 23
3
15
88
6
4
16
103
4
20
106
4
20
112
6
20
115
2007 2008 2009 2010 2011
112123
130136
141
0
50
100
150
Total Fleet
F100
Airbusnarrow-body
Airbuswide-body
MD11B777
...increasing our fleet in 3 wide-body aircraft in 2007 to long haul destinations

24 24
Fleet and network Distribution costs Overhead
Increase of block hours to over 13 hours per day per aircraft in 2007
6 extra seats in the A319/320 fleet
Increase in direct sales through: Site improvement Fare bundles Call center outsourcing New means of payment
Insourcing of representatives
Adjusting indirect sales commissions to higher % on offpeak flights
Outsourcing of non-core activities
Redefinition of service standards
Review of spans&layers in the hierarquy
Implementation of new automated processes
Improved sourcing capabilities
Our cost targets are aggressive, but the roadmap is already laid out
In implementation
Implemented
25 25
2.0
4.0
6.0
8.0
10.0
12.0
14.0
16.0
8.0 13.0 18.0 23.0 28.0 33.0 38.0
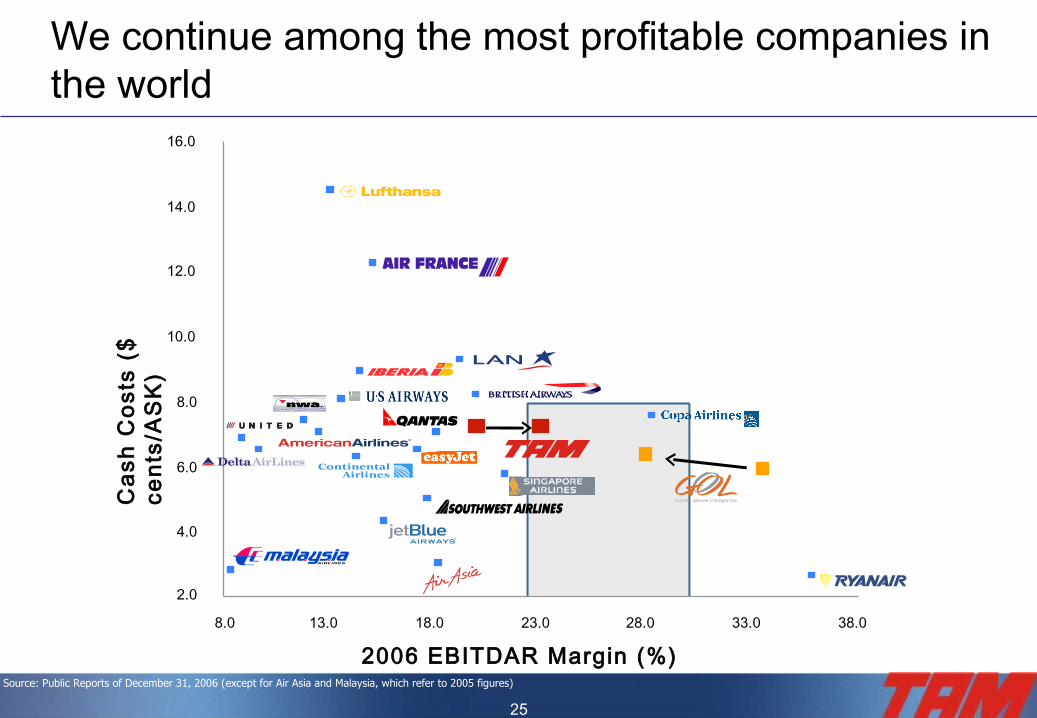
2006 EBITDAR Margin (%)
Cas
h C
osts
($
cent
s/A
SK
)
We continue among the most profitable companies in the world
Source: Public Reports of December 31, 2006 (except for Air Asia and Malaysia, which refer to 2005 figures)

26 26
Information and ProjectionThis notice may contain estimates for future events. These estimates merely reflect the expectations of the
Company’s management, and involve risks and uncertainties. The Company is not responsible for investment
operations or decisions taken based on information contained in this communication. These estimates are
subject to changes without prior notice.
This material has been prepared by TAM S.A. (“TAM“ or the “Company”) includes certain forward-looking
statements that are based principally on TAM’s current expectations and on projections of future events and
financial trends that currently affect or might affect TAM’s business, and are not guarantees of future
performance. They are based on management’s expectations that involve a number of business risks and
uncertainties, any of each could cause actual financial condition and results of operations to differ materially
from those set out in TAM’s forward-looking statements. TAM undertakes no obligation to publicly update or
revise any forwardlooking statements.
This material is published solely for informational purposes and is not to be construed as a solicitation or an
offer to buy or sell any securities or related financial instruments. Likewise it does not give and should not be
treated as giving investment advice. It has no regard to the specific investment objectives, financial situation or
particular needs of any recipient. No representation or warranty, either express or implied, is provided in relation
to the accuracy, completeness or reliability of the information contained herein. It should not be regarded by
recipients as a substitute for the exercise of their own judgment.

27 27
1Q071Q07Results Presentation
São Paulo, May 10, 2007