07 man envn res int 2 - deanscommunityhighschool.com · 4 additional space for answers will be...
TRANSCRIPT

©
FOR OFFICIAL USE
Total Marks
Fill in these boxes and read what is printed below.
Full name of centre Town
Forename(s) Surname
Date of birth
1 Attempt all questions in Section 1. In Section 2 there is a choice.
2 Read the whole of each question carefully before you answer it.
3 Write in the spaces provided.
4 Additional space for answers will be found at the end of the book. If further space isrequired, supplementary sheets may be obtained from the invigilator and should beinserted inside the front cover of this book.
5 There is a separate Ordnance Survey Map Extract for use with Question 8.
6 Rough work, if any should be necessary, should be written in this book and then scoredthrough when the fair copy has been written.
7 Before leaving the examination room you must give this book to the invigilator. If you donot, you may lose all the marks for this paper.
Day Month Year Number of seat Scottish candidate number
N A T I O N A L W E D N E S D A Y , 6 J U N EQ U A L I F I C A T I O N S 1 . 0 0 P M – 3 . 0 0 P M2 0 0 7
MANAGINGENVIRONMENTAL RESOURCESINTERMEDIATE 2
X055/201
PB X055 /201 6 / 670 *X055/201*

SECTION 1
Answer ALL questions in the spaces provided.
Use the map extract to answer Question 8.
1. (a) The pie chart below shows the sources from which electricity was
generated in Scotland for the year 2003.
(i) Name the major source of electricity generation in Scotland in
2003.
(ii) What percentage of electricity was generated from fossil fuels in
2003?
Space for calculation
%
(iii) Natural gas from the North Sea started to be used for generating
electricity in the early 1970s. What was the major source for
generating electricity before 1970?
Page two[X055/201]
Marks
1
1
1
DO NOT
WRITE
IN THIS
MARGIN
8%
KEY
Sources
38%
30%
2%
22%
Nuclear
Coal
Oil & Natural gas
Hydro
Other renewables

DO NOT
WRITE
IN THIS
MARGIN
Page three
1. (continued)
(b) The target for electricity generated from renewable sources is 18% by
2010. One proposal being considered in Scotland is to build more wind
farms.
(i) Give two advantages to the environment of building wind farms.
1
2
(ii) Give two disadvantages of building wind farms.
1
2
(iii) There is an alternative proposal to build another nuclear power
station. Give one advantage and one disadvantage of generating
electricity from nuclear fuel.
Advantage
Disadvantage
(iv) Name one other renewable resource which can be used to generate
electricity.
(c) Name a European country which relies on geothermal sources to generate
electricity.
(d) Give two differences in energy production between an economically
more developed country (EMDC) and an economically less developed
country (ELDC).
1
2
Marks
1
1
1
1
1
1
1
1
1
1
[X055/201] [Turn over

DO NOT
WRITE
IN THIS
MARGIN
Page four
2. The diagram below is part of a moorland foodweb.
(a) From the food web:
(i) name a producer;
(ii) name an omnivore;
(iii) complete the food chain below;
(iv) describe the niche of the red deer;
Marks
1
1
1
2
[X055/201]
heather grass
golden eagle
rabbit
man
red grouse
parasites
insects
red deer
red grouse

2. (a) (continued)
(v) name a biotic factor and explain how it can affect the numbers of
red grouse.
Biotic factor
Explanation
(b) Hen harriers are large birds of prey found on moorland. The number of
hen harriers has increased due to legal protection measures.
Predict an effect this would have on the golden eagle population.
Underline one of the options.
increase
Numbers of golden eagle would stay the same .
decrease
Give a reason for your answer.
Page five
Marks
1
1
1
DO NOT
WRITE
IN THIS
MARGIN
[X055/201]
[Turn over
{ {

2. (continued)
(c) The key below is used to identify moorland plants.
Key to moorland plants
1 Woody plant over 80 cm .....................................................gorse
Woody plant under 80 cm.................................................go to 2
2 Plant with bell-shaped flowers..........................................go to 3
Plant with flowers not bell-shaped ....................................go to 4
3 Flowers dark pink or purple......................................bell heather
Flowers pale pink ...........................................cross-leaved heath
4 Flowers single or in pairs on stem ................................cranberry
Multiple flowers on stem ......................................................ling
(i) Use the key to identify the plant below.
Name
(ii) Give one similarity and one difference between bell heather and
ling.
Similarity
Difference
Page six
Marks
1
1
1
DO NOT
WRITE
IN THIS
MARGIN
[X055/201]
20 cm
woody stem

DO NOT
WRITE
IN THIS
MARGIN
3. (a) The table below gives information on sources of emissions causing air
pollution in a Scottish city for the year 2005.
(i) What is the main source of air pollution?
(ii) The total emissions of oxides of carbon is 268 tonnes/km.
Calculate the mass of oxides of carbon released by road transport.
Space for calculation
tonnes/km
(iii) Give one way of reducing emissions from:
road transport;
industry.
(b) Pollutants contribute to the formation of acid rain.
Give one effect of acid rain on:
organisms;
habitat.
Page seven
Marks
1
1
1
1
1
1
[X055/201] [Turn over
Source of emissions %
Roadtransport
Oxides ofcarbon
Pollutant
97 0 0 3
78 2 12 8
88 0 4 8
Oxides ofnitrogenSulphurdioxide
Industry Domestic Others

4. The diagram below shows a large garden centre sited in the countryside near
a town.
(a) (i) Give two natural resources on which the garden centre depends.
1 ___________________________
2 ___________________________
(ii) Name two man-made resources used at the garden centre.
1 ___________________________
2 ___________________________
(iii) Suggest two types of recyclable waste produced at the garden
centre.
1 ___________________________
2 ___________________________
(iv) Circle the name used to describe the plants sold at the garden
centre.
weeds wild cultivated domesticated
Page eight
Marks
1
1
2
1
DO NOT
WRITE
IN THIS
MARGIN
[X055/201]

4. (continued)
(b) The landowners have diversified from farming.
(i) Suggest a reason for this diversification.
(ii) Give two examples of changes of land use at this site.
1
2
DO NOT
WRITE
IN THIS
MARGIN
Page nine[X055/201]
Marks
1
1
1
[Turn over

DO NOT
WRITE
IN THIS
MARGIN
4. (continued)
(c) Daily monitoring of temperature occurs at the garden centre.
The daily temperatures recorded for sixteen consecutive days in May
2005 are shown in the table below.
(i) Part of the line graph for ground temperature is shown below.
Using information from the table:
A add the appropriate scale to the vertical axis;
B complete the line for ground temperature.
(An additional climate graph can be found on page 28.)
Page ten[X055/201]
Marks
2
Day 1 2 3 4 5 6 7 8 9 10 11 12 13 14 15 16
Groundtemperature °C
0 7 0 –3 –1 –1 –4 –3 –1 –2 1 6 3 –4 –4 5
Air temperature(minimum) °C
2 7 3 1 1 2 0 0 1 1 2 7 5 –1 –2 5
Air temperature(maximum) °C
14 14 12 12 12 10 10 13 16 15 17 20 9 11 10 12
Ground
temperature
°C
0
Day
2 4 6 8 10 12 14 16

DO NOT
WRITE
IN THIS
MARGIN
Page eleven
4. (c) (continued)
(ii) Use the information in the table to complete the sentence.
The range in air temperature is from °C to °C.
(iii) From the table, on which two days would the plants be at most
risk from frost damage?
(iv) Suggest one precaution the garden centre could take to prevent
frost damage.
(d) Temperature is an abiotic factor.
Name one other abiotic factor which could be monitored at the garden
centre.
Marks
1
1
1
1
[X055/201]
[Turn over

Page twelve
5. The diagram below shows the cycling of carbon.
(a) Complete the diagram by:
(i) naming Process X;
(ii) adding one arrow to represent the process of feeding.
(b) Name two requirements, other than carbon dioxide, for the process of
photosynthesis.
and
(c) Complete the word equation for the process of respiration.
Carbohydrate + → Energy + carbon dioxide +
Marks
1
1
1
1
DO NOT
WRITE
IN THIS
MARGIN
[X055/201]
Carbon dioxide in
air
Carbohydrates in
plants
Carbohydrates in
animals
Carbon in the soil
Fossil fuels
Photosynthesis
Decomposition
Fossilisation
Respiration
Process X

Page thirteen
5. (continued)
(d) Decomposition recycles the nutrient, carbon.
(i) Give two examples of decomposers.
and
(ii) Name one other nutrient that is recycled during decomposition.
(iii) Explain why cycling of nutrients is important.
(e) Explain the consequences of increasing levels of carbon dioxide in the air.
Marks
1
1
1
2
DO NOT
WRITE
IN THIS
MARGIN
[X055/201]
[Turn over

Page fourteen
6. Read the passage below and answer the questions which follow.
Local Biodiversity Action Plans
Local biodiversity action plans (LBAPs) are one way in which local
authorities are trying to address biodiversity. LBAPs are local partnerships
based on national and international initiatives. The Nature Conservation
(Scotland) Act (2004) makes conserving biodiversity a statutory duty for all
public organisations. A national framework for development is available in
the Scottish Biodiversity Strategy. Biodiversity is recognised as being one
clear measurement of sustainable development.
A typical local partnership would be headed by a steering group, and, in some
cases, have a biodiversity officer, who would co-ordinate the plan. Local
priority species and habitats are selected from those highlighted for action in
the UK Biodiversity Action Plan.
For example, the Common Juniper (Juniperuscommunis) is a low growing, blue-grey native
conifer. It was one of the first trees to colonise
Britain after the last glaciation. Recent studies
have indicated a 60% decline in this species.
The cones, which resemble berries, were used
historically in medicine and for flavouring gin.
The wood was burned for its sweet smell and
the plant was used traditionally for warding off
evil. The juniper is unusual in that it has male
and female plants. This becomes a problem
where plants have become isolated and so are
no longer able to reproduce.
Careful management of identified outcrops of
juniper are essential for its survival. A local
biodiversity action plan is one way in which
this could be achieved.
Everyone has a role to play in conserving local
biodiversity. Some measures which could help
include:
• plant trees and shrubs to attract butterflies and other insects
• use peat free compost or make your own
• recycle domestic waste.
(a) What is meant by sustainable development?
Marks
1
DO NOT
WRITE
IN THIS
MARGIN
[X055/201]
cone

6. (continued)
(b) What is meant by the term “native” in relation to the juniper?
(c) Explain how historical uses have influenced the decline of the juniper.
(d) Suggest one way in which a management plan could help prevent the
juniper from becoming extinct.
(e) Name one animal species in need of conservation.
(f) LBAPs are one way in which a single species can be conserved.
Name one other.
(g) Give two ways in which you could contribute to improving local
biodiversity.
1
2
Page fifteen
DO NOT
WRITE
IN THIS
MARGIN
[X055/201]
Marks
1
2
1
1
1
1
[Turn over

Page sixteen
7. In 1975, an investigation was carried out into the distribution of lichens in a
city. The investigation was repeated in 2005.
Some lichens are more sensitive to air pollution than others.
Information about the investigation is shown in the table below.
Using random sampling, the numbers of lichen species were counted at
0.5 km intervals from the city centre. An average value was calculated at each
distance to give the lichen zone.
The graph below shows the lichen zone found at 0.5 km intervals from the
city centre for the years 1975 and 2005.
DO NOT
WRITE
IN THIS
MARGIN
[X055/201]
Main type of lichen found Lichen zone Level of sensitivity to air pollutionCrusty 1 Low sensitivity
Scaly 2
Leafy, found on walls 3
Leafy, found on trees 4
Shrubby 5 High sensitivity
Lichen
zone
5
4
3
2
1
0 1 2 3Distance from city centre (km)
2005
1975

Page seventeen
7. (continued)
(a) From the table:
(i) which type of lichen is least sensitive to air pollution?
(ii) which zone contains lichens which are most sensitive to air
pollution?
(b) (i) Name a piece of equipment which is used to sample plant species.
(ii) Explain why random sampling is used in this investigation.
(iii) Explain why an average value was calculated at each distance to
give the lichen zone.
(c) Use the graph and the table to answer the following questions.
(i) Suggest a reason for the lichen zone result at 2 km from the city
centre in 1975.
(ii) Give two conclusions about air pollution in this city.
1
2
Marks
1
1
1
1
1
1
2
DO NOT
WRITE
IN THIS
MARGIN
[X055/201]
[Turn over

Page eighteen[X055/201]
[Turn over for Question 8 on Page nineteen

8. Use the map extract of the Aberdeen area—Extract No 1562/38 (separate
item).
(a) The map extract shows different urban environments.
(i) Complete the table using the information below.
9004
9306
port
industry
town park
(ii) Name two places, with their grid reference (GR), of tourist
interest.
Place GR
Place GR
Marks
3
1
Page nineteen
DO NOT
WRITE
IN THIS
MARGIN
[X055/201]
Land use Grid reference
residential area
9502
town centre
9505
9304
[Turn over

Page twenty
DO NOT
WRITE
IN THIS
MARGIN
8. (continued)
(b) Most traffic approaching Aberdeen from the south uses the A90 dual
carriageway through the built up area.
The sketch map below shows the route of a proposed bypass.
1
1
3
2
[X055/201]

Page twenty-one
Marks
1
1
1
2
2
DO NOT
WRITE
IN THIS
MARGIN
[X055/201]
8. (b) (continued)
(i) Give one possible environmental benefit of a bypass to:
residents in Area A;
the transport industry.
(ii) Describe one negative environmental impact of a bypass.
(c) In the planning process for a bypass, different groups put forward their
own interests.
Describe a possible conflict of interest between two named groups for the
proposed route of the bypass.
Group 1 Group 2
Possible conflict
(d) Give two examples of energy efficiency schemes for public transport.
1
2
[Turn over

Page twenty-two
Marks
1
1
1
1
1
DO NOT
WRITE
IN THIS
MARGIN
[X055/201]
8. (continued)
(e) Loirston Country Park and Loch are located at GR 9302 and 9301.
A Country Park is designated as a “park or pleasure ground in the
countryside and which, by reason of its position in relation to
concentrations of population, affords convenient opportunities to the
public for enjoyment of the countryside or open air recreation”.
Countryside (Scotland) Act 1967
(i) Name two large residential areas close to the Park and the Loch.
1
2
(ii) Suggest two recreational pursuits that would be available in a
Country Park.
1
2
(iii) Loirston Loch is a valuable site for breeding and over-wintering of
wild birds. The work of the local Countryside Ranger includes
guided walks and talks to schools and local groups.
Explain how this will help protect the wild birds.
(f) Historically, Footdee (GR 9506) was a small fishing village.
(i) Suggest one natural feature that gave an advantage to this site.
(ii) Suggest one geological feature that is dangerous to shipping at this
site.
Page twenty-three
Marks
1
1
1
DO NOT
WRITE
IN THIS
MARGIN
[X055/201]
8. (continued)
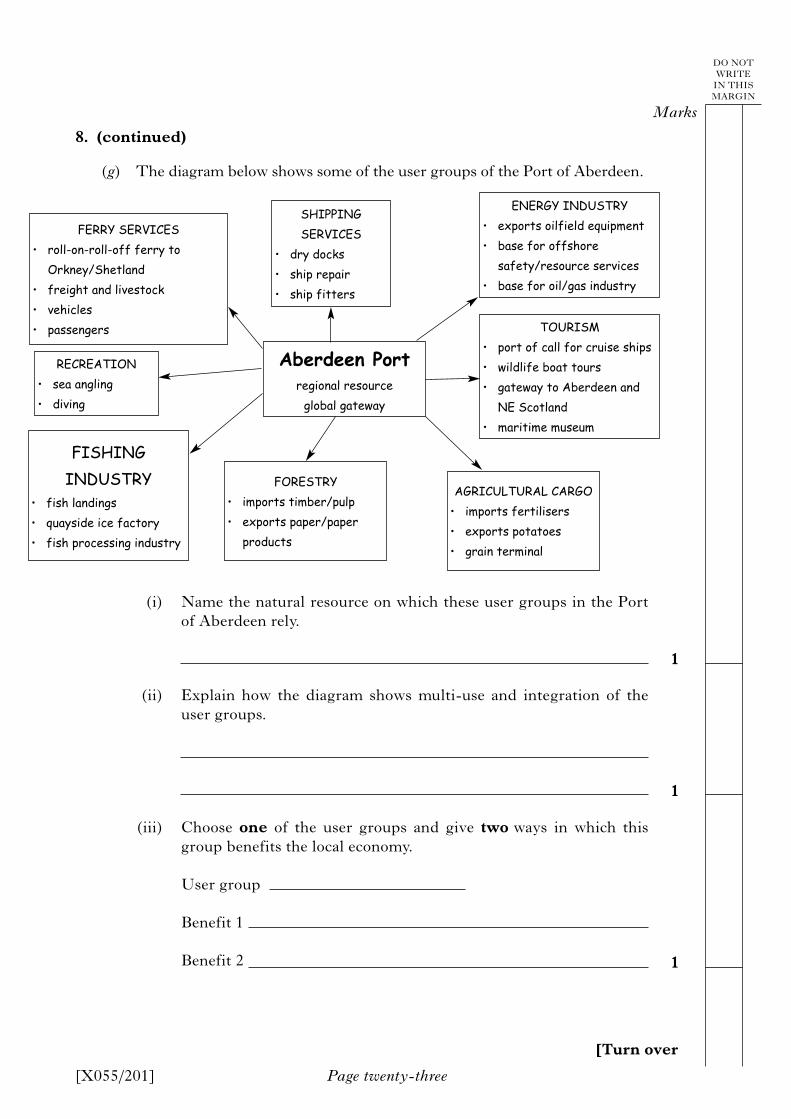
(g) The diagram below shows some of the user groups of the Port of Aberdeen.
(i) Name the natural resource on which these user groups in the Port
of Aberdeen rely.
(ii) Explain how the diagram shows multi-use and integration of the
user groups.
(iii) Choose one of the user groups and give two ways in which this
group benefits the local economy.
User group
Benefit 1
Benefit 2
Aberdeen Port
regional resource
global gateway
ENERGY INDUSTRY
• exports oilfield equipment
• base for offshore
safety/resource services
• base for oil/gas industry
TOURISM
• port of call for cruise ships
• wildlife boat tours
• gateway to Aberdeen and
NE Scotland
• maritime museum
AGRICULTURAL CARGO
• imports fertilisers
• exports potatoes
• grain terminal
FORESTRY
• imports timber/pulp
• exports paper/paper
products
SHIPPING
SERVICES
• dry docks
• ship repair
• ship fitters
FERRY SERVICES
• roll-on-roll-off ferry to
Orkney/Shetland
• freight and livestock
• vehicles
• passengers
RECREATION
• sea angling
• diving
FISHING
INDUSTRY
• fish landings
• quayside ice factory
• fish processing industry
[Turn over

Page twenty-four
Marks
1
1
DO NOT
WRITE
IN THIS
MARGIN
[X055/201]
8. (g) (continued)
(iv) Forestry uses sustainable methods.
Give one sustainable method which is used in forestry.
(v) In 2002, 8 cruise ships called at the Port of Aberdeen.
In 2005, 10 cruise ships called at the Port of Aberdeen.
Calculate the percentage increase.
Space for calculation
%

Page twenty-five
Marks
5
5
(10)
5
5
(10)
5
5
(10)
DO NOT
WRITE
IN THIS
MARGIN
SECTION 2
Answer only ONE question—Option A or B or C.
Write your answers on the pages which follow.
Option A
Discuss the ways in which energy demand can be reduced by initiatives at:
(a) a national level;
(b) a personal level.
OR
Option B
Discuss the effects of:
(a) oil spillage in a named ecosystem;
(b) sewage in a named ecosystem.
OR
Option C
Describe:
(a) the historical influences in the development of your area;
(b) how you carried out this investigation.
[END OF QUESTION PAPER]
[X055/201]

DO NOT
WRITE
IN THIS
MARGIN
Page twenty-six
MarksSPACE FOR ANSWERS
[X055/201]

DO NOT
WRITE
IN THIS
MARGIN
Page twenty-seven
MarksSPACE FOR ANSWERS
[X055/201] [Turn over

ADDITIONAL CLIMATE GRAPH FOR QUESTION 4(c)(i)
Page twenty-eight[X055/201]
Ground
temperature
°C 0
Day
2 4 6 8 10 12 14 16