061405-2004 houston transtar annual report
TRANSCRIPT

Houston TranStar Annual Report–2004
Prepared by TEXAS TRANSPORTATION INSTITUTE
THE TEXAS A&M UNIVERSITY SYSTEM701 NORTH POST OAK, SUITE 430
HOUSTON, TEXAS 77024-3827
for TEXAS DEPARTMENT OF TRANSPORTATION

Houston TranStar Annual Report–2004
Prepared by TEXAS TRANSPORTATION INSTITUTE
THE TEXAS A&M UNIVERSITY SYSTEM701 NORTH POST OAK, SUITE 430
HOUSTON, TEXAS 77024-3827
for TEXAS DEPARTMENT OF TRANSPORTATION
June 2005

Houston TranStar Annual Report – 2004 Page i
ACRONYMS ATM Asynchronous Transfer Mode AVI Automatic Vehicle Identification CCTV Closed Circuit Television CMAQ Congestion Mitigation and Air Quality CTMS Computerized Traffic Management System DMS Dynamic Message Sign EOC Emergency Operations Center FHWA Federal Highway Administration FTA Federal Transit Administration HAR Highway Advisory Radio HCOHS&EM Harris County Office of Homeland Security & Emergency Management HCPID Harris County Public Infrastructure Department HEC Houston Emergency Center HOT High Occupancy/Toll Lane HOV High Occupancy Vehicle ITS Intelligent Transportation Systems JOC Joint Operations Center MAP Motorist Assistance Program METRO Metropolitan Transit Authority of Harris County MOC Mobile Operations Center (MOC) OEM Office of Emergency Management PDA Personal Digital Assistant RCTSS Regional Computerized Traffic Signal System RIMS Regional Incident Management System RWIS Roadway Weather Information System STP Surface Transportation Program TMC Transportation Management Center TSTOP Traffic Signal Timing Optimization Program TxDOT Texas Department of Transportation USDOT U.S. Department of Transportation
Houston TranStar Annual Report – 2004 Page 1 of 50
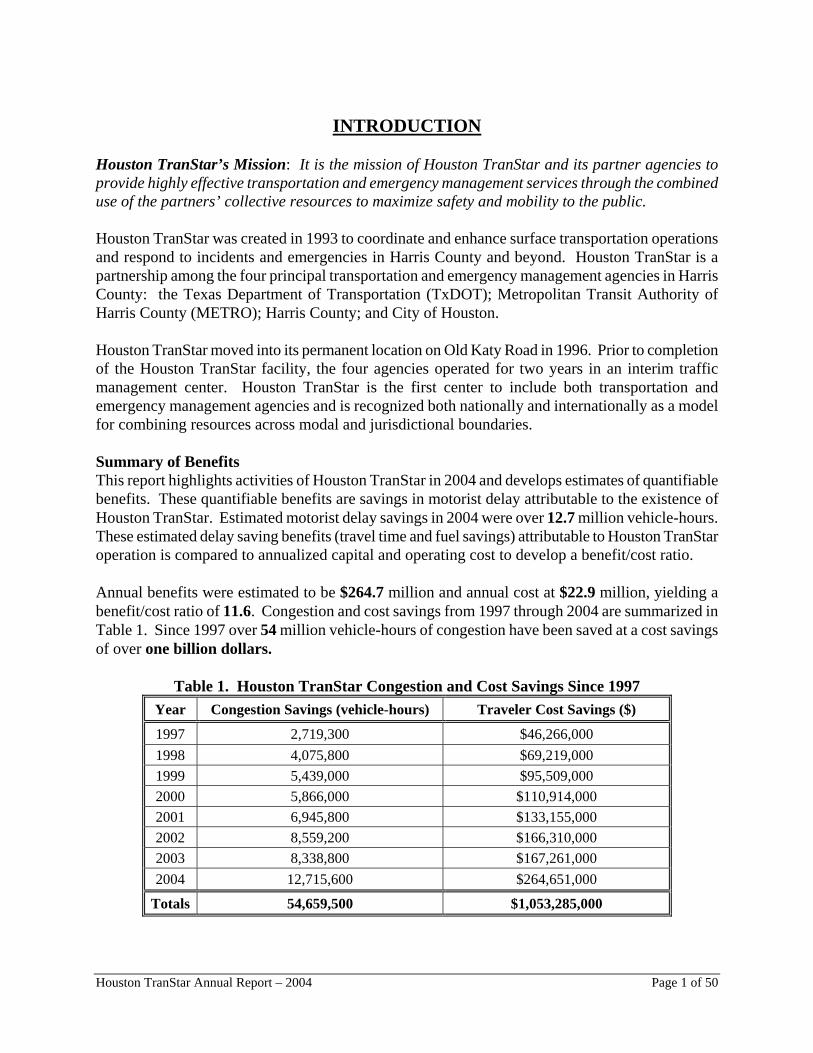
INTRODUCTION Houston TranStar’s Mission: It is the mission of Houston TranStar and its partner agencies to provide highly effective transportation and emergency management services through the combined use of the partners’ collective resources to maximize safety and mobility to the public. Houston TranStar was created in 1993 to coordinate and enhance surface transportation operations and respond to incidents and emergencies in Harris County and beyond. Houston TranStar is a partnership among the four principal transportation and emergency management agencies in Harris County: the Texas Department of Transportation (TxDOT); Metropolitan Transit Authority of Harris County (METRO); Harris County; and City of Houston. Houston TranStar moved into its permanent location on Old Katy Road in 1996. Prior to completion of the Houston TranStar facility, the four agencies operated for two years in an interim traffic management center. Houston TranStar is the first center to include both transportation and emergency management agencies and is recognized both nationally and internationally as a model for combining resources across modal and jurisdictional boundaries. Summary of Benefits This report highlights activities of Houston TranStar in 2004 and develops estimates of quantifiable benefits. These quantifiable benefits are savings in motorist delay attributable to the existence of Houston TranStar. Estimated motorist delay savings in 2004 were over 12.7 million vehicle-hours. These estimated delay saving benefits (travel time and fuel savings) attributable to Houston TranStar operation is compared to annualized capital and operating cost to develop a benefit/cost ratio. Annual benefits were estimated to be $264.7 million and annual cost at $22.9 million, yielding a benefit/cost ratio of 11.6. Congestion and cost savings from 1997 through 2004 are summarized in Table 1. Since 1997 over 54 million vehicle-hours of congestion have been saved at a cost savings of over one billion dollars.
Table 1. Houston TranStar Congestion and Cost Savings Since 1997 Year Congestion Savings (vehicle-hours) Traveler Cost Savings ($)
1997 2,719,300 $46,266,000 1998 4,075,800 $69,219,000 1999 5,439,000 $95,509,000 2000 5,866,000 $110,914,000 2001 6,945,800 $133,155,000 2002 8,559,200 $166,310,000 2003 8,338,800 $167,261,000 2004 12,715,600 $264,651,000
Totals 54,659,500 $1,053,285,000

Houston TranStar Annual Report – 2004 Page 2 of 50
Houston TranStar Organization Houston TranStar uses a three-tiered management structure with representation of each of the four agencies on each committee (Figure 1). Functions of the three committees are:
• Executive Committee–sets policy and manages fiscal and staffing matters; • Leadership Team–comprised of administrators of the transportation and emergency
management groups; administers implementation of various projects and activities and reviews funding commitments; and
• Agency Managers Committee–comprised of managers of the transportation and emergency management groups; the agency managers are responsible for daily operations.
Houston TranStar is staffed by employees from the member agencies that support the three levels of management in operating the systems and programs housed in the Center. Operation of the Center is coordinated by a small management staff that is responsible for operating and maintaining Houston TranStar facilities, coordinating multi-agency activities, coordinating budget preparation, workshops, meetings, and facility tours, and managing public information activities.
Executive Committee District Engineer TxDOT President and C.E.O. METRO Executive Director of Public Infrastructure Harris County Director of Public Works City of Houston
Leadership Team Chief of Police METRO Manager Traffic and Transportation Group Harris County Emergency Management Coordinator Harris County Director of Transportation Operations TxDOT Executive Liaison Harris County Emergency Management Coordinator City of Houston Deputy Director of Public Works City of Houston
Agency Managers Traffic Management and Operations Engineer Harris County Emergency Management Operations Manager Harris County Director of Transportation Management Systems TxDOT Captain, TranStar Division METRO Information Systems Manager TxDOT Traffic, Deputy Assistant Director City of Houston
Figure 1. Houston TranStar Organization

Houston TranStar Annual Report – 2004 Page 3 of 50
Each of the four Houston TranStar partner agencies has different functions and responsibilities relative to transportation. TxDOT is the only partner that focuses its resources primarily on transportation; as such, TxDOT is the largest transportation agency in the area. METRO provides transit services as its core function but is also involved in other transportation and law enforcement as significant functions. The City of Houston and Harris County have very broad responsibilities, only one of which is transportation. Harris County also has an emergency management function that is a part of Houston TranStar. Law enforcement is an important component in functions coordinated through Houston TranStar. Nevertheless, the concept underlying Houston TranStar (and essential for its success) is teamwork and coordinating the actions of all four agencies together to monitor, provide information about, respond to, and manage, where appropriate, both emergency and transportation operations conditions.

Houston TranStar Annual Report – 2004 Page 4 of 50
SUMMARY OF ACTIVITIES Houston TranStar is a flexible and dynamic partnership whose scope and services have been evolving since its inception. Houston TranStar continues to improve its operational effectiveness and expand its transportation and emergency management facilities and systems. Cooperative working relationships fostered by daily interaction of the staffs of various agencies in the region and frequent coordination and training meetings are invaluable to the operations of Houston TranStar. Activities and accomplishments for the Year 2004 are highlighted in the following sections. Houston TranStar Operations Houston TranStar staff provides administrative, coordination, and systems support for the facility and partner agencies. Representative activities for the year include:
• Hosted 101 tours with 1,618 visitors to Houston TranStar (Table 2); • Conducted 26 “special visits” including elected officials and national transportation
professionals; • Hosted 12 news conferences by partner agencies; • Hosted 11 conferences and exercises including national Intelligent Transportation
Systems (ITS) workshop; • Significantly expanded traveler information website; • Participated with City of Houston in planning, traffic management, and traveler
information for Super Bowl XXXVIII; • Continued systems upgrades and integration migration to the Asynchronous Transfer
Mode (ATM) communication system by partner agencies; • TxDOT extended the Computerized Traffic Management System (CTMS) seven miles on
SH 146; and • Houston TranStar website honored for third time by Federal Highway Administration
(FHWA).
Table 2. Houston TranStar Visitor Activity Year Number of Tours Number of Visitors 1997 57 n/a 1998 99 n/a 1999 168 3149 2000 191 3515 2001 187 3834 2002 114 2086 2003 113 2468 2004 101 1618

Houston TranStar Annual Report – 2004 Page 5 of 50
Traffic Management Each of the four Houston TranStar agencies is involved in various ways in traffic management of the area’s freeways and arterials. Texas Department of Transportation: TxDOT is responsible for traffic management of freeways and state-maintained arterial highways in the region. The CTMS has been in continuous deployment on Houston area freeways since the late 1980s with seven miles added in 2004. Total extent of the system now exceeds 240 miles. Components of the CTMS include closed circuit television (CCTV), dynamic message signs (DMS), highway advisory radio (HAR), flow signals, travel time monitoring using the Automatic Vehicle Identification (AVI) system, and related fiber/communications systems and central facility computer systems. The extent of the freeway management and other ITS components are listed in Table 3.
Table 3. Deployment of Freeway Management Components Field Devices Number of Devices Closed Circuit Television 353 Dynamic Message Signs 157 Highway Advisory Radio 12 Flow Signals in Operation 108 Fiber Optic Cable (miles) 242 Automatic Vehicle Identification Locations 239
Roadway Weather Systems 41 Flow signals provide a positive means for managing freeway demand and enhancing safety with 108 ramps operating in 2004. The location of flow signals by freeway is listed in Table 4.
Table 4. Operating Flow Signals by Freeway Freeway Number of Flow Signals IH 10 Katy 19 IH 45 North 20 US 290 Northwest 20 US 59 Southwest 14 IH 45 Gulf 26 IH 610 Loop 8 Total 108

Houston TranStar Annual Report – 2004 Page 6 of 50
Partner agencies under the leadership of TxDOT are participating in federally sponsored ITS Priority Corridor and ITS deployment programs. These two programs have added significantly to Houston TranStar’s functionality, as well as providing funding for development of innovative demonstration projects by partner agencies. The Priority Corridor program was adjusted to add an additional project which will implement and evaluate an FHWA area wide adaptive traffic signal control system: Claire/DYNASMART. The system will be deployed and evaluated in the next two to three years. A number of freeway-to-freeway connectors are being instrumented with a detection/warning system aimed at preventing truck rollover accidents. The prototype of this technology was deployed and evaluated as a Priority Corridor project. In addition, the Priority Corridor and ITS Deployment programs have resulted in deployment of DMS and HAR units in the region, development of database technology for traffic detectors, development and expansion of environmental monitoring systems on roadways, and deployment of the Sugar Land train monitoring system. City of Houston: The City of Houston Signal Engineering and Operations Branch, located at Houston TranStar, directs the design and installation of new traffic signals, operates and manages the signal system, and oversees operations and development of the signal communications infrastructure. The Signal Branch employs 22 full-time employees that oversee design and operations of field devices and the City's portion of the "I2" (formerly ICONS) signal control software system. The section manages the federally funded Congestion Mitigation and Air Quality (CMAQ) Program whose goal is to reduce the impact of vehicle exhaust and arterial congestion. This section manages the implementation of the Regional Computerized Traffic Signal System (RCTSS), which is designed to tie the operation of 1,225 traffic signals to a single control center located at the Houston TranStar center. Additionally, it oversees operation of the city's 2,350 signalized intersections, which includes traffic signal synchronization and modification, changing timing or adding protected turn phases, and reconfiguring lane usage and assignments. Initiatives in 2004 included the Traffic Signal Timing Optimization Program (TSTOP). TSTOP addresses traffic signal synchronization issues in the City of Houston and was a two-phase program that began on January 7, 2004 (Phase 1) and is scheduled to conclude on December 31, 2005 (Phase 2). The central focus of TSTOP is to provide an optimized level of traffic signal operation on the city's most heavily traveled corridors and throughout some of its most heavily populated employment areas. In all, TSTOP 2004 affected 1,540 traffic signals on 85 specified corridors as well as those in the Downtown, Midtown, Uptown, and the Texas Medical Center employment areas. TSTOP 2005 will retime 582 traffic signals distributed over 71 critical corridors throughout the City. TSTOP did include provision for upgrading controllers and detection at approximately 150 signalized intersections. Initial evaluations of TSTOP corridors indicate travel time savings of 10 to 25 percent. Through the City of Houston CMAQ project, timing on 138 additional traffic signals will be optimized within the same model.

Houston TranStar Annual Report – 2004 Page 7 of 50
In addition to providing the program management for TSTOP, the Traffic Signal Engineering and Operations Section is responsible for developing optimization plans for all of the selected zones. Their role in this process consists of field data collection, timing plan design, and timing plan implementation. The City also actively coordinates signal operations in work zones and at political boundaries with TxDOT and Harris County. Harris County Public Infrastructure Department: The Harris County Public Infrastructure Department's (HCPID) Traffic Management and Operations Section manage the operation of the County's signal infrastructure and communications system from offices located within Houston TranStar. The scope of these activities includes management, operation, and construction of the County's traffic signal communications infrastructure. Current integration activity is adding 145 miles of fiber optic cable links to the Houston TranStar infrastructure. These activities include connecting to four existing hub buildings located throughout the County. These hub buildings are currently being integrated to the center via the ATM network and have current capability to receive video data from ten arterial cameras. By the middle of 2005, a total of 63 arterial cameras will be added to the Houston TranStar network. By the end of 2005, 250 Harris County traffic signals will also be integrated into and managed from Houston TranStar. In addition to providing the program management for engineering and signal operations, the Traffic Management and Operations Section is responsible for developing optimized signal timing plans for corridors throughout the County. Their role in this process consists of field data collection, timing plan design, and timing plan implementation. The County also actively coordinates signal operations with the City and State at political boundaries. More than 150 signals have been retimed in 2004 in seven corridors managed by Harris County, including:
• Clay Road–Fry Road to North Eldridge Parkway (13 signals); • Barker Cypress Road–IH 10 to Spring Cypress Road (26 signals); • Westpark Toll Road Corridor (45 signals, various arterials); • Sheldon Road–US Business 90 to Jacinto Port Boulevard; • Fry Road–Westheimer Parkway to Clay Road (20 signals); • Kingsland Boulevard–Greenhouse Road to SH 99 (14 signals); • Mason Road–Winding Hollow Road to Lakes of Bridgewater (12 signals); • Louetta Road–Grant Road to Holzwarth Road (36 signals); • Stuebner-Airline/Veterans Memorial–Blue Bell Road to Spring-Cypress Road (29
signals); and • Kuykendahl Road–Rankin Road to Kuykendahl-Huffsmith (20 signals).
Each of these signal systems is under evaluation to determine estimated measures of effectiveness to quantify reductions in stops, delay, fuel consumption and emissions.

Houston TranStar Annual Report – 2004 Page 8 of 50
The Departments signal retiming efforts have been extended into development of a proposed signal system retiming guideline that is under review for applicability to regional, interagency signal timing efforts. This signal timing guideline is intended for use on arterials that might span several jurisdictions where signal coordination is desirable. The HCPID Traffic Management and Operations Section also continues to be active in the development of federally funded efforts associated with development of national ITS cabinet and controller standards and development of ITS components to allow remote diagnostics and monitoring and signal operations. HCPID staff is also involved in development of standards to enhance information transfer capabilities between transportation and public safety systems. Metropolitan Transit Authority of Harris County: METRO is deploying the extensive RCTSS network for the benefit of Houston TranStar’s traffic management agencies. Deployment of the RCTSS accelerated significantly in 2004. The area wide system located on bus routes primarily inside the Beltway will ultimately deploy a 1,347 signal system to be operated from Houston TranStar. The system is comprised of four primary elements: central control (Houston TranStar), intersections, communications, and transit vehicle interface (for transit signal priority). The following highlights activities in 2004:
• All significant RCTSS contracts have been awarded; • RCTSS is on-time for April 2005 operation; • RCTSS is on-budget for $120 million; • The RCTSS communications “backbone” is complete, saving METRO operating dollars; • RCTSS in the Texas Medical Center and Spur 527 areas is operational; • RCTSS provided signaling platform for METRORail; • Mayor White’s TSTOP Program based in large part on availability of RCTSS equipment
and schedule; • The proposed transit signal priority treatments brought into balance with the needs for
general traffic operations and mobility; and • RCTSS provides a strong arterial signal system platform for future ITS systems and
resulting benefits. Traveler Information Systems Traveler information systems are a significant traffic management function, and Houston TranStar is a leader in the scope and timeliness of its real-time traveler information systems. Monitoring systems at Houston TranStar provide extensive information of value to motorists as well as traffic management operators at Houston TranStar. Information is provided to motorists by four means: DMSs, HAR, the Internet, and the local media.

Houston TranStar Annual Report – 2004 Page 9 of 50
The 157 DMSs provide information on traffic incidents and planned construction, giving location, travel direction, and nature of incident or activity. There were 94,658 messages displayed on DMSs in 2004, as listed in Table 5. In addition, over two million automated travel time and ferry wait time messages were displayed on DMS. Ferry wait times were displayed seasonally (during spring and summer) and accounted for less than on percent of total DMS travel time messages. HAR broadcast similar travel information at the 12 HAR sites located throughout the area with 1,873 HAR messages broadcast in 2004. CCTV provides a means for operators and the media to view traffic conditions and verify incidents.
Table 5. Dynamic Message Sign Operator Activations in 2004 Messages Number Operated for Incidents 58,619 Operated for Road Closures (Construction) 23,630 Operated for State Authorized Amber Alerts 319 Operated for State Authorized Amber Alert Tests 27 Operated for Weather Incidents 1,180 Operated for Ozone Alerts 530 Operated for Safety Campaigns 139 Operated for Public Meetings 18 Operated for Special Events 928 Operated for Miscellaneous Purposes 9,268 Total 94,658
Local radio and television stations have access to Houston TranStar’s travel time data, incident data, and the freeway cameras and use this information frequently during peak period broadcasts. In addition, traffic service organizations are housed on the operations floor of Houston TranStar. The Houston TranStar website has experienced an evolution with new information being added on an on-going basis. Highlights and enhancements to the website in 2004 include:
• Total website accesses increased from 68.8 million in 2003 to 99.2 million in 2004, a 31 percent increase. Average monthly users increased from 125,000 in 2003 to 163,000 in 2004, a 30 percent increase.
• Moved the Houston TranStar Traffic Information Website (http://traffic.houstontranstar.org) to a higher bandwidth Internet connection. This increased the capacity of the website and dramatically improved response times during periods of heavy usage such as severe weather events.
• Deployed a traffic information website regarding the US 59/Spur 527 construction. The website contained project information, schedules, real-time construction lane closures, available alternate routes and other traffic information related to the project.
• Developed a public website for the SAFEclear Traffic Incident Response Program. • Added day of week comparisons to the speed chart application. • Deployed a new Road Closure/Incident web application that displays incidents, road
closures, and high water locations in separate tables, improving the usability of the previous application.

Houston TranStar Annual Report – 2004 Page 10 of 50
• TxDOT deployed an information system for tracking and disseminating real-time ferry wait times for the Galveston-Bolivar Ferry. The system automatically posts wait times to DMS as well as the website.
• The Traffic Alert E-Mail Notification System was featured in several publications including the Houston Chronicle and the Houston Business Journal. As a result, 850 new subscribers were added to the system within a two-week period.
• Received the FHWA Award for being one of the best traveler information websites in the United States. This is the third such award in the last four years.
• Deployed a new web-based traffic map for the Houston region. The new system allows users to toggle map features on and off, view additional maps of the Houston region with expanded coverage, zoom in and out of specific map areas, and click on hot links to various traveler information directly from the maps.
• Deployed a new web-based traffic map targeted at mobile devices such as cellular phones and personal digital assistants (PDAs).
The Traffic Alert Incident Notification System provides free e-mail traffic alerts to subscribers. Over 4.3 million e-mail alerts were sent to 3,759 subscribers with the monthly activity shown in Table 6.
Table 6. Traffic Alert Notification System Activity–2004 Month New Subscribers Alerts Sent January 82 239,193 February 108 285,370 March 73 332,473 April 85 333,055 May 131 304,471 June 124 373,995 July 88 341,305 August 85 330,454 September 164 339,893 October 870 461,637 November 160 508,695 December 111 458,498 Total 2,081 4,309,039

Houston TranStar Annual Report – 2004 Page 11 of 50
With the added features and increasing public visibility and knowledge of the website, access activity increased significantly in 2004 to over 99 million unique accesses. Accesses by month are shown in Table 7 with February being the highest month and December the lowest. Yearly trends are shown in Table 8.
Table 7. Houston TranStar Website Usage–2004 Month Number of Users Number of Accesses January 143,758 8,347,336 February 181,125 9,523,760 March 157,506 8,877,915 April 161,643 9,288,245 May 166,142 9,396,910 June 167,087 8,264,946 July 149,086 8,254,183 August 152,671 7,253,720 September 162,716 7,708,483 October 151,688 9,162,992 November 188,848 6,662,122* December 171,492 6,491,209* Total 99,231,821
*Due to the improved efficiency of the website design beginning in November 2004, total page accesses will be approximately 25% less than they were before given the same number of unique users.
Table 8. Website Yearly Trends Year Number of Accesses Average Monthly Users 1998 6,853,628 31,021 1999 10,690,290 39,623 2000 16,609,507 54,374 2001 48,781,408 89,095 2002 55,616,870 108,732 2003 66,812,294 125,008 2004 99,231,821 162,814

Houston TranStar Annual Report – 2004 Page 12 of 50
The National Football League's Super Bowl XXXVIII was held on Sunday, February 1, 2004 with activities spread throughout the preceding week. The website activity was consistent with typical weekday trends during this week. However, website traffic was seen to increase (by 50 to 100 percent) on the Saturday before and Sunday of the game. Website activity for this week is illustrated in Figure 2.
-
50,000
100,000
150,000
200,000
250,000
300,000
350,000
400,000
450,000
500,000
Monda
y
Tuesda
y
Wed
nesd
ay
* Thu
rsday
Friday
Saturda
y
Sunda
y
Day of Week
Web
site
Acc
esse
s
Super Bowl Week (*Thursday was a rain day) Typical Week
Figure 2. Website Accesses During the Week of Super Bowl XXXVIII
(January 26–February 1, 2004)

Houston TranStar Annual Report – 2004 Page 13 of 50
Emergency Response The Office of Emergency Management (OEM) for Harris County operates from Houston TranStar. The City of Houston Office of Emergency Management relocated its operation to the City’s Houston Emergency Center, although close coordination is maintained with Houston TranStar. A fully equipped operations center provides the connectivity for the OEMs and partners at Houston TranStar to effectively respond to and recover from the impacts of emergencies and/or disasters. Training programs are also coordinated and conducted. Harris County operates a stream flood monitoring system and, with TxDOT, a roadway flood, wind, and ice monitoring system. Both of the systems are accessible on the Internet. Houston TranStar enhances the operations of the OEMs through the availability of the facilities for monitoring transportation and weather conditions, communicating with the appropriate agencies and jurisdictions, and meeting and training with other Houston TranStar agency staffs. This region is vulnerable to natural and technological emergencies and disasters such as flooding, tornadic thunderstorms, tropical storms and hurricanes, hazardous material spills, fires, and industrial accidents. Activations may include such events as hazardous material incidents, truck crashes, pipeline ruptures, train derailment, and chemical explosions. Other Houston TranStar partners assist the OEMs during the activations by providing unique technical and managerial expertise as well as additional manpower and facilities support. The joint effort by the Houston TranStar agencies enables faster response times in dispatching the appropriate equipment and manpower, resulting in more effective and efficient responses that reduce the cost of activations. The community also benefits by reductions in the impact of the emergencies. The Harris County Commissioners’ Court in July 2004 changed the name of the Office of Emergency Management to the Office of Homeland Security & Emergency Management (HCOHS&EM). The change of name reflects the additional tasks delegated to the Office. The HCOHS&EM continues in its partnership with the Texas Department of Transportation, Metropolitan Transit Authority, and the City of Houston Transportation Department. During the year, the Emergency Operations Center (EOC) was activated ten times for Homeland Security incidents. These events included natural, manmade (including terrorism and weapons of mass destruction), and technological occurrences. The OHS&EM for Harris County is housed in, and is a partner agency in Houston TranStar. A fully equipped Emergency Operations Center provides the connectivity for the HCOHS&EM to efficiently coordinate the County’s response to those hazards with the potential of impacting Harris County. The Emergency Operations Center is additionally used for the training of personnel in the response procedures for the vulnerabilities that Harris County and this region are susceptible to. HCOHS&EM operates a stream flood monitoring system on 22 major watersheds in Harris County and, with TxDOT, a roadway flood, wind, and ice monitoring system. Both of the systems are accessible to the public via the Internet at www.hcoem.org. Due to Houston TranStar’s unique ability to coordinate traffic management, emergency management, and homeland security, the Emergency Operations Center continues to act as a base for regional and multi-jurisdictional training and exercises. In recognition of this ability, the State of

Houston TranStar Annual Report – 2004 Page 14 of 50
Texas has designated the EOC and Houston TranStar as its Regional Operations Center for evacuations. Houston TranStar’s mission is to enhance the operations of the regional offices of emergency management. To accomplish this, the Emergency Operations Center has the ability to monitor and coordinate regional transportation routes based on current and forecasted weather conditions. The EOC can communicate with those agencies and jurisdictions having homeland security roles. The facility provides meeting and training space not only for partner agencies, but other agencies and jurisdictions within the region. This Greater Harris County region is vulnerable to natural, manmade, and technological emergencies/disasters. The Emergency Operations Center has been and will be activating for hazardous material incidents, truck crashes, pipeline ruptures, train derailment, chemical explosions, flooding, tornadoes, thunderstorms, tropical cyclones (including named tropical storms and hurricanes), fires, and industrial accidents. Houston TranStar’s partners assist the EOC during the activations by providing unique technical and managerial expertise, as well as additional manpower and facility support. The joint effort by the Houston TranStar agencies enables faster response times in dispatching the appropriate equipment and manpower, which results in more effective and efficient responses that reduce the loss of life and property of our citizens. The HCOHS&EM expanded its stream flood monitoring system to 129 sites along the 22 watersheds in the County, in addition to the dedicated sites for the METRO rail system and Park and Ride facilities. Due to the fact that heavy rainfall can cause traffic problems/accidents, interactive rainfall alarms were set up to be sent to the pagers of key response and emergency management personnel to help in the monitoring of the situation. To further support Houston TranStar’s mission, the HCOHS&EM has created a redundant website to ensure the ability to provide information to the public through its School Closing Notification System, Ozone Warning System, Media Alert Notification System, Rain Fall Maps, and Stream Level Templates. In the past, the HCOHS&EM website has received 7,365,290 hits with a one-day high of 300,000 inquiries. Harris County continues to expand its regional radio system, which is currently being used by numerous agencies in the twenty-three county area. This radio system gives the Emergency Operations Center the ability to communicate with the largest number of responders and governmental agencies of any radio system in the region. Incident Management Freeway incidents are a major cause of congestion in the Houston area, and the detection, response, and clearing of incidents is an important function of Houston TranStar. The Houston TranStar agencies play a major role in incident response management and information dissemination. Incidents are entered into the Regional Incident Management System (RIMS) operations database by agency personnel. Incident data were primarily entered by TxDOT operators and METRO Police as shown in Table 9. Most of METRO's reported incidents (688 of 697) were on the high occupancy vehicle (HOV) lanes. There were 10,127 incidents recorded by Houston TranStar operators. Distribution of incident by freeway and month are shown in Tables 10 and 11.

Houston TranStar Annual Report – 2004 Page 15 of 50
Table 9. Roadway Incidents Recorded Into RIMS by Agency Agency Number of Incidents Percent of Total TxDOT 12,408 94.7% METRO 697 5.3% Harris County 0 0% City of Houston 0 0% Total 13,105 100% Note: This table includes only roadway incidents and does not include other incidents entered by offices of Emergency Management.
Table 10. Houston TranStar Recorded Freeway Incidents by Month–2004 Month Number of Incidents January 935 February 967 March 1,168 April 1,125 May 1,101 June 1,271 July 1,083 August 1,028 September 1,073 October 1,120 November 1,140 December 1,094 Total 13,105

Houston TranStar Annual Report – 2004 Page 16 of 50
Table 11. Houston TranStar Recorded Incidents by Freeway–2004 Number of Incidents Freeway
Main Lanes HOV Lanes IH 10 East 1,027 n/a IH 10 Katy 1,756 198 IH 45 Gulf 1,525 81 IH 45 North 1,830 182 SH 288 324 n/a US 290 Northwest 623 92 US 59 Eastex 356 41 US 59 Southwest 1,522 94 IH 610 East Loop 407 n/a IH 610 North Loop 654 n/a IH 610 West Loop 1,362 n/a IH 610 South Loop 607 n/a SH 225 186 n/a Other 238 n/a Subtotal 12,417 688 Total Incidents 13,105
Incident location and status are automatically provided on the traffic website. Operators develop and activate DMS messages providing information on the incident (e.g., traffic direction, location, type incident, lanes blocked). Temporal patterns of incidents by hour of day, by day of week, and month are illustrated in Figures 3, 4, and 5.

Houston TranStar Annual Report – 2004 Page 17 of 50
0
200
400
600
800
1000
1200
1400
12:00
PM
2:00 A
M
4:00 A
M
6:00 A
M
8:00 A
M
10:00
AM
12:00
PM
2:00 P
M
4:00 P
M
6:00 P
M
8:00 P
M
10:00
PM
Time of Day
Num
ber o
f Inc
iden
ts
Figure 3. Freeway Incidents by Time of Day
842
2115 23
03
2260
2326
2306
953
0
500
1000
1500
2000
2500
Sunday Monday Tuesday Wednesday Thursday Friday Saturday
Day of Week
Tota
l Num
ber o
f Inc
iden
ts R
ecor
ded
Figure 4. Freeway Incidents by Day of Week

Houston TranStar Annual Report – 2004 Page 18 of 50
0
200
400
600
800
1000
1200
1400
Janu
ary
Febr
uary
Mar
ch
Apr
il
May
June July
Aug
ust
Sept
embe
r
Oct
ober
Nov
embe
r
Dec
embe
r
Month
Num
ber
of In
cide
nts
Figure 5. Incidents by Month
TxDOT initiated a resource recovery contract in 1998 to provide heavy-duty wreckers for crashes and spilled loads involving tractor-trailer trucks. The contract was modified in 2002 to extend coverage to include the area inside Beltway 8. Houston TranStar operators request the heavy-duty wreckers with truck owners paying the cost for the wrecker service. In 2004, there were 78 incidents requiring dispatch of wreckers under this contract. This represents a 13 percent reduction from 2003 in the number of incidents requiring heavy-duty wreckers. The Motorist Assistance Program (MAP) is one of the most visible services operated by Houston TranStar, in partnership with the private sector. There were 34,443 incidents handled by MAP in 2004 with 37,311 persons receiving assistance (Figure 6). A breakdown of the types of services provided by MAP personnel is shown in Table 12.

Houston TranStar Annual Report – 2004 Page 19 of 50
0
10,000
20,000
30,000
40,000
Incidents Handled 37,157 36,951 32,501 30,692 32,540 35,743 33,500 32,424 34,443
Persons Assisted 39,076 39,240 38,658 32,198 38,193 37,324 34,712 33,329 37,311
1996 1997 1998 1999 2000 2001 2002 2003 2004
Figure 6. Motorist Assistance Program Activity from 1996 to 2004
Table 12. Motorist Assistant Program Services Provided–2004 MAP Activity Number of Incidents Abandoned Vehicle 8,575 Mechanical Problem 7,888 Flat Tire 6,076 Stalled Vehicle 3,929 Directions/Information 4,884 Motorist Used MAP Phone 1,542 Accident Assistance 1,760 Wrecker Needed 1,366 Provide Fuel 1,472 Debris Removal 1,330 Jump Start 1,049 Other 4,965 Total 44,6611
1 Total exceeds number of incidents as multiple activities occurred for some incidents.

Houston TranStar Annual Report – 2004 Page 20 of 50
Under METRO’s direction, the Mobile Operations Center (MOC) was developed as part of a Priority Corridor project for use in management of major incidents and special events. The MOC is equipped with advanced surveillance and communications equipment. The MOC was displayed and its functions demonstrated at the 2004 ITS America Annual Meeting in San Antonio. The roadway weather information system developed by TxDOT and Harris County provides information on current weather and roadway environmental conditions to the Houston TranStar control room and on the Internet. The system includes 41 locations with additional sites planned for the future. The system provides critical information on roadway flooding and icing, as well as other site specific weather information. The information is displayed on the Harris County OEM website, which receives five to six million accesses per month. METRO Operations METRO programs operated from Houston TranStar include: METRO bus dispatch, METRORail control center, HOV lane operation and incident management, and monitoring and operation of park and ride facilities. METRO utilizes 17 dispatchers to manage the active fleet of 1,380 buses. METRORail utilizes seven controllers for its 18 car Main Street Line. The Houston area HOV system is recognized as the leading network of its kind in the world. The HOV lane system has evolved since 1979 to include over 95 miles of one-way reversible lanes and 11 miles of concurrent lanes, primarily in freeway medians for use by buses, vanpools, and carpools. Total HOV system operation utilization in December 2004 was measured at 37,433 vehicle-trips per day and 115,952 person-trips per day. Park and ride facilities were used by approximately 17,000 vehicles per day. Historical HOV trends are shown in Figure 7. METRO operates the QuickRide program on the Katy HOV lane as part of the FHWA Value Pricing Program. The program is considered a high occupancy/toll (HOT) lane concept in that higher occupancy vehicles use the facility at no cost, while two-person carpools pay a toll to use the lane. Occupancy requirements for the Katy HOV lane were raised from 2+ to 3+ persons for the AM peak hour in 1988 when level of service on the lane dropped below “C”. The PM peak hour was included in the program in 1991. The QuickRide program allowed for the excess capacity to be sold to two-person carpools while still maintaining a level of service “C”. In 2001, the QuickRide program was expanded to US 290 during the AM peak. As of 2004, Houston had two of the four operating HOT lanes in the nation. In addition to its HOV operation, METRO Police’s Houston TranStar Division serves as the combined communications and records management section, watch command center, and central security monitoring center. It manages specific capital and technology-related projects to enhance police effectiveness and efficiency, security projects to reduce the use of contract security guards and ensure integration of METRO projects into the Houston TranStar architecture and support systems.

Houston TranStar Annual Report – 2004 Page 21 of 50
Figure 7. Historical Daily Vehicle Trip Trends on HOV Lanes

Houston TranStar Annual Report – 2004 Page 22 of 50
ESTIMATED BENEFITS Determining the benefits of Houston TranStar is limited and conservative, since many of the benefits are not quantifiable and some are intangible. An attempt is made to develop estimates of those benefits, which are quantifiable, e.g., the cost of motorist delay savings, fuel savings, and emissions savings. An approach was established in preparing annual reports for prior years, which estimates the operational benefits in terms of freeway motorist delay savings. Traffic congestion on the freeway system was determined from the AVI travel time monitoring system, traffic volumes from the TxDOT annual volume-roadway inventory files, and travel time studies on non-AVI segments. The procedure for evaluation uses national experience to establish Houston TranStar quantitative goals for expected benefits and the expertise of Houston TranStar staff to estimate performance of the transportation systems in terms of percent attainment of the goals. The projected costs of congestion for the year 2004 were calculated to be nearly $860 million. Annual benefits in the reduction of travel time were estimated to be 12.7 million vehicle-hours with an estimated monetary value of $224 million. A summary of estimated operational savings is provided in Table 13. The savings in travel time are equivalent to reducing fuel consumption by 23.3 million gallons for an additional savings of $41.0 million. Thus, total 2004 motorists’ savings was $264.7 million. Since 1997 (when benefits were first estimated), Houston TranStar has saved Houston area motorists over one billion dollars in reduced delay cost as summarized in Table 14.
Table 13. Houston TranStar Transportation Management Estimates of Benefits for 2004 Annual Benefits Resulting from
Transportation Management Deployments Transportation Management Deployments
Reduction in Congestion in Vehicle Hours
Value of Time Saved (Millions of Dollars*)
Transportation Management Center 1,271,800 $ 22.372 Traveler Information 5,164,500 $ 90.845 Incident Management 4,369,000 $ 76.851 Flow Signals (Ramp Metering) 1,910,200 $ 33.601 Totals 12,715,600 $ 223.668
* A value of time of $17.59 per vehicle hour is used in this analysis.

Houston TranStar Annual Report – 2004 Page 23 of 50
$0.0
$50.0
$100.0
$150.0
$200.0
$250.0
$300.0
Benefit ($Mil) $46.3 $69.2 $95.5 $110. $133. $166. $167. $265.
1997 1998 1999 2000 2001 2002 2003 2004
Table 14. Congestion and Cost Savings Since 1997
Year Congestion Savings (vehicle-hours)
Traveler Cost Savings ($)
1997 2,719,300 $ 46,266,000 1998 4,075,800 $ 69,219,000 1999 5,439,000 $ 95,509,000 2000 5,866,000 $ 110,914,000 2001 6,945,800 $ 133,155,000 2002 8,559,200 $ 166,310,000 2003 8,338,800 $ 167,261,000 2004 12,715,600 $ 264,651,000 Total 54,659,500 $1,053,285,000
Reduction in the amount of fuel consumed also results in a reduction of exhaust emissions. Based on U.S. Department of Transportation (USDOT) Bureau of Transportation Statistics, the reduction of 23.3 million gallons of fuel is equivalent to a reduction of 503 tons of hydrocarbons; 3,250 tons of carbon monoxide; and 731 tons of nitrogen oxides. A benefit/cost analysis was conducted, comparing the benefits discussed previously to the annual costs of Houston TranStar. Annual costs include annualized capital costs, annual operational costs of the Houston TranStar systems, and the annual cost of operation and maintenance of the field installations. The annual costs estimates are $22.9 million, which divided into the annual benefit of $264.7 million, yields a benefit/cost ratio of 11.6. Benefit and benefit/cost information is illustrated in Figures 8 and 9.
Figure 8. Benefits for Houston TranStar–1997 to 2004

Houston TranStar Annual Report – 2004 Page 24 of 50
0.0
2.0
4.0
6.0
8.0
10.0
12.0
14.0
B/C Ratios 2.7 3.9 5.3 5.2 6.0 7.3 7.0 11.6
1997 1998 1999 2000 2001 2002 2003 2004
Figure 9. Benefit/Cost Ratios for Houston TranStar–1997 to 2004 There was a significant increase in delay savings and benefit/cost from 2003 to 2004. This reflects the increase in operational efficiency measures used in estimating delay savings, as well as the compounding effects of increased gasoline prices, value of congestion (cost/vehicle-hour), and the magnitude of estimated congestion. The significant increase in estimated base congestion, from which congestion savings are calculated, is attributed to normal growth of congestion plus construction activities on the Katy Freeway, West Loop, and Southwest Freeway (including Spur 527), and use of an updated methodology for estimating congestion on non-AVI segments. This change in methodology affected particularly the Sam Houston Tollway, which has seen significant annual increases in congestion, which the previous methodology did not fully consider.

Houston TranStar Annual Report – 2004 Page 25 of 50
APPENDIX A. HOUSTON TRANSTAR PROGRAM DESCRIPTIONS
The Houston TranStar consortium is a partnership of four government agencies that are responsible for providing Transportation Management and Emergency Management services to the Greater Houston Region. TxDOT, Harris County, METRO, and the City of Houston have implemented an interlocal agreement to share their resources and find solutions for providing traffic, mobility, and emergency management services to the citizens of the region. Houston TranStar was created in 1993 and began operations in its current location on April 15, 1996. Houston TranStar combines the expertise and resources of each partner agency to provide an unprecedented level of service to the citizens of the greater Houston region. Each partner agency has brought high-tech systems to the state-of-the-art center to manage their individual functions. These resources are in-turn available to assist and advise other partner agencies. The center currently collects, operates, and/or disseminates information for the region using the following systems:
• Houston TranStar Traffic Management Center; • Fiber Optic Communications Network; • Closed Circuit Television (CCTV) Camera System; • Automatic Vehicle Identification (AVI) System and Automated Travel Time
Dissemination; • Regional Incident Management System (RIMS); • Roadway Weather Information System (RWIS); • Traveler Information Systems:
o Internet; o Dynamic Message Signs (DMS); o Highway Advisory Radio (HAR); o Personal Traffic Alert Notification System; and o Broadcast Media Support.
• Flow Signal Operation at Freeway Entrance Ramps; • Regional Computerized Traffic Signal System (RCTSS); • High Occupancy Vehicle (HOV) Lane System; • QuickRide Program; • Motorist Assistance Program (MAP) and SAFEclear Towing Program; • METRO Bus Dispatch and METRORail; • Freeway Interchange Truck Rollover Warning System; • Sugar Land Railroad Monitoring System; and • Emergency Operations Center.

Houston TranStar Annual Report – 2004 Page 26 of 50
A summary of the activities of each of these critical traffic management and/or emergency operations elements of Houston TranStar follows. Houston TranStar Traffic Management Center Officially created in August 1994, but not beginning operations in the current building until April 1996, Houston TranStar is the first Transportation Management Center (TMC) in the nation to combine traffic management and emergency management operations into one building. The center was also the first in the country to combine State, City, County, and Transit operations into one operations center. The four government entities housed are:
• State of Texas (TxDOT–Transportation Management Systems); • Harris County (Traffic Department and OEM); • City of Houston (Traffic Department); and • METRO (Bus, HOV Operations, and Rail Operations).
Houston, Texas is the fourth largest city in America and the largest in the Southern region of the United States and keeping traffic moving safely and efficiently requires constant maintenance. However, building and repairing roads and freeways are only part of the equation. The Houston TranStar partnership has been a leader in designing and implementing transportation operations and management plans to get citizens of the region where they want to go. Whether the destination is work or play, Houston TranStar plays a pivotal role in the travel of people in the greater Houston region. Since its inception, the Houston TranStar partnership has handled transportation issues in the most efficient method possible: through the application of shared technology and interagency coordination. This partnership has allowed for regional collection and dissemination of traffic and emergency management data. The center currently operates the following transportation system elements:
• Fiber Optic Communications Network; • Closed Circuit Television (CCTV) Camera System; • Automatic Vehicle Identification (AVI) System and Automated Travel Time
Dissemination; • Regional Incident Management System (RIMS); • Roadway Weather Information System (RWIS); • Traveler Information Systems:
o Internet; o Dynamic Message Signs (DMS); o Highway Advisory Radio (HAR); o Personal Traffic Alert Notification System; and o Broadcast Media Support.
• Flow Signal Operation at Freeway Entrance Ramps; • Regional Computerized Traffic Signal System (RCTSS);

Houston TranStar Annual Report – 2004 Page 27 of 50
• High Occupancy Vehicle (HOV) Lane System; • QuickRide Program; • Motorist Assistance Program (MAP) and SAFEclear Towing Program; • METRO Bus Dispatch and METRORail; • Freeway Interchange Truck Rollover Warning System; • Sugar Land Railroad Monitoring System; and • Emergency Operations Center.
Houston TranStar was founded under an Interlocal Agreement for a Regional Transportation Management Program as provided for under Chapter 791 of the Texas Government Code. This agreement spells out the goals of the Center, its structure and funding arrangements. The Center is guided by an Executive Committee consisting of chief executive officers of each agency. The facility (physical plant) management is led by an Executive Director who is a City of Houston employee. The Executive Director oversees operations and maintenance of the Houston TranStar facility and acts as coordinator between agencies. However, traffic, mobility, emergency operations, and homeland security functions operate from within each partner agency. The center disseminates information to the traveling public via DMS, HAR, and the Internet (houstontranstar.org website and personal alert information "push" services). The Center also delivers content to local television and radio stations, as well as private traffic information services. The internet-based information is based largely on the AVI system, which started in 1994 with 50,000 transponders, has now grown to 1.5 million transponders, covering 495 miles of directional roadways (each direction of covered freeways plus HOV coverage). Over 180,000 unique users access the Houston TranStar website www.houstontranstar.org and in 2004 nearly 100 million accesses were made to the Houston TranStar web pages. Houston TranStar has begun to prepare for the next generation of real-time traffic information dissemination by deploying mobile web applications that can be accessed via web-enabled cell phone or PDA devices while traveling. The current Personal Alert Program has been very popular, evidenced by the rate of subscription, which went up 380 percent over the previous year. The ultimate goal is the use of this information into a sufficiently equipped traveler’s automobile. Houston TranStar's support for this mission makes real-time information automatically available for trip decisions. As technology changes and more wireless devices are made available, the public will no longer tied to only the website. When communications into the automobile become more commonplace through the use of wireless hot spots, cellular or satellite communications, real-time information from Houston TranStar will be downloaded while they travel. Funding Sources: CMAQ, Surface Transportation Program (STP), Federal Transit Administration (FTA) Funding, State Funding, and Local Funding. Future Direction: The Center has become the hub for regional traffic and emergency management data. Harris County’s 911 Center is planned to be integrated into Houston TranStar and the Center will continue to expand its Intelligent Transportation System network. Center-to-Center

Houston TranStar Annual Report – 2004 Page 28 of 50
communications will be established with other Traffic Management Centers in the region and statewide. Benefits: Since opening in 1996, Houston TranStar has saved Houston motorists one billion dollars in reduced congestion and travel delay costs. Travel time savings are equivalent to reducing fuel consumption by an estimated 23.3 million gallons of fuel. Reduction in the amount of fuel consumed also results in a reduction of exhaust emissions. Based on USDOT statistics, the reduction of 23.3 million gallons of gasoline is equivalent to 503 tons of hydrocarbons, 3,250 tons of carbon monoxide, and 731 tons of nitrogen oxides. These benefits do not include the unquantifiable benefits of the emergency management center and other safety operations housed at Houston TranStar. The benefit-to-cost ratio of the Center has been calculated at 11.6. Simply put, for every dollar spent on Houston TranStar operations, the traveling public saves approximately eleven dollars. Fiber Optic Communications Network Description: The fiber optic communications network is the backbone of Houston TranStar’s transportation management system. All communications between the Houston TranStar center and the various field devices take place through this network. The system enables the high-tech equipment from all partner agencies to correspond and coordinate enabling the traffic system to become a region-wide traffic network. As part of the CTMS, 325 freeway miles of TxDOT-owned backbone fiber optic communications cable has been installed around the Houston region. This cable is used by various agencies at Houston TranStar for transportation management in the region. Communication via fiber optics is fast and reliable on the cables that have been placed in the freeway right-of-ways of the State. Various transportation devices are communicated by the fiber optic cable, including DMS, Flow Signals, CCTV, and other devices. Real-time traffic data is also communicated via the fiber optic cables. Funding Source: CMAQ and State Funding. Future Direction: Construction is underway to add another 100 freeway miles of fiber optic communication cable to Houston area freeway system and fiber backbone. METRO, County and State systems will be linked together for greater flexibility. Benefits: Fiber optic communications cable is an effective way to move large amounts of data and video. The control of traffic devices requires a secure system and the placement of fiber communications in the State right-of-way enhances system security, because problems can easily be detected and repaired. In addition, the fiber network is being developed to have redundant links so that if one link is severed, data traffic is re-routed to functioning links. On a regional basis, sharing

Houston TranStar Annual Report – 2004 Page 29 of 50
fiber among agencies leverages resources and provides a more robust system at a lower operational and maintenance cost than leased lines. Closed Circuit Television (CCTV) Camera System Description: CCTV is part of the “Transportation Management System.” The primary incident management tool of the Houston TranStar Traffic Management Center is 353 CCTV cameras located on major freeways throughout the Houston area. The cameras are generally placed at one mile intervals on selected segments of the freeway. The cameras are able to zoom in from ½ mile distances, rotate 355 degrees on the horizontal axis and 120 degrees vertically. Most of the camera sites are located at cross streets so that cross street traffic can also be monitored. Views from these cameras are sent from the field to the center through a state owned fiber optic communications network. The cameras are used to locate, verify and monitor traffic accidents, construction, special events, weather events and congestion. The images from these cameras are disseminated to the four local television stations for broadcast to the public. Frequently updated snapshots from these cameras are displayed on the Houston TranStar website, www.houstontranstar.org. Funding Source: CMAQ, State Funding, and Local Funding. Future Direction: The deployment of cameras will be continued until all major freeways in the six counties under the responsibility of the TxDOT Houston District are covered. Harris County has started deployment of cameras on major arterials in the western portion of the County. These cameras will be integrated into the TMC once the ATM Communication system has been deployed and has been completed (scheduled for 2005). The dissemination of these camera images to local cities and county government will be provided through the use of the fiber network and streaming video over the Internet. Wireless cameras are currently being deployed in prototype systems and are being planned for "last mile" remote monitoring or outlying critical links. Benefits: The CCTV camera system is a valuable part of the Traffic Management System. CCTV output is one of the most requested informational products by the media and traveling public. The benefits from the CCTV system are a major contributor to the congestion cost savings since Houston TranStar became operational. Automatic Vehicle Identification (AVI) System Description: The Houston TranStar AVI traffic monitoring system measures travel speeds on Houston area freeways and HOV lanes by using AVI reader stations and over 1.5 million AVI toll tags (transponders). The AVI system determines the travel speeds on roadway segments by calculating the time it takes a vehicle equipped with an AVI tag to travel a predetermined distance between two AVI tag readers mounted above the roadway. The AVI system requires the mounting

Houston TranStar Annual Report – 2004 Page 30 of 50
of AVI tag readers on overhead sign structures or on the side of the road, similar to installations on the local toll road system. The AVI system has been operational since 1994 when it was installed by TxDOT. Today, over 70 percent of Houston area freeway miles are instrumented with AVI sensors, with coverage focused on the busiest corridors. The vehicle speeds derived from the system are used to produce color-coded speed maps for the greater Houston region’s freeways. These maps display real-time traffic and are used in traffic operations for traffic management and incident detection. It is available to the public via Houston TranStar’s web site www.houstontranstar.org. The traveler information derived from the AVI system is provided to the public through media reports, displayed on numerous roadside dynamic message signs, and on the Houston TranStar website. The travel times provided by the system are a critical part of media traffic reports and the central focus of the Houston TranStar website, which is accessed by more than 180,000 unique visitors each month and approximately 100 million accesses per year. This level of internet activity makes the Houston TranStar website one of the most visited transportation web pages in the nation. The AVI system also provides a wealth of historical data that is used for traffic operations and planning. Historical speeds and travel times have been archived since the system’s inception in 1993. This historical data is also provided to the public on the website and used for predictive data algorithms. Funding Sources: CMAQ, Priority Corridor Program, and State Funding. Future Directions: The AVI system is currently being expanded to provide greater overall coverage in the Houston region. This will allow Houston TranStar to assist traffic operations personnel and meet the demands of the public for additional traveler information in corridors where it is currently limited. Expansion of the system will provide more accurate travel time and speed information and give users more information on which to base their travel decisions. In addition, modifications may be made to refine incident detection algorithms to allow traffic operations staff to receive an alert when a possible incident is detected by variations from historical travel times. Benefits: The AVI system is used for the following purposes:
1. As a traffic operations management tool for Houston TranStar personnel to monitor traffic operations on freeways and major arterials in the Houston region.
2. As a data source for providing historical measures of Houston area traffic conditions. 3. A source for publicly available, real-time traffic information for the Houston freeway,
tollway and HOV lane systems.

Houston TranStar Annual Report – 2004 Page 31 of 50
Regional Incident Management System (RIMS) Description: RIMS is a secure web-based data management system that integrates information from traffic management and emergency management operations. RIMS was developed as part of TxDOT's Priority Corridor project and is able to keep records on the following functions:
TRAFFIC MANAGEMENT
EMERGENCY MANANGEMENT
• Traffic incidents • Heavy duty wrecker deployments • Maintenance deficiencies • Motor Assistance Programs • Road closures • Emergency events and incidents • Internal and external resources
• Emergency events and incidents • Internal and external resources • Utility outages • Facility resources • Medical facility status • Shelter status • Damage assessments • Chemical releases • News situations
Information and data flow during major emergency or incident events is crucial to the region as a whole. This was demonstrated by Tropical Storm Allison, the events of September 11, 2001, and other major disasters. Disasters affect the transportation system and resulting emergency management relief and rescue efforts. In response to the need to effectively manage information resulting from incident operations, the RIMS system was developed. The RIMS system combines traffic management and emergency management operations into one system allowing the sharing of information within Houston TranStar and the Houston region. The RIMS system combined the operations of TxDOT Transportation Management Systems, the City of Houston Emergency Management, Harris County Emergency Management, METRO, the State Department of Emergencies and the FBI for Super Bowl XXXVIII. This activity was completed over a secure connection from multiple local agencies with minimal effort because of the capability of the RIMS system. The City of Houston, Office of Emergency Management, used the RIMS to coordinate the events and activities related to Super Bowl XXXVIII held in Houston on February 1, 2004. RIMS allowed venue sites and command posts to communicate in real time. The software was used to monitor personnel location, staged equipment and personnel, and monitor any actual or perceived threats to the venue sites. RIMS provided the linkage between 27 Federal agencies, four State agencies, and several city and county departments, and other regional partners. RIMS provided the connection from the field command post through the State Operations Center in Austin, Texas touching all links in the chain.

Houston TranStar Annual Report – 2004 Page 32 of 50
RIMS was used by the Joint Terrorism Task Force to monitor real-time activity and evaluate perceived threat information from the local FBI Headquarters. The City of Houston hosted its second major sporting event of 2004. The 75th Annual Major League Baseball All-Star Game was played at Minute Maid Park the evening of July 13th. Related events were held July 9-13 at various venues around the City. Some of events were: John Hancock All-Star FunFest at the George R. Brown Convention Center, Main Event Party in downtown Houston, and the Century 21 Home Run Derby in Minute Maid Park the evening of July 12th. The Joint Operations Center (JOC), located at the Houston Emergency Center (HEC), was activated on July 12th at 3:00 p.m. and was operational until around 12:00 midnight. The same hours were observed for game day, July 13th. Each day the JOC was staffed with personnel representing 10 Federal Agencies, one State Agency, one County Agency, five City Departments, METRO PD, Union Pacific Railroad, and Major League Baseball. There were three Command Posts established. They were located at Minute Maid Park, George R. Brown Convention Center, and the Houston Police Department Command Center. Activities at various event venues were monitored using the RIMS developed by the Texas Department of Transportation and enhanced by the City of Houston, Office of Emergency Management to support planned events. The JOC received information through RIMS from the three command posts. Additionally, information was received via telephone and two-way radio. RIMS was monitored at Houston TranStar for traffic related incidents, road closure information, and general event status. The Disaster District Committee for the Department of Public Safety Region 2A, located at US 290 and West Road and the State Emergency Operations Center in Austin, were also monitoring event information had a response been required. Funding Source: Priority Corridor, State Funding, and Local Funding. Future Direction: RIMS will continue to be developed and deployed within the Houston Region and will be enhanced to include the SAFEclear incident management program. RIMS is one of the first data management systems that uses web-based methodology. In fact, it follows the format of the National Incident Management System that is currently being developed and deployed nationwide. RIMS will be modified to include predefined incident management scenarios with a map-based interface. Benefits: It is difficult to put a dollar value on effective emergency and incident management; however, the benefits seen so far from the system have been, at minimum, the effective sharing of information among and between agencies and their timely response.

Houston TranStar Annual Report – 2004 Page 33 of 50
Roadway Weather Information System (RWIS) Description: The RWIS consists of 41 weather stations placed at strategic positions throughout an eight county region by TxDOT. These stations contain some or all of the following various measurement capabilities:
• Wind (speed/direction); • Rainfall; • Air temperature and humidity; • Barometric pressure; • Pavement temperature and ice conditions; • Stream water levels; and • Roadway water levels or street flooding.
This data is transmitted by a licensed radio frequency to processing computers housed at Houston TranStar. The central processing computers can transmit alert alarms by electronic pager and email to appropriate personnel. The information from the system is also available on the Internet at www.hcoem.org/txdot. Funding Sources: Priority Corridor, State Funding, and Local Funding. Future Directions: New locations will be deployed at critical locations. Modifications to the information system are being investigated to simplify distribution of the data. A project is slated to integrate roadway flooding conditions and traffic conditions to Emergency Medical Service vehicle to allow for drivers to take the shortest accessible routes to the Texas Medical Center. Benefits: The RWIS provides agency personnel with real-time information about weather conditions that affect the traveling public such as street flooding, ice on roadways, high winds on bridges, etc. Information is disseminated via the internet, e-mail alerts, and via text pages. Providing this information to the public can prevent motorists from entering these locations, save lives, property, and time. This system is also used for daily operations and maintenance activities. Traveler Information Systems Houston TranStar has been a pioneer the field of traveler information and dissemination. Through Houston TranStar and partner agency infrastructure, the Center can reach motorists via dynamic message signs, highway advisory radio, public media, or the internet. Through its agreements with local media outlets, the Center can reach millions through television and radio. Houston TranStar systems also allow individuals to receive personalized information through the Personal Alert Notification system. Details on all these systems are presented below.

Houston TranStar Annual Report – 2004 Page 34 of 50
Internet (www.houstontranstar.org) Description: The Houston TranStar website provides the public with a wide variety of traffic information for the greater Houston area. The Houston TranStar website was created in 1994 by TxDOT and an interagency contract with TTI and has evolved into an extensive traveler information system. Houston TranStar’s ITS deployed services such as AVI sensors, CCTV cameras, and DMS's serve as the data sources for the system. Using these resources, the website is able to provide a wealth of valuable traveler information including:
• Real-time and historical speeds and travel times; • Freeway incidents and road closures; • Construction closures; • CCTV snapshots; • DMS messages; • E-mail based traffic alerts; • RWIS information; • Railroad grade crossing status and train detection in the Sugar Land rail corridor; and • Estimated ferry wait times at the Galveston-Bolivar Ferry.
The website is also a source of public feedback for Houston TranStar and the transportation and emergency management activities in the Houston region. Information is accessed from the website from a variety of sources including personal computers, mobile devices, other interfaces, using the Internet and provides the infrastructure to allow third party in-vehicle navigation system access. The website has been formally recognized by FHWA as one of the top traveler information websites in the nation three out of the last four years. In addition, the website has won an award for pioneering the dissemination of traffic information to mobile devices and most recently, by MIT and Accenture for being the most innovative State and Local Government technology project in the nation. Funding Sources: Priority Corridor and State Funding. Future Direction: Houston TranStar is continually developing the website including the real-time traffic mapping system, expanding the website’s coverage as Houston TranStar’s ITS infrastructure expands. This includes the development of innovative ways to distribute real-time incident and traffic information to the general public on personal computers, mobile devices, in-vehicle navigation systems, and other interfaces using the Internet. Benefits: The website is widely used by the public and transportation and emergency management personnel at Houston TranStar, with over 180,000 different users accessing the system each month. Pre-trip and en-route traveler information provides the motorist information on the most efficient commute, potentially saving valuable time and frustration.

Houston TranStar Annual Report – 2004 Page 35 of 50
Dynamic Message Signs (DMS) Description: DMSs are a significant part of the traveler information system for Houston TranStar. DMS have been installed at 157 locations around the Houston region. They are also being placed in the IH 10 corridor between San Antonio and Houston, as well as in suburban and rural areas on major corridors leading into the Houston region. The signs will be used to give travelers advance warning about roadway conditions within the Houston region. All DMS's are controlled from Houston TranStar by TxDOT or METRO, allowing the use of travel information already available from other systems. This information includes:
• Amber Alerts; • Traffic information, including real-time travel time information and incident status; • Weather conditions (including flood status) on roadways; • Roadway and congestion conditions; • Truck restriction notices; • Scheduled freeway construction and maintenance; • Special Event Information; and • Safety Messages.
Funding Sources: CMAQ, Priority Corridor, Congressional Earmark Funding, and State Funding. Future Direction: There will be 13 more DMS's deployed in the region this year. The DMS signs on the IH 10 corridor will provide information to travelers going to and from San Antonio and Houston. There are plans to investigate DMS deployment on IH 45 from Houston to Dallas. Benefits: DMSs provide information on travel times, traffic incidents, roadway conditions, road construction, amber alerts, weather conditions, and evacuations. In rural areas, while being a benefit to all travelers, DMS's will be particularly beneficial to long-haul interstate truck drivers. The signs will give the drivers advance warnings of road environmental conditions, which will allow them to either alter their route to another state highway around the Houston region or alter the time they travel through the Houston region. Highway Advisory Radio (HAR) Description: The HAR Broadcasting System is used to broadcast current traffic conditions, travel times, alternate routes, and road construction information to the traveling public. As a result of this information, drivers can divert to other travel routes while reducing traffic congestion significantly. There are 12 fixed and one portable HAR unit deployed at various locations around the greater Houston region. Six units are placed along IH 610 to achieve optimum listening at a three-mile radius range. They broadcast in synchronization to allow the placement of the same message with no interference zones when traveling around the IH 610 loop. Two HARs are located on IH 10 on the outside of the TxDOT Houston District to warn truckers and travelers of delays in the Houston

Houston TranStar Annual Report – 2004 Page 36 of 50
area. The remaining four sites are located on Hurricane Evacuation Routes to give evacuation information. All sites also convey construction and accident information. Along with the HAR units there are static signs with flashing beacon lights equipment to advising travelers when there is an urgent message. Information for these HAR are supplied by the ITS housed at Houston TranStar. Funding Source: CMAQ, Priority Corridor, and Earmark Funding. Future Direction: Improvements to the system include improving the synchronization of the IH 610 Loop HAR and creating an automated system that will deploy a text to speech file to the HAR when an accident occurs. Work is also planned to integrate automated travel times into the HAR and add the HAR messages to the www.houstontranstar.org website. Benefits: The HAR supplies in-vehicle information that most vehicles are capable of receiving. It provides more detailed information than DMSs and is more frequently updated than a regular radio broadcast. Personal Traffic Alert Notification System Description: The Houston TranStar Traffic Alert System enables registered users to receive notification of incidents on Houston area freeways. The notifications or “traffic alerts” can be sent to any device capable of receiving E-mail or text messages, including personal computers, cellular phones, personal digital assistants, and text pagers. Using the registration form, users can customize their alert profiles detailing the times, locations, and incident severity that they would like to receive alerts. This service is offered at no charge to the user. Traffic information is available to the public through the Houston TranStar web site located at www.houstontranstar.org. Some of the information available to the public on this web site includes:
• Real-Time Traffic Information traffic map, camera map, camera list, incident list, speed reports, route builder, speed charts, construction closures, emergency closures, roadway status weather sensors;
• Historical Traffic Information: historical speed map and freeway travel times; • Weather information; • HOV Lane Information; and • Emergency Management Information.
Users who register for alerts will receive them each time the status of an incident changes. Typically, an incident's status will change twice for each incident: once upon verification by Houston TranStar traffic operators, and once when the incident has been cleared. Personal Alert Notification Subscribers receive Personal Alert Notification of incidents on their freeway routes, real-time traffic information, weather information, and emergency information via their web-enabled personal digital assistants, cell phones, and personal computers.

Houston TranStar Annual Report – 2004 Page 37 of 50
Funding Source: Priority Corridor Program and State Funding. Future Direction: Houston TranStar is preparing the information infrastructure required to support future personal and public information notification requirements. Benefits: Personal traffic alerts allow motorists the ability to receive real-time information on routes they choose in the format that they require, whether text messaging, paging, or email. This ability to receive information in-vehicle and in-route allow motorists to make educated decisions on the most efficient route given the current roadway conditions. Broadcast Media Support Houston TranStar has established multimedia partnerships with the major electronic and print outlets in Houston, Texas, which is the 11th largest media market in the nation. Houston TranStar has established partnerships with the local television outlets in Houston. These outlets include NBC (Channel 2), ABC (Channel 13), CBS (Channel 11), and FOX (Channel 26) affiliates. Houston TranStar’s Closed Circuit Television Images and Automated Vehicle Identification Speed Data can be seen locally on these stations. Houston TranStar also serves as the sole source of traffic and transportation information for radio stations in the Houston market. Via our partnerships with Traffic Pulse Networks and Metro Networks, we are able to provide real-time traffic reports and information to all radio stations regardless of format in the Houston area. Funding Sources: Public/Private Partnership and State Funding. Benefits: The benefit of supplying local media with CCTV feeds and travel time information is that it reaches another segment of the traveling audience both pre-trip and en route. Flow Signal Operation at Freeway Entrance Ramps Description: Flow signals provide a positive means for managing freeway demand and enhancing safety by regulating traffic entering the freeway. Flow signal operation is a relatively low cost way to improve traffic flow on freeways during various traffic volume conditions. The meter allows traffic to enter the freeway at a rate dependent on the conditions of the freeway traffic. Motorists must stop at the meter, but freeway speeds and overall travel times are improved. There were 108 Flow Signals operating in the Houston region as of 2004. Funding Source: CMAQ Funding and State Funding. Future Direction: Additional flow signals have been requested to be added on various freeway facilities in the Houston region.

Houston TranStar Annual Report – 2004 Page 38 of 50
Benefits: Studies have shown that by regulating the flow of vehicles entering the freeway that freeway speeds increase, travel time decreases, and accidents are reduced. It is one of the most effective ITS devices in terms of benefits per cost expended. Ramp meters are a proven and cost-effective method of relieving traffic congestion. By increasing the efficiency of the freeway system, ramp meters save taxpayers costs associated with building new lanes. Flow signal activations have been shown to reduce rear-end and sideswipe collisions by significant amounts. Regional Computerized Traffic Signal System (RCTSS) Description: The agencies involved in the Houston TranStar partnership are working to ultimately computerize more that 3,000 traffic signals in the greater Houston region as part of the RCTSS program. I2, a software program for traffic signals, helps to identify traffic signal malfunction problems earlier by letting a malfunctioning signal electronically call in an alert at Houston TranStar and other locations. I2 also facilitates synchronizing signals and sharing information between signals. I2 allows signals to be controlled from a central location at Houston TranStar. It will also integrate traffic signals from the three Houston TranStar partner agencies that operate traffic signals. The system will allow operators at Houston TranStar to modify signal timing on arterial streets in response to congestion and incidents. Signal timing plans for special events such as NBA, NFL, MLS sporting events and the Houston Livestock Show and Rodeo will also be modified remotely to adjust to changing traffic flow patterns. The extensive communication system facilitates coordination of signals from a centralized location for the Houston area inside of Beltway 8. The RCTSS will also permit priority signal operation along bus routes. Priority will be given to buses behind schedule, taking into consideration the impact on traffic in the immediate area. The RCTSS Program is being augmented by a combination of funding resources. The Initial Regular Business Plan will fund approximately 1,347 intersections. Because of the RCTSS Program traffic signal service is constantly improving and will continue to improve in the future. Funding Source: CMAQ, FTA, State Funding, and Local Funding. Future Direction: Complete modernization, computerization, and control of more than 1,700 additional intersections. Expand the communications to the traffic signals by use of Wireless communications. Benefits: Traffic signal modernizations and timing improvements can give benefits of from $20 to $38 per $1 spent. These benefits include more efficient and reliable travel times, reduced stops, fuel consumption, emissions, and reduced crash experience.

Houston TranStar Annual Report – 2004 Page 39 of 50
High Occupancy Vehicle (HOV) Lane System Description: HOV lanes are exclusive roadways or lanes designated for high occupancy vehicles such as buses, vanpools, and carpools. HOV lanes in Houston require minimum vehicle occupancy of two or more persons. However, occupancy requirements have been raised to three or more persons during the peak hour on the IH 10 (Katy Freeway) and US 290 (Northwest Freeway) HOV lanes, because high volumes of two-person carpools lowered speeds on these facilities. Several of the common types of HOV lanes are barrier separated (typical of most Houston region HOV facilities), concurrent flow separated from the main-lanes by a buffer or paint stripe (currently used on IH 10 Katy outside SH 6), and contra flow lanes (not currently used in the Houston region). Support facilities, such as park and ride lots and transit centers with direct access to the HOV lane, are important system elements to increase facility use. The Houston HOV lane system consists of approximately 94 miles of barrier-separated HOV lanes and approximately 20 miles of concurrent flow HOV lanes. Single lane facilities operate as reversible lanes, flowing in one direction during the morning period, and the other direction in the evening period. Multiple lane facilities may either be operated as two-way facilities or reversible facilities. Concurrent flow HOV lanes occupy the inside freeway lane and are separated from the main-lanes by a buffer or paint stripe. Funding Sources: FHWA Programs, FTA Programs, Local METRO, and State Funding. Future Direction: HOV lanes have been highly successful in the Houston region and there are plans to expand the system to two way operations. This will incorporate managed lanes concepts, congestion pricing, and other aspects to improve the person carrying capabilities of the system. Benefits: HOV lanes increase the overall person carrying capacity in a corridor, improve transit service and reliability, and encourage carpool/vanpool formation and bus usage. During the peak rush hours, the six HOV lanes in Houston move the same number of persons as 24 lanes of freeway. HOV lanes provide significant benefits to transit service and carpoolers. Peak hour bus operating speeds on Houston HOV corridors have increased from 24 mph prior to the HOV lanes to 50-55 mph with the HOV lanes. The reduction of travel time is estimated to have reduced the required operating time by 12 to 22 minutes per trip. Studies have shown that HOV lanes increase carpool and transit usage. Of the persons using the IH 10 Katy Freeway HOV lane in Houston, 36 percent of carpoolers and 36 percent of bus riders previously drove alone. Benefit/cost analyses for the Houston HOV lanes have yielded results of 8 to 1 to 48 to 1.

Houston TranStar Annual Report – 2004 Page 40 of 50
QuickRide Description: The QuickRide program began in Houston in 1998 on the Katy HOV lane as part of the FHWA Value Pricing Program. The program is considered a HOT lane concept in that higher occupancy vehicles use the facility at no cost, while two-person carpools pay a toll to use the lane. Occupancy requirements for the Katy HOV lane were raised from 2+ to 3+ persons for the AM peak hour in 1988 when level of service on the lane drop below “C” and for the PM peak hour was included in 1991. This program allowed for the excess capacity to be sold to two-person carpools while still maintaining a level of service “C”. In 2001, the QuickRide program was expanded to US 290 during the AM peak. Houston had two of the four operation HOT lanes in the nation until 2005. Funding Source: FHWA Value Pricing Program, METRO, Priority Corridor, and State Funding. Future Direction: This type of system is being considered on the other HOV lanes in the area, as well as other modified operational concepts. Examination of allowing Single Occupant Vehicles during non-peak hours will be investigated. The Katy Freeway will have four managed lanes once reconstruction is completed. Benefits: The QuickRide program utilizes the unused capacity by lowering the occupancy level and charging a $2 fee. This increases the person movement of the facility enabling a two-person carpool without impact to the HOV operations. Funds collected from the program are used for operations and other transit projects. Motorist Assistance Program (MAP) and SAFEclear Description: Since 1986, the MAP, a public/private partnership service provided by the Greater Houston Automobile Dealers Association, Harris County Sheriff’s Department, TxDOT, METRO,, and Cingular Wireless Telephone Company, has been helping freeway motorists in the Houston Metropolitan Area at no cost to the driver. The public/private partnership consists of a fleet of 16 vans and trucks driven by officers from 6:00 a.m. until 10:00 p.m., Monday through Friday. The MAP vehicles patrol all major freeways in the metropolitan area helping motorists. Each month the MAP vans cover over 50,000 miles and assist more than 3,000 Houston area motorists. A MAP dispatcher is contacted free of charge through Cingular Wireless by dialing *MAP (527) or by 713-CALL-MAP (713-225-5627). MAP is a traffic management strategy used to safely and quickly remove minor incidents from the freeways. The MAP vehicles are equipped to handle problems such as:

Houston TranStar Annual Report – 2004 Page 41 of 50
• Changing a flat tire; • Jump starting a vehicle; • Providing gasoline or water; • Assisting with minor engine repairs; • Summon additional help; • Push disabled vehicles from travel lanes; and • Transport motorists to a safe location.
SafeClear was created by the City of Houston Mayor’s Office of Mobility, the members of the Houston TranStar partnership, Law Enforcement Agencies, and the Towing Industry. Safe Clear is a traffic incident response program designed to establish immediate clearance of stalled or disabled vehicles that disrupt traffic flow on area freeways. The Safe Clear traffic incident response program operates 24 hours a day, seven days a week. The goal of this incident response program is to reduce the number of secondary incidents caused by stalled or disabled vehicles, decrease response times by area law enforcement agencies, increase road safety, and improve travel times for drivers in the region. In 2004, Safe Clear was instituted on the Katy Freeway during construction activity. It was expanded to include other Houston area freeways on January 1, 2005. Funding Source: MAP is funded by a public/private partnership between the Greater Houston Automobile Dealers Association (vehicles), TxDOT (provides dispatch services), METRO, and Harris County Sheriff’s Department (officers for motorist assistance). SAFEclear is currently funded through a combination of user fees, towing franchise fees, and local general revenue funding. Future Direction: Plans are to increase the number of units on the roadway, the amount of roadway covered by MAP, and combining this program with the City of Houston SAFE CLEAR program. Benefits: According to the Federal Highway Administration, 65 percent of all incidents that take place in the greater Houston region are caused by stalled or disabled vehicles. Secondary incidents often lead to extended travel delays, safety issues, environmental impacts, and estimated costs for the Houston region of more than $2 billion annually. Non-recurrent congestion caused by minor incidents and breakdowns are responsible for approximately 60 percent of the total congestion. Each minute a roadway is blocked by a minor incident results in three to eight minutes of delay. Removing stranded motorists quickly reduces the time the roadway is blocked and can prevent secondary incidents. METRO Bus and Rail Dispatch Description: METRO's bus and rail dispatch activities are headquartered at Houston TranStar. The integration of transit management into Houston TranStar allows bus dispatchers to have access to real-time traffic information. Houston TranStar also has access to information from METRO’s Smart Bus. The Smart Bus system consists of an on-board computer and a network of wiring that provides electronic links between the various components of a bus. The foundation is an advanced

Houston TranStar Annual Report – 2004 Page 42 of 50
radio communications system that will transmit both voice and data between the buses and Houston TranStar. The computer and radio systems work together to collect and transmit current bus data including location, number of passengers, and fare collection data. The result of the Smart Bus is greater safety for passengers, continuous monitoring of the on-time performance of each bus and an enhanced ability to distribute the bus fleet to serve the community better. Funding Source: FTA and Local Funding. Benefits: Benefits include an additional 1,000 probes (buses) during the peak periods that can report and verify transportation problems on the region’s street system. In addition, information exchange resulting from the co-location of bus dispatchers with transportation managers help coordinate emergency activities, such as evacuations or bus re-routing, swiftly and effectively. Freeway Interchange Truck Rollover Warning System Description: Warning signs with flashing lights are being installed at freeway interchanges having high truck volumes and low operating speeds. The system deployed will identify a vehicle as a truck as well as determine the truck's speed. If the truck's speed is above the safe operating speed of a freeway interchange ramp, a warning device will be activated. The warning device will be flashing lights mounted on symbol signs indicating a possible truck rollover and the need for the truck driver to adjust his/her speed. Funding Source: Congressional Earmark and State Funding. Future Direction: The sites will be integrated into Houston TranStar for database warehousing, and provide real-time assistance for planning truck enforcement for high violation areas in the region. Benefits: These systems will increase truck safety by making truck drivers aware that they are above the safe speed on freeway interchange ramps, and allow law enforcement to monitor the situation for possible crashes on these ramps. Sugar Land Rail Monitoring System Description: TxDOT, in cooperation with the City of Sugar Land, Texas, developed a pilot rail crossing monitoring system that detects and monitors trains on the Union Pacific railroad tracks adjacent to US 90A in Sugar Land. The monitored section is between Kirkwood and the Grand Parkway and covers nine intersections. The main purpose of the system is to provide monitoring capability for Fire, Emergency Medical Services, and Police who all may experience disruptions from delays at grade crossings. The system also provides traveler information to commuters who drive through the area along US 90A.

Houston TranStar Annual Report – 2004 Page 43 of 50
The internet based system includes a map of the rail corridor that depicts each crossing’s status using a color-coded icon. Trains in the corridor are represented by icons that exist at the approximate location of the train. In addition, for each train present in the corridor, a corresponding table appears below the map that shows the train’s estimated length, direction of travel, speed, and expected arrival and departure time at each crossing. An indicator at the top of the page depicts the status of the corridor as a whole. This feature is intended to give users an overview of what’s happening in the corridor at first glance. Funding Sources: Priority Corridor and State Funding. Future Directions: Additional locations are being considered. The City of Houston is currently implementing a monitoring system where trains block crossings near schools. School children have been observed climbing under and over rail cars to get to and from school while a train is blocking the crossing. Enhancements to the existing system have been planned, including CCTV elements trackside. Benefits: This project saves critical time for emergency personnel responding to incidents in this area. The monitoring program has proven to save lives as a stalled vehicle containing extremely hazardous chemicals was detected on the tracks. Fire and police personnel were able to immediately contact the railroad tower and a potential devastating and possibly fatal accident was avoided. The railroad monitor proved to be invaluable, and just this incident would have more than paid for any expenses incurred in this project.

Houston TranStar Annual Report – 2004 Page 44 of 50
APPENDIX B. BENEFIT COST ANALYSIS Houston TranStar was officially opened on April 15, 1996, and the deployment and integration of the transportation and emergency management systems are being accomplished on a project-by-project basis. The evaluation of the operations of Houston TranStar for 2004 is based on those systems that were operational for all or part of the year. The Houston TranStar evaluation uses the travel conditions as the base line for estimating the benefits of those systems that were in operation for all or part of the 2004 calendar year. The procedure for evaluation uses national experience to establish the Houston TranStar goals for expected benefits and the expertise of the Houston TranStar staff to estimate the performance of systems against these goals. Travel conditions in terms of traffic congestion of the freeways of Houston were determined primarily from the AVI travel time monitoring system and traffic volumes developed from the TxDOT Annual Volume-Roadway Inventory Files. Annual base congestion for 2004 was calculated to be nearly 49 million vehicle-hours (Table B-1). This is a conservative estimate because of the resolution of the traffic volume data used and the design of the AVI system. The Houston TranStar Agency Managers reviewed the results from other national transportation management centers and developed operational goals for Houston (Table B-2). The Houston TranStar Agency Managers then reviewed the current status of deployment of systems and the operating efficiencies of the transportation management systems and strategies in Houston TranStar and rated these systems in terms of the percent attainment of national goals (Table B-3). For flow signal operation, data taken from Houston TranStar records were used to calculate the benefits by freeway (Table B-4). Procedures for establishing ratings involved the development of lists of factors for each of the deployments, the establishment of assigned weights of importance to the factors, and finally the assessment by the agency managers of the progress in the deployment and operation of the various factors in 2004. Results of this process are shown in Table B-5. The benefits of operating the transportation management systems of Houston TranStar in 2004 were determined from the Agency Managers’ assessments of progress to the adopted operational goals and the levels of congestion determined from the AVI/TxDOT Volume-Roadway Inventory Files. Annual benefits in the reduction of travel time were calculated to be 12.7 million vehicle hours, which represents a monetary value of $223.7 million (Table B-6). The savings in travel time are equivalent to reducing fuel consumption by 23.3 million gallons–an additional savings of $41.0 million. The total 2004 benefits to the motorists are valued at $264.7 million. The reduction in the amount of fuel consumed also results in a reduction of exhaust emissions. Based on USDOT Bureau of Transportation Statistics, the reduction of 23.3 million gallons of fuel is equivalent to a reduction of:

Houston TranStar Annual Report – 2004 Page 45 of 50
• 503 tons of hydrocarbons; • 3,250 tons of carbon monoxide; and • 731 tons of nitrogen oxides.
The annual costs of deploying, operating, and maintaining Houston TranStar systems were determined for the transportation management systems that were operational in 2004. The cost analysis includes the annualized capital costs of the Houston TranStar facility, the annual operational costs of the Houston TranStar systems, and the annual cost of operations and maintenance of the field installations. The annualized capital and operating cost estimate is $22.9 million, which divided into the annual benefits of $264.7 million, yields a benefit/cost ratio of 11.6 (Table B-7).

Houston TranStar Annual Report – 2004 Page 46 of 50
Length of SectionEstimated Annual
CongestionAnnual Cost of
CongestionFreeway Section (miles) (vehicle hrs/year) ($/year)*
County Line to South Belt 15.20 - $ - South Belt to East Loop 6.85 326,000 $ 5,734,300 East Loop to IH 45 5.40 761,700 $ 13,398,300 Subtotal 27.45 1,087,700 $ 19,132,600
Grand Parkway to Barker-Cypress 5.50 1,170,400 $ 20,587,300 Barker-Cypress to West Belt 7.60 2,720,700 $ 47,857,100 West Belt to West Loop 6.30 4,118,600 $ 72,446,200 West Loop to IH 45 6.05 731,400 $ 12,865,300 Subtotal 25.45 8,741,100 $ 153,755,900
Hardy Tollroad to FM 1960 5.70 53,400 $ 939,300 FM 1960 to Aldine-Bender 7.00 121,600 $ 2,138,900 Aldine-Bender to Crosstimbers 8.20 2,341,300 $ 41,183,500 Crosstimbers to IH 10 2.50 612,000 $ 10,765,100 Subtotal 23.40 3,128,300 $ 55,026,800
NASA 1 to Fuqua 7.90 610,700 $ 10,742,200 Fuqua to Woodridge 7.65 1,389,600 $ 24,443,100 Woodridge to Scott 4.15 889,800 $ 15,651,600 Scott to IH 10 4.20 1,569,100 $ 27,600,400 Subtotal 23.90 4,459,200 $ 78,437,300
Grand Parkway to SH 6 4.91 1,576,100 $ 27,723,600 SH 6 to Wilcrest 4.92 369,600 $ 6,501,300 Wilcrest to West Loop 8.24 1,444,700 $ 25,412,300 West Loop to Fannin 5.60 3,489,700 $ 61,383,800 Fannin to IH 10 1.80 1,946,800 $ 34,244,200 Subtotal 25.47 8,826,900 $ 155,265,200
Townsen to North Belt 5.10 10,400 $ 182,900 North Belt to North Loop 10.00 129,300 $ 2,274,400 North Loop to IH 45 4.45 589,600 $ 10,371,100 Subtotal 19.55 729,300 $ 12,828,400
Mason to Barker-Cypress 4.80 - $ - Barker-Cypress to West Belt 9.15 636,200 $ 11,190,800 West Belt to Pinemont 4.45 1,177,600 $ 20,714,000 Pinemont to West Loop 3.55 2,209,200 $ 38,859,800 Subtotal 21.95 4,023,000 $ 70,764,600
Table B-1. Summary of Estimated Base Freeway Congestion-2004 (Part 1 of 2)
IH 10 East Freeway
IH 10 Katy Freeway
IH 45 North Freeway
IH 45 Gulf Freeway
US 59 Southwest Freeway
US 59 Eastex Freeway
US 290 Northwest Freeway
*A value of time of $17.59 per vehicle-hour is used in this analysis.

Houston TranStar Annual Report – 2004 Page 47 of 50
South Belt to South Loop (Holly Hall) 5.80 327,600 $ 5,762,500 South Loop to US 59 3.30 372,400 $ 6,550,500 Subtotal 9.10 700,000 $ 12,313,000
SH 146 to East Belt 7.60 - $ - East Belt to East Loop 7.00 483,900 $ 8,511,800 Subtotal 14.60 483,900 $ 8,511,800
IH 45 to IH 610 22.05 - $ - Subtotal 22.05 - $ -
IH 10 Katy to US 59 Southwest 8.63 4,336,600 $ 76,280,800 US 59 Southwest to SH 288 11.85 494,800 $ 8,703,500 SH 288 to IH 10 East 24.05 - $ - US 59 Eastex to IH 45 North 7.15 633,000 $ 11,134,500 IH 45 North to US 290 12.59 4,084,400 $ 71,844,600 US 290 to IH 10 Katy 6.42 962,500 $ 16,930,400 Subtotal 70.69 10,511,300 $ 184,893,800
North Loop (N. Wayside to Ella) 9.25 1,039,400 $ 18,283,000 West Loop (Ella to S. Post Oak) 11.00 4,066,900 $ 71,536,800 South Loop (S. Post Oak to S. Wayside) 8.25 504,000 $ 8,865,400 East Loop (S. Wayside to N. Wayside) 10.20 466,000 $ 8,196,900 Subtotal 38.70 6,076,300 $ 106,882,100 GRAND TOTAL 322.31 48,767,000 $ 857,811,500
IH 610 Loop
Hardy Toll Road
Table B-1. Summary of Estimated Base Freeway Congestion-2004 (Part 2 of 2)SH 288 South Freeway
SH 225 LaPorte Freeway
Sam Houston Toll Way
*A value of time of $17.59 per vehicle-hour is used in this analysis.
Table B-2. Houston TranStar Transportation Management Goals for Reducing Congestion
% Reduction of Congestion Deployment Description Non-Recurrent Recurrent Transportation Management Center 8 4 Traveler Information (RSS) 29 12 Incident Management 26 10 Ramp Metering 35 30

Houston TranStar Annual Report – 2004 Page 48 of 50
Table B-3. Houston TranStar Transportation Management Estimates of Deployment and Operational Efficiency for 2004–Related to Transportation Management Goals
Non-Recurrent RecurrentTransportation Management Center 1.870 0.738Traveler Information (RSS) 8.392 2.507Incident Management 7.796 1.163Ramp Metering (see Table B-4) 2.154 1.763Total 20.212 6.171
Estimated PercentReduction of Congestion
Deployment Description
Table B-4. Houston TranStar Transportation Management 2004 Estimates of Benefits for Freeway Flow Signals
Reduction in Congestion Value of Time Saved
(Vehicle Hours) (Millions of Dollars)*IH 10 Katy Freeway 522,100 $ 9,183,700 IH 45 North Freeway 213,000 $ 3,746,700 US 59 Southwest Freeway 452,900 $ 7,966,500 US 290 Northwest Freeway 478,500 $ 8,416,800 IH 45 Gulf Freeway 169,100 $ 2,974,500
West Loop - $ - North Loop 74,400 $ 1,308,700 Totals 1,910,000 $ 33,596,900
Freeway Corridors
IH 610 Loop
Annual Benefits Resulting from Freeway Flow Signal Deployments
*A value of time of $17.59 per vehicle hour is used in this analysis.

Houston TranStar Annual Report – 2004 Page 49 of 50
Table B-5. Summary of Benefit Calculations for 2004
Transportation Management Deployment Vehicle Hours Saved Value of Time SavedTraffic Management Center:
Non-Recurrent = 0.01870 x TAC1 = 911,943 16,041,100$ Recurrent = 0.00738 x TAC = 359,900 6,330,700$ Subtotal for Traffic Management Center = 0.02608 x TAC = 1,271,843 22,372,000$
In-Vehicle Special In-Vehicle Non-Recurrent = 0.00255 x TAC = 124,356 2,187,500$ Recurrent = 0.00185 x TAC = 90,219 1,587,000$ Public Radio Non-Recurrent = 0.01914 x TAC = 933,400 16,418,600$ Recurrent = 0.01050 x TAC = 512,054 9,007,100$ Cellular Telephone Non-Recurrent = 0.01044 x TAC = 509,127 8,955,600$ Recurrent = 0.00840 x TAC = 409,643 7,205,700$ Subtotal for In-Vehicle = 0.05288 x TAC = 2,578,799 45,361,100$ Roadside (Dynamic Message Signs) Non-Recurrent = 0.04407 x TAC = 2,149,162 37,803,800$ Recurrent = 0.00963 x TAC = 469,626 8,260,800$ Subtotal for Dynamic Message Signs = 0.05370 x TAC = 2,618,788 46,064,500$ Pre Trip Non-Recurrent = 0.06321 x TAC = 3,082,562 54,222,300$ Recurrent = 0.01119 x TAC = 545,703 9,599,000$ Subtotal for Pre Trip = 0.07440 x TAC = 3,628,265 63,821,200$ Subtotal for Traveler Information Systems (RSS2) = 0.10590 x TAC = 5,164,548 90,844,500$
Incident Management: Non-Recurrent = 0.07796 x TAC = 3,801,875 66,875,000$ Recurrent = 0.01163 x TAC = 567,160 9,976,400$ Subtotal for Incident Management = 0.08959 x TAC = 4,369,036 76,851,400$
Ramp Metering/Flow Signals: Non-Recurrent = 0.02154 x TAC = 1,050,441 18,477,300$ Recurrent = 0.01763 x TAC = 859,762 15,123,300$ Subtotal for Flow Signals = 0.03917 x TAC = 1,910,203 33,600,500$
Total Benefits = 0.26074 x TAC = 12,715,631 223,668,000$
Notes: 1. TAC = Total Annual Congestion (vehicles hours); 2. RSS=Root Sum of Squares
Benefit Factor
Traveler Information Systems:

Houston TranStar Annual Report – 2004 Page 50 of 50
Table B-6. Houston TranStar Transportation Management Estimates of Benefits for 2004 Annual Benefits Resulting from
Transportation Management Deployments Transportation Management Deployments
Reduction in Congestion in Vehicle Hours
Value of Time Saved (Millions of Dollars*)
Transportation Management Center 1,271,800 $ 22.372
Traveler Information 5,164,500 $ 90.845
Incident Management 4,369,000 $ 76.851
Flow Signals (Ramp Metering) 1,910,200 $ 33.601
Totals 12,715,600 $ 223.668 * A value of time of $17.59 per vehicle hour is used in this analysis.
Table B-7. Benefit Cost Analysis for 2004 Summary of Capital Expenditures
Houston TranStar Facilities $ 13.500 M CTMS Installations Completed 114.831 M AVI Installations 7.800 M
Total Capital Expenditures $136.131 M Annual Operations and Maintenance Costs:
Houston TranStar $ 2.263 M CTMS 1.730 M Motorist Assistance Program 1.531 M AVI Traffic Monitoring System 0.364 M
Total Annual O&M Costs $ 5.888 M Total Annual Costs:
Annualized Capital Expenditures (15 yrs. @ 6 % for Houston TranStar) $ 1.390 M (10 yrs. @ 6% for CTMS and AVI) 15.606 M
Annual Operations and Maintenance Costs 5.888 M Total Annual Costs $ 22,884 M
Summary of Benefits Value of Annual Delay Savings $223.668 M Value of Annual Fuel Savings 40.983 M
$264.651 M Benefit/Cost Ratio
The 2004 Benefit/Cost Ratio is calculated by dividing total annual benefits by total annual costs. Benefit/Cost Ratio is equal to: $264.651 M / $22.884 M=11.6