06 - measuring political brand equity a consumer oriented approach
DESCRIPTION
marketingTRANSCRIPT

1
Measuring Political Brand Equity: A Consumer Oriented Approach.
Alan French and Gareth Smith*
Loughborough University, UK
*The Authors:
Dr Alan French, Lecturer in Management Science, Loughborough University Business
School, Loughborough University, Loughborough, Leicestershire LE11 3TU, UK.
Tel: +44 (0)1509 223199; fax: +44 (0)1509 223960; email: [email protected]
Gareth Smith, Senior Lecturer in Marketing, Loughborough University Business School,
Loughborough University, Loughborough, Leicestershire LE11 3TU, UK.
Tel: +44 (0)1509 223126; fax: +44 (0)1509 223960; email: [email protected]
Research Paper
Keywords: Political Marketing Brand Associations Equity Mapping

2
Measuring Political Brand Equity: A Consumer Oriented Approach.
Research Paper
Abstract
Purpose
To develop understanding of how voters view the political brand by analysing the
mental maps that voters create when asked to think about a political party. The analysis
is both in terms of the nature of the maps and also in terms of the equity associated with
a map.
Methodology
A consumer-oriented approach is developed for mapping the political brand. The brand
maps are analysed to discern brand characteristics. Furthermore, methods are developed
to assess the power of political brands and concomitantly, political brand equity.
Findings
The method provides interesting insights into the nature and equity of brand associations
for the two main political protagonists, i.e. Conservative and Labour. Key branded
characteristics are highlighted for each party, both in terms of general structure, and also
those associations which form a central role in voters’ maps. For the partisan sample
chosen, both parties are shown to have strong brand equity, with the Conservatives
slightly stronger than Labour.
Practical implications
The method is straightforward to apply and provides important information to political
marketers about the nature and power of the associations held in memory by voters.
Taking a wider stance, the approach can be applied to any branding situation.
Originality/value

3
This paper provides a means by which a brand mapping process, new to politics, can be
combined with methods facilitating the analysis of brand maps to produce a means by
which brand equity can be measured.
Keywords: Political Marketing Brand Associations Equity Mapping
Introduction
The concept of political parties as brands is now commonplace and part of a general
dispersion of branding from its original, consumer marketing origins. Indeed, “branding
principles have been applied in virtually every setting where consumer choice of some
kind is involved, e.g., with physical goods, services, retail stores, people, organisations,
places or ideas” (Keller, 2002, p. 151) (our italics). It is axiomatic that political parties
are organisations where politicians seek to exchange ideas and promises for electoral
support. However, Keller concludes that “As branding is applied in more and more
different settings, brand theory and best practice guidelines need to be refined to reflect
the unique realities of those settings” (2002, p. 171).
Politics has already been shown to be different to other, commercial markets (Lock and
Harris, 1996; Butler and Collins, 1999; O’Shaugnessy, 2001; Henneberg, 2006). The
purpose of this paper is therefore not to be prescriptive about the application of branding
practices in politics but rather to develop understanding of how voters view the political
brand. It does this by applying consumer learning theory to the political brand. From
this theoretical/conceptual underpinning, and using an empirically validated
methodology for measuring brands, the paper develops a new consumer-oriented
approach for mapping the political brand. It also develops a method for assessing the
power of political brands and concomitantly, political brand equity. Thus, maps of
Conservative and Labour brands are produced, analysed and their brand equity
discussed. The paper concludes by identifying further research opportunities pertaining
to political brands suggested by this new methodological approach.
The Rise of the Political Brand

4
Brands are important. They are able to produce in consumers a perceived differentiation
between competing offerings and they can play a critical role in directing consumer
preference and choice (Aaker, 1991; Tybout and Sternthal, 2001: Kapferer, 2004).
There has also been a steady stream of papers recognising political parties and or
politicians as brands (Kavanagh, 1995; Kotler and Kotler, 1999; Harris and Lock, 2001;
Smith, 2001; White and deChernatony, 2002; Schneider, 2004; Needham, 2005, 2006;
Reeves et al., 2006; Scammell, 2007).
One reason for the increased research into the political brand is the changing nature of
post-war Western Democracies. Kirchheimer (1966) suggests that viewing parties as
brands is an inevitable response to the move from mass based to catch-all parties.
Voters are less influenced by class affiliation and more likely to act like rational,
economic actors when voting (Downs, 1957). So to win an election, “the catch-all party
must have entered into millions of minds as a familiar object fulfilling in politics a role
analogous to that of a major brand in marketing, of a universally needed and highly
standardized article of mass consumption”(Kirchheimer, 1966, p. 192).
However, a consequence of the ‘catch-all’ approach adopted by the main, national
British political parties, as with many western democracies, is that they increasingly
fight over the middle ground. Also, to secure this middle ground the parties end up
offering ‘valence’ policies (Nelson, 1984) to the electorate wherein they all agree on the
ends (such as the need to improve public services) and differ only on the means of
achieving them. For voters, this increases the effort needed to differentiate between the
parties.
Against these changes, many citizens have a low involvement with party politics. For
them in particular, gathering political information is costly in terms of the effort needed
to assimilate it versus the motivation to do so (Downs, 1957). Faced with these learning
costs, increased by valence politics, voters can save time and energy by using heuristic
shortcuts to help them decide their voting intention (Sniderman et al., 1991; Popkin,
1994). For many, the associations that consumers have of the party brand acts like a
useful heuristic, obviating the need to actively engage in learning about a party, its
policies and values (Forehand et al., 2004). The leader’s image, as part of the overall
brand, has for example been identified as such a heuristic device for voter assessment of
overall party competence, responsiveness and attractiveness (Clarke et al., 2004).
A Consumer Versus a Managerial Approach to Political Branding

5
Despite the structural and consumer-based reasons for more voters viewing political
parties as they do other service brands, the application of branding in the political
marketplace has been equivocal. Branding has been seen to produce unwanted effects
such as narrowing the political agenda, increasing confrontation, demanding conformity
of behaviour/message and even increasing political disengagement at the local level
(Scammell, 1999; Lillekar and Negrine, 2003; Needham, 2005).
These criticisms derive from the application of branding principles in politics – what
may be termed the managerial, normative approach as used on commercial brands (see,
for example, Aaker and Joachimstaller, 2000). In mainstream academic research,
branding is premised on a consumer-oriented perspective, investigating how consumers
learn about brands (see Keller and Lehmann (2006) for an overview of this extensive,
empirical, academic branding literature). The consumer-oriented paradigm of branding
adopts a cognitive psychological approach which assumes that consumers build
knowledge structures about an object (such as a political party) that is stored for retrieval
in memory. It contends that, consumers have an innate motivation to learn about and
decide about brands, both to know where to spend their money (or cast their vote) and to
cope with the increasingly complex and over-communicated world that they live in.
This approach offers numerous new theoretical perspectives from which to investigate
the political brand1 and is the one adopted in this paper.
Conceptualising the Political Brand as Consumer Memory
Brands are not physical but intangible entities, being the associations about a particular
object that are held in the memory of consumers (Keller, 1993). This idea is supported
by learning theory and in particular the associative network memory model of consumer
memory. Brand knowledge is made from individual pieces of information (called
nodes). The theory assumes that such information is linked together in memory to form a
more complex associative network (Collins and Loftus, 1975; Wyer and Srull, 1989); in
this context a network of information about a given political party. This information is
recalled from memory when a node is stimulated from rest by a process known as
activation (de Groot, 1989). So, for example, the Conservative Party may be viewed as
an information node to which other nodes may be associated such as its current leader,
David Cameron (and associations linked to him - that he is relatively young, went
sledging on a Norwegian glacier etc.); that it is the party of the countryside, low tax and

6
so on. Seeing a party’s leader on the television (or hearing their name/reading it in a
paper) acts as a stimulus, producing spreading activation from memory to other political
associations such as those mentioned above. Any association when stimulated has the
potential to activate other brand nodes that are stored in memory.
From a consumer learning perspective therefore, the political brand is defined as an
associative network of interconnected political information, held in memory and
accessible when stimulated from the memory of a voter. Political marketing research to
date has typically sought to measure a priori, views about political parties and their
leaders, policies etc.. The number, type, strength and inter-relationship of the actual
associations of the political brand held in the collective memories of an electorate (or
sub-division thereof) have not been measured and as such the true nature of the political
brand from an associative network perspective remains unknown. This is a major
omission as it is from the associations held in memory that consumers form their
attitudes and make decisions (Keller, 1993). By corollary, this is how voting decisions
are also made.
Measuring Political Brand Equity
As we have seen, the brand is a source of competitive differentiation and given its
importance, there has been much effort to measure the overall value of brands. Brand
equity is the overall term for this value and is defined herein as the differential effect of
brand associations on consumer response to the brand. “A brand is said to have positive
(negative) customer-based brand equity when consumers react more (less) favourably to
an element of the marketing mix for the brand than they do to the same marketing mix
element when it is attributed to a fictitiously named or unnamed version of the product
or service” (Keller, 1993, p. 1). In the political market, an example would be a voter
viewing a Party Political Broadcast more (less) positively because he/she already had a
positive (negative) view of that party.
Numerous ways of measuring consumer-based brand equity have been forwarded (Na et
al., 1999; Kish et al., 2001; Srinivasan et al., 2005). One notable and widely used
approach conceptualises four dimensions of consumer based brand equity, namely,
brand awareness, brand associations, perceived quality and brand loyalty (Aaker, 1991;
Keller 1993) These dimensions have subsequently received empirical support (Yoo and

7
Donthu, 2001; Pappu et al., 2005) and provide the structure for the discussion of
political brand equity that follows.
Brand Awareness. Both Labour and Conservative Parties are clearly very strong in
terms of awareness. Their unprompted recall (derived from the question “name the main
political parties in the UK”) reveals, unsurprisingly, 100% awareness for both brands
from UK respondents. However, high recall, whilst being a necessary condition for
equity, is not of itself sufficient. As we shall see later, brand recall stimulates related
brand associations which may be positive (and add to equity), neutral or negative (and
thus not add to a brand’s equity).
Loyalty. In UK politics, using British Election Studies (BES) and British Election Panel
Surveys (BEPS) over the period 1964-2001, Clarke et al. (2004) conclude that “very
sizeable minorities change their party identifications” (p. 212). Currently about 70% of
voters stay with one party over consecutive elections and approaching a third shift their
level of allegiance and or shift party altogether. There are two ways of viewing this.
Psephologists such as Clarke et al. (2004) view this as evidence of “substantial, ongoing
dynamics in partisanship in Britain” (p. 213). Marketers might think that keeping the
loyalty of the clear majority of existing customers over a protracted period was a sign of
high brand equity.2
Perceived Quality. To the best knowledge of the authors, the perceived quality of the
political brand has not been researched directly at the time of writing. The extant service
quality literature is however extensive and, using Zeithaml et al.’s (1990) seminal work,
those dimensions that appear particularly apposite to politics are highlighted in the
following table. Also provided are examples of recent political events where Labour’s
service quality may have been judged positively or negatively.
Table 1. Potential Influences on the Perceived Quality of the Labour Party
Service Quality
Dimension
Features Political Events Allowing Service Quality
Judgement
Credibility Trustworthiness, honesty and
believability
� Decision on Iraq war/weapons of
mass destruction (2002-3)
� Political sleaze (e.g. cash for honours)
(2006-7)
Security Freedom from danger, risk or
doubt
� Anti-terrorism actions (2001-2007)
� 7th July bombings in London (2005)

8
Communication Listening and keeping
consumers involved
� Blair’s ‘masochism’ election strategy
(2005)
� Labour’s ‘Big Conversation’ (2003)
Reliability/
competence
Ability to perform the
promised service
� Progress on targets in the NHS,
education etc (1998-2007)
� Inaccuracies over immigration figures
(2007)
Adapted from Zeithaml et al. (1990)
Over the 1983-2003 period, about three quarters of polled respondents agreed that both
cabinet ministers and all politicians do not tell the truth (Worcester, 2003). There is also
evidence of declining trust in political parties and politicians in the UK (Dermody and
Hanmer-Lloyd, 2005). Added to these trends is the high overall level of perceived
‘sleaze’ with Labour, perceived as less sleazy than the Conservatives in 2001, now
viewed as more sleazy (Ipsos-Mori, 2007). Taken as a whole, these measures of
perceived quality suggest that both political parties are not strong.
Brand Associations. In measuring brand associations it is evident that they are not all of
equal importance or positive and as such affect equity differently. Keller (1993)
acknowledges this and uses brand association strength, favourability and uniqueness as
measures of brand equity. Strength equates to how many associations the party brings to
mind; Favourability, the positivity/negativity of these associations and Uniqueness,
where associations are not shared with the opposition and thus a potential source of
differentiation. Ideally, a powerful brand with high levels of brand equity will have
strong and favourable associations overall and some of these will be unique on things
important to the consumer/voter.
The rest of this paper is devoted to considering how to measure political brand
associations and their contribution to overall brand equity. It is posited here that the
associations of a political party are the basic source from which perceptions of brand
quality are determined. In turn, the overall perception of the quality of the brand
influences directly partisan loyalty and, subsequently, voting behaviour. As such, brand
associations act as the basic cognitive building block of consumer-based brand equity.3

9
Developing Mental Maps of Political Brands: a Methodology
The main way of representing the memory of consumers is by using mental maps that
reveal not only the associations held in memory but also how these are connected to
each other (see Henderson et al., 1998 for an overview). However, the mapping
approach has been very time consuming and requiring intensive training for the
researcher. A recent addition from John et al. (2006) has forwarded a more
straightforward but empirically reliable and valid method, Brand Concept Maps (BCM),
for collecting, aggregating and producing a single consensus map that represents the
associative network for a particular group of a particular brand.
Rather than repeat the John et al. (2006) BCM methodology, we focus on showing how
we a) applied BCM to the political market, b) used BCM to analyse the characteristics of
the political market and c) further developed the method to consider the power of the
political brand (i.e. its brand equity). In doing this, the paper contributes to the existing
associative network methodology and produces improved ways of measuring brand
maps per se.
The BCM approach uses a stimulus to trigger memory about a brand. The stimulus used
in this research was the party name (Conservative or Labour). The choice of using the
party as the stimulus (as opposed to the leader) is predicated on the fact that the party,
like corporate brands generally, offers the umbrella of cohesion, recognition and
predictability (Singer, 2002). They have also been identified as providing signals
(information) that are simple, credible, salient and continuous over long periods of time
(Tomz and Sniderman, 2004). The greater longevity and umbrella function suggests the
party name as stimulus will cover relevant leader, policy and other important political
brand associations as held in memory by the public.
The research was based on a sample of two discrete groups of undergraduate students at
an English University, one for the elicitation stage (N = 132) and one for the actual
mapping stage (N= 62). Whilst clearly not representative of the electorate at large, their
relative homogeneity as a group (by age, sex, education etc.) was useful for piloting the
method in the area (Calder et al., 1981).
The first step in BCM research is the Elicitation phase wherein the first cohort were
asked to write down the associations (unprompted) that came to mind when they thought
of a given party. Respondents chose the party they felt greatest affinity with.

10
Uncommitted respondents were randomly allocated a party. This resulted in 60 Labour
and 72 Conservative responses. These produced an unprompted listing of approximately
50 separately identifiable associations for both Labour and Conservative. This list was
then reduced to 23 (Labour) and 26 (Conservative) by removing associations mentioned
by less than 4 respondents. A listing of the associations that made it on to the consensus
maps is shown in Table 2 that follows. The associations that failed to appear on the
consensus maps can be found in Table 4 in the Appendix.
The second, Mapping phase entailed using a different subset of the student population.
They were shown an existing brand map example (of the VW Beetle) as a means of
instruction on how to construct a brand map.4 The research group were then asked to
identify the political party they felt closest to. They were next shown the associations
for their chosen party as derived from the Elicitation stage and asked to construct their
own map for their preferred party. Respondents were also told that they were entirely at
liberty to add their own associations; one such free association (First female Prime
Minister) made it onto the final Conservative consensus map. Participants were asked
not only to identify those associations they thought relevant but also to link associations
together. When this was complete, respondents were asked to indicate the strength of
the link between associations using single, double or triple lines. Further, respondents
were asked to consider the associations on their maps and to indicate whether they
considered the association to be positive, negative or neutral.
At the third, Aggregation stage, the individual brand maps were used to generate a single
brand consensus map for each party. In summary, this was done by a) identifying the
(first and second-order) brand associations that feature on the majority of individual
maps; b) adding (first-order) associations to the map that were linked to the party more
often than not; c) adding the remaining (second-order) associations by linking them to
the already positioned first-order associations; d) adding (third-order) associations to the
map- these are included due to high frequency links to first and or second-order
associations; e) calculating the average “weight” for each link, based on the weights in
the individual maps and f) attributing positive or negative signs to each mapped
association.
Analysing the Brand Associations of Labour and Conservative Brands

11
The maps produced during the Aggregation stage are provided in Figures 1 and 2 for
Conservative and Labour respectively. They reflect the associations about a party by
respondents who expressed a preference (either strong or slight) for that party. There
were no Conservative supporters mapping Labour and vice versa. Given their positive
affiliation with the party brand, the resultant maps are relatively positive also.
The Party and its first-order associations are shown shaded; second-order associations
are un-shaded with a solid outline; third-order associations are shown with dashed
outlines.
Figure 1: A Brand Consensus Map of the Conservative Party by Conservative
Supporters
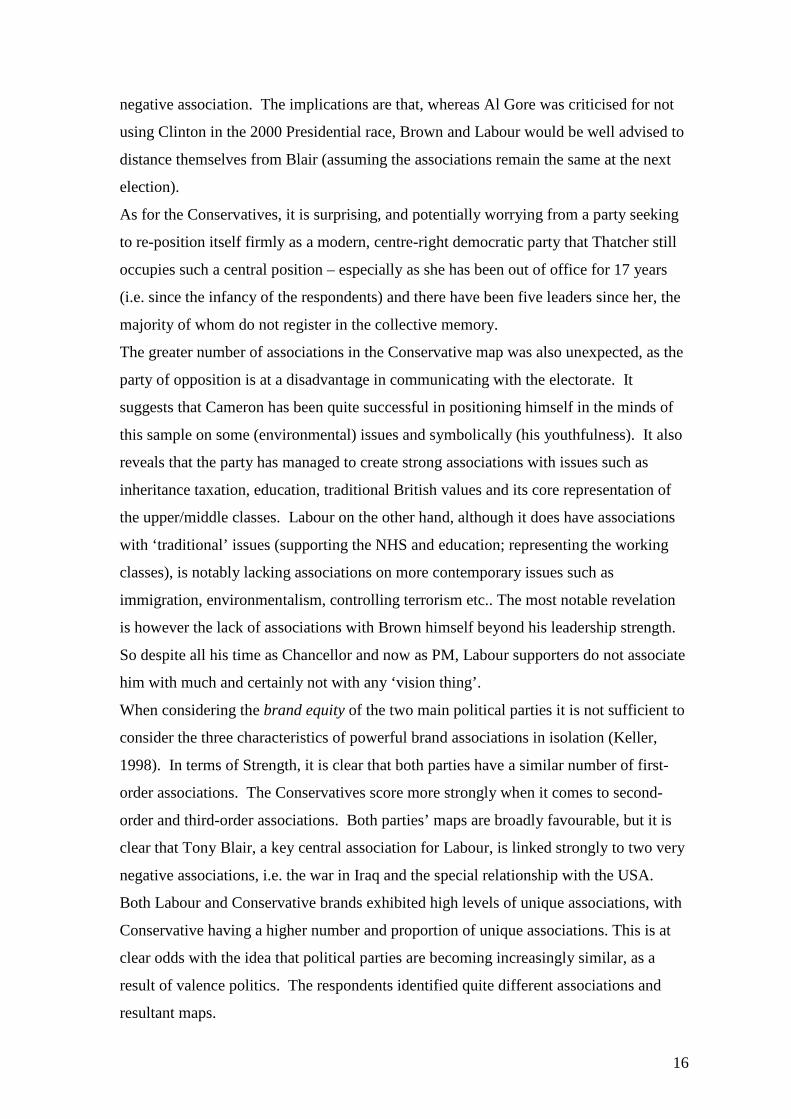
Figure 2: A Brand Consensus Map of the Labour Party by Labour Supporters
David Cameron
Conservative Party
Good policies
on education
Blue
Cycles to work
Young leader
Time for a change
Good leader
Supports green
policies
Hug-a-hoodie
Low inheritance tax policies
Not in power Represents
Middle/Upper classes
Margaret Thatcher
Tree logo
John Major
Party of the 80s/Dated
First female PM
Promotes traditional
British values
Low taxation policies
Party of fairness
Tough on immigration
Family oriented
party
–
–
+
+
+
+
+
+ +
+
+
–
+
+
+
+
+
+
+
+ –

12
General Characteristics: Firstly, it is useful to gain a broad prima facie impression from
the maps and this is done by simply ‘eyeballing’ them, looking for interesting features.
This process reveals that the Conservative map clearly contains more associations than
the Labour map – the implications of this will be discussed in greater detail later. Both
maps have a similar structure insofar as personality associations and policy based
associations appear as separate discrete groupings. Both maps also contain a very
similar structure linking party, leader, past leader and good/strong leadership.
Surprisingly, the maps show that David Cameron is linked with more associations than
Gordon Brown, the Prime Minister; when respondents think of David Cameron, many
more associations are triggered in memory. This would perhaps be a concern for Labour
party strategists.
However, much information from the maps is not apparent from a visual inspection and
a quantitative analysis is required to highlight this hidden information. Our primary
concern was to identify those associations that consumers perceive to be the most
important for the political brand. In network analysis this is denoted by the brand
association’s centrality within the consensus map.
Central Characteristics: Centrality measures where each association is in a map. Those
features scoring more highly can be regarded as being more important, fundamental or
central to the brand. Three commonly used centrality measures were used: degree
centrality (Freeman, 1979; Czepiel, 1974) – how many associations are directly linked to
each association; betweenness centrality (Freeman, 1979) – what proportion of geodesic
(shortest) paths in the map link through a particular association and closeness centrality
Gordon Brown
Labour Party
In power
Tony Blair
Promotes equal opportunities
Promotes a fair society
Supports the NHS
Special relationship with USA
Have improved education
Party for the working class
Strong leader
War in Iraq
+ –
+
+
+
+
+
+
+
+
–

13
(Sabidussi, 1966) – how close an association is to the other associations in the map. By
using these three measures together, it is possible to identify the central associations of
the map, and hence the party. Details of the formulae involved in calculating these
measures can be found in Appendix 1. The centrality values for the maps in Figures 1
and 2 are shown in Table 2 below.
The centrality measures reveal that for the Conservatives, there is very broad agreement
between the three measures as to what are the key branded features: Conservative Party;
David Cameron; Represents Middle/Upper Classes and, Margaret Thatcher. For Labour,
there is similar agreement: Labour Party; Gordon Brown; Party for the Working Class
and Tony Blair. Further analysis of the tables reveals that for the Conservatives, David
Cameron is ranked higher than Margaret Thatcher with respect to all three measures of
centrality. More surprisingly, for Labour, the former leader, Tony Blair, is more central
to the brand than the current leader, Gordon Brown.
Table 2: Centrality Values for the Consensus Maps (Figures 1 and 2)
Conservative Centrality Labour Centrality
Association Deg. Bet. Clo. Association Deg. Bet. Clo.
Conservative Party 5 150.50 0.024 Labour Party 5 32.00 0.059
David Cameron 8 90.50 0.021 War In Iraq 3 2.50 0.045
Margaret Thatcher 6 53.50 0.020 Tony Blair 6 20.00 0.056
Middle/Upper Classes 5 117.00 0.020 Gordon Brown 4 16.50 0.050
Trad’l British Values 4 41.00 0.015 Spec. Rel. - USA 2 0.00 0.037
Green Policies 3 8.00 0.016 Improved Educ’n 1 0.00 0.036
Tough on Immigration 1 0.00 0.012 For Working Class 3 18.00 0.043
Blue 2 12.50 0.017 Supports The NHS 1 0.00 0.037
Low Inheritance Tax 2 0.00 0.015 Promotes Fair Society 2 0.00 0.031
Low Taxation Policies 3 21.00 0.015 Promotes Equal Opps 2 0.00 0.031
Time for a Change 1 0.00 0.012 In Power 1 0.00 0.033
Good Policies Educ’n 1 0.00 0.012 Strong Leader 2 0.00 0.038
Not in Power 2 21.00 0.016
Young Leader 1 0.00 0.015
John Major 2 0.00 0.015
Family Oriented Party 2 0.00 0.015
Cycles to Work 2 0.00 0.015
Good Leader 2 0.00 0.015
Party of 80’s/Dated 1 0.00 0.014

14
Party of Fairness 1 0.00 0.011
Tree Logo 2 1.50 0.014
Hug-A-Hoodie 1 0.00 0.015
First Female PM 1 0.00 0.014
Measuring the Equity of Political Brands
As previously identified, Keller (1993) postulates that the strength, favourability and
uniqueness of a brand’s associations are a measure of brand equity. What remains is to
operationalise these measures within the consensus maps of the Labour and
Conservative parties created and discussed above. To this end, the work of Krishnan
(1996) on measuring brand equity via brand associations is used and applied to the brand
maps of Labour and the Conservatives.
Strength. The number of associations that come to mind when asked to consider a party
is one measure of equity. A party with many associations has more routes between
associations and thus a greater number of ways by which associations can be recalled
from memory via spreading activation. So, based upon the consensus maps in Figures 1
and 2, the Conservative party with 22 associations would be considered far stronger than
the Labour party with 11 associations. However, further analysis based on the
categorisation (by BCM) of associations as either first-order (frequently
mentioned/linked and directly linked to the party), second-order (frequently
mentioned/linked, but not directly linked to the party) and third-order (included due to
the frequency of linkage to a first or second-order association) presents a slightly more
balanced view (see Table 3). Thus, it can be seen that both parties have the same
number of associations directly linked to the party. The Conservatives however, show
greater strength in terms of the number of associations that are triggered when the first-
order associations come to mind. The significance of this can only be gauged by
considering the nature of these further associations; having more associations will only
be of value if the associations are favourable.
Table 3: Number of Associations by Type
Type of Association Labour Conservative

15
First-Order 5 5
Second-Order 4 7
Third-Order 2 10
Total 11 22
Favourability. As the number of associations is not necessarily a sign of equity (for
example, McDonalds may have a lot of negative associations for some consumers), it is
necessary to measure the net valence of the associations (Krishnan, 1996), that is (# of
positive associations - # of negative associations) / (total number of associations). For
Labour, this calculation produces a favourability score of 0.63. For the Conservatives,
favourability is 0.685 with 1 being complete favourability. Thus, the Conservative
brand is viewed marginally more favourably than Labour. Further analysis of these
figures reveal that in both cases, in excess of 75% of associations were positively judged
and overall, the respondents had a high level of favourability for their preferred party -
as might be expected.
Uniqueness. Krishnan (1996) measures uniqueness as the proportion of associations that
are unique to the brand as compared to the competition. As the two elicited lists
contained many different associations, the resulting consensus maps were expected to
have little in common and show two unique brands. The maps in fact share three
associations, i.e. Party of fairness/Promotes a fair society; Good policies on
education/Have improved education and Good leader/Strong leader. The remaining
associations (19 for Conservative, 8 for Labour) are unique. Measuring the proportion
of unique associations reveals that Conservatives have 19/22 = 86% unique associations
compared to 8/11 = 73% for Labour. The analysis confirms that the party brands are in
fact quite unique for the sampled groups
Discussion of Results
Analysis of the general and central brand characteristics has confirmed the importance
of the leader with the party brand. For Labour it also reveals how Blair is still a major
part of the brand. Though Blair still has strong negative associations (Iraq and the USA),
his link to Brown is less strong, whilst Brown himself is not linked directly with either
16
negative association. The implications are that, whereas Al Gore was criticised for not
using Clinton in the 2000 Presidential race, Brown and Labour would be well advised to
distance themselves from Blair (assuming the associations remain the same at the next
election).
As for the Conservatives, it is surprising, and potentially worrying from a party seeking
to re-position itself firmly as a modern, centre-right democratic party that Thatcher still
occupies such a central position – especially as she has been out of office for 17 years
(i.e. since the infancy of the respondents) and there have been five leaders since her, the
majority of whom do not register in the collective memory.
The greater number of associations in the Conservative map was also unexpected, as the
party of opposition is at a disadvantage in communicating with the electorate. It
suggests that Cameron has been quite successful in positioning himself in the minds of
this sample on some (environmental) issues and symbolically (his youthfulness). It also
reveals that the party has managed to create strong associations with issues such as
inheritance taxation, education, traditional British values and its core representation of
the upper/middle classes. Labour on the other hand, although it does have associations
with ‘traditional’ issues (supporting the NHS and education; representing the working
classes), is notably lacking associations on more contemporary issues such as
immigration, environmentalism, controlling terrorism etc.. The most notable revelation
is however the lack of associations with Brown himself beyond his leadership strength.
So despite all his time as Chancellor and now as PM, Labour supporters do not associate
him with much and certainly not with any ‘vision thing’.
When considering the brand equity of the two main political parties it is not sufficient to
consider the three characteristics of powerful brand associations in isolation (Keller,
1998). In terms of Strength, it is clear that both parties have a similar number of first-
order associations. The Conservatives score more strongly when it comes to second-
order and third-order associations. Both parties’ maps are broadly favourable, but it is
clear that Tony Blair, a key central association for Labour, is linked strongly to two very
negative associations, i.e. the war in Iraq and the special relationship with the USA.
Both Labour and Conservative brands exhibited high levels of unique associations, with
Conservative having a higher number and proportion of unique associations. This is at
clear odds with the idea that political parties are becoming increasingly similar, as a
result of valence politics. The respondents identified quite different associations and
resultant maps.

17
Taken together, the Conservative brand has more strength than Labour, is as favourably
perceived and has more unique associations and as such has the greater equity. This
conclusion of course applies only to the groups sampled. It also must be set against the
background of the political marketplace; of high political brand awareness but
significant brand switching amongst voters and a low perceived quality of the service
political parties provide overall.
Further Research
In this paper we have concentrated on illustrating brand mapping and brand equity
measurement as applied to the two main UK political parties. Clearly, BCM may be
also used to compare and contrast other important electoral groups. So for example,
future research could target floating/non aligned voters in marginal seats to see what
associations of the competing political brands are in their collective memories,
accessible for use when voting - and thus likely to influence the outcome of a general
election.
Another interesting possibility with this method would be to adopt a longitudinal
approach over the duration of an election campaign to see a) how, if at all, the campaign
influences the mental maps of voters and b) if there are changes, whether these are
affecting changes in voting intention (to vote or abstain; to switch allegiance).
Longitudinal research could also compare and contrast election campaign affects across
differing ‘segments’6 using the BCM approach.
A more protracted longitudinal study that covered the period of a parliament or longer
would allow for the analysis of how significant events (war, sleaze, economic
mismanagement etc.) affect consumer memory of political brands and potentially shed
light on tipping points in voting intentions.
Finally, the BCM approach can also be used with differing foci. So for example it could
be used with the leader as the main stimulus in the map’s creation. Parties might also be
interested to analyse the memory maps of voters on specific policies (for example the
Conservatives on how they are perceived on the EU, Public Services etc.).
Conclusions

18
The paper has analysed the two main political parties in the UK as brands. To do this it
has conceptualized the political brand as consumer learning and provided a new method
for measuring the brand equity of political parties using consumers’ brand associations.
The findings are limited in their wider application by their focus on a convenience
sample of students. The method however does confirm the relative ease of developing
maps and, as the further research section suggests, the potential to develop this method
in politics is great, both in the UK and other democratic societies where the views of the
public are important. Its wider application will produce a greater understanding of how
voters understand and react to political parties. The approach outlined in this paper
promises to provide a strong impetus for further empirical, theoretically supported
research into this important area of political marketing.
References
Aaker,D. (1991), Managing Brand Equity, The Free Press, New York.
Aaker, D. and Joachimsthaler, E. (2000), Brand Leadership, The Free Press, New York.
Butler, P. and Collins, N. (1999), “A Conceptual Framework for Political Marketing”, in
Newman, B.I., (ed.), Handbook of Political Marketing, Sage, Thousand Oaks,
California.
Calder, B.J., Phillips L.W. and Tybout, A.M. (1981), “Designing Research for
Application,” Journal of Consumer Research, Vol. 8, September, pp. 197-207.
Clarke, H.D., Sanders, D., Stewart, M.C. and Whiteley, P. (2004), Political Choice in
Britain, Oxford University Press, Oxford.
Collins, A.M. and Loftus, E.F. (1975), “A spreading activation theory of semantic
processing”, Psychological Review, Vol. 82, No.6, pp. 407-28.
Czepiel, J.A. (1974), “Word-of-Mouth Processes in the Diffusion of a Major
Technological Innovation”, Journal of Marketing Research, Vol. 11, May, pp.172–180.
de Groot, A.M.B. (1989), “Representational aspects of word imageability and word
frequency as assessed through word association”, Journal of Educational Psychology:
Learning Memory and Cognition, Vol. 15, No. 5, pp 824-845.
Dermody, J. and Hanmer Lloyd, S. (2005), “Safeguarding the Future of Democracy:
(Re)Building Young People’s Trust in Parliamentary Democracy”, Journal of Political
Marketing, Vol. 4, No. 2/3, pp. 115-133.

19
Downs, A. (1957), An Economic Theory of Democracy, Harper, New York.
Forehand, M., Gastil, J. and Smith, M.A. (2004), “Endorsement as Voting Cues:
Heuristic and Systematic Processing in Initiative Elections”, Journal of Applied Social
Psychology, Vol. 34, No. 11, pp. 2215-2233.
Freeman, L.C. (1979), “Centrality in Social Networks Conceptual Clarification”, Social
Networks, Vol. 1, No. 3, pp. 215–239.
Harris, P. and Lock, A. (2001), “Establishing the Charles Kennedy Brand: A Strategy for
an Election the Result of which is a Foregone Conclusion”, Journal of Marketing
Management, Vol. 17, No. 9-10, pp. 943-956.
Henderson G.R., Iacobucci D. and Calder B.J. (1998), “Brand Diagnostics: Mapping
Branding Effects Using Consumer Associative Networks”, European Journal of
Operational Research, Volume 111, Number 2, pp. 306-327.
Henneberg, S. (2006), “The views of an advocatus dei: political marketing and its
critics”, Journal of Public Affairs, Vol. 4, No. 3 , pp. 225 – 243.
Ipsos-Mori (2007), “Attitudes Towards Sleaze”, http://www.ipsos-mori.com/polls/
trends/sleaze.shtml.
John, R.D., Loken, B., Kim, K. and Basu Monga, A. (2006), “Brand Concept Maps : A
Methodology for Identifying Brand Association Networks”, Journal of Marketing
Research, Vol. 43, No. 4, pp. 549-563.
Kapferer, J-N. (2004), The New Strategic Brand Management. Creating and Sustaining
Brand Equity Long Term, Kogan Page, London.
Kavanagh, D. (1995). Election Campaigning: The New Marketing of Politics, Blackwell,
Oxford, UK.
Keller, K.L. (1993), “Conceptualizing, measuring, and managing customer-based brand
equity”, Journal of Marketing, Vol. 57 No.1, pp.1-22.
Keller, K.L. (1998), Building, Measuring and Managing Brand Equity, Prentice Hall,
New Jersey.
Keller, K.L. (2002), “Branding and Brand Equity”, in Weitz, B.A. and Wensley, R.,
(ed.), Handbook of Marketing, Sage, Thousand Oaks, California.
Keller, K.L. and Lehmann, D. (2006), “Brands and branding: Research Findings and
Future Priorities”, Marketing Science, Vol. 25, No. 6. pp. 740-759.
Kirchheimer, O. (1966), “The Transformation of the Western European Party Systems",
in Lapalombara, H. and Weiner, M., (eds.), Political Parties and Political Development,
Princeton University Press, Princeton, N.J., pp. 177–200.

20
Kish, P, Riskey, D. R. and Kerin, R. A. (2001), “Measurement and tracking of brand
equity in the global marketplace: the PepsiCo experience”, International Marketing
Review, Vol. 18, No. 1, pp. 91-96.
Kotler, P. and Kotler, N. (1999), “Generating effective candidates, campaigns, and
causes”, in Newman, B., (ed.), Handbook of Political Marketing, Sage, Thousand Oaks,
pp.3-19.
Krishnan, S.H. (1996), “Characteristics of Memory Associations: A Consumer-Based
Brand Equity Perspective”, International Journal of Research in Marketing, Vol. 13,
389-405.
Lilleker, D. and Negrine, R. (2003). “Not big brand names but corner shop: Marketing
politics to a disengaged electorate”, Journal of Political Marketing, Vol. 2, No.1, pp. 55-
75.
Lock A. and Harris P. (1996), “Political Marketing - Vive la Différence!”, European
Journal of Marketing, Vol. 30, No. 10/11, pp. 14-24.
Na, W. B., Marshall, R. and Keller, K. L. (1999), “Measuring brand power: validating a
model for optimizing brand equity”, Journal of Product and Brand Management, Vol.
18, No. 2/3, pp. 170-184.
Needham, C. (2005), “Brand Leaders: Clinton, Blair and the Limitations of the
Permanent Campaign”, Political Studies, Vol. 53, p. 343-361.
Needham, C. (2006), “Brands and Political Loyalty”, Brand Management, Vol. 13, No.
3, pp. 178-187.
Nelson, B.J. (1984), Making an Issue of Child Abuse: Political Agenda Setting for Social
Problems, University of Chicago Press, Chicago.
O’Shaugnessy, N. (2001), “The Marketing of Political Marketing”, European Journal of
Marketing, Vol. 35, No. 9/10, pp. 1047-1057.
Pappu, R., Quester, P. G. and Cooksey, R. W. (2005), “Consumer-based brand equity:
improving the measurement - empirical evidence”, Journal of Product and Brand
Management, Vol. 14, No.3, pp. 143-154.
Popkin, S. L. (1994), The Reasoning Voter, The University of Chicago Press, Chicago.
Reeves, P., de Chernatony, L. and Carrigan, M. (2006), “Building a Political Brand:
Ideology Or Voter- Driven Strategy”, Journal of Brand Management, Vol. 13, No. 6, pp.
418-428.
Sabidussi, G. (1966), “The Centrality Index of a Graph”, Psychometrika, Vol. 31, No. 4,
pp. 581–603.

21
Scammell, M. (1999), “Political marketing: Lessons for political science”, Political
Studies, Vol. 47, No. 4, pp. 718-739.
Scammell, M. (2007), “Political Brands and Consumer Citizens: The Rebranding of
Tony Blair”, The ANNALS of the American Academy of Political and Social Science,
Vol. 611, No. 1, pp. 176-192.
Schneider, H. (2004), “Branding in Politics – Manifestations, Relevance and Identity-
Oriented Management”, Journal of Political Marketing, Vol. 3, No. 3, pp. 41-67.
Singer, C. (2002), “Bringing Brand Savvy to Politics,” Brandweek, Vol. 43, No. 34, p.
19.
Smith, I.G. (2001), ''The 2001 General Election: Factors Influencing the Brand Image of
Political Parties and their Leaders'', Journal of Marketing Management, Vol. 17, No.
9/10, pp. 1058-1073.
Sniderman, P.M., Brody, R.A. and Tetlock, P.E. (1991), Reasoning and Choice.
Explorations in Political Psychology, Cambridge University Press, Cambridge.
Srinivasan, V. S., Park, C.S. and Chang, D.R. (2005), "An Approach to the
Measurement, Analysis, and Prediction of Brand Equity and Its Sources," Management
Science, Vol. 51, No. 9, pp. 1433-1448.
Tomz, M. and Sniderman, P. (2004), “Constraint in Mass Belief Systems: Political
Brand Names as Signals”, paper presented at the annual meeting of the American
Political Science Association, Chicago.
Tybout, A.M. and Sternthal, B. (2001), “Brand Positioning”, in Iacobucci, D., (ed.),
Kellogg on Marketing, John Wiley, New York, pp. 31-57.
White, J. and de Chernatony, L. (2002), “New Labour: A Study of the Creation,
Development and Demise of a Political Brand”, Journal of Political Marketing, Vol. 1,
No. 2/3, pp. 45-52.
Worcester, R.M. (2003), “Whom Do We Trust? Neither Politicians Nor Journalists!”,
http://www.ipsos-mori.com/publications/rmw/whomdowetrust.shtml.
Wyer, R.S. and Srull, T.K. (1989), “Person memory and judgement”, Psychological
Review, Vol. 96, No. 1, pp. 58-83.
Yoo, B. and Donthu, N. (2001), “Developing and Validating a Multidimensional
Consumer-Based Brand Equity Scale”, Journal of Business Research, Vol. 52, No. 1.
pp. 1-14.

22
Zeithaml, V., Parasuraman, A. and Berry, L. (1990), Delivering Quality Service:
Balancing Customer Perceptions and Expectations, The Free Press, New York.
Appendix
Degree Centrality for association k = ∑=
n
iika
1
where n is the number of associations in the
consensus map, aik = 1 if associations i and k are directly connected in the consensus map
and 0 otherwise.
Betweenness Centrality for association k = ∑ ∑−
≠= ≠+=
1
,1 ,1
n
kii
n
kjijijkb where
ij
ijijk g
kgb
)(= . gij is the
number of shortest paths connecting associations i and j in the consensus map and gij(k) is
the number of the shortest paths that pass through association k.
Closeness Centrality for association k = 1
1
−
=
∑
n
iikd where dik is the number of links in the
shortest path linking associations i and k.
Table 4: Associations produced during the elicitation phase not appearing in the
consensus maps.
Conservative Labour
Better than the Labour Party Better than the Conservative Party
Euro-sceptics Election wins
Good policies for the NHS Increased Taxes Through Stealth
New/Innovative/Progressive Party New Labour/Third Way
Strong Party Party of fair taxation
Pro miners/unions
Produced economic prosperity
Pro-Europe
Red
Rose logo
Supports civil liberties
Supports the welfare state

23
1 For example, brand knowledge theory underpins source credibility, cognitive consistency, schema congruity and affect transfer -and these all offer potential novel insight into political marketing. 2 In commercial markets, high brand loyalty is closely linked to purchase and financial success. In politics, loyalty often matters less than a much smaller number of floating voters switching between parties. 3 This is particularly true with valence based voting behaviour wherein trust and competence to best implement policies that are similar across parties is forwarded as a major dynamic of voting behaviour (see Clarke et al. (2004)). 4 This brand map was the same as used by John et al. (2006), amended to make more relevant to the sample. 5 Note that “Not in Power” has been treated as a positive; this is actually a favourable association. 6 For example, British Social Attitudes’ floating voters/non aligned, residual identifiers, sympathisers and partisans.