05-chapter1
DESCRIPTION
Material Properties DatabaseTRANSCRIPT

Metallic Materials Properties Development and Standardization (MMPDS)
CHAPTER 1 – INTRODUCTION April 2010 Scientific Source: Metallic Materials design data acceptable to Government procuring or certification agencies.
A joint effort of government, industrial, educational, and international aerospace organizations.
MMPDS-05
Copyright 2010 Federal Aviation Administration and licensed exclusively to Battelle Memorial Institute for distribution. All rights reserved. Unauthorized duplication or
distribution may violate the Copyright Laws of the United States and of other jurisdictions.

Except as expressly provided below, the copyrighted work contained herein may not be
copied, modified, adapted, translated, included in derivative works or transferred to a third
party. The information may be subject to export control laws and regulations of the United
States. The user represents and warrants that the information will not be exported, transferred,
sublicensed, copied, shared, disclosed, or used in any way except in compliance with all
applicable export control laws and regulations of the United States.
The owner of this copy of the Handbook is hereby granted a limited license to make
copies of no more than 10 individual pages of the Handbook (but specifically not including
multiple sections or volumes) from this copy at a time for the sole purpose of attaching as
reference and supporting information to a document authored by the owner.
The user of this Handbook assumes the responsibility for the selection of material
properties from it to meet their requirements. The information contained herein is provided as-is
without warranty. There are no warranties of any kind, either express or implied, including but
not limited to the implied warranties of merchantability and fitness for a particular purpose.

MMPDS-051 April 2010
i
The Metallic Materials Properties Development and Standardization (MMPDS) Handbook, is an
accepted source for metallic material and fastener system allowables for the Federal Aviation
Administration (FAA), all Departments and Agencies of the Department of Defense (DoD), and the
National Aeronautics and Space Administration (NASA). Per guidance provided by FAA Advisory
Circular (AC) 25.613-1 and FAA policy memorandum PS-AIR100-2006-MMPDS, the A and B values
contained in the MMPDS have been determined to satisfy the regulatory requirements defined in Title 14
of the Code of Federal Regulations (CFR) 27.613(d), 29.613(d), 25.613(b) and 23.613(b).
MMPDS-05 is the replacement to MMPDS-04/MMPDS-04 Change Notice 1 and prior editions as
well as the replacement for all editions of MIL-HDBK-5, Metallic Materials and Elements for Aerospace
Vehicle Structures Handbook that was maintained by the U.S. Air Force. The last edition, MIL-HDBK-5J,
was classified as noncurrent in the Spring of 2004.
This document contains design information on the strength properties of metallic materials and
elements for aircraft and aerospace vehicle structures. All information and data contained in this Handbook
has been reviewed and approved in a standardized development process. The development and ongoing
maintenance process involves certifying agencies, including the FAA, DoD, and NASA, and major material
suppliers and material users worldwide. The data and procedures in this Handbook are continuously
reviewed, and if needed, are modified or removed for consistency. With advances in materials and fastener
systems, and with the review process of existing information, annual updates of the MMPDS are expected.
As such, it is recommended that the latest version of the MMPDS be used.
Beneficial comments (recommendations, additions, deletions) and any pertinent data that may be of
use in improving this document should be addressed to Secretariat, MMPDS Coordination Activity (614-
424-4433 voice or [email protected] email), Battelle, Mechanical Analysis Group, Room 11-1-080,
505 King Avenue, Columbus, OH 43201. You may also contact the Secretariat through the handbook
website, www.mmpds.org
This Handbook has been approved for public release with unlimited distribution.
Preparing activity:
FAA - William J. Hughes Technical Center
FOREWORD

MMPDS-051 October 2010
ii
For chapters containing materials properties, a deci-numeric system is used to identify sections oftext, tables, and illustrations. This system is explained in the examples shown below. Variations of thisdeci-numerical system are also used in Chapters 1, 8, and 9.
Example A 2.4.2.1.1
General material category (in this case, steel) . . . . . . . . . . . . . . . . . . . . . . . . . . . . . . . . . . . . . . . . . .
A logical breakdown of the base material by family characteristics(in this case, intermediate alloy steels); or for element properties . . . . . . . . . . . . . . . . . . . . . . . . .
Particular alloy to which all data are pertinent. If zero, section contains commentson the family characteristics . . . . . . . . . . . . . . . . . . . . . . . . . . . . . . . . . . . . . . . . . . . . . . . . . . . . . . .
If zero, section contains comments specific to the alloy; if it is an integer, thenumber identifies a specific temper or condition (heat treatment) . . . . . . . . . . . . . . . . . . . . . . . . . . . .
Type of graphical data presented on a given figure(see following description) . . . . . . . . . . . . . . . . . . . . . . . . . . . . . . . . . . . . . . . . . . . . . . . . . . . . . . . . . .
Example B 3.2.3.1.X
Aluminum . . . . . . . . . . . . . . . . . . . . . . . . . . . . . . . . . . . . . . . . . . . . . . . . . . . . . . . . . . . . . . . . . . . . .
2000 Series Wrought Alloy . . . . . . . . . . . . . . . . . . . . . . . . . . . . . . . . . . . . . . . . . . . . . . . . . . . . . . . . .
2024 Alloy . . . . . . . . . . . . . . . . . . . . . . . . . . . . . . . . . . . . . . . . . . . . . . . . . . . . . . . . . . . . . . . . . . . . . . . .
T3, T351, T3510, T3511, T4, and T42 Tempers . . . . . . . . . . . . . . . . . . . . . . . . . . . . . . . . . . . . . . . . . . .
Specific Property as Follows . . . . . . . . . . . . . . . . . . . . . . . . . . . . . . . . . . . . . . . . . . . . . . . . . . . . . . . . . . . .
Tensile properties (ultimate and yield strength) . . . . . . . . . . . . . . . . . . . . . . . . . . . . . . . . . . . . . . . . 1
Compressive yield and shear ultimate strengths . . . . . . . . . . . . . . . . . . . . . . . . . . . . . . . . . . . . . . . . 2
Bearing properties (ultimate and yield strength) . . . . . . . . . . . . . . . . . . . . . . . . . . . . . . . . . . . . . . . . 3
Modulus of elasticity, shear modulus . . . . . . . . . . . . . . . . . . . . . . . . . . . . . . . . . . . . . . . . . . . . . . . . 4
Elongation, total strain at failure, and reduction of area . . . . . . . . . . . . . . . . . . . . . . . . . . . . . . . . . . 5
Stress-strain curves, tangent-modulus curves . . . . . . . . . . . . . . . . . . . . . . . . . . . . . . . . . . . . . . . . . . 6
Creep . . . . . . . . . . . . . . . . . . . . . . . . . . . . . . . . . . . . . . . . . . . . . . . . . . . . . . . . . . . . . . . . . . . . . . . . . 7
Fatigue . . . . . . . . . . . . . . . . . . . . . . . . . . . . . . . . . . . . . . . . . . . . . . . . . . . . . . . . . . . . . . . . . . . . . . . . 8
Fatigue-Crack Propagation . . . . . . . . . . . . . . . . . . . . . . . . . . . . . . . . . . . . . . . . . . . . . . . . . . . . . . . . 9
Fracture Toughness . . . . . . . . . . . . . . . . . . . . . . . . . . . . . . . . . . . . . . . . . . . . . . . . . . . . . . . . . . . . . . 10
EXPLANATION OF NUMERICAL CODE

MMPDS-05
1 April 2010
iii
REGISTERED TRADEMARKS
Trademark Registered by Chemistry UNS Number
15-5PH® AK STEEL CORP. 15Cr - 4.6Ni - 0.22Cb - 2.8Cu J92110
15Cr - 4.5Ni - 0.30Cb - 3.5Cu S15500
17-4-PH® 1 ARMCO INC. CORP. 16Cr - 4.1Ni - 0.28Cb - 3.2Cu J92200
16.5Cr - 4.0Ni - 4.0Cu - 0.30Cb S17400
17-7PH® ARMCO INC. CORP 17Cr-7.1Ni-1.1Al J17700
ACRES®sleeves
CLICK BOND, INC. NA NA
AerMet® 100 CRS HOLDINGS INC.3.1Cr-11.5Ni-13.5Co-1.2Mo (0.21 -
0.25C)K92580
AM-350™ ALLEGHENY LUDLUM
CORP.16.5Cr - 4.5Ni - 2.9Mo - 0.10N S35000
AM-355™ ALLEGHENY LUDLUM
CORP.15.5Cr - 4.5Ni - 2.0Mo - 0.10N S35500
Cherry®TEXTRON FASTENING
SYSTEMS, INC.NA NA
Cherrybucks®TEXTRON FASTENING
SYSTEMS, INC.NA NA
Custom450® CRS HOLDINGS INC. 15Cr - 6.5Ni - 0.75Mo - 0.30 (Cb + Ta)
- 1.5CuS45000
Custom455® CRS HOLDINGS INC. 12Cr-8.5Ni-2.0Cu-1.1Ti S45500
Custom465® CRS HOLDINGS INC. 6A1- 6V - 2SN none
Ferrium® S53® Ques Tek Innovations LLC10Cr-5.5Ni-14Co-2Mo-1W (0.19-
0.23C)S10500
Hastelloy® X HAYNES
INTERNATIONAL, INC.47.5Ni-22Cr-1.5Co-9.0Mo N06002
Elektron® 21MAGNESIUMELEKTRON
EV31ASimilar toM12310
HAYNES®HAYNES
INTERNATIONAL, INC.NA NA
230® HAYNES
INTERNATIONAL, INC.59Ni-22Cr-2Mo-14W-0.35Al N06230
Hi-Lok® HI-SHEAR CORP. NA NA
Hi-Shear® HI-SHEAR CORP. NA NA
HR-120® HAYNES
INTERNATIONAL, INC.35Fe - 24Cr - 37Ni - 0.65Cb - 0.2N N08120
HSL180TMHITACHI METALS ANDSUMITOMO PRECISION
PRODUCTS12.5Cr-1.0Ni-15.5Co-2.0Mo NA
INCONEL®HUNTINGTON ALLOYS
CORP.NA NA
MP159® SPS TECHNOLOGY19Cr - 36Co - 25Ni - 7.0Mo - 0.50Cb -
2.9Ti - 0.20Al - 9.0FeR30159
1 Shown in the customary form of 17-4PH in the Handbook.

MMPDS-05
1 April 2010
iv
Trademark Registered by Chemistry UNS Number
MP35N® SPS TECHNOLOGY 20Cr - 35Ni - 35Co - 10Mo R30035
PH13-8® Mo ARMCO INC. CORP. 13Cr-8.0Ni-2.2Ni-1.1Al S13800
PH15-7® Mo ARMCO INC. CORP. 15Cr - 7.1Ni - 2.5Mo - 1.1A1 S15700
RENE3 ® 41TELEDYNE INDUSTRIES
INC.54Ni - 19Cr - 11Co - 9.8Mo - 3.2Ti -
1.5Al - 0.006B N0704
ToughMet® 3 Brush Wellman Inc. 77Cu-15Ni-8Sn C72900

MMPDS-05
1 April 2010
VOLUME CONTENTS
Section Page
I
Chapter 1
1.0 General . . . . . . . . . . . . . . . . . . . . . . . . . . . . . . . . . . . . . . . . . . . . . . . . . . . . . . . . . . . . . . . . . . 1-1
1.1 Purpose and Use of Document . . . . . . . . . . . . . . . . . . . . . . . . . . . . . . . . . . . . . . . . . . . . . . . . 1-1
1.1.1 Introduction . . . . . . . . . . . . . . . . . . . . . . . . . . . . . . . . . . . . . . . . . . . . . . . . . . . . . . . . . 1-1
1.1.2 Scope of Handbook . . . . . . . . . . . . . . . . . . . . . . . . . . . . . . . . . . . . . . . . . . . . . . . . . . . 1-1
1.2 Nomenclature . . . . . . . . . . . . . . . . . . . . . . . . . . . . . . . . . . . . . . . . . . . . . . . . . . . . . . . . . . . . . 1-3
1.2.1 Symbols and Definitions . . . . . . . . . . . . . . . . . . . . . . . . . . . . . . . . . . . . . . . . . . . . . . . 1-3
1.2.2 International Systems of Units (SI) . . . . . . . . . . . . . . . . . . . . . . . . . . . . . . . . . . . . . . . 1-3
1.3 Commonly Used Formulas . . . . . . . . . . . . . . . . . . . . . . . . . . . . . . . . . . . . . . . . . . . . . . . . . . . 1-5
1.3.1 General . . . . . . . . . . . . . . . . . . . . . . . . . . . . . . . . . . . . . . . . . . . . . . . . . . . . . . . . . . . . 1-5
1.3.2 Simple Unit Stresses . . . . . . . . . . . . . . . . . . . . . . . . . . . . . . . . . . . . . . . . . . . . . . . . . . 1-5
1.3.3 Combined Stresses (see Section 1.5.3.5) . . . . . . . . . . . . . . . . . . . . . . . . . . . . . . . . . . 1-5
1.3.4 Deflections (Axial) . . . . . . . . . . . . . . . . . . . . . . . . . . . . . . . . . . . . . . . . . . . . . . . . . . . 1-5
1.3.5 Deflections (Bending) . . . . . . . . . . . . . . . . . . . . . . . . . . . . . . . . . . . . . . . . . . . . . . . . . 1-5
1.3.6 Deflections (Torsion) . . . . . . . . . . . . . . . . . . . . . . . . . . . . . . . . . . . . . . . . . . . . . . . . . 1-6
1.3.7 Biaxial Elastic Deformation . . . . . . . . . . . . . . . . . . . . . . . . . . . . . . . . . . . . . . . . . . . . 1-6
1.3.8 Basic Column Formula . . . . . . . . . . . . . . . . . . . . . . . . . . . . . . . . . . . . . . . . . . . . . . . . 1-6
1.3.9 Inelastic Stress-Strain Response . . . . . . . . . . . . . . . . . . . . . . . . . . . . . . . . . . . . . . . . . 1-7
1.4 Basic Principles . . . . . . . . . . . . . . . . . . . . . . . . . . . . . . . . . . . . . . . . . . . . . . . . . . . . . . . . . . . 1-9
1.4.1 General . . . . . . . . . . . . . . . . . . . . . . . . . . . . . . . . . . . . . . . . . . . . . . . . . . . . . . . . . . . . 1-9
1.4.2 Stress . . . . . . . . . . . . . . . . . . . . . . . . . . . . . . . . . . . . . . . . . . . . . . . . . . . . . . . . . . . . . . 1-10
1.4.3 Strain . . . . . . . . . . . . . . . . . . . . . . . . . . . . . . . . . . . . . . . . . . . . . . . . . . . . . . . . . . . . . . 1-10
1.4.4 Tensile Properties . . . . . . . . . . . . . . . . . . . . . . . . . . . . . . . . . . . . . . . . . . . . . . . . . . . . 1-10
1.4.5 Compressive Properties . . . . . . . . . . . . . . . . . . . . . . . . . . . . . . . . . . . . . . . . . . . . . . . . 1-13
1.4.6 Shear Properties . . . . . . . . . . . . . . . . . . . . . . . . . . . . . . . . . . . . . . . . . . . . . . . . . . . . . 1-13
1.4.7 Bearing Properties . . . . . . . . . . . . . . . . . . . . . . . . . . . . . . . . . . . . . . . . . . . . . . . . . . . . 1-14
1.4.8 Temperature Effects . . . . . . . . . . . . . . . . . . . . . . . . . . . . . . . . . . . . . . . . . . . . . . . . . . 1-15
1.4.9 Fatigue Properties . . . . . . . . . . . . . . . . . . . . . . . . . . . . . . . . . . . . . . . . . . . . . . . . . . . . 1-16
1.4.10 Metallurgical Instability . . . . . . . . . . . . . . . . . . . . . . . . . . . . . . . . . . . . . . . . . . . . . . . 1-19
1.4.11 Biaxial Properties . . . . . . . . . . . . . . . . . . . . . . . . . . . . . . . . . . . . . . . . . . . . . . . . . . . . 1-19
1.4.12 Fracture Toughness . . . . . . . . . . . . . . . . . . . . . . . . . . . . . . . . . . . . . . . . . . . . . . . . . . . 1-21
1.4.13 Fatigue Crack Growth . . . . . . . . . . . . . . . . . . . . . . . . . . . . . . . . . . . . . . . . . . . . . . . . 1-29
1.5 Types of Failures . . . . . . . . . . . . . . . . . . . . . . . . . . . . . . . . . . . . . . . . . . . . . . . . . . . . . . . . . . 1-33
1.5.1 General . . . . . . . . . . . . . . . . . . . . . . . . . . . . . . . . . . . . . . . . . . . . . . . . . . . . . . . . . . . . 1-33
1.5.2 Material Failures . . . . . . . . . . . . . . . . . . . . . . . . . . . . . . . . . . . . . . . . . . . . . . . . . . . . . 1-33
1.5.3 Instability Failures . . . . . . . . . . . . . . . . . . . . . . . . . . . . . . . . . . . . . . . . . . . . . . . . . . . . 1-34
1.6 Columns . . . . . . . . . . . . . . . . . . . . . . . . . . . . . . . . . . . . . . . . . . . . . . . . . . . . . . . . . . . . . . . . . 1-35
1.6.1 General . . . . . . . . . . . . . . . . . . . . . . . . . . . . . . . . . . . . . . . . . . . . . . . . . . . . . . . . . . . . 1-35
1.6.2 Primary Instability Failures . . . . . . . . . . . . . . . . . . . . . . . . . . . . . . . . . . . . . . . . . . . . . 1-35
1.6.3 Local Instability Failures . . . . . . . . . . . . . . . . . . . . . . . . . . . . . . . . . . . . . . . . . . . . . . 1-35
1.6.4 Correction of Column Test Results . . . . . . . . . . . . . . . . . . . . . . . . . . . . . . . . . . . . . . . 1-36
1.7 Thin-Walled and Stiffened Thin-Walled Sections . . . . . . . . . . . . . . . . . . . . . . . . . . . . . . . . . 1-43
1.8 Allowables-Based Flow Stress for Nonlinear Static Analysis . . . . . . . . . . . . . . . . . . . . . . . . 1-45
1.8.1 Introduction . . . . . . . . . . . . . . . . . . . . . . . . . . . . . . . . . . . . . . . . . . . . . . . . . . . . . . . . . 1-45
1.8.2 Procedure . . . . . . . . . . . . . . . . . . . . . . . . . . . . . . . . . . . . . . . . . . . . . . . . . . . . . . . . . . 1-45
1.8.3 Reporting Requirements . . . . . . . . . . . . . . . . . . . . . . . . . . . . . . . . . . . . . . . . . . . . . . . 1-47
References . . . . . . . . . . . . . . . . . . . . . . . . . . . . . . . . . . . . . . . . . . . . . . . . . . . . . . . . . . . . . . . . . . . 1-49

MMPDS-05
1 April 2010
VOLUME CONTENTS
Section Page
II
Appendices
A.0 Glossary . . . . . . . . . . . . . . . . . . . . . . . . . . . . . . . . . . . . . . . . . . . . . . . . . . . . . . . . . . . . . . . . . A-1
A.1 Abbreviations . . . . . . . . . . . . . . . . . . . . . . . . . . . . . . . . . . . . . . . . . . . . . . . . . . . . . . . A-1
A.2 Symbols . . . . . . . . . . . . . . . . . . . . . . . . . . . . . . . . . . . . . . . . . . . . . . . . . . . . . . . . . . . . A-5
A.3 Definitions . . . . . . . . . . . . . . . . . . . . . . . . . . . . . . . . . . . . . . . . . . . . . . . . . . . . . . . . . . A-6
A.4 Conversion of U.S. Units of Measure Used in MMPDS to SI Units . . . . . . . . . . . . . A-17
B.0 Alloy Index . . . . . . . . . . . . . . . . . . . . . . . . . . . . . . . . . . . . . . . . . . . . . . . . . . . . . . . . . . . . . . . B-1
C.0 Specification Index . . . . . . . . . . . . . . . . . . . . . . . . . . . . . . . . . . . . . . . . . . . . . . . . . . . . . . . . . C-1
D.0 Testing Standards . . . . . . . . . . . . . . . . . . . . . . . . . . . . . . . . . . . . . . . . . . . . . . . . . . . . . . . . . . D-1
E.0 Subject Index . . . . . . . . . . . . . . . . . . . . . . . . . . . . . . . . . . . . . . . . . . . . . . . . . . . . . . . . . . . . . E-1
MMPDS-05
1 April 2010
MMPDS-05 Handbook Breakout
I
CHAPTER 1 - INTRODUCTION1.1 Purpose and Use of Document
1.2 Nomenclature
1.3 Commonly Used Formulas
1.4 Basic Principles
1.5 Types of Failures
1.6 Columns
1.7 Thin-Walled and Stiffened Thin-Walled Sections
1.8 Allowables-Based Flow Stress for Nonlinear Static Analysis
CHAPTER 2 - STEEL2.1 General
2.2 Carbon Steels
2.3 Low-Alloy Steels (AISI Grades and Proprietary Grades)
2.4 Intermediate Alloy Steels
2.5 High-Alloy Steels
2.6 Precipitation- and Transformation-Hardening Steels (Stainless)
2.7 Austenitic Stainless Steels
2.8 Element Properties
CHAPTER 3 - ALUMINUM3.1 General
3.2 2000 Series Wrought Alloys
3.3 3000 Series Wrought Alloys
3.4 4000 Series Wrought Alloys
3.5 5000 Series Wrought Alloys
3.6 6000 Series Wrought Alloys
3.7 7000 Series Wrought Alloys
3.8 200.0 Series Cast Alloys
3.9 300.0 Series Cast Alloys
3.10 Element Properties
CHAPTER 4 - MAGNESIUM ALLOYS4.1 General
4.2 Magnesium-Wrought Alloys
4.3 Magnesium Cast Alloys
4.4 Element Properties
CHAPTER 5 - TITANIUM5.1 General
5.2 Unalloyed Titanium
5.3 Alpha and Near-Alpha Titanium Alloys
5.4 Alpha-Beta Titanium Alloys
5.5 Beta, Near-Beta, and Metastable-Beta Titanium Alloys
5.6 Element Properties

MMPDS-05
1 April 2010
MMPDS-05 Handbook Breakout
II
CHAPTER 6 - HEAT-RESISTANT ALLOYS6.1 General
6.2 Iron-Chromium-Nickel-Base Alloys
6.3 Nickel-Base Alloys
6.4 Cobalt-Base Alloys
CHAPTER 7 - MISCELLANEOUS ALLOYS AND HYBRID MATERIALS7.1 General
7.2 Beryllium
7.3 Copper and Copper Alloys
7.4 Multiphase Alloys
7.5 Aluminum Alloy Sheet Laminates
CHAPTER 8 - STRUCTURAL JOINTS8.1 Mechanically Fastened Joints
8.2 Metallurgical Joints
8.3 Bearings, Pulleys, and Wire Rope
CHAPTER 9 - GUIDELINES9.1 General
9.2 Material, Specification, Testing, and Data Requirements
9.3 Submission of Data
9.4 Substantiation of Properties
9.5 Analysis Procedures for Statistically Computed Minimum Static Properties
9.6 Analysis Procedures for Dynamic and Time Dependent Properties
9.7 Analysis Procedures for Structural Joint Properties
9.8 Examples of Data Analysis and Data Presentation for Static Properties
9.9 Examples of Data for Dynamic and Time Dependent Properties
9.10 Statistical Tables
APPENDICESA.0 Glossary
B.0 Alloy Index
C.0 Specification Index
D.0 Testing Standards
E.0 Subject Index

MMPDS-05
1 April 2010
1-1
CHAPTER 1
GENERAL
1.1 PURPOSE AND USE OF DOCUMENT
1.1.1 INTRODUCTION — Since many aerospace companies manufacture both commercial and
military products, the standardization of metallic materials design data which are acceptable to Government
procuring or certification agencies is very beneficial to those manufacturers as well as governmental agencies.
Although the design requirements for military and commercial products may differ greatly, the required design
values for the strength of materials and elements and other needed material characteristics are often identical.
Therefore, this publication provides standardized design values and related design information for metallic
materials and structural elements used in aerospace structures. The data contained herein, or from approved
items in the minutes of the Metallic Materials Properties Development and Standardization (MMPDS)
handbook coordination meetings, are acceptable to the Federal Aviation Administration (FAA), the
Department of Defense (DoD), and the National Aeronautics and Space Administration (NASA). Approval
by the procuring or certificating agency must be obtained for the use of design values for products not
contained herein.
MMPDS-05 was prepared by Battelle under contract with the FAA Willliam J. Hughes Technical
Center. It is covered under U.S. Copyright and is the only current form of the MMPDS Handbook. It renders
MMPDS-04, and prior published versions of MMPDS and MIL-HDBK-5 obsolete. If computerized third-party
MMPDS databases are used, caution should be exercised to ensure that the information in these databases is
identical to that contained in the Handbook.
Approved printed and electronic copies of MMPDS-05 are available for purchase through Battelle and
its approved licensees. Official copies of MMPDS-05 may also be obtained through participation in the
MMPDS Industrial Steering Group (ISG) or Government Steering Group (GSG), whichever is appropriate.
The ISG is open to membership by all commercial and education organizations, while the GSG is open to
membership by all U.S. and foreign government entities. See www.mmpds.org for further information.
1.1.2 SCOPE OF HANDBOOK — This Handbook is primarily intended to provide a source of design
mechanical and physical properties and joint allowables. Material property and joint data obtained from tests
by material and fastener producers, government agencies, and members of the airframe industry are submitted
to MMPDS for review and analysis. Results of these analyses are submitted to the membership during
semiannual coordination meetings for approval and, when approved, published in this Handbook.
This Handbook also contains some useful basic formulas for structural element analysis. These
formulas are provided in chapter 1 to illustrate how the material data contained in the Handbook may be used.
However, structural design and analysis are beyond the scope of this Handbook. While an attempt is made
to assure the accuracy of the formulas and analytical methods contained in chapter 1, there is no attempt in this
Handbook to provide currently accepted design or analytical methods.
References for data and various test methods are listed at the end of each chapter. The reference
number corresponds to the applicable paragraph of the chapter cited. Such references are intended to provide
sources of additional information, but should not necessarily be considered as containing data suitable for
design purposes.

MMPDS-05
1 April 2010
1-2
Applicable testing standards are identified by number only in the text. Full titles for these standards
are listed in Appendix D.
The content of this Handbook is arranged as follows:
Chapter(s) Subjects
1 Nomenclature, Systems of Units, Formulas, Material Property Definitions,
Failure Analysis, Column Analysis, Thin-Walled Sections
2-7 Material Properties
8 Joint Allowables
9 Data Requirements, Statistical Analysis Procedures

MMPDS-05
1 April 2010
1-3
1.2 NOMENCLATURE
1.2.1 SYMBOLS AND DEFINITIONS — The various symbols used throughout the Handbook to
describe properties of materials, grain directions, test conditions, dimensions, and statistical analysis
terminology are included in Appendix A.
1.2.2 INTERNATIONAL SYSTEM OF UNITS — Design properties and joint allowables contained
in this Handbook are given in customary units of U.S. measure to ensure compatibility with government and
industry material specifications and current aerospace design practice. Appendix A.4 may be used to assist
in the conversion of these units to Standard International (SI) units when desired.

MMPDS-05
1 April 2010
1-4
This page is intentionally blank.

MMPDS-05
1 April 2010
1-5
1.3 COMMONLY USED FORMULAS
1.3.1 GENERAL — Formulas provided in the following sections are listed for reference purposes.
Sign conventions generally accepted in their use are quantities associated with tension action (loads, stresses,
strains, etc.) are usually considered as positive, and quantities associated with compressive action are
considered as negative. When compressive action is of primary interest, it is sometimes convenient to identify
associated properties with a positive sign. Formulas for all statistical computations relating to allowables
development are presented in Chapter 9.
1.3.2 SIMPLE UNIT STRESSES —
ft = P / A (tension) [1.3.2(a)]
fc = P / A (compression) [1.3.2(b)]
fb = My / I = M / Z (bending) [1.3.2(c)]
fs = S / A (average direct shear stress) [1.3.2(d)]
fx = SQ / Ib (longitudinal or transverse shear stress) [1.3.2(e)]
fx = Ty / Ip (shear stress in round tubes due to torsion) [1.3.2(f)]
fs = (T/2At) (shear stress due to torsion in thin-walled structures of closed [1.3.2(g)]
section. Note that A is the area enclosed by the median line of the section.)
fA = BfH ; fT = BfL (axial and tangential stresses, where B = biaxial ratio) [1.3.2(h)]
1.3.3 COMBINED STRESSES (SEE SECTION 1.5.3.4) —
fA = fc + fb (compression and bending) [1.3.3(a)]
(compression, bending, and torsion) [1.3.3(b)]( )[ ]f f fs s nmax
/
/= +2 21 2
2
fn max = fn/2 + fs max [1.3.3(c)]
1.3.4 DEFLECTIONS (AXIAL) —
e = δ / L (unit deformation or strain) [1.3.4(a)]
E = f/e (This equation applied when E is obtained from the same tests in which [1.3.4(b)]
f and e are measured.)
δ = eL = (f / E)L [1.3.4(c)]
= PL / (AE) (This equation applies when the deflection is to be [1.3.4(d)]
calculated using a known value of E.)
1.3.5 DEFLECTIONS (BENDING) —
di/dx = M / (EI) (Change of slope per unit length of a beam; radians per unit length) [1.3.5(a)]
MMPDS-05
1 April 2010
1-6
— Slope at Point 2. (This integral denotes the area under the [1.3.5(b)][ ]i i M EI dx
x
x
2 1
1
2
= + ∫ /( )
curve of M/EI plotted against x, between the limits of x1 and x2.)
— Deflection at Point 2. [1.3.5(c)]( ) ( )( )y y i x x M EI x x dx
x
x
2 1 2 1 2
1
2
= + − + −∫ /
(This integral denotes the area under the curve having an ordinate equal to M/EI multiplied by the
corresponding distances to Point 2, plotted against x, between the limits of x1 and x2.)
— Deflection at Point 2. (This integral denotes the area under the [1.3.5(d)]y y idx
x
x
2 1
1
2
= + ∫
curve of x1(i) plotted against x, between the limits of x1 and x2.)
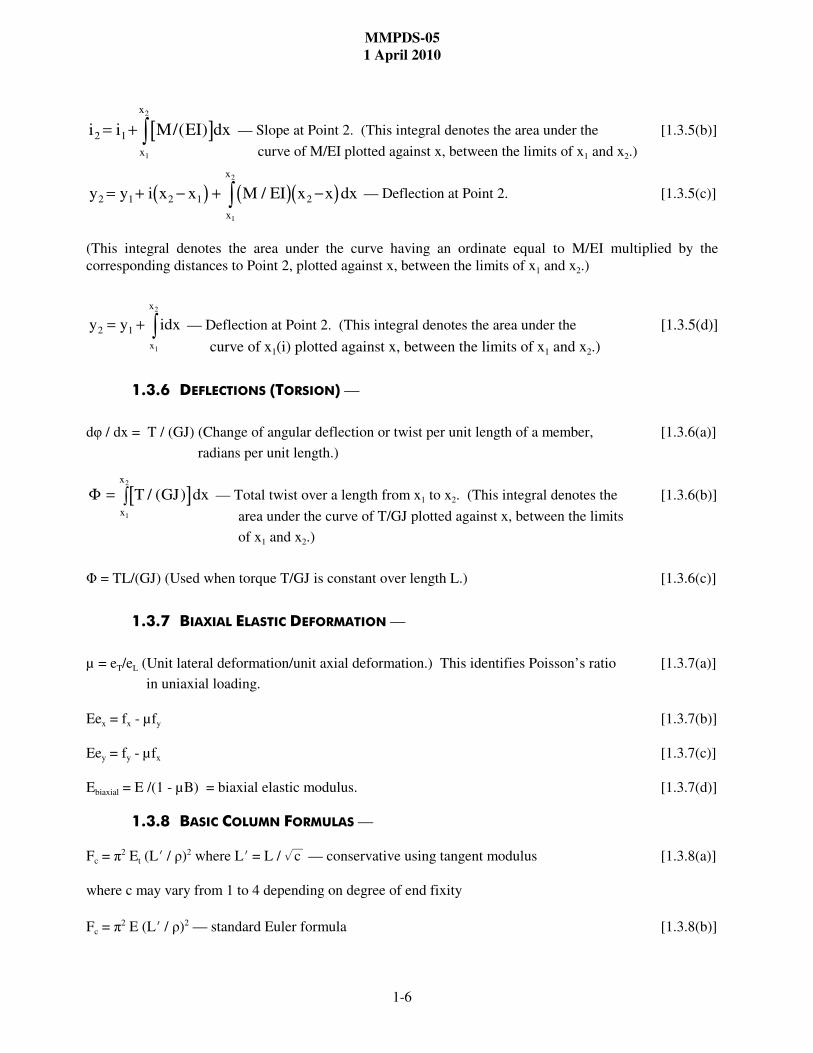
1.3.6 DEFLECTIONS (TORSION) —
dφ / dx = T / (GJ) (Change of angular deflection or twist per unit length of a member, [1.3.6(a)]
radians per unit length.)
— Total twist over a length from x1 to x2. (This integral denotes the [1.3.6(b)][ ]Φ = ∫ T GJ dxx
x
/ ( )
1
2
area under the curve of T/GJ plotted against x, between the limits
of x1 and x2.)
Φ = TL/(GJ) (Used when torque T/GJ is constant over length L.) [1.3.6(c)]
1.3.7 BIAXIAL ELASTIC DEFORMATION —
µ = eT/eL (Unit lateral deformation/unit axial deformation.) This identifies Poisson’s ratio [1.3.7(a)]
in uniaxial loading.
Eex = fx - µfy [1.3.7(b)]
Eey = fy - µfx [1.3.7(c)]
Ebiaxial = E /(1 - µB) = biaxial elastic modulus. [1.3.7(d)]
1.3.8 BASIC COLUMN FORMULAS —
Fc = π2 Et (LN / ρ)2 where LN = L / %&c — conservative using tangent modulus [1.3.8(a)]
where c may vary from 1 to 4 depending on degree of end fixity
Fc = π2 E (LN / ρ)2 — standard Euler formula [1.3.8(b)]

MMPDS-05
1 April 2010
1-7
1.3.9 INELASTIC STRESS-STRAIN RESPONSE —
etotal = f / E + ep (elastic strain response plus inelastic or plastic strain response) [1.3.9(a)]
where
ep = 0.002 * (f/f0.2ys)n, [1.3.9(b)]
f0.2ys = the 0.2 percent yield stress and
n = Ramberg-Osgood parameter
Equation [1.3.9(b)] implies a log-linear relationship between inelastic strain and stress, which is observed with
many metallic materials, at least for inelastic strains ranging from the material’s proportional limit to its yield
stress.

MMPDS-05
1 April 2010
1-8
This page is intentionally blank.

MMPDS-05
1 April 2010
1-9
1.4 BASIC PRINCIPLES
1.4.1 GENERAL — It is assumed that users of this Handbook are familiar with the principles of
strength of materials. A brief summary of that subject is presented in the following paragraphs to emphasize
principles of importance regarding the use of allowables for various metallic materials.
Requirements for adequate test data have been established to ensure a high degree of reliability for
allowables published in this Handbook. Statistical analysis methods, provided in Chapter 9, are standardized
and approved by all government regulatory agencies as well as MMPDS members from industry.
1.4.1.1 Basis — Primary static design properties are provided for the following conditions:
Tension . . . . . . . . . Ftu and Fty
Compression . . . . . Fcy
Shear . . . . . . . . . . . Fsu
Bearing . . . . . . . . . . Fbru and Fbry
These design properties are presented as A- and B- or S-Basis room temperature values for each alloy.
Design properties for other temperatures, when determined in accordance with Section 1.4.1.3, are regarded
as having the same basis as the corresponding room temperature values. Definitions of A-, B- and S-Basis are
found in Appendix A.3.
Elongation and reduction of area design properties listed in room temperature property tables represent
procurement specification minimum requirements and are designated as S-values. Elongation and reduction
of area at other temperatures, as well as moduli, physical properties, creep properties, fatigue properties, and
fracture toughness properties, are all typical values unless another basis is specifically indicated.
Use of B-Values — The use of B-Basis design properties is permitted in design by the Air Force, the
Army, the Navy, and the FAA, subject to certain limitations specified by each agency. Reference should be
made to specific requirements of the applicable agency before using B-values in design.
1.4.1.2 Statistically Calculated Values — Statistically calculated values are S (since 1975),
T99 and T90. S, the minimum properties guaranteed in the material specification, are calculated using the same
requirements and procedure as AMS and is explained in Chapter 9. T99 and T90 are the local tolerance bounds,
and are defined and may be computed using the data requirements and statistical procedures explained in
Chapter 9.
1.4.1.3 Ratioed Values — A ratioed design property is one that is determined through its
relationship with an established design value. This may be a tensile stress in a different grain direction from
the established design property grain direction or it may be another stress property, e.g., compression, shear
or bearing. It may also be the same stress property at a different temperature. Refer to Chapter 9 for specific
data requirements and data analysis procedures.
Derived properties are presented in two manners. Room temperature-derived properties are presented
in tabular form with their baseline design properties. Other than room temperature-derived properties are
presented in graphical form as percentages of the room temperature value. Percentage values apply to all forms
and thicknesses shown in the room temperature design property table for the heat treatment condition indicated
therein unless restrictions are otherwise indicated. Percentage curves usually represent short time exposures
to temperature (30 minutes) followed by testing at the same strain rate as used for the room temperature tests.
When data are adequate, percentage curves are shown for other exposure times and are appropriately labeled.

MMPDS-05
1 April 2010
1-10
1.4.2 STRESS — The term stress, as used in this Handbook, implies a force per unit area and is a
measure of the intensity of the force acting on a definite plane passing through a given point (see Equations
1.3.2(a) and 1.3.2(b)). The stress distribution may or may not be uniform, depending on the nature of the
loading condition. For example, tensile stresses identified by Equation 1.3.2(a) are considered to be uniform.
The bending stress determined from Equation 1.3.2(c) refers to the stress at a specified distance perpendicular
to the normal axis. The shear stress acting over the cross section of a member subjected to bending is not
uniform. (Equation 1.3.2(d) gives the average shear stress.)
1.4.3 STRAIN — Strain is the change in length per unit length in a member or portion of a member.
As in the case of stress, the strain distribution may or may not be uniform in a complex structural element,
depending on the nature of the loading condition. Strains are usually present in directions other than the
directions of applied loads.
1.4.3.1 Poisson’s Ratio Effect — A normal strain is that which is associated with a normal
stress; a normal strain occurs in the direction in which its associated normal stress acts. Normal strains that
result from an increase in length are designated as positive (+), and those that result in a decrease in length are
designated as negative (-).
Under the condition of uniaxial loading, strain varies directly with stress. The ratio of stress to strain
has a constant value (E) within the elastic range of the material, but decreases when the proportional limit is
exceeded (plastic range). Axial strain is always accompanied by lateral strains of opposite sign in the two
directions mutually perpendicular to the axial strain. Under these conditions, the absolute value of a ratio of
lateral strain to axial strain is defined as Poisson’s ratio. For stresses within the elastic range, this ratio is
approximately constant. For stresses exceeding the proportional limit, this ratio is a function of the axial strain
and is then referred to as the lateral contraction ratio. Information on the variation of Poisson’s ratio with
strain and with testing direction is available in Reference 1.4.3.1.
Under multiaxial loading conditions, strains resulting from the application of each directional load are
additive. Strains must be calculated for each of the principal directions taking into account each of the
principal stresses and Poisson’s ratio (see Equation 1.3.7 for biaxial loading).
1.4.3.2 Shear Strain — When an element of uniform thickness is subjected to pure shear, each
side of the element will be displaced in opposite directions. Shear strain is computed by dividing this total
displacement by the right angle distance separating the two sides.
1.4.3.3 Strain Rate — Strain rate is a function of loading rate. Test results are dependent upon
strain rate, and the American Society for Testing and Materials (ASTM) testing procedures specify appropriate
strain rates. Design properties in this Handbook were developed from test data obtained from coupons tested
at the stated strain rate or up to a value of 0.01 in./in./min, the standard maximum static rate for tensile testing
materials per specification ASTM E 8.
1.4.3.4 Elongation and Reduction of Area — Elongation and reduction of area aremeasured in accordance with specification ASTM E 8.
1.4.4 TENSILE PROPERTIES — When a metallic specimen is tested in tension using ASTM E 8
standard procedures, it is customary to plot results as a stress-strain diagram. Typical tensile stress-strain
diagrams are characterized in Figure 1.4.4. Such diagrams, drawn to scale, are provided in appropriate
chapters of this Handbook. The general format of such diagrams is to provide a strain scale nondimensionally
(in./in.) and a stress scale in 1000 lb/in. (ksi). Properties required for design and structural analysis are
discussed in Sections 1.4.4.1 to 1.4.4.6.

MMPDS-05
1 April 2010
1-11
Figure 1.4.4. Typical tensile stress-strain diagrams.
1.4.4.1 Modulus of Elasticity (E) — Referring to Figure 1.4.4, it is noted that the initial part
of stress-strain curves are straight lines. This indicates a constant ratio between stress and strain. Numerical
values of such ratios are defined as the modulus of elasticity, denoted by the letter E. This value applies up
to the proportional limit stress at which point the initial slope of the stress-strain curve then decreases.
Modulus of elasticity has the same units as stress. See Equation 1.3.4(b).

MMPDS-05
1 April 2010
1-12
Other moduli of design importance are tangent modulus, Et, and secant modulus, Es. Both of these
moduli are functions of strain. Tangent modulus is the instantaneous slope of the stress-strain curve at any
selected value of strain. Secant modulus is defined as the ratio of total stress to total strain at any selected
value of strain. Both of these moduli are used in structural element designs. Except for materials described
with discontinuous behaviors, such as the upper stress-strain curve in Figure 1.4.4, tangent modulus is the
lowest value of modulus at any state of strain beyond the proportional limit. Similarly, secant modulus is the
highest value of modulus beyond the proportional limit.
Clad aluminum alloys may have two separate modulus of elasticity values, as indicated in the typical
stress-strain curve shown in Figure 1.4.4. The initial slope or primary modulus denotes a response of both the
low-strength cladding and higher-strength core elastic behaviors. This value applies only up to the
proportional limit of the cladding. For example, the primary modulus of 2024-T3 clad sheet applies only up
to about 6 ksi. Similarly, the primary modulus of 7075-T6 clad sheet applies only up to approximately 12 ksi.
A typical use of primary moduli is for low-amplitude, high-frequency fatigue. Primary moduli are not
applicable at higher stress levels. Above the proportional limits of cladding materials, a short transition range
occurs while the cladding is developing plastic behavior. The material then exhibits a secondary elastic
modulus up to the proportional limit of the core material. This secondary modulus is the slope of the second
straight line portion of the stress-strain curve. In some cases, the cladding is so little different from the core
material that a single elastic modulus value is used.
1.4.4.2 Tensile Proportional Limit Stress (Ftp) — The tensile proportional limit is the
maximum stress for which strain remains proportional to stress. Since it is practically impossible to determine
precisely this point on a stress-strain curve, it is customary to assign a small value of plastic strain to identify
the corresponding stress as the proportional limit. In this Handbook, the tension and compression proportional
limit stress corresponds to a plastic strain of 0.0001 in./in.
1.4.4.3 Tensile Yield Stress (TYS or Fty) — Stress-strain diagrams for some ferrous alloys
exhibit a sharp break at a stress below the tensile ultimate strength. At this critical stress, the material
elongates considerably with no apparent change in stress. See the upper stress-strain curve in Figure 1.4.4.
The stress at which this occurs is referred to as the yield point. Most nonferrous metallic alloys and most high
strength steels do not exhibit this sharp break, but yield in a monotonic manner. This condition is also
illustrated in Figure 1.4.4. Permanent deformation may be detrimental, and the industry adopted 0.002 in./in.
plastic strain as an arbitrary limit that is considered acceptable by all regulatory agencies. For tension and
compression, the corresponding stress at this offset strain is defined as the yield stress (see Figure 1.4.4). This
value of plastic axial strain is 0.002 in./in. and the corresponding stress is defined as the yield stress. For
practical purposes, yield stress can be determined from a stress-strain diagram by extending a line parallel to
the elastic modulus line and offset from the origin by an amount of 0.002-in./in. strain. The yield stress is
determined as the intersection of the offset line with the stress-strain curve.
1.4.4.4 Tensile Ultimate Stress (TUS or Ftu) — Figure 1.4.4 shows how the tensile ultimate
stress is determined from a stress-strain diagram. It is simply the maximum stress attained. It should be noted
that all stresses are based on the original cross-sectional dimensions of a test specimen, without regard to the
lateral contraction due to Poisson’s ratio effects. That is, all strains used herein are termed engineering strains
as opposed to true strains, which take into account actual cross-sectional dimensions. Ultimate tensile stress
is commonly used as a criterion of the strength of the material for structural design, but it should be recognized
that other strength properties may often be more important.
1.4.4.5 Elongation (e) — An additional property that is determined from tensile tests is
elongation. This is a measure of ductility. Elongation, also stated as total elongation, is defined as the
permanent increase in gage length, measured after fracture of a tensile specimen. It is commonly expressed
as a percentage of the original gage length. Elongation is usually measured over a gage length of 2 inches for

MMPDS-05
1 April 2010
1-13
GE
=+2 1( )µ
rectangular tensile test specimens and in 4D (inches) for round test specimens. Welded test specimens are the
exception. Refer to the applicable material specification for appropriate specified gage lengths. Although
elongation is widely used as an indicator of ductility, this property can be significantly affected by testing
variables such as thickness, strain rate, and gage length of test specimens. See Section 1.4.1.1 for data basis.
1.4.4.6 Reduction of Area (RA) — Another property determined from tensile tests is reduction
of area, which is also a measure of ductility. Reduction of area is the difference, expressed as a percentage
of the original cross-sectional area, between the original cross section and the minimum cross-sectional area
adjacent to the fracture zone of a tested specimen. This property is less affected by testing variables than
elongation, but is more difficult to compute on thin section test specimens. See Section 1.4.1.1 for data basis.
1.4.5 COMPRESSIVE PROPERTIES — Results of compression tests completed in accordance with
ASTM E 9 are plotted as stress-strain curves similar to those shown for tension in Figure 1.4.4. Preceding
remarks concerning tensile properties of materials, except for ultimate stress and elongation, also apply to
compressive properties. Moduli are slightly greater in compression for most of the commonly used structural
metallic alloys. Special considerations concerning the ultimate compressive stress are described in the
following section. An evaluation of techniques for obtaining compressive strength properties of thin sheet
materials is outlined in Reference 1.4.5 and ASTM E 9.
1.4.5.1 Compressive Ultimate Stress (Fcu) — Since the actual failure mode for the highest
tension and compression stress is shear, the maximum compression stress is limited to Ftu. The driver for all
the analysis of all structure loaded in compression is the slope of the compression stress-strain curve, the
tangent modulus.
1.4.5.2 Compressive Yield Stress (CYS or Fcy) — Compressive yield stress is measured in a
manner identical to that done for tensile yield strength. It is defined as the stress corresponding to 0.002-in./in.
plastic strain.
1.4.6 SHEAR PROPERTIES — Results of torsion tests on round tubes or round solid sections are
plotted as torsion stress-strain diagrams. The shear modulus of elasticity is considered a basic shear property.
Other properties, such as the proportional limit stress and shear ultimate stress, cannot be treated as basic shear
properties because of form factor effects. The theoretical ratio between shear and tensile stress for
homogeneous, isotropic materials is 0.577. Reference 1.4.6 contains additional information on this subject.
1.4.6.1 Modulus of Rigidity (G) — This property is the initial slope of the shear stress-strain
curve. It is also referred to as the modulus of elasticity in shear. The relation between this property and the
modulus of elasticity in tension is expressed for homogeneous isotropic materials by the following equation:
[1.4.6.1]
1.4.6.2 Proportional Limit Stress in Shear (Fsp) — This property is of particular interest in
connection with formulas that are based on considerations of linear elasticity, as it represents the limiting value
of shear stress for which such formulas are applicable. This property cannot be determined directly from
torsion tests.

MMPDS-05
1 April 2010
1-14
1.4.6.3 Yield and Ultimate Stresses in Shear (SYS or Fsy) and (SUS or Fsu) — These
properties, usually obtained from ASTM test procedures tests, are not strictly basic properties, as they will
depend on the shape of the test specimen. In such cases, they should be treated as moduli and should not be
combined with the same properties obtained from other specimen configuration tests.
Design values reported for shear ultimate stress (Fsu) in room temperature property tables for aluminum
and magnesium thin sheet alloys are based on punch shear type tests except when noted. Heavy section test
data are based on pin tests. Thin aluminum products may be tested to ASTM B 831, which is a slotted shear
test. Thicker aluminums use ASTM B 769, otherwise known as the Amsler shear test. These two tests only
provide ultimate strength. Shear data for other alloys are obtained from pin tests, except where product
thicknesses are insufficient. These tests are used for other alloys; however, the standards do not specifically
cover materials other than aluminum.
1.4.7 BEARING PROPERTIES — Bearing stress limits are of value in the design of mechanically
fastened joints and lugs. Only yield and ultimate stresses are obtained from bearing tests. Bearing stress is
computed from test data by dividing the load applied to the pin, which bears against the edge of the hole by
the bearing area. Bearing area is the product of the pin diameter and the sheet or plate thickness.
A bearing test requires the use of special cleaning procedures as specified in ASTM E 238. Results
are identified as dry-pin values. The same tests performed without these cleaning procedures do not meet
ASTM E 238 requirements. These can be referred to as "wet pin". Results from wet-pin tests can produce
bearing stresses which may be 10-20% lower than those obtained from dry-pin tests depending on material
type. See Reference 1.4.7a.. Bearing Tests in various materials using MS20470D8-6, MS20470B8-6 and
NAS1198-8-6 rivets are discussed in Reference 1.4.7b. Two additional reports discussing bearing tests using
steel pins are 1.4.7c for aluminum and 1.4.7d covering various materials. Both of these reports are subject to
export control requiring prior approval of the Commander, NADC or Commander, NASC for each transmittal
of the document outside of the U.S. Department of Defense. Another report, Reference 1.4.7e, using
NAS1103, EWSB26 and EWSB30 bolts also has limited distribution to U.S. Government Agencies only and
other copies must be obtained from COMNAVAIRDEVCEN. Additionally, ASTM E 238 requires the use
of hardened pins that have diameters within 0.001 of the hole diameter. As the clearance increases to 0.001
and greater, the bearing yield and failure stress tends to decrease.
In the definition of bearing values, t is sheet or plate thickness, D is the pin diameter, and e is the edge
distance measured from the center of the hole to the adjacent edge of the material being tested in the direction
of applied load.
1.4.7.1 Bearing Yield and Ultimate Stresses (BYS or Fbry) and (BUS or Fbru) — BUS
is the maximum stress withstood by a bearing specimen. BYS is computed from a bearing stress-deformation
curve by drawing a line parallel to the initial slope at an offset of 0.02 times the pin diameter.
Tabulated design properties for bearing yield stress (Fbry) and bearing ultimate stress (Fbru) are provided
throughout the Handbook for edge margins of e/D = 1.5 and 2.0. Bearing values for e/D of 1.5 are not intended
for designs of e/D < 1.5. Bearing values for e/D < 1.5 must be substantiated by adequate tests, subject to the
approval of the procuring or certificating regulatory agency. For edge margins between 1.5 and 2.0, linear
interpolation of properties may be used.
Bearing design properties are applicable to t/D ratios from 0.25 to 0.50. Bearing design values for
conditions of t/D < 0.25 or t/D > 0.50 must be substantiated by tests. The percentage curves showing
temperature effects on bearing stress may be used with both e/D properties of 1.5 and 2.0.

MMPDS-05
1 April 2010
1-15
1.4.8 TEMPERATURE EFFECTS — Temperature effects require additional considerations for static,
fatigue, and fracture toughness properties. In addition, this subject introduces concerns for time-dependent
creep properties.
1.4.8.1 Low Temperature — Temperatures below room temperature generally cause an increase
in strength properties of metallic alloys. Ductility, fracture toughness, and elongation usually decrease. For
specific information, see the applicable chapter and references noted therein.
1.4.8.2 Elevated Temperature — Temperatures above room temperature usually cause a
decrease in the strength properties of metallic alloys. This decrease is dependent on many factors, such as
temperature and the time of exposure which may degrade the heat treatment condition, or cause a metallurgical
change. Ductility may increase or decrease with increasing temperature depending on the same variables.
Because of this dependence of strength and ductility at elevated temperatures on many variables, it is
emphasized that the elevated temperature properties obtained from this Handbook be applied for only those
conditions of exposure stated herein.
The effect of temperature on static mechanical properties is shown by a series of graphs of property
(as percentages of the room temperature allowable property) versus temperature. Data used to construct these
graphs were obtained from tests conducted over a limited range of strain rates. Caution should be exercised
in using these static property curves at very high temperatures, particularly if the strain rate intended in design
is much less than that stated with the graphs. The reason for this concern is that at very low strain rates or
under sustained loads, plastic deformation or creep deformation may occur to the detriment of the intended
structural use.
1.4.8.2.1 Creep and Stress-Rupture Properties — Creep is defined as a time-dependent
deformation of a material while under an applied load. It is usually regarded as an elevated temperature
phenomenon, although some materials creep at room temperature. If permitted to continue indefinitely, creep
terminates in rupture. Since creep in service is usually typified by complex conditions of loading and
temperature, the number of possible stress-temperature-time profiles is infinite. For economic reasons, creep
data for general design use are usually obtained under conditions of constant uniaxial loading and constant
temperature in accordance with ASTM E 139. Creep data are sometimes obtained under conditions of cyclic
uniaxial loading and constant temperature or constant uniaxial loading and variable temperatures. Section 9.4
provides a limited amount of creep data analysis procedures. It is recognized that, when significant creep
appears likely to occur, it may be necessary to test under simulated service conditions because of difficulties
posed in attempting to extrapolate from simple to complex stress-temperature-time conditions.
Creep damage is cumulative similar to plastic strain resulting from multiple static loadings. This
damage may involve significant effects on the temper of heat-treated materials, including annealing, and the
initiation and growth of cracks or subsurface voids within a material. Such effects are often recognized as
reductions in short-time strength properties or ductility, or both.
1.4.8.2.2 Creep-Rupture Curve — Results of tests conducted under constant loading and constant
temperature are usually plotted as strain versus time up to rupture. A typical plot of this nature is shown in
Figure 1.4.8.2.2. Strain includes both the instantaneous deformation due to load application and the plastic
strain due to creep. Other definitions and terminology are provided in Appendix A.3.
Designers and analysts are encouraged to use a reduction factor applied to published bearing
strength allowables based on dry-pin data to better approximate actual in-service
environments.

MMPDS-05
1 April 2010
1-16
Figure 1.4.8.2.2. Typical creep-rupture curve.
1.4.8.2.3 Creep or Stress-Rupture Presentations — Results of creep or stress-rupture tests
conducted over a range of stresses and temperatures are presented as curves of stress versus the logarithm of
time to rupture. Each curve represents an average, best-fit description of measured behavior. Modification
of such curves into design use are the responsibility of the design community since material applications and
regulatory requirements may differ. Refer to Section 9.9.4 for data reduction and presentation methods and
References 1.4.8.2.1(a) and 1.4.8.2.1(b).
1.4.9 FATIGUE PROPERTIES — Repeated loads are one of the major considerations for design of both
commercial and military aircraft structures. Static loading, preceded by cyclic loads of lesser magnitudes, may
result in mechanical behaviors (Ftu , Fty , etc.) lower than those published in room temperature allowables
tables. Such reductions are functions of the material and cyclic loading conditions. A fatigue allowables
development philosophy is not presented in this Handbook. However, basic laboratory test data are useful for
materials selection. Such data are, therefore, provided in the appropriate materials sections.
In the past, common methods of obtaining and reporting fatigue data included results obtained from
axial loading tests, plate bending tests, rotating bending tests, and torsion tests. Rotating bending tests apply
completely reversed (tension-compression) stresses to round cross section specimens. Tests of this type are
now seldom conducted for aerospace use and have, therefore, been dropped from importance in this Handbook.
For similar reasons, flexural fatigue data have also been dropped. No significant amount of torsional fatigue
data have ever been made available. Axial loading tests, the only type retained in this Handbook, consist of
completely reversed loading conditions (mean stress equals zero) and those in which the mean stress was
varied to create different stress (or strain) ratios (R = minimum stress or strain divided by maximum stress or
strain). Refer to Reference 1.4.9(a) for load control fatigue testing guidelines and Reference 1.4.9(b) for strain
control fatigue testing guidelines.

MMPDS-05
1 April 2010
1-17
1.4.9.1 Terminology — A number of symbols and definitions are commonly used to describe
fatigue test conditions, test results, and data analysis techniques. The most important of these are described
in Appendix A.
1.4.9.2 Graphical Display of Fatigue Data — Results of axial fatigue tests are reported on
S-N and ε - N diagrams. Figure 1.4.9.2(a) shows a family of axial load S-N curves. Fatigue data for each S-N
curve represent constant values of either R-ratio or mean stress, as shown in Figure 1.4.9.2(a).
S-N and ε - N diagrams are shown in this Handbook with the raw test data plotted for each stress or
strain ratio or, in some cases, for a single value of mean stress. A best-fit curve is drawn through the data at
each condition. Rationale used to develop best-fit curves and the characterization of all such curves in a single
diagram is explained in Section 9.6.1. For load control test data, individual curves are usually based on an
equivalent stress that consolidates data for all stress ratios into a single curve. Refer to Figure 1.4.9.2(b). For
strain control test data, an equivalent strain consolidation method is used. Section 9.6.1.4 includes a detailed
discussion of several commonly used equivalent stress modeling procedures..
Elevated temperature fatigue test data are treated in the same manner as room temperature data, as long
as creep is not a significant factor and room temperature analysis methods can be applied. In the limited
number of cases where creep strain data have been recorded as a part of an elevated temperature fatigue test
series, S-N (or ε - N) plots are constructed for specific creep strain levels. This is provided in addition to the
customary plot of maximum stress (or strain) versus cycles to failure.
The above information may not apply directly to the design of structures for several reasons. First,
the Handbook information may not take into account specific stress concentrations unique to any given
structural design. Design considerations usually include stress concentrations caused by re-entrant corners,
notches, holes, joints, rough surfaces, structural damage, and other conditions. Localized high stresses induced
during the fabrication of some parts have a much greater influence on fatigue properties than on static
properties. These factors significantly reduce fatigue life below that which is predictable by estimating smooth
specimen fatigue performance with estimated stresses due to fabrication. Fabricated parts have been found
to fail at less than 50,000 cycles of loading when the nominal stress was far below that which could be
repeated many millions of times using a smooth-machined test specimen.
Notched fatigue specimen test data are shown in various Handbook figures to provide an
understanding of deleterious effects relative to results for smooth specimens. All of the mean fatigue curves
published in this Handbook, including both the notched fatigue and smooth specimen fatigue curves, require
modification into allowables for design use. Such factors may impose a penalty on cyclic life or upon stress.
This is a responsibility for the design community. Specific reductions vary between users of such information
and depending on the criticality of application, sources of uncertainty in the analysis and requirements of the
certificating activity. ASTM E 466 and ASTM E 606 contain more specific information on fatigue testing in
load and strain control, procedures, organization of test results, influences of various factors, and design
considerations.

MMPDS-05
1 April 2010
1-18
Fatigue L ife, Cycles
103 104 105 106 107 108
Maxim
um
Str
ess, ksi
0
10
20
30
40
50
60
70
80
+ ++ + + ++
+ ++ + + +
+ +
++ + +++ +
++++ +
++
++++
x
x
x
x
xx
x
x
xx
xx
x xx
→
→
→→→
→→
→→
→→→→
→→
.
.
on net section.N ote: Stresses are based
Mean S tress or S tress Ratio =
Level 2 Level 1
Level 4x
Level 3+
Materia l=A , K t=B, N otch Type=C,
Runout→
Figure 1.4.9.2(a). Best fit S/N curve diagram for a material at various stress ratios.
Fatigue Life, Cycles
103 104 105 106 107 108
Eq
uiv
ale
nt
Str
ess,
Se
q
0
10
20
30
40
50
60
70
80
90
100
+ ++ ++ +
+
+ ++ + ++
+ +
++ + ++
+ +
++++
+
x
x
x
x
x
x
x
x
x
x
x
x
x
.
.
on net section.Note: Stresses are based
Mean Stress or Stress Ratio =
Level 2 Level 1
Level 4x Level 3+
Material=A, Kt=B, Notch Type=C,
Figure 1.4.9.2(b). Consolidated fatigue data for a material using the equivalent stressparameter.

MMPDS-05
1 April 2010
1-19
1.4.10 METALLURGICAL INSTABILITY — In addition to the retention of strength and ductility, a
structural material must also retain surface and internal stability. Surface stability refers to the resistance of
the material to oxidizing or corrosive environments. Lack of internal stability is generally manifested (in some
ferrous and several other alloys) by carbide precipitation, spheroidization, sigma-phase formation, temper
embrittlement, and internal or structural transformation, depending upon the specific conditions of exposure.
Environmental conditions that influence metallurgical stability include heat, level of stress, oxidizing
or corrosive media, and nuclear radiation. The effect of environment on the material can be observed as either
improvement or deterioration of properties, depending upon the specific-imposed conditions. For example,
prolonged heating may progressively raise the strength of a metallic alloy as measured on smooth tensile or
fatigue specimens. However, at the same time, ductility may be reduced to such an extent that notched tensile
or fatigue behavior becomes erratic or unpredictable. The metallurgy of each alloy should be considered in
making material selections.
Under normal temperatures, i.e., between -65E and 160EF, the stability of most structural metallic
alloys is relatively independent of exposure time. However, as temperature is increased, the metallurgical
instability becomes increasingly time-dependent. The factor of exposure time should be considered in design
when applicable.
1.4.11 BIAXIAL PROPERTIES — Discussions up to this point pertained to uniaxial conditions of
static, fatigue, and creep loading. Many structural applications involve both biaxial and triaxial loadings.
Because of the difficulties of testing under triaxial loading conditions, few data exist. However, considerable
biaxial testing has been conducted and the following paragraphs describe how these results are presented in
this Handbook. This does not conflict with data analysis methods presented in Chapter 9. Therein, statistical
analysis methodology is presented solely for use in analyzing test data to establish allowables.
If stress axes are defined as being mutually perpendicular along x-, y-, and z-directions in a rectangular
coordinate system, a biaxial stress is then defined as a condition in which loads are applied in both the x- and
y-directions. In some special cases, loading may be applied in the z-direction instead of the y-direction. Most
of the following discussion will be limited to tensile loadings in the x- and y-directions. Stresses and strains
in these directions are referred to as principal stresses and principal strains. See Reference 1.4.11.
When a specimen is tested under biaxial loading conditions, it is customary to plot the results as a
biaxial stress-strain diagram. These diagrams are similar to uniaxial stress-strain diagrams shown in Figure
1.4.4. Usually, only the maximum (algebraically larger) principal stress and strain are shown for each test
result. When tests of the same material are conducted at different biaxial stress ratios, the resulting curves may
be plotted simultaneously, producing a family of biaxial stress-strain curves as shown in Figure 1.4.11 for an
isotropic material. For anisotropic materials, biaxial stress-strain curves also require distinction by grain
direction.
The reference direction for a biaxial stress ratio, i.e., the direction corresponding to B=0, should be
clearly indicated with each result. The reference direction is always considered as the longitudinal (rolling)
direction for flat products and the hoop (circumferential) direction for shells of revolution, e.g., tubes, cones,
etc. The letter B denotes the ratio of applied stresses in the two loading directions. For example, biaxiality
ratios of 2 and 0.5 shown in Figure 1.4.11 indicate results representing both biaxial stress ratios of 2 or 0.5,
since this is a hypothetical example for an isotropic material, e.g., cross-rolled sheet. In a similar manner, the
curve labeled B=1 indicates a biaxial stress-strain result for equally applied stresses in both directions. The
curve labeled B = 4, 0 indicates the biaxial stress-strain behavior when loading is applied in only one direction,
e.g., uniaxial behavior. Biaxial property data presented in the Handbook are to be considered as basic material
properties obtained from carefully prepared specimens.

MMPDS-05
1 April 2010
1-20
Figure 1.4.11. Typical biaxial stress-strain diagrams forisotropic materials.
Figure 1.4.11.2. Typical biaxial yield stressenvelope.
1.4.11.1 Biaxial Modulus of Elasticity — Referring to Figure 1.4.11, it is noted that the
original portion of each stress-strain curve is essentially a straight line. In uniaxial tension or compression,
the slope of this line is defined as the modulus of elasticity. Under biaxial loading conditions, the initial slope
of such curves is defined as the biaxial modulus. It is a function of biaxial stress ratio and Poisson’s ratio.
See Equation 1.3.7.(d).
1.4.11.2 Biaxial Yield Stress — Biaxial yield stress is defined as the maximum principal stress
corresponding to 0.002 in./in. plastic strain in the same direction, as determined from a test curve.
In the design of aerospace structures, biaxial stress ratios other than those normally used in biaxial
testing are frequently encountered. Information can be combined into a single diagram to enable interpolations
at intermediate biaxial stress ratios, as shown in Figure 1.4.11.2. An envelope is constructed through test
results for each tested condition of biaxial stress ratios. In this case, a typical biaxial yield stress envelope is

MMPDS-05
1 April 2010
1-21
identified. In the preparation of such envelopes, data are first reduced to nondimensional form (percent of
uniaxial tensile yield stress in the specified reference direction), then a best-fit curve is fitted through the
nondimensionalized data. Biaxial yield strength allowables are then obtained by multiplying the uniaxial Fty
(or Fcy) allowable by the applicable coordinate of the biaxial stress ratio curve. To avoid possible confusion,
the reference direction used for the uniaxial yield strength is indicated on each figure.
1.4.11.3 Biaxial Ultimate Stress — Biaxial ultimate stress is defined as the highest nominal
principal stress attained in specimens of a given configuration, tested at a given biaxial stress ratio. This
property is highly dependent upon geometric configuration of the test parts. Therefore, such data should be
limited in use to the same design configurations.
The method of presenting biaxial ultimate strength data is similar to that described in the preceding
section for biaxial yield strength. Both biaxial ultimate strength and corresponding uniform elongation data
are reported, when available, as a function of biaxial stress ratio test conditions.
1.4.12 FRACTURE TOUGHNESS — The occurrence of flaws in a structural component is an
unavoidable circumstance of material processing, fabrication, or service. Flaws may appear as cracks, voids,
metallurgical inclusions, weld defects, design discontinuities, or some combination thereof. The fracture
toughness of a part containing a flaw is dependent upon flaw size, component geometry, and a material
property defined as fracture toughness. The fracture toughness of a material is literally a measure of its
resistance to fracture. As with other mechanical properties, fracture toughness is dependent upon alloy type,
processing variables, product form, geometry, temperature, loading rate, and other environmental factors.
This discussion is limited to brittle fracture, which is characteristic of high-strength materials under
conditions of loading resulting in plane-strain through the cross section. Very thin materials are described as
being under the condition of plane-stress. The following descriptions of fracture toughness properties applies
to the currently recognized practice of testing specimens under slowly increasing loads. Attendant and
interacting conditions of cyclic loading, prolonged static loadings, environmental influences other than
temperature, and high strain rate loading are not considered.
1.4.12.1 Brittle Fracture — For materials that have little capacity for plastic flow, or for flaw
and structural configurations, which induce triaxial tension stress states adjacent to the flaw, component
behavior is essentially elastic until the fracture stress is reached. Then, a crack propagates from the flaw
suddenly and completely through the component. A convenient illustration of brittle fracture is a typical load-
compliance record of a brittle structural component containing a flaw, as illustrated in Figure 1.4.12.1. Since
little or no plastic effects are noted, this mode is termed brittle fracture.
This mode of fracture is characteristic of the very high-strength metallic materials under plane-strain
conditions.

MMPDS-05
1 April 2010
1-22
Figure 1.4.12.1. Typical load deformation recordof a structural component containing a flawsubject to brittle fracture.
1.4.12.2 Brittle Fracture Analysis — The application of linear elastic fracture mechanics has
led to the stress intensity concept to relate flaw size, component geometry, and fracture toughness. In its very
general form, the stress-intensity factor, K, can be expressed as
[1.4.12.2]K f aY ksi in= ⋅, . /1 2
where
f = stress applied to the gross section, ksi
a = measure of flaw size, inches
Y = factor-relating component geometry and flaw size, nondimensional. See
ASTM E 399 for values.
For every structural material that exhibits brittle fracture (by nature of low ductility or plane-strain
stress conditions), there is a lower-limiting value of K termed the plane-strain fracture toughness, KIc.
The specific application of this relationship is dependent on flaw type, structural configuration, and
type of loading, and a variety of these parameters can interact in a real structure. Flaws may occur through
the thickness, may be imbedded as voids or metallurgical inclusions, or may be partial-through (surface)
cracks. Loadings of concern may be tension and/or flexure. Structural components may vary in section size
and may be reinforced in some manner. The ASTM Committee E 8 on Fatigue and Fracture has developed
testing and analytical techniques for many practical situations of flaw occurrence subject to brittle fracture.
They are summarized in ASTM E 399.
1.4.12.3 Critical Plane-Strain Fracture Toughness — A tabulation of fracture toughness
data is printed in the general discussion prefacing most alloy chapters in this Handbook. These critical plane-
strain fracture toughness values have been determined in accordance with recommended ASTM testing
practices. This information is provided for information purposes only due to limitations in available data
quantities and product form coverages. The statistical reliability of these properties is not known. Listed
properties generally represent the average value of a series of test results.
MMPDS-05
1 April 2010
1-23
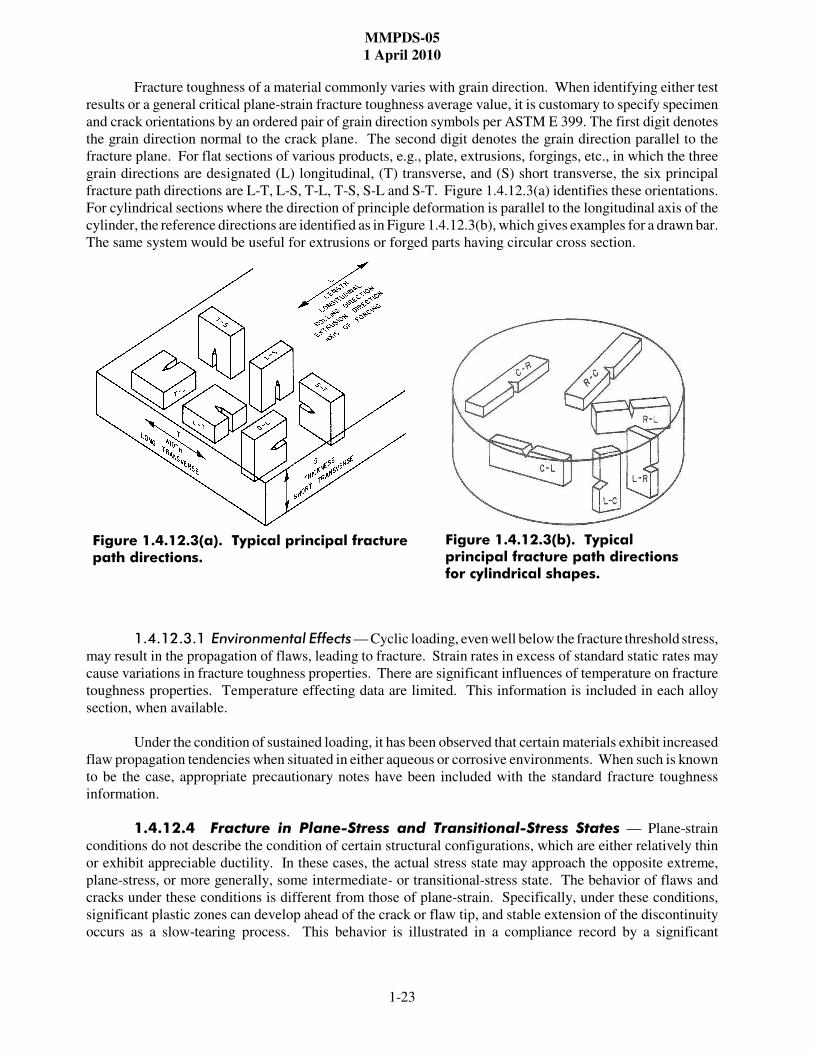
Figure 1.4.12.3(a). Typical principal fracturepath directions.
Figure 1.4.12.3(b). Typicalprincipal fracture path directionsfor cylindrical shapes.
Fracture toughness of a material commonly varies with grain direction. When identifying either test
results or a general critical plane-strain fracture toughness average value, it is customary to specify specimen
and crack orientations by an ordered pair of grain direction symbols per ASTM E 399. The first digit denotes
the grain direction normal to the crack plane. The second digit denotes the grain direction parallel to the
fracture plane. For flat sections of various products, e.g., plate, extrusions, forgings, etc., in which the three
grain directions are designated (L) longitudinal, (T) transverse, and (S) short transverse, the six principal
fracture path directions are L-T, L-S, T-L, T-S, S-L and S-T. Figure 1.4.12.3(a) identifies these orientations.
For cylindrical sections where the direction of principle deformation is parallel to the longitudinal axis of the
cylinder, the reference directions are identified as in Figure 1.4.12.3(b), which gives examples for a drawn bar.
The same system would be useful for extrusions or forged parts having circular cross section.
1.4.12.3.1 Environmental Effects — Cyclic loading, even well below the fracture threshold stress,
may result in the propagation of flaws, leading to fracture. Strain rates in excess of standard static rates may
cause variations in fracture toughness properties. There are significant influences of temperature on fracture
toughness properties. Temperature effecting data are limited. This information is included in each alloy
section, when available.
Under the condition of sustained loading, it has been observed that certain materials exhibit increased
flaw propagation tendencies when situated in either aqueous or corrosive environments. When such is known
to be the case, appropriate precautionary notes have been included with the standard fracture toughness
information.
1.4.12.4 Fracture in Plane-Stress and Transitional-Stress States — Plane-strain
conditions do not describe the condition of certain structural configurations, which are either relatively thin
or exhibit appreciable ductility. In these cases, the actual stress state may approach the opposite extreme,
plane-stress, or more generally, some intermediate- or transitional-stress state. The behavior of flaws and
cracks under these conditions is different from those of plane-strain. Specifically, under these conditions,
significant plastic zones can develop ahead of the crack or flaw tip, and stable extension of the discontinuity
occurs as a slow-tearing process. This behavior is illustrated in a compliance record by a significant

MMPDS-05
1 April 2010
1-24
Figure 1.4.12.4. Typical load deformationrecord for non-plane strain fracture.
Figure 1.4.12.4.1. Crack growth curve.
nonlinearity prior to fracture, as shown in Figure 1.4.12.4. This nonlinearity results from the alleviation of
stress at the crack tip by causing plastic deformation.
1.4.12.4.1 Analysis of Plane-Stress and Transitional-Stress State Fracture — The basic
concepts of linear elastic fracture mechanics as used in plane-strain fracture analysis also applies to these
conditions. The stress-intensity factor concept, as expressed in general form by Equation 1.4.12.2, is used to
relate load or stress, flaw size, component geometry, and fracture toughness.
However, interpretation of the critical flaw dimension and corresponding stress has two possibilities.
This is illustrated in Figure 1.4.12.4.1. One possibility is the onset of nonlinear displacement with increasing
load. The other possibility identifies the fracture condition, usually very close to the maximum load.

MMPDS-05
1 April 2010
1-25
Generally, these two conditions are separated in applied stress and exhibit large differences in flaw dimensions
due to stable tearing.
When a compliance record is transformed into a crack growth curve, the difference between the two
possible K-factor designations becomes more apparent. In most practical cases, the definition of nonlinear
crack length with increasing load is difficult to assess. As a result, an alternate characterization of this
behavior is provided by defining an artificial or apparent stress-intensity factor.
[1.4.12.4.1]K f a Yapp o=
The apparent fracture toughness is computed as a function of the maximum stress and initial flaw size.
This datum coordinate corresponds to point A in Figure 1.4.12.4.1. This conservative stress-intensity factor
is a first approximation to the actual property associated with the point of fracture.
1.4.12.5 Apparent Fracture Toughness Values for Plane-Stress and Transitional-Stress States — When available, each alloy chapter contains graphical formats of stress versus flaw size.
This is provided for each temper, product form, grain direction, thickness, and specimen configuration. Data
points shown in these graphs represent the initial flaw size and maximum stress achieved. These data have
been screened to ensure that an elastic instability existed at fracture, consistent with specimen type. The
average Kapp curve, as defined in the following subsections, is shown for each set of data.
1.4.12.5.1 Middle-Tension Panels — The calculation of apparent fracture toughness for middle-
tension panels is given by the following equation.
[1.4.12.5.1(a)]( )K f a a Wapp c o o= ⋅π πsec //1 2
Data used to compute Kapp values have been screened to ensure that the net section stress at failure did not
exceed 80 percent of the tensile yield strength; that is, they satisfied the criterion:
[1.4.12.5.1(b)]f TYS a Wc ≤ −08 1 2. ( ) / ( / )
This criterion ensures that the fracture was an elastic instability and that plastic effects are negligible.
The average Kapp parametric curve is presented on each figure as a solid line with multiple extensions
where width effects are displayed in the data. As added information, where data are available, the propensity
for slow stable tearing prior to fracture is indicated by a crack extension ratio, ∆2a/2ao. The coefficient (2)
indicates the total crack length; the half-crack length is designated by the letter “a.” In some cases, where data
exist covering a wide range of thicknesses, graphs of Kapp versus thickness are presented.
1.4.12.6 Crack Resistance (R-Curve)— The test method adopted within the MMPDS Handbook
for characterizing the resistance to fracture of metallic materials under plane stress (Mode I) loading at static
rates is the KR curve. A KR curve provides a record of toughness development (resistance to crack extension)
as a function of effective crack extension. These curves have a number of uses to evaluate crack growth under
plane stress; however, it is important to consider the specimen geometry, thickness, initial flaw size, and
material (yield strength).
R-curves are used for several specialized fracture assessments. Skin crack propagation is an obvious
assessment. Residual strength calculation of stiffened panels is directly applicable. A plastic zone estimate
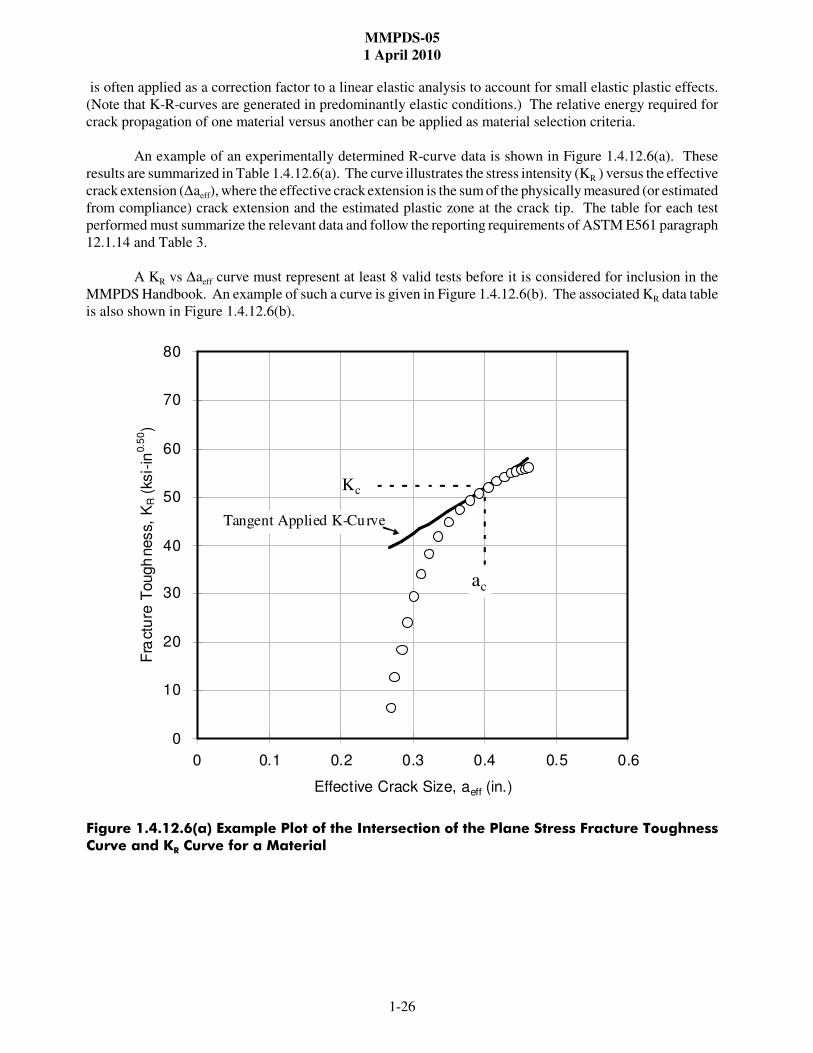
MMPDS-05
1 April 2010
1-26
is often applied as a correction factor to a linear elastic analysis to account for small elastic plastic effects.
(Note that K-R-curves are generated in predominantly elastic conditions.) The relative energy required for
crack propagation of one material versus another can be applied as material selection criteria.
An example of an experimentally determined R-curve data is shown in Figure 1.4.12.6(a). These
results are summarized in Table 1.4.12.6(a). The curve illustrates the stress intensity (KR ) versus the effective
crack extension (∆aeff), where the effective crack extension is the sum of the physically measured (or estimated
from compliance) crack extension and the estimated plastic zone at the crack tip. The table for each test
performed must summarize the relevant data and follow the reporting requirements of ASTM E561 paragraph
12.1.14 and Table 3.
A KR vs ∆aeff curve must represent at least 8 valid tests before it is considered for inclusion in the
MMPDS Handbook. An example of such a curve is given in Figure 1.4.12.6(b). The associated KR data table
is also shown in Figure 1.4.12.6(b).
Figure 1.4.12.6(a) Example Plot of the Intersection of the Plane Stress Fracture ToughnessCurve and KR Curve for a Material
0
10
20
30
40
50
60
70
80
0 0.1 0.2 0.3 0.4 0.5 0.6
Effective Crack Size, aeff (in.)
Fra
ctu
re T
ough
ness,
KR (
ksi-
in0.5
0)
Kc
ac
Tangent Applied K-Curve

MMPDS-05
1 April 2010
1-27
Table 1.4.12.6(a). Example Tabulation of Data Used to Construct KR Curves Shown in Figures1.4.12.6(a) and (b)
Input Data B=0.157 E=10005 ksi 2a0=0.511 in a0=0.256 in
Y=0.063 in W=1.968 in v=0.33 2an=0.393 in af=0.059 in
Load (kips) Displace-
ment (in)
V/P EBv/P aeff (in) KR ∆ (in)
2.08 0.00079 3.794E-04 0.595 0.268 6.46 0.013
4.06 0.00158 3.901E-04 0.612 0.274 12.78 0.018
5.76 0.00236 4.100E-04 0.643 0.283 18.5 0.027
7.37 0.00315 4.271E-04 0.670 0.291 24.13 0.035
8.85 0.00396 4.480E-04 0.702 0.300 29.53 0.044
10.00 0.00472 1.723E-04 0.740 0.310 34.11 0.054
10.99 0.00551 5.015E-04 0.786 0.321 38.37 0.065
11.68 0.00630 5.392E-04 0.845 0.334 41.93 0.079
12.17 0.00709 5.824E-04 0.913 0.349 44.94 0.093
12.45 0.00790 6.346E-04 0.995 0.364 47.40 0.108
12.63 0.00870 6.890E-04 1.080 0.378 49.42 0.122
12.68 0.00946 7.456E-04 1.169 0.391 50.89 0.135
12.69 0.01028 8.104E-04 1.271 0.404 52.19 0.148
12.39 0.01107 8.727E-04 1.368 0.415 53.26 0.159
12.66 0.01193 9.422E-04 1.477 0.425 54.21 0.170
12.62 0.01287 1.021E-03 1.600 0.436 55.04 0.180
12.57 0.01341 1.066E-03 1.672 0.441 55.38 0.186
12.46 0.01432 1.149E-03 1.801 0.449 22.74 0.194
12.39 0.01497 1.208E-03 1.893 0.454 55.93 0.199
12.35 0.01576 1.276E-03 2.001 0.459 56.25 0.204
The typical curve is determined through an analysis of the relationship between KR and estimated
physical crack extension, as shown in Figure 1.4.12.6(c). The average estimated physical crack extension at
each KR is added to the computed plastic zone size for that stress intensity to develop typical values of
effective crack extension as a function of KR.

MMPDS-05
1 April 2010
1-28
2198-T8, T-L, 75F, 0.064 - 0.102 in. thick sheet
0
40
80
120
160
200
240
280
0.00 0.50 1.00 1.50 2.00 2.50 3.00 3.50 4.00 4.50 5.00 5.50
Delta a effective, in.
KR
, k
si-
in0
.50
Mean Curve
0.064
0.072
0.072
0.073
0.073
0.079
0.087
0.102
W = 29.9 inFty = 77 ksi
Figure 1.4.12.6(b) Example KR vs ∆aeff Curve Constructed from a Collection ofIndividual KR Curves
2198 T-L Thin Sheet
-2.50
-2.00
-1.50
-1.00
-0.50
0.00
0.50
1.00
1.7 1.8 1 .9 2.0 2.1 2.2 2.3 2.4
log KR, ksi-in0.50
log
de
lta
a p
hys
ica
l, i
n.
0.064 in. <= t <= 0.102 in.
Linear (0.064 in. <= t <= 0.102in.)
Figure 1.4.12.6(c) Variability in Estimated Physical Crack Extension as a Functionof KR

MMPDS-05
1 April 2010
1-29
Figure 1.4.13.1(a). Fatigue crack-growthcurve.
1.4.13 FATIGUE CRACK GROWTH — Crack growth deals with material behavior between crack
initiation and crack instability. In small size specimens, crack initiation and specimen failure may be nearly
synonymous. However, in larger structural components, the existence of a crack does not necessarily imply
imminent failure. Significant structural life exists during cyclic loading and crack growth.
1.4.13.1 Fatigue Crack Growth Rate Testing — Fatigue crack growth is manifested as the
growth or extension of a crack under cyclic loading. This process is primarily controlled by the maximum load
or stress ratio. Additional factors include environment, loading frequency, temperature, and grain direction.
Certain factors, such as environment and loading frequency, have interactive effects. Environment is important
from a potential corrosion viewpoint. Time at stress is another important factor. Standard testing procedures
are documented in ASTM E 647.
Fatigue crack growth data presented herein are based on constant-amplitude tests. Crack growth
behaviors based on spectrum loading cycles are beyond the scope of this Handbook. Constant-amplitude data
consist of crack length measurements at corresponding loading cycles. Such data are presented as crack
growth curves, as shown in Figure 1.4.13.1(a).
Since the crack growth curve is dependent on initial crack length and the loading conditions, the above
format is not the most efficient form to present information. The instantaneous slope, ∆a/∆N, corresponding
to a prescribed number of loading cycles, provides a more fundamental characterization of this behavior. In
general, fatigue crack growth rate behavior is evaluated as a function of the applied stress-intensity factor
range, ∆K, as shown in Figure 1.4.13.1(b).

MMPDS-05
1 April 2010
1-30
Figure 1.4.13.1(b). Fatigue crack-growth-rate curve.
1.4.13.2 Fatigue Crack Growth Analysis — It is known that fatigue crack growth behavior
under constant-amplitude cyclic conditions is influenced by maximum cyclic stress, Smax, and some measure
of cyclic stress range, ∆S (such as stress ratio, R, or minimum cyclic stress, Smin), the instantaneous crack size,
a, and other factors such as environment, frequency, and temperature. Thus, fatigue crack growth rate behavior
can be characterized, in general form, by the relation
da/dN . ∆a/∆N = g(Smax, ∆S or R or Smin, a, ...). [1.4.13.3(a)]
By applying concepts of linear elastic fracture mechanics, the stress and crack size parameters can be
combined into the stress-intensity factor parameter, K, such that Equation 1.4.13.3(a) may be simplified to
da/dN . ∆a/∆N = g(Kmax, ∆K, ...) [1.4.13.3(b)]
where
Kmax = the maximum cyclic stress-intensity factor
∆K = (1-R)Kmax, the range of the cyclic stress-intensity factor, for R $ 0
∆K = Kmax, for R # 0.
At present, in the Handbook, the independent variable is considered to be simply ∆K and the data are con-
sidered to be parametric on the stress ratio, R, such that Equation 1.4.13.3(b) becomes
da/dN . ∆a/∆N = g(∆K, R). [1.4.13.3(c)]
1.4.13.3 Fatigue Crack Growth Data Presentation — Fatigue crack growth rate data for
constant amplitude cyclic loading conditions are presented as logarithmic plots of da/dN versus ∆K. Such
information, such as that illustrated in Figure 1.4.13.3, are arranged by material alloy and heat treatment
condition. Each curve represents a specific stress ratio, R, environment, and cyclic loading frequency.
Specific details regarding test procedures and data interpolations are presented in Chapter 9.

MMPDS-05
1 April 2010
1-31
Figure 1.4.13.3. Sample display of fatigue crack growth rate data.

MMPDS-05
1 April 2010
1-32
This page is intentionally blank.

MMPDS-05
1 April 2010
1-33
1.5 TYPES OF FAILURES
1.5.1 GENERAL — In the following discussion, failure will usually indicate fracture of a member or
the condition of a member when it has attained maximum load.
1.5.2 MATERIAL FAILURES — Fracture can occur in either ductile or brittle fashions in the same
material, depending on the state of stress, rate of loading, and environment. The ductility of a material has a
significant effect on the ability of a part to withstand loading and delay fracture. Although not a specific
design property for ductile materials, some ductility data are provided in this Handbook to assist in material
selections. The following paragraphs discuss the relationship between failure and the applied or induced
stresses.
1.5.2.1 Direct Tension or Compression — This type of failure is associated with ultimate
tensile or compressive stress of the material. For compression, it can only apply to members having large
cross-sectional dimensions relative to their lengths. See Section 1.4.5.1.
1.5.2.2 Shear — Pure shear failures are usually obtained when the shear load is transmitted over
a very short length of a member. This condition is approached in the case of rivets and bolts. In cases where
ultimate shear stress is relatively low, a pure shear failure can result. But, generally, members subjected to
shear loads fail under the action of the resulting normal stress, usually the compressive stress. See Equation
1.3.2(b). Failure of tubes in torsion are not caused by exceeding the shear ultimate stress, but by exceeding
a normal compressive stress, which causes the tube to buckle. It is customary to determine stresses for
members subjected to shear in the form of shear stresses, although they are actually indirect measures of the
stresses actually causing failure.
1.5.2.3 Bearing — Failure of a material in bearing can consist of crushing, splitting, tearing, or
progressive rapid yielding in the direction of load application. A failure of this type depends on the relative
size and shape of the two connecting parts. The maximum bearing stress may not be applicable to cases in
which one of the connecting members is relatively thin.
1.5.2.4 Bending — For sections not subject to geometric instability, a bending failure can be
classed as either a tensile or compressive failure. Reference 1.5.2.4 provides methodology by which actual
bending stresses above the material proportional limit can be used to establish maximum stress conditions.
Actual bending stresses are related to the bending modulus of rupture. The bending modulus of rupture (fb)
is determined by Equation 1.3.2(c). When the computed bending modulus of rupture is found to be lower than
the proportional limit strength, it represents an actual stress. Otherwise, it represents an apparent stress and
is not considered as an actual material strength. This is important when considering complex stress states such
as combined bending and compression or tension.
1.5.2.5 Failure Due to Stress Concentrations — Static stress properties represent pristine
materials without notches, holes, or other stress concentrations. Such simplistic structural design is not always
possible. Consideration should be given to the effect of stress concentrations. When available, references are
cited for specific data in various chapters of this Handbook.
1.5.2.6 Failure From Combined Stresses — Under combined stress conditions, where failure
is not due to buckling or instability, it is necessary to refer to some theory of failure. The maximum shear
theory is widely accepted as a working basis in the case of isotropic ductile materials. It should be noted that
this theory defines failure as the first yielding of a material. Any extension of this theory to cover conditions
of final rupture must be based on evidence supported by the user. The failure of brittle materials under
combined stresses is generally treated by the maximum stress theory. Section 1.4.11 contains a more complete
discussion of biaxial behavior. References 1.5.2.6(a) through 1.5.2.6(c) offer additional information.
MMPDS-05
1 April 2010
1-34
1.5.3 INSTABILITY FAILURES — Practically all structural members, such as beams and columns,
particularly those made from thin material, are subject to failure due to instability. In general, instability can
be classed as (1) primary or (2) local. For example, the failure of a tube loaded in compression can occur
either through lateral deflection of the tube acting as a column (primary instability) or by collapse of the tube
walls at stresses lower than those required to produce a general column failure. Similarly, an I-beam or other
formed shape can fail by a general sidewise deflection of the compression flange, by local wrinkling of thin
outstanding flanges, or by torsional instability. It is necessary to consider all types of potential failures unless
it is apparent that the critical load for one type is definitely the controlling condition.
Instability failures can occur in either the elastic range below the proportional limit or in the plastic
range. These two conditions are distinguished by referring to either elastic instability or plastic instability
failures. Neither type of failure is associated with a material’s ultimate strength, but largely depends upon
geometry.
A method for determining the local stability of aluminum alloy column sections is provided in
Reference 1.7.1(b). Documents cited therein are the same as those listed in References 3.20.2.2(a) through
3.20.2.2(e).
1.5.3.1 Instability Failures Under Compression — Failures of this type are discussed in
Section 1.6 (Columns).
1.5.3.2 Instability Failures Under Bending — Round tubes, when subjected to bending, are
subject to plastic instability failures. In such cases, the failure criterion is the modulus of rupture. Equation
1.3.2.3, which was derived from theory and confirmed empirically with test data, is applicable.
1.5.3.3 Instability Failures Under Torsion — The remarks given in the preceding section
apply in a similar manner to round tubes under torsional loading. In such cases, the modulus of rupture in
torsion is derived through the use of Equation 1.3.2(f). See Reference 1.5.3.3.
1.5.3.4 Failure Under Combined Loadings — For combined loading conditions in which
failure is caused by buckling or instability, no theory exists for general application. Due to the various design
philosophies and analytical techniques used throughout the aerospace industry, methods for computing margin
of safety are not within the scope of this Handbook.

MMPDS-05
1 April 2010
1-35
1.6 COLUMNS
1.6.1 GENERAL — A theoretical treatment of columns can be found in standard texts on the strength
of materials. Some of the problems which are not well defined by theory are discussed in this section. Actual
strengths of columns of various materials are provided in subsequent chapters.
1.6.2 PRIMARY INSTABILITY FAILURES — A column can fail through primary instability by bending
laterally (stable sections) or by twisting about some axis parallel to its own axis. This latter type of primary
failure is particularly common to columns having unsymmetrical open sections. The twisting failure of a
closed section column is precluded by its inherently high torsional rigidity. Since the amount of available
information is limited, it is advisable to conduct tests on all columns subject to this type of failure.
1.6.2.1 Columns With Stable Sections — The Euler formula for columns which fail by lateral
bending is given by Equation 1.3.8(b). A conservative approach in using this equation is to replace the elastic
modulus (E) by the tangent modulus (Et) given by Equation 1.3.8(a). Values for the restraint coefficient (c)
depend on degrees of ends and lateral fixities. End fixities tend to modify the effective column length as
indicated in Equation 1.3.8(a). For a pin-ended column having no end restraint, c = 1.0 and LN = L. A fixity
coefficient of c = 2 corresponds to an effective column length of LN = 0.707 times the total length.
The tangent modulus equation takes into account plasticity of a material and is valid when the
following conditions are met:
(a) The column adjusts itself to forcible shortening only by bending and not by twisting.
(b) No buckling of any portion of the cross section occurs.
(c) Loading is applied concentrically along the longitudinal axis of the column.
(d) The cross section of the column is constant along its entire length.
MMPDS provides typical stress versus tangent modulus diagrams for many materials, forms, and grain
directions. This information is not intended for design purposes. Methodology is contained in Chapter 9 for
the development of allowable tangent modulus curves.
1.6.2.2 Column Stress (fco) — The upper limit of column stress for primary failure is designated
as fco. By definition, this term should not exceed the compression ultimate strength, regardless of how the
latter term is defined.
1.6.2.3 Other Considerations — Methods of analysis by which column failure stresses can be
computed, accounting for fixities, torsional instability, load eccentricity, combined lateral loads, or varying
column sections are contained in References 1.6.2.3(a) through 1.6.2.3(d).
1.6.3 LOCAL INSTABILITY FAILURES — Columns are subject to failure by local collapse of walls at
stresses below the primary failure strength. The buckling analysis of a column subject to local instability
requires consideration of the shape of the column cross section and can be quite complex. Local buckling,
which can combine with primary buckling, leads to an instability failure commonly identified as crippling.
1.6.3.1 Crushing or Crippling Stress (f cc) — The upper limit of column stress for local failure
is defined by either its crushing or crippling stress. The strengths of round tubes have been thoroughly
investigated and considerable amounts of test results are available throughout literature. Fewer data are
available for other cross-sectional configurations and testing is suggested to establish specific information, e.g.,
the curve of transition from local to primary failure.

MMPDS-05
1 April 2010
1-36
1.6.4 CORRECTION OF COLUMN TEST RESULTS — In the case of columns having unconventional
cross sections that are subject to local instability, it is necessary to establish curves of transition from local to
primary failure. In determining these column curves, sufficient tests should be made to cover the following
points.
1.6.4.1 Nature of “Short Column Curve” — Test specimens should cover a range of LN/ρ
values. When columns are to be attached eccentrically in structural application, tests should be designed to
cover such conditions. This is important particularly in the case of open sections, as maximum load-carrying
capabilities are affected by locations of load and reaction points.
1.6.4.2 Local Failure — When local failure occurs, the crushing or crippling stress can be
determined by extending the short column curve to a point corresponding to a zero value for LN/ρ. When a
family of columns of the same general cross section is used, it is often possible to determine a relationship
between crushing or crippling stress and some geometric factor. Examples are wall thickness, width, diameter,
or some combination of these dimensions. Extrapolation of such data to conditions beyond test geometry
extremes should be avoided.
1.6.4.3 Reduction of Column Test Results on Aluminum and Magnesium Alloys toStandard Material — The use of correction factors provided in Figures 1.6.4.3(a) through 1.6.4.3(i) is
acceptable to the Air Force, the Navy, the Army, and the FAA for use in reducing aluminum and magnesium
alloys column test data into allowables. (Note that an alternate method is provided in Section 1.6.4.4.) Using
Figures 1.6.4.3(a) through 1.6.4.3(i), the correction of column test results to standard material is made by
multiplying the stress obtained from testing a column specimen by the factor K. This factor may be considered
applicable regardless of the type of failure involved, i.e., column crushing, crippling, or twisting. Note that
not all the information provided in these figures pertains to allowable stresses, as explained below.
The following terms are used in reducing column test results into allowable column stress:
Fcy is the design compression yield stress of the material in question, applicable to the gage, temper, and
grain direction along the longitudinal axis of a test column.
FcN is the maximum test column stress achieved in test. Note that an uppercase letter (F) is used rather
the customary lowercase (f). This value can be an individual test result.
FcyN is the compressive yield strength of the column material. Note that an uppercase letter (F) is used
rather than the customary lowercase (f). This value can be an individual test result using a standard
compression test specimen.
Using the ratio of (FcN / FcyN), enter the appropriate diagram along the abscissa and extend a line
upwards to the intersection of a curve with a value of (FcyN / Fcy). Linear interpolation between curves is
permissible. At this location, extend a horizontal line to the ordinate and read the corresponding K-factor.
This factor is then used as a multiplier on the measured column strength to obtain the allowable. The basis
for this allowable is the same as that noted for the compression yield stress allowable obtained from the room
temperature allowables table.
If the above method is not feasible, due to an inability of conducting a standard compression test of
the column material, the compression yield stress of the column material may be estimated as follows: Conduct
a standard tensile test of the column material and obtain its tensile yield stress. Multiply this value by the ratio
of compression-to-tensile yield allowables for the standard material. This provides the estimated compression
yield stress of the column material. Continue with the analysis as described above using the compression
stress of a test column in the same manner.

MMPDS-05
1 April 2010
1-37
=
Column material compressive yield stress
0.3 0.4 0.5 0.6 0.7 0.8 0.9 1.0 1.1 1.2 1.3
K =
Corr
ection
Fa
cto
r
0.7
0.8
0.9
1.0
1.1
1.2
Maximum test column Stress
.
=
Compressive yield stress (std)
Column material compressive yield stress
Fcy
Fcy
'
Fcy
.90
.95
1.00
1.05
1.10
1.15
1.20
1.25
1.30
1.35
Fcy
'
Fcy
'
Fc'
Figure 1.6.4.3(a). Nondimensional material correctionchart for 2024-T3 sheet.
F c'
=
C olum n m ate ria l com pressive yie ld s tress
0.3 0 .4 0.5 0 .6 0 .7 0 .8 0.9 1 .0 1.1 1 .2 1 .3
K =
Corr
ection
Facto
r
0.7
0 .8
0 .9
1 .0
1 .1
1 .2
M axim um test co lum n S tress
.
Fcy
'
=
C om press ive yie ld stress (s td )
C o lum n m ate ria l com pressive yie ld s tress
F cy
Fcy
' Fcy
'
F cy
.90
.95
1.00
1.05
1.10
1.15
1.20
1.25
1.30
1.35
Figure 1.6.4.3(b). Nondimensional material correctionchart for 2024-T3 clad sheet.
If neither of the above methods are feasible, it may be assumed that the compressive yield stress
allowable for the column is 15 percent greater than minimum-established allowable longitudinal tensile yield
stress for the material in question.

MMPDS-05
1 April 2010
1-38
Fc'
=
Column material compressive yield stress
0.3 0.4 0.5 0.6 0.7 0.8 0.9 1.0 1.1 1.2 1.3
K =
Co
rre
ctio
n F
acto
r
0.7
0.8
0.9
1.0
1.1
1.2
Maximum test column Stress
.
Fcy
'
=
Compressive yield stress (std)
Column material compressive yield stress
Fcy
Fcy
' Fcy
'
Fcy
.90
.95
1.00
1.05
1.10
1.15
1.20
1.25
1.30
1.35
Figure 1.6.4.3(d). Nondimensional material correctionchart for 2024-T4 extrusion 1/4 to 1-1/2 inches thick.
Fc'
=
Column material compressive yield stress
0.3 0.4 0.5 0.6 0.7 0.8 0.9 1.0 1.1 1.2 1.3
K =
Corr
ection F
acto
r
0.7
0.8
0.9
1.0
1.1
1.2
Maximum test column Stress
.
Fcy
'
=
Compressive yield stress (std)
Column material compressive yield stress
Fcy
Fcy
' Fcy
'
Fcy
.90
.95
1.00
1.05
1.10
1.15
1.20
1.25
1.30
1.35
Figure 1.6.4.3(c). Nondimensional material correctionchart for 2024-T4 extrusion less than 1/4 inch thick.

MMPDS-05
1 April 2010
1-39
Fc'
=
Column material compressive yield stress
0.3 0.4 0.5 0.6 0.7 0.8 0.9 1.0 1.1 1.2 1.3
K =
Corr
ection
Fa
cto
r
0.7
0.8
0.9
1.0
1.1
1.2
Maximum test column Stress
.
Fcy
'
=
Compressive yield stress (std)
Column material compressive yield stress
Fcy
Fcy
' Fcy
'
Fcy
.90
.95
1.00
1.05
1.10
1.15
1.20
1.25
1.30
1.35
Figure 1.6.4.3(e). Nondimensional material correctionchart for 2024-T3 tubing.
Fc'
=
Column material compressive yield stress
0.3 0.4 0.5 0.6 0.7 0.8 0.9 1.0 1.1 1.2 1.3
K =
Co
rre
ction
Facto
r
0.7
0.8
0.9
1.0
1.1
1.2
Maximum test column Stress
.
Fcy
'
=
Compressive yield stress (std)
Column material compressive yield stress
Fcy
Fcy
' Fcy
'
Fcy
.90
.95
1.00
1.05
1.10
1.15
1.20
1.25
1.30
1.35
Figure 1.6.4.3(f). Nondimensional material correction chartfor clad 2014-T3 sheet.

MMPDS-05
1 April 2010
1-40
Fc'
=
Column material compressive yield stress
0.3 0.4 0.5 0.6 0.7 0.8 0.9 1.0 1.1 1.2 1.3
K =
Corr
ectio
n F
acto
r
0.7
0.8
0.9
1.0
1.1
1.2
Maximum test column Stress
.
Fcy
'
=
Compressive yield stress (std)
Column material compressive yield stress
Fcy
Fcy' F
cy'
Fcy
.90
.95
1.00
1.05
1.10
1.15
1.20
1.25
1.30
1.35
Figure 1.6.4.3(g). Nondimensional material correction chartfor 7075-T6 sheet.
Fc'
=
Column material compressive yield stress
0.2 0.3 0.4 0.5 0.6 0.7 0.8 0.9 1.0 1.1 1.2
K =
Co
rre
ctio
n F
acto
r
0.7
0.8
0.9
1.0
1.1
1.2
Maximum test column Stress
.
Fcy'
=
Compressive yield stress (std)
Column material compressive yield stress
Fcy
Fcy' F
cy'
Fcy
.90
1.00
1.10
1.20
1.30
Figure 1.6.4.3(h). Nondimensional material correction chartfor AZ31B-F and AZ61A-F extrusion.

MMPDS-05
1 April 2010
1-41
Fc'
=
Column material compressive yield stress
0.2 0.3 0.4 0.5 0.6 0.7 0.8 0.9 1.0 1.1 1.2
K =
Corr
ection F
acto
r
0.7
0.8
0.9
1.0
1.1
1.2
Maximum test column Stress
.
Fcy'
=
Compressive yield stress (std)
Column material compressive yield stress
Fcy
Fcy
' Fcy'
Fcy
.90
1.00
1.10
1.20
1.30
Figure 1.6.4.3(i). Nondimensional material correction chartfor AZ31B-H24 sheet.
1.6.4.4 Reduction of Column Test Results to Standard Material-AlternateMethod — For materials that are not covered by Figures 1.6.4.3(a) through 1.6.4.3(i), the following method
is acceptable for all materials to the Air Force, the Navy, the Army, and the FAA.
(1) Obtain the column material compression properties: Fcy, Ec, nc.
(2) Determine the test material column stress (fcN) from one or more column tests.
(3) Determine the test material compression yield stress (fcyN) from one or more tests.
(4) Assume Ec and nc from (1) apply directly to the column material. They should be the samematerial.
(5) Assume that the geometry of the test column is the same as that intended for design. This meansthat a critical slenderness ratio value of (LN/ρ) applies to both cases.
• Using the conservative form of the basic column formula provided in Equation 1.3.8(a), thisenables an equality to be written between column test properties and allowables. If
[1.6.4.4(a)]( ) ( )L for design L of thecolumn test'/ '/ρ ρ=
Then
[1.6.4.4(b)]( ) ( )Fc Et for design fc Et from test/ '/ '=
• Tangent modulus is defined as:

MMPDS-05
1 April 2010
1-42
Ef
f
En
f
f
tc
c
c
cc
cy
nc
''
'.
'
'
=
+
0 002
F
En
F
F
f
En
f
f
c
c
cc
cy
n
c
c
cc
cy
nc c
+
= +
0 002 0 002.
'.
'
'
e e ee p= +
ef
E
f
fy
n
= +
0 002.
Ef
f
En
f
f
t
y
n=
+
0 002.
EF
F
En
F
F
tc
c
c
cc
cy
nc
=
+
0 002.
[1.6.4.4(c)]E df det = /
• Total strain (e) is defined as the sum of elastic and plastic strains, and throughout the Handbookit is used as:
[1.6.4.4(d)]
or
[1.6.4.4(e)]
Equation 1.6.4.4(c) can be rewritten as follows:
[1.6.4.4(f)]
Tangent modulus, for the material in question, using its compression allowables is:
[1.6.4.4(g)]
In like manner, tangent modulus for the same material with the desired column configuration is:
[1.6.4.4(h)]
Substitution of Equations 1.6.4.4(g) and 1.6.4.4(h) for their respective terms in Equation 1.6.4.4(b) and
simplifying provides the following relationship:
[1.6.4.4(i)]
The only unknown in the above equation is the term Fc , the allowable column compression stress. This
property can be solved through an iterative process.
This method is also applicable at other than room temperature, having made adjustments for the effect
of temperature on each of the properties. It is critical that the test material be the same in all respects as that
for which allowables are selected from this Handbook. Otherwise, the assumption made in Equation 1.6.4.4(c)
above is not valid. Equation 1.6.4.4(i) must account for such differences in moduli and shape factors when
applicable.

MMPDS-05
1 April 2010
1-43
1.7 THIN-WALLED AND STIFFENED THIN-WALLED SECTIONS
A bibliography of information on thin-walled and stiffened thin-walled sections is contained inReferences 1.7(a) and (b).

MMPDS-05
1 April 2010
1-44
This page is intentionally blank.

MMPDS-05
1 April 2010
1-45
1.8 ALLOWABLES-BASED FLOW STRESS FOR NONLINEAR STATIC ANALYSIS
1.8.1 INTRODUCTION — Finite element analysis is often required to determine stress, strain and
deflection of complex structural components wherein the materials are stressed well beyond the elastic limit.
In these cases the materials allowables in Chapters 2 through 8 are insufficient to enable a nonlinear analysis,
and knowledge of the flow stress curve is required. Typical stress-strain curves developed by conventional
testing procedures, such as ASTM E8, are not directly suitable because the strain is averaged over a fixed gage
length. Such relationships may, however, be converted first into typical room temperature flow stress curves
then further into A-, B-, or S-Basis flow stress curves using the procedures described in this section.
Allowables-based flow stress relationships are also useful in determining fictitious stress, required for
stability and bending analyses [Ref. 1.8.1].
The assumed "typical" flow stress versus strain relationship should be substantiated before using it
in an MMPDS analysis. One way to substantiate the flow curve is through modeling of the baseline ASTM
E8 specimen and comparing the predicted stress-strain behavior to the experimental test result. It should be
noted that the assumed failure stress value may need to be raised or lowered to improve the predictive quality
of the material flow stress curve.
Once established for a given material, the flow stress curve may then be converted to an A, B, or S-
Basis flow stress curve which incorporates the appropriate strength allowables from Chapters 2 through 8. The
general procedure is as follows;
1) Obtain typical uniaxial engineering stress versus average (fixed gage length) strain data for the
material of interest using the procedures outlined in ASTM E8.
2) Create a candidate flow stress curve by converting the strain at failure to infinitesimal strain and
assuming a flow stress relationship between ultimate engineering stress and failing stress. If reduction-of-area
measurements are not available for the determination of infinitesimal failure strain then failure strain shall be
assumed to be equal to the elongation percent in 2 inches at failure.
3) Validate the flow curve by modeling the original ASTM E8 specimen's stress-strain behavior and
modifying as required until the predictive quality is within acceptable limits.
4) Determine the proportional limit, Fpl, and failure stress, Ff, by proportionally reducing Spl and Sf by
the ratio of Fty/Sy and Ftu/Su respectively. The proportional limit may also be calculated using the Ramberg-
Osgood number and the appropriate strain offset value. The allowables based stresses, Fpl, Fty, Ftu and Ff shall
"plot" on the allowable based flow curve along a line directed from Spl, Sy, Su and Sf having the slope of the
elastic modulus. In the foregoing discussion S designates stresses which are typical, non-basis, room
temperature values, while F designates stresses which have a statistical basis and may be corrected for
temperature.
1.8.2 PROCEDURE —
a) The preferred test and analysis specimens are the dog bone coupons of ASTM E8. Typical full-
range curves from MMPDS may be used if available. Otherwise at least three (3) specimens should be tested
and the engineering stress versus average engineering strain curves averaged. A sample curve is shown in
Figure 1.8.2.
b) The engineering stress-strain curve is made into a flow stress curve by substituting the fixed-gage-
length failure strain with the corresponding infinitesimal-gage-length failure strain as follows;
ef = RA/(1-RA)

MMPDS-05
1 April 2010
1-46
in which ef is the infinitesimal gage length strain at failure and RA is the reduction of area [Ref. 1.8.2(a)]. In
the event that reduction-of-area measurements are not available for the determination of infinitesimal failure
strain then failure strain shall be assumed to be equal to the elongation percent in 2 inches at failure or the
strain at maximum stress, whichever is appropriate.
c) Mathematical relationships are then derived for the transition regions between the proportional limit
and yield, between yield and ultimate, and between ultimate and failure. The analyst may consider convex or
concave shape functions, splines, or straight lines. If the finite element code incorporates a total Lagrangian
formulation, engineering stress-strain units are used. If the code uses an updated Lagrangian formulation, the
assumed flow stress curve must be converted into true stress vs. true strain before proceeding with the analysis,
as described in Section 1.8.2(h).
d) Stress-strain data pairs (or, if the finite element software permits it, an equation describing the
relationship) are extracted from this flow stress curve and used for nonlinear modeling. The piecewise-linear
representation of the flow curve should be sufficiently refined to produce suitably accurate results. Finite
element predictions from an updated Lagrangian analysis must be converted back into engineering units before
comparison to MMPDS allowables may be made.
e) The flow curve derived above should be used to predict the stress-strain behavior of the baseline
ASTM E8 test specimen, and suitably modified as required to replicate the experimental test results with
sufficient accuracy (e.g., 5%). Modifications to the flow curve should be limited to the assumed failure stress,
as this is the most uncertain of the parameters governing the shape of the flow stress curve.
f) Once the predictability of the flow stress curve is established and accepted, it may be remapped as
an allowables-based flow curve as follows;
• Lower the proportional limit by the ratio of Fty to Sy.
• Lower the failure stress by the ratio of Fu to Su.
• The allowables-based flow curve will pass through the new proportional limit, Fty, Ftu, and the new
failure stress as determined above. The transition regions between the proportional limit and Fty,
between Fty and Ftu, and between Ftu and the new failure stress will be identical to those used to
validate the "average" flow stress curve. The points corresponding to Fty, Ftu and failure stress will
lie on lines extending from Sy, Su, and Sf respectively on a slope equal to the elastic modulus. Refer
to Figure 1.8.2
g) Finite element analysis may be either 2D (plane strain, plane stress, or axisymmetric) or 3D (solid
elements), and may take advantage of symmetry planes to minimize computational cost (i.e., element count).
The mesh must be sufficiently refined to ensure convergence of the solution between runs of different mesh
densities. Note that the element formulation must be capable of handling large strain, large rotation and large
displacement. Total Lagrangian and updated Lagrangian element formulations are specifically designed to
handle this class of problems.
h) Updated Lagrangian finite element formulations require that the material stress-strain properties
be entered in terms of true (Cauchy) stress and true (logarithmic) strain. These may be obtained from
engineering stress and zero-gage-length engineering strain as follows [Ref. 1.8.2(b)]:
g = ln(1+e)
σ = S(1+ e)
.

MMPDS-05
1 April 2010
1-47
1.8.3 REPORTING REQUIREMENTS C Analyses using the procedures outlined herein shall document
the following data and information:
• Average (i.e., "typical") ASTM E8 stress-strain curve
• Test specimen stress and strain data pairs ("way points":SPL, SY, SU, SF, ePL, ey, eu, ef, and elongation
in 2" or reduction of area)
• Calculation showing the derivation of ef (zero-gage-length strain).
• Formulas describing the transition regions between SPL, SY, SU, and SF) for the ASTM E8 analysis.
• Allowables-Based stress and strain data pairs ("way points":FPL, Fty, Ftu, FF, ePL, ey, eu, ef)
• Formulas describing the transition regions between FPL, Fty, Ftu, and FF) for the ASTM E8 analysis.
Figure 1.8.2. Superimposed plots of (a)Experimental Result, (b) Extended Curve toAccount for Infinitesimal Strain, and (c) Derived Allowables Flow Curve.

MMPDS-05
1 April 2010
1-48
This page is intentionally blank.

MMPDS-05
1 April 2010
1-49
REFERENCES
1.4.3.1 Goodman, S. and Russell, S.B., U.S. Air Force, “Poisson’s Ratio of Aircraft Sheet Materials
for Large Strain,” WADC-TR-53-7, 58 pp. (June 1953).
1.4.5 Hyler, W.S., “An Evaluation of Compression-Testing Techniques for Determining Elevated
Temperature Properties of Titanium Sheet,” Titanium Metallurgical Laboratory Report No. 43,
Battelle Memorial Institute, 38 pp. Appendix 28 pp. (June 8, 1956).
1.4.6 Stange, A.H., Ramberg, W., and Back, G., “Torsion Tests of Tubes,” National Advisory
Committee for Aeronautics, Report No. 601, pp. 515-535 (February 1937).
1.4.7(a) Stickley, G.W. and Moore, A.A., “Effects of Lubrication and Pin Surface on Bearing Strengths
of Aluminum and Magnesium Alloys,” Materials Research and Standards, 2, (9), pp. 747-751
(September 1962).
1.4.7(b) "Effect of Lubrication on the Joint Bearing Strength of Riveted Lap Joints," Report
NADC-72055-VT 4 Apr. 1972 Naval Air Development Center Johnsville, PA
1.4.7(c) "Effect of Lubrication on the Bearing Strength of Aluminum Alloy," Report NADC-MA-6944
19 Sept 1969 Naval Air Development Center Johnsville, PA
1.4.7(d) "Effect of Lubrication on the Bearing Strength of Various Metallic Materials Report,"
NADC-MA-7007 31 Dec 1970 Naval Air Development Center Johnsville, PA
1.4.7(e) "Effect of Lubrication on the Joint Bearing Strength of Metal Joints," Report NADC-MA-7162
27 Sep 1971 Naval Air Development Center Johnsville, PA
1.4.8.2.1(a) Rice, Richard, “Reference Document for the Analysis of Creep and Stress Rupture Data in
MIL-HDBK-5,” AFWAL-TR-81-4097 (September 1981).
1.4.8.2.1(b) Aarnes, M.N. and Tuttle, M.M., “Presentation of Creep Data for Design Purposes,” ASD
Technical Report 61-216 (June 1961) (MCIC 45114).
1.4.9.2(a) Grover, H.J., “Fatigue of Aircraft Structures,” Prepared for Naval Air Systems Command,
Department of the Navy, 335 pp. (1966).
1.4.9.2(b) Osgood, C.C., “Fatigue Design,” Wiley-Interscience, A Division of John Wiley and Sons, Inc.,
523 pp. (1970).
1.4.11 Bert, C.W., Mills, E.J., and Hyler, W.S., “Mechanical Properties of Aerospace Structural
Alloys Under Biaxial-Stress Conditions,” AFML-TR-66-229 (August 1966).
1.4.13.2 Paris, P.C., “The Fracture Mechanics Approach to Fatigue,” Proc. 10th Sagamore Conference,
p. 107, Syracuse University Press (1965).
1.5.2.4 Cozzone, F.P., “Bending Strength in the Plastic Range,” Journal of the Aeronautical Sciences,
10, pp. 137-151 (1943).
1.5.2.6(a) Dieter, G.E., Jr., “Mechanical Metallurgy,” McGraw-Hill Book Company, Inc., 615 pp. (1961).
1.5.2.6(b) Freudenthal, A.M., “The Inelastic Behavior of Engineering Materials and Structures,” John
Wiley and Sons, Inc., New York, 587 pp. (1950).

MMPDS-05
1 April 2010
1-50
1.5.2.6(c) Parker, E.R., “Brittle Behavior of Engineering Structures,” John Wiley and Sons, Inc., New
York, 323 pp. (1957).
1.5.3.3 Lundquist, E.E., “Strength Tests of Thin-Walled Duralumin Cylinders in Pure Bending,” U.S.
National Advisory Committee for Aeronautics, Technical Note No. 479, 17 pp. (December
1933).
1.6.2.3(a) Hill, H.N. and Clark, J.W., “Straight-Line Column Formulas for Aluminum Alloys,” Aluminum
Company of America, Aluminum Research Laboratories, Technical Paper No. 12, 8 pp. (1955).
1.6.2.3(b) AFFDL-TR-69-42, “Stress Analysis Manual,” Air Force Flight Dynamics Laboratory, Air
Force Systems Command, Wright-Patterson Air Force Base (February 1970).
1.6.2.3(c) “Astronautic Structure Manual,” George C. Marshall Space Flight Center (August 15, 1970).
1.6.2.3(d) Niles, A.S. and Newell, J.S., “Airplane Structure,” 2, Third Edition, John Wiley and Sons
(1943).
1.7(a) “Index of Aircraft Structures Research Reports,” U.S. National Advisory Committee for
Aeronautics, Index No. 7E29, 40 pp. (June 1947).
1.7(b) Gerard and Becker, H., “Handbook of Structural Stability,” National Advisory Committee for
Aeronautics Technical Note, Nos. 3781, 102 pp. (July 1957); 3782, 72 pp. (July 1957); 3783,
154 pp. (August 1957); 3784, 93 pp. (August 1957); and 3785, 89 pp. (August 1957).
1.8.1 Cozzone, F.P.: Bending strength in plastic range. J. Aeronaut. Sci. 10, 137-151 (1943)
1.8.2(a) Dieter, G.E.: Mechanical metallurgy. McGraw-Hill Series in Materials Science and
Engineering. McGraw Hill Book Company, New York, NY (1986), pp280
1.8.2(b) Dieter, G.E.: Mechanical metallurgy. McGraw-Hill Series in Materials Science and
Engineering. McGraw Hill Book Company, New York, NY (1986)

MMPDS-05
1 April 2010
A-1
A.0 GLOSSARY
A.1 ABBREVIATIONS
a — Amplitude; crack or flaw dimension; measure of flaw size, inches.
ac — Critical half crack length.
ao — Initial half crack length.
A — Area of cross section, square inches; ratio of alternating stress to mean stress; subscript
“axial”; A basis for mechanical-property values (see Section 1.4.1.1 or Section 9.1.6); “A”
ratio, loading amplitude/mean load; or area.
Aε — Strain “A” ratio, strain amplitude/mean strain.
Ai — Model parameter.
AD — Anderson-Darling test statistic, computed in goodness-of-fit tests for normality or
Weibullness.
AISI — American Iron and Steel Institute.
AMS — Aerospace Materials Specification (published by Society of Automotive Engineers, Inc.).
Ann — Annealed.
AN — Air Force-Navy Aeronautical Standard.
ASTM — American Society for Testing and Materials.
b — Width of sections; subscript “bending”.
bof — Backoff factor (in Pearson and Weibull T90 and T99 calculations)
br — Subscript “bearing”.
B — Biaxial ratio (see Equation 1.3.2.(h)); B-basis for mechanical-property values (see Section
1.4.1.1 or Section 9.1.6).
Btu — British thermal unit(s).
BUS — Individual or typical bearing ultimate strength.
BYS — Individual or typical bearing yield strength.
c — Fixity coefficient for columns; subscript “compression”.
cpm — Cycles per minute.
C — Specific heat; Celsius; Constant.
CEM — Consumable electrode melted.
CRES — Corrosion resistant steel (stainless steel).
C(T) — Compact tension.
CYS — Individual or typical compressive yield strength.
d — Mathematical operator denoting differential.
D or d — Diameter, or Durbin Watson statistic; hole or fastener diameter; dimpled hole.
df — Degrees of freedom.
e — Elongation in percent, a measure of the ductility of a material based on a tension test; unit
deformation or strain; subscript “fatigue or endurance”; the minimum distance from a hole,
center to the edge of the sheet; Engineering strain.
ee — Elastic strain.
ef — Infinitesimal gage length strain at failure
ep — Plastic strain.
ePL, — Proportional limit strain
eu — Ultimate strain
ey — Strain at yield
APPENDIX A

APPENDIX A - Glossary (continued)
A-2
e/D — Ratio of edge distance (center of the hole to edge of the sheet) to hole diameter (bearing
strength).
E — Modulus of elasticity in tension or compression; average ratio of stress to strain for stress
below proportional limit.
Ec — Modulus of elasticity in compression; average ratio of stress to strain below proportional
limit.
Es — Secant modulus of elasticity, Eq. 9.8.4.2(c).
Et — Tangent modulus of elasticity.
ELI — Extra low interstitial (grade of titanium alloy).
ER — Equivalent round.
ESR — Electro-slag remelted.
f — Internal (or calculated) tension stress; stress applied to the gross flawed section; creep
stress.
fb — Internal (or calculated) primary bending stress.
fc — Internal (or calculated) compressive stress; maximum stress at fracture: gross stress limit
(for screening elastic fracture data).
fpl — Proportional limit.
fs — Internal (or calculated) shear stress.
ft — Internal (or calculated) tensile stress.
ft — Foot: feet.
F — Design stress; Fahrenheit; Ratio of two sample variances.
FA — Design axial stress.
Fb — Design bending stress; modulus of rupture in bending.
Fbru — Design ultimate bearing stress.
Fbry — Design bearing yield stress.
Fc — Design column stress.
Fcc — Design crushing or crippling stress (upper limit of column stress for local failure).
Fcu — Design ultimate compressive stress.
Fcy — Design compressive yield stress at which permanent strain equals 0.002.
Ff — Failure stress which has a statistical basis and may be corrected for temperature
FH — Design hoop stress.
Fpl, — Proportional limit which has a statistical basis and may be corrected for temperature
Fs — Design shear stress.
Fsp — Design proportional limit in shear.
Fst — Design modulus of rupture in torsion.
Fsu — Design ultimate stress in pure shear (this value represents the average shear stress over the
cross section).
Fsy — Design shear yield stress.
Ftp — Design proportional limit in tension.
Ftu — Design tensile ultimate stress.
Fty — Design tensile yield stress at which permanent strain equals 0.002.
g — Gram(s).
G — Modulus of rigidity (shear modulus).
Gpa — Gigapascal(s).
hr — Hour(s).
H — Subscript “hoop”.
Hp — The projection matrix

APPENDIX A - Glossary (continued)
MMPDS-05
1 April 2010
A-3
HT90 — Estimated bound on the ratio of MSE to MSPE
HIP — Hot isostatically pressed.
i — Slope (due to bending) of neutral plane of a beam, in radians (1 radian = 57.3 degrees).
in. — Inch(es).
I — Axial moment of inertia.
J — Torsion constant (= Ip for round tubes); Joule.
k — Tolerance limit factor for the normal distribution and the specified probability, confidence,
and degrees of freedom; Strain at unit stress.
k99, k90 — One-sided tolerance limit factor for T99 and T90, respectively (see Section 9.10.1 and
9.10.7).
kA,B — k factor for A basis or B basis, respectively (see Section 9.10.1 and 9.10.7).
ksi — Kips (1,000 pounds) per square inch.
K — A constant, generally empirical; thermal conductivity; stress intensity; Kelvin; correction
factor.
Kapp — Apparent plane stress fracture toughness or residual strength.
Kc — Critical plane stress fracture toughness, a measure of fracture toughness at point of crack
growth instability.
Kf — Fatigue notch factor, or fatigue strength reduction factor.
KIc — Plane strain fracture toughness.
KN — Empirically calculated fatigue notch factor.
Kt — Theoretical stress concentration factor.
lb — Pound.
ln — Natural (base e) logarithm.
log — Base 10 logarithm.
L — Length; subscript “lateral”; longitudinal (grain direction).
LT — Long transverse (grain direction).
m — Subscript “mean”; meter; slope.
mm — Millimeter(s).
M — Applied moment or couple, usually a bending moment.
Mr — The number of distinct levels of t/D in the regression model.
Mc — Machine countersunk.
Mg — Megagram(s).
MIG — Metal-inert-gas (welding).
MPa — Megapascal(s).
MS — Military Standard.
M.S. — Margin of safety.
MSE — Mean Square Error
MSPE — Mean Square Pure Error
M(T) — Middle tension.
n — Number of individual measurements or pairs of measurements; subscript “normal”; cycles
applied to failure; shape parameter for the standard stress-strain curve (Ramberg-Osgood
parameter); number of fatigue cycles endured.
ni — The number of observations in the ith t/D group
no — An adjustment made due to unequal sample sizes
N — Fatigue life, number of cycles to failure; Newton; normalized.
Nf — Fatigue life, cycles to failure or total number of tests.

APPENDIX A - Glossary (continued)
MMPDS-05
1 April 2010
* Different from ASTM.
** Different from ASTM.
A-4
Ni* — Fatigue life, cycles to initiation.
Nt* — Transition fatigue life where plastic and elastic strains are equal.
NAS — National Aerospace Standard.
p — Subscript “polar”; subscript “proportional limit”.
psi — Pounds per square inch.
P — Load; applied load (total, not unit, load); exposure parameter; probability.
Pa — Load amplitude.
Pm — Mean load.
Pmax — Maximum load.
Pmin — Minimum load.
Pu — Test ultimate load, pounds per fastener.
Py — Test yield load, pounds per fastener.
q — Fatigue notch sensitivity; sample skewness.
Q — Static moment of a cross section.
Q(x) — the ith diagonal element of the Projection Matrix Hp
Q&T — Quenched and tempered.
r — Radius; root radius; reduced ratio (regression analysis); ratio of two pair measurements;
rank of test point within a sample.
— average ratio of paired measurements.r
R — Load (stress) ratio, or residual (observed minus predicted value); stress ratio, ratio of
minimum stress to maximum stress in a fatigue cycle; reduced ratio.
Rb — Stress ratio in bending.
Rc — Stress ratio in compression; Rockwell hardness - C scale.
Rε — Strain ratio, εmin/εmax.
Rs — Stress ratio in shear or torsion; ratio of applied load to allowable shear load.
Rt — Ratio of applied load to allowable tension load.
R(x) — Parameter used in T90 calculation
RA — Reduction of area.
R.H. — Relative humidity.
RMS — Root-mean-square (surface finish).
RT — Room temperature.
s — Estimated population standard deviation; sample standard deviation; subscript “shear”.
s2 — Sample variance.
S — Shear force; nominal engineering stress, fatigue; S-basis for mechanical-property values
(see Section 1.4.1.1).
Sa — Stress amplitude, fatigue.
Se — Fatigue limit.
Seq** — Equivalent stress.
Sf — Fatigue limit; typical failure stress, non-basis, room temperature value.
sm — Mean stress, fatigue.
Smax — Highest algebraic value of stress in the stress cycle.
Smin — Lowest algebraic value of stress in the stress cycle.
Spl — Typical proportional limit, non-basis, room temperature value

APPENDIX A - Glossary (continued)
MMPDS-05
1 April 2010
A-5
Sr — Algebraic difference between the maximum and minimum stresses in one cycle.
Su — Typical ultimate stress, non-basis, room temperature value
Sy — Root mean square error or estimate of the standard deviation in average joint strengths;
typical yield stress, non-basis, room temperature value.
SAE — Society of Automotive Engineers.
SCC — Stress-corrosion cracking.
SEE — Estimate population standard error of estimate.
SR — Studentized residual.
ST — Short transverse (grain direction).
STA — Solution treated and aged.
SUS — Individual or typical shear ultimate strength.
SYS — Individual or typical shear yield strength.
t — Thickness; subscript “tension”; exposure time; elapsed time; tolerance factor for the “t”
distribution with the specified probability and appropriate degrees of freedom.
t/D — Sheet thickness to fastener diameter ratio
T — Transverse direction; applied torsional moment; transverse (grain direction); subscript
“transverse”.
TF — Exposure temperature.
T90 — Statistically based lower tolerance bound for a mechanical property such that at least
90 percent of the population is expected to exceed T90 with 95 percent confidence.
T99 — Statistically based lower tolerance bound for a mechanical property such that at least
99 percent of the population is expected to exceed T99 with 95 percent confidence.
TIG — Tungsten-inert-gas (welding).
TUS — Individual or typical tensile ultimate strength.
TUS (Su)* — Tensile ultimate strength.
TYS — Individual or typical tensile yield strength.
u — Subscript “ultimate”.
U — Factor of utilization.
V99,V90 — The tolerance limit factor corresponding to T99, T90 for the three-parameter Weibull
distribution, based on a 95 percent confidence level and a sample of size n.
W — Width of center-through-cracked tension panel; Watt.
— Distance along a coordinate axis.x
x — Sample mean based upon n observations.
X — Value of an individual measurement; average value of individual measurements.
Xr — Matrix of multiple regression variables.
y — Deflection (due to bending) of elastic curve of a beam; distance from neutral axis to given
fiber; subscript “yield”; distance along a coordinate axis.
Y — Nondimensional factor relating component geometry and flaw size. See Reference
1.4.12.2.1(a) for values.
z — Distance along a coordinate axis.
Z — Section modulus, I/y.
A.2 SYMBOLS
α — (1) Coefficient of thermal expansion, mean; constant. (2) Significance level; probability
(risk of erroneously rejecting the null hypothesis (see Section 9.5.3)).
α99, α90 — Shape parameter estimates for a T99 or T90 value based on an assumed three-parameter
Weibull distribution.

APPENDIX A - Glossary (continued)
MMPDS-05
1 April 2010
* Different from ASTM.
A-6
α50 — Shape parameter estimate for the Anderson-Darling goodness-of-fit test based on an
assumed three-parameter Weibull distribution.
β — Constant.
β99, β90 — Scale parameter estimate for a T99 or T90 value based on an assumed three-parameter
Weibull distribution.
β50 — Scale parameter estimate for the Anderson-Darling goodness-of-fit test based on an
assumed three-parameter Weibull distribution.
∆ε or εr* — strain range, εmax - εmin.
∆εe — Elastic strain range.
∆εp — Plastic strain range.
∆S (Sr)* — Stress range.
∆σ — True or local stress range.
ε — True or local strain.
εeq* — Equivalent strain.
εm — Mean strain, (εmax + εmin)/2.
εmax — Maximum strain.
εmin — Minimum strain.
εt — Total (elastic plus plastic) strain at failure determined from tensile stress-strain curve.
δ — Deflection.
Φ — Angular deflection.
ρ — Radius of gyration; Neuber constant (block length).
µ — Poisson’s ratio, Pearson distribution sample mean.
— True or local stress; or population standard deviation.σ
A.3 DEFINITIONS
A-Basis.—The lower of either a statistically calculated number, or the specification minimum (S-basis).
The statistically calculated number indicates that at least 99 percent of the population of values is expected
to equal or exceed the A-basis mechanical design property, with a confidence of 95 percent.
Alternating Load.—See Loading Amplitude.
B-Basis.—At least 90 percent of the population of values is expected to equal or exceed the B-basis
mechanical property allowable, with a confidence of 95 percent.
Backoff Factor.—A value equal to a material’s average yield or ultimate strength divided by 100, or a
material’s average elongation or fracture toughness divided by 50. The maximum allowable downward
shift in the cumulative distribution function when attempting to fit a Pearson or Weibull distribution to that
material property.
Cast.—Cast consists of the sequential ingots which are melted from a single furnace change and poured in
one or more drops without changes in the processing parameters. (The cast number is for internal
identification and is not reported.) (See Table 9.2.4.2).
APPENDIX A - Glossary (continued)
MMPDS-05
1 April 2010
* Different from ASTM.
A-7
Casting.—One or more parts which are melted from a single furnace change and poured in one or more
molds without changes in the processing parameters. (The cast number is for internal identification and is
not reported.) (See Table 9.2.4.2).
Confidence.—A specified degree of certainty that at least a given proportion of all future measurements
can be expected to equal or exceed the lower tolerance limit. Degree of certainty is referred to as the
confidence coefficient. For MMPDS, the confidence coefficient is 95 percent which, as related to design
properties, means that, in the long run over many future samples, 95 percent of conclusions regarding
exceedance of A and B-values would be true.
Confidence Interval.—An interval estimate of a population parameter computed so that the statement “the
population parameter lies in this interval” will be true, on the average, in a stated proportion of the times
such statements are made.
Confidence Interval Estimate.—Range of values, computed with the sample that is expected to include the
population variance or mean.
Confidence Level (or Coefficient).—The stated portion of the time the confidence interval is expected to
include the population parameter.
Confidence Limits*.—The two numeric values that define a confidence interval.
Constant-Amplitude Loading.—A loading in which all of the peak loads are equal and all of the valley
loads are equal.
Constant-Life Fatigue Diagram.—A plot (usually on Cartesian coordinates) of a family of curves, each of
which is for a single fatigue life, N—relating S, Smax, and/or Smin to the mean stress, Sm. Generally, the
constant life fatigue diagram is derived from a family of S/N curves, each of which represents a different
stress ratio (A or R) for a 50 percent probability of survival. NOTE— MMPDS does not present fatigue
data in the form of constant-life diagrams.
Creep.—The time-dependent deformation of a solid resulting from force.
Note 1—Creep tests are usually made at constant load and temperature. For tests on metals, initial
loading strain, however defined, is not included.
Note 2—This change in strain is sometimes referred to as creep strain.
Creep-Rupture Curve.—Results of material tests under constant load and temperature; usually plotted as
strain versus time to rupture. A typical plot of creep-rupture data is shown below. The strain indicated in
this curve includes both initial deformation due to loading and plastic strain due to creep.

APPENDIX A - Glossary (continued)
MMPDS-05
1 April 2010
A-8
Figure A.1. Typical creep-rupture curve.
Creep-Rupture Strength.—Stress that will cause fracture in a creep test at a given time, in a specified
constant environment. Note: This is sometimes referred to as the stress-rupture strength.
Creep-Rupture Test.—A creep-rupture test is one in which progressive specimen deformation and time for
rupture are measured. In general, deformation is much larger than that developed during a creep test.
Creep-Strain.—The time-dependent part of the strain resulting from stress, excluding initial loading strain
and thermal expansion.
Creep Strength.—Stress that causes a given creep in a creep test at a given time in a specified constant
environment.
Creep Stress.—The constant load divided by the original cross-sectional area of the specimen.
Creep Test.—A creep test has the objective of measuring deformation and deformation rates at stresses
usually well below those which would result in fracture during the time of testing.
Critical Stress Intensity Factor.—A limiting value of the stress intensity factor beyond which continued
flaw propagation and/or fracture may be expected. This value is dependent on material and may vary with
type of loading and conditions of use.
Cycle.—Under constant-amplitude loading, the load varies from the minimum to the maximum and then to
the minimum load. The symbol n or N (see definition of fatigue life) is used to indicate the number of
cycles.
Deformable Shank Fasteners.—A fastener whose shank is deformed in the grip area during normal
installation processes.
Degree of Freedom.—Number of degrees of freedom for n variables may be defined as number of variables
minus number of constraints between them. Since the standard deviation calculation contains one fixed
value (the mean) it has n - 1 degrees of freedom.

APPENDIX A - Glossary (continued)
MMPDS-05
1 April 2010
* Different from ASTM.
A-9
Degrees of Freedom.—Number of independent comparisons afforded by a sample.
Discontinued Test.—See Runout.
Elapsed Time.—The time interval from application of the creep stress to a specified observation.
Fatigue.—The process of progressive localized permanent structural change occurring in a material
subjected to conditions that produce fluctuating stresses and strains at some point or points, and which may
culminate in cracks or complete fracture after a sufficient number of fluctuations. NOTE—fluctuations in
stress and in time (frequency), as in the case of “random vibration.”
Fatigue Life.—N—the number of cycles of stress or strain of a specified character that a given specimen
sustains before failure of a specified nature occurs.
Fatigue Limit.—Sf—the limiting value of the median fatigue strength as N becomes very large. NOTE—-
Certain materials and environments preclude the attainment of a fatigue limit. Values tabulated as “fatigue
limits” in the literature are frequently (but not always) values of SN for 50 percent survival at N cycles of
stress in which Sm = 0.
Fatigue Loading.—Periodic or non-periodic fluctuating loading applied to a test specimen or experienced
by a structure in service (also known as cyclic loading).
Fatigue Notch Factor*.—The fatigue notch factor, Kf (also called fatigue strength reduction factor), is the
ratio of the fatigue strength of a specimen with no stress concentration to the fatigue strength of a specimen
with a stress concentration at the same number of cycles for the same conditions. NOTE—In specifying Kf,
it is necessary to specify the geometry, mode of loading, and the values of Smax, Sm, and N for which it is
computed.
Fatigue Notch Sensitivity.—The fatigue notch sensitivity, q, is a measure of the degree of agreement
between Kf and Kt. NOTE—the definition of fatigue notch sensitivity is q = (Kf - 1)/(Kt - 1).
Heat.—All material identifiable to a single molten metal source. (All material from a heat is considered to
have the same composition. A heat may yield one or more ingots. A heat may be divided into several lots
by subsequent processing.)
Heat.—Heat is material which, in the case of batch melting, is cast at the same time from the same furnace
and is identified with the same heat number; or, in the case of continuous melting, is poured without
interruption. (See Table 9.2.4.2)
Heat.—Heat is a consolidated (vacuum hot pressed) billet having a distinct chemical composition. (See
Table 9.2.4.2)
Hysteresis Diagram.—The stress-strain path during a fatigue cycle.
Isostrain Lines.—Lines representing constant levels of creep.

APPENDIX A - Glossary (continued)
MMPDS-05
1 April 2010
* Different from ASTM.
A-10
R 'minimum load
maximum load'
Pmin
Pmax
Rσ'
Smin
Smax
Rε' ε
min/ε
max
A 'loading amplitude
mean load'
Pa
Pm
orS
a
SM
Aε'
strain amplitude
mean strain'ε
a
εM
or εmax
& εmin
/ εmax
% εmin
.
Isothermal Lines.—Lines of uniform temperature on a creep or stress-rupture curve.
Interrupted Test*.—Tests which have been stopped before failure because of some mechanical problem,
e.g., power failure, load or temperature spikes.
Loading Amplitude.—The loading amplitude, Pa, Sa, or εa represents one-half of the range of a cycle. (Also
known as alternating load, alternating stress, or alternating strain.)
Loading Strain.—Loading strain is the change in strain during the time interval from the start of loading
to the instant of full-load application, sometimes called initial strain.
Loading (Unloading) Rate.—The time rate of change in the monotonically increasing (decreasing) portion
of the load-time function.
Load Ratio.—The load ratio, R, A, or Rε, Aε, or Rσ, Aσ, is the algebraic ratio of the two loading parameters
of a cycle; the two most widely used ratios are
or
or
and
NOTE—load ratios R or Rε are generally used in MMPDS.

APPENDIX A - Glossary (continued)
MMPDS-05
1 April 2010
A-11
Pm'
Pmax
% Pmin
2, or
Sm'
Smax
% Smin
2, or
εm'ε
max% ε
min
2,
Longitudinal Direction.—Parallel to the principal direction of flow in a worked metal. For die forgings
this direction is within ±15E of the predominate grain flow.
Long-Transverse Direction.—The transverse direction having the largest dimension, often called the
“width” direction. For die forgings this direction is within ±15E of the longitudinal (predominate) grain
direction and parallel, within ±15E, to the parting plane. (Both conditions must be met.)
Lot.—All material from a heat or single molten metal source of the same product type having the same
thickness or configuration, and fabricated as a unit under the same conditions. If the material is heat
treated, a lot is the above material processed through the required heat-treating operations as a unit.
Master Creep Equation.—An equation expressing combinations of stress, temperature, time and creep, or
a set of equations expressing combinations of stress, temperature and time for given levels of creep.
Master Rupture Equation.—An equation expressing combinations of stress, temperature, and time that
cause complete separation (fracture or rupture) of the specimen.
Maximum Load.—The maximum load, Pmax, Smax, εmax is the load having the greatest algebraic value.
Mean Load.—The mean load, Pm, is the algebraic average of the maximum and minimum loads in constant-
amplitude loading:
or the integral average of the instantaneous load values.
Median Fatigue Life.—The middlemost of the observed fatigue life values (arranged in order of magni-
tude) of the individual specimens in a group tested under identical conditions. In the case where an even
number of specimens are tested, it is the average of the two middlemost values (based on log lives in
MMPDS). NOTE 1—The use of the sample median instead of the arithmetic mean (that is, the average) is
usually preferred. NOTE 2—In the literature, the abbreviated term “fatigue life” usually has meant the
median fatigue life of the group. However, when applied to a collection of data without further
qualification, the term “fatigue life” is ambiguous.
Median Fatigue Strength at N Cycles.—An estimate of the stress level at which 50 percent of the
population would survive N cycles. NOTE—The estimate of the median fatigue strength is derived from a

APPENDIX A - Glossary (continued)
MMPDS-05
1 April 2010
* Different from ASTM.
A-12
particular point of the fatigue-life distribution, since there is no test procedure by which a frequency
distribution of fatigue strengths at N cycles can be directly observed. That is, one can not perform
constant-life tests.
Melt.—Melt is a single homogeneous batch of molten metal for which all processing has been completed
and the temperature has been adjusted and made ready to pour castings. (For metal-matrix composites, the
molten metal includes unmelted reinforcements such as particles, fibers, or whiskers.) (See Table 9.1.6.2)
Minimum Load.—The minimum load, Pmin, Smin, or εmin, is the load having the least algebraic value.
Nominal Hole Diameters.—Nominal hole diameters for deformable shank fasteners shall be according to
Table 9.4.1.2(a). When tests are made with hole diameters other than those tabulated, hole sizes used shall
be noted in the report and on the proposed joint allowables table.
Nominal Shank Diameter.—Nominal shank diameter of fasteners with shank diameters equal to those used
for standard size bolts and screws (NAS 618 sizes) shall be the decimal equivalents of stated fractional or
numbered sizes. These diameters are those listed in the fourth column of Table 9.7.1.1. Nominal shank
diameters for nondeformable shank blind fasteners are listed in the fifth column of Table 9.7.1.1. Nominal
shank diameters for other fasteners shall be the average of required maximum and minimum shank
diameters.
Nondeformable Shank Fasteners.—A fastener whose shank does not deform in the grip area during normal
installation processes.
Outlier*—An experimental observation which deviates markedly from other observations in the sample.
An outlier is often either an extreme value of the variability in the data, or the result of gross deviation in
the material or experimental procedure.
Peak.—The point at which the first derivative of the load-time history changes from a positive to a negative
sign; the point of maximum load in constant-amplitude loading.
Plane Strain.—The stress state in which all strains occur only in the principal loading plane. No strains
occur out of the plane, i.e., εz = 0, and σz … 0.
Plane Stress.—The stress state in which all stresses occur only in the principal loading plane. No stresses
occur out of the plane, i.e., σz = 0, and εz … 0.
Plastic Strain During Loading.—Plastic strain during loading is the portion of the strain during loading
determined as the offset from the linear portion to the end of a stress-strain curve made during load
application.
Plane-Strain Fracture Toughness.—A generic term now generally adopted for the critical plane-strain
stress intensity factor characteristic of plane-strain fracture, symbolically denoted KIc. This is because in
current fracture testing practices, specification of the slowly increasing load test of specimen materials in
the plane-strain stress state and in opening mode (I) has been dominant.

APPENDIX A - Glossary (continued)
MMPDS-05
1 April 2010
* Different from ASTM.
A-13
Plane-Stress and Transitional Fracture Toughness.—A generic term denoting the critical stress intensity
factor associated with fracture behavior under nonplane-strain conditions. Because of plasticity effects and
stable crack growth which can be encountered prior to fracture under these conditions, designation of a
specific value is dependent on the stage of crack growth detected during testing. Residual strength or
apparent fracture toughness is a special case of plane-stress and transitional fracture toughness wherein the
reference crack length is the initial pre-existing crack length and subsequent crack growth during the test is
neglected.
Population.—All potential measurements having certain independent characteristics in common; i.e., “all
possible TUS(L) measurements for 17-7PH stainless steel sheet in TH1050 condition”.
Precision.*—The degree of mutual agreement among individual measurements. Relative to a method of
test, precision is the degree of mutual agreement among individual measurements made under prescribed
like conditions. The lack of precision in a measurement may be characterized as the standard deviation of
the errors in measurement.
Primary Creep.—Creep occurring at a diminishing rate, sometimes called initial stage of creep.
Probability.—Ratio of possible number of favorable events to total possible number of equally likely
events. For example, if a coin is tossed, the probability of heads is one-half (or 50 percent) because heads
can occur one way and the total possible events are two, either heads or tails. Similarly, the probability of
throwing a three or greater on a die is 4/6 or 66.7 percent. Probability, as related to design allowables,
means that chances of a material-property measurement equaling or exceeding a certain value (the one-
sided lower tolerance limit) is 99 percent in the case of a A-basis value and 90 percent in the case of a B-
basis value.
Range.—Range, ∆P, Sr, ∆ε, εr, ∆σ is the algebraic difference between successive valley and peak loads
(positive range or increasing load range) or between successive peak and valley loads (negative range or
decreasing load range), see Figure 9.3.4.3. In constant-amplitude loading, for example, the range is given
by ∆P = Pmax - Pmin.
Rate of Creep.—The slope of the creep-time curve at a given time determined from a Cartesian plot.
Residual.*—The difference between the observed fatigue (log) life and the fatigue (log) life estimated from
the fatigue model at a particular stress/strain level.
Runout.*—A test that has been terminated prior to failure. Runout tests are usually stopped at an arbitrary
life value because of time and economic considerations. NOTE—Runout tests are useful for estimating a
pseudo-fatigue-limit for a fatigue data sample.
Sample.—A finite number of observations drawn from the population.
Sample.—The number of specimens selected from a population for test purposes. NOTE—The method of
selecting the sample determines the population about which statistical inferences or generalization can be
made.

APPENDIX A - Glossary (continued)
MMPDS-05
1 April 2010
* Different from ASTM.
A-14
TUS 'TUS
1% TUS
2% ... % TUS
n
n'
jn
i'1(TUS
i)
n
S2
TUS '
jn
i'1
TUSi& TUS
2
n & 1'
njn
i'1
(TUSi)2 & j
n
i'1
TUSi
2
n(n & 1)
Sample Average (Arithmetic Mean).—The sum of all the observed values in a sample divided by the
sample size (number). It is a point estimate of the population mean.
Sample Mean.—Average of all observed values in the sample. It is an estimate of population mean. A
mean is indicated by a bar over the symbol for the value observed. Thus, the mean of n observations of
TUS would be expressed as:
Sample Median.—Value of the middle-most observation. If the sample is nearly normally distributed, the
sample median is also an estimate of the population mean.
Sample Median.—The middle value when all observed values in a sample are arranged in order of
magnitude if an odd number of samples are tested. If the sample size is even, it is the average of the two
middlemost values. It is a point estimate of the population median, or 50 percentile point.
Sample Point Deviation.—The difference between an observed value and the sample mean.
Sample Standard Deviation.*—The standard deviation of the sample, s, is the square root of the sample
variance. It is a point estimate of the standard deviation of a population, a measure of the "spread" of the
frequency distribution of a population. NOTE—This value of s provides a statistic that is used in
computing interval estimates and several test statistics.
Sample Variance.*—Sample variance, s2, is the sum of the squares of the differences between each
observed value and the sample average divided by the sample size minus one. It is a point estimate of the
population variance. NOTE—This value of s2 provides both an unbiased point estimate of the population
variance and a statistic that is used on computing the interval estimates and several test statistics. Some
texts define s2 as “the sum of the squared differences between each observed value and the sample average
divided by the sample size”, however, this statistic underestimates the population variance, particularly for
small sample sizes.
Sample Variance.—The sum of the squared deviations, divided by n - 1, and, based on n observations of
TUS, expressed as
S-Basis.—The S-value is the minimum property value specified by the governing industry specification (as
issued by standardization groups such as SAE Aerospace Materials Division, ASTM, etc.) or federal or
military standards for the material. (See MIL-STD-970 for order of preference for specifications.) For cer-

APPENDIX A - Glossary (continued)
MMPDS-05
1 April 2010
* This is appropriate, since a confidence level of 1 - α = 0.95 is used in establishing A and B-values.
** Different from ASTM.
A-15
STUS
'
jn
i'1
TUSi& TUS
2
n & 1'
njn
i'1
TUSi
2 & jn
i'1
TUSi
2
n(n & 1)
tain products heat treated by the user (for example, steels hardened and tempered to a designated Ftu), the
S-value may reflect a specified quality-control requirement. Statistical assurance associated with this value
is not known.
Secondary Creep.—Creep occurring at a constant rate, sometimes called second stage creep.
Short-Transverse Direction.—The transverse direction having the smallest dimension, often called the
“thickness” direction. For die forgings this direction is within ±15E of the longitudinal (predominate) grain
direction and perpendicular, within ±15E, to the parting plane. (Both conditions must be met.) When
possible, short transverse specimens shall be taken across the parting plane.
Significance Level (As Used Here).—Risk of concluding that two samples were drawn from different
populations when, in fact, they were drawn from the same population. A significance level of α = 0.05 is
employed through these Guidelines.*
Significance Level.—The stated probability (risk) that a given test of significance will reject the hypothesis
that a specified effect is absent when the hypothesis is true.
Significant (Statistically Significant).—An effect or difference between populations is said to be present if
the value of a test statistic is significant, that is, lies outside of predetermined limits. NOTE—An effect that
is statistically significant may not have engineering importance.
S/N Curve for 50 Percent Survival.**—A curve fitted to the median values of fatigue life at each of several
stress levels. It is an estimate of the relationship between applied stress and the number of cycles-to-failure
that 50 percent of the population would survive. NOTE 1—This is a special case of the more general
definition of S/N curve for P percent survival. NOTE 2—In the literature, the abbreviated term “S/N
Curve” usually has meant either the S/N curve drawn through the mean (averages) or through the medians
(50 percent values) for the fatigue life values. Since the term “S/N Curve” is ambiguous, it should be used
only when described appropriately. NOTE 3—Mean S/N curves (based on log lives) are shown in
MMPDS.
S/N Diagram.—A plot of stress against the number of cycles to failure. The stress can be Smax, Smin, or Sa.
The diagram indicates the S/N relationship for a specified value of Sm, A, or R and a specified probability
of survival. Typically, for N, a log scale (base 10) is used. Generally, for S, a linear scale is used, but a log
scale is used occasionally. NOTE—Smax-versus-log N diagrams are used commonly in MMPDS.
Standard Deviation.—An estimate of the population standard deviation; the square root of the variance, or

APPENDIX A - Glossary (continued)
MMPDS-05
1 April 2010
* Different from ASTM.
A-16
K ' f a Y, ksi & in.1/2
Stress Intensity Factor.—A physical quantity describing the severity of a flaw in the stress field of a loaded
structural element. The gross stress in the material and flaw size are characterized parametrically by the
stress intensity factor,
Stress-Rupture Test—A stress-rupture test is one in which time for rupture is measured, no deformation
measurement being made during the test.
Tertiary Creep.—Creep occurring at an accelerating rate, sometimes called third stage creep.
Theoretical Stress Concentration Factor (or Stress Concentration Factor).—This factor, Kt, is the ratio of
the nominal stress to the greatest stress in the region of a notch (or other stress concentrator) as determined
by the theory of elasticity (or by experimental procedures that give equivalent values). NOTE—The theory
of plasticity should not be used to determine Kt.
Tolerance Interval.—An interval computed so that it will include at least a stated percentage of the
population with a stated probability.
Tolerance Level.—The stated probability that the tolerance interval includes at least the stated percentage
of the population. It is not the same as a confidence level, but the term confidence level is frequently
associated with tolerance intervals.
Tolerance Limits.—The two statistics that define a tolerance interval. (One value may be “minus infinity”
or “plus infinity”.)
Total Plastic Strain.—Total plastic strain at a specified time is equal to the sum of plastic strain during
loading plus creep.
Total Strain.—Total strain at any given time, including initial loading strain (which may include plastic
strain in addition to elastic strain) and creep strain, but not including thermal expansion.
Transition Fatigue Life.*—The point on a strain-life diagram where the elastic and plastic strains are equal.
Transverse Direction.—Perpendicular to the principal direction of flow in a worked metal; may be defined
as T, LT or ST.
Typical Basis.—A typical property value is an average value and has no statistical assurance associated
with it.
UPC - Upper confidence bound of dataset.
Waveform.—The shape of the peak-to-peak variation of a controlled mechanical test variable (for example,
load, strain, displacement) as a function of time.

APPENDIX A - Glossary (continued)
MMPDS-05
1 April 2010
A-17
ksi in. Megapascal meter
(MPa @ m ½ )d
A.4 Conversion of U.S. Units of Measure Used in MMPDS to SI Units
Quantity or
Property
To Convert From
U. S. Unit
Multiply
bya SI Unitb
Area in.2 645.16c Millimeter2 (mm2)
Force lb 4.4482 Newton (N)
Length in. 25.4c Millimeter (mm)
Stress ksi 6.895 Megapascal (MPa)d
Stress intensity factor 1.0989
Modulus 103 ksi 6.895 Gigapascal (GPa)d
Temperature EF F + 459.67
1.8
Kelvin (K)
Density (ω) lb/in.3 27.680 Megagram/meter3
(Mg/m3)
Specific heat (C) Btu/lb@F
(or Btu@lb-1@F-1)
4.1868c Joule/(gram@Kelvin)
(J/g@K) or (J@g-1 @K-1)
Thermal
conductivity (K)
Btu/[(hr)(ft2)(F)/ft]
(or Btu@hr-1@ft-2@F-1@ft)
1.7307 Watt/(meter@Kelvin)
W/(m@K) or (W@m-1@K-1)
Thermal
expansion (α)
in./in./F
(or [email protected]@F-1)
1.8 Meter/meter/Kelvin
m/(m@K) or (m@m-1@K-1)
a Conversion factors to give significant figures are as specified in ASTM E 380, NASA SP-7012, second revision. NBS Special
Publication 330, and Metals Engineering Quarterly. Note: Multiple conversions between U.S. and SI units should be avoided
because significant round-off errors may result.
b Prefix Multiple Prefix Multiple
giga (G) 109 milli (m) 10-3
mega (M) 106 micro (µ) 10-6
kilo (k) 103
c Conversion factor is exact.
d One Pascal (Pa) = one Newton/meter2.

APPENDIX A - Glossary (continued)
MMPDS-05
1 April 2010
A-18
This page is intentionally blank.

APPENDIX B
MMPDS-05
1 April 2010
B-1Key: Underline indicates inactive for new design.
B.0 Alloy Index
Alloy Name Form/Application Specification Section
188 Bar and Forging AMS 5772 6.4.2
188 Sheet and Plate AMS 5608 6.4.2
230 Bar and Forging AMS 5891 6.3.9
230 Plate, Sheet and Strip AMS 5878 6.3.9
250 Bar AMS 6512 2.5.1
250 Sheet and Plate AMS 6520 2.5.1
354 Casting AMS-A-21180 3.9.1
355 Permanent Mold Casting AMS 4281 3.9.2
356 Investment Casting AMS 4260 3.9.4
356 Permanent Mold Casting AMS 4284 3.9.4
356 Sand Casting AMS 4217 3.9.4
359 Casting AMS-A-21180 3.9.8
2013 Extrusion AMS 4326 3.2.1
2014 Bar and Rod, Rolled or Cold Finished AMS 4121 3.2.2
2014 Bare Sheet and Plate AMS 4028 3.2.2
2014 Bare Sheet and Plate AMS 4029 3.2.2
2014 Clad Sheet and Plate AMS-QQ-A-250/3 3.2.2
2014 Extruded Bar, Rod and Shapes AMS-QQ-A-200/2 3.2.2
2014 Extrusion AMS 4153 3.2.2
2014 Forging AMS 4133 3.2.2
2014 Forging AMS-A-22771 3.2.2
2014 Forging AMS-QQ-A-367 3.2.2
2014 Rolled or Drawn Bar, Rod and Shapes AMS-QQ-A-225/4 3.2.2
2017 Bar and Rod, Rolled or Cold-Finished AMS 4118 3.2.3
2017 Rolled Bar and Rod AMS-QQ-A-225/5 3.2.3
2024 Bar and Rod, Rolled or Cold-Finished AMS 4120 3.2.4
2024 Bare Sheet and Plate AMS 4035 3.2.4
2024 Bare Sheet and Plate AMS 4037 3.2.4
2024 Bare Sheet and Plate AMS-QQ-A-250/4 3.2.4
2024 Clad Sheet and Plate AMS-QQ-A-250/5 3.2.4
2024 Extruded Bar, Rod and Shapes AMS-QQ-A-200/3 3.2.4
2024 Extrusion AMS 4152 3.2.4
2024 Extrusion AMS 4164 3.2.4
2024 Extrusion AMS 4165 3.2.4
2024 Rolled or Drawn Bar, Rod and Wire AMS-QQ-A-225/6 3.2.4
2024 Tubing AMS-WW-T-700/3 3.2.4
2024 Tubing, Hydraulic, Seamless, Drawn AMS 4086 3.2.4
2025 Die Forging AMS 4130 3.2.5
2026 Bars, Rods, and Profiles AMS 4338 3.2.6
2027 Plate AMS 4213 3.2.7
2050 Plate AMS 4413 3.2.8
2056 Clad Sheet AMS 4298 3.2.9
2090 Sheet AMS 4251 3.2.10
2098 Plate AMS 4327 3.2.11
2098 Sheet AMS 4457 3.2.11
2099 Extrusion AMS 4287 3.2.12

APPENDIX B
MMPDS-05
1 April 2010
Alloy Name Form/Application Specification Section
B-2Key: Underline indicates inactive for new design.
2124 Plate AMS 4101 3.2.13
2124 Plate AMS-QQ-A-250/29 3.2.13
2219 Extrusion AMS 4162 3.2.14
2219 Extrusion AMS 4163 3.2.14
2219 Hand Forging AMS 4144 3.2.14
2219 Sheet and Plate AMS 4031 3.2.14
2219 Sheet and Plate AMS-QQ-A-250/30 3.2.14
2297 Plate AMS 4330 3.2.15
2397 Plate AMS 4328 3.2.16
2519 Plate MIL-DTL-46192 3.2.18
2618 Die and Hand Forgings AMS 4132 3.2.20
2618 Die Forging AMS-A-22771 3.2.20
2618 Forging AMS-QQ-A-367 3.2.20
4130 Bar AMS 6346 2.3.1
4130 Bar AMS 6346 2.3.1
4130 Bar and Forging AMS 6348 2.3.1
4130 Bar and Forging AMS 6370 2.3.1
4130 Bar and Forging AMS 6528 2.3.1
4130 Bar and Forging AMS-S-6758 2.3.1
4130 Sheet, Strip and Plate AMS 6345 2.3.1
4130 Sheet, Strip and Plate AMS 6350 2.3.1
4130 Sheet, Strip and Plate AMS 6351 2.3.1
4130 Tubing AMS 6361 2.3.1
4130 Tubing AMS 6362 2.3.1
4130 Tubing AMS 6371 2.3.1
4130 Tubing AMS 6373 2.3.1
4130 Tubing AMS 6374 2.3.1
4130 Tubing (normalized) AMS 6360 2.3.1
4130 Welding Wire AMS 6457 8.2.2
4135 Sheet, Strip and Plate AMS 6352 2.3.1
4135 Tubing AMS 6365 2.3.1
4135 Tubing AMS 6372 2.3.1
4140 Bar and Forging AMS 6349 2.3.1
4140 Bar and Forging AMS 6382 2.3.1
4140 Bar and Forging AMS 6529 2.3.1
4140 Sheet, Strip and Plate AMS 6395 2.3.1
4140 Tubing AMS 6381 2.3.1
4140 Welding Wire AMS 6452 8.2.2
4340 Bar and Forging AMS 6414 2.3.1
4340 Bar and Forging AMS 6415 2.3.1
4340 Bar and Forging AMS-S-5000 2.3.1
4340 Sheet, Strip and Plate AMS 6359 2.3.1
4340 Sheet, Strip and Plate AMS 6454 2.3.1
4340 Tubing AMS 6414 2.3.1
4340 Tubing AMS 6415 2.3.1
5052 Sheet and Plate AMS 4015 3.5.1
5052 Sheet and Plate AMS 4016 3.5.1
5052 Sheet and Plate AMS 4017 3.5.1
APPENDIX B
MMPDS-05
1 April 2010
Alloy Name Form/Application Specification Section
B-3Key: Underline indicates inactive for new design.
5052 Sheet and Plate AMS-QQ-A-250/8 3.5.1
5083 Bare Sheet and Plate AMS 4056 3.5.2
5083 Bare Sheet and Plate AMS-QQ-A-250/6 3.5.2
5083 Bare Sheet and Plate ASTM B 928 3.5.2
5083 Extruded Bar, Rod and Shapes AMS-QQ-A-200/4 3.5.2
5086 Extruded Bar, Rod and Shapes AMS-QQ-A-200/5 3.5.3
5086 Sheet and Plate ASTM B209 3.5.3
5454 Extruded Bar, Rod and Shapes AMS-QQ-A-200/6 3.5.4
5454 Sheet and Plate AMS-QQ-A-250/10 3.5.4
5456 Extruded Bar, Rod and Shapes AMS-QQ-A-200/7 3.5.5
5456 Sheet and Plate AMS-QQ-A-250/9 3.5.5
5456 Sheet and Plate ASTM B 928 3.5.5
12.5Cr-1.0Ni-15.5Co-
2.0Mo
Bar and Forging AMS 5933 2.6.11
6061 Bar and Rod, Cold Finished AMS 4116 3.6.2
6061 Bar and Rod, Rolled or Cold Finished AMS 4115 3.6.2
6061 Bar and Rod, Rolled or Cold Finished AMS 4117 3.6.2
6061 Bar and Rod, Rolled or Cold Finished AMS 4128 3.6.2
6061 Extruded Rod, Bar Shapes and Tubing AMS-QQ-A-200/8 3.6.2
6061 Extruded Rod, Bars, and Shapes AMS 4150 3.6.2
6061 Extruded Rod, Bars, and Shapes AMS 4173 3.6.2
6061 Extrusion AMS 4160 3.6.2
6061 Extrusion AMS 4161 3.6.2
6061 Extrusion AMS 4172 3.6.2
6061 Forging AMS 4127 3.6.2
6061 Forging AMS-A-22771 3.6.2
6061 Forging AMS-QQ-A-367 3.6.2
6061 Hand Forging AMS 4248 3.6.2
6061 Rolled Bar, Rod and Shapes AMS-QQ-A-225/8 3.6.2
6061 Sheet and Plate AMS 4025 3.6.2
6061 Sheet and Plate AMS 4026 3.6.2
6061 Sheet and Plate AMS 4027 3.6.2
6061 Tubing Seamless, Drawn AMS 4080 3.6.2
6061 Tubing Seamless, Drawn AMS 4081 3.6.2
6061 Tubing Seamless, Drawn AMS 4082 3.6.2
6061 Tubing Seamless, Drawn AMS 4083 3.6.2
6061 Tubing Seamless, Drawn AMS-WW-T-700/6 3.6.2
6151 Die Forging AMS 4125 3.6.3
6151 Forging AMS-A-22771 3.6.3
6156 Clad Sheet AMS 4405 3.6.4
7010 Plate AMS 4204 3.7.1
7010 Plate AMS 4205 3.7.1
7040 Plate AMS 4211 3.7.2
7049 Extrusion AMS 4157 3.7.3
7049 Forging AMS 4111 3.7.3
7049 Forging AMS-QQ-A-367 3.7.3
7049 Plate AMS 4200 3.7.3
7050 Bare Plate AMS 4050 3.7.4

APPENDIX B
MMPDS-05
1 April 2010
Alloy Name Form/Application Specification Section
B-4Key: Underline indicates inactive for new design.
7050 Bare Plate AMS 4201 3.7.4
7050 Die Forging AMS 4107 3.7.4
7050 Die Forging AMS 4333 3.7.4
7050 Extruded Shape AMS 4340 3.7.4
7050 Extruded Shape AMS 4341 3.7.4
7050 Extruded Shape AMS 4342 3.7.4
7050 Forging AMS-A-22771 3.7.4
7050 Hand Forging AMS 4108 3.7.4
7055 Extrusion AMS 4324 3.7.5
7055 Extrusion AMS 4336 3.7.5
7055 Extrusion AMS 4337 3.7.5
7055 Plate AMS 4206 3.7.5
7055 Sheet AMS 4267 3.7.5
7056 Plate AMS 4407 3.7.6
7068 Extrusion AMS 4331 3.7.7
7075 Bar and Rod, Rolled or Cold Finished AMS 4122 3.7.8
7075 Bar and Rod, Rolled or Cold Finished AMS 4123 3.7.8
7075 Bar and Rod, Rolled or Cold Finished AMS 4124 3.7.8
7075 Bar and Rod, Rolled or Cold Finished AMS 4186 3.7.8
7075 Bare Plate AMS 4078 3.7.8
7075 Bare Sheet and Plate AMS 4044 3.7.8
7075 Bare Sheet and Plate AMS 4045 3.7.8
7075 Bare Sheet and Plate AMS-QQ-A-250/12, 24 3.7.8
7075 Clad Sheet and Plate AMS 4049 3.7.8
7075 Clad Sheet and Plate AMS-QQ-A-250/13, 25 3.7.8
7075 Die Forging AMS 4141 3.7.8
7075 Extruded Bar, Rod and Shapes AMS-QQ-A-200/11, 15 3.7.8
7075 Extrusion AMS 4166 3.7.8
7075 Extrusion AMS 4167 3.7.8
7075 Forging AMS 4126 3.7.8
7075 Forging AMS 4147 3.7.8
7075 Forging AMS-A-22771 3.7.8
7075 Forging AMS-QQ-A-367 3.7.8
7075 Rolled or Drawn Bar and Rod AMS-QQ-A-225/9 3.7.8
7085 Plate AMS 4329 3.7.9
7085 Die Forging AMS 4403 3.7.9
7085 Hand Forging AMS 4414 3.7.9
7140 Plate AMS 4401 3.7.10
7140 Plate AMS 4408 3.7.10
7149 Extrusion AMS 4343 3.7.3
7149 Forging AMS 4320 3.7.3
7150 Bare Plate AMS 4306 (T6151) 3.7.11
7150 Extrusion AMS 4307 (T61511) 3.7.11
7150 Extrusion AMS 4345 (T77511) 3.7.11
7150 Plate AMS 4252 (T7751) 3.7.11
7175 Die and Hand Forging AMS 4149 (T74) 3.7.12
7175 Die Forging AMS 4148 (T66) 3.7.12
7175 Extrusion AMS 4344 (T73511) 3.7.12

APPENDIX B
MMPDS-05
1 April 2010
Alloy Name Form/Application Specification Section
B-5Key: Underline indicates inactive for new design.
7175 Forging AMS-A-22771 3.7.12
7175 Hand Forging AMS 4179 (T7452) 3.7.12
7249 Extrusion AMS 4293 3.7.13
7249 Hand Forging AMS 4334 3.7.13
7349 Extrusion AMS 4332 3.7.14
7449 Plate AMS 4250 3.7.15
7449 Plate AMS 4299 3.7.15
7449 Extruded Profile AMS 4305 3.7.15
7475 Bare Plate AMS 4089 (T7651) 3.7.16
7475 Bare Plate AMS 4090 (T651) 3.7.16
7475 Bare Plate AMS 4202 (T7351) 3.7.16
7475 Bare Sheet AMS 4084 (T61) 3.7.16
7475 Bare Sheet AMS 4085 (T761) 3.7.16
7475 Clad Sheet AMS 4100 (T761) 3.7.16
7475 Clad Sheet AMS 4207 (T61) 3.7.16
8630 Bar and Forging AMS 6280 2.3.1
8630 Bar and Forging MIL-S-6050 2.3.1
8630 Tubing AMS 6281 2.3.1
8630 Tubing AMS 6355 2.3.1
8735 Bar and Forging AMS 6320 2.3.1
8735 Sheet, Strip and Plate AMS 6357 2.3.1
8735 Tubing AMS 6282 2.3.1
8740 Bar and Forging AMS 6322 2.3.1
8740 Bar and Forging AMS 6327 2.3.1
8740 Sheet, Strip and Plate AMS 6358 2.3.1
8740 Tubing AMS 6323 2.3.1
15-5PH Bar, Forging, Ring and Extrusion (CEVM) AMS 5659 2.6.7
15-5PH Investment Casting AMS 5400 2.6.7
15-5PH Sheet, Strip and Plate (CEVM) AMS 5862 2.6.7
17-4PH Bar, Forging and Ring AMS 5643 2.6.9
17-4PH Investment Casting (H1000) AMS 5343 2.6.9
17-4PH Investment Casting (H1100) AMS 5342 2.6.9
17-4PH Investment Casting (H900) AMS 5344 2.6.9
17-4PH Sheet, Strip and Plate AMS 5604 2.6.9
17-7PH Plate, Sheet and Strip AMS 5528 2.6.10
2024-T3 ARAMID
Fiber Reinforced
Sheet Laminate AMS 4254 7.5.1
2424 (Bare) Sheet AMS 4273 3.2.17
2424 (Clad) Sheet AMS 4270 3.2.17
2524 (T3) Sheet and Plate AMS 4296 3.2.19
280 (300) Bar AMS 6514 2.5.1
300M (0.42C) Bar and Forging AMS 6257 2.3.1
300M (0.42C) Bar and Forging AMS 6419 2.3.1
300M (0.42C) Tubing AMS 6257 2.3.1
300M (0.42C) Tubing AMS 6419 2.3.1
300M (0.4C) Bar and Forging AMS 6417 2.3.1
300M (0.4C) Tubing AMS 6417 2.3.1
4330V Bar and Forging AMS 6411 2.3.1

APPENDIX B
MMPDS-05
1 April 2010
Alloy Name Form/Application Specification Section
B-6Key: Underline indicates inactive for new design.
4330V Bar and Forging AMS 6427 2.3.1
4330V Tubing AMS 6411 2.3.1
4330V Tubing AMS 6427 2.3.1
4330V Bar and Forging AMS 6340 2.3.1
4330V Tubing AMS 6340 2.3.1
4335V Bar and Forging AMS 6429 2.3.1
4335V Bar and Forging AMS 6430 2.3.1
4335V Sheet, Strip and Plate AMS 6433 2.3.1
4335V Sheet, Strip and Plate AMS 6435 2.3.1
4335V Tubing AMS 6429 2.3.1
4335V Tubing AMS 6430 2.3.1
5Cr-Mo-V Bar and Forging (CEVM) AMS 6487 2.4.1
5Cr-Mo-V Sheet, Strip and Plate AMS 6437 2.4.1
6013 (T4) Sheet AMS 4216 3.6.1
6013 (T6) Sheet AMS 4347 3.6.1
7049/7149 Forging AMS-A-22771 3.7.3
7049/7149 Forging AMS-QQ-A-367 3.7.3
7475-T761 ARAMID
Fiber Reinforced
Sheet Laminate AMS 4302 7.5.2
9Ni-4Co-0.20C Sheet, Strip and Plate AMS 6523 2.4.2
9Ni-4Co-0.30C Bar and Forging, Tubing AMS 6526 2.4.3
A201.0 Casting (T7 Temper) AMS-A-21180 3.8.1
A-286 Bar, Forging and Tubing AMS 5734 6.2.1
A-286 Bar, Forging and Tubing AMS 5737 6.2.1
A-286 Bar, Forging, Tubing and Ring AMS 5731 6.2.1
A-286 Bar, Forging, Tubing and Ring AMS 5732 6.2.1
A-286 Sheet, Strip and Plate AMS 5525 6.2.1
A356.0 Casting AMS 4218 3.9.5
A356.0 Casting AMS-A-21180 3.9.5
A357.0 Casting AMS 4219 3.9.6
A357.0 Casting AMS-A-21180 3.9.6
AerMet 100 Bar and Forging AMS 6532 2.5.3
AF1410 Bar and Forging AMS 6527 2.5.2
AISI 1025 Bar ASTM A 108 2.2.1
AISI 1025 Sheet, Strip, and Plate AMS 5046 2.2.1
AISI 1025 - N Seamless Tubing AMS 5075 2.2.1
AISI 1025 - N Tubing AMS 5077 2.2.1
AISI 1025 - N Tubing AMS-T-5066 2.2.1
AISI 301 Plate, Sheet and Strip AMS 5901 2.7.1
AISI 301 Sheet and Strip (125 ksi) AMS 5517 2.7.1
AISI 301 Sheet and Strip (150 ksi) AMS 5518 2.7.1
AISI 301 Sheet and Strip (175 ksi) AMS 5902 2.7.1
AISI 301 Sheet and Strip (185 ksi) AMS 5519 2.7.1
AISI 301 Sheet, Strip and Plate AMS 5513 2.7.1
AISI 302 Sheet and Strip (125 ksi) AMS 5903 2.7.1
AISI 302 Sheet and Strip (150 ksi) AMS 5904 2.7.1
AISI 302 Sheet and Strip (175 ksi) AMS 5905 2.7.1
AISI 302 Sheet and Strip (185 ksi) AMS 5906 2.7.1

APPENDIX B
MMPDS-05
1 April 2010
Alloy Name Form/Application Specification Section
B-7Key: Underline indicates inactive for new design.
AISI 302 Sheet, Strip and Plate AMS 5516 2.7.1
AISI 304 Sheet and Strip (150 ksi) AMS 5911 2.7.1
AISI 304 Sheet and Strip (175 ksi) AMS 5912 2.7.1
AISI 304 Sheet and Strip (185 ksi) AMS 5913 2.7.1
AISI 304 Sheet, Strip and Plate (125 ksi) AMS 5910 2.7.1
AISI 316 Sheet, Strip and Plate AMS 5524 2.7.1
AISI 316 Sheet, Strip and Plate (125 ksi) AMS 5907 2.7.1
AM100A Investment Casting AMS 4455 4.3.1
AM100A Permanent Mold Casting AMS 4483 4.3.1
AM-350 Sheet and Strip AMS 5548 2.6.1
AM-355 Bar, Forging and Forging Stock AMS 5743 2.6.2
AM-355 Plate AMS 5549 2.6.2
AM-355 Sheet and Strip AMS 5547 2.6.2
AZ31B Extrusion ASTM B 107 4.2.1
AZ31B Forging ASTM B 91 4.2.1
AZ31B Plate AMS 4376 4.2.1
AZ31B Sheet and Plate AMS 4375 4.2.1
AZ31B Sheet and Plate AMS 4377 4.2.1
AZ61A Extrusion AMS 4350 4.2.2
AZ61A Forging ASTM B 91 4.2.2
AZ91C/AZ91E Investment Casting AMS 4452 4.3.2
AZ91C/AZ91E Sand Casting AMS 4437 4.3.2
AZ91C/AZ91E Sand Casting AMS 4446 4.3.2
AZ92A Investment Casting AMS 4453 4.3.3
AZ92A Permanent Mold Casting AMS 4484 4.3.3
AZ92A Sand Casting AMS 4434 4.3.3
Beryllium, Standard
Grade
Bar, Rod, Tubing and Machined Shapes AMS 7906 7.2.1
Beryllium, Standard
Grade
Sheet and Plate AMS 7902 7.2.1
Blind Fastener Flush Head MS21140 8.1.3
Blind Fastener Flush Head MS90353 8.1.3
Blind Fastener Protruding Head NASM20600 8.1.3
Blind Fastener Flush Head NASM20601 8.1.3
Blind Fastener Flush Head NAS1379 8.1.3
Blind Fastener Protruding Head NAS1398 8.1.3
Blind Fastener Flush Head NAS1399 8.1.3
Blind Fastener Protruding Head NAS1720 8.1.3
Blind Fastener Flush Head NAS1721 8.1.3
Blind Fastener Protruding Head NAS1738 8.1.3
Blind Fastener Flush Head NAS1739 8.1.3
Blind Fastener Flush Head NAS1921 8.1.3
Blind Fastener Flush Head NAS1670-L 8.1.3
Blind Fastener Flush Head NAS1674-L 8.1.3
Blind Fastener Flush Head NASM21140 8.1.3
Blind Fastener Flush Head NASM90353 8.1.3
C355.0 Casting AMS-A-21180 3.9.3
Copper Beryllium Bar and Rod (TD04) AMS 4651 7.3.2
Copper Beryllium Bar and Rod (TF00) AMS 4533 7.3.2

APPENDIX B
MMPDS-05
1 April 2010
Alloy Name Form/Application Specification Section
B-8Key: Underline indicates inactive for new design.
Copper Beryllium Bar and Rod (TH04) AMS 4534 7.3.2
Copper Beryllium Bar, Rod, Shapes and Forging (TB00) AMS 4650 7.3.2
Copper Beryllium Mechanical tubing (TF00) AMS 4535 7.3.2
Copper Beryllium Sheet (TB00, TD01, TD02, TD04) ASTM B 194 7.3.2
Copper Beryllium Strip (TB00) AMS 4530 7.3.2
Copper Beryllium Strip (TD02) AMS 4532 7.3.2
Copper-Nickel-Tin Bar, Rod, Tubes (TX 00) AMS 4596 7.3.3
Copper-Nickel-Tin Bar and Rod (TX TS) AMS 4597 7.3.3
CP Titanium Bar AMS 4921 5.2.1
CP Titanium Extruded Bars and Shapes AMS-T-81556 5.2.1
CP Titanium Sheet, Strip and Plate AMS 4900 5.2.1
CP Titanium Sheet, Strip and Plate AMS 4901 5.2.1
CP Titanium Sheet, Strip and Plate AMS 4902 5.2.1
CP Titanium Sheet, Strip and Plate AMS 4940 5.2.1
Custom 450 Bar, Forging, Tubing, Wire and Ring (air melted) AMS 5763 2.6.3
Custom 450 Bar, Forging, Tubing, Wire and Ring (CEM) AMS 5773 2.6.3
Custom 455 Bar and Forging AMS 5617 2.6.4
Custom 455 Tubing (welded) AMS 5578 2.6.4
Custom 465 Bar, Wires and Forgings AMS 5936 2.6.5
D357.0 Sand Composite Casting AMS 4241 3.9.7
D6AC Bar and Forging AMS 6431 2.3.1
D6AC Bar and Forging AMS 6439 2.3.1
D6AC Sheet, Strip and Plate AMS 6439 2.3.1
D6AC Tubing AMS 6431 2.3.1
E357.0 Casting AMS 4288 3.9.7
EZ33A Sand Casting AMS 4442 4.3.5
F357.0 Casting AMS 4289 3.9.6
Ferrium S53 Bar AMS 5922 2.5.4
Hastelloy X Bar and Forging AMS 5754 6.3.1
Hastelloy X Sheet and Plate AMS 5536 6.3.1
HR-120 Sheet, Strip and Plate AMS 5916 6.3.10
HSL180 Bar and Forging AMS 5933 2.6.11
Hy-Tuf Bar and Forging AMS 6425 2.3.1
Hy-Tuf Tubing AMS 6425 2.3.1
Inconel Alloy 600 Bar and Rod ASTM B 166 6.3.2
Inconel Alloy 600 Forging ASTM B 564 6.3.2
Inconel Alloy 600 Plate, Sheet and Strip AMS 5540 6.3.2
Inconel Alloy 600 Tubing, Seamless AMS 5580 6.3.2
Inconel Alloy 625 Bar, Forging and Ring AMS 5666 6.3.3
Inconel Alloy 625 Sheet, Strip and Plate AMS 5599 6.3.3
Inconel Alloy 706 Bar, Forging and Ring AMS 5701 6.3.4
Inconel Alloy 706 Bar, Forging and Ring AMS 5702 6.3.4
Inconel Alloy 706 Bar, Forging and Ring AMS 5703 6.3.4
Inconel Alloy 706 Sheet, Strip and Plate AMS 5605 6.3.4
Inconel Alloy 706 Sheet, Strip and Plate AMS 5606 6.3.4
Inconel Alloy 718 Bar and Forging; Creep Rupture AMS 5662 6.3.5
Inconel Alloy 718 Bar and Forging; Creep Rupture AMS 5663 6.3.5
Inconel Alloy 718 Bar and Forging; Short-Time AMS 5664 6.3.5

APPENDIX B
MMPDS-05
1 April 2010
Alloy Name Form/Application Specification Section
B-9Key: Underline indicates inactive for new design.
Inconel Alloy 718 Investment Casting AMS 5383 6.3.5
Inconel Alloy 718 Sheet, Strip and Plate; Creep Rupture AMS 5596 6.3.5
Inconel Alloy 718 Sheet, Strip and Plate; Short-Time AMS 5597 6.3.5
Inconel Alloy 718 Tubing; Creep Rupture AMS 5589 6.3.5
Inconel Alloy 718 Tubing; Short-Time AMS 5590 6.3.5
Inconel Alloy X-750 Bar and Forging; Equalized AMS 5667 6.3.6
Inconel Alloy X-750 Sheet, Strip and Plate; Annealed AMS 5542 6.3.6
L-605 Bar and Forging AMS 5759 6.4.1
L-605 Sheet AMS 5537 6.4.1
Manganese Bronzes Casting AMS 4860 7.3.1
Manganese Bronzes Casting AMS 4862 7.3.1
MP159 Alloy Bar (solution treated and cold drawn) AMS 5842 7.4.2
MP159 Alloy Bar (solution treated, cold drawn and aged) AMS 5843 7.4.2
MP35N Alloy Bar (solution treated and cold drawn) AMS 5844 7.4.1
MP35N Alloy Bar (solution treated, cold drawn and aged) AMS 5845 7.4.1
N-155 Bar and Forging AMS 5768 6.2.2
N-155 Bar and Forging AMS 5769 6.2.2
N-155 Sheet AMS 5532 6.2.2
N-155 Tubing (welded) AMS 5585 6.2.2
PH13-8Mo Bar, Forging, Ring and Extrusion (VIM+CEVM) AMS 5629 2.6.6
PH13-8Mo Bar, Forging, Ring and Extrusion (Extra-Tough) AMS 5934 2.6.6
PH15-7Mo Plate, Sheet and Strip AMS 5520 2.6.8
QE22A Magnesium Sand Casting AMS 4418 4.3.6
Renéé 41 Bar and Forging AMS 5713 6.3.7
Renéé 41 Plate, Sheet and Strip AMS 5545 6.3.7
Renéé 41 - STA Bar and Forging AMS 5712 6.3.7
Steels Welding Electrode MIL-E-22200/10 8.2.2
Solid Rivet Protruding Head NAS1198 8.1.2
Solid Rivet Flush Head NASM14218 8.1.2
Solid Rivet Flush Head NASM14219 8.1.2
Solid Rivet Flush Head NASM20426 8.1.2
Solid Rivet Flush Head NASM20427 8.1.2
Solid Rivet Flush Head MS14218E 8.1.2
Solid Rivet Flush Head MS14219E 8.1.2
Swaged Collar
FastenerFlush Head NAS1436
8.1.4
Swaged Collar
FastenerFlush Head NAS1442
8.1.4
Swaged Collar
FastenerFlush Head NAS7024
8.1.4
Swaged Collar
FastenerFlush Head NAS7032
8.1.4
Threaded Fastener Flush Head NAS4452 8.1.5
Threaded Fastener Flush Head NAS4445 8.1.5
Ti-10V-2Fe-3Al (Ti-
10-2-3)
Forging AMS 4984 5.5.3
Ti-10V-2Fe-3Al (Ti-
10-2-3)
Forging AMS 4986 5.5.3
Ti-13V-11Cr-3Al Bar and Forging AMS 6925 5.5.1

APPENDIX B
MMPDS-05
1 April 2010
Alloy Name Form/Application Specification Section
B-10Key: Underline indicates inactive for new design.
Ti-13V-11Cr-3Al Bar and Forging AMS 6926 5.5.1
Ti-13V-11Cr-3Al Sheet, Strip and Plate AMS 4917 5.5.1
Ti-15V-3Cr-3Sn-3Al
(Ti-15-3)-3-3
Sheet and Strip AMS 4914 5.5.2
Ti-4.5Al-3V-2Fe-2Mo Bars, Wires, Forgings and Rings AMS 4964 5.4.3
Ti-4.5Al-3V-2Fe-2Mo Sheet AMS 4899 5.4.3
Ti-5Al-2.5Sn Bar AMS 4926 5.3.1
Ti-5Al-2.5Sn Bar and Forging AMS 6900 5.3.1
Ti-5Al-2.5Sn Extruded Bar and Shapes AMS-T-81556 5.3.1
Ti-5Al-2.5Sn Forging AMS 4966 5.3.1
Ti-5Al-2.5Sn Sheet, Strip and Plate AMS 4910 5.3.1
Ti-6Al-2Sn-4Zr-2Mo Bar AMS 4975 5.3.3
Ti-6Al-2Sn-4Zr-2Mo Forging AMS 4976 5.3.3
Ti-6Al-2Sn-4Zr-2Mo Sheet, Strip and Plate AMS 4919 5.3.3
Ti-6Al-4V Bar AMS 4967 5.4.1
Ti-6Al-4V Bar and Die Forging AMS 4928 5.4.1
Ti-6Al-4V Casting AMS 4962 5.4.1
Ti-6Al-4V Die Forging AMS 4920 5.4.1
Ti-6Al-4V Extrusion AMS 4934 5.4.1
Ti-6Al-4V Extrusion AMS 4935 5.4.1
Ti-6Al-4V Investment Casting AMS 4992 5.4.1
Ti-6Al-4V Sheet, Strip and Plate AMS 4911 5.4.1
Ti-6Al-4V Sheet, Strip and Plate AMS 4904 5.4.1
Ti-6Al-4V Bar AMS 6930 5.4.1
Ti-6Al-4V Bar AMS 6931 5.4.1
Ti-6Al-4V Plate AMS 6945 5.4.1
Ti-6Al-4V Bar AMS 4965 5.4.1
Ti-6Al-6V-2Sn Bar and Forging AMS 4971 5.4.2
Ti-6Al-6V-2Sn Bar and Forging AMS 4978 5.4.2
Ti-6Al-6V-2Sn Bar and Forging AMS 4979 5.4.2
Ti-6Al-6V-2Sn Extruded Bar and Shapes AMS-T-81556 5.4.2
Ti-6Al-6V-2Sn Sheet, Strip and Plate AMS 4918 5.4.2
Ti-6Al-6V-2Sn Sheet, Strip and Plate AMS 4990 5.4.2
Ti-8Al-1Mo-1V Bar and Forging AMS 6910 5.3.2
Ti-8Al-1Mo-1V Forging AMS 4973 5.3.2
Ti-8Al-1Mo-1V Sheet, Strip and Plate AMS 4915 5.3.2
Ti-8Al-1Mo-1V Sheet, Strip and Plate AMS 4916 5.3.2
Waspaloy Bar, Forgings and Ring AMS 5706 6.3.8
Waspaloy Bar, Forgings and Ring AMS 5707 6.3.8
Waspaloy Bar, Forgings and Ring AMS 5708 6.3.8
Waspaloy Bar, Forgings and Ring AMS 5709 6.3.8
Waspaloy Forging AMS 5704 6.3.8
Waspaloy Plate, Sheet and Strip AMS 5544 6.3.8
ZE41A Magnesium Sand Casting AMS 4439 4.3.7
ZK60A-F Extrusion ASTM B 107 4.2.3
ZK60A-T5 Die and Hand Forging AMS 4362 4.2.3
ZK60A-T5 Extrusion AMS 4352 4.2.3
... Sleeve Bolt MIL-B-8831/4 8.1.6

APPENDIX B
MMPDS-05
1 April 2010
Alloy Name Form/Application Specification Section
B-11Key: Underline indicates inactive for new design.
... Threaded Fasteners AS 8879 8.1.5
... Threaded Fasteners MIL-S-7742 8.1.5
... Wire Rope MIL-DTL-83420 8.3
... Wire Strand MIL-DTL-87161 8.3

APPENDIX B
MMPDS-05
1 April 2010
B-12Key: Underline indicates inactive for new design.
This page is intentionally blank.

APPENDIX C
MMPDS-05
1 April 2010
C-1Key: Underline indicates inactive for new design.
C.0 Specification Index
Specification Alloy Name Form/Application Section
AMS 5015 5052 Sheet and Plate 3.5.1
AMS 4016 5052 Sheet and Plate 3.5.1
AMS 4017 5052 Sheet and Plate 3.5.1
AMS 4025 6061 Sheet and Plate 3.6.2
AMS 4026 6061 Sheet and Plate 3.6.2
AMS 4027 6061 Sheet and Plate 3.6.2
AMS 4028 2014 Bare Sheet and Plate 3.2.2
AMS 4029 2014 Bare Sheet and Plate 3.2.2
AMS 4031 2219 Sheet and Plate 3.2.13
AMS 4035 2024 Bare Sheet and Plate 3.2.4
AMS 4037 2024 Bare Sheet and Plate 3.2.4
AMS 4044 7075 Bare Sheet and Plate 3.7.8
AMS 4045 7075 Bare Sheet and Plate 3.7.8
AMS 4049 7075 Clad Sheet and Plate 3.7.8
AMS 4050 7050 Bare Plate 3.7.4
AMS 4056 5083 Bare Sheet and Plate 3.5.2
AMS 4078 7075 Bare Plate 3.7.8
AMS 4080 6061 Tubing Seamless, Drawn 3.6.2
AMS 4081 6061 Tubing Seamless, Drawn 3.6.2
AMS 4082 6061 Tubing Seamless, Drawn 3.6.2
AMS 4083 6061 Tubing Seamless, Drawn 3.6.2
AMS 4084 (T61) 7475 Bare Sheet 3.7.16
AMS 4085 (T761) 7475 Bare Sheet 3.7.16
AMS 4086 2024 Tubing, Hydraulic, Seamless, Drawn 3.2.4
AMS 4089 (T7651) 7475 Bare Plate 3.7.16
AMS 4090 (T651) 7475 Bare Plate 3.7.16
AMS 4100 (T761) 7475 Clad Sheet 3.7.16
AMS 4101 2124 Plate 3.2.13
AMS 4107 7050 Die Forging 3.7.4
AMS 4108 7050 Hand Forging 3.7.4
AMS 4111 7049 Forging 3.7.3
AMS 4115 6061 Bar and Rod, Rolled or Cold Finished 3.6.2
AMS 4116 6061 Bar and Rod, Cold Finished 3.6.2
AMS 4117 6061 Bar and Rod, Rolled or Cold Finished 3.6.2
AMS 4118 2017 Bar and Rod, Rolled or Cold-Finished 3.2.3
AMS 4120 2024 Bar and Rod, Rolled or Cold-Finished 3.2.4
AMS 4121 2014 Bar and Rod, Rolled or Cold Finished 3.2.2
AMS 4122 7075 Bar and Rod, Rolled or Cold Finished 3.7.8
AMS 4123 7075 Bar and Rod, Rolled or Cold Finished 3.7.8
AMS 4124 7075 Bar and Rod, Rolled or Cold Finished 3.7.8
AMS 4125 6151 Die Forging 3.6.3
AMS 4126 7075 Forging 3.7.8
AMS 4127 6061 Forging 3.6.2
AMS 4128 6061 Bar and Rod, Rolled or Cold Finished 3.6.2
AMS 4130 2025 Die Forging 3.2.5
AMS 4132 2618 Die and Hand Forgings 3.2.19

APPENDIX C
MMPDS-05
1 April 2010
Specification Alloy Name Form/Application Section
C-2Key: Underline indicates inactive for new design.
AMS 4133 2014 Forging 3.2.2
AMS 4141 7075 Die Forging 3.7.8
AMS 4144 2219 Hand Forging 3.2.13
AMS 4147 7075 Forging 3.7.8
AMS 4148 (T66) 7175 Die Forging 3.7.11
AMS 4149 (T74) 7175 Die and Hand Forging 3.7.11
AMS 4150 6061 Extruded Rod, Bars, and Shapes 3.6.2
AMS 4152 2024 Extrusion 3.2.4
AMS 4153 2014 Extrusion 3.2.2
AMS 4157 7049 Extrusion 3.7.3
AMS 4160 6061 Extrusion 3.6.2
AMS 4161 6061 Extrusion 3.6.2
AMS 4162 2219 Extrusion 3.2.13
AMS 4163 2219 Extrusion 3.2.13
AMS 4164 2024 Extrusion 3.2.4
AMS 4165 2024 Extrusion 3.2.4
AMS 4166 7075 Extrusion 3.7.8
AMS 4167 7075 Extrusion 3.7.8
AMS 4172 6061 Extruded Rod, Bars, and Shapes 3.6.2
AMS 4173 6061 Extruded Rod, Bars, and Shapes 3.6.2
AMS 4179 (T7452) 7175 Hand Forging 3.7.11
AMS 4186 7075 Bar and Rod, Rolled or Cold Finished 3.7.8
AMS 4200 7049 Plate 3.7.3
AMS 4201 7050 Bare Plate 3.7.4
AMS 4202 (T7351) 7475 Bare Plate 3.7.16
AMS 4204 7010 Plate 3.7.1
AMS 4205 7010 Plate 3.7.1
AMS 4206 7055 Plate 3.7.5
AMS 4207 (T61) 7475 Clad Sheet 3.7.16
AMS 4211 7040 Plate 3.7.2
AMS 4213 2027 Plate 3.2.7
AMS 4215 C355.0 Casting 3.9.3.0(b)
AMS 4216 6013 (T4) Sheet 3.6.1
AMS 4217 356 Sand Casting 3.9.4
AMS 4218 A356.0 Casting 3.9.5
AMS 4219 A357.0 Casting 3.9.6
AMS 4229 A201.0 Casting 3.8.1.0(b)
AMS 4241 D357.0 Sand Composite Casting 3.9.7
AMS 4248 6061 Hand Forging 3.6.2
AMS 4250 7449 Plate 3.7.15
AMS 4251 2090 Sheet 3.2.10
AMS 4252 (T7751) 7150 Plate 3.7.11
AMS 4254 2024-T3 ARAMID
Fiber Reinforced
Sheet Laminate 7.5.1
AMS 4260 356 Investment Casting 3.9.4
AMS 4267 7055 Sheet 3.7.5
AMS 4270 2424 (Clad) Sheet 3.2.17
AMS 4273 2424 (Bare) Sheet 3.2.17

APPENDIX C
MMPDS-05
1 April 2010
Specification Alloy Name Form/Application Section
C-3Key: Underline indicates inactive for new design.
AMS 4281 355 Permanent Mold Casting 3.9.2
AMS 4284 356 Permanent Mold Casting 3.9.4
AMS 4287 2099 Extrusion 3.2.12
AMS 4288 E357.0 Casting 3.9.7
AMS 4289 F357.0 Casting 3.9.6
AMS 4293 7249 Extrusion 3.7.12
AMS 4296 2524 (T3) Sheet and Plate 3.2.19
AMS 4298 2056 Clad Sheet 3.2.9
AMS 4299 7449 Plate 3.7.15
AMS 4302 7475-T761 ARAMID
Fiber Reinforced
Sheet Laminate 7.5.2
AMS 4305 7449 Extruded Profile 3.7.`1
AMS 4306 (T6151) 7150 Bare Plate 3.7.11
AMS 4307 (T61511) 7150 Extrusion 3.7.11
AMS 4320 7149 Forging 3.7.3
AMS 4324 7055 Extrusion 3.7.5
AMS 4325 7150 Extrusion 3.7.11
AMS 4326 2013 Extrusion 3.2.1
AMS 4327 2098 Plate 3.2.11
AMS 4328 2397 Plate 3.2.16
AMS 4329 7085 Plate 3.7.8
AMS 4330 2297 Plate 3.2.15
AMS 4331 7068 Extrusion 3.7.7
AMS 4332 7349 Extrusion 3.7.14
AMS 4333 7050 Die Forging 3.7.4
AMS 4334 7249 Hand Forging 3.7.13
AMS 4336 7055 Extrusion 3.7.5
AMS 4337 7055 Extrusion 3.7.5
AMS 4338 2026 Bars, Rods, and Profiles 3.2.6
AMS 4340 7050 Extruded Shape 3.7.4
AMS 4341 7050 Extruded Shape 3.7.4
AMS 4342 7050 Extruded Shape 3.7.4
AMS 4343 7149 Extrusion 3.7.3
AMS 4344 (T73511) 7175 Extrusion 3.7.12
AMS 4345 (T77511) 7150 Extrusion 3.7.11
AMS 4347 6013 (T6) Sheet 3.6.1
AMS 4350 AZ61A Extrusion 4.2.2
AMS 4352 ZK60A-T5 Extrusion 4.2.3
AMS 4362 ZK60A-T5 Die and Hand Forging 4.2.3
AMS 4375 AZ31B Sheet and Plate 4.2.1
AMS 4376 AZ31B Plate 4.2.1
AMS 4377 AZ31B Sheet and Plate 4.2.1
AMS 4401 7140 Plate 3.7.10
AMS 4403 7085 Die Forging 3.7.9
AMS 4405 6156 Clad Sheet 3.6.4
AMS 4407 7056 Plate 3.7.6
AMS 4408 7140 Plate 3.7.10
AMS 4413 2050 Plate 3.2.8

APPENDIX C
MMPDS-05
1 April 2010
Specification Alloy Name Form/Application Section
C-4Key: Underline indicates inactive for new design.
AMS 4414 7085 Hand Forging 3.7.9
AMS 4418 QE22A Magnesium Sand Casting 4.3.6
AMS 4429 EV31A Sand Casting 4.3.4
AMS 4434 AZ92A Sand Casting 4.3.3
AMS 4437 AZ91C/AZ91E Sand Casting 4.3.2
AMS 4439 ZE41A Magnesium Sand Casting 4.3.7
AMS 4442 EZ33A Sand Casting 4.3.5
AMS 4446 AZ91C/AZ91E Sand Casting 4.3.2
AMS 4452 AZ91C/AZ91E Investment Casting 4.3.2
AMS 4453 AZ92A Investment Casting 4.3.3
AMS 4455 AM100A Investment Casting 4.3.1
AMS 4457 2098 Sheet 3.2.11
AMS 4483 AM100A Permanent Mold Casting 4.3.1
AMS 4484 AZ92A Permanent Mold Casting 4.3.3
AMS 4530 Copper Beryllium Strip (TF00) 7.3.2
AMS 4532 Copper Beryllium Strip (TH02) 7.3.2
AMS 4533 Copper Beryllium Bar and Rod (TF00) 7.3.2
AMS 4534 Copper Beryllium Bar and Rod (TH04) 7.3.2
AMS 4535 Copper Beryllium Mechanical tubing (TF00) 7.3.2
AMS 4596 Copper-Nickel-Tin Bar, Rod, Tube (TX 00) 7.3.3
AMS 4597 Copper-Nickel-Tin Bar and Rod (TXTS) 7.3.3
AMS 4650 Copper Beryllium Bar, Rod, Shapes and Forging (TF00) 7.3.2
AMS 4651 Copper Beryllium Bar and Rod (TF04) 7.3.2
AMS 4860 Manganese Bronzes Casting 7.3.1
AMS 4862 Manganese Bronzes Casting 7.3.1
AMS 4899 Ti-4.5Al-3V-2Fe-2Mo Sheet 5.4.3
AMS 4900 CP Titanium Sheet, Strip and Plate 5.2.1
AMS 4901 CP Titanium Sheet, Strip and Plate 5.2.1
AMS 4902 CP Titanium Sheet, Strip and Plate 5.2.1
AMS 4904 Ti-6Al-4V Sheet, Strip and Plate 5.4.1
AMS 4910 Ti-5Al-2.5Sn Sheet, Strip and Plate 5.3.1
AMS 4911 Ti-6Al-4V Sheet, Strip and Plate 5.4.1
AMS 4914 Ti-15V-3Cr-3Sn-3Al
(Ti-15-3)-3-3
Sheet and Strip 5.5.2
AMS 4915 Ti-8Al-1Mo-1V Sheet, Strip and Plate 5.3.2
AMS 4916 Ti-8Al-1Mo-1V Sheet, Strip and Plate 5.3.2
AMS 4917 Ti-13V-11Cr-3Al Sheet, Strip and Plate 5.5.1
AMS 4918 Ti-6Al-6V-2Sn Sheet, Strip and Plate 5.4.2
AMS 4919 Ti-6Al-2Sn-4Zr-2Mo Sheet, Strip and Plate 5.3.3
AMS 4920 Ti-6Al-4V Die Forging 5.4.1
AMS 4921 CP Titanium Bar 5.2.1
AMS 4926 Ti-5Al-2.5Sn Bar 5.3.1
AMS 4928 Ti-6Al-4V Bar and Die Forging 5.4.1
AMS 4934 Ti-6Al-4V Extrusion 5.4.1
AMS 4935 Ti-6Al-4V Extrusion 5.4.1
AMS 4940 CP Titanium Sheet, Strip and Plate 5.2.1
AMS 4962 Ti-6Al-4V Casting 5.4.1
AMS 4964 Ti-4.5Al-3V-2Fe-2Mo Bars, Wires, Forgings and Rings 5.4.3

APPENDIX C
MMPDS-05
1 April 2010
Specification Alloy Name Form/Application Section
C-5Key: Underline indicates inactive for new design.
AMS 4965 Tii-6Al-4V Bar 5.4.1
AMS 4966 Ti-5Al-2.5Sn Forging 5.3.1
AMS 4967 Ti-6Al-4V Bar 5.4.1
AMS 4971 Ti-6Al-6V-2Sn Bar and Forging 5.4.2
AMS 4973 Ti-8Al-1Mo-1V Forging 5.3.2
AMS 4975 Ti-6Al-2Sn-4Zr-2Mo Bar 5.3.3
AMS 4976 Ti-6Al-2Sn-4Zr-2Mo Forging 5.3.3
AMS 4978 Ti-6Al-6V-2Sn Bar and Forging 5.4.2
AMS 4979 Ti-6Al-6V-2Sn Bar and Forging 5.4.2
AMS 4983 Ti-10V-2Fe-3Al (Ti-
10-2-3)
Forging 5.5.3
AMS 4984 Ti-10V-2Fe-3Al (Ti-
10-2-3)
Forging 5.5.3
AMS 4986 Ti-10V-2Fe-3Al (Ti-
10-2-3)
Forging 5.5.3
AMS 4990 Ti-6Al-6V-2Sn Sheet, Strip and Plate 5.4.2
AMS 4992 Ti-6Al-4V Investment Casting 5.4.1
AMS 5046 AISI 1025 Sheet, Strip, and Plate 2.2.1
AMS 5075 AISI 1025 - N Seamless Tubing 2.2.1
AMS 5077 AISI 1025 - N Tubing 2.2.1
AMS 5342 17-4PH Investment Casting (H1100) 2.6.9
AMS 5343 17-4PH Investment Casting (H1000) 2.6.9
AMS 5344 17-4PH Investment Casting (H900) 2.6.9
AMS 5383 Inconel Alloy 718 Investment Casting 6.3.5
AMS 5400 15-5PH Investment Casting 2.6.7
AMS 5510 AISI 303 Sheet, Strip and Plate 2.7.1
AMS 5512 AISI 303 Sheet, Strip and Plate 2.7.1
AMS 5513 AISI 301 Sheet, Strip and Plate 2.7.1
AMS 5516 AISI 302 Sheet, Strip and Plate 2.7.1
AMS 5517 AISI 301 Sheet and Strip (125 ksi) 2.7.1
AMS 5518 AISI 301 Sheet and Strip (150 ksi) 2.7.1
AMS 5519 AISI 301 Sheet and Strip (185 ksi) 2.7.1
AMS 5520 PH15-7Mo Plate, Sheet and Strip 2.6.8
AMS 5524 AISI 316 Sheet, Strip and Plate 2.7.1
AMS 5525 A-286 Sheet, Strip and Plate 6.2.1
AMS 5528 17-7PH Plate, Sheet and Strip 2.6.10
AMS 5532 N-155 Sheet 6.2.2
AMS 5536 Hastelloy X Sheet and Plate 6.3.1
AMS 5537 L-605 Sheet 6.4.1
AMS 5540 Inconel Alloy 600 Plate, Sheet and Strip 6.3.2
AMS 5542 Inconel Alloy X-750 Sheet, Strip and Plate; Annealed 6.3.6
AMS 5544 Waspaloy Plate, Sheet and Strip 6.3.8
AMS 5545 Renéé 41 Plate, Sheet and Strip 6.3.7
AMS 5547 AM-355 Sheet and Strip 2.6.2
AMS 5548 AM-350 Sheet and Strip 2.6.1
AMS 5549 AM-355 Plate 2.6.2
AMS 5578 Custom 455 Tubing (welded) 2.6.4
AMS 5580 Inconel Alloy 600 Tubing, Seamless 6.3.2

APPENDIX C
MMPDS-05
1 April 2010
Specification Alloy Name Form/Application Section
C-6Key: Underline indicates inactive for new design.
AMS 5585 N-155 Tubing (welded) 6.2.2
AMS 5589 Inconel Alloy 718 Tubing; Creep Rupture 6.3.5
AMS 5590 Inconel Alloy 718 Tubing; Short-Time 6.3.5
AMS 5596 Inconel Alloy 718 Sheet, Strip and Plate; Creep Rupture 6.3.5
AMS 5597 Inconel Alloy 718 Sheet, Strip and Plate; Short-Time 6.3.5
AMS 5599 Inconel Alloy 625 Sheet, Strip and Plate 6.3.3
AMS 5604 17-4PH Sheet, Strip and Plate 2.6.9
AMS 5605 Inconel Alloy 706 Sheet, Strip and Plate 6.3.4
AMS 5606 Inconel Alloy 706 Sheet, Strip and Plate 6.3.4
AMS 5608 188 Sheet and Plate 6.4.2
AMS 5617 Custom 455 Bar and Forging 2.6.4
AMS 5629 PH13-8Mo Bar, Forging Ring and Extrusion (VIM+CEVM) 2.6.6
AMS 5643 17-4PH Bar, Forging and Ring 2.6.9
AMS 5659 15-5PH Bar, Forging, Ring and Extrusion (CEVM) 2.6.7
AMS 5662 Inconel Alloy 718 Bar and Forging; Creep Rupture 6.3.5
AMS 5663 Inconel Alloy 718 Bar and Forging; Creep Rupture 6.3.5
AMS 5664 Inconel Alloy 718 Bar and Forging; Short-Time 6.3.5
AMS 5666 Inconel Alloy 625 Bar, Forging and Ring 6.3.3
AMS 5667 Inconel Alloy X-750 Bar and Forging; Equalized 6.3.6
AMS 5701 Inconel Alloy 706 Bar, Forging and Ring 6.3.4
AMS 5702 Inconel Alloy 706 Bar, Forging and Ring 6.3.4
AMS 5703 Inconel Alloy 706 Bar, Forging and Ring 6.3.4
AMS 5704 Waspaloy Forging 6.3.8
AMS 5706 Waspaloy Bar, Forgings and Ring 6.3.8
AMS 5707 Waspaloy Bar, Forgings and Ring 6.3.8
AMS 5708 Waspaloy Bar, Forgings and Ring 6.3.8
AMS 5709 Waspaloy Bar, Forgings and Ring 6.3.8
AMS 5712 Renéé 41 - STA Bar and Forging 6.3.7
AMS 5713 Renéé 41 Bar and Forging 6.3.7
AMS 5731 A-286 Bar, Forging, Tubing and Ring 6.2.1
AMS 5732 A-286 Bar, Forging, Tubing and Ring 6.2.1
AMS 5734 A-286 Bar, Forging and Tubing 6.2.1
AMS 5737 A-286 Bar, Forging and Tubing 6.2.1
AMS 5743 AM-355 Bar, Forging and Forging Stock 2.6.2
AMS 5754 Hastelloy X Bar and Forging 6.3.1
AMS 5759 L-605 Bar and Forging 6.4.1
AMS 5763 Custom 450 Bar, Forging, Tubing, Wire and Ring (air melted) 2.6.3
AMS 5768 N-155 Bar and Forging 6.2.2
AMS 5769 N-155 Bar and Forging 6.2.2
AMS 5772 188 Bar and Forging 6.4.2
AMS 5773 Custom 450 Bar, Forging, Tubing, Wire and Ring (CEM) 2.6.3
AMS 5842 MP159 Alloy Bar (solution treated and cold drawn) 7.4.2
AMS 5843 MP159 Alloy Bar (solution treated, cold drawn and aged) 7.4.2
AMS 5844 MP35N Alloy Bar (solution treated and cold drawn) 7.4.1
AMS 5845 MP35N Alloy Bar (solution treated, cold drawn and aged) 7.4.1
AMS 5862 15-5PH Sheet, Strip and Plate (CEVM) 2.6.7
AMS 5878 230 Plate, Sheet and Strip 6.3.9
AMS 5891 230 Bar and Forging 6.3.9

APPENDIX C
MMPDS-05
1 April 2010
Specification Alloy Name Form/Application Section
C-7Key: Underline indicates inactive for new design.
AMS 5901 AISI 301 Plate, Sheet and Strip 2.7.1
AMS 5902 AISI 301 Sheet and Strip (175 ksi) 2.7.1
AMS 5903 AISI 302 Sheet and Strip (125 ksi) 2.7.1
AMS 5904 AISI 302 Sheet and Strip (150 ksi) 2.7.1
AMS 5905 AISI 302 Sheet and Strip (175 ksi) 2.7.1
AMS 5906 AISI 302 Sheet and Strip (185 ksi) 2.7.1
AMS 5907 AISI 316 Sheet, Strip and Plate (125 ksi) 2.7.1
AMS 5910 AISI 304 Sheet, Strip and Plate (125 ksi) 2.7.1
AMS 5911 AISI 304 Sheet and Strip (150 ksi) 2.7.1
AMS 5912 AISI 304 Sheet and Strip (175 ksi) 2.7.1
AMS 5913 AISI 304 Sheet and Strip (185 ksi) 2.7.1
AMS 5916 HR-120 Sheet, Strip and Plate 6.3.10
AMS 5922 Ferrium S53 Bar 2.5.4
AMS 5933 12.5Cr-1.0Ni-15.5Co-
2.0Mo
Bar and Forging 2.6.11
AMS 5933 HSL180 Bar and Forging 2.6.11
AMS 5934 PH13-8Mo Bar, Forging, Ring, and Extrusion 2.6.6
AMS 5936 Custom 465 Bar, Wires and Forgings 2.6.5
AMS 6257 300M (0.42C) Bar and Forging 2.3.1
AMS 6257 300M (0.42C) Tubing 2.3.1
AMS 6280 8630 Bar and Forging 2.3.1
AMS 6281 8630 Tubing 2.3.1
AMS 6282 8735 Tubing 2.3.1
AMS 6320 8735 Bar and Forging 2.3.1
AMS 6322 8740 Bar and Forging 2.3.1
AMS 6323 8740 Tubing 2.3.1
AMS 6327 8740 Bar and Forging 2.3.1
AMS 6340 4330V Bar and Forging 2.3.1
AMS 6340 4330V Tubing 2.3.1
AMS 6345 4130 Sheet, Strip and Plate 2.3.1
AMS 6346 4130 Bar 2.3.1
AMS 6346 4130 Bar 2.3.1
AMS 6348 4130 Bar and Forging 2.3.1
AMS 6349 4140 Bar and Forging 2.3.1
AMS 6350 4130 Sheet, Strip and Plate 2.3.1
AMS 6351 4130 Sheet, Strip and Plate 2.3.1
AMS 6352 4135 Sheet, Strip and Plate 2.3.1
AMS 6357 8735 Sheet, Strip and Plate 2.3.1
AMS 6358 8740 Sheet, Strip and Plate 2.3.1
AMS 6359 4340 Sheet, Strip and Plate 2.3.1
AMS 6360 4130 Tubing (normalized) 2.3.1
AMS 6361 4130 Tubing 2.3.1
AMS 6362 4130 Tubing 2.3.1
AMS 6365 4135 Tubing 2.3.1
AMS 6370 4130 Bar and Forging 2.3.1
AMS 6371 4130 Tubing 2.3.1
AMS 6372 4135 Tubing 2.3.1
AMS 6373 4130 Tubing 2.3.1
APPENDIX C
MMPDS-05
1 April 2010
Specification Alloy Name Form/Application Section
C-8Key: Underline indicates inactive for new design.
AMS 6374 4130 Tubing 2.3.1
AMS 6381 4140 Tubing 2.3.1
AMS 6382 4140 Bar and Forging 2.3.1
AMS 6395 4140 Sheet, Strip and Plate 2.3.1
AMS 6411 4330V Bar and Forging 2.3.1
AMS 6411 4330V Tubing 2.3.1
AMS 6414 4340 Bar and Forging 2.3.1
AMS 6414 4340 Tubing 2.3.1
AMS 6415 4340 Bar and Forging 2.3.1
AMS 6415 4340 Tubing 2.3.1
AMS 6417 300M (0.4C) Bar and Forging 2.3.1
AMS 6417 300M (0.4C) Tubing 2.3.1
AMS 6419 300M (0.42C) Bar and Forging 2.3.1
AMS 6419 300M (0.42C) Tubing 2.3.1
AMS 6425 Hy-Tuf Bar and Forging 2.3.1
AMS 6425 Hy-Tuf Tubing 2.3.1
AMS 6427 4330V Bar and Forging 2.3.1
AMS 6427 4330V Tubing 2.3.1
AMS 6429 4335V Bar and Forging 2.3.1
AMS 6429 4335V Tubing 2.3.1
AMS 6430 4335V Bar and Forging 2.3.1
AMS 6430 4335V Tubing 2.3.1
AMS 6431 D6AC Bar and Forging 2.3.1
AMS 6431 D6AC Tubing 2.3.1
AMS 6433 4335V Sheet, Strip and Plate 2.3.1
AMS 6435 4335V Sheet, Strip and Plate 2.3.1
AMS 6437 5Cr-Mo-V Sheet, Strip and Plate 2.4.1
AMS 6439 D6AC Bar and Forging 2.3.1
AMS 6439 D6AC Sheet, Strip and Plate 2.3.1
AMS 6452 4140 Welding Wire 8.2.2
AMS 6454 4340 Sheet, Strip and Plate 2.3.1
AMS 6457 4130 Welding Wire 8.2.2
AMS 6487 5Cr-Mo-V Bar and Forging (CEVM) 2.4.1
AMS 6512 250 Bar 2.5.1
AMS 6514 280 (300) Bar 2.5.1
AMS 6520 250 Sheet and Plate 2.5.1
AMS 6523 9Ni-4Co-0.20C Sheet, Strip and Plate 2.4.2
AMS 6526 9Ni-4Co-0.30C Bar and Forging, Tubing 2.4.3
AMS 6527 AF1410 Bar and Forging 2.5.2
AMS 6528 4130 Bar and Forging 2.3.1
AMS 6529 4140 Bar and Forging 2.3.1
AMS 6532 AerMet 100 Bar and Forging 2.5.3
AMS 6900 Ti-5Al-2.5Sn Bar and Forging 5.3.1
AMS 6910 Ti-8Al-1Mo-1V Bar and Forging 5.3.2
AMS 6925 Ti-13V-11Cr-3Al Bar and Forging 5.5.1
AMS 6926 Ti-13V-11Cr-3Al Bar and Forging 5.5.1
AMS 6930 Ti-6Al-4V Bar 5.4.1
AMS 6931 Ti-6Al-4V Bar 5.4.1
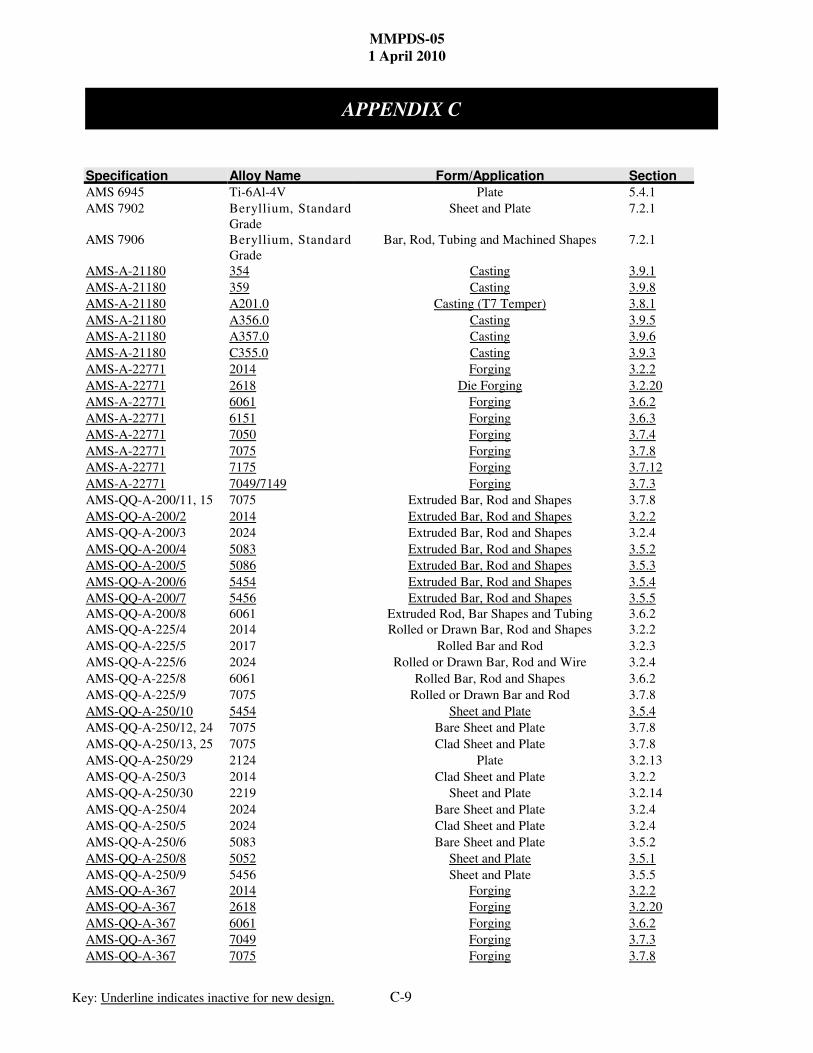
APPENDIX C
MMPDS-05
1 April 2010
Specification Alloy Name Form/Application Section
C-9Key: Underline indicates inactive for new design.
AMS 6945 Ti-6Al-4V Plate 5.4.1
AMS 7902 Beryllium, Standard
Grade
Sheet and Plate 7.2.1
AMS 7906 Beryllium, Standard
Grade
Bar, Rod, Tubing and Machined Shapes 7.2.1
AMS-A-21180 354 Casting 3.9.1
AMS-A-21180 359 Casting 3.9.8
AMS-A-21180 A201.0 Casting (T7 Temper) 3.8.1
AMS-A-21180 A356.0 Casting 3.9.5
AMS-A-21180 A357.0 Casting 3.9.6
AMS-A-21180 C355.0 Casting 3.9.3
AMS-A-22771 2014 Forging 3.2.2
AMS-A-22771 2618 Die Forging 3.2.20
AMS-A-22771 6061 Forging 3.6.2
AMS-A-22771 6151 Forging 3.6.3
AMS-A-22771 7050 Forging 3.7.4
AMS-A-22771 7075 Forging 3.7.8
AMS-A-22771 7175 Forging 3.7.12
AMS-A-22771 7049/7149 Forging 3.7.3
AMS-QQ-A-200/11, 15 7075 Extruded Bar, Rod and Shapes 3.7.8
AMS-QQ-A-200/2 2014 Extruded Bar, Rod and Shapes 3.2.2
AMS-QQ-A-200/3 2024 Extruded Bar, Rod and Shapes 3.2.4
AMS-QQ-A-200/4 5083 Extruded Bar, Rod and Shapes 3.5.2
AMS-QQ-A-200/5 5086 Extruded Bar, Rod and Shapes 3.5.3
AMS-QQ-A-200/6 5454 Extruded Bar, Rod and Shapes 3.5.4
AMS-QQ-A-200/7 5456 Extruded Bar, Rod and Shapes 3.5.5
AMS-QQ-A-200/8 6061 Extruded Rod, Bar Shapes and Tubing 3.6.2
AMS-QQ-A-225/4 2014 Rolled or Drawn Bar, Rod and Shapes 3.2.2
AMS-QQ-A-225/5 2017 Rolled Bar and Rod 3.2.3
AMS-QQ-A-225/6 2024 Rolled or Drawn Bar, Rod and Wire 3.2.4
AMS-QQ-A-225/8 6061 Rolled Bar, Rod and Shapes 3.6.2
AMS-QQ-A-225/9 7075 Rolled or Drawn Bar and Rod 3.7.8
AMS-QQ-A-250/10 5454 Sheet and Plate 3.5.4
AMS-QQ-A-250/12, 24 7075 Bare Sheet and Plate 3.7.8
AMS-QQ-A-250/13, 25 7075 Clad Sheet and Plate 3.7.8
AMS-QQ-A-250/29 2124 Plate 3.2.13
AMS-QQ-A-250/3 2014 Clad Sheet and Plate 3.2.2
AMS-QQ-A-250/30 2219 Sheet and Plate 3.2.14
AMS-QQ-A-250/4 2024 Bare Sheet and Plate 3.2.4
AMS-QQ-A-250/5 2024 Clad Sheet and Plate 3.2.4
AMS-QQ-A-250/6 5083 Bare Sheet and Plate 3.5.2
AMS-QQ-A-250/8 5052 Sheet and Plate 3.5.1
AMS-QQ-A-250/9 5456 Sheet and Plate 3.5.5
AMS-QQ-A-367 2014 Forging 3.2.2
AMS-QQ-A-367 2618 Forging 3.2.20
AMS-QQ-A-367 6061 Forging 3.6.2
AMS-QQ-A-367 7049 Forging 3.7.3
AMS-QQ-A-367 7075 Forging 3.7.8

APPENDIX C
MMPDS-05
1 April 2010
Specification Alloy Name Form/Application Section
C-10Key: Underline indicates inactive for new design.
AMS-QQ-A-367 7049/7149 Forging 3.7.3
AMS-S-6758 4130 Bar and Forging 2.3.1
AMS-T-5066 AISI 1025 - N Tubing 2.2.1
AMS-WW-T-700/3 2024 Tubing 3.2.4
AMS-WW-T-700/6 6061 Tubing Seamless, Drawn 3.6.2
AS 8879 ... Threaded Fastener 8.1.5
ASTM A 108 AISI 1025 Bar 2.2.1
ASTM A 582 AISI 303 Sheet, Strip 2.7.1
ASTM B 107 AZ31B Extrusion 4.2.1
ASTM B 107 ZK60A-F Extrusion 4.2.3
ASTM B 166 Inconel Alloy 600 Bar and Rod 6.3.2
ASTM B 194 Copper Beryllium Sheet (TF00, TH01, TH02, TH04) 7.3.2
ASTM B 209 5086 Sheet and Plate 3.5.3
ASTM B 564 Inconel Alloy 600 Forging 6.3.2
ASTM B 928 5083 Bare Sheet and Plate 3.5.2
ASTM B 928 5456 Sheet and Plate 3.5.5
ASTM B 91 AZ31B Forging 4.2.1
ASTM B 91 AZ61A Forging 4.2.2
MIL-B-8831/4 ... Sleeve Bolt 8.1.6
MIL-E-22200/10 Steels Welding Electrode 8.2.2
MIL-DTL-46192 2519 Plate 3.2.18
MIL-DTL-83420 ... Wire Rope 8.3
MIL-DTL-87161 ... Wire Strand 8.3
MIL-S-6050 8630 Bar and Forging 2.3.1
MIL-S-7742 ... Threaded Fastener 8.1.5
MIL-T-81556 CP Titanium Extruded Bars and Shapes 5.2.1
MIL-T-81556 Ti-5Al-2.5Sn Extruded Bar and Shapes 5.3.1
MIL-T-81556 Ti-6Al-6V-2Sn Extruded Bar and Shapes 5.4.2
MS14218E Solid Rivet Flush Head 8.1.2
MS14219E Solid Rivet Flush Head 8.1.2
MS21140 Blind Fastener Flush Head 8.1.3
MS90353 Blind Fastener Flush Head 8.1.3
NAS1198 Solid Rivet Protruding Head 8.1.2
NAS1379 Blind Fastener Flush Head 8.1.3
NAS1398 Blind Fastener Protruding Head 8.1.3
NAS1399 Blind Fastener Flush Head 8.1.3
NAS1436Swaged Collar
FastenerFlush Head
8.1.4
NAS1442Swaged Collar
FastenerFlush Head
Swaged
Collar
Fastener
NAS1670-L Blind Fastener Flush Head
Swaged
Collar
Fastener
NAS1674-L Blind Fastener Flush Head 8.1.3
NAS1720 Blind Fastener Protruding Head 8.1.3
NAS1721 Blind Fastener Flush Head 8.1.3
NAS1738 Blind Fastener Protruding Head 8.1.3

APPENDIX C
MMPDS-05
1 April 2010
Specification Alloy Name Form/Application Section
C-11Key: Underline indicates inactive for new design.
NAS1739 Blind Fastener Flush Head 8.1.3
NAS1921 Blind Fastener Flush Head 8.1.3
NAS4452 Threaded Fastener Flush Head 8.1.5
NAS4445 Threaded Fastener Flush Head 8.1.5
NAS7024Swaged Collar
FastenerFlush Head
8.1.4
NAS7032Swaged Collar
FastenerFlush Head
8.1.4
NASM14218 Solid Rivet Flush Head 8.1.2
NASM14219 Solid Rivet Flush Head 8.1.2
NASM20426 Solid Rivet Flush Head 8.1.2
NASM20427 Solid Rivet Flush Head 8.1.2
NASM20600 Blind Fastener Protruding Head 8.1.3
NASM20601 Blind Fastener Flush Head 8.1.3
NASM21140 Blind Fastener Flush Head 8.1.3
NASM90353 Blind Fastener Flush Head 8.1.3
Cross Reference of Canceled MIL SpecificationsMIL
SpecificationAlloy Name Temper Product Form Superseding
Spec.MIL-S-5000 4340 N, Q & T Bar and Forging AMS 6415 & AMS
6484
MIL-S-18728 8630 Normalized Sheet, Strip, and Plate AMS 6345
MIL-S-8879 ... ... Threaded Fasteners AS 8879
MIL-T-6735 4135 TubingNo superseding spec
Similar AMS 6365
MIL-T-6736 4130 Tubing
Similar AMS 6360,
AMS 6361, AMS
6362
MIL-T-7081 6061 T4 Drawn Tubing AMS 4081
MIL-T-9046 CP Titanium CP-1 Annealed Sheet, Strip, and Plate AMS 4901
MIL-T-9046 CP Titanium CP-2 Annealed Sheet, Strip, and Plate AMS 4900
MIL-T-9046 CP Titanium CP-3 Annealed Sheet, Strip, and Plate AMS 4902
MIL-T-9046 CP Titanium CP-4 Annealed Sheet, Strip, and Plate AMS 4940
MIL-T-9046 Ti-5Al-2.5Sn Annealed Sheet, Strip, and Plate AMS 4915
MIL-T-9046 Ti-8Al-1Mo-1V Single Annealed Sheet and Plate AMS 4915
MIL-T-9046 Ti-8Al-1Mo-1V Duplex Annealed Sheet and Plate AMS 4916
MIL-T-9046 Ti-6Al-2Sn-4Zr-2Mo Triplex A Sheet, Strip, and Plate no superseding spec
MIL-T-9046 Ti-6Al-4V Annealed Sheet and Plate AMS 4911
MIL-T-9046 Ti-6Al-4V STA Sheet, Strip, and Plate AMS 4904
MIL-T-9046 Ti-6Al-6V-2Sn Annealed Sheet, Strip, and Plate AMS 4918
MIL-T-9046 Ti-6Al-6V-2Sn STA Sheet, Strip, and Plate AMS 4990
MIL-T-9046 Ti-13V-11Cr-3Al Annealed Sheet, Strip, and Plate AMS 4917
MIL-T-9046 Ti-13V-11Cr-3Al STA Sheet, Strip, and Plate no superseding spec
MIL-T-9047 CP Titanium Annealed Bar AMS 4921
MIL-T-9047 Ti-5Al-2.5Sn Annealed Bar AMS 6900
MIL-T-9047 Ti-8Al-1Mo-1V Duplex Annealed Bar AMS 6910
MIL-T-9047 Ti-6Al-4V Annealed Bar AMS 6931

APPENDIX C
MMPDS-05
1 April 2010
MILSpecification
Alloy Name Temper Product Form SupersedingSpec.
C-12Key: Underline indicates inactive for new design.
MIL-T-9047 Ti-6Al-4V STA Bar AMS 6930
MIL-T-9047 Ti-13V-11Cr-3Al Annealed Bar AMS 6925
MIL-T-9047 Ti-13V-11Cr-3Al STA Bar AMS 6926
MIL-W-6858 Welding Wire AWS D17.1
MS14218 Solid Rivet Flush Head NASM14218
MS14219 Solid Rivet Flush Head NASM14219
MS20426 Solid Rivet Flush Head NASM20426
MS20427 Solid Rivet Flush Head NASM20427
MS20600 Blind Fastener Protruding Head NASM20600
MS20601 Blind Fastener Flush Head NASM20601
MS21140 Blind Fastener Flush Head NASM21140
MS90353 Blind Fastener Flush Head NASM90353
QQ-A-250/1 1100 ASTM B209
QQ-A-250/2 3003 ASTM B209
QQ-A-250/7 5086 Sheet and Plate ASTM B 209
QQ-A-250/9 5456 H321 Sheet and Plate ASTM B 928
QQ-A-250/11 6061 Annealed Sheet and Plate AMS 4025
QQ-A-250/11 6061Solution treated and
naturally agedSheet and Plate AMS 4026
QQ-A-250/11 6061Solution and precipitation
heat treatedSheet and Plate AMS 4027

MMPDS-051 April 2010
D-1
APPENDIX D
D.0 Testing Standards
AMS 2355 Quality Assurance Sampling and Testing of Aluminum Alloys and Magnesium Alloys,
Wrought Products, Except Forging Stock, and Rolled, Forged, or Flash Welded Rings
AMS 2370 Quality Assurance Sampling and Testing, Carbon and Low-Alloy Steel Wrought
Products and Forging Stock
AMS 2371 Quality Assurance Sampling and Testing, Corrosion and Heat Resistant Steels and
Alloys, Wrought Products and Forging Stock
ASTM B 117 Standard Practice for Operating Salt Spray (Fog) Apparatus (vol. 03.02)
ASTM B 557 Method of Tension Testing Wrought and Cast Aluminum – and Magnesium-Alloy
Products (vol. 02.02, 02.03, 03.01)
ASTM B 769 Test Method for Shear Testing of Aluminum Alloys (vol. 02.02)
ASTM B 831 Standard Test Method for Shear Testing of Thin Aluminum Alloy Products (vol. 02.02)
ASTM C 693 Test Method for Density of Glass by Buoyancy (vol. 15.02)
ASTM C 714 Test Method for Thermal Diffusivity of Carbon and Graphite by a Thermal Pulse Method
(vol. 15.01)
ASTM D 2766 Test Method for Specific Heat of Liquids and Solids (vol. 05.02)
ASTM E 8 Test Methods of Tension Testing of Metallic Materials (vol. 01.02, 02.01, 02.03, 03.01)
ASTM E 9 Compression Testing of Metallic Materials at Room Temperature (vol. 03.01)
ASTM E 21 Recommended Practice for Elevated Temperature Tension Tests of Metallic Materials
(vol. 03.01)
ASTM E 29 Standard Practice for Using Significant Digits in Test Data to Determine Conformance
with Specifications (vol. 14.02)
ASTM E 83 Method of Verification and Classification of Extensometers (vol. 03.01)
ASTM E 111 Test Method for Young’s Modulus, Tangent Modulus, and Chord Modulus (vol. 03.01)
ASTM E 132 Test Method for Poisson’s Ratio at Room Temperature (vol. 03.01)
ASTM E 139 Recommended Practice for Conducting Creep, Creep-Rupture, and Stress-Rupture Tests
of Metallic Materials (vol. 03.01)
ASTM E 143 Test Method for Shear Modulus at Room Temperature (vol. 03.01)

MMPDS-051 April 2010
D-2
APPENDIX D - Testing Standards (continued)
ASTM E 238 Method for Pin-Type Bearing Test of Metallic Materials (vol. 03.01)
ASTM E 399 Test Method for Plane-Strain Fracture Toughness of Metallic Materials (vol. 02.02,
03.01)
ASTM E 466 Recommended Practice for Constant Amplitude Axial Fatigue Tests of Metallic
Materials (vol. 03.01)
ASTM E 561 Recommended Practice for R-Curve Determination (vol. 03.01)
ASTM E 606 Recommended Practice for Constant-Amplitude Low-Cycle Fatigue Testing (vol. 03.01)
ASTM E 647 Test Method for Measurement of Fatigue Crack Growth Rates (vol. 03.01)
ASTM E 739 Practice for Statistical Analysis of Linear or Linearized Stress-Life (S-N) and Strain-Life
(ε-N) Fatigue Data (vol. 03.01)
ASTM E 831 Standard Test Method for Linear Thermal Expansion of Solid Materials by
Thermomechanical Analysis.
ASTM G 34 Test Method for Exfoliation Corrosion Susceptibility in 2XXX and 7XXX Series
Aluminum Alloys (EXCO Test) (vol. 03.02)
ASTM G 47 Test Method for Determining Susceptibility to Stress-Corrosion Cracking of High-
Strength Aluminum Alloy Products (vol. 02.02, 03.02)
ASTM G 64 Standard Classification of Resistance to Stress-Corrosion Cracking of Heat-Treatable
Aluminum Alloys (vol. 03.02)
NASM 1312-4 Fastener Test Methods - Method 4 Lap Joint Shear
NASM 1312-8 Fastener Test Methods- Method 8 Tensile Strength
NASM 1312-13 Fastener Test Methods- Method 13 Double Shear Test
NASM 1312-20 Fastener Test Methods- Method 20 Single Shear
NASM 33522 Rivets, Blind, Structural, Mechanically Locked and Friction Retainer Spindle,
(Reliability and Maintainability) Design and Construction Requirement

MMPDS-05
1 April 2010
E-1
E.0 Subject Index
A-Basis, 1-7, 9-11, 9-28
AMS Specifications, 9-13, C1 through C9
Anderson-Darling Test
k-Sample Test, 9-94
Normality, 9-99
Pearsonality, 9-101
Weibullness, 9-107
Applicability of Procedures, 9-7
Approval Procedures, 9-7
ASTM Standards, 9-14, 9-15
A 370, 9-15, 9-18
B 557, 9-15, 9-18
B 117, 2-150
B 769, 1-12, 9-15, 9-18
B 831, 1-12, 9-15, 9-18
C 693, 9-14, 9-19, 9-204
C 714, 9-15, 9-204
D 2766, 9-15, 9-18, 9-197
E 8, 1-8, 1-20, 9-14, 9-15, 9-18, 9-41
E 9, 1-11, 9-14, 9-18
E 21, 9-15
E 29, 9-12
E 83, 9-14, 9-18, 9-34
E 111, 9-14, 9-18, 9-34, 9-203
E 132, 9-15, 9-18, 9-19, 9-203
E 139, 1-13, 9-14, 9-25
E 143, 9-14, 9-203
E 238, 1-12, 3-7, 9-14, 9-18
E 399, 1-20, 1-21, 9-15, 9-20, 9-27, 9-147
E 466, 1-15, 9-14, 9-19
E 561, 9-15, 9-21
E 606, 1-15, 9-14, 9-19, 9-36, 9-49, 9-53,
9-129
E 647, 1-23, 9-14, 9-19
E 739, 9-48, D-2
E 831, 9-14, 9-19
G 34, 9-14
G 47, 9-15
G 64, 3-19, D-2
B-Basis, 1-7, 9-11, 9-28
Backoff Factor, 9-103, A-1, A-6
Backoff Method
for Pearson Distribution, 9-103, 9-105, 9-115
for Weibull Distribution, 9-111, 9-116
Beams, Properties of
Aluminum, 3-645
Magnesium, 4-61
Steel, 2-249
Titanium, 5-163
Bearing Failure, 1-27
Bearing Properties, ii, 1-12, 9-60, 9-72, 9-125,
9-169
Bearing Data Analysis Procedures, 9-124,
9-127
Bearing Testing Standards, 9-14
Bearings, 8-175
Bending Failure, 1-27, 1-28
Biaxial Properties, 1-17
Modulus of Elasticity, 1-18
Ultimate Stress, 1-19
Yield Stress, 1-18
Biaxial Stress-Strain Curves, 1-17, 1-18, 2-15,
9-222
Brittle Fracture, 1-19
Analysis, 1-20
Cast, Definition of, 9-33, A-6
Censored Data Analysis, 9-115, 9-120, 9-310
Clad Aluminum Plate, Design Values for, 9-125
Coefficient of Thermal Expansion, 9-8, 9-14,
9-18, 9-19, 9-29, 9-203, 9-204, 9-230,
A-5
Columns, 1-29
Aluminum, 1-30, 3-646
Local Instability, 1-29
Magnesium, 1-30, 4-61
Primary Instability, 1-29
Stable Sections, 1-29
Steel, 2-249
Test Results, 1-30
Yield Stress, 1-30
Combinability of Data, 9-94
Anderson-Darling k-Sample Test, 9-94
F Test, 9-94, 9-96, 9-147
t-Test, 9-94, 9-97
Compression Testing, 4-2, 9-14, D-1
Compressive Failure, 1-27
Compressive Properties, 1-11, 7-35, 9-8, 9-69
Computational Procedures, 9-7, 9-77, 9-181
Derived Properties, 9-28, 9-124, 9-125,
9-126
Nonparametric, 9-115, 9-121
Normal Distribution, 9-99, 9-100
APPENDIX E
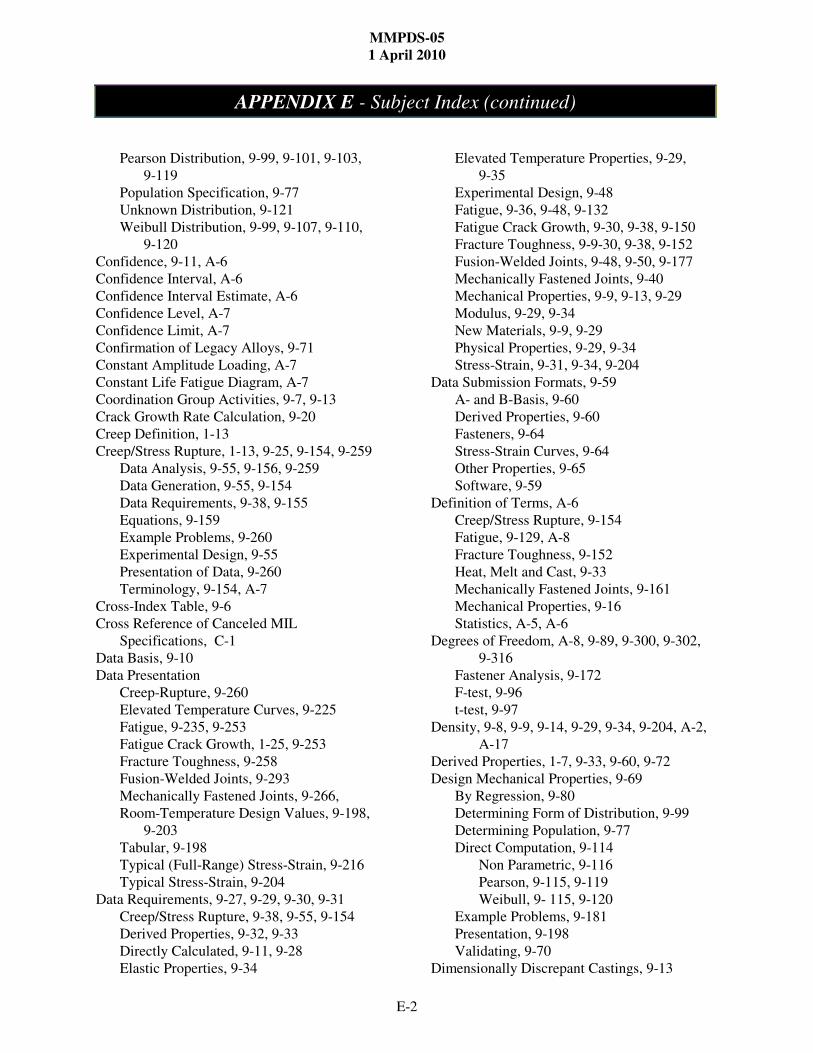
APPENDIX E - Subject Index (continued)
MMPDS-05
1 April 2010
E-2
Pearson Distribution, 9-99, 9-101, 9-103,
9-119
Population Specification, 9-77
Unknown Distribution, 9-121
Weibull Distribution, 9-99, 9-107, 9-110,
9-120
Confidence, 9-11, A-6
Confidence Interval, A-6
Confidence Interval Estimate, A-6
Confidence Level, A-7
Confidence Limit, A-7
Confirmation of Legacy Alloys, 9-71
Constant Amplitude Loading, A-7
Constant Life Fatigue Diagram, A-7
Coordination Group Activities, 9-7, 9-13
Crack Growth Rate Calculation, 9-20
Creep Definition, 1-13
Creep/Stress Rupture, 1-13, 9-25, 9-154, 9-259
Data Analysis, 9-55, 9-156, 9-259
Data Generation, 9-55, 9-154
Data Requirements, 9-38, 9-155
Equations, 9-159
Example Problems, 9-260
Experimental Design, 9-55
Presentation of Data, 9-260
Terminology, 9-154, A-7
Cross-Index Table, 9-6
Cross Reference of Canceled MIL
Specifications, C-1
Data Basis, 9-10
Data Presentation
Creep-Rupture, 9-260
Elevated Temperature Curves, 9-225
Fatigue, 9-235, 9-253
Fatigue Crack Growth, 1-25, 9-253
Fracture Toughness, 9-258
Fusion-Welded Joints, 9-293
Mechanically Fastened Joints, 9-266,
Room-Temperature Design Values, 9-198,
9-203
Tabular, 9-198
Typical (Full-Range) Stress-Strain, 9-216
Typical Stress-Strain, 9-204
Data Requirements, 9-27, 9-29, 9-30, 9-31
Creep/Stress Rupture, 9-38, 9-55, 9-154
Derived Properties, 9-32, 9-33
Directly Calculated, 9-11, 9-28
Elastic Properties, 9-34
Elevated Temperature Properties, 9-29,
9-35
Experimental Design, 9-48
Fatigue, 9-36, 9-48, 9-132
Fatigue Crack Growth, 9-30, 9-38, 9-150
Fracture Toughness, 9-9-30, 9-38, 9-152
Fusion-Welded Joints, 9-48, 9-50, 9-177
Mechanically Fastened Joints, 9-40
Mechanical Properties, 9-9, 9-13, 9-29
Modulus, 9-29, 9-34
New Materials, 9-9, 9-29
Physical Properties, 9-29, 9-34
Stress-Strain, 9-31, 9-34, 9-204
Data Submission Formats, 9-59
A- and B-Basis, 9-60
Derived Properties, 9-60
Fasteners, 9-64
Stress-Strain Curves, 9-64
Other Properties, 9-65
Software, 9-59
Definition of Terms, A-6
Creep/Stress Rupture, 9-154
Fatigue, 9-129, A-8
Fracture Toughness, 9-152
Heat, Melt and Cast, 9-33
Mechanically Fastened Joints, 9-161
Mechanical Properties, 9-16
Statistics, A-5, A-6
Degrees of Freedom, A-8, 9-89, 9-300, 9-302,
9-316
Fastener Analysis, 9-172
F-test, 9-96
t-test, 9-97
Density, 9-8, 9-9, 9-14, 9-29, 9-34, 9-204, A-2,
A-17
Derived Properties, 1-7, 9-33, 9-60, 9-72
Design Mechanical Properties, 9-69
By Regression, 9-80
Determining Form of Distribution, 9-99
Determining Population, 9-77
Direct Computation, 9-114
Non Parametric, 9-116
Pearson, 9-115, 9-119
Weibull, 9- 115, 9-120
Example Problems, 9-181
Presentation, 9-198
Validating, 9-70
Dimensionally Discrepant Castings, 9-13

APPENDIX E - Subject Index (continued)
MMPDS-05
1 April 2010
E-3
Direct Computation of Allowables, 9-77, 9-114,
9-181
Nonparametric Method, 9-116
Pearson Distribution, 9-115, 9-119
Regression, by, 9-122
Weibull Distribution, 9-115, 9-120
Distribution, Form of, 9-99
Documentation Requirements, 9-7
Elastic Properties, 9-34, 9-195
Element Properties
Aluminum, 3-645
Magnesium, 4-61
Steel, 2-249
Titanium, 5-163
Elevated Temperature Curves, 1-13, 9-225
Data Requirements, 9-35
Presentation, 9-226
Working Curves, 9-225
Elongation, 1-10, 9-227
Environmental Effects, 1-13, 1-17, 1-21
Examples of Computation Procedures
Complex Exposure, 9-233
Creep/Stress Rupture, 9-259
Design Allowables, 9-181
Fatigue, 9-235, 9-241, 9-248
Fatigue Crack Growth, 9-253
F-Test, 9-96, 9-179
Fusion-Welded Joints, 9-293
Linear Regression, 9-122
Strain-Departure Method, 9-205
t-Test, 9-97, 9-185
F-Distribution Fractiles, 9-300
F-Test, 9-96
Failure
General, 1-27
Identification code, fastener, 9-66, 9-67
Instability, 1-28
Local, 1-29
Material, 1-27
Types, 1-27
Fastened Joints, 9-266, 9-270
Fasteners, 9-64, 9-161
Data Format, 9-64
H-Type, 9-168, 9-176
S-Type, 9-168, 9-176
Sunset Clause, 9-42, 9-43, 9-44
Fatigue, 9-10, 9-19, 9-129
Data Analysis, 9-133, 9-135, 9-146
Data Generation, 9-19, 9-48, 9-132, 9-248
Data Requirements, 9-19, 9-36, 9-124,
9-235, 9-248
Experimental Design, 9-48
Example Problems, 9-235, 9-241, 9-248
Life Models, 9-134, 9-137, 9-140, 9-142,
9-144, 9-236, 9-244, 9-251, 9-252
Load Control, 9-48, 9-129, 9-132, 9-136,
9-235, 9-241
Outliers, 9-143, 9-244, 9-252
Presentation of Data, 1-15, 9-227, 9-246,
9-253
Properties, 1-14
Runouts, 9-133, 9-147, 9-237, 9-245,
9-252
Strain Control, 9-30, 9-49, 9-129, 9-133,
9-237, 9-248
Terminology, 9-48
Test Planning, 9-49
Time Dependent Effects, 9-149
Fatigue Crack Growth, 1-23, 9-19, 9-149,
9-253
Crack-Growth Analysis, 1-23, 9-150
Data Analysis, 9-150
Data Generation, 9-150
Data Requirements, 9-30, 9-38, 9-150
Presentation of Data, 1-25, 9-253
Forgings, Definition of Grain Directions in,
9-17
Fracture Toughness, 1-19, 9-20, 9-152, 9-258
Analysis, 1-20, 9-152, 9-153
Apparent Fracture Toughness, 1-23
Brittle Fracture, 1-19
Critical Plane-Strain, 1-20
Data Analysis, 9-152, 9-153
Data Generation, 9-38, 9-152
Data Requirements, 9-30, 9-38, 9-152.
9-258
Definitions, 9-152
Environmental Effects, 1-21
Examples, 9-258
Middle Tension Panels, 1-23, 9-20, 9-38,
9-258
Plane Stress, 1-21, 9-20, 9-152, 9-153,
A-12
Plane Strain, 1-20, 9-20, 9-152, A-12
Presentation of Data, 9-258
Testing Standards, 9-15

APPENDIX E - Subject Index (continued)
MMPDS-05
1 April 2010
E-4
Transitional Stress States, 1-21, 9-20, 9-152
Full-Range Stress-Strain Curves, 9-64, 9-216
Fusion-Welded Joints, 9-26, 9-48, 9-176, 9-293
Data Analysis, 9-48, 9-176, 9-178
Data Generation, 9-48, 9-177
Data Requirements, 9-48, 9-177
Experimental Design, 9-56
Presentation of Data, 9-293
Test Methods, 9-26
Goodness-of-Fit Tests, 9-99
Anderson-Darling, 9-99
Normality, 9-100
Pearsonality, 9-101
3 Parameter Weibull Acceptability, 9-100
Weibullness, 9-100
Grain Direction, Treatment of, 9-124
Grouped Data Analysis, 9-28, 9-91, 9-94
Heat, Definition of, 9-33
Heat Requirements, 9-9, 9-28, 9-29
Indirect Design Allowables, 9-9, 9-77, 9-124,
9-194
Procedure, 9-126
Without Regression, 9-124
With Regression, 9-127
Instability, 1-28
Bending, 1-28
Combined Loadings, 1-28
Compression, 1-28
Local, 1-29
Torsion, 1-28
International System of Units, 1-3
k-Sample Anderson-Darling Test, 9-94
Larson-Miller Analysis, 9-55, 9-156, 9-159,
9-261
Legacy Alloys, 9-71
Load Control, 9-14, 9-30, 9-51, 9-241
Location of Test Specimens, 9-16
Lot Requirements, 9-9
Material Failures, 1-27
Bearing, 1-27
Bending, 1-27
Combined Stress, 1-27
Compression, 1-27
Shear, 1-27
Stress Concentrations, 1-27
Tension, 1-27
Material Requirements, 9-13
Material Specifications, 9-13
Maximum Likelihood Estimation, 9-148
Mean Stress/Strain Effects, Evaluation of,
9-242
Mechanical Properties, 9-69
Computation of Design Allowables, 9-77
Derived Properties, 9-32, 9-118, 9-120
Example Problems, 9-173, 9-186
Presentation, 9-198
Terminology for, 9-16
Test Matrix, Derived Property, 9-29, 9-60
Mechanically Fastened Joints, 9-25, 9-161
Data Analysis, 9-161, 9-176, 9-178
Data Requirements, 9-40, 9-181
Definitions, 9-162
Example Problems, 9-181, 9-185, 9-266
Presentation of Data, 9-161, 9-266
Shear Strength Analysis, 9-167
Test Methods, 9-19, 9-25
Yield Load Determination, 9-163
Melt, Definition of, 9-33
Metallurgical Instability, 1-17
Modulus of Elasticity, 1-9, 9-18, 9-34, 9-203,
9-229
Modulus of Rigidity, 1-11, 9-203, 9-229
NASM 1312, 9-13, 9-14, 9-25, 9-26, 9-41,
9-163, D-2
Nomenclature, 1-3
Nonparametric Data Analysis, 9-121, 9-314
Normal Curve Statistics, 9-303
Normality, Assessment of, 9-99
Orientation, Specimen, 9-18
Outliers, Treatment of, 9-10, 9-143, 9-155,
9-244, 9-252
Pearson Method, 9-114, 9-115
Anderson-Darling, 9-101
Backoff, 9-103
Procedure, 9-119
Probability Plot, 9-103
Physical Properties, 9-18, 9-203, 9-230
Poisson’s Ratio, 1-8, 9-15, 9-18, 9-30, 9-203,
A-5
Population, 9-77, A-12
Presentation of Data, 9-181
Creep/Stress Rupture, 9-259
Design Allowables, 9-198
Effect of Temperature Curves, 9-225
Fatigue, 9-240, 9-249
Fatigue Crack Growth, 9-253
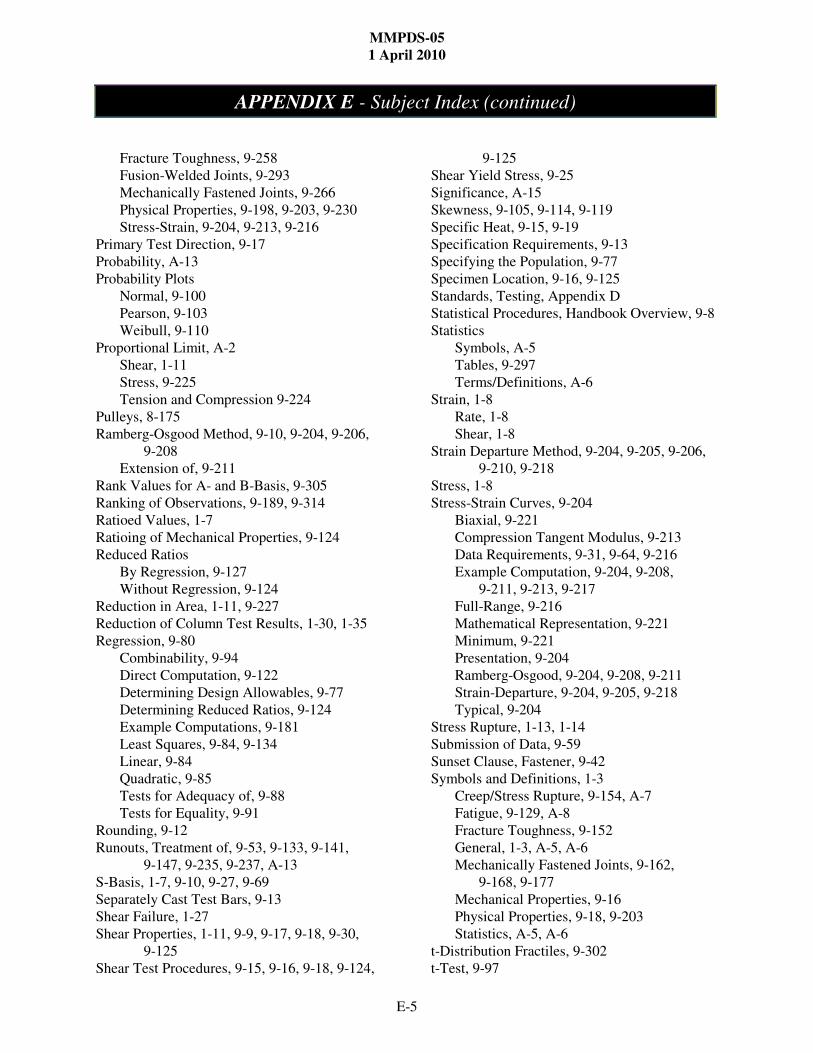
APPENDIX E - Subject Index (continued)
MMPDS-05
1 April 2010
E-5
Fracture Toughness, 9-258
Fusion-Welded Joints, 9-293
Mechanically Fastened Joints, 9-266
Physical Properties, 9-198, 9-203, 9-230
Stress-Strain, 9-204, 9-213, 9-216
Primary Test Direction, 9-17
Probability, A-13
Probability Plots
Normal, 9-100
Pearson, 9-103
Weibull, 9-110
Proportional Limit, A-2
Shear, 1-11
Stress, 9-225
Tension and Compression 9-224
Pulleys, 8-175
Ramberg-Osgood Method, 9-10, 9-204, 9-206,
9-208
Extension of, 9-211
Rank Values for A- and B-Basis, 9-305
Ranking of Observations, 9-189, 9-314
Ratioed Values, 1-7
Ratioing of Mechanical Properties, 9-124
Reduced Ratios
By Regression, 9-127
Without Regression, 9-124
Reduction in Area, 1-11, 9-227
Reduction of Column Test Results, 1-30, 1-35
Regression, 9-80
Combinability, 9-94
Direct Computation, 9-122
Determining Design Allowables, 9-77
Determining Reduced Ratios, 9-124
Example Computations, 9-181
Least Squares, 9-84, 9-134
Linear, 9-84
Quadratic, 9-85
Tests for Adequacy of, 9-88
Tests for Equality, 9-91
Rounding, 9-12
Runouts, Treatment of, 9-53, 9-133, 9-141,
9-147, 9-235, 9-237, A-13
S-Basis, 1-7, 9-10, 9-27, 9-69
Separately Cast Test Bars, 9-13
Shear Failure, 1-27
Shear Properties, 1-11, 9-9, 9-17, 9-18, 9-30,
9-125
Shear Test Procedures, 9-15, 9-16, 9-18, 9-124,
9-125
Shear Yield Stress, 9-25
Significance, A-15
Skewness, 9-105, 9-114, 9-119
Specific Heat, 9-15, 9-19
Specification Requirements, 9-13
Specifying the Population, 9-77
Specimen Location, 9-16, 9-125
Standards, Testing, Appendix D
Statistical Procedures, Handbook Overview, 9-8
Statistics
Symbols, A-5
Tables, 9-297
Terms/Definitions, A-6
Strain, 1-8
Rate, 1-8
Shear, 1-8
Strain Departure Method, 9-204, 9-205, 9-206,
9-210, 9-218
Stress, 1-8
Stress-Strain Curves, 9-204
Biaxial, 9-221
Compression Tangent Modulus, 9-213
Data Requirements, 9-31, 9-64, 9-216
Example Computation, 9-204, 9-208,
9-211, 9-213, 9-217
Full-Range, 9-216
Mathematical Representation, 9-221
Minimum, 9-221
Presentation, 9-204
Ramberg-Osgood, 9-204, 9-208, 9-211
Strain-Departure, 9-204, 9-205, 9-218
Typical, 9-204
Stress Rupture, 1-13, 1-14
Submission of Data, 9-59
Sunset Clause, Fastener, 9-42
Symbols and Definitions, 1-3
Creep/Stress Rupture, 9-154, A-7
Fatigue, 9-129, A-8
Fracture Toughness, 9-152
General, 1-3, A-5, A-6
Mechanically Fastened Joints, 9-162,
9-168, 9-177
Mechanical Properties, 9-16
Physical Properties, 9-18, 9-203
Statistics, A-5, A-6
t-Distribution Fractiles, 9-302
t-Test, 9-97

APPENDIX E - Subject Index (continued)
MMPDS-05
1 April 2010
E-6
Tabular Data Presentation, 9-198
Tangent Modulus Curves, 9-213, 9-221
Temperature Effects, 1-12, 9-225
Tensile Properties, 1-8
Tensile Proportional Limit, 1-10
Tensile Ultimate Stress, 1-10
Tensile Yield Stress, 1-10
Terminology
Creep Rupture, 9-154
Fatigue, 1-14, 9-129
Mechanical Property, 9-16
Test Methods, 9-13
Test Specimens, 9-13, 9-16
Duplication, 9-29, 9-32
Location, 9-16, 9-125
Orientation, 9-16, 9-17
Primary Test Direction, 9-17
Testing Procedures, 9-13
Bearing, 9-14, 9-18
Compression, 9-14, 9-18
Creep/Stress Rupture, 9-14, 9-25, 9-55
Direction, 9-16
Dynamic & Time Dependent Properties, 9-19
Elastic Properties, 9-14
Fatigue, 9-14, 9-19
Fatigue Crack Growth, 9-14, 9-19
Fusion-Welded Joints, 9-26
Fracture Toughness, 9-15, 9-20
Mechanically Fastened Joints, 9-25
Mechanical Properties, 9-14, 9-16
Modulus, 9-14, 9-18
Physical Properties, 9-15, 9-18
Shear, 9-15, 9-18
Short Transverse, 9-18
Specimen Location, 9-16
Stress-Strain, 9-31, 9-204
Tension, 9-15, 9-18
Testing Standards, 9-14, 9-15
Tests of Significance, 9-80, 9-88
Definitions, A-6
F-Test, 9-96
t-Test, 9-97
Test Standards, 9-14, 9-15
Thermal Conductivity, 9-8, 9-15, 9-18, 9-31,
9-204
Thermal Expansion, 9-8, 9-14, 9-18, 9-29,
9-204
Thermal Exposure, 9-10, 9-225
Complex, 9-233
Simple, 9-232
Thin Walled Sections, 1-37
Tolerance Bounds, 9-77, A-15
T90, 9-9, 9-12
T99, 9-12
Tolerance Interval, A-15
Tolerance Level, A-15
Tolerance Limit Factors, A-2
Normal, One-Sided, 9-298
Weibull, One-Sided, 9-304, 9-305
Torsion, Properties
Aluminum, 3-648
Magnesium, 4-64
Steel, 2-252
Truncation, Lower Tail, 9-112
Typical Basis, 9-10
Ultimate Bearing Stress, 1-12
Ultimate Compression Stress, 1-11
Ultimate Shear Stress, 1-12
Ultimate Tensile Stress, 1-10
Ungrouping of Data, 9-28
Units, 1-3, 9-19, 9-204, A-17
Validating Properties, 9-70
Weibull Procedure, 9-120
Weibull Acceptability Test, 9-100, 9-304
Weibull Back-Off, 9-109
Weibull Distribution Estimating, 9-107
Threshold Estimation Factors, 9-107,
9-116, 9-311
Weibullness, Assessment of, 9-107, 9-117,
9-188, 9-193
Weibull Probability Plot, 9-110
Wire Rope, 8-175
Working Curves, Determination of, 9-225
Yield Load Determination, 9-163
Yield Stress
Bearing, 1-12
Biaxial Yield Stress, 1-18
Compression, 1-11
Shear, 1-12, 9-225
Tensile, 1-9, 1-10
Tensile Proportional Limit, 1-8, 9-211