04 combustion
DESCRIPTION
combustion modelingTRANSCRIPT

1
SAE India TOPTECH Seminaron
Engine & Powertrain SimulationJan 10-11, 2008New Delhi, India
Kevin Hoag – University of Wisconsin, MadisonJohn Wilken – Gamma Technologies Inc
Greg Hampson – ENSYSAnupam Dave – Cummins Inc
S.M. Shahed – Honeywell Turbo Technologies
Combustion Simulation
Motivation• Internal Combustion in Engines
where the “fuel meets the air”• What is it and How do we know about it?• Why is this so important?• How do they react, what are the controlling
factors, and what are the results?• Can we model it – express this behavior in general
mathematical physical terms?• Can we better understand and visualize what is
happening INSIDE the combustion chamber?• Can simulations help us improve our
understanding of combustion, improve our experimental program, improve our engine design?
How do we “know” about in-cylinder processes
Via Precision Measurements:• Cylinder Pressure Transducer• Crank Angle Shaft Encoder• High Speed Data Acquisition
System
ICP- Piezo ElectricPressure TransducerFlush mounted
CrankAngleEncoder
Combustion PrimerAtom Conservation (stoichiometry)
HmCn + EA( 0.21 O2 + 0.79 N2) => a H2O + b CO2 + e N2 : EA=1
=> a H2O + b CO2 + d O2 + e N2 : EA >1
=> a H2O + [b CO2 + c CO] + e N2 : EA < 1
Species State (properties)enthalpy or energy state of chemical species
Σ products = [a HH2O + b HCO2 + c HCO + d HO2 + e HN2 ] Σ reactants = [ 1 HmCn + EA ( 0.21 HO2 + 0.79 HN2) ]
Hydrocarbon exothermic reaction in Air
1-reactants
2-products
hfavailableenergy
Heat of Formation @ To
⎟⎠⎞⎜
⎝⎛ += ∫
T
Toiii dCphfNH ττ )(
hi
State
TTo

2
Combustion PrimerEnergy Conservation (add system to chemical species conversion)
( )∫ ⋅−= dVPWork
Hydrocarbon exothermic reaction in Air
T
H dH=0 : Hp= HR
dT=0 : HP= HR - Qhv
States
Reaction Zone
Constraints: (P,T,V)
Reactants Products
control volumeanalysis Heat, Q
HHVtotf QmH ⋅=∆ ,max
( )LHVtotf
gaswall
Qm
UQdVPNAHR
⋅
∆++⋅−= ∫
,
one system:normalized apparent heat
release
1
10
100
1000
-360 -180 0 180 360
Engine Crank Angle (deg)
Pres
sure
(bar
)
0
0.05
Cyl PressNonCombIntakeExhaustFuel InjectionBurn Rate
Intake Compress Power-Expn Exhaust
wocombIgnition >
Combustion - within a thermodynamic engine cycle
Engine Cycle - 4 stroke / Diesel
Fuel Injection
Fuel Injection
IgnitionIgnition BurningExpansionBurning
ExpansionBDCBDC
Air Induction
Air Induction Air
CompressionAir
CompressionExhaustExhaustTDCTDC Expansion
Blow DownExpansionBlow Down
Research & Testing Engine Development Process is Flow upEngine Design Goals• Measured torque/ IMEP• Measured Fuel Efficiency• Measured Emissions
Engine Geometry• Bore• Stroke• CR
Pressure Profile• Compression - rate of rise - Peak pressure• Work – IMEP
Air • Boost• MAT• EGR
Fuel • SOI• Rate of Injection• Injection Quantity
Combustion• Start of Combustion• Heat Release profile
Constraints• Reliability• Noise• Cold start
Engine Design Goals• Desired torque/ IMEP• Desired Fuel Efficiency• Desired Emissions
Engine Geometry• Bore• Stroke• CR
Pressure Profile• Compression - rate of rise - Peak pressure• Work – IMEP
Air • Boost• MAT• EGR
Fuel • SOI• Rate of Injection• Injection Quantity
Combustion• Start of Combustion• Heat Release profile
Constraints• Reliability• Noise• Cold start
Design is Requirements Flow-down

3
Engine Design Goals• Desired torque/ IMEP• Desired Fuel Efficiency• Desired Emissions
Engine Geometry• Bore• Stroke• CR
Pressure Profile• Compression - rate of rise - Peak pressure• Work – IMEP
Air • Boost• MAT• EGR
Fuel • SOI• Rate of Injection• Injection Quantity
Combustion• Start of Combustion• Heat Release profile
Constraints• Reliability• Noise• Cold start
Trace Through a Design Process
7
0
5
43
2
16
1
10
100
1000
0.1 1 10Log Cylinder Volume (liter)
Log
Cyl
inde
r Pre
ssur
e (b
ar)
020
406080
100
120140160
180200
-60 -30 0 30 60Crank Angle (deg)
Pres
sure
(bar
)Polytropic Trace
Wire-FramePressure
-100
0
100
200
300
400
500
600
700
800
-20 -10 0 10 20 30 40Crank Angle (deg)
AH
RR
(J/d
eg)
Piston BowlPiston Bowl
Cylinder HeadCylinder HeadFuel SprayFuel Spray
Wire-Frame
PressureTrace
Heat ReleaseRate
Geom, Air & Fuel
Define “Wire-Frame”Cylinder Pressures to achieve design goals within constraints a’ priori
Idealized Cycle - CI• Polytropic compression• Polytropic expansion• Limited Pressure Cycle
-Constant V@TDC-Constant P=Pmax
• IMEP adjusted by τburn
7
0
5
43
2
16
1
10
100
1000
0.1 1 10Log Cylinder Volume (liter)
Log
Cyl
inde
r Pre
ssur
e (b
ar)
Starting Point:Engine torque (IMEP) requirement
120/NVdIMEPncylPower ⋅⋅⋅=
Wire-Frame / Cycle Diagram
Pmax
CR
Boost
∆P
IMEP
τburn
+
+ / -
VddVP
IMEP ∫ ⋅=
Comparison of SI-gasoline and CI-dieselRealistic Cycle Diagrams
160
20
40
60
80
100
120
140
0 5 10 15 20
Volume Ratio (V/Vtdc)
Pres
sure
(bar
)
SI Cycle
SI Polytropic 1.30
Diesel Cycle
CI Polytropic 1.37
0.1
1
10
100
1000
0.1 1 10 100
Volume Ratio (V/Vtdc)
Pres
sure
(bar
)
SI Cycle
SI Polytropic 1.30
Diesel Cycle
CI Polytropic 1.37
CI-Diesel
CI-DieselSI-Gas
SI-Gas
Linear Pressure vs. Volume Ratio Log Pressure vs. Log Volume Ratio
16
NA-SI engines – no boost, low CR & low slope, large constant volume combustionTDI-CI engines – high boost, high CR ratio & steep slope, small constant volume comb
Max Efficiency = fn(Charge Comp, Geometric CR,…)
0%
10%
20%
30%
40%
50%
60%
70%
80%
0 10 20 30Compression Ratio
Indi
cate
d Ef
ficie
ncy
γ =1.4
γ =1.3
γ =1.25
• Idealized Cycle Efficiency
• Losses & Limitations• Mechanical limits 2-10%• Fuel + Air charge is not
Air• Heat Transfer - 20%• Pumping losses 5-10%• Friction – 10%• Slow Burning – 5%• Fuel pressurization – 2%• NOx reduction 0-10% or
more• Actuation - non-ideal
valve or fuel timing
air
si
ci
η 1 1
CRγ 1

4
0
100
200
300
400
500
600
700
800
-60 -30 0 30 60Crank Angle (deg)
AH
RR
(J/d
eg)
Heat Release
020406080
100120140160180200
-60 -30 0 30 60
Crank Angle (deg)
Pres
sure
(bar
)
Wire-FrameMotored
Design Process: Flow-Down to Burn Rate“Fulcrum” of the design
Pressure vs. Crank AnglePmax
Peoc
Requirements (IMEP, Pmax…)
“Wire-Frame”Cycle Diagram
Pressure Trace
Heat Release
Rate
AHRR vs. Crank Angle
Fuel/Air/Ignition/EGR
Geometry, …
7
0
5
43
2
16
1
10
100
1000
0.1 1 10
Log Cylinder Volume (liter)
Log
Cyl
inde
r Pre
ssur
e (b
ar)
Engine Thermodynamics and Combustion Simulations
Performance Results
(IMEP, P, T…)
Cycle Diagram
Pressure Trace
BurnRate
Flow-down proceeds from engine performance Requirements to Necessary Causes – i.e. reverse causality
Simulation and Engine testing proceeds from Causes to
performance Results– i.e. forward causality, direction of
time
Fuel/Air/Ignition/EGR
Geometry, Event, …
Subject of Combustion Simulations start here
Requirements (IMEP, Pmax…)
“Wire-Frame”Cycle Diagram
Pressure Trace
Heat Release
Rate
Fuel/Air/Ignition/EGR
Geometry, …
time
Simulation Options for Burn RatesPerformance
Results(IMEP, P, T…)
Cycle Diagram
Pressure Trace
BurnRate
Fuel/Air/Ignition/EGR
Geometry, Event, …
Burn Rate Profile Options1) Experimentally Derived Heat Release Profile2) Semi-Empirical Burn Rate Profile3) Parametric Mathematical Burn Rate Profile
Starting with the burn rate profileallows us to essentially ignore what causesthe heat release in favor of focusing on theeffects of a given burn rate has on the engine system
Burn Rate Definition for SimulationsNon-predictive combustion / imposed burn rate profile
• Instantaneous Zero-Dimensional Burn Rate is directly imposed as a simulation input
• Total amount of energy released from the fuel depends on the total mass of fuel and the properties of the gas in the cylinder
• “Burn Rate” tells the simulation the rate which the available fuel + air are converted to products
• “AHRR” or the “Apparent” Heat Release Rate is generally the result of pressure trace analysis
• AHRR rarely matches the Burn Rate magnitude, but often is proportional to the Burn Rate “shape profile”

5
Cylinder Pressure “measurement”Cylinder Voltage to Pressure• Measure a relative dynamic voltage • Calibration• Pinning & Drift• Crank Angle Offset• Cleaning & Checking• Volume Estimates for PV linearity plots
pressure change
drift
graphics: Formulating an Engine Simulation Procedure, Tyler Feralio, RPI University, Troy NY
refrefcal
PovotvdVdPtP +−⋅⎥⎦
⎤= ))(~()(
1. Pressure Data Pre-Processing Checks
Syed Wahiduzzaman Loic BarbierGamma Technologies Inc. Ecole Nationale Superieure D’Electriciteet de Mecanique
Source:
• Classical Heat Release Analysis (method used in most other cylinder pressure analysis tools):
• Result is “apparent” heat release (NOT burn rate)• Employs simplifying assumptions, can enable
quick computations in a test lab while the engine is running
Apparent Heat Release Rate
( )LHVtotf
gaswall
QmUQdVP
NAHRR⋅
∆++⋅−= ∫
,
• Apparent Heat Release Rate Profile– Derived from Experimental Cylinder Pressure Trace -> Apparent– Zero-dimensional– Assumptions implicit in Heat Release Rate calculations are generally
not consistent with simulation method– However, if the goal is to get correct “profile” wrt ignition, 10/90 burn
duration, centroid of HRR, integral of HRR, then• Normalized AHRR can be used as a simulation input• Simulations will generally scale the NAHRR based upon fuel inputs
1. Experimental Burn Rate Profile
-100
0
100
200
300
400
500
600
700
800
-20 -10 0 10 20 30 40
Crank Angle (deg)
AH
RR
(J/d
eg)
0
1
2
3
4
-20 -10 0 10 20 30 40Crank Angle (deg)
Cum
ulat
ive
AH
R (K
J)

6
• SI Wiebe Model– Non-predictive burn rate imposed according to the SI Wiebe
function (50% burned, 10-90% duration, exponent)– Enables transition from NAHRR to a modeled/fit Burn rate– Can be parameterized– Very fast execution
2a. Burn Rate Profile - SI 2b. Burn Rate Profile - DI Diesel• DI Wiebe Model (No default entries)
– Non-predictive burn rate imposed according to the three-term DI Wiebe function
– Enables transition from NAHRR to a modeled/fit Burn rate– Can be parameterized– Very fast execution time
Simulation Options for Predictive Combustion
Performance Results
(IMEP, P, T…)
Cycle Diagram
Pressure Trace
BurnRate
Fuel/Air/Ignition/EGR
Geometry, Event, …
Predictive Burn Rate/Combustion Options
1) Two-Zone Rate 2) Multi-Zone Flame model3) Multi-Zone Spray model4) Full 3D Computational Fluid
Dynamics
Once we are comfortable we have the proper burn rate for our engine and operating conditions, then we can go to the next level – predictive combustion
Why Use Predictive Combustion?• Non-predictive combustion is useful when the subject
of the study does not directly affect combustion rate in a significant way– Exhaust acoustics– Intake manifold geometry– Turbocharger performance– Engine model build up
• Predictive combustion is required when subject of study directly affects combustion rate– Injection timing and profiles– EGR rates– Swirl
• Predictive combustion also useful for running a variety of loads/speeds where it may not be practical to impose burn rates from cylinder pressure

7
Predictive Combustion for SimulationsPredictive combustion / computed burn rate
• Burn rate is computed directly from: fuel injection rate, spray/gas interactions, species concentrations, time and spacial evolutions, geometry, …
• Global behavior is integral of Local & Multi-dimensional behavior (non-uniform temperature & species concentrations, but pressure equalizes quickly)
• Non-uniform spatial and temporal distributions enable realistic emissions predictions
• Physics based & More universal – physics connects the dots between known data
• Inputs are more physical and suitable for engineering design exploration studies
1. Combustion - Two-Zone• Thermodynamic Two-Zone model
– Models Unburned and Burned zones – Burn rate controlled by input profile or predictive model– Converts Unburned reactant mixture to burned products– Compression of unburned and burned products– Good for NOx emissions predictions, especially SI– Burn Rate can be predictive and coupled to flame
advancement in simulations & can include geometry dependency
piston
unburnedburned
TuTb
“flame”
2. Combustion Flame Model - SI• SI Turbulent Flame Model
– Predictive burn rate taking into account:• cylinder temperature and pressure• composition in the cylinder including fuel, fresh air, and
egr/residuals• Spark timing, position, and gap• Fuel properties• Flame area/Wall wetted area• In-cylinder flow
– Slow execution– Combustion chamber geometry (head and piston) may
be read from an .STL file or generated automatically from dimensions entered by the user
SI NOx and Knock
• Predictive NOx Model (extended Zeldovich)– Temperature tracked in many zones– Sensitive to heat release rate and composition
(including EGR)– Sensitive to pressure, temperature, equivalence
ratio, and dilution ratio
• Predictive Knock Model– Correlate predicted knock index to measurements
of knock initiation and strength– Knock index predicts knock trends– Cylinder wall temperatures should be specified by
either the detailed or solution reference objects
8
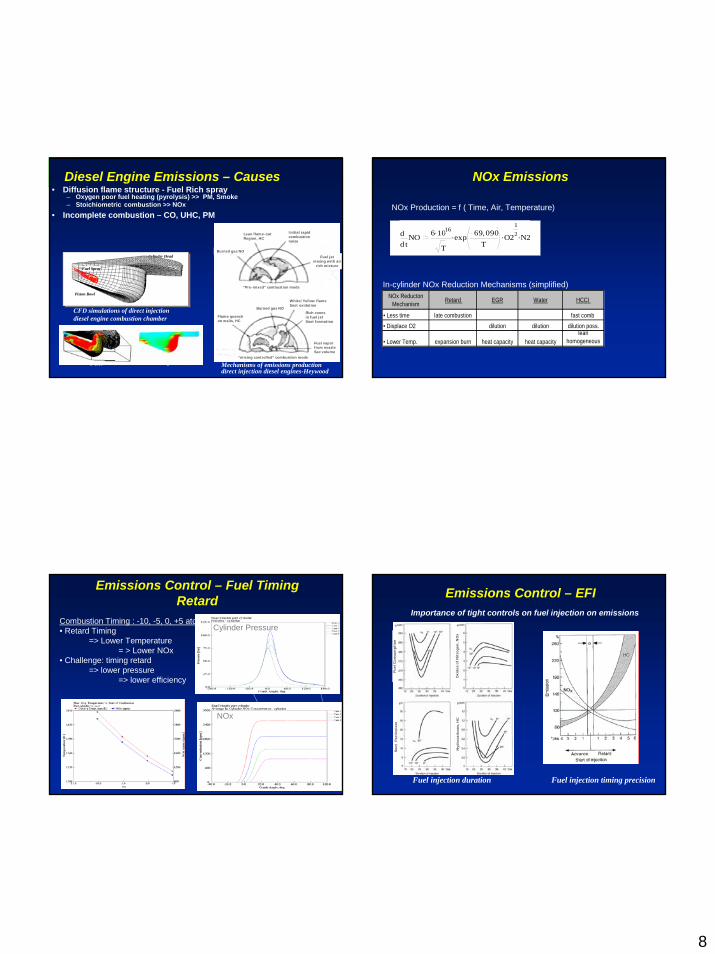
Diesel Engine Emissions – Causes• Diffusion flame structure - Fuel Rich spray
– Oxygen poor fuel heating (pyrolysis) >> PM, Smoke– Stoichiometric combustion >> NOx
• Incomplete combustion – CO, UHC, PM
Piston BowlPiston Bowl
Cylinder HeadCylinder Head
Fuel SprayFuel Spray
CFD simulations of direct injectiondiesel engine combustion chamber
Mechanisms of emissions productiondirect injection diesel engines-Heywood
TemperatureFuel
Lean flame-out Region, HC
Initial rapidcombustionnoise
Fuel jetmixing with air
rich mixture
Burned gas NO
“Pre-mixed” combustion mode
Flame quenchon walls, HC
Burned gas NO
White/Yellow flameSoot oxidation
Rich zonesin fuel jetSoot formation
“mixing controlled” combustion mode
Fuel vaporfrom nozzleSac volume
NOx Emissions
NOx Production = f ( Time, Air, Temperature)
In-cylinder NOx Reduction Mechanisms (simplified)NOx Reducton
Mechanism Retard EGR Water HCCI
• Less time late combustion fast comb
• Displace O2 dilution dilution dilution poss.
• Lower Temp. expansion burn heat capacity heat capacitylean
homogeneous
dd t
NO ....6 1016
Texp ,69 090
TO2
12 N2
Emissions Control – Fuel Timing Retard
Combustion Timing : -10, -5, 0, +5 atdc• Retard Timing
=> Lower Temperature = > Lower NOx
• Challenge: timing retard => lower pressure
=> lower efficiency
Cylinder Pressure
NOx -10
-50+5
Emissions Control – EFI
Fuel injection timing precisionFuel injection duration
Importance of tight controls on fuel injection on emissions
Fuel
Con
sum
ptio
n
Oxi
des
of N
itro
gen
, NO
x
Soot
Par
ticu
late
Hyd
roca
rbon
s, H
C

9
Emissions Control - EGR Emissions Control - EGR
Sandia NL, 9th Int’l Engine Conference, 6/05
Local Equivalence Ratio and Temperature dictate NOx and Soot formation propensity
3. Combustion - DI Diesel• DI Jet Model / Hiroyasu Model
– Predictive burn rate model, Takes into account:• Cylinder pressure and temperature• Injection timing, rate, velocity, and plume shape• Composition in the cylinder including fuel, fresh air,
and EGR/residuals• In-cylinder flow (Swirl and Tumble)
– Slow execution– Predictive NOx Model– Predictive SOOT Model (trends only)
Calibration• Match measured pressure using imposed non-
predictive HRR • Base engine model with imposed burn rates should be
well correlated BEFORE attempting detailed combustion model calibration
• Use single cylinder model with imposed BC to save time
• Calibrate at several points in operating range– Speed– Load– EGR rates
• All calibrated multipliers should be constant for all speeds, loads and EGR rates

10
Calibration
On single-cylinder model:• Impose fuel injection rate • Impose pressure/temperature
boundary conditions• Adjust Ignition delay parameters• Adjust Evaporation parameters• Adjust Entrainment parameters
DI jet model – Results Example
Combustion Prediction in a Truck DI Diesel Engine
Heat Release with and without EGR
NOx Prediction: Effect of SOI & Fuel Rate
50% load
75% load
100% load

11
NOx Prediction: EGR Effect
50% load
75% load
100% load
NOx Prediction: Speed Effect
50% load
75% load
100% load
NOx and Soot Tradeoff 3. Combustion – 3D CFD• 3D CFD (e.g. DOE/Los Alamos KIVA-3V code, StarCd,
Fluent….) • Full 3D CFD code simulates process which control combustion
& emissions:– gas flow, compression, turbulence & mixing (finite volume)– fuel jet breakup (e.g. Kelvin-Helmholtz model) – fuel droplet breakup (e.g. Rayleigh-Taylor model )– ignition (e.g. Shell model )– combustion (e.g. Lam/Turb characteristic timescale models ) – NOx (e.g. Extended Zel’dovich mechanism )– soot formation (e.g. Hiroyasu model )– soot oxidation (e.g. Nagle-Strickland model )

12
FLOW SOLVER: KIVA
Initialization
Phase A
Phase B
Phase C
Read Input DataCalculate gas viscosity
Initialize time step, piston velocity
Spray Modeling (injection, drop breakup, collision, evaporation)Combustion chemistry
Emission modeling
Fluid phase calculationMass, momentum, velocity, temperature, pressure, turbulence
properties (implicit solver, iterations)
Snapping/Rezoning gridsRemapping fluid properties to new grids
Update cell properties
IN-CYLINDER MODELS• Fluid Phase
– Continuity equations– Momentum equations– Internal energy equations– K-epsilon equations
• Boundary Conditions– Physical boundaries:
• inflow/outflow, rigid walls, periodic boundaries.– Numerical boundary conditions:
• Temperature: adiabatic, fixed T.• Velocity: free slip, no slip, turbulent law-of-the-wall• Turbulent parameters • Droplets: handled by drop-wall impingement model
DIESEL SCHEMATIC (ERC)
Fuel injectionnozzle cavitation
spray breakup
Drop/wall impingement
Drop distortionvaporizationturbulent dispersion
Autoignition/combustionsoot/NOx formation
Wall heat transfer
3D models in Practice• 3D Combustion & Spray CFD
– Very Slow Run times– Open cylinder simulations – need to include valve events
in meshing and BC at inlet to manifolds– Closed cylinder simulations – need BC: P, T, TKE at IVC
from other source (e.g. 1D solver)– Impose or compute fuel injection rates
• Calibration – this is significant, do not under-estimate– Need comprehensive data set over wide parameter space– Each submodel carries calibration constants (breakup,
evaporation, turbulence, mixing, wall impingement, ignition, heat transfer, NOx, Soot, meshing )

13
OUTPUT – Temperature at 30o Plane
Cra
nk A
ngle
(deg
)
OUTPUT - Fuel and CO mass fractions
OUTPUT
simulation time evolution animation
Summary - Engine Thermodynamics and Combustion Simulations
Performance Results
(IMEP, P, T…)
Cycle Diagram
Pressure Trace
BurnRate
Fuel/Air/Ignition/EGR
Geometry, Event, …
Step 1 impose burn rate
Requirements (IMEP, Pmax…)
“Wire-Frame”Cycle Diagram
Pressure Trace
Heat Release
Rate
Fuel/Air/Ignition/EGR
Geometry, …
Step 2 predictive combustion
Step 0 For engine design studies, determine “target” heat release rate to meet engine requirements
Sim
ulat
ion
& Ti
me

14
Summary - Engine Thermodynamics and Combustion Simulations (1)
• Burn Rate is “fulcrum” of engine system thermodynamics• Burn Rate integrates up to cylinder pressure and to
engine performance and can be defined by requirements• Take a “process approach” to Combustion Simulations
i. start simple => experimental pressure trace & NAHRR• use this to get the breathing & turbo model working• does not depend upon fuel injection rate profile
ii. go to semi-empirical, mathematical fit – Wiebe• more universal, flexible, enable “what if” and design
requirement studiesiii. parameterize the fit – parametric Wiebe coefficientsiv. increase generality with predictive combustion
• SI flame • DI jet models (requires fuel injection rate profile)
v. CFD simulations• maximum degree of predictive capabiliyt• but requires tuning and calibration• longer run times
Summary - Engine Thermodynamics and Combustion Simulations (2)
• Combustion Rate & its impact on engine operating condition
• “Process approach” to Combustion Simulations
• When to add complexity