03/10/2018 acermarketmonitoringreport2017
TRANSCRIPT

ACER Market Monitoring Report 2017 - Gas Wholesale MarketsVolume
Document title:
Publishing date: 03/10/2018
We appreciate your feedback
Please click on the icon to take a 5’ online surveyand provide your feedback about this document
Share this document
ACER/CEER
Annual Report on the Results of Monitoring the Internal Electricity and Natural Gas Markets in 2017Gas Wholesale Markets Volume
September 2018
© Agency for the Cooperation of Energy Regulators and the Council of European Energy Regulators, 2018Reproduction is authorised provided the source is acknowledged.
Legal notice
The joint publication of the Agency for the Cooperation of Energy Regulators and the Council of European Energy Regulators is protected by copyright. The Agency for the Cooperation of Energy Regulators and the Council of European Energy Regulators accept no responsibility or liability for any consequences arising from the use of the data contained in this document.
3
A C E R / C E E R A N N U A L R E P O R T O N T H E R E S U L T S O F M O N I T O R I N G T H E I N T E R N A L N A T U R A L G A S M A R K E T S I N 2 0 1 7
ACER/CEER
Annual Report on the Results of Monitoring the Internal Electricity and Natural Gas Markets in 2017Gas Wholesale Markets Volume
September 2018
The support of the Energy Community Secretariat in coordinating the collection and in analysing the information related to the Energy Community Contracting Parties is gratefully acknowledged.
CEER
Mr Andrew EbrillT +32 (0)2 788 73 35E [email protected]
Cours Saint-Michel 30a, box F1040 BrusselsBelgium
Trg republike 3 1000 Ljubljana Slovenia
If you have any queries relating to this report, please contact:
ACER
Mr David MerinoT +386 (0)8 2053 417E [email protected]
4
A C E R / C E E R A N N U A L R E P O R T O N T H E R E S U L T S O F M O N I T O R I N G T H E I N T E R N A L N A T U R A L G A S M A R K E T S I N 2 0 1 7
ContentsExecutive summary . . . . . . . . . . . . . . . . . . . . . . . . . . . . . . . . . . . . . . . . . . . . . . . . . . . . . . . . . . . . . . . . . . . . . . . . . . . . . . . . . . . . . . . . . 5
Recommendations . . . . . . . . . . . . . . . . . . . . . . . . . . . . . . . . . . . . . . . . . . . . . . . . . . . . . . . . . . . . . . . . . . . . . . . . . . . . . . . . . . . . . . . . . . 8
1. Introduction . . . . . . . . . . . . . . . . . . . . . . . . . . . . . . . . . . . . . . . . . . . . . . . . . . . . . . . . . . . . . . . . . . . . . . . . . . . . . . . . . . . . . . . . . 11
2. Overview of the Internal Gas Market in 2017 . . . . . . . . . . . . . . . . . . . . . . . . . . . . . . . . . . . . . . . . . . . . . . . . . . . . . . . . . 122.1 Demand and supply developments . . . . . . . . . . . . . . . . . . . . . . . . . . . . . . . . . . . . . . . . . . . . . . . . . . . . . . . . . . . . . . . 122.2 Price developments . . . . . . . . . . . . . . . . . . . . . . . . . . . . . . . . . . . . . . . . . . . . . . . . . . . . . . . . . . . . . . . . . . . . . . . . . . . . . . 152.3 Assessment of supply sourcing costs . . . . . . . . . . . . . . . . . . . . . . . . . . . . . . . . . . . . . . . . . . . . . . . . . . . . . . . . . . . . . 162.4 Infrastructure and system operation developments . . . . . . . . . . . . . . . . . . . . . . . . . . . . . . . . . . . . . . . . . . . . . . . 18
3. Gas target model indicators: an assessment of EU gas markets’ performance . . . . . . . . . . . . . . . . . . . . . . . . 243.1 Assessment of resilience and competition in EU gas markets: AGTM market health metrics . . . . . . . 253.2 Assessment of the functioning of EU gas hubs: AGTM market participants’ needs benchmarks . . . . 27
3.2.1 Hub gas traded volumes . . . . . . . . . . . . . . . . . . . . . . . . . . . . . . . . . . . . . . . . . . . . . . . . . . . . . . . . . . . . . . . . . . . . . 283.2.2 Liquidity at EU hubs’ spot markets . . . . . . . . . . . . . . . . . . . . . . . . . . . . . . . . . . . . . . . . . . . . . . . . . . . . . . . . . . . . 303.2.3 Liquidity at EU hubs’ prompt markets . . . . . . . . . . . . . . . . . . . . . . . . . . . . . . . . . . . . . . . . . . . . . . . . . . . . . . . . . 323.2.4 Liquidity at EU hubs’ forward markets . . . . . . . . . . . . . . . . . . . . . . . . . . . . . . . . . . . . . . . . . . . . . . . . . . . . . . . . . 343.2.5 Competition at EU hubs’ spot, prompt and forward markets . . . . . . . . . . . . . . . . . . . . . . . . . . . . . . . . . . . . 35
3.3 Gas hub categorisation . . . . . . . . . . . . . . . . . . . . . . . . . . . . . . . . . . . . . . . . . . . . . . . . . . . . . . . . . . . . . . . . . . . . . . . . . . 38
4. Impact of Network Codes on market functioning . . . . . . . . . . . . . . . . . . . . . . . . . . . . . . . . . . . . . . . . . . . . . . . . . . . . . 394.1 Gas hub price metrics . . . . . . . . . . . . . . . . . . . . . . . . . . . . . . . . . . . . . . . . . . . . . . . . . . . . . . . . . . . . . . . . . . . . . . . . . . . 39
4.1.1 Price convergence and price correlation among EU gas hubs . . . . . . . . . . . . . . . . . . . . . . . . . . . . . . . . . 394.1.2 Comparison of cross-border transportation tariffs. . . . . . . . . . . . . . . . . . . . . . . . . . . . . . . . . . . . . . . . . . . . . . 434.1.3 Relationship between transportation tariffs and price spreads across EU hubs . . . . . . . . . . . . . . . . . 46
4.2 Market effects of implementing NCs . . . . . . . . . . . . . . . . . . . . . . . . . . . . . . . . . . . . . . . . . . . . . . . . . . . . . . . . . . . . . . 494.2.1 Integrated assessment of market effects of CAM, CMP and TAR NCs and GL . . . . . . . . . . . . . . . . . 494.2.2 Assessment of market effects of BAL NC . . . . . . . . . . . . . . . . . . . . . . . . . . . . . . . . . . . . . . . . . . . . . . . . . . . . . 60
5
A C E R / C E E R A N N U A L R E P O R T O N T H E R E S U L T S O F M O N I T O R I N G T H E I N T E R N A L N A T U R A L G A S M A R K E T S I N 2 0 1 7
Executive summary1 Europe is becoming more dependent on gas imports. Demand for gas in the EU rose by 5% in 2017 com-
pared to the previous year. The increase was mainly driven by increased gas-fired electricity generation. The EU imported 76% of the gas it needed, most from Russia, Norway and Algeria. LNG imports were 12% higher in 2017 than in 2016. Domestic production continued to decline and stood at 24% of EU consumption.
2 Total EU hub-traded volumes in 2017 were around 3% lower compared to 2016. This is explained by lower price volatility at the largest hubs (TTF, NBP and NGC). However, other hubs saw an increase in trade. Gas prices also recovered from lower values in 2016, e.g. North West Europe (NWE) hubs’ day-ahead prices were 20% higher than in 2016. In 2017, hub price purchases accounted for around 70% of supplies across Europe, with differences between regions.
3 The European gas system is characterised by high overall levels of Security of Supply (SoS). On aver-age, only 25% of the available capacity of LNG facilities was used in 2017. Underground Gas Storage (UGS) facilities’ utilisation rate was 57%. The utilisation rate of cross-border Interconnection Points (IPs) measured by the yearly average ratio of nominations over booked capacity in 2017 was estimated at 57%1. Investments in infrastructure and regulatory measures (like the application of reverse flows) to alleviate bottlenecks appear to be effective. However, in some regions, mainly in South South-East (SSE), bottlenecks remain.
4 The EU gas system showed high levels of resilience in the face of accidents (e.g. Baumgarten IP accident) and climatic conditions (colder winter than usual) in 2017. Year-on-year changes in gas flows were smoothly accommodated when market circumstances dictated it. This shows that many markets have improved in terms of flexibility and liquidity and that the infrastructure can guarantee gas supply even during unexpected events.
5 Markets in the North-West Europe region tend to be the most competitive and resilient. A few Member States (MSs) still depend on a single source, which hinders the development of a competitive gas wholesale market.
6 European gas wholesale markets continued to show increasing levels of convergence in 2017, in terms of both supply sourcing costs and of gas hub prices (although to a lower extent for the latter due to the absence of hubs in a number of MSs).
• Supply sourcing costs at the MS’ level continued to converge in 2017: the maximum spread between EU MSs for supply sourcing costs decreased to below 3.5 euros/MWh, and in most cases was below 1 euro/MWh. A couple of years ago, spreads of 5 euros/MWh were common.
• Price convergence at gas hubs also increased. Gas hubs in NWE registered the highest price convergence in the EU, because of similar market fundamentals, ease of access for upstream suppliers, stable increase in hub trading, relatively lower-priced cost of transportation capacity and surpluses of long-term contracted capacity and commodity. Price integration in the Central and Eastern Europe (CEE) region has improved in recent years, while Mediterranean hubs showed lower convergence. This is due, among other things, to lower interconnection capacity levels, the pancaking of transportation tariffs and weaker hub functioning.
7 TTF and NBP continue to be the EU’s best functioning hubs. TTF and NBP distinguish themselves from the other hubs mainly because of the higher development of their forward markets (e.g. traded volumes on the curve, longer trading horizon, tighter bid-ask spreads). Over the last two years, TTF has overtaken NBP both in volumes traded and in its role as price-setter in Europe.
1 Based on a sample of 20 IPs. The use of averages is illustrative meant to show the overall European situation. Peak utilization ratios of infrastructure are also needed when dimensioning the gas system.
6
A C E R / C E E R A N N U A L R E P O R T O N T H E R E S U L T S O F M O N I T O R I N G T H E I N T E R N A L N A T U R A L G A S M A R K E T S I N 2 0 1 7
8 There is ongoing hub specialisation, especially for forward transactions. Market participants are migrat-ing to TTF for forward trading and hedging, while most of their transactions at other hubs are on the spot and near-curve markets. It is clear that market participants are choosing TTF, and to a lesser extent NBP, as the hubs where they perform their forward-related operations in a process that resembles past developments at the Henry Hub in the US2.
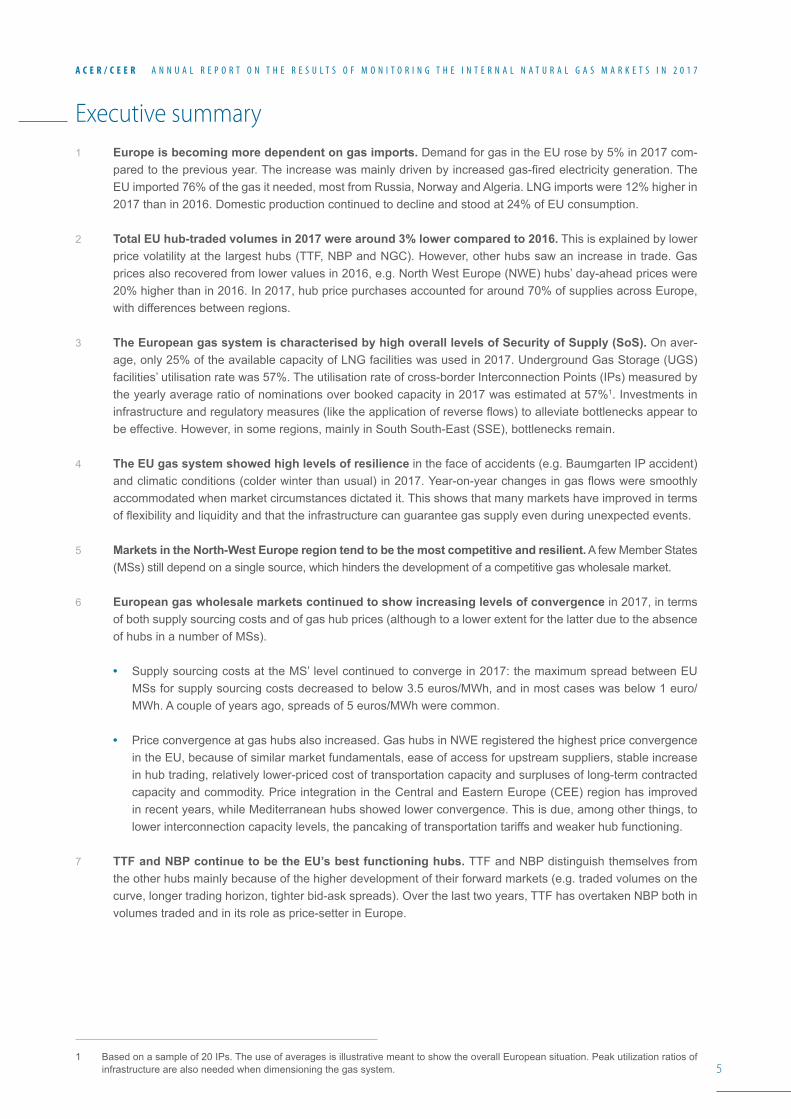
9 The difference between better functioning hubs and those without transparent trading venues contin-ues to increase. Figure 1 presents a classification of gas hubs. The groupings reflect the results of the ACER Gas Target Model (AGTM) metrics analysed in this Market Monitoring Report (MMR). While there are notable positive developments in the Iberian and Baltic regions, those MSs where a trading venue with a transparent price mechanism is either absent or not visible during many trading days of the year continue to fall behind better performers. These MSs will find it harder to catch up as the difference becomes bigger and bigger. The Energy Community Contracting Parties (EnC CPs) still show very limited hub trading activity.
Figure 1: Ranking of EU hubs based on monitoring results - 2017
Source: ACER based on AGTM metric results.
10 More market zones or MSs are engaged in integration efforts. The AGTM recommends market integration as a way of addressing the weak performance of individual markets3. A number of market integration initiatives are explored, with the BeLux initiative already implemented. In terms of milestones, it is worth mentioning the integration of the Estonian and Latvian markets in the GET Baltic exchange. The Portuguese market is also in the process of being integrated into the Iberian Mibgas platform.
2 See: MMR 2015, section 4.3; Comparison of NBP/TTF with market features of US Henry Hub.
3 The Agency is of the opinion that the number of hubs and their location is a market decision.
Established hubs• Broad liquidity • Sizeable forward markets which contribute to
supply hedging• Price reference for other EU hubs and for
long-term contracts indexation
Advanced hubs• High liquidity• More reliant comparatively on spot products • Progress on supply hedging role but relatively
lower liquidity levels of longer-term products
Emerging hubs• Improving liquidity from a lower base taking
advantage of enhanced interconnectivity and regulatory interventions
• High reliance on long-term contracts and bilateral deals
Iliquid-incipient hubs• Embryonic liquidity at a low level and mainly
focused on spot• Core reliance on long-term contracts and
bilateral deals• Diverse group with some jurisdictions having
- organised markets in early stage - to develop entry-exit systems
7
A C E R / C E E R A N N U A L R E P O R T O N T H E R E S U L T S O F M O N I T O R I N G T H E I N T E R N A L N A T U R A L G A S M A R K E T S I N 2 0 1 7
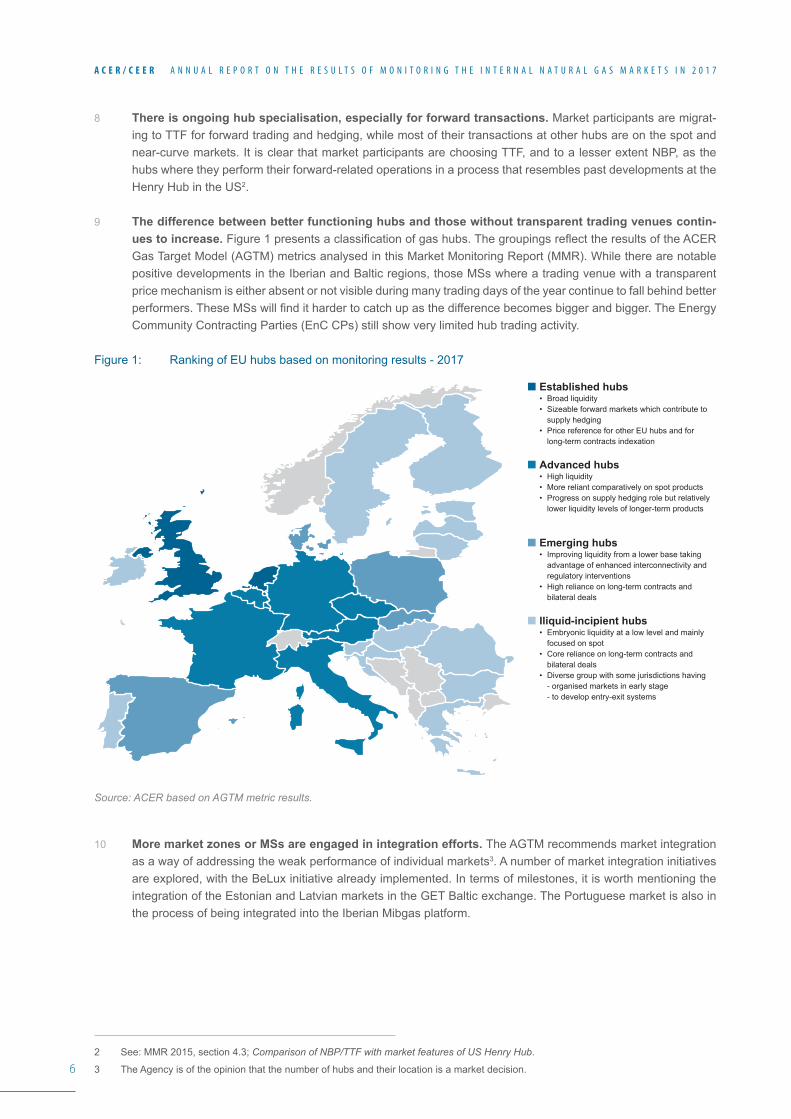
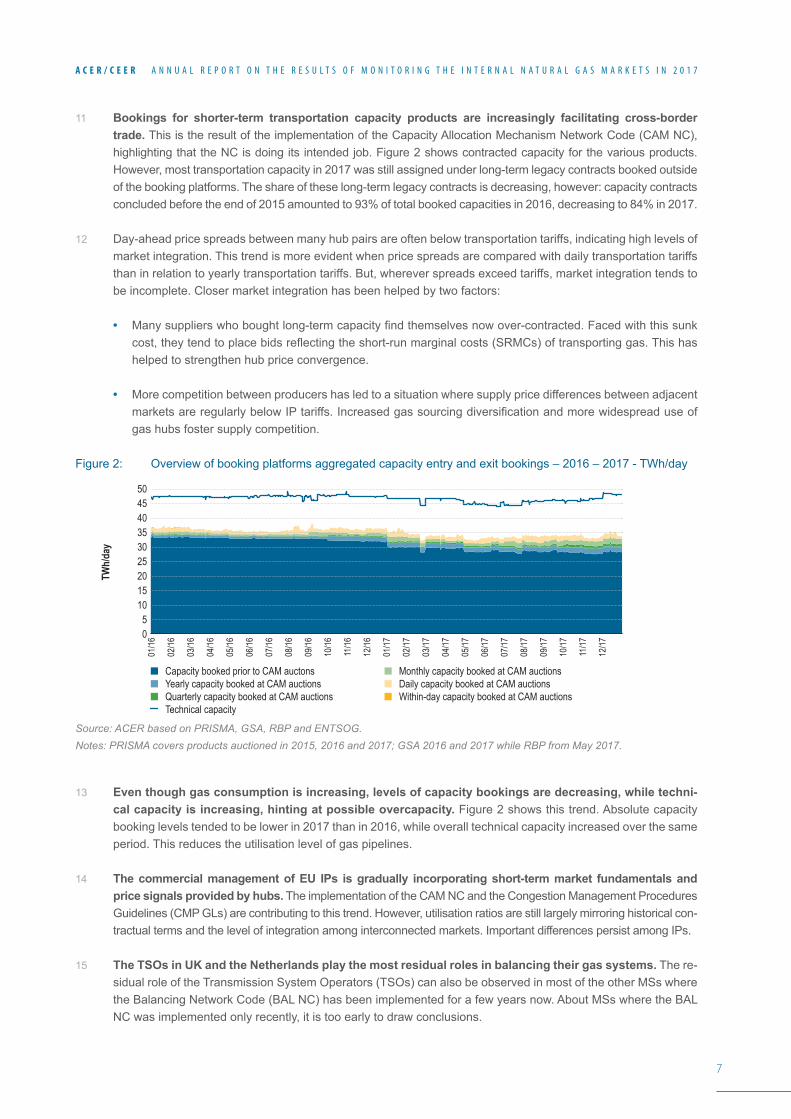
11 Bookings for shorter-term transportation capacity products are increasingly facilitating cross-border trade. This is the result of the implementation of the Capacity Allocation Mechanism Network Code (CAM NC), highlighting that the NC is doing its intended job. Figure 2 shows contracted capacity for the various products. However, most transportation capacity in 2017 was still assigned under long-term legacy contracts booked outside of the booking platforms. The share of these long-term legacy contracts is decreasing, however: capacity contracts concluded before the end of 2015 amounted to 93% of total booked capacities in 2016, decreasing to 84% in 2017.
12 Day-ahead price spreads between many hub pairs are often below transportation tariffs, indicating high levels of market integration. This trend is more evident when price spreads are compared with daily transportation tariffs than in relation to yearly transportation tariffs. But, wherever spreads exceed tariffs, market integration tends to be incomplete. Closer market integration has been helped by two factors:
• Many suppliers who bought long-term capacity find themselves now over-contracted. Faced with this sunk cost, they tend to place bids reflecting the short-run marginal costs (SRMCs) of transporting gas. This has helped to strengthen hub price convergence.
• More competition between producers has led to a situation where supply price differences between adjacent markets are regularly below IP tariffs. Increased gas sourcing diversification and more widespread use of gas hubs foster supply competition.
Figure 2: Overview of booking platforms aggregated capacity entry and exit bookings – 2016 – 2017 - TWh/day
Source: ACER based on PRISMA, GSA, RBP and ENTSOG. Notes: PRISMA covers products auctioned in 2015, 2016 and 2017; GSA 2016 and 2017 while RBP from May 2017.
13 Even though gas consumption is increasing, levels of capacity bookings are decreasing, while techni-cal capacity is increasing, hinting at possible overcapacity. Figure 2 shows this trend. Absolute capacity booking levels tended to be lower in 2017 than in 2016, while overall technical capacity increased over the same period. This reduces the utilisation level of gas pipelines.
14 The commercial management of EU IPs is gradually incorporating short-term market fundamentals and price signals provided by hubs. The implementation of the CAM NC and the Congestion Management Procedures Guidelines (CMP GLs) are contributing to this trend. However, utilisation ratios are still largely mirroring historical con-tractual terms and the level of integration among interconnected markets. Important differences persist among IPs.
15 The TSOs in UK and the Netherlands play the most residual roles in balancing their gas systems. The re-sidual role of the Transmission System Operators (TSOs) can also be observed in most of the other MSs where the Balancing Network Code (BAL NC) has been implemented for a few years now. About MSs where the BAL NC was implemented only recently, it is too early to draw conclusions.
TWh/
day
01/16
02/16
03/16
04/16
05/16
06/16
07/16
08/16
09/16
10/16
11/16
12/16
01/17
02/17
03/17
04/17
05/17
06/17
07/17
08/17
09/17
10/17
11/17
12/17
50
40
30
10
20
0
45
35
15
25
5
Capacity booked prior to CAM auctonsYearly capacity booked at CAM auctionsQuarterly capacity booked at CAM auctionsTechnical capacity
Monthly capacity booked at CAM auctionsDaily capacity booked at CAM auctionsWithin-day capacity booked at CAM auctions
8
A C E R / C E E R A N N U A L R E P O R T O N T H E R E S U L T S O F M O N I T O R I N G T H E I N T E R N A L N A T U R A L G A S M A R K E T S I N 2 0 1 7
RecommendationsWHAT SHOULD THE ENERGY REGULATORY COMMUNITY FOCUS ON?
16 This Report shows that the Internal Gas Market (IGM) is functioning better, especially in the NWE region. The ongoing implementation of the gas NCs is reinforcing this trend. However, there is still a large divergence of market maturity across the EU and an EU-wide IGM is not a reality yet. The implementation of the Third Energy Package is not complete in all MSs so it is worth revisiting the recommendations of last year’s MMR, as many remain valid.
• A number of MSs (Bulgaria, Croatia, Finland4, Greece, Ireland, Romania, Slovenia and Sweden are the most patent cases) do not have all the building blocks of a functioning hub system in place. In addition, and as revealed by the separate Agency’s NCs Implementation Monitoring Reports, several MSs still need to fully implement the NCs5.
• This Report also shows analytically the benefits of a coherent implementation of the NCs for liquidity, com-petition and price convergence. In this respect, National Regulatory Authorities (NRAs) can, among other things: lower day-ahead (DA) multipliers quicker than foreseen in the Network Code on Harmonised Trans-mission Tariff Structures (TAR NC); make sure that TSOs offer short-term capacity at more competitive pric-es, while at the same time ensuring that prices for other capacity products do not rise; encourage short-term wholesale markets with adequate balancing rules and design; and apply CMPs as a preventive measure where contractual congestion is likely to occur.
• MSs should avoid taking measures that go against the spirit of the Third Energy Package and the interest of the IGM as they tend to have an immediate, adverse impact on market functioning. Similarly, they should abolish any remaining barriers to market functioning, such as market distortive storage regulations, limita-tions on free cross-border trading of local gas production; distortive licensing requirements limiting market entry of traders, and the use of different definitions across the EU for firm capacity.
17 Market monitoring and market surveillance to detect and deter market manipulation and anti-competitive behav-iour should complement regulatory implementation towards an EU-wide IGM. This will safeguard IGM benefits like fair competition and high social welfare levels. Hence:
• EU institutions should ensure adequate attention to market surveillance and the tasks attributed to the Agency by Regulation (EU) No 1227/20116.
• The responsible institutions at national level should do the same for the tasks attributed to them in accordance with the same Regulation (EU) No 1227/2011. NRAs are encouraged to acquire certification on security as-pects to access REMIT national data. This will also limit the need for double reporting by market participants.
18 Any new legislative package on gas should build on the current gas market and regulatory model, which is delivering positive results. It should develop from a clear vision on the role of (natural and renewable) gas and be aligned with the Clean Energy Package (CEP). Plenty of gas infrastructure has been added in recent years to increase interconnectivity and market integration. However, parts of the gas transportation infrastructure are currently far from being fully utilised with the risk that regulated infrastructure becomes stranded resulting in social welfare loss for consumers.
4 Finland exempted until 2020.
5 See ACER Implementation Monitoring Report on the CAM NC, page 10 https://www.acer.europa.eu/Official_documents/Acts_of_the_Agency/Publication/Implementation_Monitoring_Report_on_the_Capacity_Allocation_Mechanisms_Network_Code.pdf, ACER Implementation Monitoring Report on Contractual Congestion at IPs, pages 3, 21: https://www.acer.europa.eu/Official_documents/Acts_of_the_Agency/Publication/Congestion%20Report%205th%20ed.pdf ACER Implementation Monitoring Report on the BAL NC: https://www.acer.europa.eu/Official_documents/Acts_of_the_Agency/Publication/ACER%20Report%20on%20the%20implementation%20of%20the%20Balancing%20Network%20Code%20(Third%20edition).pdf.
6 Regulation on wholesale energy market integrity and transparency (REMIT). See: https://eur-lex.europa.eu/legal-content/EN/TXT/?uri=CELEX%3A32011R1227.
9
A C E R / C E E R A N N U A L R E P O R T O N T H E R E S U L T S O F M O N I T O R I N G T H E I N T E R N A L N A T U R A L G A S M A R K E T S I N 2 0 1 7
19 Continuous alignment of the Energy Community to the acquis communautaire of the EU is a pre-condition for market integration and cross-border trading of the Contracting Parties. Boosting liquidity in the Energy Com-munity must predominantly rely on integration with neighbouring EU markets, having in mind the size and state of development of the Contracting Parties’ gas markets.
WHAT ACTIONS ARE NEEDED TO IMPROVE THE GAS HUB MODEL OUTLINED IN THE ACER GAS TARGET MODEL?
20 The Agency and NRAs should explore ways to implement the AGTM, given the persistent and widening gap be-tween the best and worst performing gas wholesale markets. The assessment of EU gas markets’ performance based on AGTM metrics shows the need for most hubs to develop further.
• As the advanced and developing hubs have improved, (spot) liquidity is by and large present or developing, but forward liquidity is still insufficient and is unlikely to improve sufficiently to meet the AGTM thresholds. Market participants seem to have chosen a couple of specialised hubs for forward trading and this choice needs to be respected. The planned merger efforts (e.g. in France and Germany) could further enhance liquidity and market functioning.
• The liquidity in embryonic-illiquid hubs is still very low, hence there is a need to enact trading-oriented re-forms. Some integration efforts could further boost competition and liquidity, and benefit consumer welfare. Specifically, the following zones should consider the benefit of an integration effort as outlined in the AGTM:
a) Liquidity in the Iberian and Baltic regions is on an upward trajectory and should proceed with their re-spective ongoing integration efforts;
b) In CEE, Slovenia and Croatia could discuss integration efforts with Austria so they can link to an ad-vanced hub. This is also possibly relevant for Slovakia and Hungary;
c) In some MSs, market foreclosure arising from (prolonged) historical supply contracts, and resulting in a dominant market position for incumbents, will remain an obstacle to applying EU codes and achieving a truly IGM. Hence for these MSs, like Bulgaria and Romania, and before integration efforts could be un-dertaken, tailored regulation might be needed in addition to what the local authorities need to do in terms of following the best AGTM practices for gas market design. They should guarantee fair and non-discrim-inatory hub operation; introduce market making and/or gas release obligations; increase transparency by publishing information relevant for market participants’ commercial decisions in an accurate and timely way; and set fees and licensing requirements for market participants that will attract new market entrants.
• The AGTM should be further developed to provide guidance on process and governance aspects when im-plementing integration efforts. For example, defining the roles of network users, NRAs and TSOs in propos-ing, developing and deciding on aspects such as inter-TSO compensation mechanisms (ITC) in the event of markets merging. The latter aspect has turned out to be a primary challenge for some integration projects.
HOW CAN SECURITY OF SUPPLY BE GUARANTEED WITHOUT INCREASING THE COST TO CONSUMERS?
21 The EU gas sector has reached high levels of interconnectivity and Security of Supply, in terms of capacity and as gas availability. In parallel, market integration and competition have increased. This has been enabled by specific EU rules like reverse gas flow requirements (Regulation 994/2010, and now Regulation 1938/2017), market participants’ initiatives and by a reliance on market forces to safeguard supply needs.
• Apart from some critical interconnectivity gaps mainly in the SSE7 and Baltic regions and still missing reverse flow capability at important EU IPs, the general focus can shift away from new infrastructure expansion, also because of the EU decarbonisation targets. Furthermore, congestion levels are low (only 7% of IP sides are reported as congested8) and parts of the gas transportation capacity are under-utilised.
7 In accordance to the PCI list, there is still a lack of interconnectivity in the SSE region that shall be addressed by reinforced bi-directional corridors; e.g. Greece-Bulgaria-Romania-Hungary. Remedying this shall also improve market functioning.
8 See the Agency Congestion Monitoring Report 2017. See footnote 6.
10
A C E R / C E E R A N N U A L R E P O R T O N T H E R E S U L T S O F M O N I T O R I N G T H E I N T E R N A L N A T U R A L G A S M A R K E T S I N 2 0 1 7
• Therefore, and pending a clearer vision on the future role of gas in the EU, caution should be used about new infrastructure investment support at the EU or national level (e.g. the current number of Project of Com-mon Interest (PCI) proposals is still high). The extent of gas infrastructure developments need to be coherent with other EU policy objectives such as e.g. climate change goals. All individual investment decisions should be market-based and subject to Cost-Benefit Analysis (CBA) which should assess the possible impacts on existing infrastructure (i.e. its utilisation) and current and future costs to consumers.
22 The full and timely implementation of SoS Regulation (EU) No 1938/2017 should be sufficient to guarantee continuity of gas supply (especially to protected customers). Additional SoS requirements stemming from na-tional legislations shall not unduly restrain or distort market competition, as this would lead to increased costs for consumers.
• The approach must be regional as required by Regulation 1938/2017 and market based. For example, MSs should consider the use of broader options to meet SoS obligations such as cross-border storage, virtual storage, options to LNG deliveries.
• MS regulations that hinder the flexible use of UGS and LNG facilities should be avoided as they add complexi-ty to the system and impose additional costs on final consumers, as Sections 2.4 and 4.1 of this Volume show.
HOW CAN THE IMPLEMENTATION OF NETWORK CODES BEST CONTRIBUTE TO MARKET FUNCTIONING?
23 The EU gas wholesale markets have become more dynamic with market participants using long- and short-term products according to business requirements and economic fundamentals. This Report shows that NCs are contributing to these changes.
24 NRAs shall continue the implementation of NCs having a regional view in mind. For example, NRAs should urge TSOs to consult on VIPs9 and subsequently implement them by November 2018, as established by the CAM NC; NRAs should push TSOs to facilitate the transfer of (secondary) capacity between network users so as to optimise the use of the EU network.
25 NRAs shall continue the adjustment of their tariff systems based on the TAR NC principles, fully implementing its provisions such as transparency and cost-reflectivity.
26 The MSs concerned are urged to complete the implementation of the BAL NC and review the application of interim measures where those apply in view of the April 2019 deadline. NRAs in MSs which have already imple-mented the BAL NC are invited to assess, in consultation with market participants, how best to tune their balanc-ing system towards observed best practices, e.g. softening or removing portfolio based within-day obligations and revisiting and improving information provision schemes for network users.
27 Transparency remains a key enabler for market functioning and integration and, in those countries that are behind in NC implementation, a means for market opening. Transparency covers both data transparency and transparent, inclusive consultation processes, where stakeholders are actively involved and their views included in the decision-making process. NRAs should review and strengthen the latter.
28 Stakeholders are encouraged to use the Functionality Platform10 to raise issues regarding the implementation of NCs.
9 The acronym VIP refers to virtual interconnection point. In accordance with the CAM NC, where two or more IPs connect the same two adjacent entry-exit systems, TSOs will offer the sum of their available capacities at a VIP.
10 The platform was launched by ACER and ENTSOG to gather potential implementation issues with the gas NCs and allow stakeholders to provide feedback on a range of topics. See: http://www.gasncfunc.eu/.
11
A C E R / C E E R A N N U A L R E P O R T O N T H E R E S U L T S O F M O N I T O R I N G T H E I N T E R N A L N A T U R A L G A S M A R K E T S I N 2 0 1 7
1. Introduction29 This MMR, which is in its seventh edition and covers the year 2017, consists of four volumes respectively on: the
Electricity Wholesale Market, the Gas Wholesale Market, the Electricity and Gas Retail Markets, and Customer Protection and Empowerment. It covers the EU MSs and, for selected topics, also the Contracting Parties of the Energy Community.
30 This Gas Wholesale Volume presents the results of the monitoring of the European gas wholesale markets in 2017 and their trajectory towards an Internal Gas Market.
31 The Volume is divided into three analytical chapters. Chapter 2 presents an overview of the main developments in the European wholesale gas markets in 2017; Chapter 3 focuses on assessing the performance of gas mar-kets based on the AGTM indicators; and Chapter 4 analyses the impact of network codes on market functioning. The Volume also provides a set of recommendations based on the outcomes of the analytical work performed by the Agency.
32 In order to calculate the AGTM metrics, which assess the structural degree of competition and well-functionality of gas markets, for the third year the Agency has used anonymised and aggregated REMIT data. For selected AGTM’s metrics this Volume only displays the results for a sample of MSs, while the results for all the MSs will be made available in a dedicated document on the Agency’s website.
12
A C E R / C E E R A N N U A L R E P O R T O N T H E R E S U L T S O F M O N I T O R I N G T H E I N T E R N A L N A T U R A L G A S M A R K E T S I N 2 0 1 7
2. Overview of the Internal Gas Market in 20172.1 Demand and supply developments
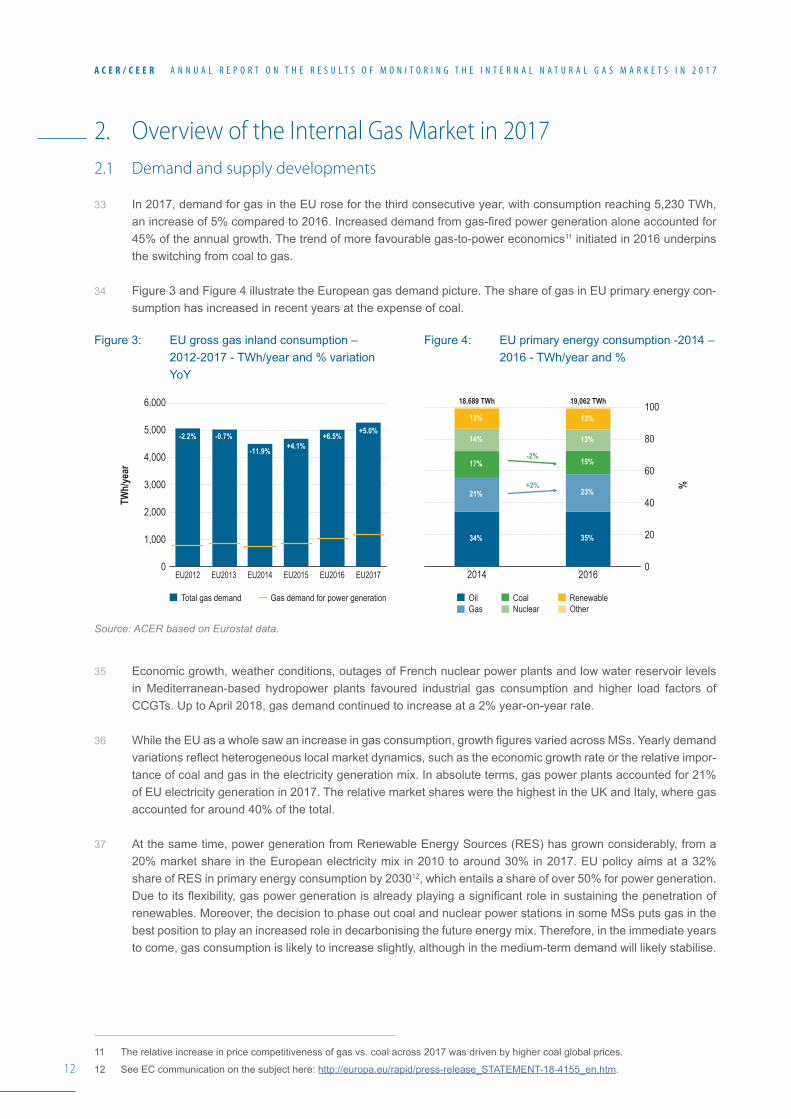
33 In 2017, demand for gas in the EU rose for the third consecutive year, with consumption reaching 5,230 TWh, an increase of 5% compared to 2016. Increased demand from gas-fired power generation alone accounted for 45% of the annual growth. The trend of more favourable gas-to-power economics11 initiated in 2016 underpins the switching from coal to gas.
34 Figure 3 and Figure 4 illustrate the European gas demand picture. The share of gas in EU primary energy con-sumption has increased in recent years at the expense of coal.
Figure 3: EU gross gas inland consumption – 2012-2017 - TWh/year and % variation YoY
Figure 4: EU primary energy consumption -2014 – 2016 - TWh/year and %
Source: ACER based on Eurostat data.
35 Economic growth, weather conditions, outages of French nuclear power plants and low water reservoir levels in Mediterranean-based hydropower plants favoured industrial gas consumption and higher load factors of CCGTs. Up to April 2018, gas demand continued to increase at a 2% year-on-year rate.
36 While the EU as a whole saw an increase in gas consumption, growth figures varied across MSs. Yearly demand variations reflect heterogeneous local market dynamics, such as the economic growth rate or the relative impor-tance of coal and gas in the electricity generation mix. In absolute terms, gas power plants accounted for 21% of EU electricity generation in 2017. The relative market shares were the highest in the UK and Italy, where gas accounted for around 40% of the total.
37 At the same time, power generation from Renewable Energy Sources (RES) has grown considerably, from a 20% market share in the European electricity mix in 2010 to around 30% in 2017. EU policy aims at a 32% share of RES in primary energy consumption by 203012, which entails a share of over 50% for power generation. Due to its flexibility, gas power generation is already playing a significant role in sustaining the penetration of renewables. Moreover, the decision to phase out coal and nuclear power stations in some MSs puts gas in the best position to play an increased role in decarbonising the future energy mix. Therefore, in the immediate years to come, gas consumption is likely to increase slightly, although in the medium-term demand will likely stabilise.
11 The relative increase in price competitiveness of gas vs. coal across 2017 was driven by higher coal global prices.
12 See EC communication on the subject here: http://europa.eu/rapid/press-release_STATEMENT-18-4155_en.htm.
TWh/
year %
6,000
5,000
4,000
3,000
2,000
1,000
0
100
80
60
40
20
0EU2012 EU2013 EU2014 EU2015 2014 2016
18,689 TWh 19,062 TWh
EU2016 EU2017
Total gas demand OilGas
CoalNuclear
RenewableOther
Gas demand for power generation
-0.7%
-11.9% +4.1%+6.5% +5.0%-2.2%
34%
21%
17%
14%
13%
35%
23%
15%
13%
13%
-2%
+2%
13
A C E R / C E E R A N N U A L R E P O R T O N T H E R E S U L T S O F M O N I T O R I N G T H E I N T E R N A L N A T U R A L G A S M A R K E T S I N 2 0 1 7
38 In this respect, it is important to reflect on the future role of gas in the EU, something the 2017 Madrid Forum focused on13. The EC is undertaking efforts to address this. In addition, the ‘Future Role of Gas’ report of CEER examines the options for the future use of gas14. Apart from the decarbonisation of the energy sector, the main issues relate to how synergies between the gas and the power sectors can be achieved, to the prospects for re-newable gases, to the potentials for new uses of gas and to gas decarbonisation where feasible. In this domain, power-to-gas technologies can contribute to enabling electricity storage, particularly when produced by renewa-bles. The gas infrastructure network could contribute in accommodating the development of renewable gases15.
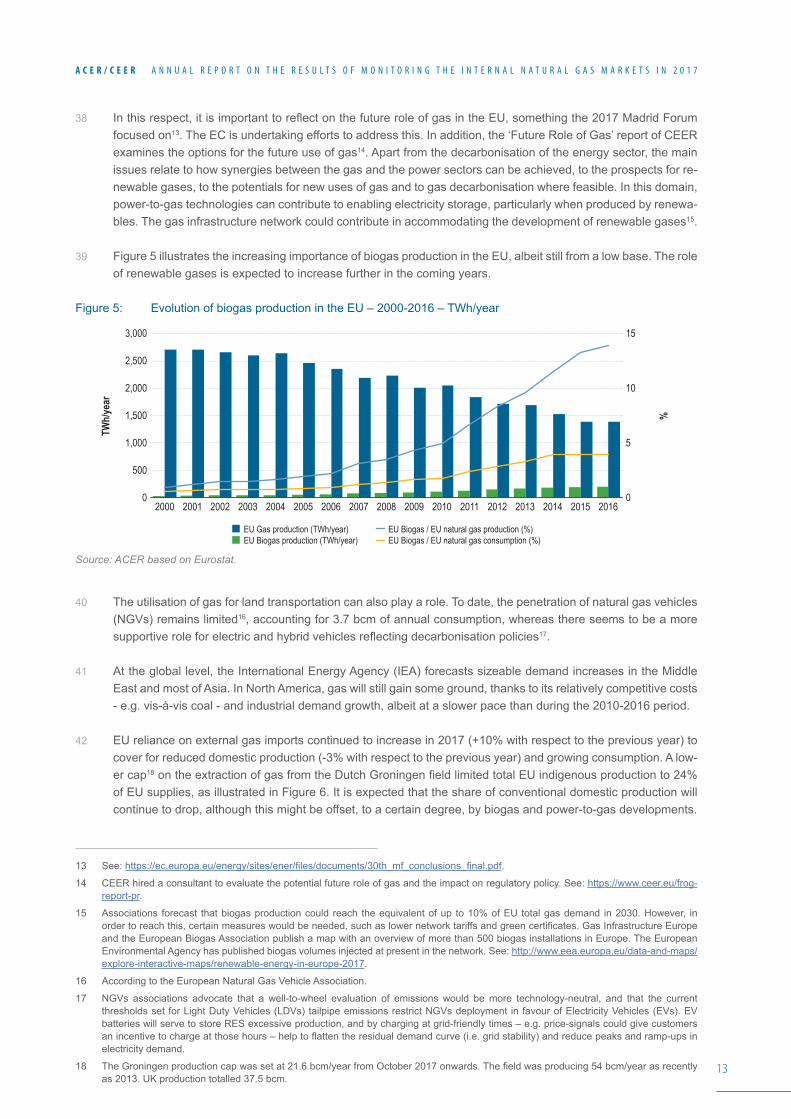
39 Figure 5 illustrates the increasing importance of biogas production in the EU, albeit still from a low base. The role of renewable gases is expected to increase further in the coming years.
Figure 5: Evolution of biogas production in the EU – 2000-2016 – TWh/year
Source: ACER based on Eurostat.
40 The utilisation of gas for land transportation can also play a role. To date, the penetration of natural gas vehicles (NGVs) remains limited16, accounting for 3.7 bcm of annual consumption, whereas there seems to be a more supportive role for electric and hybrid vehicles reflecting decarbonisation policies17.
41 At the global level, the International Energy Agency (IEA) forecasts sizeable demand increases in the Middle East and most of Asia. In North America, gas will still gain some ground, thanks to its relatively competitive costs - e.g. vis-à-vis coal - and industrial demand growth, albeit at a slower pace than during the 2010-2016 period.
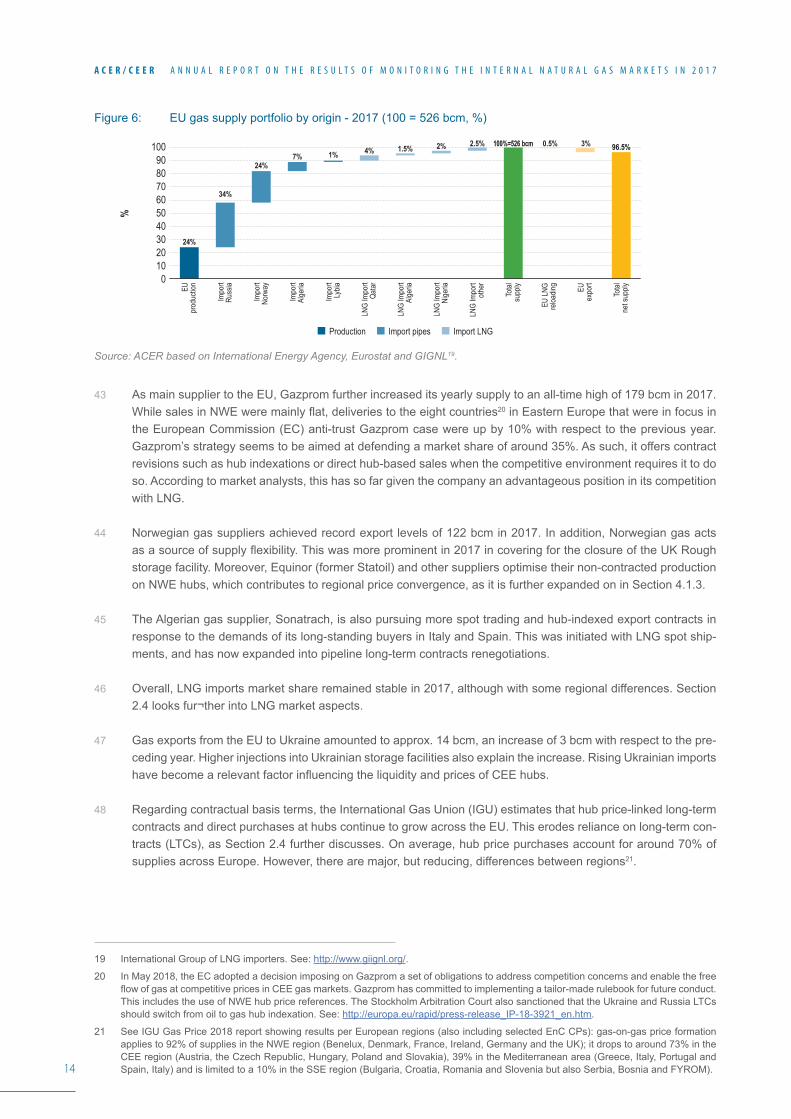
42 EU reliance on external gas imports continued to increase in 2017 (+10% with respect to the previous year) to cover for reduced domestic production (-3% with respect to the previous year) and growing consumption. A low-er cap18 on the extraction of gas from the Dutch Groningen field limited total EU indigenous production to 24% of EU supplies, as illustrated in Figure 6. It is expected that the share of conventional domestic production will continue to drop, although this might be offset, to a certain degree, by biogas and power-to-gas developments.
13 See: https://ec.europa.eu/energy/sites/ener/files/documents/30th_mf_conclusions_final.pdf.
14 CEER hired a consultant to evaluate the potential future role of gas and the impact on regulatory policy. See: https://www.ceer.eu/frog-report-pr.
15 Associations forecast that biogas production could reach the equivalent of up to 10% of EU total gas demand in 2030. However, in order to reach this, certain measures would be needed, such as lower network tariffs and green certificates. Gas Infrastructure Europe and the European Biogas Association publish a map with an overview of more than 500 biogas installations in Europe. The European Environmental Agency has published biogas volumes injected at present in the network. See: http://www.eea.europa.eu/data-and-maps/explore-interactive-maps/renewable-energy-in-europe-2017.
16 According to the European Natural Gas Vehicle Association.
17 NGVs associations advocate that a well-to-wheel evaluation of emissions would be more technology-neutral, and that the current thresholds set for Light Duty Vehicles (LDVs) tailpipe emissions restrict NGVs deployment in favour of Electricity Vehicles (EVs). EV batteries will serve to store RES excessive production, and by charging at grid-friendly times – e.g. price-signals could give customers an incentive to charge at those hours – help to flatten the residual demand curve (i.e. grid stability) and reduce peaks and ramp-ups in electricity demand.
18 The Groningen production cap was set at 21.6 bcm/year from October 2017 onwards. The field was producing 54 bcm/year as recently as 2013. UK production totalled 37.5 bcm.
TWh/
year %
3,000
2,000
2,500
1,500
1,000
500
0
15
5
10
020112010200920082007200620052004200320022000 2001 2012 2013 2014 2015 2016
EU Gas production (TWh/year)EU Biogas production (TWh/year)
EU Biogas / EU natural gas production (%)EU Biogas / EU natural gas consumption (%)
14
A C E R / C E E R A N N U A L R E P O R T O N T H E R E S U L T S O F M O N I T O R I N G T H E I N T E R N A L N A T U R A L G A S M A R K E T S I N 2 0 1 7
Figure 6: EU gas supply portfolio by origin - 2017 (100 = 526 bcm, %)
Source: ACER based on International Energy Agency, Eurostat and GIGNL19.
43 As main supplier to the EU, Gazprom further increased its yearly supply to an all-time high of 179 bcm in 2017. While sales in NWE were mainly flat, deliveries to the eight countries20 in Eastern Europe that were in focus in the European Commission (EC) anti-trust Gazprom case were up by 10% with respect to the previous year. Gazprom’s strategy seems to be aimed at defending a market share of around 35%. As such, it offers contract revisions such as hub indexations or direct hub-based sales when the competitive environment requires it to do so. According to market analysts, this has so far given the company an advantageous position in its competition with LNG.
44 Norwegian gas suppliers achieved record export levels of 122 bcm in 2017. In addition, Norwegian gas acts as a source of supply flexibility. This was more prominent in 2017 in covering for the closure of the UK Rough storage facility. Moreover, Equinor (former Statoil) and other suppliers optimise their non-contracted production on NWE hubs, which contributes to regional price convergence, as it is further expanded on in Section 4.1.3.
45 The Algerian gas supplier, Sonatrach, is also pursuing more spot trading and hub-indexed export contracts in response to the demands of its long-standing buyers in Italy and Spain. This was initiated with LNG spot ship-ments, and has now expanded into pipeline long-term contracts renegotiations.
46 Overall, LNG imports market share remained stable in 2017, although with some regional differences. Section 2.4 looks fur¬ther into LNG market aspects.
47 Gas exports from the EU to Ukraine amounted to approx. 14 bcm, an increase of 3 bcm with respect to the pre-ceding year. Higher injections into Ukrainian storage facilities also explain the increase. Rising Ukrainian imports have become a relevant factor influencing the liquidity and prices of CEE hubs.
48 Regarding contractual basis terms, the International Gas Union (IGU) estimates that hub price-linked long-term contracts and direct purchases at hubs continue to grow across the EU. This erodes reliance on long-term con-tracts (LTCs), as Section 2.4 further discusses. On average, hub price purchases account for around 70% of supplies across Europe. However, there are major, but reducing, differences between regions21.
19 International Group of LNG importers. See: http://www.giignl.org/.
20 In May 2018, the EC adopted a decision imposing on Gazprom a set of obligations to address competition concerns and enable the free flow of gas at competitive prices in CEE gas markets. Gazprom has committed to implementing a tailor-made rulebook for future conduct. This includes the use of NWE hub price references. The Stockholm Arbitration Court also sanctioned that the Ukraine and Russia LTCs should switch from oil to gas hub indexation. See: http://europa.eu/rapid/press-release_IP-18-3921_en.htm.
21 See IGU Gas Price 2018 report showing results per European regions (also including selected EnC CPs): gas-on-gas price formation applies to 92% of supplies in the NWE region (Benelux, Denmark, France, Ireland, Germany and the UK); it drops to around 73% in the CEE region (Austria, the Czech Republic, Hungary, Poland and Slovakia), 39% in the Mediterranean area (Greece, Italy, Portugal and Spain, Italy) and is limited to a 10% in the SSE region (Bulgaria, Croatia, Romania and Slovenia but also Serbia, Bosnia and FYROM).
%
24%
34%
24%7% 1% 4% 2%1.5% 2.5%100
908070
40
60
3020
50
100
EUpr
oduc
tion
Impo
rtRu
ssia
Impo
rtNo
rway
Impo
rtLy
bia
Impo
rtAl
geria
LNG
Impo
rtQa
tar
LNG
Impo
rtAl
geria
LNG
Impo
rtNi
geria
LNG
Impo
rtoth
er
Total
supp
ly
EU LN
Gre
loadin
g EUex
port
Total
net s
upply
Production Import pipes Import LNG
0.5% 3% 96.5%96.5%100%=526 bcm100%=526 bcm
15
A C E R / C E E R A N N U A L R E P O R T O N T H E R E S U L T S O F M O N I T O R I N G T H E I N T E R N A L N A T U R A L G A S M A R K E T S I N 2 0 1 7
2.2 Price developments
49 In 2017, gas prices recovered from lower 2016 values. The yearly average price of NWE hubs’ day-ahead prod-ucts in 2017 was 20% higher than in 2016. Higher coal and oil prices supported gas price increases.
50 The beginning and the end of the year saw the highest gas prices22, driven by weather conditions, among other things. The need to refill very low UGS stocks played a price-supporting role in the summer months. Gas ver-sus coal switching economics influence EU gas hubs’ price formation, as both coal and gas compete in setting marginal prices for power generation. Rising Asian spot prices limited LNG deliveries to the EU at the end of the year, putting extra pressure on prices.
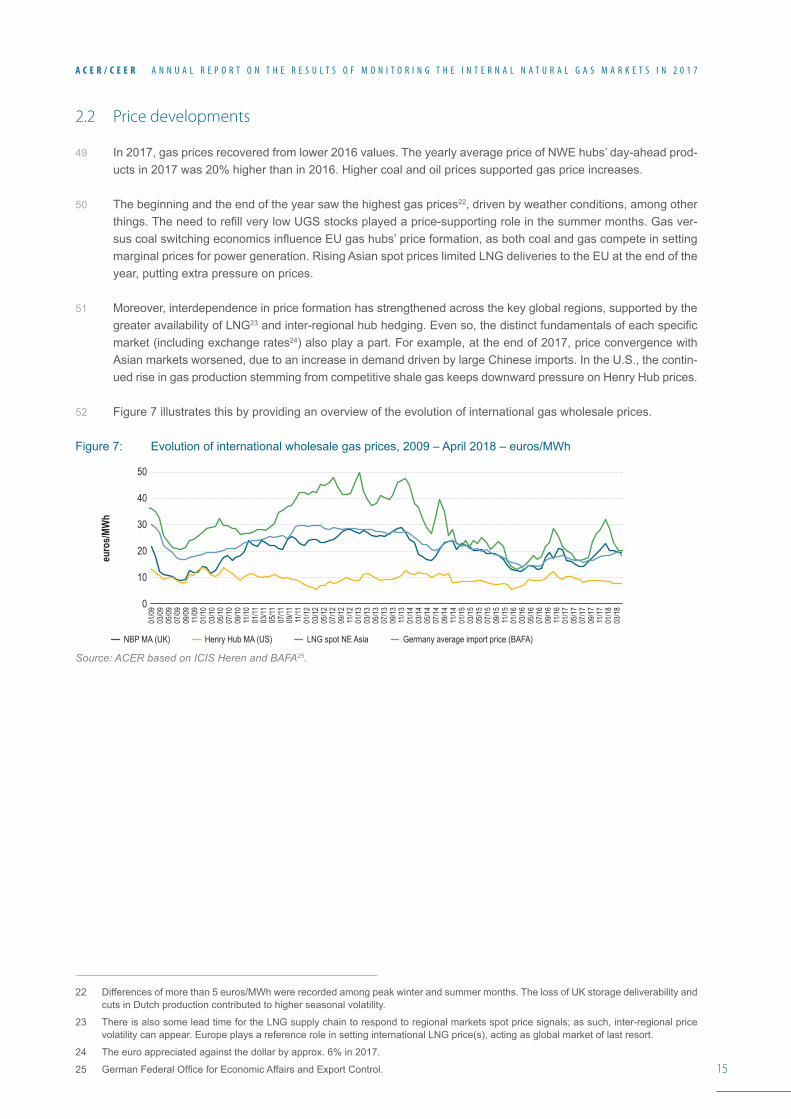
51 Moreover, interdependence in price formation has strengthened across the key global regions, supported by the greater availability of LNG23 and inter-regional hub hedging. Even so, the distinct fundamentals of each specific market (including exchange rates24) also play a part. For example, at the end of 2017, price convergence with Asian markets worsened, due to an increase in demand driven by large Chinese imports. In the U.S., the contin-ued rise in gas production stemming from competitive shale gas keeps downward pressure on Henry Hub prices.
52 Figure 7 illustrates this by providing an overview of the evolution of international gas wholesale prices.
Figure 7: Evolution of international wholesale gas prices, 2009 – April 2018 – euros/MWh
Source: ACER based on ICIS Heren and BAFA25.
22 Differences of more than 5 euros/MWh were recorded among peak winter and summer months. The loss of UK storage deliverability and cuts in Dutch production contributed to higher seasonal volatility.
23 There is also some lead time for the LNG supply chain to respond to regional markets spot price signals; as such, inter-regional price volatility can appear. Europe plays a reference role in setting international LNG price(s), acting as global market of last resort.
24 The euro appreciated against the dollar by approx. 6% in 2017.
25 German Federal Office for Economic Affairs and Export Control.
euro
s/MW
h
50
40
30
20
10
0
01/09
03/09
05/09
07/09
09/09
11/09
01/10
03/10
05/10
07/10
09/10
11/10
01/11
03/11
05/11
07/11
09/11
11/11
01/12
03/12
05/12
07/12
09/12
11/12
01/13
03/13
05/13
07/13
09/13
11/13
01/14
03/14
05/14
07/14
09/14
11/14
01/15
03/15
05/15
07/15
09/15
11/15
01/16
03/16
05/16
07/16
09/16
11/16
01/17
05/17
07/17
09/17
11/17
01/18
03/18
Henry Hub MA (US)NBP MA (UK) LNG spot NE Asia Germany average import price (BAFA)
16
A C E R / C E E R A N N U A L R E P O R T O N T H E R E S U L T S O F M O N I T O R I N G T H E I N T E R N A L N A T U R A L G A S M A R K E T S I N 2 0 1 7
2.3 Assessment of supply sourcing costs
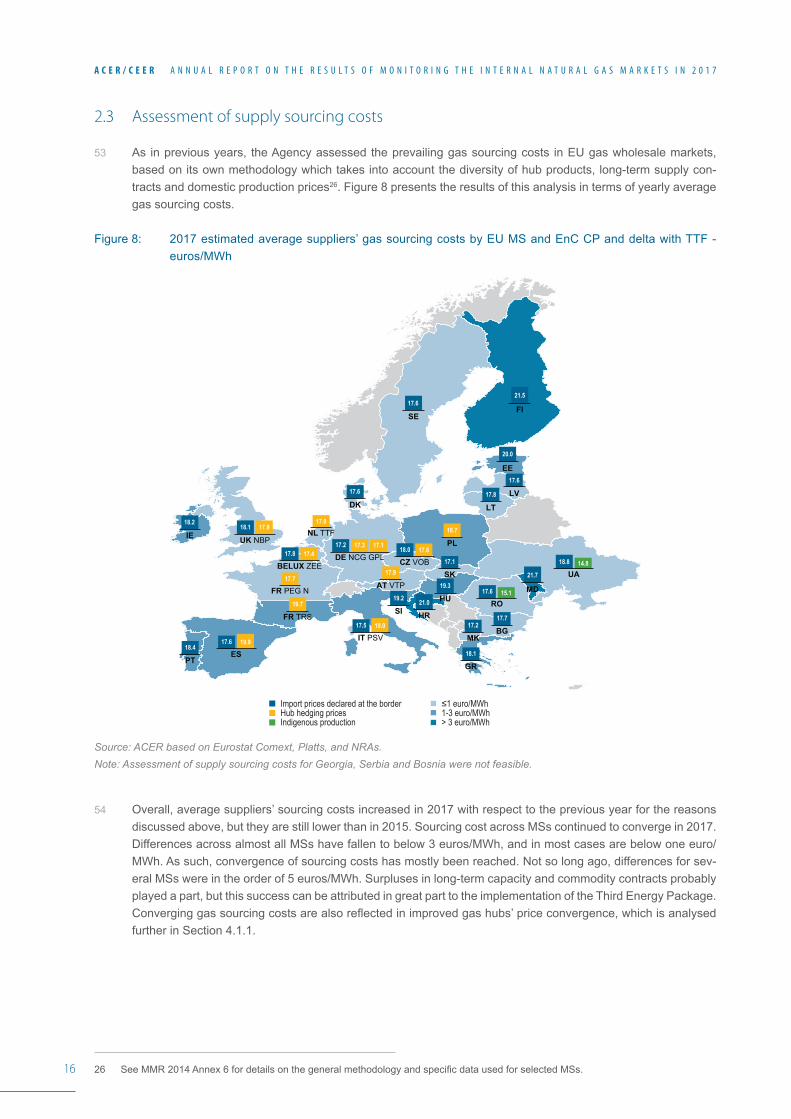
53 As in previous years, the Agency assessed the prevailing gas sourcing costs in EU gas wholesale markets, based on its own methodology which takes into account the diversity of hub products, long-term supply con-tracts and domestic production prices26. Figure 8 presents the results of this analysis in terms of yearly average gas sourcing costs.
Figure 8: 2017 estimated average suppliers’ gas sourcing costs by EU MS and EnC CP and delta with TTF - euros/MWh
Source: ACER based on Eurostat Comext, Platts, and NRAs. Note: Assessment of supply sourcing costs for Georgia, Serbia and Bosnia were not feasible.
54 Overall, average suppliers’ sourcing costs increased in 2017 with respect to the previous year for the reasons discussed above, but they are still lower than in 2015. Sourcing cost across MSs continued to converge in 2017. Differences across almost all MSs have fallen to below 3 euros/MWh, and in most cases are below one euro/MWh. As such, convergence of sourcing costs has mostly been reached. Not so long ago, differences for sev-eral MSs were in the order of 5 euros/MWh. Surpluses in long-term capacity and commodity contracts probably played a part, but this success can be attributed in great part to the implementation of the Third Energy Package. Converging gas sourcing costs are also reflected in improved gas hubs’ price convergence, which is analysed further in Section 4.1.1.
26 See MMR 2014 Annex 6 for details on the general methodology and specific data used for selected MSs.
≤1 euro/MWh1-3 euro/MWh> 3 euro/MWh
Import prices declared at the borderHub hedging pricesIndigenous production
18.4
PT18.1
GR
17.2
MK
17.7
BG
21.0
HR
19.2
SI
19.3
HU
17.1
SK17.9
AT VTP
18.7
PL
18.2
IE
17.6
DK
17.6
SE
21.5
FI
21.7
MD
20.0
EE17.6
LV17.8
LT
18.1 17.9
UK NBP17.8 17.4
BELUX ZEE
18.0 17.6
CZ VOB
17.6 15.1RO
18.8 14.8UA
17.2 17.3 17.1
DE NCG GPL
17.6 19.9
ES
17.5 19.0
IT PSV
17.0
NL TTF
FR TRS
19.7
FR PEG N17.7
17
A C E R / C E E R A N N U A L R E P O R T O N T H E R E S U L T S O F M O N I T O R I N G T H E I N T E R N A L N A T U R A L G A S M A R K E T S I N 2 0 1 7
55 Supply sourcing costs in the EnC CPs continue to be higher than in EU MSs, with the exception of Ukraine. This is mainly attributed to the prevalence of less price-competitive long-term contracts and a more limited number of supply sources. Since 2016, Ukrainian suppliers have been acquiring sizeable volumes from EU traders; the price of these imports increased by approx. 14% with respect to the previous year27. However, Ukrainian indig-enous gas production is still more competitive even though its price increased approx. 20% in 2017 compared to the previous year.
56 Observations in recent years have shown that sourcing at the EU’s more liquid hubs generally results in more attractive prices compared to LTCs. However, as LTCs are structured more and more to include hub indexation, it is no surprise that this drives larger degrees of convergence between these two sourcing options. Oil-indexed LTCs can be competitive with hub prices. This is especially during periods when low oil prices push down gas prices, taking also into account the typical 6-9 month price lags. This is illustrated, for example, by the cost-effective sourcing costs registered in Bulgaria and Latvia throughout 2017, or by the fact that French, Spanish and Italian LTCs prices were more competitive than the assessment of gas sourcing costs from gas purchased on the TRS, PVB and PSV hubs.
27 According to information provided by NEURC (Ukrainian NRA).
18
A C E R / C E E R A N N U A L R E P O R T O N T H E R E S U L T S O F M O N I T O R I N G T H E I N T E R N A L N A T U R A L G A S M A R K E T S I N 2 0 1 7
2.4 Infrastructure and system operation developments
57 This Section covers the main developments in gas flows, bookings of capacity at interconnectors and trends in LNG and UGS markets.
PHYSICAL GAS FLOWS ACROSS EU BORDERS
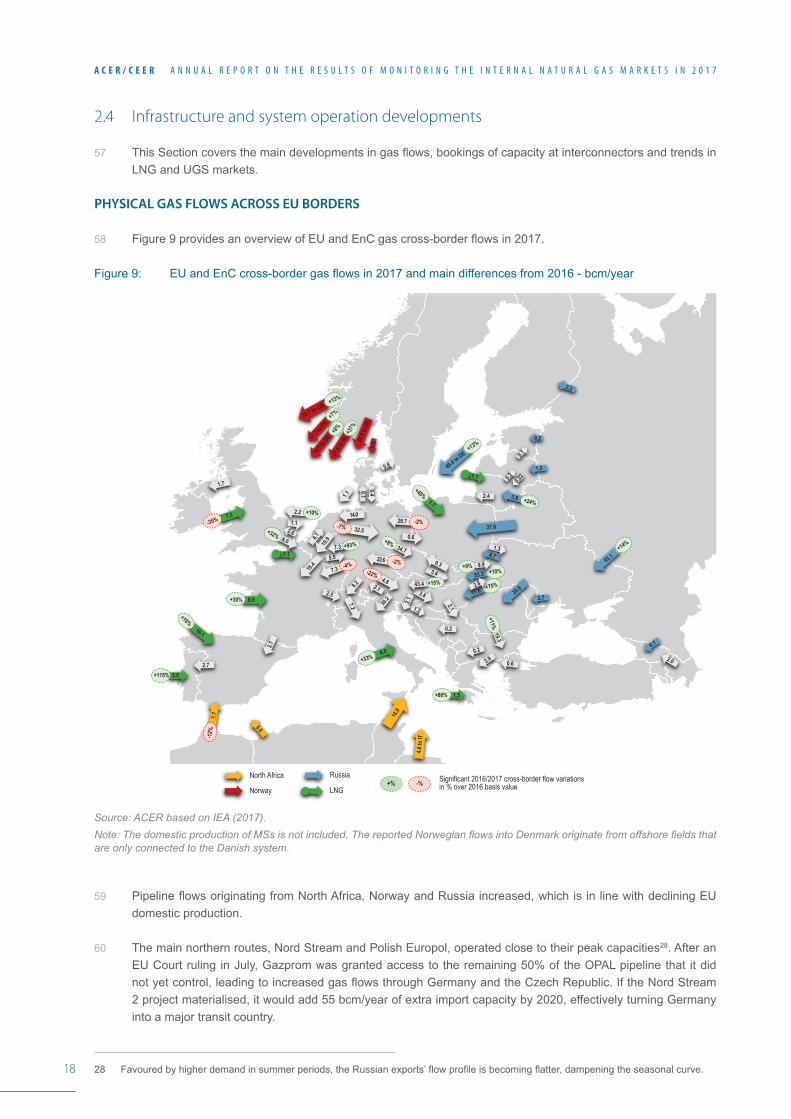
58 Figure 9 provides an overview of EU and EnC gas cross-border flows in 2017.
Figure 9: EU and EnC cross-border gas flows in 2017 and main differences from 2016 - bcm/year
Source: ACER based on IEA (2017).Note: The domestic production of MSs is not included. The reported Norwegian flows into Denmark originate from offshore fields that are only connected to the Danish system.
59 Pipeline flows originating from North Africa, Norway and Russia increased, which is in line with declining EU domestic production.
60 The main northern routes, Nord Stream and Polish Europol, operated close to their peak capacities28. After an EU Court ruling in July, Gazprom was granted access to the remaining 50% of the OPAL pipeline that it did not yet control, leading to increased gas flows through Germany and the Czech Republic. If the Nord Stream 2 project materialised, it would add 55 bcm/year of extra import capacity by 2020, effectively turning Germany into a major transit country.
28 Favoured by higher demand in summer periods, the Russian exports’ flow profile is becoming flatter, dampening the seasonal curve.
6.6
2.13.8
2.1
0.6
2.1
16.4
5.5
6.1
1.1
0.62.0
3.4
0.3
0.4
1.1
0.8
0.4
3.7
2.5
2.6
8.2
30.2
0.1
0.2 0.02
4.6 to
IT
1.1
1.1
19.9
26.9
to D
E
0.2
2.3
1.3
2.7
0.1
2.7
7.2
4.7 93.1
37.6
1.7
1.2
32.5-7%
4.8-22%
14.0
22.6 -2%
28.7 -2%
8.9+30%
1.7
+48%
7.3 -35%
16.1
+18%
8.5+33%
11.6 +75% 53.3 +10%
3.5+115%
49.4 to DE+13%
15.5 t
o BE +8
% 27
.6 to
NL +
37%
17.7 to
FR +7%
35.7 to GB +13% 18
.9
3.8 +24%
0.1
1.3
2.8
0.2
0.2
2.9
2.4
1.5+86%
+14%
20.8
7.7-1
2%
9.9 +9%
8.0+32%
19.3+11%
34.7+8%
2.2 +10%
7.3 +93%
43.4 +15%
7.3 -4%
North Africa
Norway
Russia
LNGSignificant 2016/2017 cross-border flow variationsin % over 2016 basis value-%+%
19
A C E R / C E E R A N N U A L R E P O R T O N T H E R E S U L T S O F M O N I T O R I N G T H E I N T E R N A L N A T U R A L G A S M A R K E T S I N 2 0 1 7
61 Gas flows from Russia via Ukraine also increased by 10% with respect to the previous year, but are still 40% below their 2010 levels29. On the other side, flows from the EU into Ukraine increased by 26%. Given the impact of Nord Stream, it would appear likely that gas flows from Ukraine could be further reoriented to the SSE mar-ket. Nonetheless, the planned implementation of a new entry-exit tariff methodology in Ukraine may also affect future flow levels. The new methodology, which shall be in line with EU rules, in combination with NRA decisions, could lead to reducing tariffs30.
62 LNG imports as a whole were 12% higher in 2017 than in 2016, but showed a disparate pattern. While the UK and Belgium imported less, Italy, France and Spain increased their LNG deliveries. The reasons for this are, inter alia, that in the former countries, LNG prices were less competitive than domestic production and pipeline imports, while in the latter, nuclear outages and low-hydro reservoir levels fostered gas demand. Imports in the Baltic Sea region also increased. For example, the Polish Świnoujście LNG terminal saw a 48% yearly increase, covering approx. a 10% of Polish consumption.
63 Lower Dutch gas production led to the Netherlands relying on more gas imports from Germany. In addition, flows from Germany into Poland increased31. The closure of the Rough storage facility reinforced the utilisation levels of UK bidirectional interconnectors with Belgium and the Netherlands32. British shippers are using these interconnectors and the Continental storage sites and Norwegian gas as additional sources of supply flexibility.
64 Despite changing market fundamentals, year-on-year changes in gas flows are accommodated in a smooth fashion, showing to what extent many markets have improved in terms of flexibility and liquidity. For example, in December 2017, following an explosion in the Baumgarten compression facility, gas flows were managed to secure physical balancing. In particular, despite a temporary spike in day-ahead prices, the flexibility of the system, including demand-side measures and alternative supply options, prevented cuts being needed.
INFRASTRUCTURE INVESTMENT AND REGULATIONS
65 Various European MSs continue to take measures to diversify their supply capabilities. A variety of new pipelines and LNG terminals are proposed, either along established supply axes or via new gas corridors. Some of these projects could be operational by the early 2020’s, e.g. TAP-TANAP, Nord Stream 2 and GIPL33.
66 The completion of some of these projects could affect the current supply competition framework, not only for the concerned MSs, but also at a regional level. In this context, a proposal to amend the current Gas Directive was published in November 2017. The EC is proposing to extend the main principles of the Third Energy Package – unbundling, non-discriminatory and regulated TPA – to all gas pipelines to, and from, third countries up to the EU border to secure a level playing field34.
67 There are still pockets of infrastructure gaps that if (when) solved would clearly promote supply competition. Most of them are in the SSE region, and to a lesser extent in the CEE and between the Baltic region and West-ern Europe.
68 Additionally, a reinforced Security of Supply Regulation EU 2017/1938 was approved in spring 2017, pursuing more coordination of security of supply measures among MSs35. It contains provisions requiring shippers to
29 Despite last year’s YoY rise, the historical series show a drop in imports of 40% from 2010. Additionally, Gazprom still hinders the implementation of virtual reverse flows at the EU IPs with UA – i.e. Velike Kapusany.
30 E.g.See: https://www.energy-community.org/dam/jcr:6734e299-e861-4774-8f79-7615d1ec0020/GF2017_NEURC.pdf.
31 During the year, open seasons were organised to test the market interest in capacity enlargements from Germany into Poland and into the Netherlands. If Nord Stream 2 is consolidated, and Dutch domestic production keeps falling, Germany is expected to play a more active transit role in Europe.
32 Towards the end of 2019, physical reverse flows are expected to be also available from the UK to the Netherlands. Flows between Belgium and the Netherlands rose by approx. 60%, an indication that gas flowing from the UK into Continental Europe is being stored in Dutch facilities. As well as the integration of BBL in the Dutch system from January 2018 will simplify bookings and possibly encourage users to use the link.
33 The 2017 list of Projects of Common Interest provides an overview of infrastructure proposals: https://ec.europa.eu/energy/en/topics/infrastructure/projects-common-interest.
34 Even if the implementation of specific provisions could retain some discretion e.g. by MSs for the derogation of certain aspects.
35 See: https://eur-lex.europa.eu/legal-content/EN/TXT/PDF/?uri=CELEX:32017R1938&from=EN.
20
A C E R / C E E R A N N U A L R E P O R T O N T H E R E S U L T S O F M O N I T O R I N G T H E I N T E R N A L N A T U R A L G A S M A R K E T S I N 2 0 1 7
reroute volumes if a supply crisis emerges, and solidarity mechanisms compelling a reallocation of contracts to supply household and vulnerable consumers. The implementation of this Regulation, as well as the entry into force of some NCs provisions – e.g. CMP, TAR – could reduce the need to expand infrastructure.
CAPACITY CONTRACTING TRENDS
69 Figure 2 in the Executive Summary provides an overview of the aggregated entry and exit bookings underlying the capacity in use in the last two years. Bookings are divided according to capacity product duration. The analy-sis covers only those CAM-relevant IPs whose capacities are auctioned at the booking platforms. The analysis also shows the accumulated technical capacity as reported by ENTSOG36.
70 Figure 2 shows that most booked capacity relates to long-term legacy contracts acquired outside the booking platforms. This will continue to be the case until these contracts expire37. However, the gradual impact of the implementation of the CAM NC is visible. The auctions, mandatory since 2015, clearly reveal a rise in bookings for the various CAM denominated capacity products. As such, it would appear that the CAM NC is doing its intended job.
71 Also, interestingly, even though Figure 2 covers only two years, absolute booking levels tended to be somewhat lower in 2017 than in 2016. This contrasts with the increase in overall technical capacity over the same period, which further reduces the utilisation level of the gas pipelines. Shorter-duration CAM-auctioned products are generally replacing longer-term bookings. However, there also seems to be a more pronounced profiling pattern, which may partly reduce absolute booking levels; as such, capacity contracting becomes more a reflection of actual market needs.
72 However, the scenario varies by IP. Overall, capacity bookings linked to legacy contracts still very much pre-vail on the historically dominant flow direction on a majority of EU IPs. However, a number of IPs operate in a manner that follow hub price signals more closely. This is also the case at some IPs that have seen the recent introduction of reverse-flow capabilities. For these IPs, a more profiled booking picture emerges. Section 4.2.1 elaborates extensively on the subject.
73 As Figure 2 shows, the overall level of capacity bookings between EU gas markets has been decreasing over the last couple of years. The Agency has made an estimation of the revenue generated from cross-border capacity bookings for a sample of intra-EU IPs. The results indicate that collected revenues are decreasing in line with reduced bookings38. The bookings revenue that is associated with CAM auction bookings has grown in 2017 as compared to 2016, but revenues associated with legacy bookings have fallen at a faster rate. CAM auctioned capacity still represents a relatively small part of the sampled IPs revenues, with the large majority originating from legacy capacity bookings.
LNG
74 The global LNG market is evolving, but it is still, to a large degree, an illiquid market. The main trends of this evolution are:
• Shortening the duration of long-term contracts
• Emergence of a spot LNG market whose importance has been growing in recent years. In 2017, 27% of global LNG trade was imported on a spot or short-term basis according to the International Group of Lique-fied Natural Gas Importers (GIIGNL)39.
36 Technical capacity shows an erratic pattern, which would indicate that some TSOs are not using a uniform definition when reporting to ENTSOG.
37 ENTSOG and booking platforms’ data show that high booking levels remain in place until 2020, in accordance with already committed bookings. However, by 2025, absolute booking values at many IPs will have fallen below 50%.
38 The analysis is preliminary. Collected revenues are not only affected by actual booking levels, but they are a function of the total allowed revenues delimited by NRAs.
39 Short-term basis means volumes delivered under contracts with a duration of 4 years, whereas spot is delivery less than three months from the transaction date.
21
A C E R / C E E R A N N U A L R E P O R T O N T H E R E S U L T S O F M O N I T O R I N G T H E I N T E R N A L N A T U R A L G A S M A R K E T S I N 2 0 1 7
• Looser destination clauses for cargoes: they are no longer always point to point, but can divert midway to berth where it is more profitable
75 At the international level, the US is further consolidating its position as the biggest global gas producer, and is becoming an important player in the global LNG export market. On the consumer side, China has an increas-ing influence on gas market dynamics, a trend that will intensify. The country almost doubled its gas imports in 2017 with respect to the previous year, driven by a shift from coal to gas. The price dynamics of LNG in the EU will also be more and more affected by market developments in East Asia. These markets are subject to pronounced seasonal price fluctuations due to climate conditions and limited storage facilities. With growing demand, particularly from China, it is expected that the EU-East Asia price arbitrage will mean that LNG cargoes destined for the Atlantic basin will find their way more to East Asia than to the EU. This is in spite of the greater availability of global LNG production.
76 The forecasted significant rise of LNG supplies into Europe did not materialise. Many LNG terminals are under-utilised. In fact, their average utilisation rate in the EU in 2017 was less than 25%. In some MSs, the ample availability of LNG facilities helped to unlock the unduly limited diversity of supply situation, leading to more competition and lower wholesale prices. From a European perspective, LNG with a total capacity of around 200 bcm can also be used as a flexibility instrument. Together with UGS, which accounts for around 100 bcm of capacity, LNG can serve to balance gas demand and supply. As such, it not only enhances security of supply, but also caps gas price levels and contributes to supply competition.
77 With its liquid gas hubs, NWE also acts as the price benchmark for global liquefied natural gas. The high liquidity of NBP and TTF provide market players with a trusted price signal that is used in the absence of a stand-alone LNG price benchmark. The EU can act as a sink of global surplus LNG supply, as it can absorb larger amounts of gas than other regions, due to its spare regasification capacity, hub liquidity and ample gas storage.
78 The access conditions applicable at individual EU LNG terminals may also play a part in fostering short-term market potential. These conditions govern aspects such as shipments’ slot allocation, regasification arrange-ments or tariffs. Unduly rigid procedures could constitute barriers impeding the ability to take full advantage of this rising LNG market dynamism. A recent CEER study examines LNG terminals access conditions and identi-fies barriers40.
UTILISATION ANALYSIS OF UNDERGROUND STORAGE FACILITIES
79 At the end of the storage season 2017/18, the EU storage inventories reached the lowest levels in the last eight years (19.8% of total capacity against an average of 35% in the previous seven storage years)41. The cold spell hitting several MSs between February and March 2018 kept the demand for gas high. Given the slower response of LNG, storage facilities were used as the main flexibility tool to supply gas.
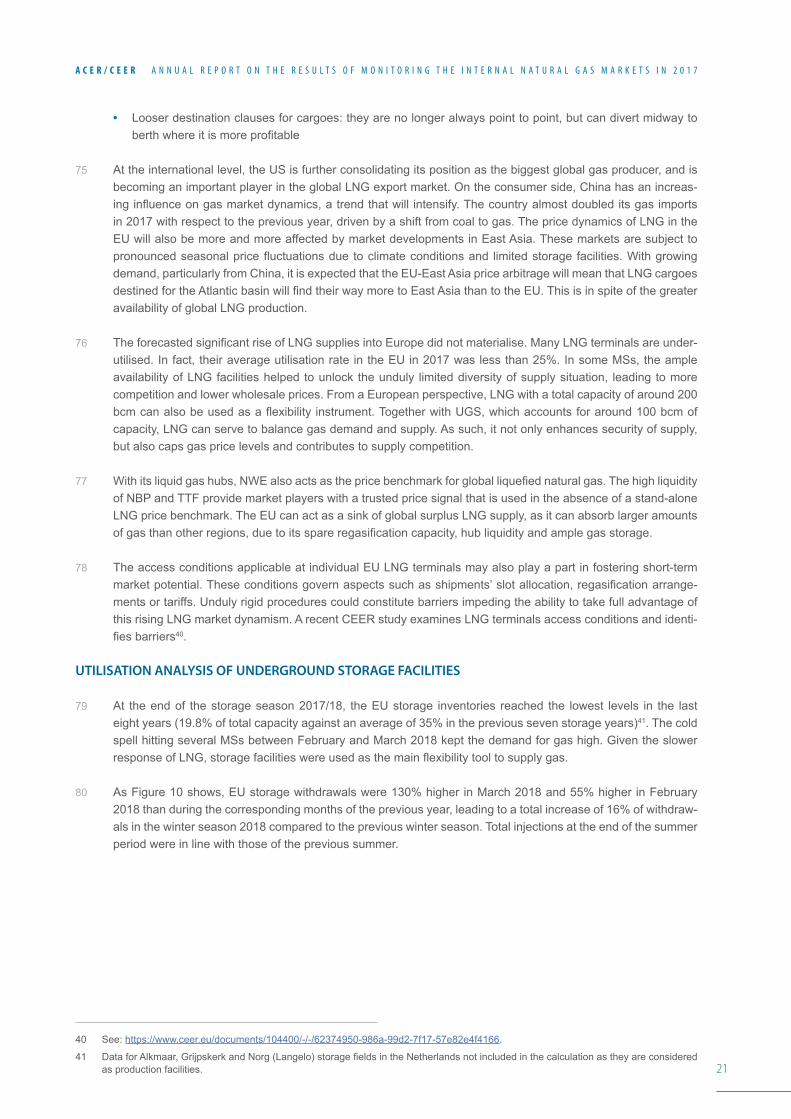
80 As Figure 10 shows, EU storage withdrawals were 130% higher in March 2018 and 55% higher in February 2018 than during the corresponding months of the previous year, leading to a total increase of 16% of withdraw-als in the winter season 2018 compared to the previous winter season. Total injections at the end of the summer period were in line with those of the previous summer.
40 See: https://www.ceer.eu/documents/104400/-/-/62374950-986a-99d2-7f17-57e82e4f4166.
41 Data for Alkmaar, Grijpskerk and Norg (Langelo) storage fields in the Netherlands not included in the calculation as they are considered as production facilities.
22
A C E R / C E E R A N N U A L R E P O R T O N T H E R E S U L T S O F M O N I T O R I N G T H E I N T E R N A L N A T U R A L G A S M A R K E T S I N 2 0 1 7
Figure 10: Daily injections and withdrawals in storage years 2016/17 and 2017/18 - GWh/d
Source: ACER based on AGSI+.
81 Even with factors such as the cold spell of winter 2018, the closure of the Rough UGS site in UK and the im-posed cap on the Dutch Groningen field production, a situation of overcapacity in storage facilities can still be observed across the EU, as already highlighted in the MMR’s covering 2015 and 2016. The maximum level of gas in UGS inventories in the storage year 2017/18 was one of the lowest of the last 8 storage years. Further-more, the injection and withdrawal rates in respectively the summer and winter months of the storage season 2017/18 were low (injections in summer 2017 were 30% of the total injection capacity and withdrawals during winter 2017/18 were 23% of the total withdrawal capacity).
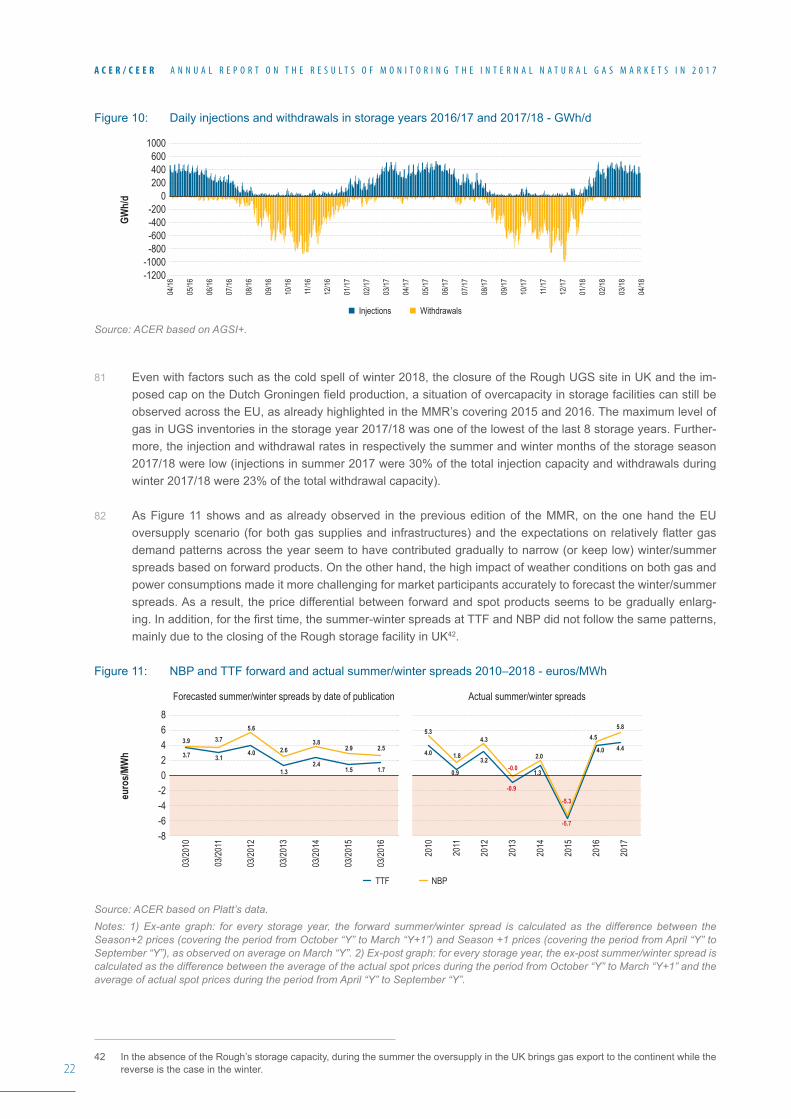
82 As Figure 11 shows and as already observed in the previous edition of the MMR, on the one hand the EU oversupply scenario (for both gas supplies and infrastructures) and the expectations on relatively flatter gas demand patterns across the year seem to have contributed gradually to narrow (or keep low) winter/summer spreads based on forward products. On the other hand, the high impact of weather conditions on both gas and power consumptions made it more challenging for market participants accurately to forecast the winter/summer spreads. As a result, the price differential between forward and spot products seems to be gradually enlarg-ing. In addition, for the first time, the summer-winter spreads at TTF and NBP did not follow the same patterns, mainly due to the closing of the Rough storage facility in UK42.
Figure 11: NBP and TTF forward and actual summer/winter spreads 2010–2018 - euros/MWh
Source: ACER based on Platt’s data.Notes: 1) Ex-ante graph: for every storage year, the forward summer/winter spread is calculated as the difference between the Season+2 prices (covering the period from October “Y” to March “Y+1”) and Season +1 prices (covering the period from April “Y” to September “Y”), as observed on average on March “Y”. 2) Ex-post graph: for every storage year, the ex-post summer/winter spread is calculated as the difference between the average of the actual spot prices during the period from October “Y” to March “Y+1” and the average of actual spot prices during the period from April “Y” to September “Y”.
42 In the absence of the Rough’s storage capacity, during the summer the oversupply in the UK brings gas export to the continent while the reverse is the case in the winter.
GWh/
d
1000600
-1000
200400
-200-400-600-800
0
-1200
04/16
05/16
06/16
07/16
08/16
09/16
10/16
11/16
12/16
01/17
02/17
03/17
04/17
05/17
06/17
07/17
08/17
09/17
10/17
11/17
12/17
01/18
02/18
03/18
04/18
Injections Withdrawals
euro
s/MW
h
Actual summer/winter spreadsForecasted summer/winter spreads by date of publication8642
-4-6-8
-20
TTF NBP
03/20
10
03/20
11
03/20
12
03/20
13
03/20
14
03/20
15
03/20
16
2010
2011
2012
2013
2014
2015
2016
2017
4.0
0.9
3.2
-0.9
1.3
-5.7
5.3
1.8
4.3 4.5
4.0 4.4
5.8
-0.02.0
-5.3
1.5 1.7
3.7 3.1 4.0
1.3 2.4
3.9 3.7 5.6
2.6 3.8
2.9 2.5
23
A C E R / C E E R A N N U A L R E P O R T O N T H E R E S U L T S O F M O N I T O R I N G T H E I N T E R N A L N A T U R A L G A S M A R K E T S I N 2 0 1 7
83 In some MSs, the usage of storage is still less flexible due to restrictive regulation, as discussed in the previous edition of the MMR and in the ‘Barriers in Gas Wholesale Markets Survey’43. The revisions of storage obligations implemented in France44 during 2017 show that security of supply is guaranteed also with a more market-based approach to storage, even during exceptional circumstances, as the cold spell of February and March 2018.
84 Obligations to book storage capacity and restrictions to its utilisation have an impact on the level of competi-tion in a MS and on its gas wholesale and retail prices. For example, the new provisions on storage obligations established by the government in Poland, obliging any supplier importing gas to keep 30 days of the yearly vol-umes in the country’s storage facilities starting from 2017, worsened the price convergence of the Polish market with the NWE region, as shown in paragraphs 151 and 152.
85 Apart from that, and not considering exceptional circumstances like a cold spell, the dynamics of injection and withdrawals in the EU seem to continue to indicate a shorter-term orientation for portfolio optimisation and bal-ancing. This is confirmed by increased volumes of withdrawals registered in the summer months (in summer 2017 withdrawals increased by 30% with respect to the previous year) and increased volumes of injections in winter months (in autumn 2017 injections increased by 53% with respect to the previous year), signalling a posi-tive trend of more flexibility provided by storage facilities.
43 MMR 2016 pages 12, 18 and 19. ‘Barriers in Gas wholesale Markets Survey’ pages 16, 43, 44, 47 link: https://www.acer.europa.eu/en/Electricity/Market%20monitoring/Documents_Public/Kantor_report_on%20barriers%20to%20gas%20wholesale%20trading.pdf.
44 Since 2017 storage capacity is allocated via auctions.
24
A C E R / C E E R A N N U A L R E P O R T O N T H E R E S U L T S O F M O N I T O R I N G T H E I N T E R N A L N A T U R A L G A S M A R K E T S I N 2 0 1 7
3. Gas target model indicators: an assessment of EU gas markets’ performance
86 This Chapter looks into the market structure and transactional activity at gas wholesale markets in EU MSs, using indicators recommended in the AGTM. For some of the topics covered, the AGTM indicators have been complemented with additional metrics.
87 The AGTM is a model for the IGM developed by the Agency, NRAs and gas sector stakeholders. At its core are interconnectivity between, competition at, and liquidity of, gas hubs. In order to assess the gap between gas hubs’ current status and a target model of well-functioning hubs, the AGTM is complemented by a set of indica-tors, the so-called market health metrics and the market participants’ needs metrics.
88 The results of the application of the market health metrics indicate whether gas hubs are structurally competi-tive, resilient and exhibit a sufficient degree of diversity of supply; and the results of the application of market participant’s needs metrics indicate how liquid these hubs are.
89 Market participants’ needs metrics have been calculated using anonymised and aggregated data reported to the Agency under Regulation (EU) No 1227/2011 (REMIT). However, these metrics could be calculated only for those transparent trading venues with sufficient trading activity of standard gas products45.
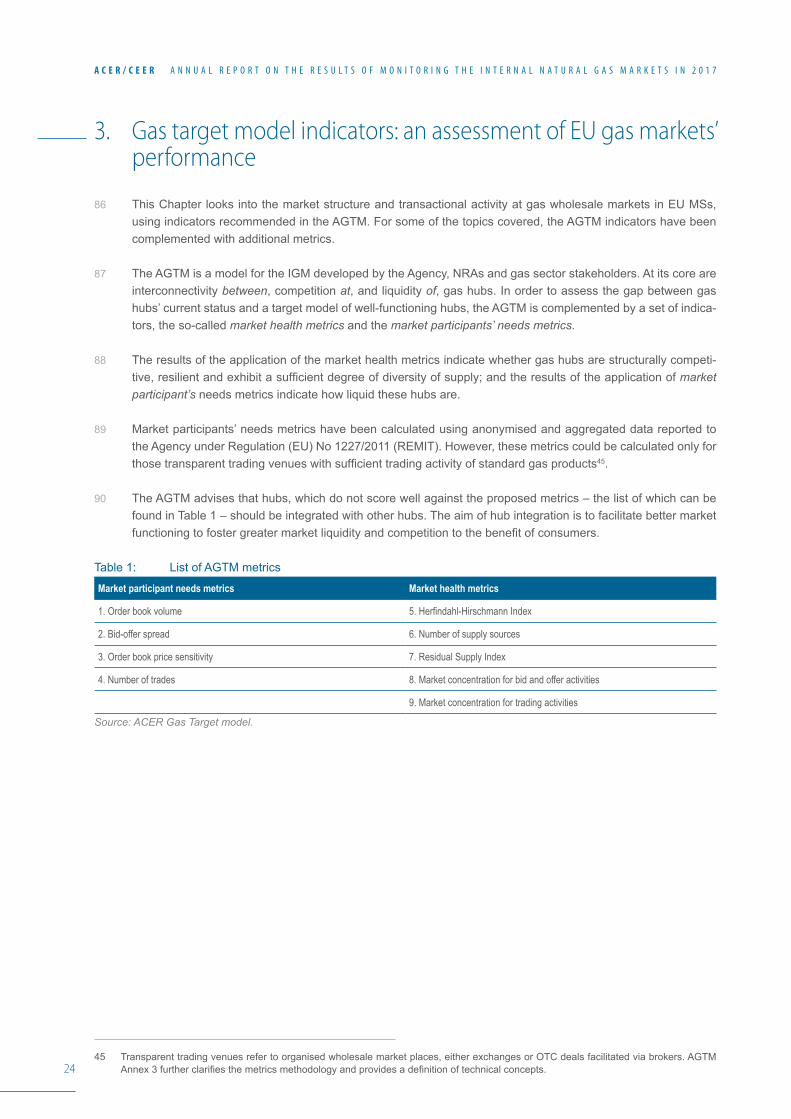
90 The AGTM advises that hubs, which do not score well against the proposed metrics – the list of which can be found in Table 1 – should be integrated with other hubs. The aim of hub integration is to facilitate better market functioning to foster greater market liquidity and competition to the benefit of consumers.
Table 1: List of AGTM metrics
Market participant needs metrics Market health metrics
1. Order book volume 5. Herfindahl-Hirschmann Index
2. Bid-offer spread 6. Number of supply sources
3. Order book price sensitivity 7. Residual Supply Index
4. Number of trades 8. Market concentration for bid and offer activities
9. Market concentration for trading activities
Source: ACER Gas Target model.
45 Transparent trading venues refer to organised wholesale market places, either exchanges or OTC deals facilitated via brokers. AGTM Annex 3 further clarifies the metrics methodology and provides a definition of technical concepts.
25
A C E R / C E E R A N N U A L R E P O R T O N T H E R E S U L T S O F M O N I T O R I N G T H E I N T E R N A L N A T U R A L G A S M A R K E T S I N 2 0 1 7
3.1 Assessment of resilience and competition in EU gas markets: AGTM market health metrics
91 Market health describes a broad set of competition aspects associated with gas hubs46: diversity of gas supply sources, concentration of gas suppliers and the hubs’ potential to meet its gas demand without its largest up-stream supplier. This set of metrics is related to aspects of upstream competition, while Section 3.2.5 focuses on competition in the hub’s transparent, organised trading venues.
92 As described in Section 2.1, five significant sources of upstream supply feed the EU’s and EnC gas markets: indigenous production, pipeline imports from Russia, Norway and Algeria, and shipments of LNG from various sources.
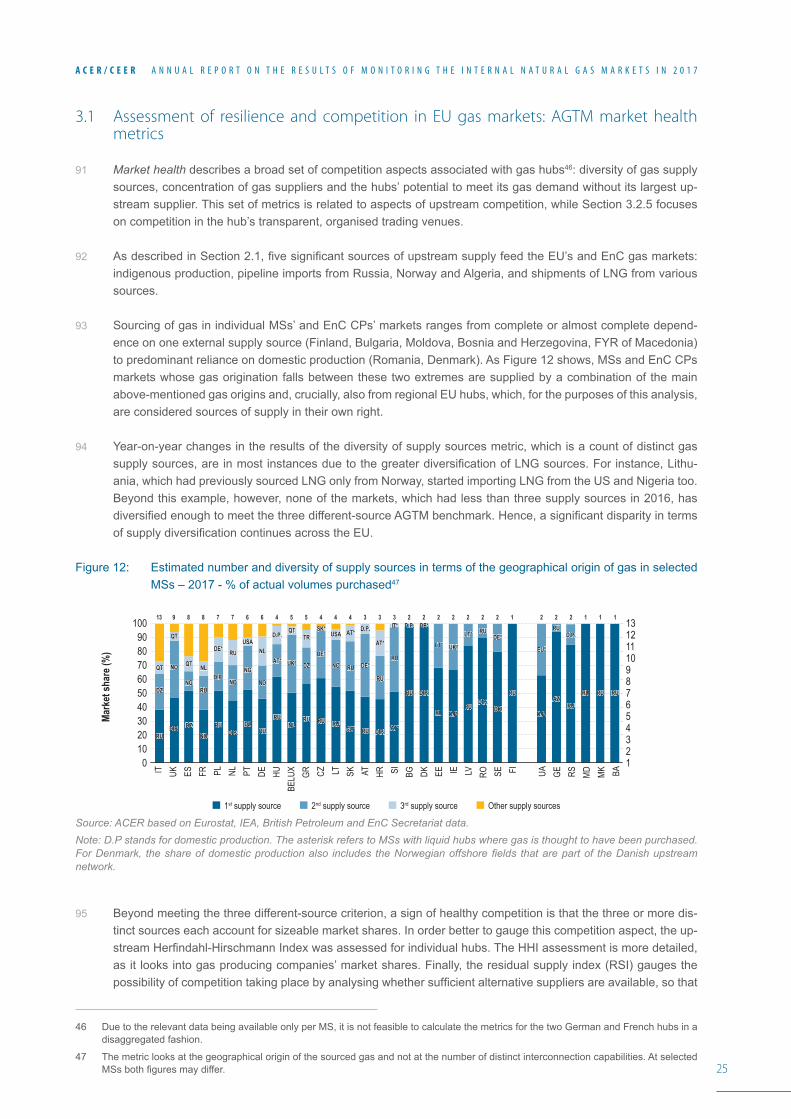
93 Sourcing of gas in individual MSs’ and EnC CPs’ markets ranges from complete or almost complete depend-ence on one external supply source (Finland, Bulgaria, Moldova, Bosnia and Herzegovina, FYR of Macedonia) to predominant reliance on domestic production (Romania, Denmark). As Figure 12 shows, MSs and EnC CPs markets whose gas origination falls between these two extremes are supplied by a combination of the main above-mentioned gas origins and, crucially, also from regional EU hubs, which, for the purposes of this analysis, are considered sources of supply in their own right.
94 Year-on-year changes in the results of the diversity of supply sources metric, which is a count of distinct gas supply sources, are in most instances due to the greater diversification of LNG sources. For instance, Lithu-ania, which had previously sourced LNG only from Norway, started importing LNG from the US and Nigeria too. Beyond this example, however, none of the markets, which had less than three supply sources in 2016, has diversified enough to meet the three different-source AGTM benchmark. Hence, a significant disparity in terms of supply diversification continues across the EU.
Figure 12: Estimated number and diversity of supply sources in terms of the geographical origin of gas in selected MSs – 2017 - % of actual volumes purchased47
Source: ACER based on Eurostat, IEA, British Petroleum and EnC Secretariat data.Note: D.P stands for domestic production. The asterisk refers to MSs with liquid hubs where gas is thought to have been purchased. For Denmark, the share of domestic production also includes the Norwegian offshore fields that are part of the Danish upstream network.
95 Beyond meeting the three different-source criterion, a sign of healthy competition is that the three or more dis-tinct sources each account for sizeable market shares. In order better to gauge this competition aspect, the up-stream Herfindahl-Hirschmann Index was assessed for individual hubs. The HHI assessment is more detailed, as it looks into gas producing companies’ market shares. Finally, the residual supply index (RSI) gauges the possibility of competition taking place by analysing whether sufficient alternative suppliers are available, so that
46 Due to the relevant data being available only per MS, it is not feasible to calculate the metrics for the two German and French hubs in a disaggregated fashion.
47 The metric looks at the geographical origin of the sourced gas and not at the number of distinct interconnection capabilities. At selected MSs both figures may differ.
1st supply source 2nd supply source 3rd supply source Other supply sources
Mark
et sh
are (
%)
IT UK ES FR PL NL PT DE HUBE
LUX GR CZ LT SK AT HR SI BG DK EE IE LV RO SE FI UA GE RS MD MK BA
100
708090
40
6050
302010
0
13
101112
7
98
56
4321
113 9 8 8 7 7 6 6 4 5 5 4 4 4 3 3 3 2 2 2 2 2 2 2 1 2 2 2 1 1
RU
DZ
QT
D.P.
NO
QT
DZ
NG
QT
NO
RU
NL
RU
D.P.
DE*
D.P.
NO
RU
DZ
NG
USA
RU
NO
NL
RU
AT*
D.P.
NL
UK*
QT
RU
DZ
TR
RU
DE*
SK*
RU
NO
USA
CZ*
RU
AT*
RU
DE*
D.P.
D.P.
RU
AT*
AT*
RU
IT*
RU
D.P.
D.P.
DE*
RU
LT*
D.P.
UK*
RU
LT* RU
D.P.DK
DE*
RU
D.P.
EU*
AZ
RU
RU
D.P.
RU RU RU
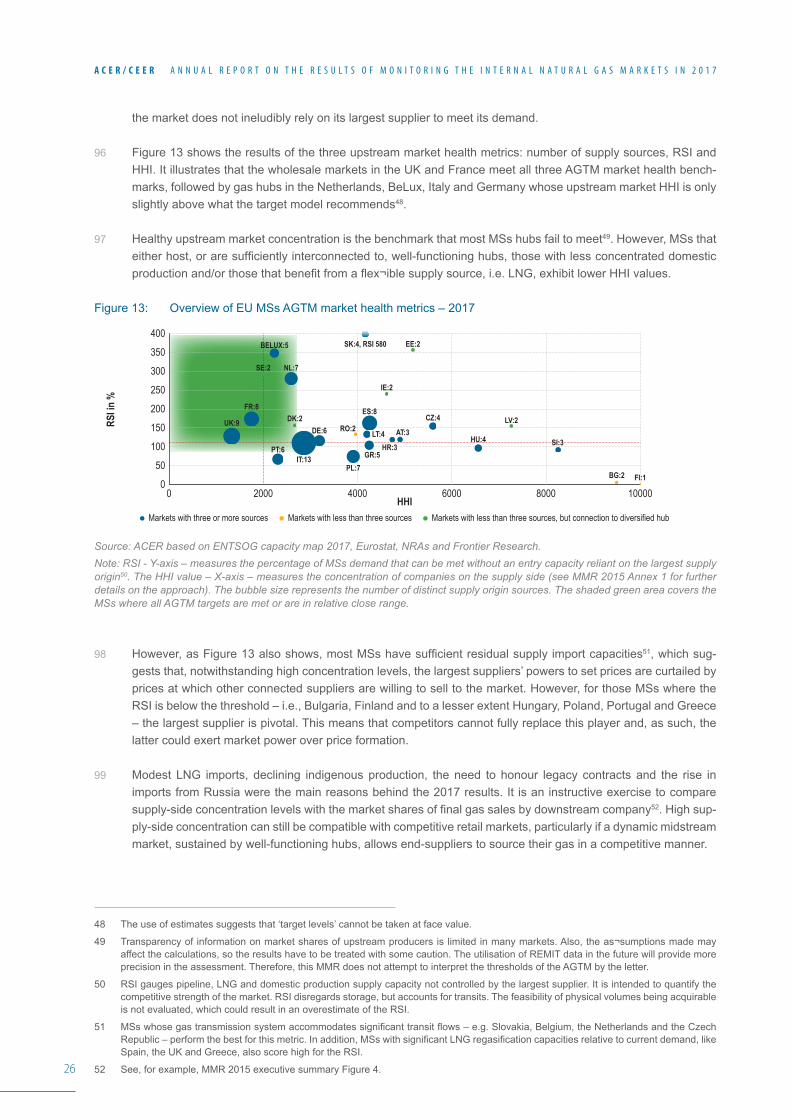
26
A C E R / C E E R A N N U A L R E P O R T O N T H E R E S U L T S O F M O N I T O R I N G T H E I N T E R N A L N A T U R A L G A S M A R K E T S I N 2 0 1 7
the market does not ineludibly rely on its largest supplier to meet its demand.
96 Figure 13 shows the results of the three upstream market health metrics: number of supply sources, RSI and HHI. It illustrates that the wholesale markets in the UK and France meet all three AGTM market health bench-marks, followed by gas hubs in the Netherlands, BeLux, Italy and Germany whose upstream market HHI is only slightly above what the target model recommends48.
97 Healthy upstream market concentration is the benchmark that most MSs hubs fail to meet49. However, MSs that either host, or are sufficiently interconnected to, well-functioning hubs, those with less concentrated domestic production and/or those that benefit from a flex¬ible supply source, i.e. LNG, exhibit lower HHI values.
Figure 13: Overview of EU MSs AGTM market health metrics – 2017
Source: ACER based on ENTSOG capacity map 2017, Eurostat, NRAs and Frontier Research.Note: RSI - Y-axis – measures the percentage of MSs demand that can be met without an entry capacity reliant on the largest supply origin50. The HHI value – X-axis – measures the concentration of companies on the supply side (see MMR 2015 Annex 1 for further details on the approach). The bubble size represents the number of distinct supply origin sources. The shaded green area covers the MSs where all AGTM targets are met or are in relative close range.
98 However, as Figure 13 also shows, most MSs have sufficient residual supply import capacities51, which sug-gests that, notwithstanding high concentration levels, the largest suppliers’ powers to set prices are curtailed by prices at which other connected suppliers are willing to sell to the market. However, for those MSs where the RSI is below the threshold – i.e., Bulgaria, Finland and to a lesser extent Hungary, Poland, Portugal and Greece – the largest supplier is pivotal. This means that competitors cannot fully replace this player and, as such, the latter could exert market power over price formation.
99 Modest LNG imports, declining indigenous production, the need to honour legacy contracts and the rise in imports from Russia were the main reasons behind the 2017 results. It is an instructive exercise to compare supply-side concentration levels with the market shares of final gas sales by downstream company52. High sup-ply-side concentration can still be compatible with competitive retail markets, particularly if a dynamic midstream market, sustained by well-functioning hubs, allows end-suppliers to source their gas in a competitive manner.
48 The use of estimates suggests that ‘target levels’ cannot be taken at face value.
49 Transparency of information on market shares of upstream producers is limited in many markets. Also, the as¬sumptions made may affect the calculations, so the results have to be treated with some caution. The utilisation of REMIT data in the future will provide more precision in the assessment. Therefore, this MMR does not attempt to interpret the thresholds of the AGTM by the letter.
50 RSI gauges pipeline, LNG and domestic production supply capacity not controlled by the largest supplier. It is intended to quantify the competitive strength of the market. RSI disregards storage, but accounts for transits. The feasibility of physical volumes being acquirable is not evaluated, which could result in an overestimate of the RSI.
51 MSs whose gas transmission system accommodates significant transit flows – e.g. Slovakia, Belgium, the Netherlands and the Czech Republic – perform the best for this metric. In addition, MSs with significant LNG regasification capacities relative to current demand, like Spain, the UK and Greece, also score high for the RSI.
52 See, for example, MMR 2015 executive summary Figure 4.
AT:3
GR:5
LT:4
PT:6 HR:3
CZ:4DE:6
BELUX:5
UK:9
SK:4, RSI 580
ES:8FR:8
NL:7
IT:13PL:7
RSI in
%
HHI
400
50
100
150
200
250
300
350
00 2000 4000 6000 8000 10000
Markets with three or more sources Markets with less than three sources Markets with less than three sources, but connection to diversified hub
FI:1
LV:2
BG:2
EE:2
DK:2
SE:2
IE:2
SI:3HU:4RO:2
27
A C E R / C E E R A N N U A L R E P O R T O N T H E R E S U L T S O F M O N I T O R I N G T H E I N T E R N A L N A T U R A L G A S M A R K E T S I N 2 0 1 7
100 Overall, the results for the three market health metrics are closely interrelated, as they measure interdependent aspects. Moreover, they are also strongly linked to the metrics gauging the quality of hubs’ functioning, which will be presented in the next Section. Market health metrics reveal structural aspects that influence the way in which gas wholesale markets function.
101 Finally, even if the AGTM metrics were developed to assess MS’s performance and hence are here presented at the MS level, it is important to apply a regional lens when analysing the results. Even when taking into ac-count individual MS specificities, some regional aggregation can be done: the NWE region is the most resilient; Mediterranean MSs benefit from the flexibility that LNG provides; the CEE and Baltic regions are progressively diversifying their supplies away from their historical supplier, Gazprom. However, in the SSE region, two MSs still depend on a single supplier. Thus they can benefit from certain infrastructure investment, further implemen-tation of Third Energy Package regulations and crucially enhanced regional cooperation.
3.2 Assessment of the functioning of EU gas hubs: AGTM market participants’ needs benchmarks
102 Market participants’ needs metrics indicate whether, and to what extent, the transactional needs of wholesale market participants have been met.
103 Therefore, the analysis focuses on the liquidity of hubs’ standard gas commodity products, ranging from those with a short duration of delivery (that are only traded close to their delivery start) to products which deliver throughout a calendar year (that in some markets are traded up to two years ahead of their start of delivery). This corresponds to what market participants’ needs are:
• Spot liquidity to balance their actual positions, i.e. match their actual gas demand and gas supply;
• Prompt liquidity: sufficient liquidity and diversity of medium-duration products with which to profile their ex-pected position (e.g. risk management);
• Forward liquidity: sufficient liquidity to cover future exposure (mitigate the risk of prices moving in an unfa-vourable direction or price hedging).
104 Since liquidity is a concept for which no definitive measure exists, it can be estimated in multiple ways. For the purposes of this analysis, many established methodologies are used, ranging from intuitive metrics, such as traded gas volumes and number of trades, to more complex measures, like bid-ask spreads and order book availability. The value in such an approach is that each metric is revealing of some market liquidity aspect, and when assessed together they allow for greater confidence in gauging the state of development of individual gas hubs. However, as will be shown, it is generally the case that, for a given hub and product, the results of the various employed metrics all broadly point in the same direction.
105 The Sections that follow are organised in the following way:
• The Section on Hub traded volumes presents overall EU and individual hubs traded volumes for 2017. The results are assessed relative to previous years, as well as broken down by different product types.
• The Section on Liquidity at EU hubs spot markets presents trading frequency, order book availability and bid-ask spread of the day-ahead product at EU gas hubs in 2017.
• The Section on Liquidity at EU hubs prompt markets presents trading frequency, order book availability and bid-ask spread of the month-ahead product at EU gas hubs in 2017.
• The Section on Liquidity at EU hubs forward markets presents trading time horizon, order book time horizon and bid-ask spread of a number of forward products at EU gas hubs in 2017.
• The Section on Competition at EU hubs spot, prompt and forward markets presents the results of the as-sessment of hub transactional concentration and compares it with the assessed upstream concentration.
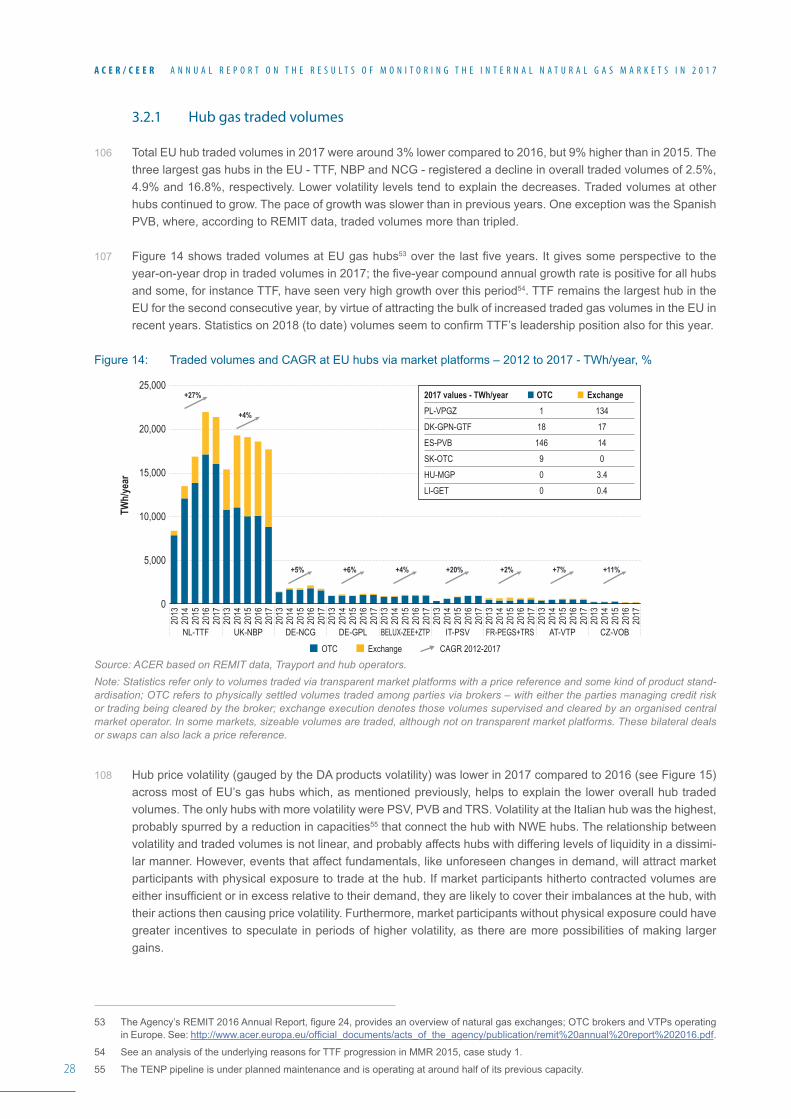
28
A C E R / C E E R A N N U A L R E P O R T O N T H E R E S U L T S O F M O N I T O R I N G T H E I N T E R N A L N A T U R A L G A S M A R K E T S I N 2 0 1 7
3.2.1 Hub gas traded volumes
106 Total EU hub traded volumes in 2017 were around 3% lower compared to 2016, but 9% higher than in 2015. The three largest gas hubs in the EU - TTF, NBP and NCG - registered a decline in overall traded volumes of 2.5%, 4.9% and 16.8%, respectively. Lower volatility levels tend to explain the decreases. Traded volumes at other hubs continued to grow. The pace of growth was slower than in previous years. One exception was the Spanish PVB, where, according to REMIT data, traded volumes more than tripled.
107 Figure 14 shows traded volumes at EU gas hubs53 over the last five years. It gives some perspective to the year-on-year drop in traded volumes in 2017; the five-year compound annual growth rate is positive for all hubs and some, for instance TTF, have seen very high growth over this period54. TTF remains the largest hub in the EU for the second consecutive year, by virtue of attracting the bulk of increased traded gas volumes in the EU in recent years. Statistics on 2018 (to date) volumes seem to confirm TTF’s leadership position also for this year.
Figure 14: Traded volumes and CAGR at EU hubs via market platforms – 2012 to 2017 - TWh/year, %
Source: ACER based on REMIT data, Trayport and hub operators. Note: Statistics refer only to volumes traded via transparent market platforms with a price reference and some kind of product stand-ardisation; OTC refers to physically settled volumes traded among parties via brokers – with either the parties managing credit risk or trading being cleared by the broker; exchange execution denotes those volumes supervised and cleared by an organised central market operator. In some markets, sizeable volumes are traded, although not on transparent market platforms. These bilateral deals or swaps can also lack a price reference.
108 Hub price volatility (gauged by the DA products volatility) was lower in 2017 compared to 2016 (see Figure 15) across most of EU’s gas hubs which, as mentioned previously, helps to explain the lower overall hub traded volumes. The only hubs with more volatility were PSV, PVB and TRS. Volatility at the Italian hub was the highest, probably spurred by a reduction in capacities55 that connect the hub with NWE hubs. The relationship between volatility and traded volumes is not linear, and probably affects hubs with differing levels of liquidity in a dissimi-lar manner. However, events that affect fundamentals, like unforeseen changes in demand, will attract market participants with physical exposure to trade at the hub. If market participants hitherto contracted volumes are either insufficient or in excess relative to their demand, they are likely to cover their imbalances at the hub, with their actions then causing price volatility. Furthermore, market participants without physical exposure could have greater incentives to speculate in periods of higher volatility, as there are more possibilities of making larger gains.
53 The Agency’s REMIT 2016 Annual Report, figure 24, provides an overview of natural gas exchanges; OTC brokers and VTPs operating in Europe. See: http://www.acer.europa.eu/official_documents/acts_of_the_agency/publication/remit%20annual%20report%202016.pdf.
54 See an analysis of the underlying reasons for TTF progression in MMR 2015, case study 1.
55 The TENP pipeline is under planned maintenance and is operating at around half of its previous capacity.
ExchangeOTC CAGR 2012-2017
TWh/
year
25,000
15,000
20,000
10,000
5,000
0
2013
2014
2015
2016
2017
2013
2014
2015
2016
2017
2013
2014
2015
2016
2017
2013
2014
2015
2016
2017
2013
2014
2015
2016
2017
2013
2014
2015
2016
2017
2013
2014
2015
2016
2017
2013
2014
2015
2016
2017
2013
2014
2015
2016
2017
UK-NBP DE-NCG DE-GPL BELUX-ZEE+ZTP IT-PSV FR-PEGS+TRS AT-VTP CZ-VOBNL-TTF
+27%
+4%
+5% +6% +4% +20% +2% +7% +11%
2017 values - TWh/yearPL-VPGZDK-GPN-GTFES-PVBSK-OTCHU-MGPLI-GET
OTC1
18146900
Exchange13417140
3.40.4
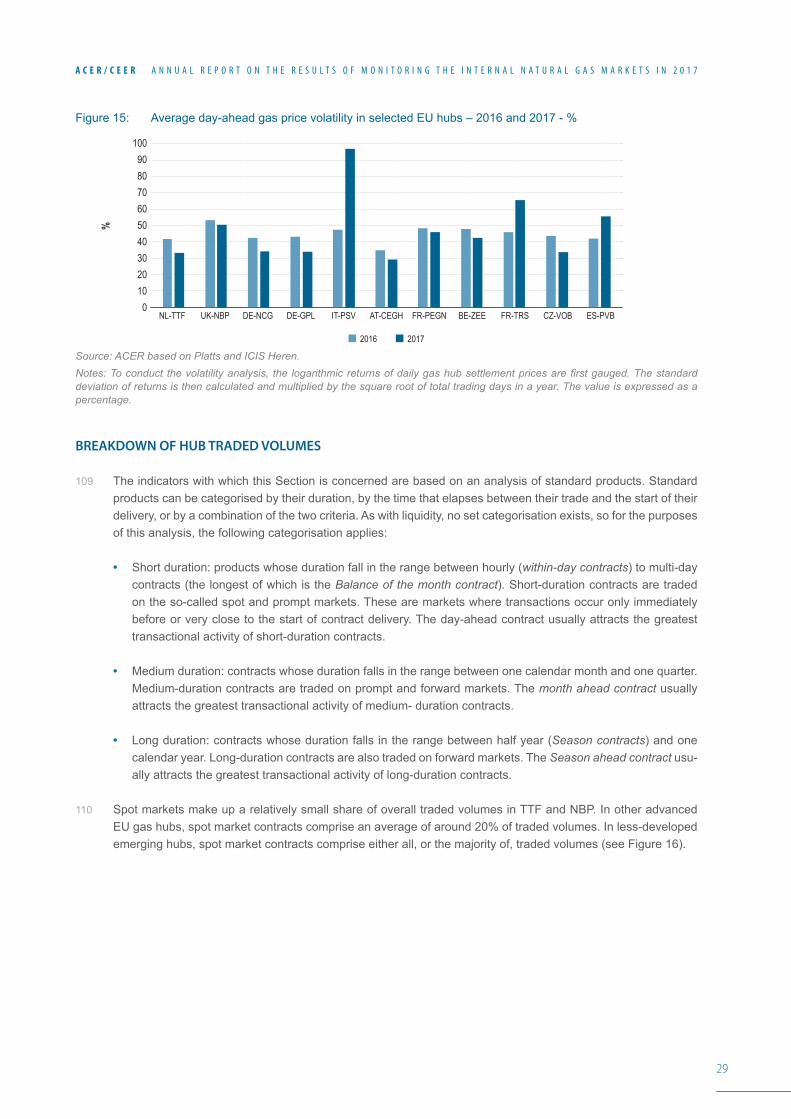
29
A C E R / C E E R A N N U A L R E P O R T O N T H E R E S U L T S O F M O N I T O R I N G T H E I N T E R N A L N A T U R A L G A S M A R K E T S I N 2 0 1 7
Figure 15: Average day-ahead gas price volatility in selected EU hubs – 2016 and 2017 - %
Source: ACER based on Platts and ICIS Heren. Notes: To conduct the volatility analysis, the logarithmic returns of daily gas hub settlement prices are first gauged. The standard deviation of returns is then calculated and multiplied by the square root of total trading days in a year. The value is expressed as a percentage.
BREAKDOWN OF HUB TRADED VOLUMES
109 The indicators with which this Section is concerned are based on an analysis of standard products. Standard products can be categorised by their duration, by the time that elapses between their trade and the start of their delivery, or by a combination of the two criteria. As with liquidity, no set categorisation exists, so for the purposes of this analysis, the following categorisation applies:
• Short duration: products whose duration fall in the range between hourly (within-day contracts) to multi-day contracts (the longest of which is the Balance of the month contract). Short-duration contracts are traded on the so-called spot and prompt markets. These are markets where transactions occur only immediately before or very close to the start of contract delivery. The day-ahead contract usually attracts the greatest transactional activity of short-duration contracts.
• Medium duration: contracts whose duration falls in the range between one calendar month and one quarter. Medium-duration contracts are traded on prompt and forward markets. The month ahead contract usually attracts the greatest transactional activity of medium- duration contracts.
• Long duration: contracts whose duration falls in the range between half year (Season contracts) and one calendar year. Long-duration contracts are also traded on forward markets. The Season ahead contract usu-ally attracts the greatest transactional activity of long-duration contracts.
110 Spot markets make up a relatively small share of overall traded volumes in TTF and NBP. In other advanced EU gas hubs, spot market contracts comprise an average of around 20% of traded volumes. In less-developed emerging hubs, spot market contracts comprise either all, or the majority of, traded volumes (see Figure 16).
%
1009080
60
40
20
70
50
30
100
NL-TTF UK-NBP DE-NCG DE-GPL IT-PSV AT-CEGH FR-PEGN BE-ZEE FR-TRS CZ-VOB ES-PVB
2016 2017
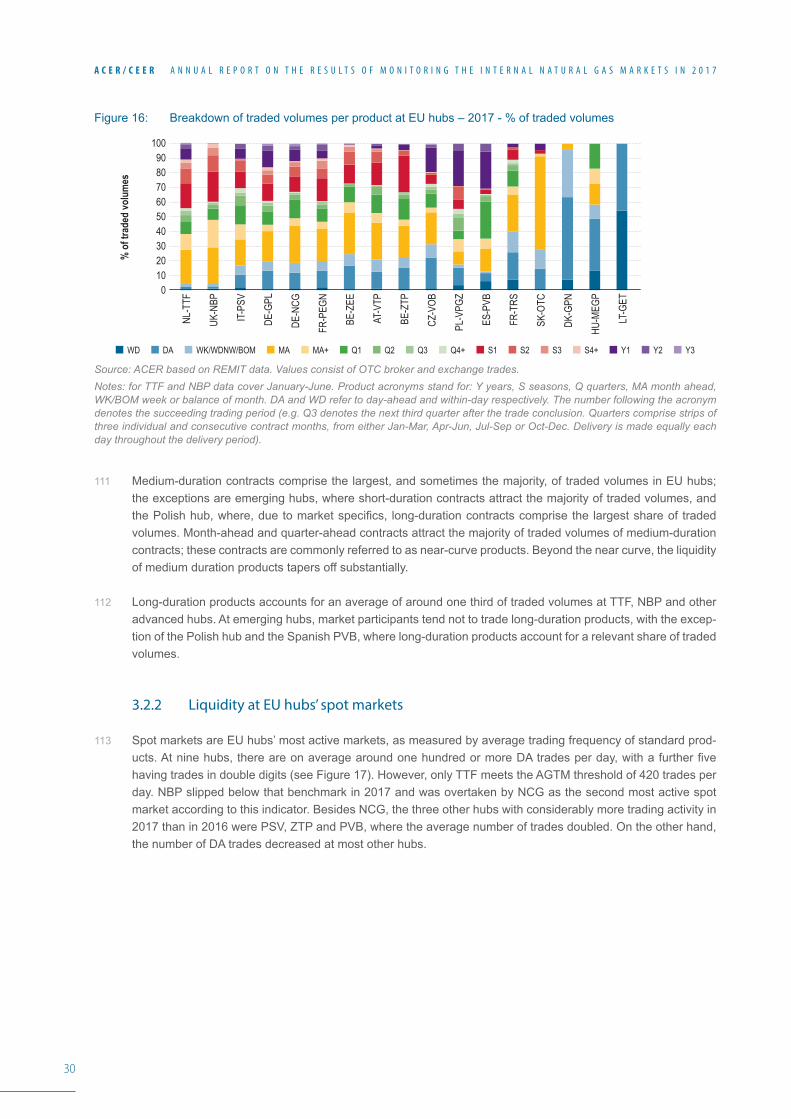
30
A C E R / C E E R A N N U A L R E P O R T O N T H E R E S U L T S O F M O N I T O R I N G T H E I N T E R N A L N A T U R A L G A S M A R K E T S I N 2 0 1 7
Figure 16: Breakdown of traded volumes per product at EU hubs – 2017 - % of traded volumes
Source: ACER based on REMIT data. Values consist of OTC broker and exchange trades.Notes: for TTF and NBP data cover January-June. Product acronyms stand for: Y years, S seasons, Q quarters, MA month ahead, WK/BOM week or balance of month. DA and WD refer to day-ahead and within-day respectively. The number following the acronym denotes the succeeding trading period (e.g. Q3 denotes the next third quarter after the trade conclusion. Quarters comprise strips of three individual and consecutive contract months, from either Jan-Mar, Apr-Jun, Jul-Sep or Oct-Dec. Delivery is made equally each day throughout the delivery period).
111 Medium-duration contracts comprise the largest, and sometimes the majority, of traded volumes in EU hubs; the exceptions are emerging hubs, where short-duration contracts attract the majority of traded volumes, and the Polish hub, where, due to market specifics, long-duration contracts comprise the largest share of traded volumes. Month-ahead and quarter-ahead contracts attract the majority of traded volumes of medium-duration contracts; these contracts are commonly referred to as near-curve products. Beyond the near curve, the liquidity of medium duration products tapers off substantially.
112 Long-duration products accounts for an average of around one third of traded volumes at TTF, NBP and other advanced hubs. At emerging hubs, market participants tend not to trade long-duration products, with the excep-tion of the Polish hub and the Spanish PVB, where long-duration products account for a relevant share of traded volumes.
3.2.2 Liquidity at EU hubs’ spot markets
113 Spot markets are EU hubs’ most active markets, as measured by average trading frequency of standard prod-ucts. At nine hubs, there are on average around one hundred or more DA trades per day, with a further five having trades in double digits (see Figure 17). However, only TTF meets the AGTM threshold of 420 trades per day. NBP slipped below that benchmark in 2017 and was overtaken by NCG as the second most active spot market according to this indicator. Besides NCG, the three other hubs with considerably more trading activity in 2017 than in 2016 were PSV, ZTP and PVB, where the average number of trades doubled. On the other hand, the number of DA trades decreased at most other hubs.
% o
f tra
ded
volu
mes
10090807060504030
1020
0
NL-T
TF
UK-N
BP
IT-PS
V
DE-G
PL
DE-N
CG
FR-P
EGN
BE-Z
EE
AT-V
TP
BE-Z
TP
CZ-V
OB
PL-V
PGZ
ES-P
VB
FR-T
RS
SK-O
TC
DK-G
PN
HU-M
EGP
LT-G
ET
S1 S2 S3 Y1 Y2 Y3S4+WD DA MA MA+ Q1 Q2 Q3 Q4+WK/WDNW/BOM
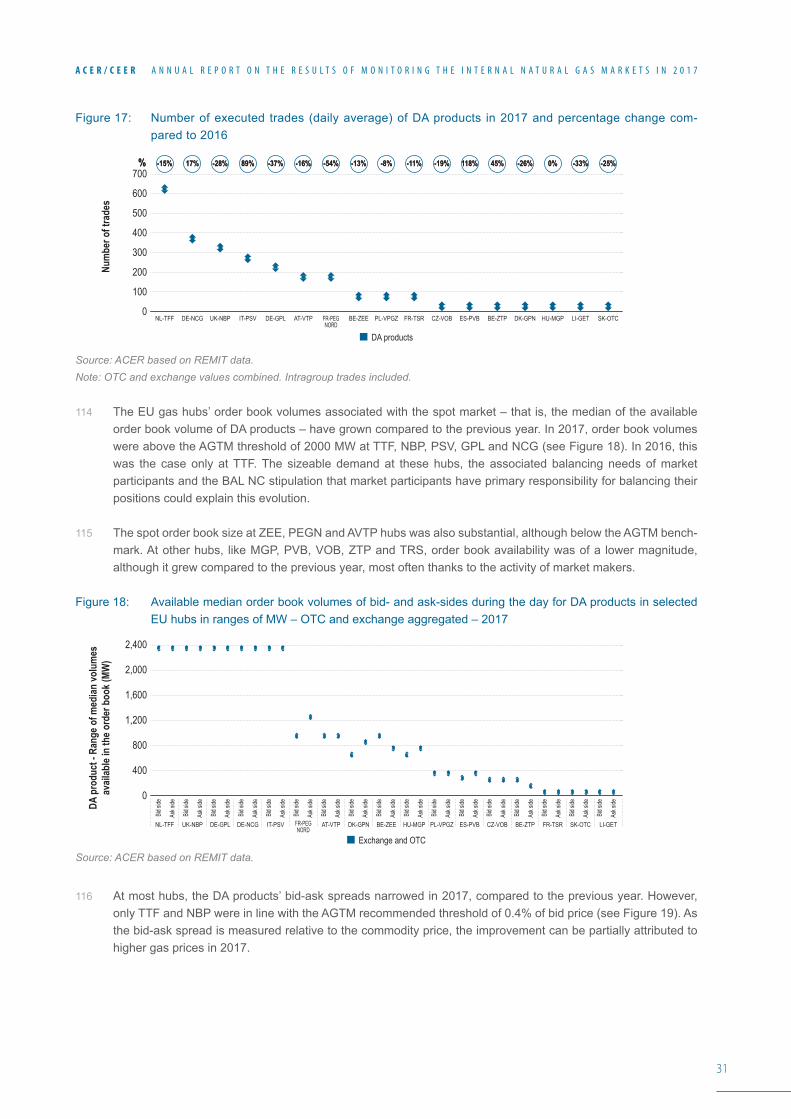
31
A C E R / C E E R A N N U A L R E P O R T O N T H E R E S U L T S O F M O N I T O R I N G T H E I N T E R N A L N A T U R A L G A S M A R K E T S I N 2 0 1 7
Figure 17: Number of executed trades (daily average) of DA products in 2017 and percentage change com-pared to 2016
Source: ACER based on REMIT data.Note: OTC and exchange values combined. Intragroup trades included.
114 The EU gas hubs’ order book volumes associated with the spot market – that is, the median of the available order book volume of DA products – have grown compared to the previous year. In 2017, order book volumes were above the AGTM threshold of 2000 MW at TTF, NBP, PSV, GPL and NCG (see Figure 18). In 2016, this was the case only at TTF. The sizeable demand at these hubs, the associated balancing needs of market participants and the BAL NC stipulation that market participants have primary responsibility for balancing their positions could explain this evolution.
115 The spot order book size at ZEE, PEGN and AVTP hubs was also substantial, although below the AGTM bench-mark. At other hubs, like MGP, PVB, VOB, ZTP and TRS, order book availability was of a lower magnitude, although it grew compared to the previous year, most often thanks to the activity of market makers.
Figure 18: Available median order book volumes of bid- and ask-sides during the day for DA products in selected EU hubs in ranges of MW – OTC and exchange aggregated – 2017
Source: ACER based on REMIT data.
116 At most hubs, the DA products’ bid-ask spreads narrowed in 2017, compared to the previous year. However, only TTF and NBP were in line with the AGTM recommended threshold of 0.4% of bid price (see Figure 19). As the bid-ask spread is measured relative to the commodity price, the improvement can be partially attributed to higher gas prices in 2017.
Num
ber o
f tra
des
700
400
300
500
600
200
100
0
-15%-15%%% 17%17% -28%-28% 89%89% -37%-37% -16%-16% -54%-54% -13%-13% -8%-8% -11%-11% -19%-19% 118%118% 45%45% -26%-26% 0%0% -33%-33% -25%-25%
NL-TFF UK-NBP DE-GPLDE-NCG BE-ZEE DK-GPNIT-PSV LI-GETHU-MGPAT-VTP FR-PEGNORD
PL-VPGZ ES-PVBCZ-VOB BE-ZTPFR-TSR SK-OTC
DA products
DA p
rodu
ct -
Rang
e of m
edian
volu
mes
avail
able
in th
e ord
er b
ook (
MW)
2,400
1,600
2,000
1,200
400
800
0
Bid si
de
Ask s
ide
Bid si
de
Ask s
ide
Bid si
de
Ask s
ide
Bid si
de
Ask s
ide
Bid si
de
Ask s
ide
Bid si
de
Ask s
ide
Bid si
de
Ask s
ide
Bid si
de
Ask s
ide
Bid si
de
Ask s
ide
Bid si
de
Ask s
ide
Bid si
de
Ask s
ide
Bid si
de
Ask s
ide
Bid si
de
Ask s
ide
Bid si
de
Ask s
ide
Bid si
de
Ask s
ide
Bid si
de
Ask s
ide
Bid si
de
Ask s
ide
NL-TFF UK-NBP DE-GPL DE-NCG BE-ZEEDK-GPNIT-PSV LI-GETHU-MGPAT-VTPFR-PEGNORD
PL-VPGZ ES-PVB CZ-VOB BE-ZTP FR-TSR SK-OTC
Exchange and OTC
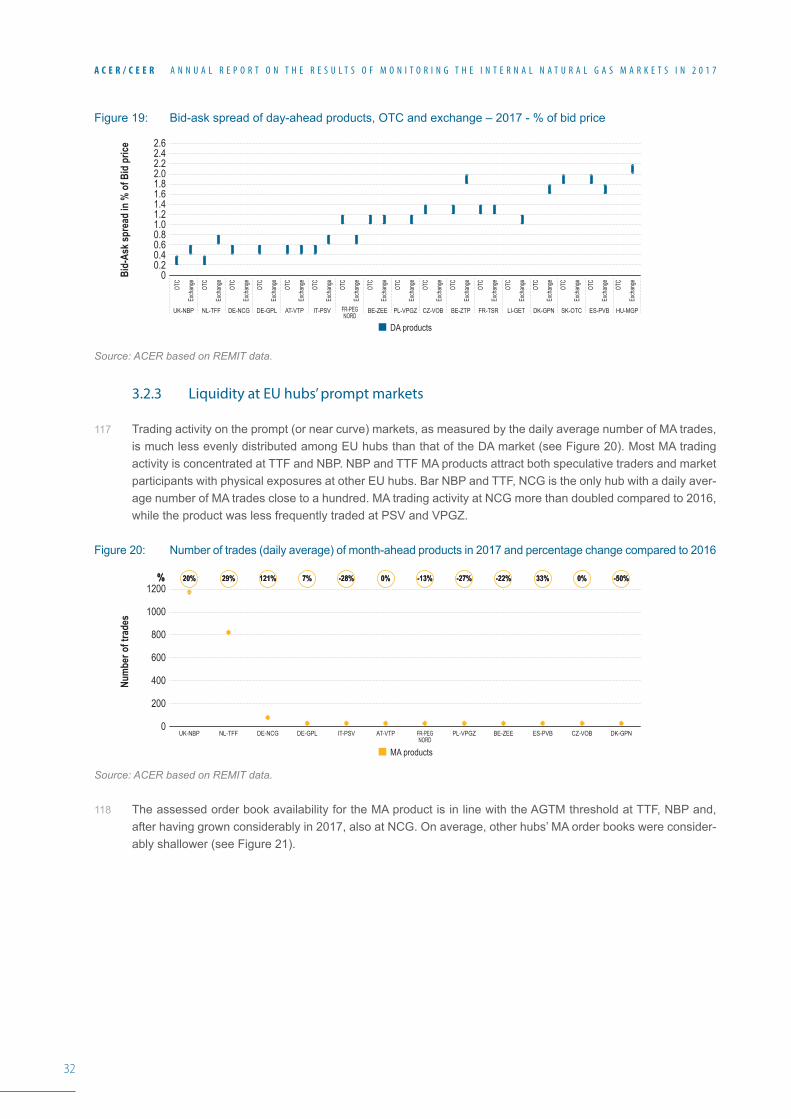
32
A C E R / C E E R A N N U A L R E P O R T O N T H E R E S U L T S O F M O N I T O R I N G T H E I N T E R N A L N A T U R A L G A S M A R K E T S I N 2 0 1 7
Figure 19: Bid-ask spread of day-ahead products, OTC and exchange – 2017 - % of bid price
Source: ACER based on REMIT data.
3.2.3 Liquidity at EU hubs’ prompt markets
117 Trading activity on the prompt (or near curve) markets, as measured by the daily average number of MA trades, is much less evenly distributed among EU hubs than that of the DA market (see Figure 20). Most MA trading activity is concentrated at TTF and NBP. NBP and TTF MA products attract both speculative traders and market participants with physical exposures at other EU hubs. Bar NBP and TTF, NCG is the only hub with a daily aver-age number of MA trades close to a hundred. MA trading activity at NCG more than doubled compared to 2016, while the product was less frequently traded at PSV and VPGZ.
Figure 20: Number of trades (daily average) of month-ahead products in 2017 and percentage change compared to 2016
Source: ACER based on REMIT data.
118 The assessed order book availability for the MA product is in line with the AGTM threshold at TTF, NBP and, after having grown considerably in 2017, also at NCG. On average, other hubs’ MA order books were consider-ably shallower (see Figure 21).
Bid-
Ask s
prea
d in
% o
f Bid
pric
e 2.6
2.2
1.8
1.4
0.6
1.0
2.4
2.0
1.6
0.8
1.2
0.40.2
0
DA products
OTC
Exch
ange
OTC
Exch
ange
OTC
Exch
ange
OTC
Exch
ange
OTC
Exch
ange
OTC
Exch
ange
OTC
Exch
ange
OTC
Exch
ange
OTC
Exch
ange
OTC
Exch
ange
OTC
Exch
ange
OTC
Exch
ange
OTC
Exch
ange
OTC
Exch
ange
OTC
Exch
ange
OTC
Exch
ange
OTC
Exch
ange
NL-TFFUK-NBP DE-GPLDE-NCG BE-ZEE DK-GPNIT-PSV LI-GET HU-MGPAT-VTP FR-PEGNORD
PL-VPGZ ES-PVBCZ-VOB BE-ZTP FR-TSR SK-OTC
Num
ber o
f tra
des
1200
800
600
1000
400
200
0
20%20%%% 29%29% 121%121% 7%7% -28%-28% 0%0% -13%-13% -27%-27% -22%-22% 33%33% 0%0% -50%-50%
NL-TFFUK-NBP DE-GPLDE-NCG BE-ZEE DK-GPNIT-PSV AT-VTP FR-PEGNORD
PL-VPGZ ES-PVB CZ-VOB
MA products
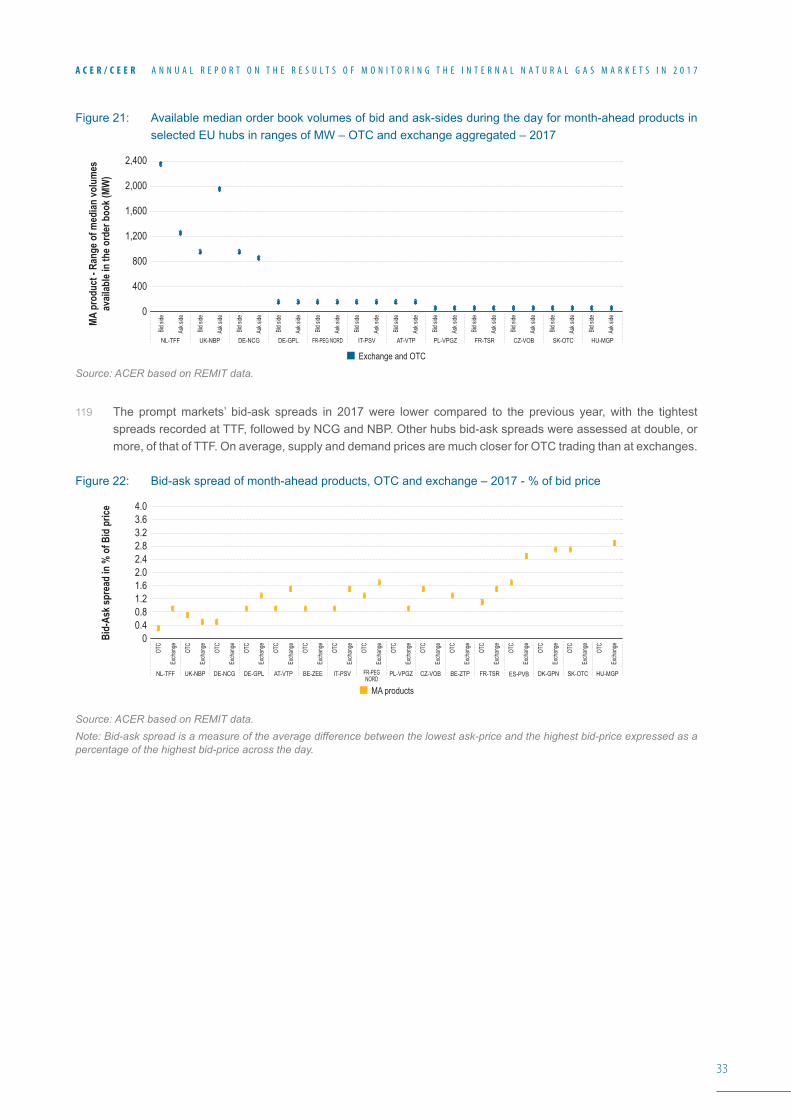
33
A C E R / C E E R A N N U A L R E P O R T O N T H E R E S U L T S O F M O N I T O R I N G T H E I N T E R N A L N A T U R A L G A S M A R K E T S I N 2 0 1 7
Figure 21: Available median order book volumes of bid and ask-sides during the day for month-ahead products in selected EU hubs in ranges of MW – OTC and exchange aggregated – 2017
Source: ACER based on REMIT data.
119 The prompt markets’ bid-ask spreads in 2017 were lower compared to the previous year, with the tightest spreads recorded at TTF, followed by NCG and NBP. Other hubs bid-ask spreads were assessed at double, or more, of that of TTF. On average, supply and demand prices are much closer for OTC trading than at exchanges.
Figure 22: Bid-ask spread of month-ahead products, OTC and exchange – 2017 - % of bid price
Source: ACER based on REMIT data.Note: Bid-ask spread is a measure of the average difference between the lowest ask-price and the highest bid-price expressed as a percentage of the highest bid-price across the day.
MA p
rodu
ct -
Rang
e of m
edian
volu
mes
avail
able
in th
e ord
er b
ook (
MW)
2,400
1,600
2,000
1,200
400
800
0
Bid si
de
Ask s
ide
Bid si
de
Ask s
ide
Bid si
de
Ask s
ide
Bid si
de
Ask s
ide
Bid si
de
Ask s
ide
Bid si
de
Ask s
ide
Bid si
de
Ask s
ide
Bid si
de
Ask s
ide
Bid si
de
Ask s
ide
Bid si
de
Ask s
ide
Bid si
de
Ask s
ide
Bid si
de
Ask s
ide
NL-TFF UK-NBP DE-GPLDE-NCG IT-PSV HU-MGPAT-VTPFR-PEG NORD PL-VPGZ CZ-VOBFR-TSR SK-OTC
Exchange and OTC
Bid-
Ask s
prea
d in
% o
f Bid
pric
e 4.0
2.42.83.23.6
2.01.6
0.81.2
0.40
MA products
OTC
Exch
ange
OTC
Exch
ange
OTC
Exch
ange
OTC
Exch
ange
OTC
Exch
ange
OTC
Exch
ange
OTC
Exch
ange
OTC
Exch
ange
OTC
Exch
ange
OTC
Exch
ange
OTC
Exch
ange
OTC
Exch
ange
OTC
Exch
ange
OTC
Exch
ange
OTC
Exch
ange
OTC
Exch
ange
NL-TFF UK-NBP DE-GPLDE-NCG BE-ZEE DK-GPNIT-PSV HU-MGPAT-VTP FR-PEGNORD
PL-VPGZ ES-PVBCZ-VOB BE-ZTP FR-TSR SK-OTC
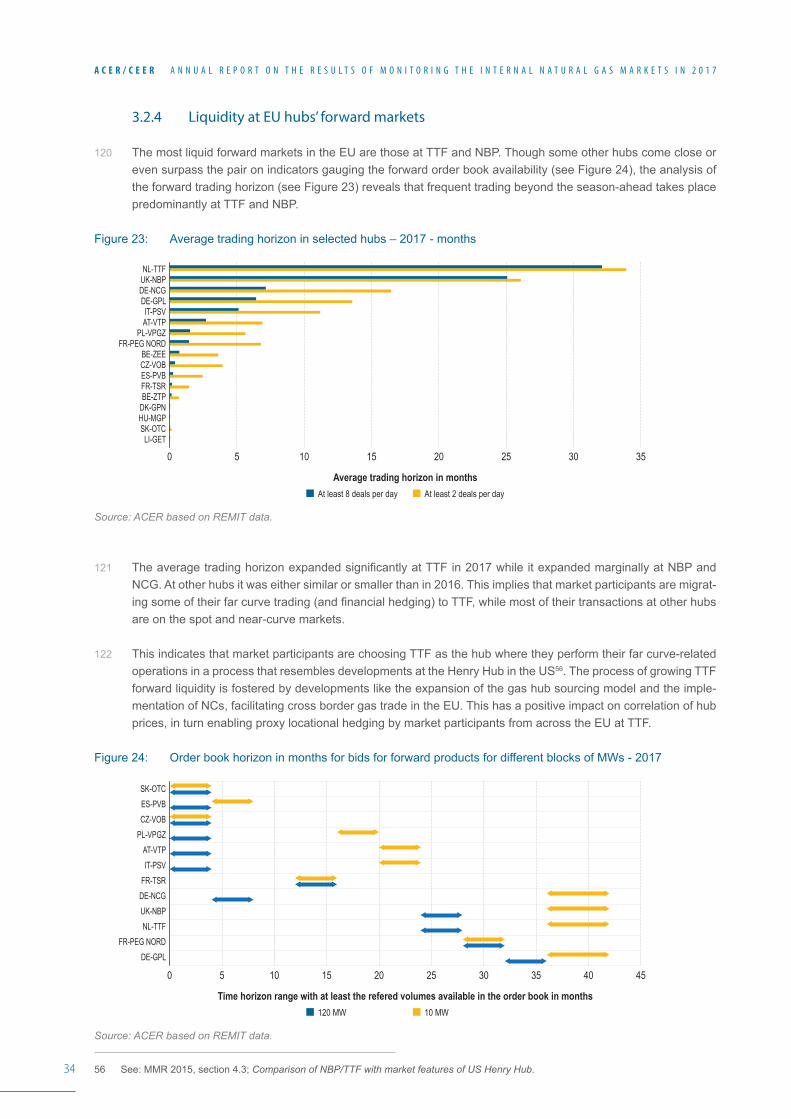
34
A C E R / C E E R A N N U A L R E P O R T O N T H E R E S U L T S O F M O N I T O R I N G T H E I N T E R N A L N A T U R A L G A S M A R K E T S I N 2 0 1 7
3.2.4 Liquidity at EU hubs’ forward markets
120 The most liquid forward markets in the EU are those at TTF and NBP. Though some other hubs come close or even surpass the pair on indicators gauging the forward order book availability (see Figure 24), the analysis of the forward trading horizon (see Figure 23) reveals that frequent trading beyond the season-ahead takes place predominantly at TTF and NBP.
Figure 23: Average trading horizon in selected hubs – 2017 - months
Source: ACER based on REMIT data.
121 The average trading horizon expanded significantly at TTF in 2017 while it expanded marginally at NBP and NCG. At other hubs it was either similar or smaller than in 2016. This implies that market participants are migrat-ing some of their far curve trading (and financial hedging) to TTF, while most of their transactions at other hubs are on the spot and near-curve markets.
122 This indicates that market participants are choosing TTF as the hub where they perform their far curve-related operations in a process that resembles developments at the Henry Hub in the US56. The process of growing TTF forward liquidity is fostered by developments like the expansion of the gas hub sourcing model and the imple-mentation of NCs, facilitating cross border gas trade in the EU. This has a positive impact on correlation of hub prices, in turn enabling proxy locational hedging by market participants from across the EU at TTF.
Figure 24: Order book horizon in months for bids for forward products for different blocks of MWs - 2017
Source: ACER based on REMIT data.
56 See: MMR 2015, section 4.3; Comparison of NBP/TTF with market features of US Henry Hub.
Average trading horizon in months
0 5 10 15 20 25 3530
NL-TTFUK-NBPDE-NCGDE-GPLIT-PSVAT-VTP
PL-VPGZFR-PEG NORD
BE-ZEECZ-VOBES-PVBFR-TSRBE-ZTP
DK-GPNHU-MGPSK-OTC
LI-GET
At least 8 deals per day At least 2 deals per day
Time horizon range with at least the refered volumes available in the order book in months
0 5 10 15 20 25 45403530
SK-OTCES-PVBCZ-VOB
PL-VPGZAT-VTPIT-PSV
FR-TSRDE-NCGUK-NBPNL-TTF
FR-PEG NORDDE-GPL
120 MW 10 MW
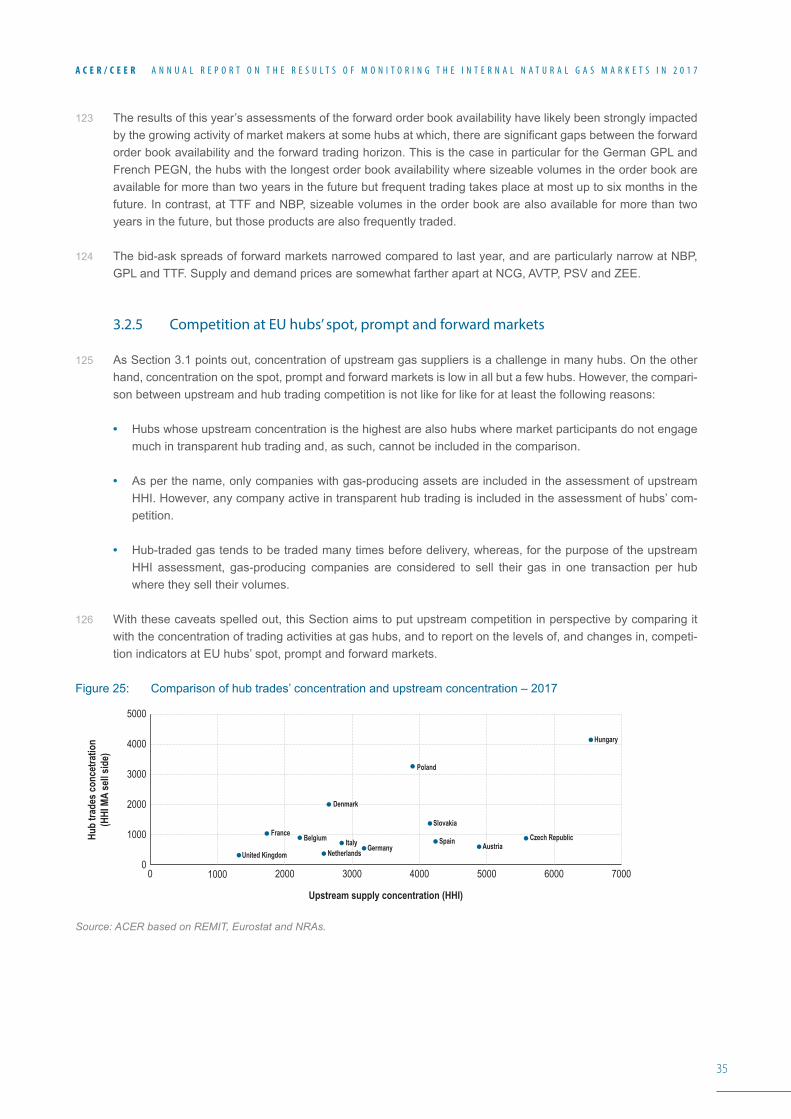
35
A C E R / C E E R A N N U A L R E P O R T O N T H E R E S U L T S O F M O N I T O R I N G T H E I N T E R N A L N A T U R A L G A S M A R K E T S I N 2 0 1 7
123 The results of this year’s assessments of the forward order book availability have likely been strongly impacted by the growing activity of market makers at some hubs at which, there are significant gaps between the forward order book availability and the forward trading horizon. This is the case in particular for the German GPL and French PEGN, the hubs with the longest order book availability where sizeable volumes in the order book are available for more than two years in the future but frequent trading takes place at most up to six months in the future. In contrast, at TTF and NBP, sizeable volumes in the order book are also available for more than two years in the future, but those products are also frequently traded.
124 The bid-ask spreads of forward markets narrowed compared to last year, and are particularly narrow at NBP, GPL and TTF. Supply and demand prices are somewhat farther apart at NCG, AVTP, PSV and ZEE.
3.2.5 Competition at EU hubs’ spot, prompt and forward markets
125 As Section 3.1 points out, concentration of upstream gas suppliers is a challenge in many hubs. On the other hand, concentration on the spot, prompt and forward markets is low in all but a few hubs. However, the compari-son between upstream and hub trading competition is not like for like for at least the following reasons:
• Hubs whose upstream concentration is the highest are also hubs where market participants do not engage much in transparent hub trading and, as such, cannot be included in the comparison.
• As per the name, only companies with gas-producing assets are included in the assessment of upstream HHI. However, any company active in transparent hub trading is included in the assessment of hubs’ com-petition.
• Hub-traded gas tends to be traded many times before delivery, whereas, for the purpose of the upstream HHI assessment, gas-producing companies are considered to sell their gas in one transaction per hub where they sell their volumes.
126 With these caveats spelled out, this Section aims to put upstream competition in perspective by comparing it with the concentration of trading activities at gas hubs, and to report on the levels of, and changes in, competi-tion indicators at EU hubs’ spot, prompt and forward markets.
Figure 25: Comparison of hub trades’ concentration and upstream concentration – 2017
Source: ACER based on REMIT, Eurostat and NRAs.
Hub
trade
s con
cetra
tion
(HHI
MA
sell s
ide)
Upstream supply concentration (HHI)
5000
1000
2000
3000
4000
00 2000 30001000 4000 5000 6000 7000
AustriaBelgium Czech Republic
Denmark
France
Germany
Hungary
ItalyNetherlands
Poland
Slovakia
SpainUnited Kingdom
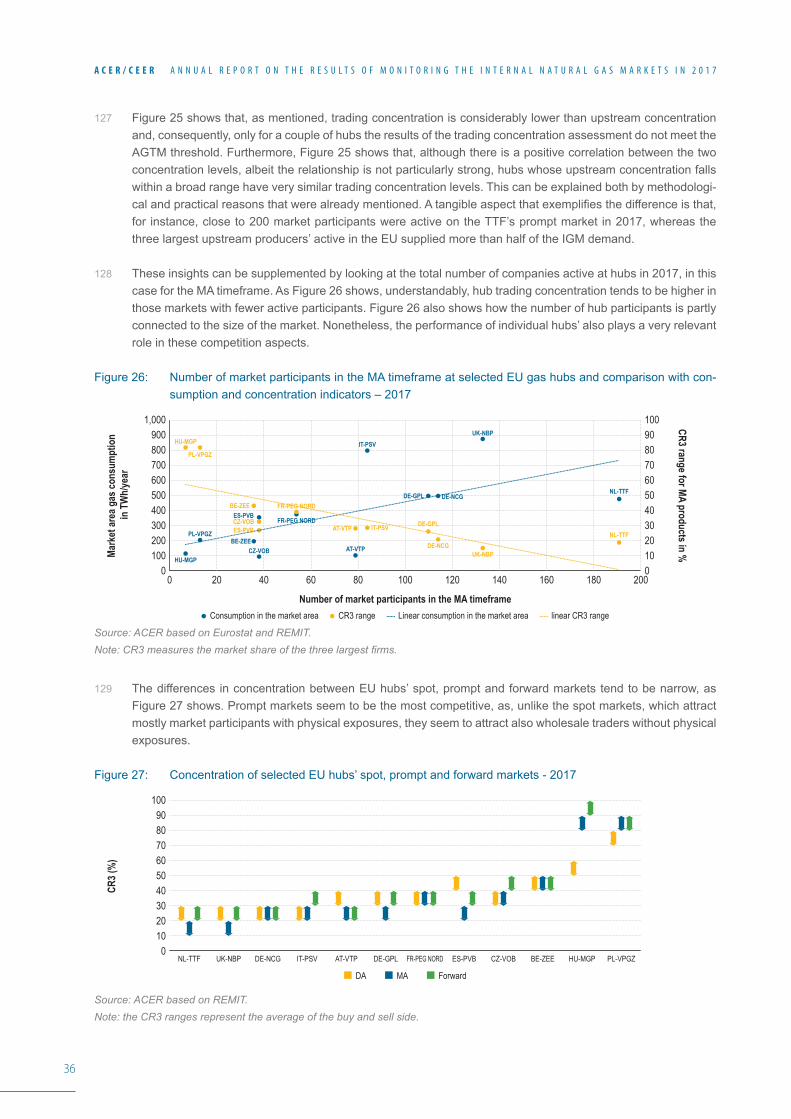
36
A C E R / C E E R A N N U A L R E P O R T O N T H E R E S U L T S O F M O N I T O R I N G T H E I N T E R N A L N A T U R A L G A S M A R K E T S I N 2 0 1 7
127 Figure 25 shows that, as mentioned, trading concentration is considerably lower than upstream concentration and, consequently, only for a couple of hubs the results of the trading concentration assessment do not meet the AGTM threshold. Furthermore, Figure 25 shows that, although there is a positive correlation between the two concentration levels, albeit the relationship is not particularly strong, hubs whose upstream concentration falls within a broad range have very similar trading concentration levels. This can be explained both by methodologi-cal and practical reasons that were already mentioned. A tangible aspect that exemplifies the difference is that, for instance, close to 200 market participants were active on the TTF’s prompt market in 2017, whereas the three largest upstream producers’ active in the EU supplied more than half of the IGM demand.
128 These insights can be supplemented by looking at the total number of companies active at hubs in 2017, in this case for the MA timeframe. As Figure 26 shows, understandably, hub trading concentration tends to be higher in those markets with fewer active participants. Figure 26 also shows how the number of hub participants is partly connected to the size of the market. Nonetheless, the performance of individual hubs’ also plays a very relevant role in these competition aspects.
Figure 26: Number of market participants in the MA timeframe at selected EU gas hubs and comparison with con-sumption and concentration indicators – 2017
Source: ACER based on Eurostat and REMIT. Note: CR3 measures the market share of the three largest firms.
129 The differences in concentration between EU hubs’ spot, prompt and forward markets tend to be narrow, as Figure 27 shows. Prompt markets seem to be the most competitive, as, unlike the spot markets, which attract mostly market participants with physical exposures, they seem to attract also wholesale traders without physical exposures.
Figure 27: Concentration of selected EU hubs’ spot, prompt and forward markets - 2017
Source: ACER based on REMIT.Note: the CR3 ranges represent the average of the buy and sell side.
Mark
et ar
ea g
as co
nsum
ptio
n in
TW
h/ye
ar
Number of market participants in the MA timeframe
CR3 range for MA products in %
1,000
100200300400500600700
900800
00 20 40 60 80 100 120 140 160 180 200
100
10203040506070
9080
0HU-MGP
HU-MGP
PL-VPGZ
PL-VPGZ
ES-PVB
ES-PVBBE-ZEE
BE-ZEE
FR-PEG NORD
FR-PEG NORD
AT-VTP
AT-VTP
CZ-VOB
CZ-VOB
IT-PSV
IT-PSV
DE-GPL
DE-GPL
UK-NBP
UK-NBP
NL-TTF
NL-TTF
DE-NCG
DE-NCG
Consumption in the market area CR3 range linear CR3 rangeLinear consumption in the market area
DA MA Forward
CR3 (
%)
100
80
60
20
90
40
70
50
30
100
UK-NBPNL-TTF DE-GPLIT-PSV AT-VTP HU-MGPDE-NCG FR-PEG NORD ES-PVB PL-VPGZBE-ZEECZ-VOB
37
A C E R / C E E R A N N U A L R E P O R T O N T H E R E S U L T S O F M O N I T O R I N G T H E I N T E R N A L N A T U R A L G A S M A R K E T S I N 2 0 1 7
130 Spot market concentration is relatively low at most EU gas hubs, with the exception of the Polish hub, where the assessed HHI was almost twice that of the next most concentrated hub, the Baltic hub. Concentration was the lowest at TTF, GPL, NBP and NCG, although the HHI was somewhat worse at GPL and NBP compared to the previous year. Hubs where there was growing hub spot market competition were PVB, MGP, GPN and PSV. Spot market competition notably weakened, particularly on the sell side, at the Polish hub, ZEE, PEGN and TRS.
131 Competition on prompt markets improved on average in 2017 compared to the previous year. In fact, the prompt markets’ concentration was noticeably higher compared to 2016 only on the Polish hubs. Concentration at the Hungarian MGP was the highest of the assessed hubs, but competition seems to have improved the most com-pared to the previous year. Competition also improved at PSV, PVB, VOB and NCG.
132 Forward markets’ competition could be an issue at the Hungarian and Polish hubs, where the CR3 was as-sessed at close or above 90%, which is considerably higher than at other hubs, although the situation at MGP improved compared to last year, while it deteriorated at the Polish hub. Concentration in 2017 was the lowest at TTF and NBP, followed by NCG, where there was a noticeable improvement compared to the previous year. Competition also improved on the forward markets of PSV, PVB and ZTP.
38
A C E R / C E E R A N N U A L R E P O R T O N T H E R E S U L T S O F M O N I T O R I N G T H E I N T E R N A L N A T U R A L G A S M A R K E T S I N 2 0 1 7
3.3 Gas hub categorisation
133 Figure 1 in the Executive Summary presents a classification of gas hubs. The groupings reflect the results of the many metrics discussed in this Chapter. The classification in itself is the same as in last year’s MMR. This year there is no evidence that warrants moving hubs into a higher or lower category.
134 The values of the metrics that measure the performance of hubs and which are analysed in this Chapter warrant TTF and NBP to be placed into a separate group called established hubs. The breadth and depth of these gas hubs, on forward markets, for example, is such that they are ahead of any other European hub. On top of this, TTF is well on its way to outpacing NBP. However, both TTF and NBP are still some distance from the most developed gas hub in the world, i.e. Henry Hub (for example, on churn rate), let alone the level of sophistication of oil hubs.
135 Several hubs in the advanced category are slowly getting closer to TTF and NBP, particularly for the orders’ re-lated metrics. All these markets note larger order book availability in 2017 compared to the previous year, driven by a wider availability of orders. The situation does not only characterise the spot market, but, to some degree, also the forward market. More prominent activity by market makers at the exchanges seems to be contributing to this trend. The role of market makers also explains the higher levels of concentration of orders in these hubs57. However, the higher availability of orders does not match a parallel increase in the number of concluded trades, which are still at a lower level compared to TTF and NBP. The actual conclusion of a larger number of forward trades is the main aspect differentiating established from advanced hub categories.
136 On the other end of spectrum, most of the emerging and incipient hubs have improved their results with respect to the previous year, especially the Spanish and Baltics gas hubs. Hubs are increasingly perceived as alterna-tives to traditional sourcing via LTCs. Nonetheless, these advances need to be put into context, as the gap with the more advanced hub is still wide.
137 The analysis of liquidity of gas hubs is chiefly based on data reported under REMIT. However, the relevant metrics could not be calculated for market areas where gas is not traded on transparent trading venues, but only bilaterally. This indicates that further steps towards implementing transparent gas trading are still needed in some MSs. However, this does not necessarily mean that some form of market is not developing. For exam-ple, Romania, Slovenia or Ireland AGTM metrics could not be processed, but there is evidence of increasing transactional activity on ad-hoc platforms, usually dedicated to balancing. These could be embryonic for further trading activity.
138 The AGTM recommends market integration as a way of addressing the weak performance of individual mar-kets58. A number of market integration initiatives are already on the table, irrespective of the AGTM results and timetable, with the BeLux initiative already implemented. In terms of milestones, it is worth mentioning the in-clusion of the Estonian and Latvian markets in the Lithuanian GET Baltic exchange, which could also embrace Finland in the future. The Portuguese market is also in the process of being integrated into the Spanish Mibgas platform. The two German hubs will merge, as well as the two French ones.
57 For example, the Pegas exchange has five market makers for the AVTP DA product. The market makers have the mandate to place orders of at least 100MW each, which explains the order availability result of around 800MW. The concentration of placed orders somehow mirrors these results. See: http://cegh.at/market-maker.
58 The Agency is of the opinion that the number of hubs and their location is a market decision.
39
A C E R / C E E R A N N U A L R E P O R T O N T H E R E S U L T S O F M O N I T O R I N G T H E I N T E R N A L N A T U R A L G A S M A R K E T S I N 2 0 1 7
4. Impact of Network Codes on market functioning139 The aim of the NCs is to promote the integration of EU gas wholesale markets. The ambition of this Chapter is
to better understand the impact of the NCs on the market integration process. However, quantifying the specific market effects brought by the implementation of the NCs and separating the latter from the impact of broader market fundamentals is not easy. In addition, the implementation process is still ongoing in some MSs.
140 Gas sector stakeholders acknowledge that, on the one hand, the increased level of transparency and harmoni-sation that NCs provide favours more coordinated system operations, while on the other hand, the pro-market NCs provisions foster competition and market integration. The enactment of standardised, transparent and market-driven provisions for capacity acquisition, congestion management and portfolios balancing contributes to the removal of market barriers, hence facilitating competition across European markets, among other things via the entry of new participants59.
4.1 Gas hub price metrics
4.1.1 Price convergence and price correlation among EU gas hubs
141 This Chapter starts by reviewing hub price dynamics at selected EU hubs over the last three years. In fact, the level of price convergence and of price correlation among markets helps to reveal their true level of integration. Unfortunately, this exercise can still not be done for all markets, as a number of them still lack a hub reference price for all (or most) trading days60. This Section focuses on the reasons behind differences in price integration levels. In doing so, it looks for evidence that could be attributed to the implementation of gas NCs.
142 Figure 28 shows the evolution of price convergence, which is defined here as the percentage of days when price spreads were within defined bands, and price correlation61 for a number of hub pairs across the NWE, the CEE and the Baltic regions.
59 This positioning is substantiated inter alia in the Kantor study on market access barriers carried out in MMR 2016. See:https://www.acer.europa.eu/en/Electricity/Market%20monitoring/Documents_Public/Kantor_report_on%20barriers%20to%20gas%20wholesale%20trading.pdf.
60 Finland, Sweden, Ireland, Portugal, Romania, Bulgaria, Greece, Slovenia and Croatia.
61 Correlation measures the relationship between two hubs’ price changes over time. Correlation is calculated using the Pearson product-moment coefficient. i.e. the covariance of the two distinct hub prices divided by the product of their standard deviations.
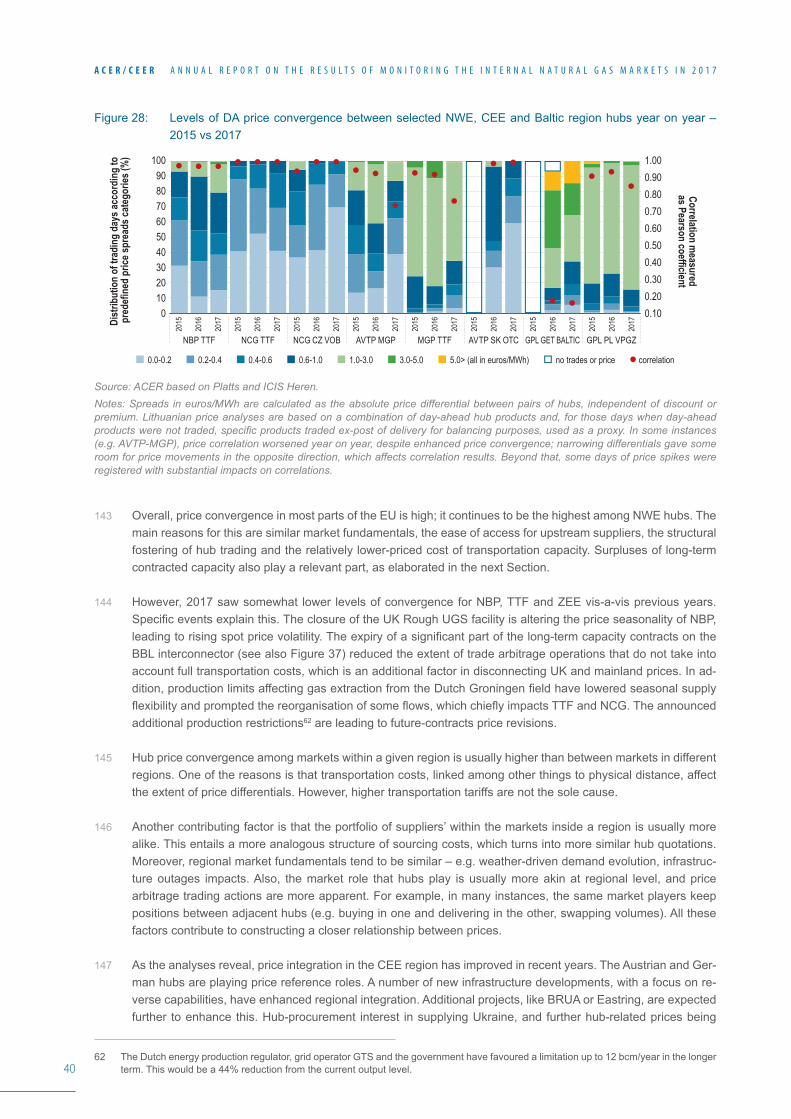
40
A C E R / C E E R A N N U A L R E P O R T O N T H E R E S U L T S O F M O N I T O R I N G T H E I N T E R N A L N A T U R A L G A S M A R K E T S I N 2 0 1 7
Figure 28: Levels of DA price convergence between selected NWE, CEE and Baltic region hubs year on year – 2015 vs 2017
Source: ACER based on Platts and ICIS Heren. Notes: Spreads in euros/MWh are calculated as the absolute price differential between pairs of hubs, independent of discount or premium. Lithuanian price analyses are based on a combination of day-ahead hub products and, for those days when day-ahead products were not traded, specific products traded ex-post of delivery for balancing purposes, used as a proxy. In some instances (e.g. AVTP-MGP), price correlation worsened year on year, despite enhanced price convergence; narrowing differentials gave some room for price movements in the opposite direction, which affects correlation results. Beyond that, some days of price spikes were registered with substantial impacts on correlations.
143 Overall, price convergence in most parts of the EU is high; it continues to be the highest among NWE hubs. The main reasons for this are similar market fundamentals, the ease of access for upstream suppliers, the structural fostering of hub trading and the relatively lower-priced cost of transportation capacity. Surpluses of long-term contracted capacity also play a relevant part, as elaborated in the next Section.
144 However, 2017 saw somewhat lower levels of convergence for NBP, TTF and ZEE vis-a-vis previous years. Specific events explain this. The closure of the UK Rough UGS facility is altering the price seasonality of NBP, leading to rising spot price volatility. The expiry of a significant part of the long-term capacity contracts on the BBL interconnector (see also Figure 37) reduced the extent of trade arbitrage operations that do not take into account full transportation costs, which is an additional factor in disconnecting UK and mainland prices. In ad-dition, production limits affecting gas extraction from the Dutch Groningen field have lowered seasonal supply flexibility and prompted the reorganisation of some flows, which chiefly impacts TTF and NCG. The announced additional production restrictions62 are leading to future-contracts price revisions.
145 Hub price convergence among markets within a given region is usually higher than between markets in different regions. One of the reasons is that transportation costs, linked among other things to physical distance, affect the extent of price differentials. However, higher transportation tariffs are not the sole cause.
146 Another contributing factor is that the portfolio of suppliers’ within the markets inside a region is usually more alike. This entails a more analogous structure of sourcing costs, which turns into more similar hub quotations. Moreover, regional market fundamentals tend to be similar – e.g. weather-driven demand evolution, infrastruc-ture outages impacts. Also, the market role that hubs play is usually more akin at regional level, and price arbitrage trading actions are more apparent. For example, in many instances, the same market players keep positions between adjacent hubs (e.g. buying in one and delivering in the other, swapping volumes). All these factors contribute to constructing a closer relationship between prices.
147 As the analyses reveal, price integration in the CEE region has improved in recent years. The Austrian and Ger-man hubs are playing price reference roles. A number of new infrastructure developments, with a focus on re-verse capabilities, have enhanced regional integration. Additional projects, like BRUA or Eastring, are expected further to enhance this. Hub-procurement interest in supplying Ukraine, and further hub-related prices being
62 The Dutch energy production regulator, grid operator GTS and the government have favoured a limitation up to 12 bcm/year in the longer term. This would be a 44% reduction from the current output level.
Dist
ribut
ion
of tr
adin
g da
ys ac
cord
ing
to p
rede
fined
pric
e spr
eads
cate
gorie
s (%
)
Correlation measured
as Pearson coefficient
2015
2016
2017
2015
2016
2017
2015
2016
2017
2015
2016
2017
2015
2016
2017
2015
2016
2017
2015
2016
2017
2015
2016
2017
100
708090
40
6050
302010
0
1.00
0.700.800.90
0.40
0.600.50
0.300.200.10
0.0-0.2 0.2-0.4 0.4-0.6 0.6-1.0 1.0-3.0 3.0-5.0 5.0> (all in euros/MWh) no trades or price correlation
NBP TTF NCG TTF NCG CZ VOB AVTP MGP MGP TTF AVTP SK OTC GPL GET BALTIC GPL PL VPGZ
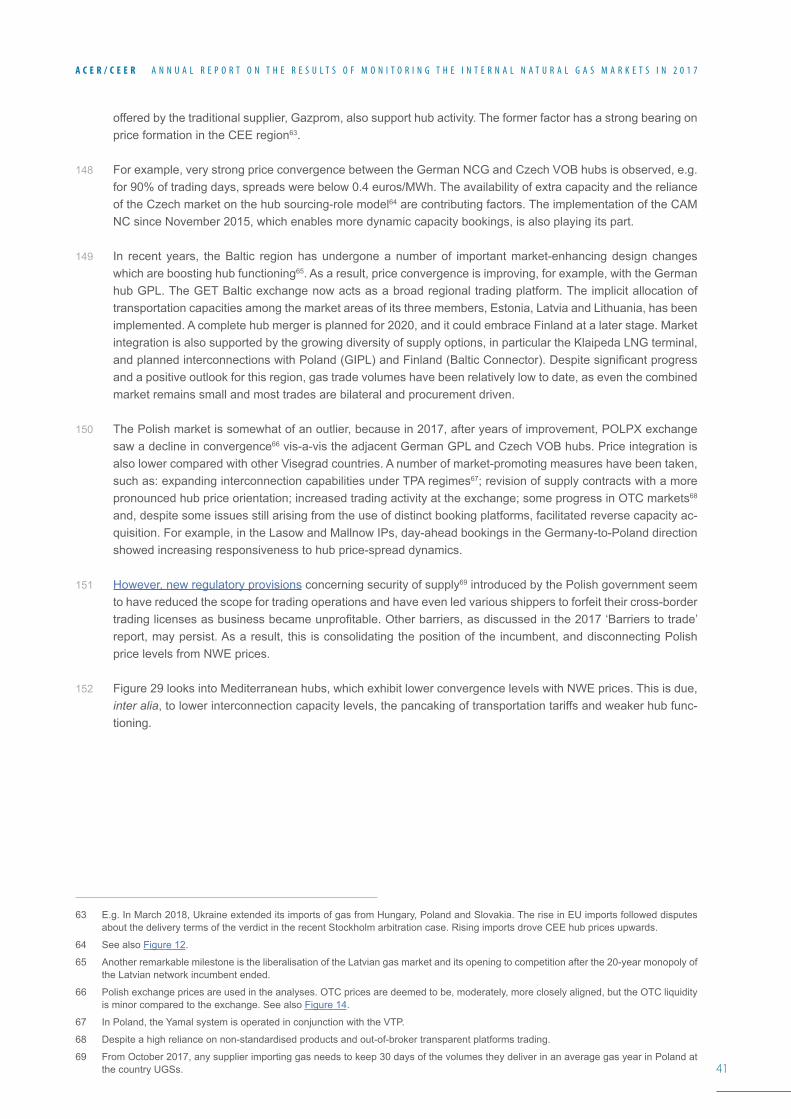
41
A C E R / C E E R A N N U A L R E P O R T O N T H E R E S U L T S O F M O N I T O R I N G T H E I N T E R N A L N A T U R A L G A S M A R K E T S I N 2 0 1 7
offered by the traditional supplier, Gazprom, also support hub activity. The former factor has a strong bearing on price formation in the CEE region63.
148 For example, very strong price convergence between the German NCG and Czech VOB hubs is observed, e.g. for 90% of trading days, spreads were below 0.4 euros/MWh. The availability of extra capacity and the reliance of the Czech market on the hub sourcing-role model64 are contributing factors. The implementation of the CAM NC since November 2015, which enables more dynamic capacity bookings, is also playing its part.
149 In recent years, the Baltic region has undergone a number of important market-enhancing design changes which are boosting hub functioning65. As a result, price convergence is improving, for example, with the German hub GPL. The GET Baltic exchange now acts as a broad regional trading platform. The implicit allocation of transportation capacities among the market areas of its three members, Estonia, Latvia and Lithuania, has been implemented. A complete hub merger is planned for 2020, and it could embrace Finland at a later stage. Market integration is also supported by the growing diversity of supply options, in particular the Klaipeda LNG terminal, and planned interconnections with Poland (GIPL) and Finland (Baltic Connector). Despite significant progress and a positive outlook for this region, gas trade volumes have been relatively low to date, as even the combined market remains small and most trades are bilateral and procurement driven.
150 The Polish market is somewhat of an outlier, because in 2017, after years of improvement, POLPX exchange saw a decline in convergence66 vis-a-vis the adjacent German GPL and Czech VOB hubs. Price integration is also lower compared with other Visegrad countries. A number of market-promoting measures have been taken, such as: expanding interconnection capabilities under TPA regimes67; revision of supply contracts with a more pronounced hub price orientation; increased trading activity at the exchange; some progress in OTC markets68 and, despite some issues still arising from the use of distinct booking platforms, facilitated reverse capacity ac-quisition. For example, in the Lasow and Mallnow IPs, day-ahead bookings in the Germany-to-Poland direction showed increasing responsiveness to hub price-spread dynamics.
151 However, new regulatory provisions concerning security of supply69 introduced by the Polish government seem to have reduced the scope for trading operations and have even led various shippers to forfeit their cross-border trading licenses as business became unprofitable. Other barriers, as discussed in the 2017 ‘Barriers to trade’ report, may persist. As a result, this is consolidating the position of the incumbent, and disconnecting Polish price levels from NWE prices.
152 Figure 29 looks into Mediterranean hubs, which exhibit lower convergence levels with NWE prices. This is due, inter alia, to lower interconnection capacity levels, the pancaking of transportation tariffs and weaker hub func-tioning.
63 E.g. In March 2018, Ukraine extended its imports of gas from Hungary, Poland and Slovakia. The rise in EU imports followed disputes about the delivery terms of the verdict in the recent Stockholm arbitration case. Rising imports drove CEE hub prices upwards.
64 See also Figure 12.
65 Another remarkable milestone is the liberalisation of the Latvian gas market and its opening to competition after the 20-year monopoly of the Latvian network incumbent ended.
66 Polish exchange prices are used in the analyses. OTC prices are deemed to be, moderately, more closely aligned, but the OTC liquidity is minor compared to the exchange. See also Figure 14.
67 In Poland, the Yamal system is operated in conjunction with the VTP.
68 Despite a high reliance on non-standardised products and out-of-broker transparent platforms trading.
69 From October 2017, any supplier importing gas needs to keep 30 days of the volumes they deliver in an average gas year in Poland at the country UGSs.
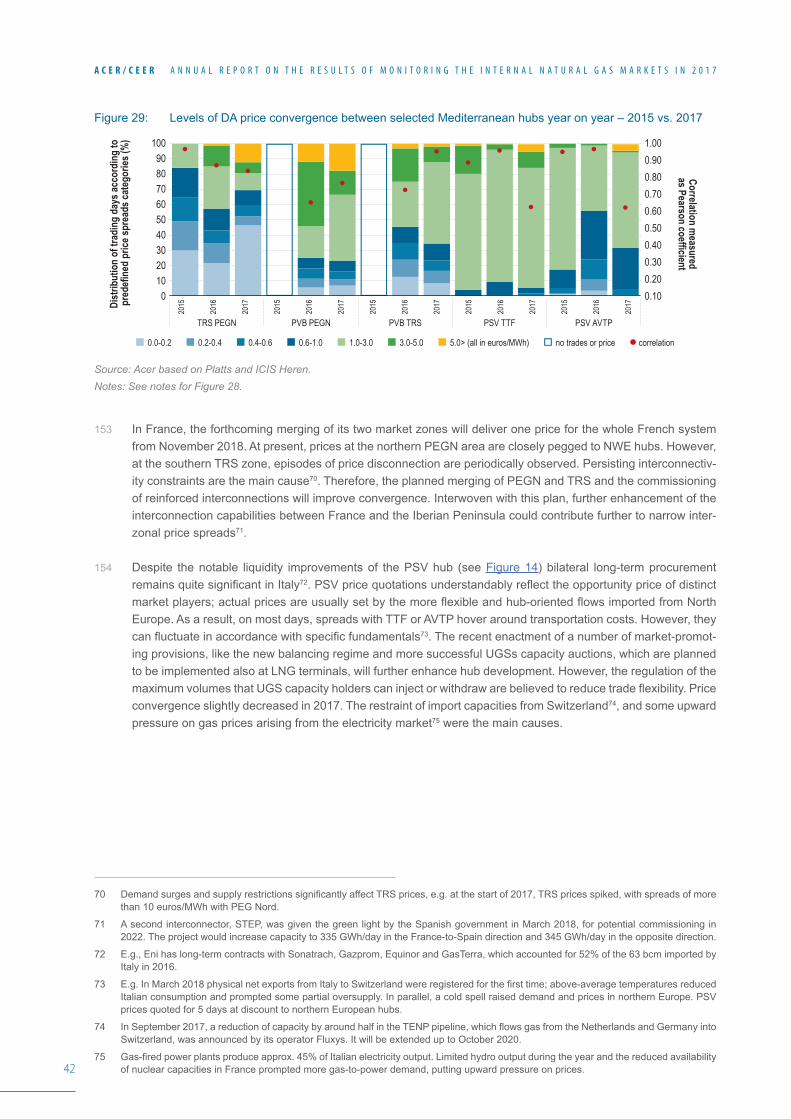
42
A C E R / C E E R A N N U A L R E P O R T O N T H E R E S U L T S O F M O N I T O R I N G T H E I N T E R N A L N A T U R A L G A S M A R K E T S I N 2 0 1 7
Figure 29: Levels of DA price convergence between selected Mediterranean hubs year on year – 2015 vs. 2017
Source: Acer based on Platts and ICIS Heren. Notes: See notes for Figure 28.
153 In France, the forthcoming merging of its two market zones will deliver one price for the whole French system from November 2018. At present, prices at the northern PEGN area are closely pegged to NWE hubs. However, at the southern TRS zone, episodes of price disconnection are periodically observed. Persisting interconnectiv-ity constraints are the main cause70. Therefore, the planned merging of PEGN and TRS and the commissioning of reinforced interconnections will improve convergence. Interwoven with this plan, further enhancement of the interconnection capabilities between France and the Iberian Peninsula could contribute further to narrow inter-zonal price spreads71.
154 Despite the notable liquidity improvements of the PSV hub (see Figure 14) bilateral long-term procurement remains quite significant in Italy72. PSV price quotations understandably reflect the opportunity price of distinct market players; actual prices are usually set by the more flexible and hub-oriented flows imported from North Europe. As a result, on most days, spreads with TTF or AVTP hover around transportation costs. However, they can fluctuate in accordance with specific fundamentals73. The recent enactment of a number of market-promot-ing provisions, like the new balancing regime and more successful UGSs capacity auctions, which are planned to be implemented also at LNG terminals, will further enhance hub development. However, the regulation of the maximum volumes that UGS capacity holders can inject or withdraw are believed to reduce trade flexibility. Price convergence slightly decreased in 2017. The restraint of import capacities from Switzerland74, and some upward pressure on gas prices arising from the electricity market75 were the main causes.
70 Demand surges and supply restrictions significantly affect TRS prices, e.g. at the start of 2017, TRS prices spiked, with spreads of more than 10 euros/MWh with PEG Nord.
71 A second interconnector, STEP, was given the green light by the Spanish government in March 2018, for potential commissioning in 2022. The project would increase capacity to 335 GWh/day in the France-to-Spain direction and 345 GWh/day in the opposite direction.
72 E.g., Eni has long-term contracts with Sonatrach, Gazprom, Equinor and GasTerra, which accounted for 52% of the 63 bcm imported by Italy in 2016.
73 E.g. In March 2018 physical net exports from Italy to Switzerland were registered for the first time; above-average temperatures reduced Italian consumption and prompted some partial oversupply. In parallel, a cold spell raised demand and prices in northern Europe. PSV prices quoted for 5 days at discount to northern European hubs.
74 In September 2017, a reduction of capacity by around half in the TENP pipeline, which flows gas from the Netherlands and Germany into Switzerland, was announced by its operator Fluxys. It will be extended up to October 2020.
75 Gas-fired power plants produce approx. 45% of Italian electricity output. Limited hydro output during the year and the reduced availability of nuclear capacities in France prompted more gas-to-power demand, putting upward pressure on prices.
Dist
ribut
ion
of tr
adin
g da
ys ac
cord
ing
to p
rede
fined
pric
e spr
eads
cate
gorie
s (%
)
Correlation measured
as Pearson coefficient
2015
2016
2017
2015
2016
2017
2015
2016
2017
2015
2016
2017
2015
2016
2017
100
708090
40
6050
302010
0
1.00
0.700.800.90
0.40
0.600.50
0.300.200.10
0.0-0.2 0.2-0.4 0.4-0.6 0.6-1.0 1.0-3.0 3.0-5.0 5.0> (all in euros/MWh) no trades or price correlation
TRS PEGN PVB PEGN PVB TRS PSV TTF PSV AVTP
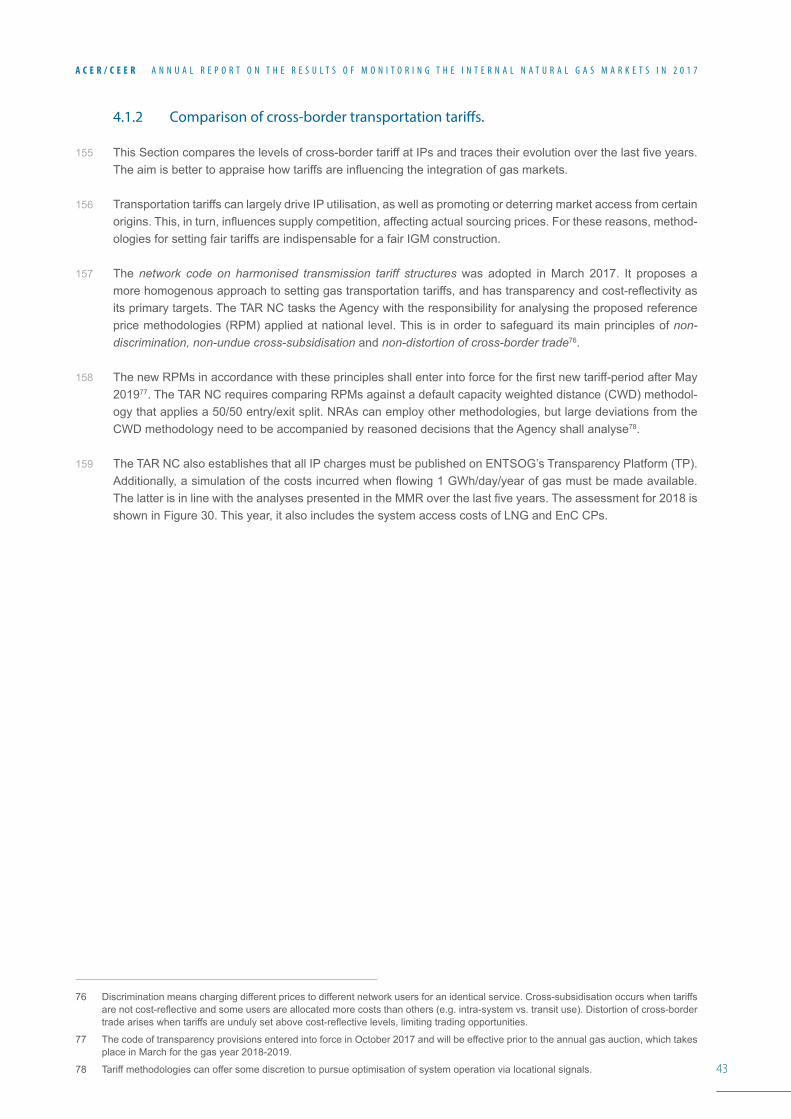
43
A C E R / C E E R A N N U A L R E P O R T O N T H E R E S U L T S O F M O N I T O R I N G T H E I N T E R N A L N A T U R A L G A S M A R K E T S I N 2 0 1 7
4.1.2 Comparison of cross-border transportation tariffs.
155 This Section compares the levels of cross-border tariff at IPs and traces their evolution over the last five years. The aim is better to appraise how tariffs are influencing the integration of gas markets.
156 Transportation tariffs can largely drive IP utilisation, as well as promoting or deterring market access from certain origins. This, in turn, influences supply competition, affecting actual sourcing prices. For these reasons, method-ologies for setting fair tariffs are indispensable for a fair IGM construction.
157 The network code on harmonised transmission tariff structures was adopted in March 2017. It proposes a more homogenous approach to setting gas transportation tariffs, and has transparency and cost-reflectivity as its primary targets. The TAR NC tasks the Agency with the responsibility for analysing the proposed reference price methodologies (RPM) applied at national level. This is in order to safeguard its main principles of non-discrimination, non-undue cross-subsidisation and non-distortion of cross-border trade76.
158 The new RPMs in accordance with these principles shall enter into force for the first new tariff-period after May 201977. The TAR NC requires comparing RPMs against a default capacity weighted distance (CWD) methodol-ogy that applies a 50/50 entry/exit split. NRAs can employ other methodologies, but large deviations from the CWD methodology need to be accompanied by reasoned decisions that the Agency shall analyse78.
159 The TAR NC also establishes that all IP charges must be published on ENTSOG’s Transparency Platform (TP). Additionally, a simulation of the costs incurred when flowing 1 GWh/day/year of gas must be made available. The latter is in line with the analyses presented in the MMR over the last five years. The assessment for 2018 is shown in Figure 30. This year, it also includes the system access costs of LNG and EnC CPs.
76 Discrimination means charging different prices to different network users for an identical service. Cross-subsidisation occurs when tariffs are not cost-reflective and some users are allocated more costs than others (e.g. intra-system vs. transit use). Distortion of cross-border trade arises when tariffs are unduly set above cost-reflective levels, limiting trading opportunities.
77 The code of transparency provisions entered into force in October 2017 and will be effective prior to the annual gas auction, which takes place in March for the gas year 2018-2019.
78 Tariff methodologies can offer some discretion to pursue optimisation of system operation via locational signals.
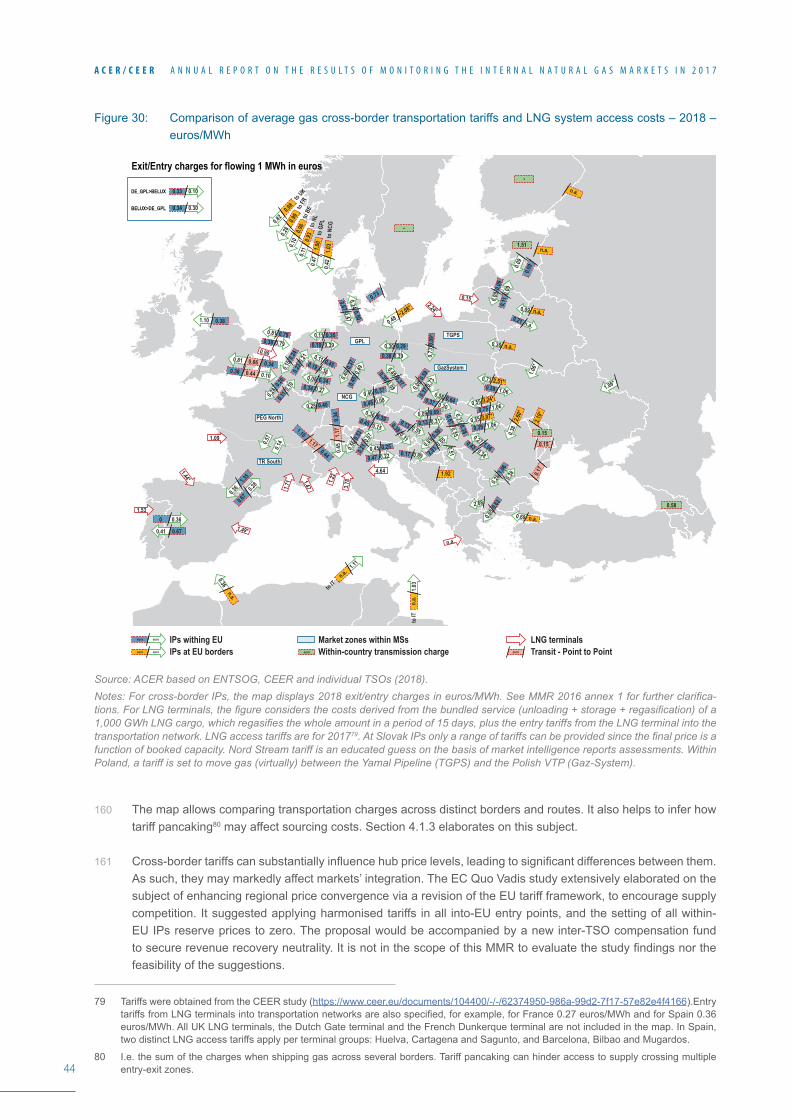
44
A C E R / C E E R A N N U A L R E P O R T O N T H E R E S U L T S O F M O N I T O R I N G T H E I N T E R N A L N A T U R A L G A S M A R K E T S I N 2 0 1 7
Figure 30: Comparison of average gas cross-border transportation tariffs and LNG system access costs – 2018 – euros/MWh
Source: ACER based on ENTSOG, CEER and individual TSOs (2018).Notes: For cross-border IPs, the map displays 2018 exit/entry charges in euros/MWh. See MMR 2016 annex 1 for further clarifica-tions. For LNG terminals, the figure considers the costs derived from the bundled service (unloading + storage + regasification) of a 1,000 GWh LNG cargo, which regasifies the whole amount in a period of 15 days, plus the entry tariffs from the LNG terminal into the transportation network. LNG access tariffs are for 201779. At Slovak IPs only a range of tariffs can be provided since the final price is a function of booked capacity. Nord Stream tariff is an educated guess on the basis of market intelligence reports assessments. Within Poland, a tariff is set to move gas (virtually) between the Yamal Pipeline (TGPS) and the Polish VTP (Gaz-System).
160 The map allows comparing transportation charges across distinct borders and routes. It also helps to infer how tariff pancaking80 may affect sourcing costs. Section 4.1.3 elaborates on this subject.
161 Cross-border tariffs can substantially influence hub price levels, leading to significant differences between them. As such, they may markedly affect markets’ integration. The EC Quo Vadis study extensively elaborated on the subject of enhancing regional price convergence via a revision of the EU tariff framework, to encourage supply competition. It suggested applying harmonised tariffs in all into-EU entry points, and the setting of all within-EU IPs reserve prices to zero. The proposal would be accompanied by a new inter-TSO compensation fund to secure revenue recovery neutrality. It is not in the scope of this MMR to evaluate the study findings nor the feasibility of the suggestions.
79 Tariffs were obtained from the CEER study (https://www.ceer.eu/documents/104400/-/-/62374950-986a-99d2-7f17-57e82e4f4166).Entry tariffs from LNG terminals into transportation networks are also specified, for example, for France 0.27 euros/MWh and for Spain 0.36 euros/MWh. All UK LNG terminals, the Dutch Gate terminal and the French Dunkerque terminal are not included in the map. In Spain, two distinct LNG access tariffs apply per terminal groups: Huelva, Cartagena and Sagunto, and Barcelona, Bilbao and Mugardos.
80 I.e. the sum of the charges when shipping gas across several borders. Tariff pancaking can hinder access to supply crossing multiple entry-exit zones.
IPs withing EUIPs at EU borders
Market zones within MSsWithin-country transmission charge Transit - Point to Point
LNG terminals
DE_GPL>BELUX
BELUX>DE_GPL
Exit/Entry charges for flowing 1 MWh in euros
0.42
1.03
to N
CG
0.47
1.00
to G
PL
0.11
0.93
to N
L
0.10
0.98
to BE
0.28
0.99
to FR
0.82
0.98
to UK
0.36n.a.
0.48 ~2.08*
n.a.
n.a.
0.38
2.60*
2.19*
1.92
1.10 0.38
1.11
n.a.
to IT
1.03
n.a.
to IT
euroeuro
0.57
0.14
0.09
1.06*
1.06*
0.09
0.73
0.36
1.35
0.28
0.67
0.41 0.67
0.360
0.45 0.250.220.47
0.89 0.3
9
0.55
2.81 0.51
0.09 0.690.31*0.13
0.08 0.64
0.300.37
0.31
0.38
0.55 3.07*
0.550.67
0.27 1.060.38
0.43
0.28 1.0
6
0.68 0.6
32.680.3
8
1.060.39
0.55 3.24*
1.060.75
0.73 2.51*
0.36 n.a.
0.69 n.a.
0.09 n.a.
1.060.59
0.890.17
0.550.13
0.31
0.38
0.30 0.29
0.7
3*0.0
9*
0.390.38
0.0
90.0
90.0
90.1
1
n.a.0.21
0.49 0.370.08
0.35
0.24
0.50
0.470.67
0.4
00.3
7
0.28 0.40
0.49
0.45
0.11 0.350.390.10
0.81 0.790.790.38
0.08 0.340.270.34
0.11 0.45
0.360.19
0.40 0.37
0.080.45
0.36 0.39
0.150.45
0.08 0.5
90.7
30.3
7
0.5
60.5
30.0
70.2
1
0.1
00.2
40.2
10.2
3
0.28
0.20
0.10
0.11
euroeuro
0.300.34
0.100.33
0.45
1.17
0.34
0.81 0.66 0.340.100.440.38
0.44
1.17
1.10
euro
0.17
0.15
0.15
0.58
-
-
1.51
euro
NCG
GPLTGPS
TR South
GazSystem
PEG North
1.53
1.09
2.24*
0.15
0.90
1.44* 1.22
n.a.
3.78
1.71
1.49*
4.64
1.47
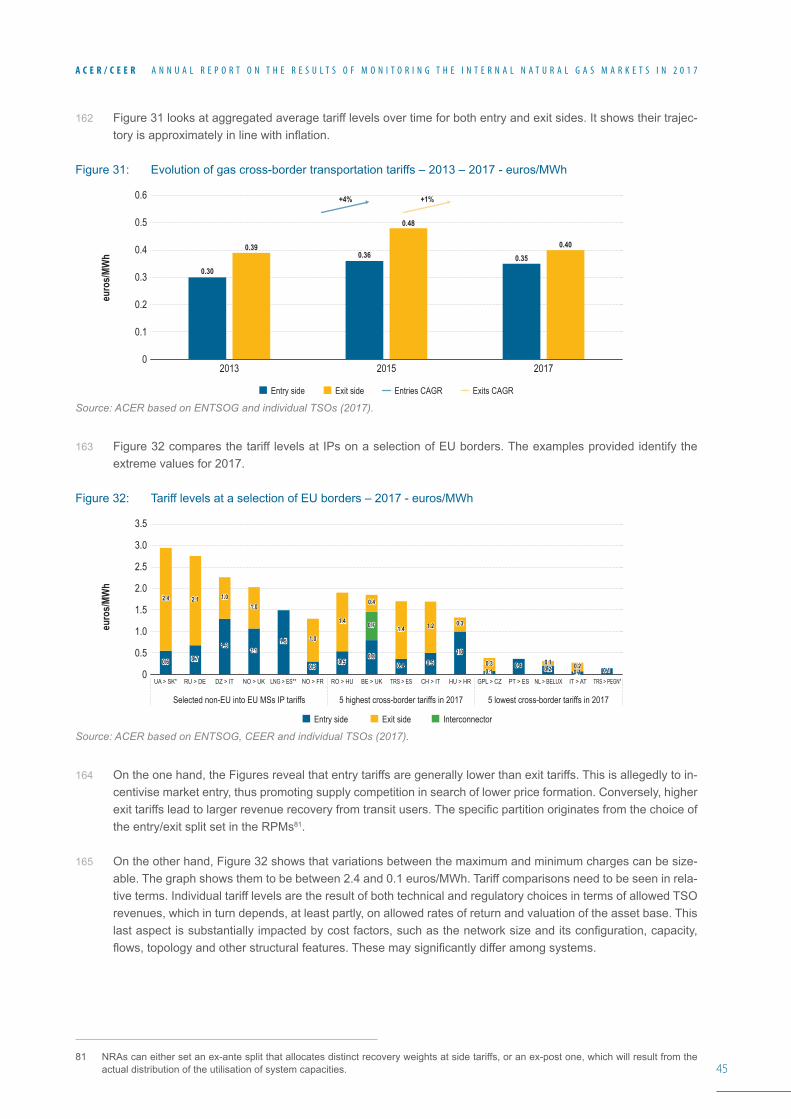
45
A C E R / C E E R A N N U A L R E P O R T O N T H E R E S U L T S O F M O N I T O R I N G T H E I N T E R N A L N A T U R A L G A S M A R K E T S I N 2 0 1 7
162 Figure 31 looks at aggregated average tariff levels over time for both entry and exit sides. It shows their trajec-tory is approximately in line with inflation.
Figure 31: Evolution of gas cross-border transportation tariffs – 2013 – 2017 - euros/MWh
Source: ACER based on ENTSOG and individual TSOs (2017).
163 Figure 32 compares the tariff levels at IPs on a selection of EU borders. The examples provided identify the extreme values for 2017.
Figure 32: Tariff levels at a selection of EU borders – 2017 - euros/MWh
Source: ACER based on ENTSOG, CEER and individual TSOs (2017).
164 On the one hand, the Figures reveal that entry tariffs are generally lower than exit tariffs. This is allegedly to in-centivise market entry, thus promoting supply competition in search of lower price formation. Conversely, higher exit tariffs lead to larger revenue recovery from transit users. The specific partition originates from the choice of the entry/exit split set in the RPMs81.
165 On the other hand, Figure 32 shows that variations between the maximum and minimum charges can be size-able. The graph shows them to be between 2.4 and 0.1 euros/MWh. Tariff comparisons need to be seen in rela-tive terms. Individual tariff levels are the result of both technical and regulatory choices in terms of allowed TSO revenues, which in turn depends, at least partly, on allowed rates of return and valuation of the asset base. This last aspect is substantially impacted by cost factors, such as the network size and its configuration, capacity, flows, topology and other structural features. These may significantly differ among systems.
81 NRAs can either set an ex-ante split that allocates distinct recovery weights at side tariffs, or an ex-post one, which will result from the actual distribution of the utilisation of system capacities.
euro
s/MW
h
0.6
0.5
0.4
0.3
0.2
0.1
02013 2015 2017
Exit sideEntry side Entries CAGR Exits CAGR
0.30
0.390.36
+4% +1%
0.48
0.350.40
euro
s/MW
h
3.5
2.0
2.5
3.0
1.5
0.5
1.0
0UA > SK* RU > DE NO > UK LNG > ES** NO > FR RO > HU BE > UK TRS > ES CH > IT HU > HR GPL > CZ PT > ES NL > BELUX IT > AT TRS > PEGN*DZ > IT
Selected non-EU into EU MSs IP tariffs 5 highest cross-border tariffs in 2017 5 lowest cross-border tariffs in 2017
Entry side Exit side Interconnector
0.10.1 0.20.20.60.6 0.70.7
1.31.31.11.1
1.51.5
0.30.30.50.5
0.80.80.40.4 0.50.5
1.01.0
0.10.10.40.4 0.20.2 0.10.1 0.10.1
0.70.7
2.42.4 2.12.1 1.01.01.01.0
1.01.0
1.41.4
0.40.4
1.41.4 1.21.2 0.30.3
0.30.3
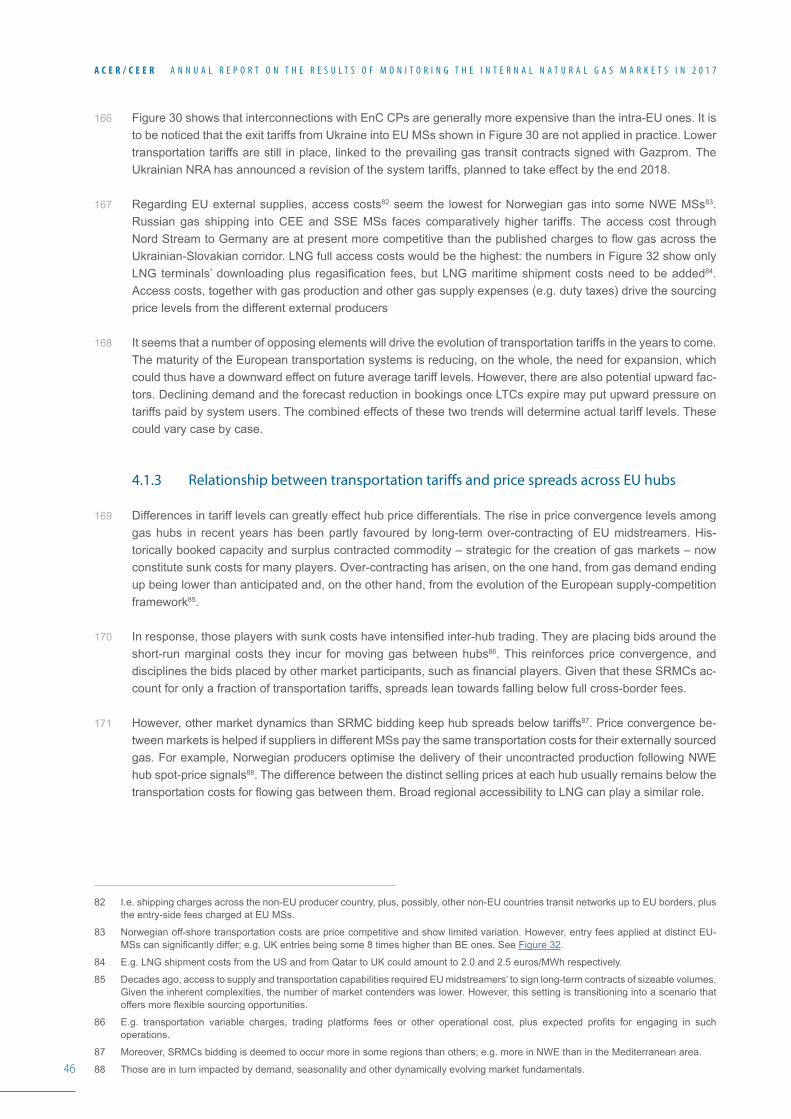
46
A C E R / C E E R A N N U A L R E P O R T O N T H E R E S U L T S O F M O N I T O R I N G T H E I N T E R N A L N A T U R A L G A S M A R K E T S I N 2 0 1 7
166 Figure 30 shows that interconnections with EnC CPs are generally more expensive than the intra-EU ones. It is to be noticed that the exit tariffs from Ukraine into EU MSs shown in Figure 30 are not applied in practice. Lower transportation tariffs are still in place, linked to the prevailing gas transit contracts signed with Gazprom. The Ukrainian NRA has announced a revision of the system tariffs, planned to take effect by the end 2018.
167 Regarding EU external supplies, access costs82 seem the lowest for Norwegian gas into some NWE MSs83. Russian gas shipping into CEE and SSE MSs faces comparatively higher tariffs. The access cost through Nord Stream to Germany are at present more competitive than the published charges to flow gas across the Ukrainian-Slovakian corridor. LNG full access costs would be the highest: the numbers in Figure 32 show only LNG terminals’ downloading plus regasification fees, but LNG maritime shipment costs need to be added84. Access costs, together with gas production and other gas supply expenses (e.g. duty taxes) drive the sourcing price levels from the different external producers
168 It seems that a number of opposing elements will drive the evolution of transportation tariffs in the years to come. The maturity of the European transportation systems is reducing, on the whole, the need for expansion, which could thus have a downward effect on future average tariff levels. However, there are also potential upward fac-tors. Declining demand and the forecast reduction in bookings once LTCs expire may put upward pressure on tariffs paid by system users. The combined effects of these two trends will determine actual tariff levels. These could vary case by case.
4.1.3 Relationship between transportation tariffs and price spreads across EU hubs
169 Differences in tariff levels can greatly effect hub price differentials. The rise in price convergence levels among gas hubs in recent years has been partly favoured by long-term over-contracting of EU midstreamers. His-torically booked capacity and surplus contracted commodity – strategic for the creation of gas markets – now constitute sunk costs for many players. Over-contracting has arisen, on the one hand, from gas demand ending up being lower than anticipated and, on the other hand, from the evolution of the European supply-competition framework85.
170 In response, those players with sunk costs have intensified inter-hub trading. They are placing bids around the short-run marginal costs they incur for moving gas between hubs86. This reinforces price convergence, and disciplines the bids placed by other market participants, such as financial players. Given that these SRMCs ac-count for only a fraction of transportation tariffs, spreads lean towards falling below full cross-border fees.
171 However, other market dynamics than SRMC bidding keep hub spreads below tariffs87. Price convergence be-tween markets is helped if suppliers in different MSs pay the same transportation costs for their externally sourced gas. For example, Norwegian producers optimise the delivery of their uncontracted production following NWE hub spot-price signals88. The difference between the distinct selling prices at each hub usually remains below the transportation costs for flowing gas between them. Broad regional accessibility to LNG can play a similar role.
82 I.e. shipping charges across the non-EU producer country, plus, possibly, other non-EU countries transit networks up to EU borders, plus the entry-side fees charged at EU MSs.
83 Norwegian off-shore transportation costs are price competitive and show limited variation. However, entry fees applied at distinct EU-MSs can significantly differ; e.g. UK entries being some 8 times higher than BE ones. See Figure 32.
84 E.g. LNG shipment costs from the US and from Qatar to UK could amount to 2.0 and 2.5 euros/MWh respectively.
85 Decades ago, access to supply and transportation capabilities required EU midstreamers’ to sign long-term contracts of sizeable volumes. Given the inherent complexities, the number of market contenders was lower. However, this setting is transitioning into a scenario that offers more flexible sourcing opportunities.
86 E.g. transportation variable charges, trading platforms fees or other operational cost, plus expected profits for engaging in such operations.
87 Moreover, SRMCs bidding is deemed to occur more in some regions than others; e.g. more in NWE than in the Mediterranean area.
88 Those are in turn impacted by demand, seasonality and other dynamically evolving market fundamentals.
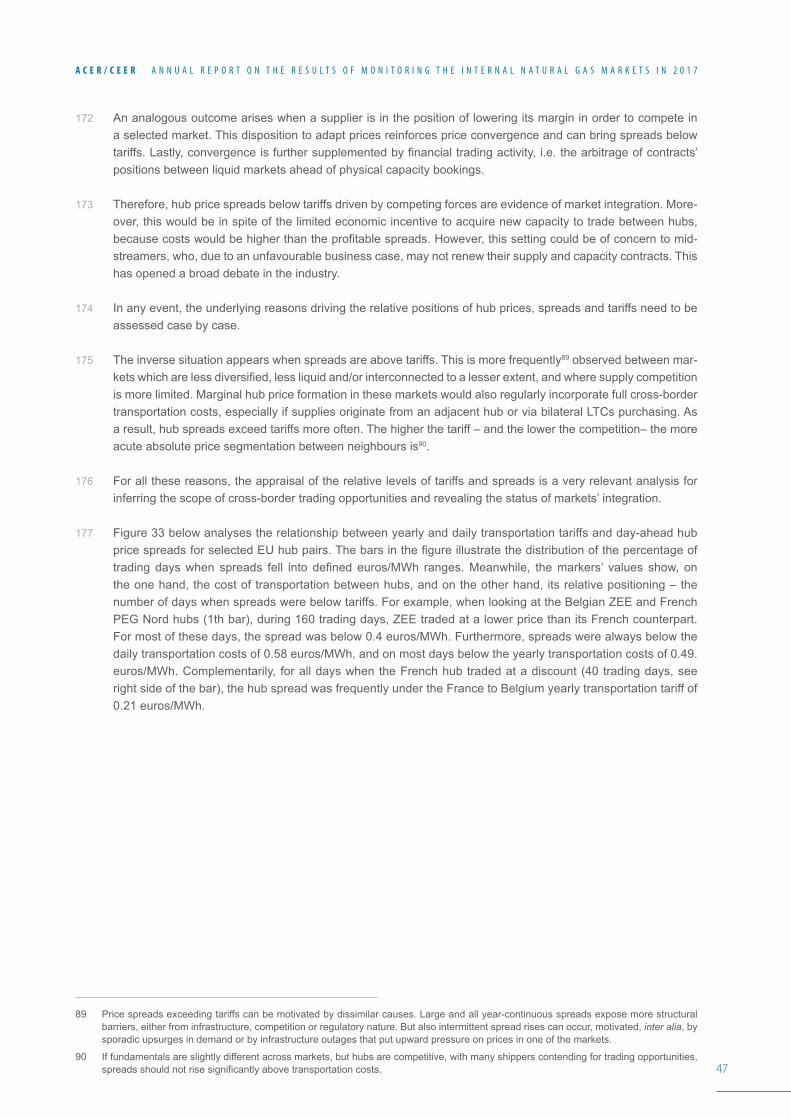
47
A C E R / C E E R A N N U A L R E P O R T O N T H E R E S U L T S O F M O N I T O R I N G T H E I N T E R N A L N A T U R A L G A S M A R K E T S I N 2 0 1 7
172 An analogous outcome arises when a supplier is in the position of lowering its margin in order to compete in a selected market. This disposition to adapt prices reinforces price convergence and can bring spreads below tariffs. Lastly, convergence is further supplemented by financial trading activity, i.e. the arbitrage of contracts’ positions between liquid markets ahead of physical capacity bookings.
173 Therefore, hub price spreads below tariffs driven by competing forces are evidence of market integration. More-over, this would be in spite of the limited economic incentive to acquire new capacity to trade between hubs, because costs would be higher than the profitable spreads. However, this setting could be of concern to mid-streamers, who, due to an unfavourable business case, may not renew their supply and capacity contracts. This has opened a broad debate in the industry.
174 In any event, the underlying reasons driving the relative positions of hub prices, spreads and tariffs need to be assessed case by case.
175 The inverse situation appears when spreads are above tariffs. This is more frequently89 observed between mar-kets which are less diversified, less liquid and/or interconnected to a lesser extent, and where supply competition is more limited. Marginal hub price formation in these markets would also regularly incorporate full cross-border transportation costs, especially if supplies originate from an adjacent hub or via bilateral LTCs purchasing. As a result, hub spreads exceed tariffs more often. The higher the tariff – and the lower the competition– the more acute absolute price segmentation between neighbours is90.
176 For all these reasons, the appraisal of the relative levels of tariffs and spreads is a very relevant analysis for inferring the scope of cross-border trading opportunities and revealing the status of markets’ integration.
177 Figure 33 below analyses the relationship between yearly and daily transportation tariffs and day-ahead hub price spreads for selected EU hub pairs. The bars in the figure illustrate the distribution of the percentage of trading days when spreads fell into defined euros/MWh ranges. Meanwhile, the markers’ values show, on the one hand, the cost of transportation between hubs, and on the other hand, its relative positioning – the number of days when spreads were below tariffs. For example, when looking at the Belgian ZEE and French PEG Nord hubs (1th bar), during 160 trading days, ZEE traded at a lower price than its French counterpart. For most of these days, the spread was below 0.4 euros/MWh. Furthermore, spreads were always below the daily transportation costs of 0.58 euros/MWh, and on most days below the yearly transportation costs of 0.49. euros/MWh. Complementarily, for all days when the French hub traded at a discount (40 trading days, see right side of the bar), the hub spread was frequently under the France to Belgium yearly transportation tariff of 0.21 euros/MWh.
89 Price spreads exceeding tariffs can be motivated by dissimilar causes. Large and all year-continuous spreads expose more structural barriers, either from infrastructure, competition or regulatory nature. But also intermittent spread rises can occur, motivated, inter alia, by sporadic upsurges in demand or by infrastructure outages that put upward pressure on prices in one of the markets.
90 If fundamentals are slightly different across markets, but hubs are competitive, with many shippers contending for trading opportunities, spreads should not rise significantly above transportation costs.
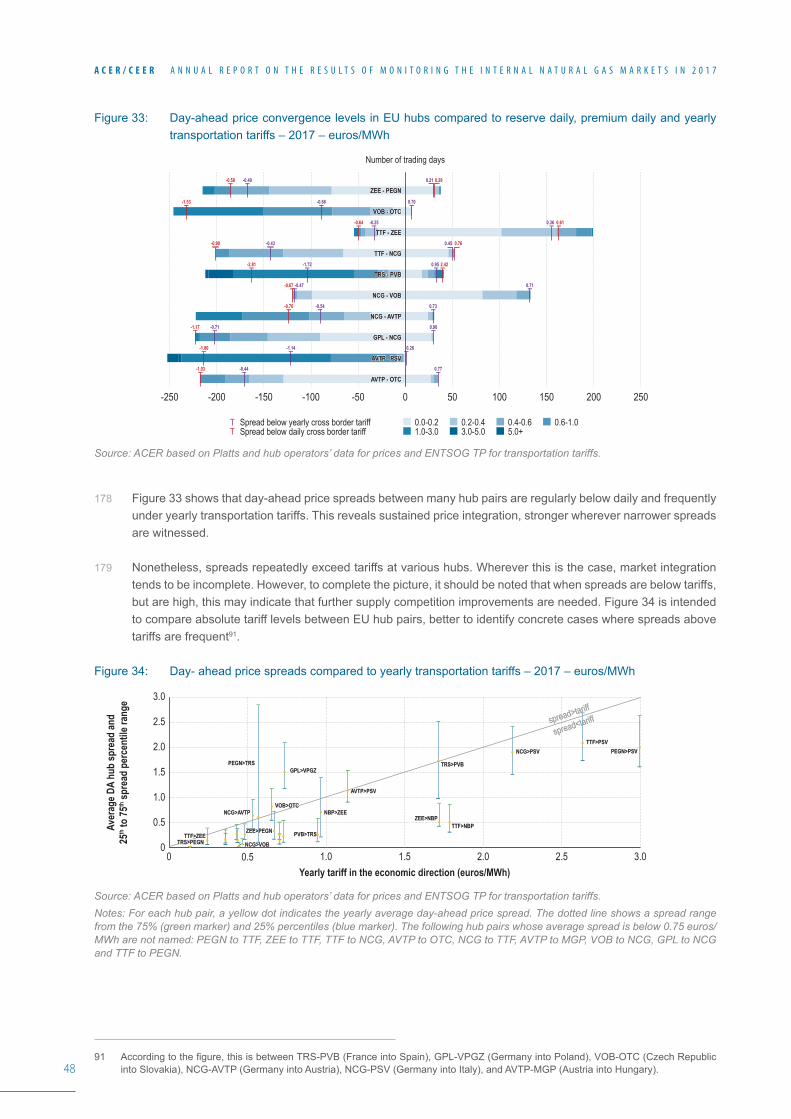
48
A C E R / C E E R A N N U A L R E P O R T O N T H E R E S U L T S O F M O N I T O R I N G T H E I N T E R N A L N A T U R A L G A S M A R K E T S I N 2 0 1 7
Figure 33: Day-ahead price convergence levels in EU hubs compared to reserve daily, premium daily and yearly transportation tariffs – 2017 – euros/MWh
Source: ACER based on Platts and hub operators’ data for prices and ENTSOG TP for transportation tariffs.
178 Figure 33 shows that day-ahead price spreads between many hub pairs are regularly below daily and frequently under yearly transportation tariffs. This reveals sustained price integration, stronger wherever narrower spreads are witnessed.
179 Nonetheless, spreads repeatedly exceed tariffs at various hubs. Wherever this is the case, market integration tends to be incomplete. However, to complete the picture, it should be noted that when spreads are below tariffs, but are high, this may indicate that further supply competition improvements are needed. Figure 34 is intended to compare absolute tariff levels between EU hub pairs, better to identify concrete cases where spreads above tariffs are frequent91.
Figure 34: Day- ahead price spreads compared to yearly transportation tariffs – 2017 – euros/MWh
Source: ACER based on Platts and hub operators’ data for prices and ENTSOG TP for transportation tariffs.Notes: For each hub pair, a yellow dot indicates the yearly average day-ahead price spread. The dotted line shows a spread range from the 75% (green marker) and 25% percentiles (blue marker). The following hub pairs whose average spread is below 0.75 euros/MWh are not named: PEGN to TTF, ZEE to TTF, TTF to NCG, AVTP to OTC, NCG to TTF, AVTP to MGP, VOB to NCG, GPL to NCG and TTF to PEGN.
91 According to the figure, this is between TRS-PVB (France into Spain), GPL-VPGZ (Germany into Poland), VOB-OTC (Czech Republic into Slovakia), NCG-AVTP (Germany into Austria), NCG-PSV (Germany into Italy), and AVTP-MGP (Austria into Hungary).
2501000 150 200-100-200 -150 50-50-250
0.0-0.2 0.2-0.4 0.4-0.6 0.6-1.01.0-3.0 3.0-5.0 5.0+
Spread below yearly cross border tariffSpread below daily cross border tariff
Number of trading days
-0.58 -0.49
ZEE - PEGN
VOB - OTC
TTF - ZEE
TTF - NCG
TRS - PVB
NCG - VOB
NCG - AVTP
GPL - NCG
AVTP - PSV
AVTP - OTC
ZEE - PEGN
VOB - OTC
TTF - ZEE
TTF - NCG
TRS - PVB
NCG - VOB
NCG - AVTP
GPL - NCG
AVTP - PSV
AVTP - OTC
-1.53 -0.66
-0.90 0.76-0.43 0.45
-2.81 -1.72 2.420.95
-0.67 -0.47 0.71
-0.70 -0.54 0.73
-1.17 -0.71 0.90
-1.80 -1.14
-1.03 -0.44
0.26
0.77
-0.64 0.61-0.25 0.36
0.70
0.21 0.29
Aver
age D
A hu
b sp
read
and
25th to
75th sp
read
per
cent
ile ra
nge
Yearly tariff in the economic direction (euros/MWh)
3.0
0.5
1.0
1.5
2.0
2.5
00 1.00.5 1.5 2.0 2.5 3.0
TTF>ZEETTF>ZEENCG>VOBNCG>VOB
NCG>AVTPNCG>AVTP
ZEE>PEGNZEE>PEGN PVB>TRSPVB>TRS
PEGN>PSVPEGN>PSVTTF>PSVTTF>PSV
NCG>PSVNCG>PSV
TTF>NBPTTF>NBPZEE>NBPZEE>NBP
TRS>PVBTRS>PVB
TRS>PEGNTRS>PEGN
AVTP>PSVAVTP>PSV
PEGN>TRSPEGN>TRS
NBP>ZEENBP>ZEE
GPL>VPGZGPL>VPGZ
VOB>OTCVOB>OTC
spread>tariffspread>tariff
spread<tariffspread<tariff
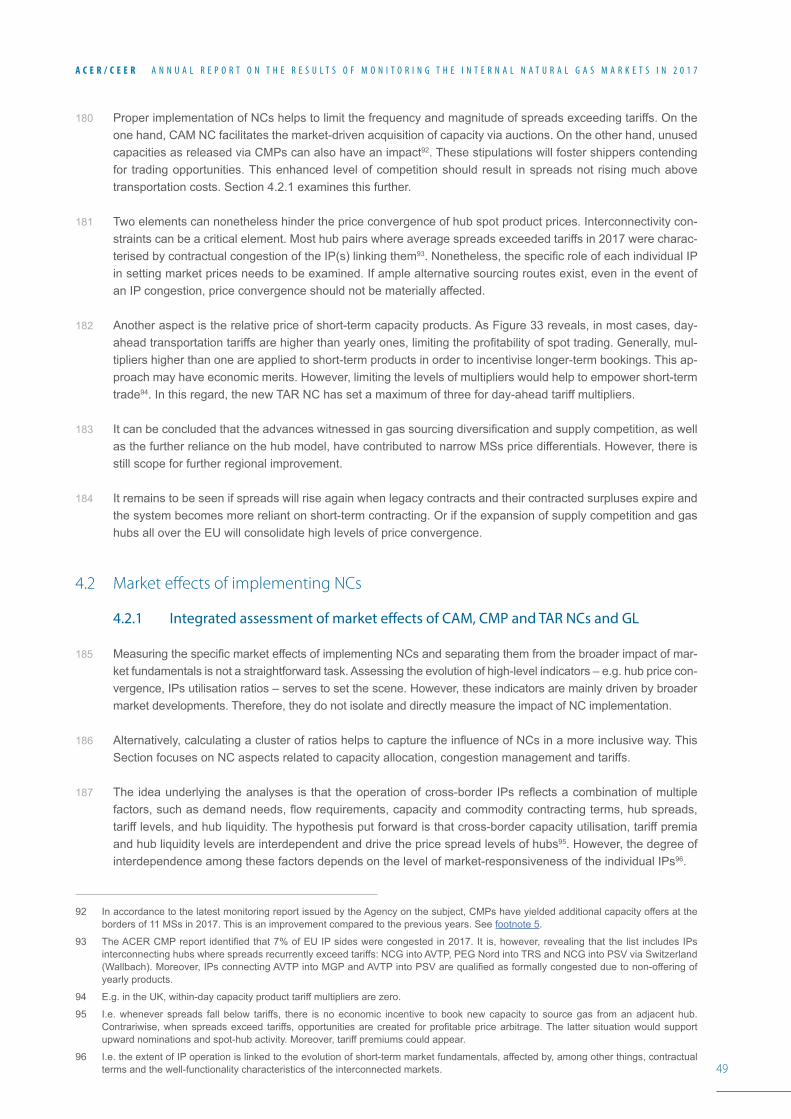
49
A C E R / C E E R A N N U A L R E P O R T O N T H E R E S U L T S O F M O N I T O R I N G T H E I N T E R N A L N A T U R A L G A S M A R K E T S I N 2 0 1 7
180 Proper implementation of NCs helps to limit the frequency and magnitude of spreads exceeding tariffs. On the one hand, CAM NC facilitates the market-driven acquisition of capacity via auctions. On the other hand, unused capacities as released via CMPs can also have an impact92. These stipulations will foster shippers contending for trading opportunities. This enhanced level of competition should result in spreads not rising much above transportation costs. Section 4.2.1 examines this further.
181 Two elements can nonetheless hinder the price convergence of hub spot product prices. Interconnectivity con-straints can be a critical element. Most hub pairs where average spreads exceeded tariffs in 2017 were charac-terised by contractual congestion of the IP(s) linking them93. Nonetheless, the specific role of each individual IP in setting market prices needs to be examined. If ample alternative sourcing routes exist, even in the event of an IP congestion, price convergence should not be materially affected.
182 Another aspect is the relative price of short-term capacity products. As Figure 33 reveals, in most cases, day-ahead transportation tariffs are higher than yearly ones, limiting the profitability of spot trading. Generally, mul-tipliers higher than one are applied to short-term products in order to incentivise longer-term bookings. This ap-proach may have economic merits. However, limiting the levels of multipliers would help to empower short-term trade94. In this regard, the new TAR NC has set a maximum of three for day-ahead tariff multipliers.
183 It can be concluded that the advances witnessed in gas sourcing diversification and supply competition, as well as the further reliance on the hub model, have contributed to narrow MSs price differentials. However, there is still scope for further regional improvement.
184 It remains to be seen if spreads will rise again when legacy contracts and their contracted surpluses expire and the system becomes more reliant on short-term contracting. Or if the expansion of supply competition and gas hubs all over the EU will consolidate high levels of price convergence.
4.2 Market effects of implementing NCs
4.2.1 Integrated assessment of market effects of CAM, CMP and TAR NCs and GL
185 Measuring the specific market effects of implementing NCs and separating them from the broader impact of mar-ket fundamentals is not a straightforward task. Assessing the evolution of high-level indicators – e.g. hub price con-vergence, IPs utilisation ratios – serves to set the scene. However, these indicators are mainly driven by broader market developments. Therefore, they do not isolate and directly measure the impact of NC implementation.
186 Alternatively, calculating a cluster of ratios helps to capture the influence of NCs in a more inclusive way. This Section focuses on NC aspects related to capacity allocation, congestion management and tariffs.
187 The idea underlying the analyses is that the operation of cross-border IPs reflects a combination of multiple factors, such as demand needs, flow requirements, capacity and commodity contracting terms, hub spreads, tariff levels, and hub liquidity. The hypothesis put forward is that cross-border capacity utilisation, tariff premia and hub liquidity levels are interdependent and drive the price spread levels of hubs95. However, the degree of interdependence among these factors depends on the level of market-responsiveness of the individual IPs96.
92 In accordance to the latest monitoring report issued by the Agency on the subject, CMPs have yielded additional capacity offers at the borders of 11 MSs in 2017. This is an improvement compared to the previous years. See footnote 5.
93 The ACER CMP report identified that 7% of EU IP sides were congested in 2017. It is, however, revealing that the list includes IPs interconnecting hubs where spreads recurrently exceed tariffs: NCG into AVTP, PEG Nord into TRS and NCG into PSV via Switzerland (Wallbach). Moreover, IPs connecting AVTP into MGP and AVTP into PSV are qualified as formally congested due to non-offering of yearly products.
94 E.g. in the UK, within-day capacity product tariff multipliers are zero.
95 I.e. whenever spreads fall below tariffs, there is no economic incentive to book new capacity to source gas from an adjacent hub. Contrariwise, when spreads exceed tariffs, opportunities are created for profitable price arbitrage. The latter situation would support upward nominations and spot-hub activity. Moreover, tariff premiums could appear.
96 I.e. the extent of IP operation is linked to the evolution of short-term market fundamentals, affected by, among other things, contractual terms and the well-functionality characteristics of the interconnected markets.
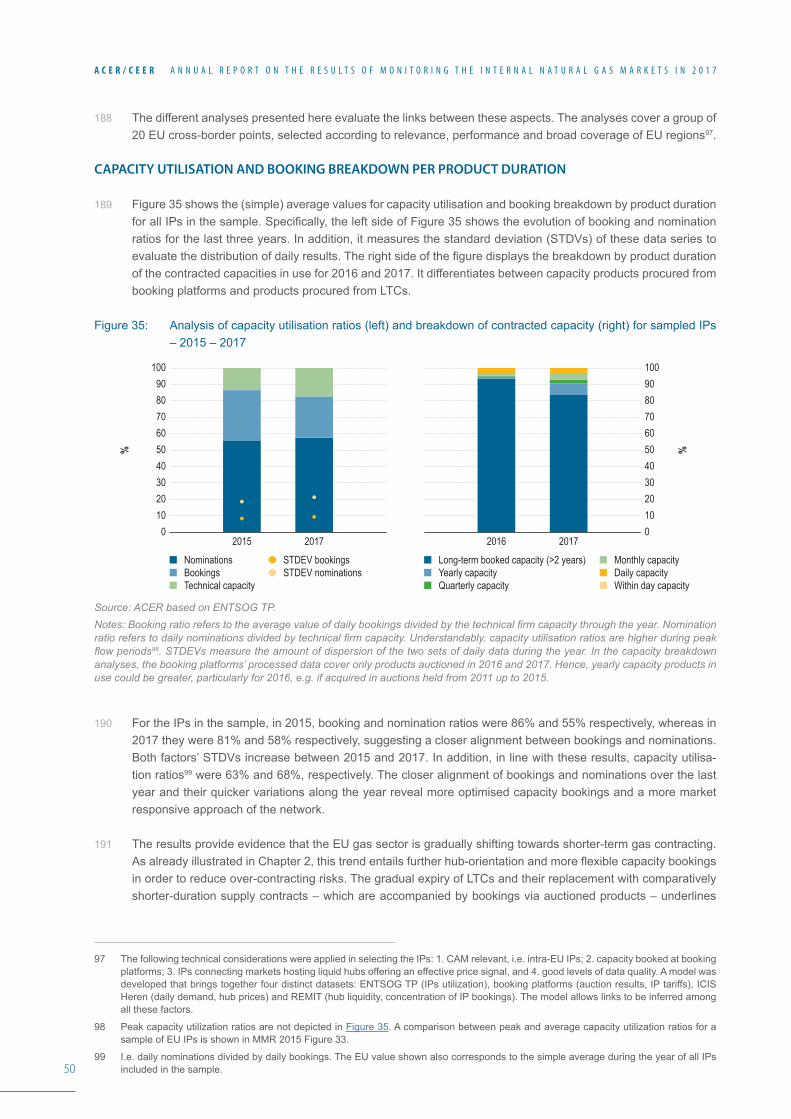
50
A C E R / C E E R A N N U A L R E P O R T O N T H E R E S U L T S O F M O N I T O R I N G T H E I N T E R N A L N A T U R A L G A S M A R K E T S I N 2 0 1 7
188 The different analyses presented here evaluate the links between these aspects. The analyses cover a group of 20 EU cross-border points, selected according to relevance, performance and broad coverage of EU regions97.
CAPACITY UTILISATION AND BOOKING BREAKDOWN PER PRODUCT DURATION
189 Figure 35 shows the (simple) average values for capacity utilisation and booking breakdown by product duration for all IPs in the sample. Specifically, the left side of Figure 35 shows the evolution of booking and nomination ratios for the last three years. In addition, it measures the standard deviation (STDVs) of these data series to evaluate the distribution of daily results. The right side of the figure displays the breakdown by product duration of the contracted capacities in use for 2016 and 2017. It differentiates between capacity products procured from booking platforms and products procured from LTCs.
Figure 35: Analysis of capacity utilisation ratios (left) and breakdown of contracted capacity (right) for sampled IPs – 2015 – 2017
Source: ACER based on ENTSOG TP.Notes: Booking ratio refers to the average value of daily bookings divided by the technical firm capacity through the year. Nomination ratio refers to daily nominations divided by technical firm capacity. Understandably, capacity utilisation ratios are higher during peak flow periods98. STDEVs measure the amount of dispersion of the two sets of daily data during the year. In the capacity breakdown analyses, the booking platforms’ processed data cover only products auctioned in 2016 and 2017. Hence, yearly capacity products in use could be greater, particularly for 2016, e.g. if acquired in auctions held from 2011 up to 2015.
190 For the IPs in the sample, in 2015, booking and nomination ratios were 86% and 55% respectively, whereas in 2017 they were 81% and 58% respectively, suggesting a closer alignment between bookings and nominations. Both factors’ STDVs increase between 2015 and 2017. In addition, in line with these results, capacity utilisa-tion ratios99 were 63% and 68%, respectively. The closer alignment of bookings and nominations over the last year and their quicker variations along the year reveal more optimised capacity bookings and a more market responsive approach of the network.
191 The results provide evidence that the EU gas sector is gradually shifting towards shorter-term gas contracting. As already illustrated in Chapter 2, this trend entails further hub-orientation and more flexible capacity bookings in order to reduce over-contracting risks. The gradual expiry of LTCs and their replacement with comparatively shorter-duration supply contracts – which are accompanied by bookings via auctioned products – underlines
97 The following technical considerations were applied in selecting the IPs: 1. CAM relevant, i.e. intra-EU IPs; 2. capacity booked at booking platforms; 3. IPs connecting markets hosting liquid hubs offering an effective price signal, and 4. good levels of data quality. A model was developed that brings together four distinct datasets: ENTSOG TP (IPs utilization), booking platforms (auction results, IP tariffs), ICIS Heren (daily demand, hub prices) and REMIT (hub liquidity, concentration of IP bookings). The model allows links to be inferred among all these factors.
98 Peak capacity utilization ratios are not depicted in Figure 35. A comparison between peak and average capacity utilization ratios for a sample of EU IPs is shown in MMR 2015 Figure 33.
99 I.e. daily nominations divided by daily bookings. The EU value shown also corresponds to the simple average during the year of all IPs included in the sample.
%%
1009080706050403020100
2015 2017 2016 2017
100908070605040302010
0
Long-term booked capacity (>2 years)Yearly capacityQuarterly capacity
Monthly capacity Daily capacityWithin day capacity
NominationsBookingsTechnical capacity
STDEV bookingsSTDEV nominations
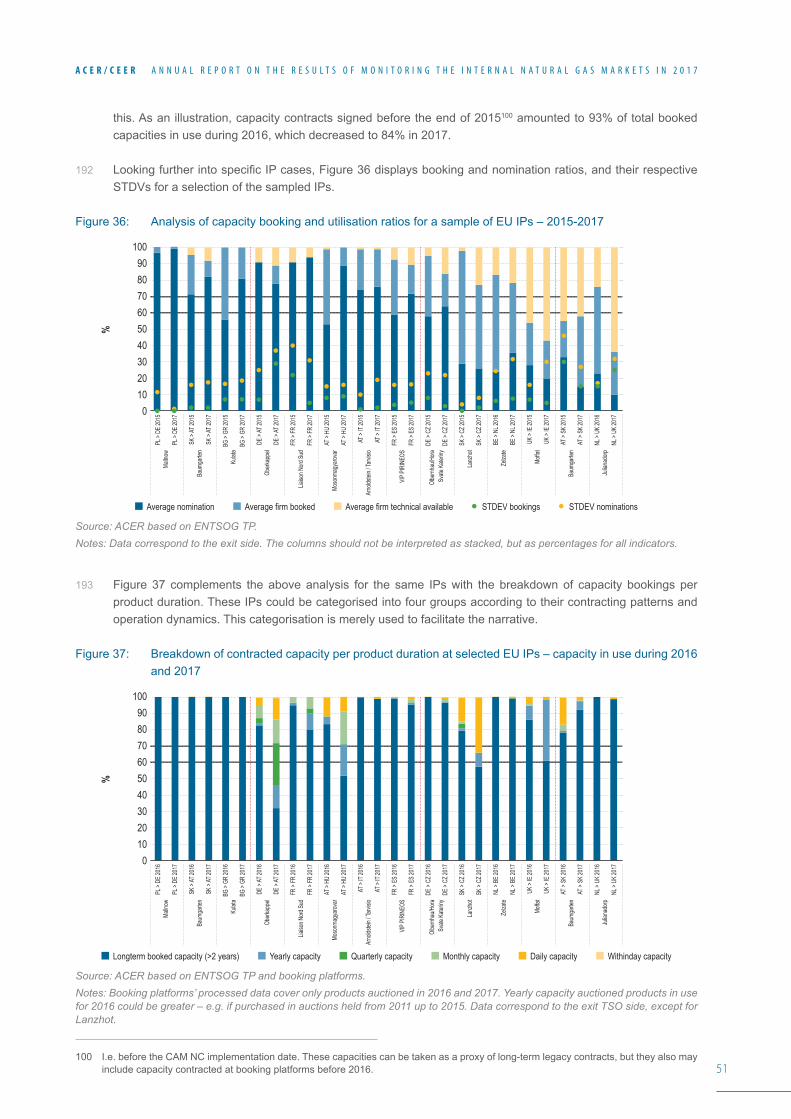
51
A C E R / C E E R A N N U A L R E P O R T O N T H E R E S U L T S O F M O N I T O R I N G T H E I N T E R N A L N A T U R A L G A S M A R K E T S I N 2 0 1 7
this. As an illustration, capacity contracts signed before the end of 2015100 amounted to 93% of total booked capacities in use during 2016, which decreased to 84% in 2017.
192 Looking further into specific IP cases, Figure 36 displays booking and nomination ratios, and their respective STDVs for a selection of the sampled IPs.
Figure 36: Analysis of capacity booking and utilisation ratios for a sample of EU IPs – 2015-2017
Source: ACER based on ENTSOG TP.Notes: Data correspond to the exit side. The columns should not be interpreted as stacked, but as percentages for all indicators.
193 Figure 37 complements the above analysis for the same IPs with the breakdown of capacity bookings per product duration. These IPs could be categorised into four groups according to their contracting patterns and operation dynamics. This categorisation is merely used to facilitate the narrative.
Figure 37: Breakdown of contracted capacity per product duration at selected EU IPs – capacity in use during 2016 and 2017
Source: ACER based on ENTSOG TP and booking platforms.Notes: Booking platforms’ processed data cover only products auctioned in 2016 and 2017. Yearly capacity auctioned products in use for 2016 could be greater – e.g. if purchased in auctions held from 2011 up to 2015. Data correspond to the exit TSO side, except for Lanzhot.
100 I.e. before the CAM NC implementation date. These capacities can be taken as a proxy of long-term legacy contracts, but they also may include capacity contracted at booking platforms before 2016.
%
100
80
60
40
20
90
70
50
30
100
PL >
DE 20
15
PL >
DE 20
17
SK >
AT 20
15
SK >
AT 20
17
BG >
GR 20
15
BG >
GR 20
17
DE >
AT 20
15
DE >
AT 20
17
FR >
FR 20
15
FR >
FR 20
17
AT >
HU 20
15
AT >
HU 20
17
AT >
IT 20
15
AT >
IT 20
17
FR >
ES 20
15
FR >
ES 20
17
DE >
CZ 20
15
DE >
CZ 20
17
SK >
CZ 20
15
SK >
CZ 20
17
BE >
NL 20
16
BE >
NL 20
17
UK >
IE 20
15
UK >
IE 20
17
AT >
SK 20
15
AT >
SK 20
17
NL >
UK 20
16
NL >
UK 20
17
Malln
ow
Baum
garte
n
Kulat
a
Oberk
appe
l
Liaiso
n Nord
Sud
Moso
nmag
yarov
ar
Arno
ldstei
n / Ta
rvisio
VIP P
IRIN
EOS
Olbe
rnhau
/Hora
Sva
te Ka
teriny
Lanz
hot
Zelza
te
Moffa
t
Baum
garte
n
Julia
nado
rp
Average nomination Average firm technical available STDEV nominationsSTDEV bookingsAverage firm booked
%
100
80
60
40
20
90
70
50
30
100
PL >
DE 20
16
PL >
DE 20
17
SK >
AT 20
16
SK >
AT 20
17
BG >
GR 20
16
BG >
GR 20
17
DE >
AT 20
16
DE >
AT 20
17
FR >
FR 20
16
FR >
FR 20
17
AT >
HU 20
16
AT >
HU 20
17
AT >
IT 20
16
AT >
IT 20
17
FR >
ES 20
16
FR >
ES 20
17
DE >
CZ 20
16
DE >
CZ 20
17
SK >
CZ 20
16
SK >
CZ 20
17
NL >
BE 20
16
NL >
BE 20
17
UK >
IE 20
16
UK >
IE 20
17
AT >
SK 20
16
AT >
SK 20
17
NL >
UK 20
16
NL >
UK 20
17
Malln
ow
Baum
garte
n
Kulat
a
Oberk
appe
l
Liaiso
n Nord
Sud
Moso
nmag
yarov
ar
Arno
ldstei
n / Ta
rvisio
VIP P
IRIN
EOS
Olbe
rnhau
/Hora
Sva
te Ka
teriny
Lanz
hot
Zelza
te
Moffa
t
Baum
garte
n
Julia
nado
rp
Longterm booked capacity (>2 years) Quarterly capacity Monthly capacity Daily capacity Withinday capacityYearly capacity
52
A C E R / C E E R A N N U A L R E P O R T O N T H E R E S U L T S O F M O N I T O R I N G T H E I N T E R N A L N A T U R A L G A S M A R K E T S I N 2 0 1 7
194 The first group of IPs encompasses Mallnow, Baumgarten and Kulata101. They are highly contracted in the domi-nant flow direction. Bookings are almost entirely long-term in nature. Average nomination ratios exceed 75%, while peak capacity utilization ratios are close to 100%. These pipelines are critical for the sourcing of gas to their respective destination markets. As such, gas flows are barely driven by relative hub-price positions, but by transit requirements stemming from long-term supply commitments.
195 The second group comprises IPs like Tarvisio, VIP Pyrenees, Liaison North-South and Oberkappel102. In this category, booking levels are also quite high, and generally reflect long-term contracts. Likewise, nominations are moderately high, partly led by stable flow patterns drawn on long-term obligations. However, their operation is becoming more dynamic. Although long-term commitments can still restrict short-term dynamics, IP utilisa-tion is more and more closely responding to hub price signals and market fundamentals. This is more apparent for, but not only, the share of non-historically contracted capacity. This setting leads overall to higher STDVs for nominations, and even bookings, and to improving correlation between nominations and spreads. The specific case of VIP Pyrenees presented in Figure 40 further elaborates on the aspect.
196 The third group refers to interconnectors which are seldom used, even though they are amply booked through past bookings. These gaps arise from evolving market and infrastructure dynamics, which are reducing the profitability of legacy capacity contracts. Lanzhot or Olbernhau, in the flow direction into Czech Republic, or Zelzate in both directions, are good examples103. The amounts of contracted capacities are gradually declining, although stipulations prevent immediate capacity release. Figure 37 also illustrates how long-term capacity is compensated with short and medium–term products.
197 Finally, the fourth group looks at IPs, which are modestly contracted and are, to a certain extent, more and more used in search of profitable trades, taking into account the relative positions of hub price spreads and tariffs. In the aim of enhancing profitability, shippers may take also into account UGS; e.g. looking at the price relationship between summer and winter hub seasonal products.
198 For example, the BBL interconnector sourcing role was reduced after the expiry at the end of 2016 of sizeable volumes of LTCs. Current booked capacities are increasingly reflecting hub prices and other market signals. This prompts a larger share of short- and medium–term capacity products104. Complementarily, Figure 36 dem-onstrates higher STDVs for both nominations and bookings, stemming from a more dynamic operation.
199 Increasing dynamics are also observed at some IPs linking markets in the direction from West to East. This is the case at Mosonmagyarovar, i.e. Austria into Hungary, for net physical flows, and more evidently at Baumgarten, i.e. Austria into Slovakia, for reverse nominations. For these IPs and directions, the shares of short-term capac-ity products and the STDVs of nominations are relatively high. The causes are multi-faceted; on the one hand, the offering of IP capacities is more novel. On the other hand, there is rising interest in securing capacities for sourcing gas from competitive Western hubs for these Central and Eastern MSs, and also, importantly, for sup-plying gas to Ukraine. As the next Section discusses, it remains to be seen if the rising IP dynamism observed would weaken if these reverse IPs utilisation diminished its role in sourcing from Western hubs for Eastern markets – which is also fostering supply diversification – and turned into a more pronounced Russian-supplies delivery function across Nord Stream(s) related routes, to the detriment of the Slovak-Ukrainian corridors.
101 Few others intra-EU IPs will correspond to this category (e.g. Negru-Voda), but, importantly, most of the pipelines connecting with non-EU countries.
102 Blaregnies, Obergailbach and Bocholtz complete the category IPs included in the processed sample. This category is thought to comprise the highest number of intra-EU IPs.
103 At Lanzhot flows from Czech Republic into Slovakia are, contrariwise, gaining ground. The underlying motives have been mentioned: higher Russian gas deliveries into CEE across non-Ukrainian routes, i.e. Nord Stream, and larger purchases at EU hubs for supplying gas up to Ukraine. STDVs are relatively high, driven by among other things, variant supply needs into Ukraine at distinct times in the year. Zelzate exemplifies the situation of the various over-contracted IPs whose large bookings partly constitute sunk costs at present. Section 4.1.3 discusses this subject.
104 In fact, the relatively tight NBP-TTF price spread has left not that much incentive for short-term bookings, as transportation costs (including commodity charges) proved too high to hub spreads. As a result, flows from the Netherlands into the UK have dropped since the beginning of 2017. The situation could change from 2018, after the merging of BBL into the TTF zone.
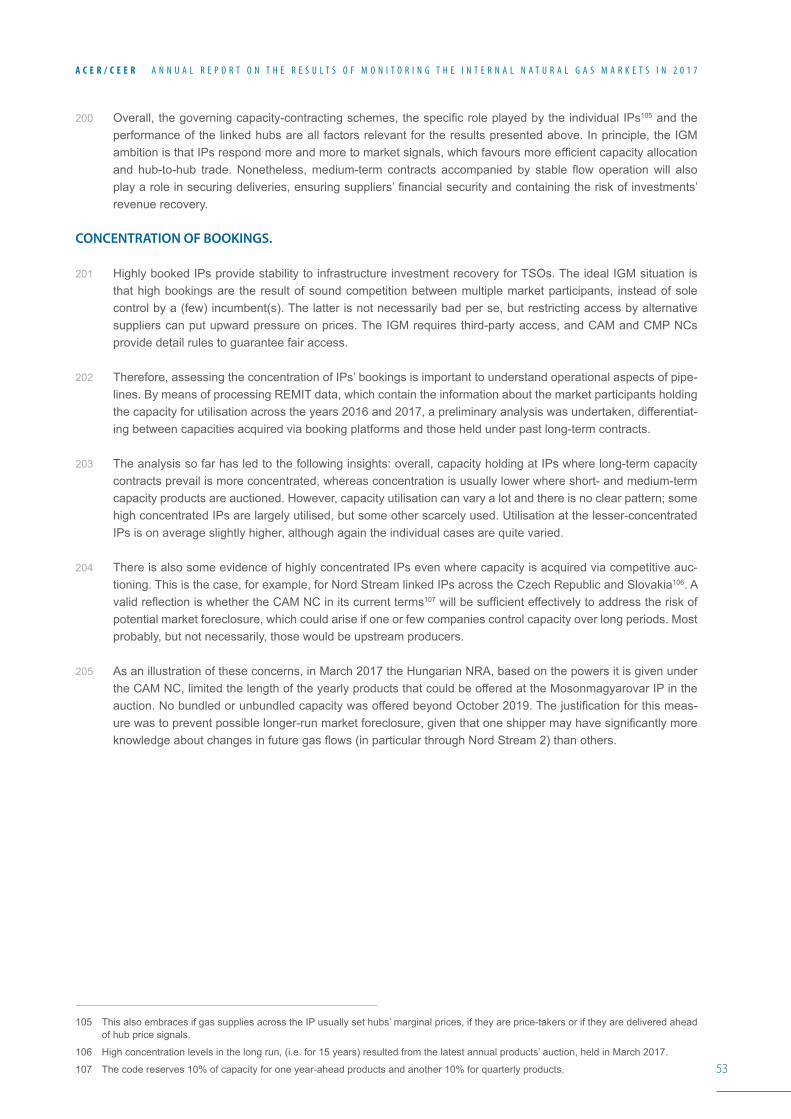
53
A C E R / C E E R A N N U A L R E P O R T O N T H E R E S U L T S O F M O N I T O R I N G T H E I N T E R N A L N A T U R A L G A S M A R K E T S I N 2 0 1 7
200 Overall, the governing capacity-contracting schemes, the specific role played by the individual IPs105 and the performance of the linked hubs are all factors relevant for the results presented above. In principle, the IGM ambition is that IPs respond more and more to market signals, which favours more efficient capacity allocation and hub-to-hub trade. Nonetheless, medium-term contracts accompanied by stable flow operation will also play a role in securing deliveries, ensuring suppliers’ financial security and containing the risk of investments’ revenue recovery.
CONCENTRATION OF BOOKINGS.
201 Highly booked IPs provide stability to infrastructure investment recovery for TSOs. The ideal IGM situation is that high bookings are the result of sound competition between multiple market participants, instead of sole control by a (few) incumbent(s). The latter is not necessarily bad per se, but restricting access by alternative suppliers can put upward pressure on prices. The IGM requires third-party access, and CAM and CMP NCs provide detail rules to guarantee fair access.
202 Therefore, assessing the concentration of IPs’ bookings is important to understand operational aspects of pipe-lines. By means of processing REMIT data, which contain the information about the market participants holding the capacity for utilisation across the years 2016 and 2017, a preliminary analysis was undertaken, differentiat-ing between capacities acquired via booking platforms and those held under past long-term contracts.
203 The analysis so far has led to the following insights: overall, capacity holding at IPs where long-term capacity contracts prevail is more concentrated, whereas concentration is usually lower where short- and medium-term capacity products are auctioned. However, capacity utilisation can vary a lot and there is no clear pattern; some high concentrated IPs are largely utilised, but some other scarcely used. Utilisation at the lesser-concentrated IPs is on average slightly higher, although again the individual cases are quite varied.
204 There is also some evidence of highly concentrated IPs even where capacity is acquired via competitive auc-tioning. This is the case, for example, for Nord Stream linked IPs across the Czech Republic and Slovakia106. A valid reflection is whether the CAM NC in its current terms107 will be sufficient effectively to address the risk of potential market foreclosure, which could arise if one or few companies control capacity over long periods. Most probably, but not necessarily, those would be upstream producers.
205 As an illustration of these concerns, in March 2017 the Hungarian NRA, based on the powers it is given under the CAM NC, limited the length of the yearly products that could be offered at the Mosonmagyarovar IP in the auction. No bundled or unbundled capacity was offered beyond October 2019. The justification for this meas-ure was to prevent possible longer-run market foreclosure, given that one shipper may have significantly more knowledge about changes in future gas flows (in particular through Nord Stream 2) than others.
105 This also embraces if gas supplies across the IP usually set hubs’ marginal prices, if they are price-takers or if they are delivered ahead of hub price signals.
106 High concentration levels in the long run, (i.e. for 15 years) resulted from the latest annual products’ auction, held in March 2017.
107 The code reserves 10% of capacity for one year-ahead products and another 10% for quarterly products.
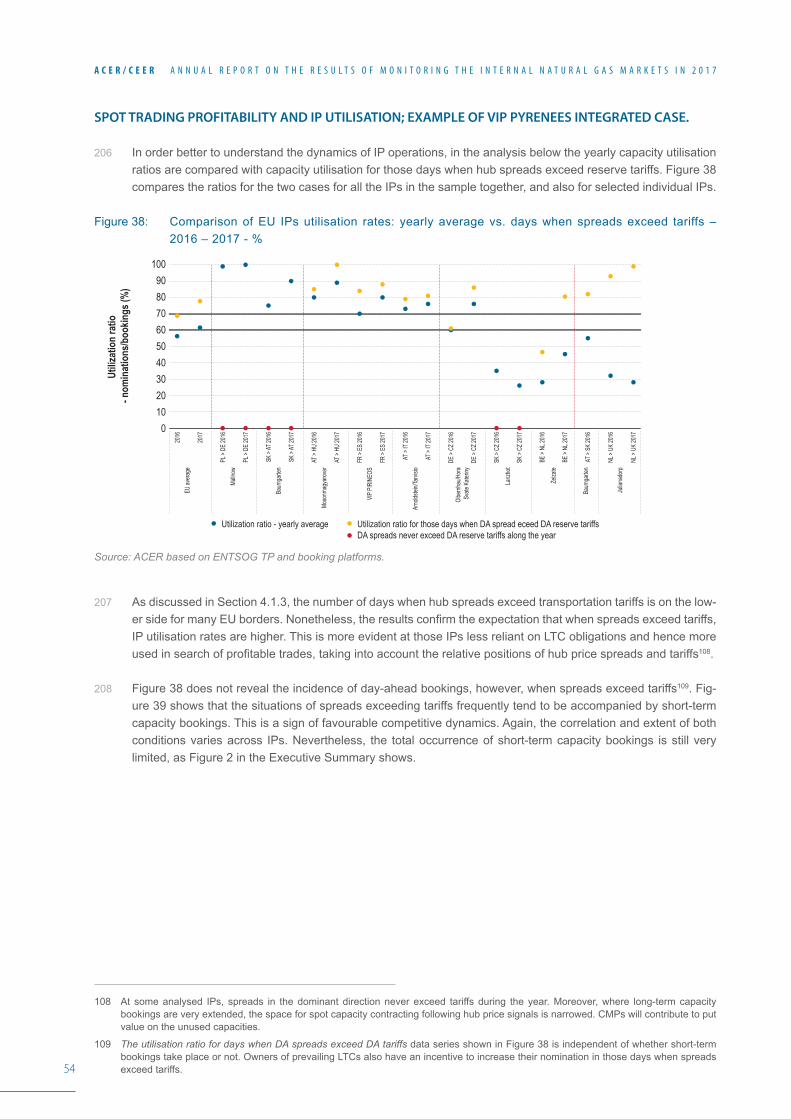
54
A C E R / C E E R A N N U A L R E P O R T O N T H E R E S U L T S O F M O N I T O R I N G T H E I N T E R N A L N A T U R A L G A S M A R K E T S I N 2 0 1 7
SPOT TRADING PROFITABILITY AND IP UTILISATION; EXAMPLE OF VIP PYRENEES INTEGRATED CASE.
206 In order better to understand the dynamics of IP operations, in the analysis below the yearly capacity utilisation ratios are compared with capacity utilisation for those days when hub spreads exceed reserve tariffs. Figure 38 compares the ratios for the two cases for all the IPs in the sample together, and also for selected individual IPs.
Figure 38: Comparison of EU IPs utilisation rates: yearly average vs. days when spreads exceed tariffs – 2016 – 2017 - %
Source: ACER based on ENTSOG TP and booking platforms.
207 As discussed in Section 4.1.3, the number of days when hub spreads exceed transportation tariffs is on the low-er side for many EU borders. Nonetheless, the results confirm the expectation that when spreads exceed tariffs, IP utilisation rates are higher. This is more evident at those IPs less reliant on LTC obligations and hence more used in search of profitable trades, taking into account the relative positions of hub price spreads and tariffs108.
208 Figure 38 does not reveal the incidence of day-ahead bookings, however, when spreads exceed tariffs109. Fig-ure 39 shows that the situations of spreads exceeding tariffs frequently tend to be accompanied by short-term capacity bookings. This is a sign of favourable competitive dynamics. Again, the correlation and extent of both conditions varies across IPs. Nevertheless, the total occurrence of short-term capacity bookings is still very limited, as Figure 2 in the Executive Summary shows.
108 At some analysed IPs, spreads in the dominant direction never exceed tariffs during the year. Moreover, where long-term capacity bookings are very extended, the space for spot capacity contracting following hub price signals is narrowed. CMPs will contribute to put value on the unused capacities.
109 The utilisation ratio for days when DA spreads exceed DA tariffs data series shown in Figure 38 is independent of whether short-term bookings take place or not. Owners of prevailing LTCs also have an incentive to increase their nomination in those days when spreads exceed tariffs.
Utiliz
atio
n ra
tio -
nom
inat
ions
/boo
kings
(%)
100
80
60
40
20
90
70
50
30
100
2016
2017
PL >
DE 20
16
PL >
DE 20
17
SK >
AT 20
16
SK >
AT 20
17
AT >
HU 20
16
AT >
HU 20
17
FR >
ES 20
16
FR >
ES 20
17
AT >
IT 20
16
AT >
IT 20
17
DE >
CZ 20
16
DE >
CZ 20
17
SK >
CZ 20
16
SK >
CZ 20
17
BE >
NL 20
16
BE >
NL 20
17
AT >
SK 20
16
NL >
UK 20
16
NL >
UK 20
17
EU av
erage
Malln
ow
Baum
garte
n
Moso
nmag
yarov
ar
VIP P
IRIN
EOS
Arno
ldstei
n/Tarv
isio
Olbe
rnhau
/Hora
Svate
Kate
riny
Lanz
hot
Zelza
te
Baum
garte
n
Julia
nado
rp
Utilization ratio - yearly average Utilization ratio for those days when DA spread eceed DA reserve tariffsDA spreads never exceed DA reserve tariffs along the year
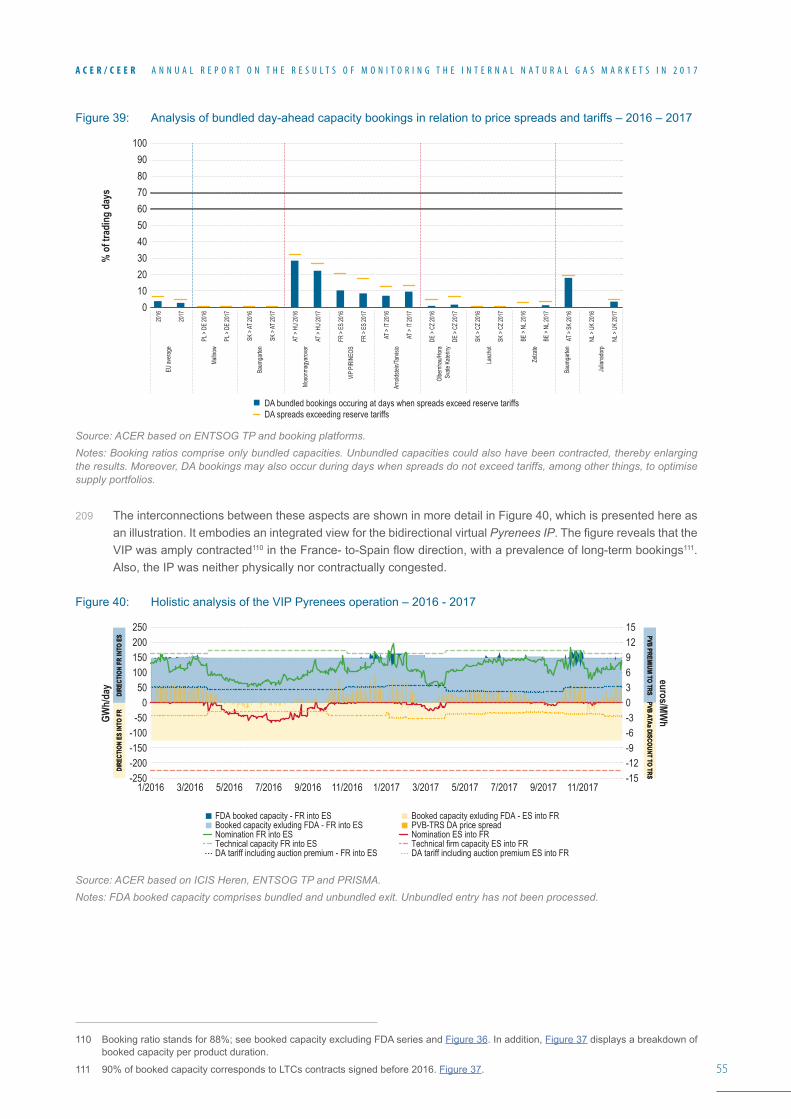
55
A C E R / C E E R A N N U A L R E P O R T O N T H E R E S U L T S O F M O N I T O R I N G T H E I N T E R N A L N A T U R A L G A S M A R K E T S I N 2 0 1 7
Figure 39: Analysis of bundled day-ahead capacity bookings in relation to price spreads and tariffs – 2016 – 2017
Source: ACER based on ENTSOG TP and booking platforms.Notes: Booking ratios comprise only bundled capacities. Unbundled capacities could also have been contracted, thereby enlarging the results. Moreover, DA bookings may also occur during days when spreads do not exceed tariffs, among other things, to optimise supply portfolios.
209 The interconnections between these aspects are shown in more detail in Figure 40, which is presented here as an illustration. It embodies an integrated view for the bidirectional virtual Pyrenees IP. The figure reveals that the VIP was amply contracted110 in the France- to-Spain flow direction, with a prevalence of long-term bookings111. Also, the IP was neither physically nor contractually congested.
Figure 40: Holistic analysis of the VIP Pyrenees operation – 2016 - 2017
Source: ACER based on ICIS Heren, ENTSOG TP and PRISMA.Notes: FDA booked capacity comprises bundled and unbundled exit. Unbundled entry has not been processed.
110 Booking ratio stands for 88%; see booked capacity excluding FDA series and Figure 36. In addition, Figure 37 displays a breakdown of booked capacity per product duration.
111 90% of booked capacity corresponds to LTCs contracts signed before 2016. Figure 37.
% o
f tra
ding
day
s
100
80
60
40
20
90
70
50
30
100
2016
2017
PL >
DE 20
16
PL >
DE 20
17
SK >
AT 20
16
SK >
AT 20
17
AT >
HU 20
16
AT >
HU 20
17
FR >
ES 20
16
FR >
ES 20
17
AT >
IT 20
16
AT >
IT 20
17
DE >
CZ 20
16
DE >
CZ 20
17
SK >
CZ 20
16
SK >
CZ 20
17
BE >
NL 20
16
BE >
NL 20
17
AT >
SK 20
16
NL >
UK 20
16
NL >
UK 20
17
EU av
erage
Malln
ow
Baum
garte
n
Moso
nmag
yarov
ar
VIP P
IRIN
EOS
Arno
ldstei
n/Tarv
isio
Olbe
rnhau
/Hora
Svate
Kate
riny
Lanz
hot
Zelza
te
Baum
garte
n
Julia
nado
rp
DA bundled bookings occuring at days when spreads exceed reserve tariffsDA spreads exceeding reserve tariffs
GWh/
day
DIRE
CTIO
N FR
INTO
ES
DIRE
CTIO
N FR
INTO
ES
DIRE
CTIO
N ES
INTO
FR
DIRE
CTIO
N ES
INTO
FR
PVB PREMIUM TO TRSPVB PREMIUM TO TRS
PVB ATAa DISCOUNT TO TRSPVB ATAa DISCOUNT TO TRS
euros/MWh
250200
-150-100
-500
50
150100
-250-200
1/2016 5/2016 9/2016 1/2017 5/2017 9/20173/2016 7/2016 11/2016 3/2017 7/2017 11/2017
1512
-9-6-303
96
-15-12
FDA booked capacity - FR into ESBooked capacity exluding FDA - FR into ESNomination FR into ESTechnical capacity FR into ESDA tariff including auction premium - FR into ES
Booked capacity exluding FDA - ES into FRPVB-TRS DA price spreadNomination ES into FRTechnical firm capacity ES into FRDA tariff including auction premium ES into FR
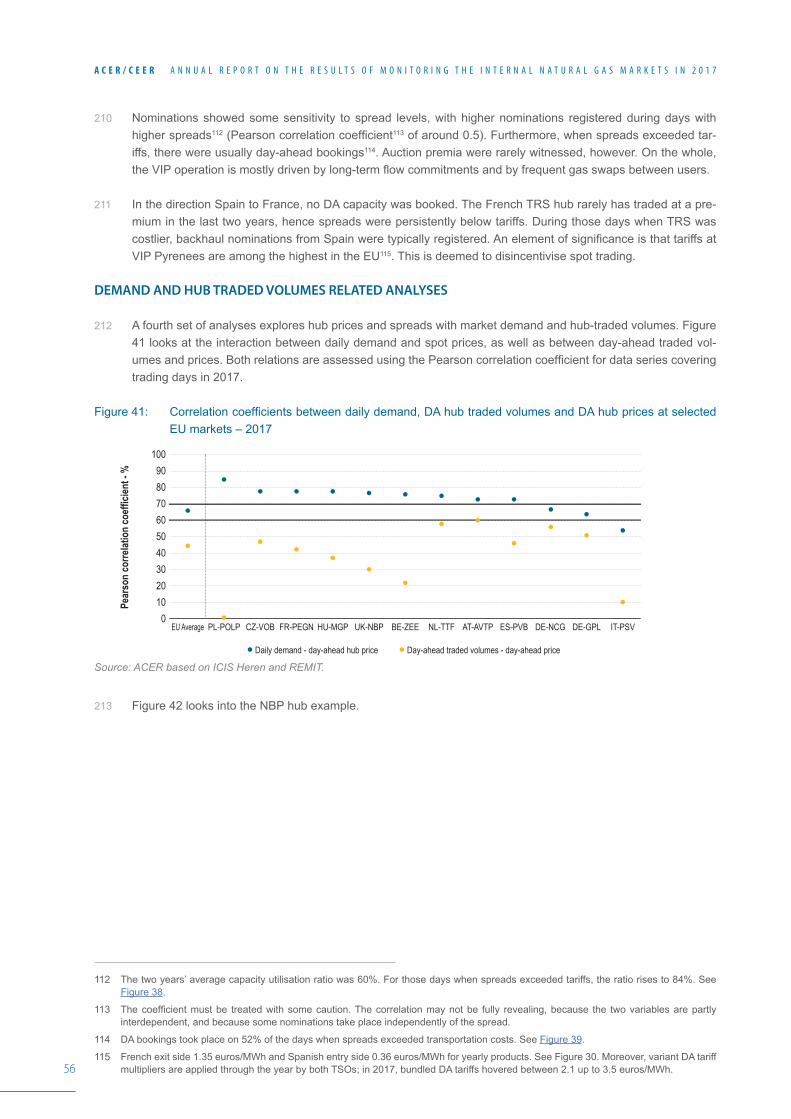
56
A C E R / C E E R A N N U A L R E P O R T O N T H E R E S U L T S O F M O N I T O R I N G T H E I N T E R N A L N A T U R A L G A S M A R K E T S I N 2 0 1 7
210 Nominations showed some sensitivity to spread levels, with higher nominations registered during days with higher spreads112 (Pearson correlation coefficient113 of around 0.5). Furthermore, when spreads exceeded tar-iffs, there were usually day-ahead bookings114. Auction premia were rarely witnessed, however. On the whole, the VIP operation is mostly driven by long-term flow commitments and by frequent gas swaps between users.
211 In the direction Spain to France, no DA capacity was booked. The French TRS hub rarely has traded at a pre-mium in the last two years, hence spreads were persistently below tariffs. During those days when TRS was costlier, backhaul nominations from Spain were typically registered. An element of significance is that tariffs at VIP Pyrenees are among the highest in the EU115. This is deemed to disincentivise spot trading.
DEMAND AND HUB TRADED VOLUMES RELATED ANALYSES
212 A fourth set of analyses explores hub prices and spreads with market demand and hub-traded volumes. Figure 41 looks at the interaction between daily demand and spot prices, as well as between day-ahead traded vol-umes and prices. Both relations are assessed using the Pearson correlation coefficient for data series covering trading days in 2017.
Figure 41: Correlation coefficients between daily demand, DA hub traded volumes and DA hub prices at selected EU markets – 2017
Source: ACER based on ICIS Heren and REMIT.
213 Figure 42 looks into the NBP hub example.
112 The two years’ average capacity utilisation ratio was 60%. For those days when spreads exceeded tariffs, the ratio rises to 84%. See Figure 38.
113 The coefficient must be treated with some caution. The correlation may not be fully revealing, because the two variables are partly interdependent, and because some nominations take place independently of the spread.
114 DA bookings took place on 52% of the days when spreads exceeded transportation costs. See Figure 39.
115 French exit side 1.35 euros/MWh and Spanish entry side 0.36 euros/MWh for yearly products. See Figure 30. Moreover, variant DA tariff multipliers are applied through the year by both TSOs; in 2017, bundled DA tariffs hovered between 2.1 up to 3.5 euros/MWh.
Pear
son
corre
latio
n co
effic
ient -
%
100
80
60
40
20
90
70
50
30
100
EU Average PL-POLP CZ-VOB FR-PEGN HU-MGP UK-NBP BE-ZEE NL-TTF AT-AVTP ES-PVB DE-NCG DE-GPL IT-PSV
Daily demand - day-ahead hub price Day-ahead traded volumes - day-ahead price
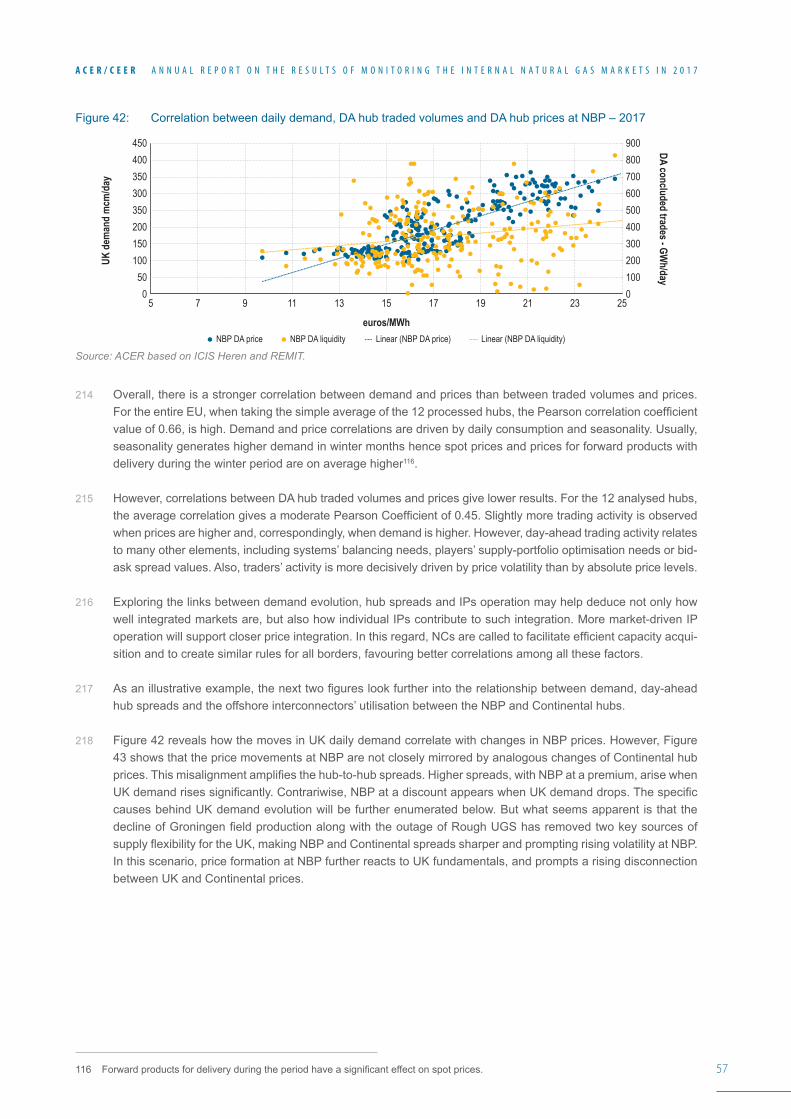
57
A C E R / C E E R A N N U A L R E P O R T O N T H E R E S U L T S O F M O N I T O R I N G T H E I N T E R N A L N A T U R A L G A S M A R K E T S I N 2 0 1 7
Figure 42: Correlation between daily demand, DA hub traded volumes and DA hub prices at NBP – 2017
Source: ACER based on ICIS Heren and REMIT.
214 Overall, there is a stronger correlation between demand and prices than between traded volumes and prices. For the entire EU, when taking the simple average of the 12 processed hubs, the Pearson correlation coefficient value of 0.66, is high. Demand and price correlations are driven by daily consumption and seasonality. Usually, seasonality generates higher demand in winter months hence spot prices and prices for forward products with delivery during the winter period are on average higher116.
215 However, correlations between DA hub traded volumes and prices give lower results. For the 12 analysed hubs, the average correlation gives a moderate Pearson Coefficient of 0.45. Slightly more trading activity is observed when prices are higher and, correspondingly, when demand is higher. However, day-ahead trading activity relates to many other elements, including systems’ balancing needs, players’ supply-portfolio optimisation needs or bid-ask spread values. Also, traders’ activity is more decisively driven by price volatility than by absolute price levels.
216 Exploring the links between demand evolution, hub spreads and IPs operation may help deduce not only how well integrated markets are, but also how individual IPs contribute to such integration. More market-driven IP operation will support closer price integration. In this regard, NCs are called to facilitate efficient capacity acqui-sition and to create similar rules for all borders, favouring better correlations among all these factors.
217 As an illustrative example, the next two figures look further into the relationship between demand, day-ahead hub spreads and the offshore interconnectors’ utilisation between the NBP and Continental hubs.
218 Figure 42 reveals how the moves in UK daily demand correlate with changes in NBP prices. However, Figure 43 shows that the price movements at NBP are not closely mirrored by analogous changes of Continental hub prices. This misalignment amplifies the hub-to-hub spreads. Higher spreads, with NBP at a premium, arise when UK demand rises significantly. Contrariwise, NBP at a discount appears when UK demand drops. The specific causes behind UK demand evolution will be further enumerated below. But what seems apparent is that the decline of Groningen field production along with the outage of Rough UGS has removed two key sources of supply flexibility for the UK, making NBP and Continental spreads sharper and prompting rising volatility at NBP. In this scenario, price formation at NBP further reacts to UK fundamentals, and prompts a rising disconnection between UK and Continental prices.
116 Forward products for delivery during the period have a significant effect on spot prices.
UK d
eman
d m
cm/d
ay
euros/MWh
DA concluded trades - GWh/day
450
50100150200350300350400
05 7 9 11 13 15 17 19 21 23 25
900
100200300400500600700800
0
NBP DA price NBP DA liquidity Linear (NBP DA liquidity)Linear (NBP DA price)
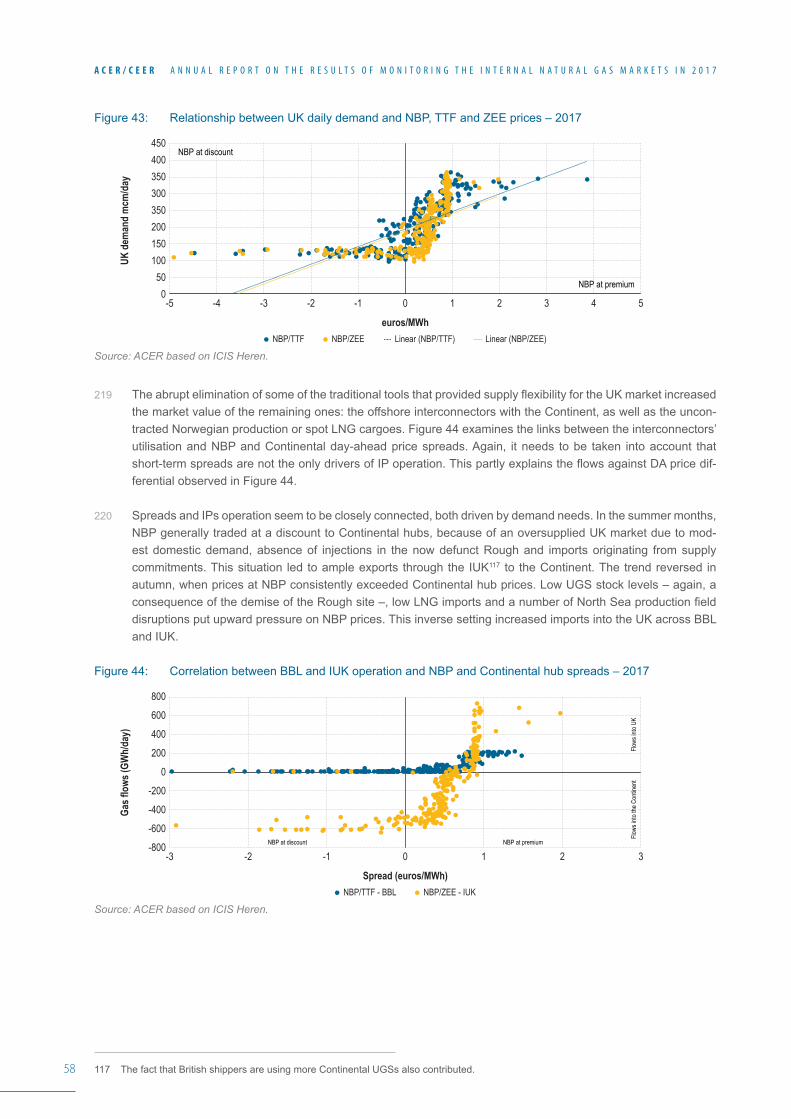
58
A C E R / C E E R A N N U A L R E P O R T O N T H E R E S U L T S O F M O N I T O R I N G T H E I N T E R N A L N A T U R A L G A S M A R K E T S I N 2 0 1 7
Figure 43: Relationship between UK daily demand and NBP, TTF and ZEE prices – 2017
Source: ACER based on ICIS Heren.
219 The abrupt elimination of some of the traditional tools that provided supply flexibility for the UK market increased the market value of the remaining ones: the offshore interconnectors with the Continent, as well as the uncon-tracted Norwegian production or spot LNG cargoes. Figure 44 examines the links between the interconnectors’ utilisation and NBP and Continental day-ahead price spreads. Again, it needs to be taken into account that short-term spreads are not the only drivers of IP operation. This partly explains the flows against DA price dif-ferential observed in Figure 44.
220 Spreads and IPs operation seem to be closely connected, both driven by demand needs. In the summer months, NBP generally traded at a discount to Continental hubs, because of an oversupplied UK market due to mod-est domestic demand, absence of injections in the now defunct Rough and imports originating from supply commitments. This situation led to ample exports through the IUK117 to the Continent. The trend reversed in autumn, when prices at NBP consistently exceeded Continental hub prices. Low UGS stock levels – again, a consequence of the demise of the Rough site –, low LNG imports and a number of North Sea production field disruptions put upward pressure on NBP prices. This inverse setting increased imports into the UK across BBL and IUK.
Figure 44: Correlation between BBL and IUK operation and NBP and Continental hub spreads – 2017
Source: ACER based on ICIS Heren.
117 The fact that British shippers are using more Continental UGSs also contributed.
UK d
eman
d m
cm/d
ay
euros/MWh
450
50100150200350300350400
0-5 -4 -3 -2 -1 0 1 2 3 4 5
NBP/TTF NBP/ZEE Linear (NBP/ZEE)Linear (NBP/TTF)
NBP at premium
NBP at discount
Gas f
lows
(GW
h/da
y)
Spread (euros/MWh)
800
-600
-400
-200
0
200
400
600
-800-3 -2 -1 0 1 2 3
NBP/TTF - BBL NBP/ZEE - IUK
NBP at premiumNBP at discount
Flows
into
UKFlo
ws in
to the
Con
tinen
t
59
A C E R / C E E R A N N U A L R E P O R T O N T H E R E S U L T S O F M O N I T O R I N G T H E I N T E R N A L N A T U R A L G A S M A R K E T S I N 2 0 1 7
CMP EFFECTS
221 Finally, to better understand the implementation effects of the CMP GLs, a brief look is taken at congestion as-pects. The purpose of congestion management procedures is to offer additional capacity at times when booked capacities are not used, thus limiting the potential for capacity hoarding.
222 According to the Agency’s latest Congestion Monitoring Report118, CMPs were in place at the borders of 11 MSs in 2017, four more than in the preceding year. That report provides an overview of where and how these different measures are implemented, and lists the individual congested IP sides.
223 The report lists 17 IP sides where contractual congestion occurred in 2017. Ten other IPs were close to being congested119. This equates to less than 7% of all IPs, which is a lower figure. However, some of the congested IPs are of strategic relevance, and congestion seems to be one of the main causes behind higher hub price spreads among a number of market zones, as identified in Figure 34.
224 Assessing the market effects of CMPs is not obvious. As already stated, the effective application of CMP pro-visions should free capacity for new market participants and limit capacity misuse. This should result in more effective price formation. However, the use of CMPs and their effects are also dependent on the broad market dynamics, which may vary from year to year.
225 For example, both the number of EU IPs where CMPs were applied in 2017 and the days with additional capaci-ties being offered have both increased compared to previous years. This signals advancing implementation, and grounds for greater trust in the fairness of the system’s operation. However, there is no conclusive evidence that contractual congestion has decreased. Those IPs that were contractually congested in previous editions are still congested, probably for structural reasons. In addition, a larger number of IPs with tariff premia at capacity auctions were identified120. Tariff premia are one of the symptoms of congestion, resulting from increasing com-petition among players for capacity acquisition.
226 With efficient application, CMPs will support the optimisation of hub-to-hub trading opportunities. A possible way to try to infer the economic effects of CMPs is by trying to determine how much of the capacities released are subsequently booked and put in use. Linked to this, it is interesting to assess the welfare gains that those trades could have delivered.
227 However, determining whether, and to which extent, any capacity released by CMPs has been subsequently booked is not straightforward. The datasets of the booking platforms do not label a principal (i.e. initially avail-able) or subordinate (i.e. available after CMP release) origin of daily booked capacities121.
228 In order to measure the short-term benefits of CMPs, a simplified approach based on short-term trades can be used. It is to be noticed that calculating the total welfare gains of CMPs should also look into market access and competition aspects, not only short-term trades. In addition, measuring the welfare losses originating from continued congestion would be a different exercise.
118 The purpose of the report is to identify contractual congestion between entry-exit zones on the basis of four distinct conditions. When an IP side is identified as congested, the application of the Firm Day ahead use it or lose it (FDA UIOLI) CMP mechanism will be triggered. See footnote 5.
119 See details about the categorisation and congestion detection criteria used in the report.
120 At 60 EU IPs, at least 1 day-ahead capacity auction resulted in tariff premiums. But these situations can be very day specific, as they are due to particular market scenarios, and do not necessarily trigger the identification of IP congestion.
121 PRISMA has a secondary capacity platform that would help in this identification, but it has attracted limited volumes. A proxy for trying to infer how much DA capacity could have been booked after CMPs application would be a comparison of ENTSOG TP statistics about CMP released capacities with PRISMA booking data.
60
A C E R / C E E R A N N U A L R E P O R T O N T H E R E S U L T S O F M O N I T O R I N G T H E I N T E R N A L N A T U R A L G A S M A R K E T S I N 2 0 1 7
229 To take a concrete example, the German-Austrian Oberkappel IP in the direction into Austria is one of the most frequently contractually congested pipelines. For day-ahead products, auction premia were registered for 202 trading days during the 2016 - 2017 period. This figure includes bundled and unbundled products and all types of capacity. In general, tariff premia were in the range of a few cents, although in the most extreme cases, they went up to 1 euro/MWh122.
230 At Oberkappel, direction into Austria, the total of paid premia – i.e. multiplying all daily-acquired capacity by its associated daily premium – amounted to around 1.1 million euros for both years together. On a comparative basis, the total payments underlying day-ahead capacity acquisition at the IP (reserve prices plus premium, excluding commodity charges) were around 7.8 million euros for the same years.
231 These capacity acquisition costs can be compared with the conceivable gains that could have been obtained from hub-to-hub trading. Again, it is to be reiterated that day-ahead bookings - and even auction premium pay-ments - do not only occur from hub-to-hub trading taking advantage of spread versus tariff levels. They can also occur for either supply portfolio optimisation or balancing purposes. Moreover, and in principle, on those days with more favourable spreads, existing owners of capacity are incentivised to maximise their use, hence limiting CMPs’ application.
232 For the example used, the multiplication of daily positive spreads (i.e. AVTP at a premium) by all daily capacity purchases renders 19.8 million euros – for the two years considered. However, when tariffs are subtracted – this means when multiplying the daily booked capacities by only the part of the daily spreads above paid tariffs123 – the result is 6.9 million euros. In some way it could be inferred that the net economic benefits124 obtained at the Oberkappel IP by booking day-ahead products and devoting them to hub-to-hub trading price arbitrage could have been at most around these 6.9 million euros during the two years. CMPs would have contributed to this.
4.2.2 Assessment of market effects of BAL NC
233 The Agency is tasked to publish the Gas Balancing Network Code Implementation Monitoring Report, which considers the balancing designs implemented in EU MSs and assesses their effectiveness and compliance to the BAL NC125.
234 This Section analyses the potential market effects of the implementation of the BAL NC using the same indica-tors used in the previous edition of the MMR126. The balancing zones analysed are those where the BAL NC was implemented both by October 2015 (Cluster October 2015) and by October 2016 (Cluster October 2016) and for which complete data could be extracted from ENTSOG’s files and the REMIT database127. The period covered is two gas years, i.e. from the 1st of October 2015 to the 31st of September 2017.
235 Figure 45 shows the level of TSO’s intervention in a number of balancing areas taking into account two indica-tors: (a) the number of balancing actions triggered by the TSO and (b) the percentage of days without TSO’s intervention. For the Cluster October 2016, data of the gas year preceding the code’s implementation (gas year 2015/16) are not shown as they were not provided by ENTSOG to the Agency.
122 Bundled capacity reserve tariff in NCG in the AVTP direction amounts to approx. 0.7 euros/MWh.
123 Including capacity charges and premiums. In the assessment, the bundled firm reserve tariff is applied for all types of capacities.
124 Net economic benefits associated with hub-to-hub trading. Considering favourable spreads discounted of new day-ahead bookings’ tariffs (reserve capacity and capacity premium considered). Hub-to-hub price arbitrage also takes place via prevailing capacity bookings.
125 See latest edition of the Agency’s Implementation Monitoring Report of the Gas Balancing Network Code. See footnote 5.
126 See MMR covering 2016, section 4.2.2., pages 51-55.
127 Cluster October 2015: BeLux (Belgium and Luxembourg), NBP (UK), NCG and GPL (Germany), GPN (Denmark), PEG Nord and TRS (France), TTF (the Netherlands) .The BAL NC was implemented by October 2015 also in the balancing zones in Austria, Hungary and Slovenia but for these balancing zones complete data could not be extracted from REMIT and ENTSOG’s databases.
Cluster October 2016: MIBGAS (Spain), OTE (Czech Republic), PSV (Italy). The BAL NC was implemented by October 2016 also in the balancing zones in Croatia and Portugal but for these balancing zones complete data could not be extracted from REMIT and ENTSOGs’ databases.
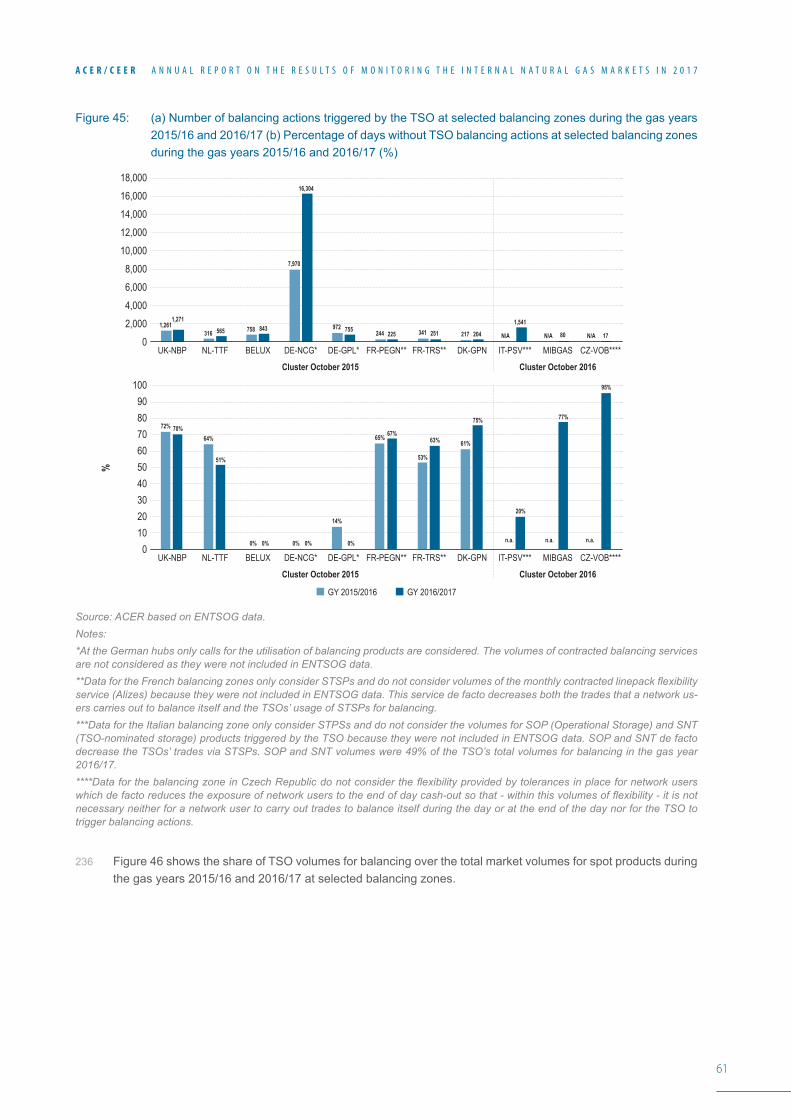
61
A C E R / C E E R A N N U A L R E P O R T O N T H E R E S U L T S O F M O N I T O R I N G T H E I N T E R N A L N A T U R A L G A S M A R K E T S I N 2 0 1 7
Figure 45: (a) Number of balancing actions triggered by the TSO at selected balancing zones during the gas years 2015/16 and 2016/17 (b) Percentage of days without TSO balancing actions at selected balancing zones during the gas years 2015/16 and 2016/17 (%)
Source: ACER based on ENTSOG data.Notes: *At the German hubs only calls for the utilisation of balancing products are considered. The volumes of contracted balancing services are not considered as they were not included in ENTSOG data. **Data for the French balancing zones only consider STSPs and do not consider volumes of the monthly contracted linepack flexibility service (Alizes) because they were not included in ENTSOG data. This service de facto decreases both the trades that a network us-ers carries out to balance itself and the TSOs’ usage of STSPs for balancing.***Data for the Italian balancing zone only consider STPSs and do not consider the volumes for SOP (Operational Storage) and SNT (TSO-nominated storage) products triggered by the TSO because they were not included in ENTSOG data. SOP and SNT de facto decrease the TSOs’ trades via STSPs. SOP and SNT volumes were 49% of the TSO’s total volumes for balancing in the gas year 2016/17.****Data for the balancing zone in Czech Republic do not consider the flexibility provided by tolerances in place for network users which de facto reduces the exposure of network users to the end of day cash-out so that - within this volumes of flexibility - it is not necessary neither for a network user to carry out trades to balance itself during the day or at the end of the day nor for the TSO to trigger balancing actions.
236 Figure 46 shows the share of TSO volumes for balancing over the total market volumes for spot products during the gas years 2015/16 and 2016/17 at selected balancing zones.
18,00016,000
12,000
8,000
4,0002,000
14,000
10,000
6,000
0CZ-VOB****FR-PEGN** FR-TRS** DK-GPNBELUX MIBGASUK-NBP NL-TTF DE-NCG*
Cluster October 2015 Cluster October 2016
Cluster October 2015 Cluster October 2016
DE-GPL* IT-PSV***
CZ-VOB****FR-PEGN** FR-TRS** DK-GPNBELUX MIBGASUK-NBP NL-TTF DE-NCG* DE-GPL* IT-PSV***
GY 2015/2016 GY 2016/2017
%
100
80
60
40
20
90
70
50
30
100
72%
64%
0% 0%
14%
65%
53%
61%
n.a. n.a.
70%
51%
0% 0% 0%
67%63%
75%
20%
77%
95%
n.a.
1,261 316 758
7,970
972 244 341 217 N/A N/A N/A
1,271 565 843
16,304
755 225 251 204
1,541
80 17
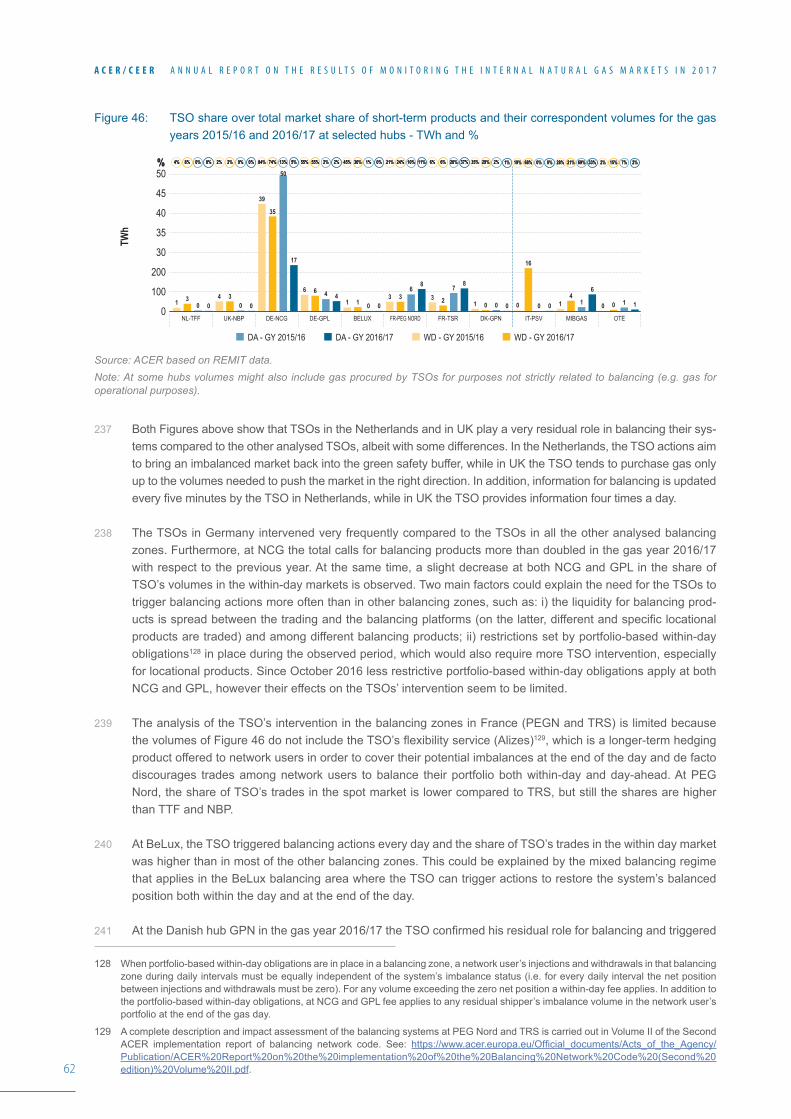
62
A C E R / C E E R A N N U A L R E P O R T O N T H E R E S U L T S O F M O N I T O R I N G T H E I N T E R N A L N A T U R A L G A S M A R K E T S I N 2 0 1 7
Figure 46: TSO share over total market share of short-term products and their correspondent volumes for the gas years 2015/16 and 2016/17 at selected hubs - TWh and %
Source: ACER based on REMIT data. Note: At some hubs volumes might also include gas procured by TSOs for purposes not strictly related to balancing (e.g. gas for operational purposes).
237 Both Figures above show that TSOs in the Netherlands and in UK play a very residual role in balancing their sys-tems compared to the other analysed TSOs, albeit with some differences. In the Netherlands, the TSO actions aim to bring an imbalanced market back into the green safety buffer, while in UK the TSO tends to purchase gas only up to the volumes needed to push the market in the right direction. In addition, information for balancing is updated every five minutes by the TSO in Netherlands, while in UK the TSO provides information four times a day.
238 The TSOs in Germany intervened very frequently compared to the TSOs in all the other analysed balancing zones. Furthermore, at NCG the total calls for balancing products more than doubled in the gas year 2016/17 with respect to the previous year. At the same time, a slight decrease at both NCG and GPL in the share of TSO’s volumes in the within-day markets is observed. Two main factors could explain the need for the TSOs to trigger balancing actions more often than in other balancing zones, such as: i) the liquidity for balancing prod-ucts is spread between the trading and the balancing platforms (on the latter, different and specific locational products are traded) and among different balancing products; ii) restrictions set by portfolio-based within-day obligations128 in place during the observed period, which would also require more TSO intervention, especially for locational products. Since October 2016 less restrictive portfolio-based within-day obligations apply at both NCG and GPL, however their effects on the TSOs’ intervention seem to be limited.
239 The analysis of the TSO’s intervention in the balancing zones in France (PEGN and TRS) is limited because the volumes of Figure 46 do not include the TSO’s flexibility service (Alizes)129, which is a longer-term hedging product offered to network users in order to cover their potential imbalances at the end of the day and de facto discourages trades among network users to balance their portfolio both within-day and day-ahead. At PEG Nord, the share of TSO’s trades in the spot market is lower compared to TRS, but still the shares are higher than TTF and NBP.
240 At BeLux, the TSO triggered balancing actions every day and the share of TSO’s trades in the within day market was higher than in most of the other balancing zones. This could be explained by the mixed balancing regime that applies in the BeLux balancing area where the TSO can trigger actions to restore the system’s balanced position both within the day and at the end of the day.
241 At the Danish hub GPN in the gas year 2016/17 the TSO confirmed his residual role for balancing and triggered
128 When portfolio-based within-day obligations are in place in a balancing zone, a network user’s injections and withdrawals in that balancing zone during daily intervals must be equally independent of the system’s imbalance status (i.e. for every daily interval the net position between injections and withdrawals must be zero). For any volume exceeding the zero net position a within-day fee applies. In addition to the portfolio-based within-day obligations, at NCG and GPL fee applies to any residual shipper’s imbalance volume in the network user’s portfolio at the end of the gas day.
129 A complete description and impact assessment of the balancing systems at PEG Nord and TRS is carried out in Volume II of the Second ACER implementation report of balancing network code. See: https://www.acer.europa.eu/Official_documents/Acts_of_the_Agency/Publication/ACER%20Report%20on%20the%20implementation%20of%20the%20Balancing%20Network%20Code%20(Second%20edition)%20Volume%20II.pdf.
TWh
50
35
30
40
45
200
100
0
%%
NL-TFF UK-NBP DE-GPLDE-NCG DK-GPN IT-PSVBELUX FR-PEG NORD MIBGAS OTEFR-TSR
DA - GY 2016/17DA - GY 2015/16 WD - GY 2016/17WD - GY 2015/16
1 04
0
39
50
6 41 0
36
37
1 0 0 0 1 1 0 130
30
35
17
64
1 03
8
2
8
0 0
16
04
6
0 1
8%8% 0%0% 0%0% 2%2% 2%2% 0%0% 0%0% 84%84% 74%74% 13%13% 5%5% 55%55%55%55% 2%2% 2%2% 45%45% 36%36% 1%1% 21%21% 24%24% 10%10% 11%11% 6%6%6%6% 37%37%26%26% 35%35% 29%29% 2%2% 1%1%4%4% 0%0% 21%21% 69%69% 33%33% 2%2% 15%15% 7%7% 2%2%28%28%19%19% 68%68% 0%0% 0%0%
63
A C E R / C E E R A N N U A L R E P O R T O N T H E R E S U L T S O F M O N I T O R I N G T H E I N T E R N A L N A T U R A L G A S M A R K E T S I N 2 0 1 7
even fewer balancing actions in fewer days and for smaller volumes than in the previous gas year. This is mainly due to the very market oriented balancing system implemented in Denmark, together with the accurate and fre-quent information provided to network users by the TSO. However the TSO’s share of trades in the within-day timeframe is still high, most probably due to the smaller size and liquidity of the Danish market.
242 Given the implementation date of October 2016, it is too early to draw conclusions on the effects of the balancing zones selected in the Cluster October 2016. As an initial observation, Figure 46 shows that the implementation of the BAL NC in those zones could have been the driver of increased spot liquidity (both WD and DA) and of increased TSO’s actions in the spot timeframe (via STSPs).
243 For the Italian balancing zone, the total market spot trades increased both in the within-day and day-ahead time-frame in the gas following the implementation of the BAL NC (gas year 2016/17) (Figure 46). However, the role of the TSO to balance the system seems to be still very central. In the gas year 2016/17, half of the total volumes for balancing130 were procured by the TSO via TSO nominated storage (SNT) and Operational Storage (SOP) services, consisting respectively in: utilisation of storage facilities owned by the same TSO outside of the market dynamics (SNT) and ex-post balancing actions not fully in line with the spirit of the BAL NC, which requires the TSO to use ex-ante products, mainly on the spot markets (SOP).
244 In the gas year 2015/16, the Spanish TSO’s share of day-ahead trades was particularly high compared to the other balancing zones. This was mainly due to a series of measures established by the Spanish Government in order to promote the usage of MIBGAS131. Due to the implementation of the BAL NC in 2016 and the increased trades by market participants at MIBGAS, the role of the TSO for balancing decreased in the gas year 2016/17. For the gas year 2017/18 the market share of the TSO is likely to continue to decrease due to the end of some of the liquidity measures at MIBGAS and to the increased traded volumes from the market participants.
245 The balancing system in the Czech Republic gives network users updates two times per day on their position and on the system’s position. However, still very few actions and volumes were triggered by the TSO for balanc-ing in the gas year 2016/17. This could be explained by two factors: i) at OTE some portfolio-based within-day obligations apply to network users using the pipeline for transit flows; and ii) network users are each given flexibility quantities on each day, depending on the size of their portfolio132. The flexibility quantities reduce the network user’s exposure to cash-out and the consequent need for network users to trade volumes in the spot timeframe to cover their imbalances133.
246 Given the small sample and the limited time of observation, it is not yet feasible to draw firm conclusions from this analysis on the efficiency of balancing systems. However, it transpires that the implementation of the BAL NC is one of the factors increasing market liquidity in the spot timeframes134 and that in some systems the TSO seems to play a more residual balancing role.
130 A complete description and impact assessment of the balancing systems at PSV is carried out in the Third ACER implementation report of balancing network code. See footnote 5.
131 MIBGAS started its operation in December 2015. In order to increase its liquidity, the Spanish Government introduced the following measures: i) the obligation for ENAGAS to buy in 2017 and 2018 at MIBGAS volumes for cushion gas related to a TSO-owned storage field with within-day, day-ahead and month-ahead products; 2) the obligation for ENAGAS to buy operational gas, on a daily basis with day-ahead products, in order to run the compression stations and LNG terminals.
132 The level of gas trading activity and capacities at storage and borders (where OBA arrangements apply) do not generate any flexibility entitlement.
133 A complete description and impact assessment of the balancing systems at OTE is carried out in the Third ACER implementation report of balancing network code. See footnote 5.
134 Other factors influencing the levels of short-term liquidity in a market or balancing zone are for example: the market economics and fundamentals, if a hub is a first mover, the presence of infrastructure, the presence of physical and contractual congestions, the absence of barriers in wholesale markets (e.g. excessive and unclear regulation, absence of political support, lack or not enough transparency)
64
A C E R / C E E R A N N U A L R E P O R T O N T H E R E S U L T S O F M O N I T O R I N G T H E I N T E R N A L N A T U R A L G A S M A R K E T S I N 2 0 1 7
List of figuresFigure 1: Ranking of EU hubs based on monitoring results - 2017 . . . . . . . . . . . . . . . . . . . . . . . . . . . . . . . . . . . . . . . . . . . 6Figure 2: Overview of booking platforms aggregated capacity entry and exit bookings – 2016 –
2017 - TWh/day . . . . . . . . . . . . . . . . . . . . . . . . . . . . . . . . . . . . . . . . . . . . . . . . . . . . . . . . . . . . . . . . . . . . . . . . . . . . . . . 7Figure 3: EU gross gas inland consumption – 2012-2017 - TWh/year and % variation YoY . . . . . . . . . . . . . . . . . . 12Figure 4: EU primary energy consumption -2014 – 2016 - TWh/year and % . . . . . . . . . . . . . . . . . . . . . . . . . . . . . . . . . 12Figure 5: Evolution of biogas production in the EU – 2000-2016 – GWh/year . . . . . . . . . . . . . . . . . . . . . . . . . . . . . . . . 13Figure 6: EU gas supply portfolio by origin - 2017 (100 = 526 bcm, %) . . . . . . . . . . . . . . . . . . . . . . . . . . . . . . . . . . . . . . 14Figure 7: Evolution of international wholesale gas prices, 2009 – April 2018 – euros/MWh . . . . . . . . . . . . . . . . . . . 15Figure 8: 2017 estimated average suppliers’ gas sourcing costs by EU MS and EnC CP and
delta with TTF - euros/MWh . . . . . . . . . . . . . . . . . . . . . . . . . . . . . . . . . . . . . . . . . . . . . . . . . . . . . . . . . . . . . . . . . . . 16Figure 9: EU and EnC cross-border gas flows in 2017 and main differences from 2016 - bcm/year . . . . . . . . . . . 18Figure 10: Daily injections and withdrawals in storage years 2016/17 and 2017/18 - GWh/d . . . . . . . . . . . . . . . . . . 22Figure 11: NBP and TTF forward and actual summer/winter spreads 2010–2018 - euros/MWh . . . . . . . . . . . . . . . . 22Figure 12: Estimated number and diversity of supply sources in terms of the geographical origin of
gas in selected MSs – 2017 - % of actual volumes purchased . . . . . . . . . . . . . . . . . . . . . . . . . . . . . . . . . . . . 25Figure 13: Overview of EU MSs AGTM market health metrics – 2017 . . . . . . . . . . . . . . . . . . . . . . . . . . . . . . . . . . . . . . . 26Figure 14: Traded volumes and CAGR at EU hubs via market platforms – 2012 to 2017 - TWh/year, % . . . . . . . . 28Figure 15: Average day-ahead gas price volatility in selected EU hubs – 2016 and 2017 - % . . . . . . . . . . . . . . . . . . 29Figure 16: Breakdown of traded volumes per product at EU hubs – 2017 - % of traded volumes . . . . . . . . . . . . . . . 30Figure 17: Number of executed trades (daily average) of DA products in 2017 and percentage
change compared to 2016 . . . . . . . . . . . . . . . . . . . . . . . . . . . . . . . . . . . . . . . . . . . . . . . . . . . . . . . . . . . . . . . . . . . . . 31Figure 18: Available median order book volumes of bid- and ask-sides during the day for DA
products in selected EU hubs in ranges of MW – OTC and exchange aggregated – 2017 . . . . . . . . . . . 31Figure 19: Bid-ask spread of day-ahead products, OTC and exchange – 2017 - % of bid price . . . . . . . . . . . . . . . . 32Figure 20: Number of trades (daily average) of month-ahead products in 2017 and percentage
change compared to 2016 . . . . . . . . . . . . . . . . . . . . . . . . . . . . . . . . . . . . . . . . . . . . . . . . . . . . . . . . . . . . . . . . . . . . . 32Figure 21: Available median order book volumes of bid and ask-sides during the day for month-
ahead products in selected EU hubs in ranges of MW – OTC and exchange aggregated – 2017 . . . . 33Figure 22: Bid-ask spread of month-ahead products, OTC and exchange – 2017 - % of bid price . . . . . . . . . . . . . . 33Figure 23: Average trading horizon in selected hubs – 2017 - months. . . . . . . . . . . . . . . . . . . . . . . . . . . . . . . . . . . . . . . . 34Figure 24: Order book horizon in months for bids for forward products for different blocks of MWs - 2017 . . . . . . 34Figure 25: Comparison of hub trades’ concentration and upstream concentration – 2017 . . . . . . . . . . . . . . . . . . . . . . 35Figure 26: Number of market participants in the MA timeframe at selected EU gas hubs and
comparison with consumption and concentration indicators – 2017 . . . . . . . . . . . . . . . . . . . . . . . . . . . . . . . . 36Figure 27: Concentration of selected EU hubs’ spot, prompt and forward markets - 2017 . . . . . . . . . . . . . . . . . . . . . 36Figure 28: Levels of DA price convergence between selected NWE, CEE and Baltic region hubs
year on year – 2015 vs 2017 . . . . . . . . . . . . . . . . . . . . . . . . . . . . . . . . . . . . . . . . . . . . . . . . . . . . . . . . . . . . . . . . . . 40Figure 29: Levels of DA price convergence between selected Mediterranean hubs year on year –
2015 vs. 2017 . . . . . . . . . . . . . . . . . . . . . . . . . . . . . . . . . . . . . . . . . . . . . . . . . . . . . . . . . . . . . . . . . . . . . . . . . . . . . . . . 42Figure 30: Comparison of average gas cross-border transportation tariffs and LNG system access
costs – 2018 – euros/MWh . . . . . . . . . . . . . . . . . . . . . . . . . . . . . . . . . . . . . . . . . . . . . . . . . . . . . . . . . . . . . . . . . . . . . 44Figure 31: Evolution of gas cross-border transportation tariffs – 2013 – 2017 - euros/MWh . . . . . . . . . . . . . . . . . . . . 45Figure 32: Tariff levels at a selection of EU borders – 2017 - euros/MWh . . . . . . . . . . . . . . . . . . . . . . . . . . . . . . . . . . . . . 45Figure 33: Day-ahead price convergence levels in EU hubs compared to reserve daily, premium
daily and yearly transportation tariffs – 2017 – euros/MWh . . . . . . . . . . . . . . . . . . . . . . . . . . . . . . . . . . . . . . . 48Figure 34: Day- ahead price spreads compared to yearly transportation tariffs – 2017 – euros/MWh . . . . . . . . . . . 48Figure 35: Analysis of capacity utilisation ratios (left) and breakdown of contracted capacity (right)
for sampled IPs – 2015 – 2017 . . . . . . . . . . . . . . . . . . . . . . . . . . . . . . . . . . . . . . . . . . . . . . . . . . . . . . . . . . . . . . . . 50Figure 36: Analysis of capacity booking and utilisation ratios for a sample of EU IPs – 2015-2017 . . . . . . . . . . . . . 51Figure 37: Breakdown of contracted capacity per product duration at selected EU IPs – capacity in
use during 2016 and 2017 . . . . . . . . . . . . . . . . . . . . . . . . . . . . . . . . . . . . . . . . . . . . . . . . . . . . . . . . . . . . . . . . . . . . . 51
65
A C E R / C E E R A N N U A L R E P O R T O N T H E R E S U L T S O F M O N I T O R I N G T H E I N T E R N A L N A T U R A L G A S M A R K E T S I N 2 0 1 7
Figure 38: Comparison of EU IPs utilisation rates: yearly average vs. days when spreads exceed tariffs – 2016 – 2017 - % . . . . . . . . . . . . . . . . . . . . . . . . . . . . . . . . . . . . . . . . . . . . . . . . . . . . . . . . . . . . . 54
Figure 39: Analysis of bundled day-ahead capacity bookings in relation to price spreads and tariffs – 2016 – 2017 . . . . . . . . . . . . . . . . . . . . . . . . . . . . . . . . . . . . . . . . . . . . . . . . . . . . . . . . . . . . . . . . . . . . . . . . . . . . . . . . 55
Figure 40: Holistic analysis of the VIP Pyrenees operation – 2016 - 2017 . . . . . . . . . . . . . . . . . . . . . . . . . . . . . . . . . . . . 55Figure 41: Correlation coefficients between daily demand, DA hub traded volumes and DA hub
prices at selected EU markets – 2017 . . . . . . . . . . . . . . . . . . . . . . . . . . . . . . . . . . . . . . . . . . . . . . . . . . . . . . . . . . . 56Figure 42: Correlation between daily demand, DA hub traded volumes and DA hub prices at NBP – 2017 . . . . . . 57Figure 43: Relationship between UK daily demand and NBP, TTF and ZEE prices – 2017 . . . . . . . . . . . . . . . . . . . . 58Figure 44: Correlation between BBL and IUK operation and NBP and Continental hub spreads – 2017 . . . . . . . . . 58Figure 45: (a) Number of balancing actions triggered by the TSO at selected balancing zones during
the gas years 2015/16 and 2016/17 (b) Percentage of days without TSO balancing actions at selected balancing zones during the gas years 2015/16 and 2016/17 (%) . . . . . . . . . . . . . . . . 61
Figure 46: TSO share over total market share of short-term products and their correspondent volumes for the gas years 2015/16 and 2016/17 at selected hubs - TWh and % . . . . . . . . . . . . . . . . . . . . 62
ACER Market Monitoring Report 2017 - Gas Wholesale MarketsVolume
Document title:
Publishing date: 03/10/2018
We appreciate your feedback
Please click on the icon to take a 5’ online surveyand provide your feedback about this document
Share this document