03 chapter 3 - pdfs.semanticscholar.org · 34 chapter 3 the benefits and pitfalls of geographic...
TRANSCRIPT

34
CHAPTER 3
The Benefits and Pitfalls ofGeographic Information Systems inMarine Benthic Habitat Mapping
Gary H. Greene, Joseph J. Bizzarro, Janet E. Tilden,Holly L. Lopez, and Mercedes D. Erdey
AbstractThe application of geographic information system (GIS) technologyto the characterization of marine benthic habitats has greatlyincreased the speed and resolution of seafloor mapping efforts. GIS isa powerful tool for the visualization and imaging of seafloorcharacteristics and has also proven useful for the quantification ofmapped substrate types, determination of slope inclination andrugosity, and other spatial analyses. With the use of GIS, geologistsand digital cartographers can create marine benthic habitat maps toassist scientists and policy-makers in the management of commercialgroundfish stocks and the designation of marine protected areas.However, without a complete understanding of mapping proceduresand the technology used to obtain source data (e.g., multibeamswath bathymetric and backscatter imagery), maps and GIS productsmay be misinterpreted and used in ways that are inappropriate ormisleading.
IntroductionThe use of geographic information systems (GISs) has proven to beextremely effective in the compilation and presentation of maps ofvarious types and scales. GIS technology (especially by ESRI®) ispresently the tool of choice for the scientific community involved inthe mapping of marine benthic habitats because of its flexibility andease in adding, modifying, and analyzing data. However, a lack of properunderstanding and documentation of the quality, manipulation, andlimitations of source data and derivative habitat interpretations is leadingto confusion and potentially inappropriate use of habitat maps presented
Gary H. Greene, Joseph J. Bizzarro, Janet E. Tilden, Holly L. Lopez, andMercedes D. ErdeyCenter for Habitat Studies, Moss Landing Marine Laboratories, 8272 MossLanding Rd., Moss Landing, CA 95039
Corresponding author: [email protected]

The Benefits and Pitfalls of GIS in Marine Benthic Habitat Mapping 35
in GIS. Though the use of GIS in seafloor mapping is still in its earlystages of development, protocols must be established to more clearlyidentify data type, quality, interpretive processes, and authors of habitatinterpretations (genealogy).
Marine benthic habitat maps are critical to state and federal fisheriesagencies for the development of management and conservation policiesand as a basis for habitat-related studies. These maps play a crucial rolein the evaluation, extension, and selection of marine protected areas(MPAs) that are being established to conserve overexploited groundfishspecies (Yoklavich et al., 1997; O’Connell et al., 1998). The demand forthese maps and related GIS products has led to a community-widecompilation and interpretation frenzy. In many cases, groups andagencies have rapidly incorporated, and possibly incompletelydocumented, GIS datasets that are being utilized by government,academic, industry and non-governmental organizations in mappingand monitoring marine benthic habitats and developing managementplans for groundfish species.
Although GIS has facilitated a great increase in the quality andquantity of marine benthic habitat maps, in some cases users areunaware of its limitations. Even when Federal Geographic DataCommittee (FGDC) compliant metadata was included, our map productshave occasionally been misinterpreted and incorrectly used becauseour interpretive processes and/or the quality of source data was notfully understood. Given the widespread compilation and use of habitatmaps and their importance in fisheries management, this could becomea serious problem. The objective of this paper is therefore to brieflydiscuss the advantages, or benefits, and disadvantages, or pitfalls,encountered in using GIS in mapping marine benthic habitats. Possiblesolutions to the problems outlined herein are also suggested.
DiscussionHabitats: DefinitionsThe word “habitat” has been used in many ways and the concept hasinconsistent connotations to scientists of different disciplines. Thefollowing basic definition is found in the Merriam-Webster’s Dictionary(2004): “1.a. the place or environment where a plant or animal naturallyor normally lives and grows. 2. the place where something is commonlyfound.” The Glossary of Geology (Bates and Jackson,1980) provides anonly slightly more specific definition: “the particular environment wherean organism or species tends to live; a more locally circumscribed portionof the total environment.” Essential Fish Habitat is defined in theSustainable Fisheries Act (1996) as: “waters and substrate necessaryfor spawning, breeding, feeding or growth to maturity,” which again isso generally descriptive as not to be very useful. Due to the vague
36 Place Matters
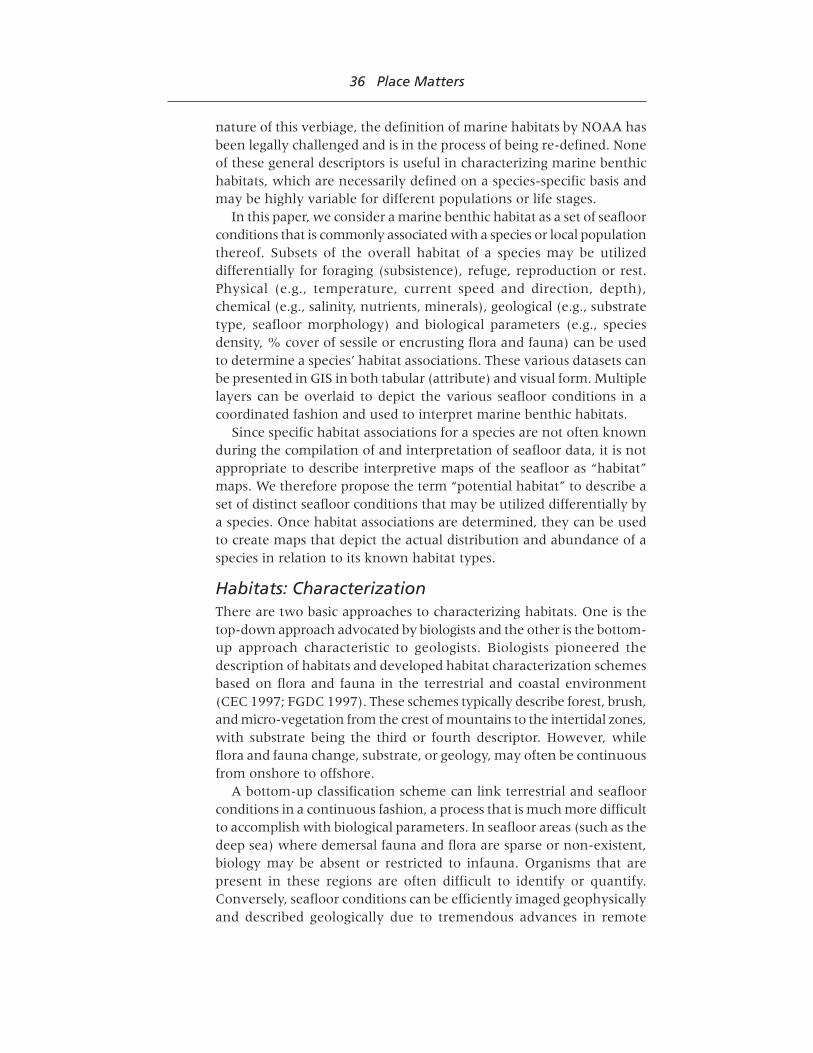
nature of this verbiage, the definition of marine habitats by NOAA hasbeen legally challenged and is in the process of being re-defined. Noneof these general descriptors is useful in characterizing marine benthichabitats, which are necessarily defined on a species-specific basis andmay be highly variable for different populations or life stages.
In this paper, we consider a marine benthic habitat as a set of seafloorconditions that is commonly associated with a species or local populationthereof. Subsets of the overall habitat of a species may be utilizeddifferentially for foraging (subsistence), refuge, reproduction or rest.Physical (e.g., temperature, current speed and direction, depth),chemical (e.g., salinity, nutrients, minerals), geological (e.g., substratetype, seafloor morphology) and biological parameters (e.g., speciesdensity, % cover of sessile or encrusting flora and fauna) can be usedto determine a species’ habitat associations. These various datasets canbe presented in GIS in both tabular (attribute) and visual form. Multiplelayers can be overlaid to depict the various seafloor conditions in acoordinated fashion and used to interpret marine benthic habitats.
Since specific habitat associations for a species are not often knownduring the compilation of and interpretation of seafloor data, it is notappropriate to describe interpretive maps of the seafloor as “habitat”maps. We therefore propose the term “potential habitat” to describe aset of distinct seafloor conditions that may be utilized differentially bya species. Once habitat associations are determined, they can be usedto create maps that depict the actual distribution and abundance of aspecies in relation to its known habitat types.
Habitats: CharacterizationThere are two basic approaches to characterizing habitats. One is thetop-down approach advocated by biologists and the other is the bottom-up approach characteristic to geologists. Biologists pioneered thedescription of habitats and developed habitat characterization schemesbased on flora and fauna in the terrestrial and coastal environment(CEC 1997; FGDC 1997). These schemes typically describe forest, brush,and micro-vegetation from the crest of mountains to the intertidal zones,with substrate being the third or fourth descriptor. However, whileflora and fauna change, substrate, or geology, may often be continuousfrom onshore to offshore.
A bottom-up classification scheme can link terrestrial and seafloorconditions in a continuous fashion, a process that is much more difficultto accomplish with biological parameters. In seafloor areas (such as thedeep sea) where demersal fauna and flora are sparse or non-existent,biology may be absent or restricted to infauna. Organisms that arepresent in these regions are often difficult to identify or quantify.Conversely, seafloor conditions can be efficiently imaged geophysicallyand described geologically due to tremendous advances in remote

The Benefits and Pitfalls of GIS in Marine Benthic Habitat Mapping 37
sensing technology. As a result of these considerations, a geologicalbottom-up characterization of habitats seems more appropriate for deep-water (>~30 m) marine benthic regions.
A GIS-Compatible Classification Scheme for PotentialMarine Benthic HabitatsWe constructed a detailed, GIS-compatible classification scheme forthe characterization of potential marine benthic habitats. Although theclassification scheme is in flux, it is presented for reference purposesalong with an explanation for its use (Appendices 3.1, 3.2). This schemeis generally based on geomorphological and physiographical scales,depth, seafloor induration (hardness), texture and sessile biology.Potential habitats are divided into four types based on size (scale) anddepth: Mega-, Meso-, Macro- and Microhabitats after Greene et al.(1999). Mega-, meso-, and macrohabitats are typically interpreted fromseafloor imagery (e.g., sidescan sonar, multibeam imagery) or geologicdata. Imaging and characterization of microhabitats is typically moredifficult and time-consuming and is usually best accomplished from insitu or video observations.
Data Sources and Map ConstructionMany different types of data are being used to characterize potentialand actual marine benthic habitats (Greene et al., 1995, 1999, 2000;Yoklavich et al., 1995, 2000; Auzende and Greene, 1999; Gordon etal., 2000; Todd et al., 2000; Kostylev et al., 2001). These data rangefrom previously constructed seafloor geologic, geomorphic, geophysical,sediment, biologic and bathymetric maps to remotely collected seafloorimagery (e.g., single beam echosounder, multibeam bathymetric andbackscatter, side-scan sonar, and seismic reflection profile, LIDAR, laser-line scan, and hyperspectral data) and in situ observational andphotographic (video and still photo) data obtained with the use ofsubmersibles, ROVs, camera sleds, or by free diving. As previouslymentioned, these data are used for the interpretation of seafloormorphology and substrate types that can be represented as eitherpotential habitats or actual habitats. Thematic maps depicting substratetypes, benthic habitats, physiography, bathymetry, and morphology canbe constructed from interpretation of remotely and in situ collecteddata. Various spatial analysis tools enable an interpreter using GIS toconstruct maps detailing seafloor complexity and seafloor slope, and toquantify substrate and morphologic features useful in determiningcritical habitat parameters. In the following section, we discuss someof the advantages and disadvantages of the contemporary practice ofmapping potential or actual marine benthic habitats.
38 Place Matters
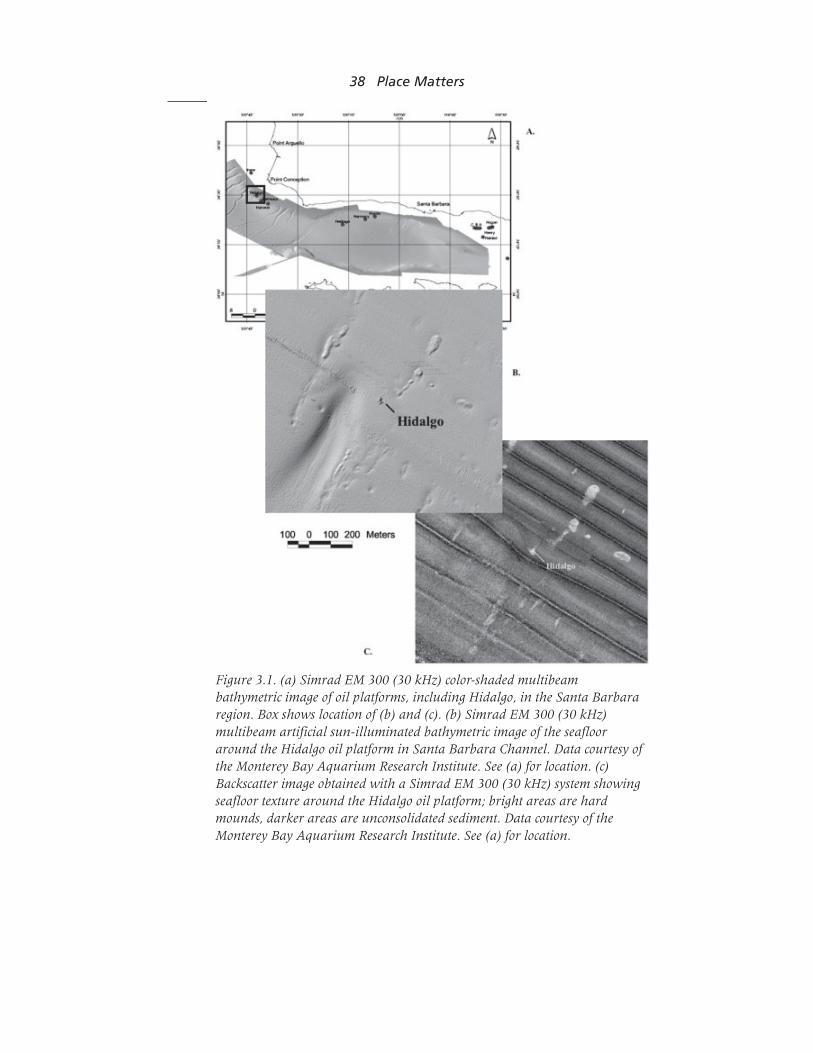
Figure 3.1. (a) Simrad EM 300 (30 kHz) color-shaded multibeambathymetric image of oil platforms, including Hidalgo, in the Santa Barbararegion. Box shows location of (b) and (c). (b) Simrad EM 300 (30 kHz)multibeam artificial sun-illuminated bathymetric image of the seaflooraround the Hidalgo oil platform in Santa Barbara Channel. Data courtesy ofthe Monterey Bay Aquarium Research Institute. See (a) for location. (c)Backscatter image obtained with a Simrad EM 300 (30 kHz) system showingseafloor texture around the Hidalgo oil platform; bright areas are hardmounds, darker areas are unconsolidated sediment. Data courtesy of theMonterey Bay Aquarium Research Institute. See (a) for location.

The Benefits and Pitfalls of GIS in Marine Benthic Habitat Mapping 39
Advantages (Benefits)GIS is an excellent tool for developing basemaps and for layering variousthematic datasets above and below a basemap. Often in deep-waterhabitat mapping, the basemap is a bathymetric map of some sort. Typicalsource data for basemaps consist of either a bathymetric contour mapor a multibeam bathymetric map, commonly presented as an artificial,sun-illuminated relief map (Fig. 3.1a, b), which is digitally constructedfrom x, y, z data that represent accurately positioned soundings. Thesetypes of maps are easily displayed using GIS. The next type of map, oroverlay to the basemap, is typically multibeam backscatter (Fig. 3.1c)or side-scan sonar (Fig. 3.2) imagery, which provides information aboutseafloor texture and substrate types. If geologic data and/or geologicmaps are available, these data can then be incorporated into a GISproject as another layer. Many other datasets and maps can also beincluded and represented. Potential marine benthic habitats areinterpreted from these multiple data layers and the ultimate interpretivemap consists of polygons that have been attributed to distinct habitattypes (Fig. 3.3; see page XX).
Ease of geo-referencing and incorporating maps and data from avariety of sources is a distinct advantage of GIS and facilitates theinclusion of both analog data, which can be scanned and digitized, and
Figure 3.2. Exampleof a side-scan sonarmosaic. This datasetwas collected on thecontinental shelfnorth of Santa Cruz,California. Darkareas are hard rockexposures; light areasare unconsolidatedsediment (likelysand). Data courtesyof DeltaOceanographics, Inc.and Fugro-Pelagos,Inc.

40 Place Matters
digital data. This allows for the utilization of historical data sourcesthat may otherwise be overlooked. Once incorporated into a GIS project,these data can be layered and used collectively as a basis for habitatinterpretations.
GIS is also a convenient tool for updating habitat maps. Because ofthe ease of inputting and layering geo-referenced data, habitat mapscan be readily updated once new data become available. This enablesusers to conduct time-series analyses that may be essential to monitoringstudies. These studies are especially important in areas where dynamicseafloor processes occur and may temporally alter habitats (Fig. 3.4;see page XX).
Excellent quantification and spatial analysis tools are available inGIS programs. With these tools, polygon areas can be quantified andcan be summed by habitat type to determine habitat-specific areas (Fig.3.5; see page XX). Seafloor slope can also be calculated using x,y,z datatypically collected with multibeam systems (Fig. 3.6; see page XX).Rugosity, based on neighborhood statistics, can also be calculated withthese data. Maps derived from these analyses can be constructed andrepresented as thematic layers in a GIS project.
Disadvantages (Pitfalls)Probably the most serious problem in the use of GIS for marine benthichabitat mapping is the lack of attention paid to the type and quality ofdata used to construct a habitat map and the incomplete documentationof the history of data collection, modification, interpretation, andgenealogy. This type of information is included as metadata in eitherread-me files or, more recently, compiled in ArcCatalog®. However,metadata is often isolated from GIS map projects and may not be readilyaccessible or considered by the users. Even when it is easily incorporated(e.g., ArcGIS®) it is presented in a lengthy, written format. One of themain benefits and primary uses of GIS programs is to facilitate thevisualization and incorporation of a wide variety of data sources into aproject. Metadata (especially for data type and quality) should thereforebe displayed in a similar format to increase utilization andcomprehension by the user.
Without detailed knowledge of data type and the quality, it is difficultto assess the accuracy of derivative habitat maps. For example, a habitatmap may have been constructed from a previously published offshoregeologic map that was produced from the interpretation of seismicreflection profiles and seafloor sampling (Fig. 3.7; see page XX).Although closed polygons were constructed, their resolution would besuch that their boundaries in most areas are only approximately located.This map could be merged with higher resolution maps constructedfrom state-of-the-art multibeam bathymetry and backscatter data (Fig.3.8; see page XX) that would then exhibit seamless polygons synthesizedfrom all datasets (Fig. 3.9; see page XX). However, without knowledge
The Benefits and Pitfalls of GIS in Marine Benthic Habitat Mapping 41
of these facts, a user may assume that the habitat map was createdfrom sources of equal quality and therefore should be of uniformaccuracy. It is easy to imagine the pitfalls of this thinking, which couldadversely skew management regulations or other decision-making tasks.
A critical component in the creation of habitat maps is the scale atwhich the source data were interpreted. Without this information, itbecomes very difficult to determine accuracy of habitat interpretations.Although it is possible to infer relative differences in data resolution bythe differing sizes and shapes of delineated polygons (Fig. 3.9), thetrue differences are unobtainable from habitat maps or metadata.
SolutionsWhile metadata is useful for referencing technical information, it isnot visually informative and therefore often overlooked or not wellunderstood, especially by managers and scientists who may not have atechnical understanding of GIS. Some of the most important informationneeded, such as data type, quality, and scale, are best presented visuallyrather than in a written format. We therefore propose that a data typeand quality layer be developed that would correspond to all marinehabitat maps presented in a GIS product. This layer would essentiallybe a map (Fig. 3.10; see page XX) that would exhibit area (with tracklineswhen appropriate), type, and quality of data used in the interpretationof marine benthic habitat maps. Information on data source, collection,associated publications, scale, and genealogy could be listed in theattribute table for this map layer and easily accessed for polygons orregions of interest. This type of metadata presentation would moreefficiently and effectively serve GIS map users in evaluating accuracyand quality and determining data sources.
Conclusions GISs provide excellent tools for the compilation and presentation ofmarine benthic habitat maps. They are especially valuable in exhibitingvarious thematic layers that can be used to compile and manipulatedifferent and disparate datasets in a manner that allows for theconstruction of very comprehensive habitat and other thematic maps(Fig. 3.10). However, the lack of a convenient protocol to clearly andillustratively convey information such as source data type, quality, scale,and genealogy hampers the ability of a user to assess the accuracy andquality of the resultant habitat maps. Inclusion in metadata is anecessary, but circuitous way of displaying this critical information.We, therefore, propose a protocol that consists of a distinct layer withina GIS project that exhibits and lists data type, quality, source, collectiondate, interpretation scale(s), genealogy and associated publications(bibliography) used in the construction of marine benthic habitat maps(Fig. 3.11; see page XX). If adapted by the marine benthic habitatmapping community, a standard methodology would exist to better
42 Place Matters
determine and understand the specific details of seafloor datasets usedin the characterization and assessment of marine benthic habitats.
AcknowledgementsWe wish to thank Lee Murai for his assistance in constructing the figures.Many of the habitat maps and other data presented in this paper arethe result of grants from the Dickinson Foundation, SeaDoc Society(formerly the Marine Ecosystem Health Program) managed at UC Davis,NOAA Coastal Services Center (grant #NA17OC2646), NOAA NationalSea Grant (grant #R/F-181A), NOAA National Marine Fisheries Service,Alaska Department of Fish and Game, and California Department of[]Fish and Game.
ReferencesAuzende, J. M., and Greene, H. G. (eds.), 1999. Marine Benthic
Habitats, Special Issue of Oceanologica Acta, 22(6), 726 pp.Bates, R. L., and Jackson, J. A., 1980. Glossary of Geology, Falls Church,
VA, American Geological Institute, 751 pp.Commission for Environmental Cooperation (CEC), 1997. Ecological
regions of North America: toward a common perspective, Montreal, Quebec,Canada, 71 pp. Map (1:12,500,000).
Federal Geographic Data Committee (FGDC), 1997. National VegetationClassification and Information Standards Approved by FGDC, http://www.nbs.gov/fgdc.veg/standards/vegstd-pr.htm.
Greene, H. G., Yoklavich, M. M., Sullivan, D., and Cailliet, G. M., 1995.A geophysical approach to classifying marine benthic habitats:Monterey Bay as a model, in O’Connell, T., and Wakefield, W. (eds.),Applications of Side-scan Sonar and Laser-line Systems in Fisheries Research,Alaska Dept. Fish and Game Special Publication No. 9, 15-30.
Greene, H. G., Yoklavich, M. M., Starr, R., O’Connell, V. M., Wakefield,W. W., Sullivan, D. L. MacRea, J. E., and Cailliet, G. M., 1999. Aclassification scheme for deep-water seafloor habitats, OceanologicaActa, 22(6): 663-78.
Greene, H. G., Yoklavich, M. M., O’Connell, V. M., Starr, R. M.,Wakefield, W. W., Brylinsky, C. K., Bizzarro, J. J., and Cailliet, G. M.,2000. Mapping and classification of deep seafloor Habitats, ICES 2000Annual Science Conference, Bruges, Belgium, ICES paper CM 2000/T:08.
Gordon, D. C., Jr., Kenchington, E. L. R., Gilkinson, K. D., McKeown, D.L., Steeves, G., Chin-Yee, M., Vass, W. P., Bentham, K., andBoudreau, P. R., 2000. Canadian imaging and sampling technologyfor studying marine benthic habitat and biological communities, ICES2000 Annual Science Conference, Bruges, Belguim, ICES Paper CM2000/T:07.
O’Connell, V., Wakefield, W. W., and Greene, H. G., 1998. The use of ano-take marine reserve in the eastern Gulf of Alaska to protectessential fish habitat, in Yoklavich, M. M. (ed.), Marine HarvestRefugia for West Coast Rockfish: A Workshop, NOAA TechnicalMemorandum. NOAA-TM-NMFSC-255: 125-32.
Merriam-Webster. 2004. Merriam-Webster’s Online Dictionary. http://www.m-w.com/dictionary.htm.
Public Law 104-297. October 11, 1996. Sustainable Fisheries Act.
The Benefits and Pitfalls of GIS in Marine Benthic Habitat Mapping 43
Kostylev, V. E., Todd, B. J., Fader, G. B. J., Courtney, R. C., Cameron, G.D. M., and Pickrill, R. A., 2001. Benthic habitat mapping on theScotian Shelf based on multibeam bathymetry, surficial geology andseafloor photographs, Marine Ecology Progress Series, 219: 121-37.
Todd, B. J., Kostylev, V. E., Fader, G. B. J., et al., 2000. New approachesto benthic habitat mapping integrating multibeam bathymetry andbackscatter, surficial geology and seafloor photographs: A case studyfrom the Scotian Shelf, Atlantic Canada, ICES 2000 Annual ScienceConference, Bruges, Belgium, ICES Paper CM 2000/T:16.
Vedder, J. G, Greene, H. G., Clarke, S. H., and Kennedy, M. P. 1986.Geologic map of the mid-southern California continental margin. inGreene, H. G., and Kennedy, M. P. (eds). California Continental MarginMarine Geologic Map Series. Area 2, Sheet 1. California Division of Minesand Geology, 1:250,000 scale.
Yoklavich, M. M., Cailliet, G. M., Greene, H. G., and Sullivan, D., 1995.Interpretation of side-scan sonar records for rockfish habitat analysis:Examples from Monterey Bay, in O’Connell, T., and Wakefield, W.(eds.). Applications of Side-scan Sonar and Laser-line Systems in FisheriesResearch, Alaska Dept. Fish and Game Special Publication No. 9, 11-14.
Yoklavich, M., Starr, R., Steger, J., Greene, H. G., Schwing, F., andMalzone, C., 1997. Mapping benthic habitats and ocean currents inthe vicinity of central California’s Big Creek Ecological Reserve,NOAA Technical Memorandum, NMFS, NOAA-TM-NMFS-SWFSC-245, 52 pp.
Yoklavich, M. M., Greene, H. G., Cailliet, G. M., Sullivan, D. E., Lea, R.N., and Love, M. S., 2000. Habitat association of deep-waterrockfishes in a submarine canyon: an example of a natural refuge,Fisheries Bulletin, 98: 625-41.
APPENDIX 3.1
Key to Marine Benthic Habitat Classification Scheme(modified after Greene et al., 1999)
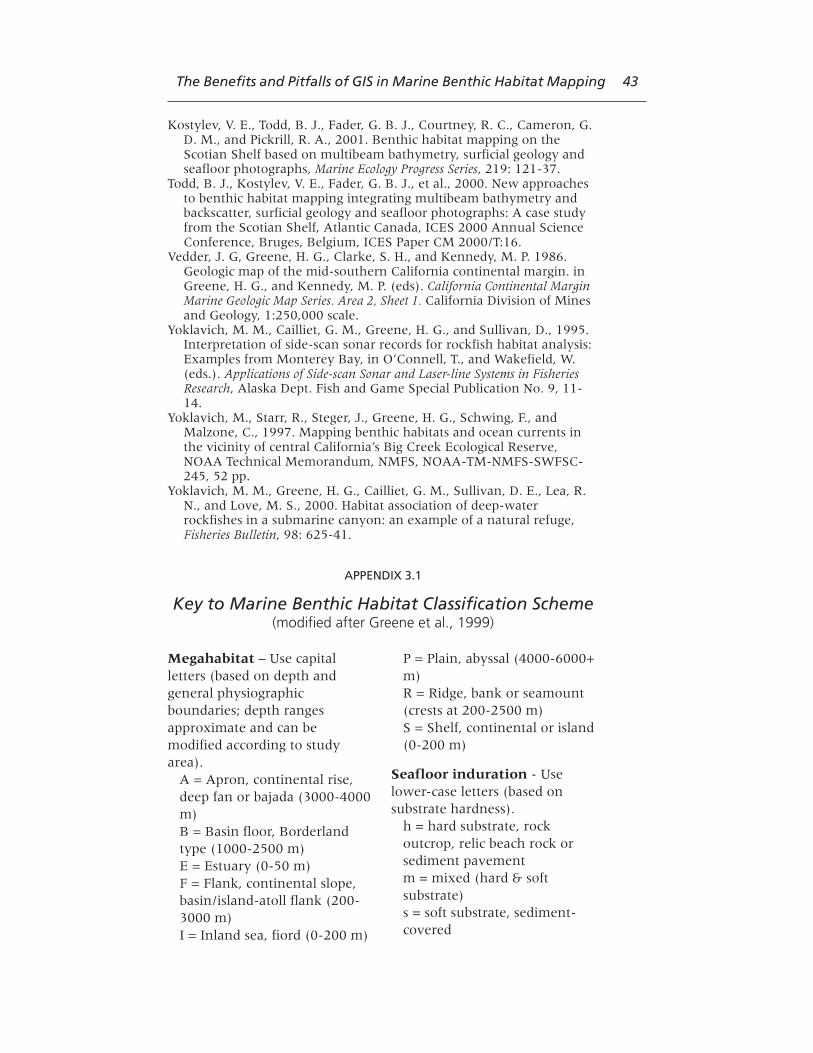
Megahabitat – Use capitalletters (based on depth andgeneral physiographicboundaries; depth rangesapproximate and can bemodified according to studyarea).
A = Apron, continental rise,deep fan or bajada (3000-4000m)B = Basin floor, Borderlandtype (1000-2500 m)E = Estuary (0-50 m)F = Flank, continental slope,basin/island-atoll flank (200-3000 m)I = Inland sea, fiord (0-200 m)
P = Plain, abyssal (4000-6000+m)R = Ridge, bank or seamount(crests at 200-2500 m)S = Shelf, continental or island(0-200 m)
Seafloor induration - Uselower-case letters (based onsubstrate hardness).
h = hard substrate, rockoutcrop, relic beach rock orsediment pavementm = mixed (hard & softsubstrate)s = soft substrate, sediment-covered

44 Place Matters
Sediment types (for aboveindurations) - Use parentheses.
(b) = boulder(c) = cobble(g) = gravel(h) = halimeda sediment,carbonate(m) = mud, silt, clay(p) = pebble(s) = sand
Meso/Macrohabitat - Uselower-case letters (based onscale).
a = atollb = beach, relicc = canyond = deformed, tilted and foldedbedrocke = exposure, bedrockf = flat, floorg = gully, channeli = ice-formed feature ordeposit, moraine, drop-stonedepressionk = karst, solution pit, sinkl = landslidem = mound, depression;includes short, linear ridgesn = enclosed waters, lagoono = overbank deposit (levee)p = pinnacle, volcanic coner = rills = scarp, cliff, fault or slumpt = terracew = sediment wavesy = delta, fanz
# = zooxanthellae hosting
structure, carbonate reef1 = barrier reef2 = fringing reef3 = head, bommie4 = patch reef
Modifier - Use lower-casesubscript letters or underscore(textural and lithologicrelationship).
a = anthropogenic (artificial
reef/breakwall/shipwreck)
b = bimodal (conglomeratic,
mixed [includes gravel, cobblesand pebbles])
c = consolidated sediment(includes claystone, mudstone,siltstone, sandstone, breccia, orconglomerate)
d = differentially eroded
f = fracture, joints-faulted
g = granite
h = hummocky, irregular relief
i = interface, lithologic contact
k = kelp
l = limestone or carbonate
m = massive sedimentary
bedrock
o = outwash
p = pavement
r = ripples
s = scour (current or ice,
direction noted)
u = unconsolidated sediment
v = volcanic rock
Seafloor slope - Use categorynumbers. Typically calculatedfrom x-y-z multibeam data.Category designations representsuggestions and can be modifiedby the user.
1 Flat (0-1º)2 Sloping (1-30º)3 Steeply Sloping (30-60º)4 Vertical (60-90º)5 Overhang (> 90º)
Seafloor complexity - Usecategory letters (in caps).Typically calculated from x-y-zmultibeam slope data usingneighborhood statistics andreported in standard deviationunits. Category designationsrepresent suggestions and can bemodified by the user.
A Very Low Complexity (-1to 0)

The Benefits and Pitfalls of GIS in Marine Benthic Habitat Mapping 45
B Low Complexity (0 to 1)C Moderate Complexity (1to 2)D High Complexity (2 to 3)E Very High Complexity(3+)
Geologic Unit – When possible,the associated geologic unit isidentified for each habitat typeand follows the habitatdesignation in parentheses.
Examples:Shp
d1D(Q/R) - Continental
shelf megahabitat; flat, highlycomplex (differentially eroded)hard seafloor with pinnacles.Geologic unit = Quaternary/Recent.
Fhd_d2C (Tmm) - Continentalslope megahabitat; slopinghard seafloor of deformed(tilted, faulted, folded),differentially eroded bedrock.Geologic unit = TertiaryMiocene Monterey Formation.
APPENDIX 3.2
Explanation for Marine Benthic HabitatClassification Scheme
(modified after Greene et al., 1999)
HABITAT CLASSIFICATION CODEA habitat classification code, based on the deepwater habitatcharacterization scheme developed by Greene et al. (1999), wascreated to easily distinguish marine benthic habitats and to facilitateease of use and queries within GIS (e.g., ArcView®, TNT Mips®, andArcGIS®) and database (e.g., Microsoft Access® or Excel®)programs. The code is derived from several categories and can besubdivided based on the spatial scale of the data. The followingcategories apply directly to habitat interpretations determined fromremote sensing imagery collected at the scale of tens of kilometers toone meter: Megahabitat, Seafloor Induration, Meso/Macrohabitat,Modifier, Seafloor Slope, Seafloor Complexity, and Geologic Unit.Additional categories of Macro/Microhabitat, Seafloor Slope, andSeafloor Complexity apply to areas at the scale of 10 meters tocentimeters and are determined from video, still photos, or directobservations. These two components can be used in conjunction todefine a habitat across spatial scales or separately for comparisonsbetween large and small-scale habitat types. Categories are explainedin detail below. Not all categories may be required or possible giventhe study objectives, data availability, or data quality. In these cases
46 Place Matters
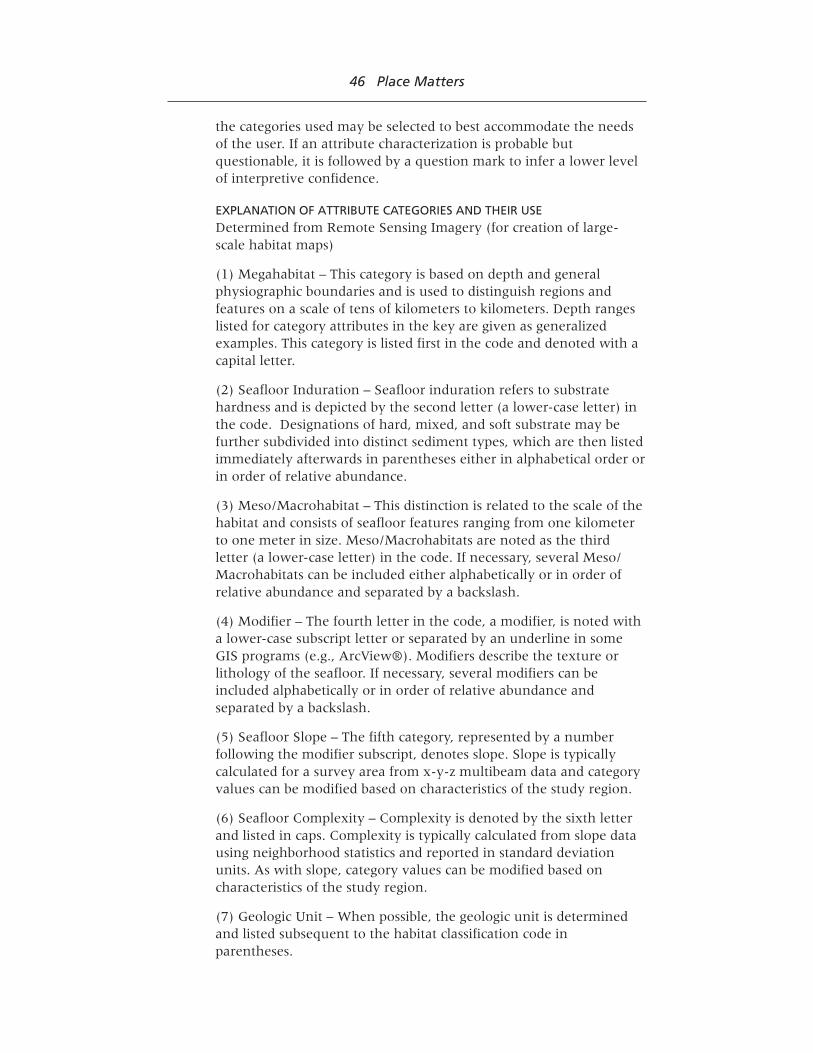
the categories used may be selected to best accommodate the needsof the user. If an attribute characterization is probable butquestionable, it is followed by a question mark to infer a lower levelof interpretive confidence.
EXPLANATION OF ATTRIBUTE CATEGORIES AND THEIR USEDetermined from Remote Sensing Imagery (for creation of large-scale habitat maps)
(1) Megahabitat – This category is based on depth and generalphysiographic boundaries and is used to distinguish regions andfeatures on a scale of tens of kilometers to kilometers. Depth rangeslisted for category attributes in the key are given as generalizedexamples. This category is listed first in the code and denoted with acapital letter.
(2) Seafloor Induration – Seafloor induration refers to substratehardness and is depicted by the second letter (a lower-case letter) inthe code. Designations of hard, mixed, and soft substrate may befurther subdivided into distinct sediment types, which are then listedimmediately afterwards in parentheses either in alphabetical order orin order of relative abundance.
(3) Meso/Macrohabitat – This distinction is related to the scale of thehabitat and consists of seafloor features ranging from one kilometerto one meter in size. Meso/Macrohabitats are noted as the thirdletter (a lower-case letter) in the code. If necessary, several Meso/Macrohabitats can be included either alphabetically or in order ofrelative abundance and separated by a backslash.
(4) Modifier – The fourth letter in the code, a modifier, is noted witha lower-case subscript letter or separated by an underline in someGIS programs (e.g., ArcView®). Modifiers describe the texture orlithology of the seafloor. If necessary, several modifiers can beincluded alphabetically or in order of relative abundance andseparated by a backslash.
(5) Seafloor Slope – The fifth category, represented by a numberfollowing the modifier subscript, denotes slope. Slope is typicallycalculated for a survey area from x-y-z multibeam data and categoryvalues can be modified based on characteristics of the study region.
(6) Seafloor Complexity – Complexity is denoted by the sixth letterand listed in caps. Complexity is typically calculated from slope datausing neighborhood statistics and reported in standard deviationunits. As with slope, category values can be modified based oncharacteristics of the study region.
(7) Geologic Unit – When possible, the geologic unit is determinedand listed subsequent to the habitat classification code inparentheses.