02accy 240 financial stmt analysis summary.ppt chapter 15: financial statement analysis chapter 15...
TRANSCRIPT

15-1
Chapter 15: Financial Statement Analysis
Chapter 15 focuses on financial statement analysis, which is used to assess the financial health of a company. It includes examining trends in key financial data, comparing financial data across companies, and analyzing financial ratios.

15-2
Differences in accounting methods between companies sometimes make it difficult to compare their financial data. For example, if one company values its inventory using the LIFO method and another uses the average cost method, then direct comparisons of financial data, such as inventory valuations and cost of goods sold, may be misleading.
Even with this limitation in mind, comparing financial ratios with other companies or industry averages can provide useful insights.

15-3
Ratios should not be viewed as an end, but rather as a starting point. They raise many questions and point to opportunities for further analysis, but they rarely answer questions by themselves.
In addition to ratios, other sources of data should also be considered, such as industry trends, technological changes, changes in consumer tastes, changes in broad economic factors, and changes within the company itself.

15-4
Learning objective number 1 is to prepare and interpret financial statements in comparative and common‐size form.

15-5
An item on a balance sheet or income statement has little meaning by itself. The meaning of the number can be enhanced by drawing comparisons. This chapter discusses three such means of enabling comparisons:
1. Dollar and percentage changes on statements (also known as horizontal analysis),
2. Common‐size statements (also known as vertical analysis), and
3. Ratios.
15-6
Horizontal analysis (also known as trend analysis) involves analyzing financial data over time.
Quantifying dollar changes over time serves to highlight the changes that are the most important economically.
Quantifying percentage changes over time serves to highlight the changes that are the most unusual.

15-7
The following slides illustrate a horizontal analysis of Clover Corporation’s comparative balance sheets and comparative income statements for this year and last year.

15-8
Assume the comparative asset account balances from the balance sheets as shown.

15-9
The dollar change in account balances is calculated as the current year figure minus the base year figure. The dollar amounts for last year become the “base” year figures.

15-10
The percentage change in account balances is calculated as dollar change divided by the base year figure times 100 percent.

15-11
The dollar and percentage changes in the cash account are computed as shown.

15-12
The dollar and percentage changes for the remaining asset accounts are as shown. Can you calculate these numbers?

15-13
We could do this for the liabilities and stockholders’ equity, but instead, let’s look at the income statement.

15-14
Assume Clover has the comparative income statement amounts as shown.

15-15
The dollar and percentage changes for each account are as shown.

15-16
Sales increased by 8.3%, yet net income decreased by 21.9%.
15-17
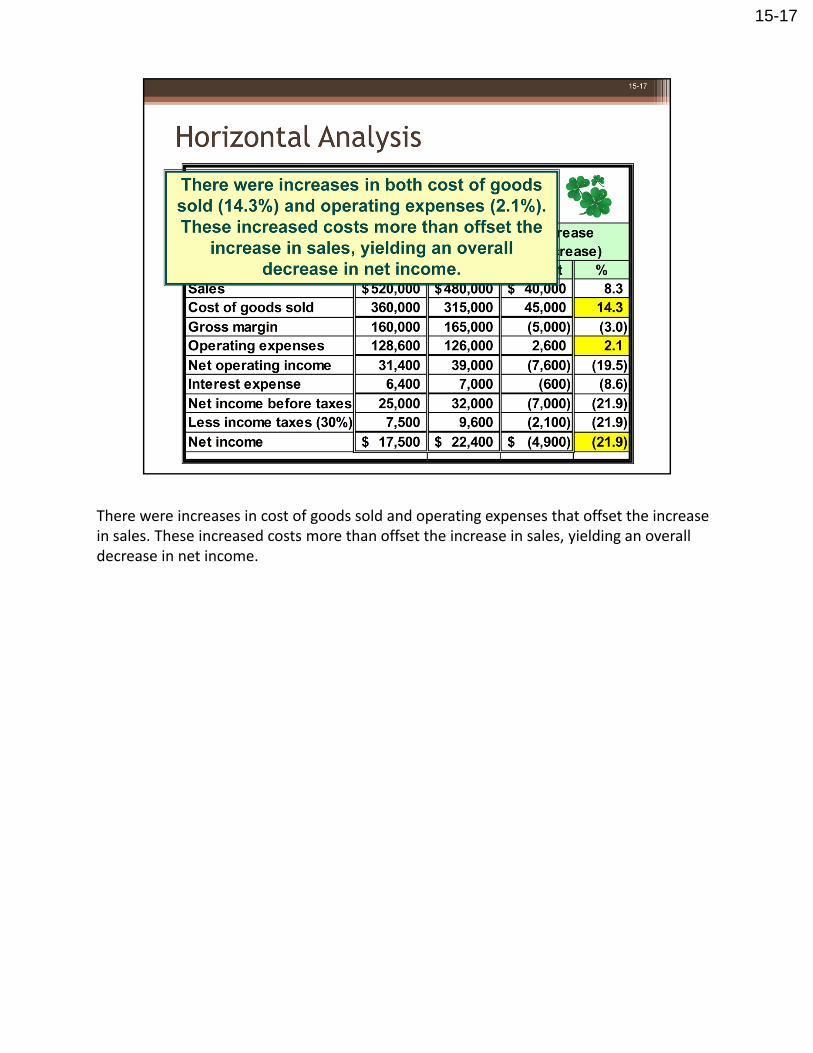
There were increases in cost of goods sold and operating expenses that offset the increase in sales. These increased costs more than offset the increase in sales, yielding an overall decrease in net income.