02 16-13 sumitomochem results-q3
DESCRIPTION
TRANSCRIPT

Sumitomo Chemical Co., Ltd.
February 1, 2013February 1, 2013
Financial Results Financial Results
of of
FY2012 Third QuarterFY2012 Third Quarter

Sumitomo Chemical Co., Ltd.
(Cautionary Statement)Statements made in this material with respect to Sumitomo Chemical’s current plans, estimates, strategies and beliefs that are not historical facts are forward-looking statements about the future performance of Sumitomo Chemical. These statements are based on management’s assumptions and beliefs in light of the information currently available to it, and involve risks and uncertainties. The important factors that could cause actual results to differ materially from those discussed in the forward-looking statements include, but are not limited to, general economic conditions in Sumitomo Chemical’s markets; demand for, and competitive pricing pressure on, Sumitomo Chemical’s products in the marketplace; Sumitomo Chemical’s ability to continue to win acceptance for its products in these highly competitive markets; and movements of currency exchange rates.
Sumitomo Chemical Co., Ltd.

Sumitomo Chemical Co., Ltd.
Financial Summary・・・・・・・・・・・・・・・・・・・・・・
Net Sales by Business Segments・・・・・・・・・
Operating Income by Business Segments・
Extraordinary Gains / Losses・・・・・・・・・・・・・
Consolidated Balance Sheets・・・・・・・・・・・・・
Consolidated Statements of Cash Flows・・
Major Subsidiaries・・・・・・・・・・・・・・・・・・・・・・・・
Financial Estimates for Year・・・・・・・・・・・・・・
Estimates of Net Sales and Operating
Income by Business Segments for Year・・・
Reasons for the Revision・・・・・・・・・・・・・・・・・・
Cost-Cutting measures・・・・・・・・・・・・・・・・・・・・
Consolidated Financial Results of Consolidated Financial Results of FY2012 Third QuarterFY2012 Third Quarter
1
2
3
4
5
6
7
8
9
10
11
ContentsContents
Sumitomo Chemical Co., Ltd.

Sumitomo Chemical Co., Ltd.
Financial SummaryFinancial Summary
11
Unit; billions of yenFY2011
3rd Quarter(year to date)
FY20123rd Quarter
(year to date)Difference Growth
Rate
Net Sales 1,443.9 1,422.3 -21.6 -1.5%
Operating Income 58.3 36.8 -21.6 -37.0%
(Equity in earnings / losses of affiliates,included in ordinary income) (-0.3) (6.0) (6.3) -
(Net gain / loss on foreign currency transactions,included in ordinary income) (-5.9) (1.7) (7.6) -
Ordinary Income 48.5 37.6 -10.9 -22.4%
(Extraordinary Gain / Losses) (-31.5) (-7.9) (23.6) -
(Income taxes) (-17.6) (-58.3) (-40.7) -
(Minority interests in income) (-10.7) (-12.1) (-1.4) -
Net Income -11.3 -40.7 -29.4 -
ROE -2.3% -8.8%
Naphtha Price (yen/KL) 55,200 55,400
Exchange Rate (yen/USD) 78.98 79.95
Sumitomo Chemical Co., Ltd.
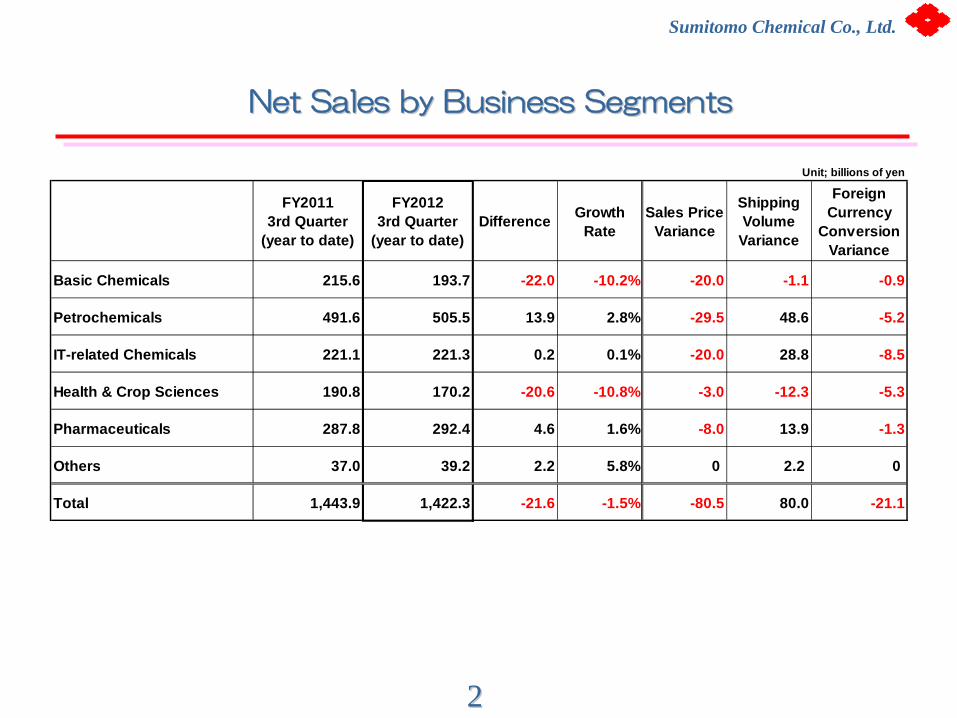
Net Sales by Business SegmentsNet Sales by Business Segments
22
Unit; billions of yen
FY20113rd Quarter
(year to date)
FY20123rd Quarter
(year to date)Difference Growth
RateSales Price
Variance
ShippingVolume
Variance
ForeignCurrency
ConversionVariance
Basic Chemicals 215.6 193.7 -22.0 -10.2% -20.0 -1.1 -0.9
Petrochemicals 491.6 505.5 13.9 2.8% -29.5 48.6 -5.2
IT-related Chemicals 221.1 221.3 0.2 0.1% -20.0 28.8 -8.5
Health & Crop Sciences 190.8 170.2 -20.6 -10.8% -3.0 -12.3 -5.3
Pharmaceuticals 287.8 292.4 4.6 1.6% -8.0 13.9 -1.3
Others 37.0 39.2 2.2 5.8% 0 2.2 0
Total 1,443.9 1,422.3 -21.6 -1.5% -80.5 80.0 -21.1

Sumitomo Chemical Co., Ltd.
Operating Income by Business SegmentsOperating Income by Business Segments
33
Unit; billions of yen
FY20113rd Quarter
(year to date)
FY20123rd Quarter
(year to date)
Basic Chemicals 10.9 -4.8 -15.6 -13.5 0.5 -2.6 -15.6
Petrochemicals 6.3 -1.7 -7.9 -12.0 3.0 1.1 -7.9
IT-related Chemicals 11.3 7.2 -4.1 -21.5 10.5 6.9 -4.1
Health & Crop Sciences 17.5 8.9 -8.6 -3.0 0 -5.6 -8.6
Pharmaceuticals 23.2 37.3 14.0 -8.0 11.0 11.0 14.0
Others & Adjustments -10.9 -10.2 0.7 0 0 0.7 0.7
Total 58.3 36.8 -21.6 -58.0 25.0 11.4 -21.6
Operating Income ShippingVolume
Varianceand Other
Difference PriceVariance
CostVariance Total

Sumitomo Chemical Co., Ltd.
Extraordinary Gains / LossesExtraordinary Gains / Losses
44
Unit; billions of yen
FY20113rd Quarter
(year to date)
FY20123rd Quarter
(year to date)Difference
- 1.5 1.5
1.2 - -1.2
0.2 - -0.2
Extraordinary Gains 1.5 1.5 0
2.9 6.5 3.6
2.4 3.0 0.6
27.8 - -27.8
Extraordinary Losses 33.0 9.4 -23.6
Extraordinary Gains / Losses -31.5 -7.9 23.6
Gain on step acquisitions
Restructuring charges
Impairment loss
Gain on sale of property, plant andequipment
Gain on sale of investment securities
Equity in losses of affiliates

Sumitomo Chemical Co., Ltd.
Consolidated Balance SheetsConsolidated Balance Sheets
55
Unit; billions of yen
31-Mar-12 31-Dec-12 Difference 31-Mar-12 31-Dec-12 Difference
Current Assets 1,102.1 1,066.7 -35.4 Liabilities 1,616.1 1,685.1 69.0
Cash and cash equivalents 147.1 122.5 -24.5 Trade notes and accounts payable 227.8 213.6 -14.2
Trade notes and accountsreceivable 410.9 362.2 -48.7 Interest-bearing liabilities 1,053.0 1,125.4 72.4
Inventories 382.4 409.6 27.2 Others 335.3 346.1 10.8
Others 161.7 172.4 10.7 Net Assets 720.9 672.7 -48.2
Non-current Assets 1,234.9 1,291.0 56.2 Shareholders' equity 589.7 534.9 -54.8
Property, plant and equipment 594.9 622.1 27.2 Accumulated othercomprehensive income -103.4 -98.9 4.5
Intangible assets 142.2 173.6 31.4 Minority interests 234.7 236.7 2.0
Investment and other assets 497.8 495.3 -2.5
Total 2,337.0 2,357.7 20.8 Total 2,337.0 2,357.7 20.8
Shareholders' equity ratio 20.8% 18.5% - 2.3%

Sumitomo Chemical Co., Ltd.
Consolidated Statements of Cash FlowsConsolidated Statements of Cash Flows
66
Unit; billions of yen
FY20113rd Quarter
(year to date)
FY20123rd Quarter
(year to date)Difference
Cash flows from operating activities 102.4 70.0 -32.4
Cash flows from investing activities -95.6 -138.1 -42.5
Free cash flows 6.8 -68.1 -74.8
Cash flows from financing activities -2.5 42.8 45.3
-4.5 -0.4 4.1
-0.2 -25.7 -25.5
151.4 122.5 -28.9
Effect of exchange rate changes on cash andcash equivalents
Net change in cash and cash equivalents
Cash and cash equivalents(as of December 31)

Sumitomo Chemical Co., Ltd.
Major SubsidiariesMajor Subsidiaries
77
FY20113rd Quarter
(year to date)
FY20123rd Quarter
(year to date)
The Polyolefin Company (Singapore)
(millions of USD)
Petrochemical Corporation ofSingapore
(millions of USD)
Rabigh Refining and PetrochemicalCompany
(millions of SAR)
Dongwoo Fine-Chem
(billions of KRW)
Valent U.S.A. and Subsidiaries
(millions of USD)
408
1,127
2,618
36,783
1,590
460
1,006
2,605
46,345
1,737
Decreased due to margin erosion
Increased due to higher sales volume
Remained due to higher sales volumedespite lower selling prices
Decreased, despite strong businessperformance, due to seasonal effectscaused by a change in the company’sfiscal year
Company
Net Sales
Decreased due to margin erosion
Profit Trends

Sumitomo Chemical Co., Ltd.
Financial Estimates for YearFinancial Estimates for Year
88
Unit; billions of yenPreviousEstimates
RevisedEstimates Difference Ratio
Net Sales 2,020.0 1,970.0 -50.0 - 2.5%
Operating Income 65.0 50.0 -15.0 - 23.1%
(Equity in earnings of affiliates,included in ordinary income) (12.0) (6.0) (-6.0) - 50.0%
Ordinary Income 62.0 45.0 -17.0 - 27.4%
Net Income 10.0 -50.0 -60.0 -
ROE 2.1% -10.5%
Naphtha Price (yen/KL) 55,000 56,000
Exchange Rate (yen/USD) 80.00 81.00

Sumitomo Chemical Co., Ltd.
Estimates of Net Sales and Operating Income by Estimates of Net Sales and Operating Income by Business Segments for YearBusiness Segments for Year
99
Unit; billions of yen
PreviousEstimates
RevisedEstimates Difference Previous
EstimatesRevised
Estimates Difference
Basic Chemicals 280.0 265.0 -15.0 -2.0 -7.0 -5.0
Petrochemicals 710.0 700.0 -10.0 1.0 -4.5 -5.5
IT-related Chemicals 310.0 295.0 -15.0 15.0 11.5 -3.5
Health & Crop Sciences 280.0 270.0 -10.0 32.0 30.0 -2.0
Pharmaceuticals 380.0 380.0 0 33.0 33.0 0
Others & Adjustments 60.0 60.0 0 -14.0 -13.0 1.0
Total 2,020.0 1,970.0 -50.0 65.0 50.0 -15.0
Operating IncomeNet Sales

Sumitomo Chemical Co., Ltd.
Reasons for the RevisionReasons for the Revision
・・Reversal of Deferred Tax AssetReversal of Deferred Tax Asset
¥¥
32.4 billion32.4 billion
・・Restructuring Charges & Impairment LossesRestructuring Charges & Impairment Losses
((Restructuring of Petrochemical Business Restructuring of Petrochemical Business
at the Chiba Works, and othersat the Chiba Works, and others))
Approx. Approx. ¥¥
18.0 billion18.0 billion
TotalTotal
Approx. Approx. ¥¥
50.0 billion50.0 billion
10

Sumitomo Chemical Co., Ltd.
CostCost--Cutting measuresCutting measures
1)Reduction in executive compensation 1)Reduction in executive compensation
& manager& manager’’s salaries s salaries
2)Revision of retirement pension plan2)Revision of retirement pension plan
3)Freeze on hiring of experienced personnel3)Freeze on hiring of experienced personnel
4)Drastic reduction of head4)Drastic reduction of head--office fixed costs office fixed costs
11