01a draft rebasebook 2014 20131007 v4 - arizona ... 2014 i october 8, 2013 rebasebook 2014 table of...
TRANSCRIPT

RebaseBook 2014
October 8, 2013
Division of Developmental Disabilities 1789 W. Jefferson
Phoenix, AZ

RebaseBook 2014 i October 8, 2013
RebaseBook 2014 Table of Contents October 8, 2013
Introduction ..........................................................................................................................1 Providing Written Comments ..............................................................................................2 Rebasing Background ..........................................................................................................4
Statutory requirements ...................................................................................................4 Services included in the rebase project ..........................................................................4 Benchmark and Adopted Rates ......................................................................................6 Independent cost models in rate setting .........................................................................7
The Rebasing Process ..........................................................................................................9 Guiding Principles .........................................................................................................9 The Consultant Work Group and Special Studies .......................................................10
Summary of Proposed Changes to Existing Rates .............................................................14 General Methodologies for Rebased Rates ........................................................................21
Wages ...........................................................................................................................21 Employment Related Expenditures (ERE) ..................................................................25 Productivity of Direct Service Staff .............................................................................29 Program Support ..........................................................................................................30 Administrative Expenses .............................................................................................31 Multiple Client Rate Calculation .................................................................................32 Travel Time Calculation ..............................................................................................32 Other Factors ................................................................................................................33
Specific Methodologies for Each Service ..........................................................................35 Home-Based Services ..................................................................................................35 Independent Living Services ........................................................................................38 Day Treatment and Training Services .........................................................................39 Developmental Home Services ....................................................................................43 Group Home Services ..................................................................................................46 Professional Services ...................................................................................................50 Employment Support Services .....................................................................................57 Specialized Habilitation Services ................................................................................62 Transportation Services ...............................................................................................66
Proposed Models for Rebased Rates..................................................................................69 Home-Based Services ..................................................................................................70 Independent Living Services ........................................................................................74 Day Treatment and Training Services .........................................................................75 Developmental Home Services ....................................................................................88 Group Home Services ..................................................................................................91 Professional Services ...................................................................................................99 Employment Support Services ...................................................................................115 Specialized Habilitation Services ..............................................................................133 Transportation Services .............................................................................................141
Proposed Rebased Rate Schedule ....................................................................................147 Home-Based Services ................................................................................................148
RebaseBook 2014 ii October 8, 2013
Independent Living Services ......................................................................................150 Day Treatment and Training Services .......................................................................152 Developmental Home Services ..................................................................................155 Group Home Services ................................................................................................156 Professional Services .................................................................................................158 Employment Support Services ...................................................................................167 Specialized Habilitation Services ..............................................................................170 Transportation Services .............................................................................................172
Appendices 1. Derivation of Rebase Wage Levels .................................................................. A.1-1 2. Employee Related Expense (ERE) .................................................................. A.2-1 3. Productivity Assumptions ................................................................................ A.3-1

RebaseBook 2014 iii October 8, 2013
RebaseBook 2014 Listing of Tables October 8, 2013
Table 1: Services Covered by the SFY 2014 Rebasing ...................................................5 Table 2: History of Benchmark/Adopted Rate Changes ................................................11 SFY 2004 through SFY 2014 Table 3: Percent Change to the Division’s Rate Schedule .............................................12 Proposed Benchmark Rate to SFY 2014 Adopted Exhibit 1: Summary of Proposed Changes to Existing Rates ...........................................17 Table 4: Direct Care Wages Paid Compared to Market .................................................22 Table 5: Direct Care Wages Paid Compared to the ......................................................24 Current Cost Models and the Proposed Rebased Model Table 6: ERE Packages Compared to Various Direct Care Wages Levels ....................26 Table 7: ERE, Agency Providers, Hourly Wages less than $13.00 ...............................27 Table 8: ERE, Agency Providers, Hourly Wages of $13.01 - $19.99 ...........................28 Table 9: ERE, Agency Providers, Hourly Wages of $20.00 (or greater) .......................28 Table 10: Example of the Impact of the Changed Methodology for ..............................32 Calculating Administrative Expenses Table 11: Attendant Care .................................................................................................36 Table 12: Habilitation, Support ........................................................................................36 Table 13: Homemaker ......................................................................................................37 Table 14: Respite, Hourly ................................................................................................37 Table 15: Respite, Day .....................................................................................................37 Table 16: Habilitation, Individually Designed Living Arrangement, Hourly ..................38 Table 17: Habilitation, Individually Designed Living Arrangement, Daily ....................39 Table 18: Day Treatment and Training, Adult (1:3.5) .....................................................42 Table 19: Day Treatment and Training, Children ............................................................42 After-School & Summer Programs (1:3.5) Table 20: Day Treatment and Training, Adult, Rural ......................................................43 Table 21: Day Treatment and Training, Intense ..............................................................43 Table 22: Food Costs .......................................................................................................45 Table 23: Vendor Supported Developmental Home, Adult and Child ............................45 Table 24: Room and Board, .............................................................................................45 Vendor Supported Developmental Home, Adult and Child Table 25: Group Home Daily Mileage Assumption ........................................................46 Table 26: Percentage of HUD Reported Data Used for Rental Payments .......................47 Table 27: Rental Payment Values Used in Room and Board Models .............................47 Table 28: Utility Payment Values Used in Room and Board Models .............................48 Table 29: Maintenance Expense Values Used in Room and Board Models....................48 (Including Maintenance and Household Consumables) Table 30: Food Costs Used in Room and Board Models .................................................48 Table 31: Example of the Monthly and Daily Values Used in Room & Board ...............49 Models, Amounts are Per Person Table 32: Habilitation, Community Protection & Treatment, Group Home ...................49 Table 33: Habilitation, Group Home ...............................................................................49

RebaseBook 2014 iv October 8, 2013
Table 34: Habilitation, Nursing Supported Group Home (Level I) .................................49 Table 35: Home Health Aide ...........................................................................................51 Table 36: Nursing, Visit RN ............................................................................................51 Table 37: Nursing, Visit LPN ..........................................................................................52 Table 38: Nursing, Intermittent RN .................................................................................52 Table 39: Nursing, Intermittent LPN ...............................................................................53 Table 40: Nursing, Continuous/Respite RN ....................................................................53 Table 41: Nursing, Continuous/Respite LPN ..................................................................54 Table 42: Therapy Services, Clinical ...............................................................................54 Table 43: Therapy Services, Natural ................................................................................54 Table 44: Therapy Assistant, Clinical ..............................................................................55 Table 45: Therapy Assistant, Natural ...............................................................................55 Table 46: Respiratory Therapy, Clinical ..........................................................................56 Table 47: Respiratory Therapy, Natural ...........................................................................56 Table 48: Center-Based Employment, Urban (1:3) .........................................................57 Table 49: Center-Based Employment, Rural (1:3) ..........................................................58 Table 50: Group Supported Employment, Urban (1:2) ...................................................58 Table 51: Group Supported Employment, Rural (1:2) .....................................................59 Table 52: Individual Supported Employment, Job Coaching, Urban ..............................59 Table 53: Individual Supported Employment, Job Coaching, Rural ...............................60 Table 54: Individual Supported Employment, Job Development, Urban ........................60 Table 55: Individual Supported Employment, Job Development, Rural .........................60 Table 56: Transition to Employment, Urban ...................................................................61 Table 57: Transition to Employment, Rural ....................................................................61 Table 58: Habilitation with Music Therapy .....................................................................62 Table 59: Habilitation, Consultation Licensed Psychologist Urban ................................63 Table 60: Habilitation, Consultation Licensed Psychologist Rural .................................63 Table 61: Habilitation, Consultation Licensed Behavior Analyst ...................................63 Table 62: Habilitation, Consultation BCBA ....................................................................64 Table 63: Habilitation, Consultation BCABA .................................................................64 Table 64: Habilitation, Early Childhood Autism Specialized (Masters) .........................65 Table 65: Habilitation, Early Childhood Autism Specialized (Bachelors) ......................65 Table 66: Habilitation, Early Childhood Autism Specialized Habilitation Hourly .........65 Table 67: Flat Trip Rate for Regularly Scheduled Daily Trans, Urban ...........................66 Table 68: Flat Trip Rate for Regularly Scheduled Daily Trans, Rural ............................67 Table 69: Single Person Modified, Urban........................................................................67 Table 70: Single Person Modified, Rural .........................................................................68 Table 71: Extensive Transportation .................................................................................68

RebaseBook 2014 1 October 8, 2013
INTRODUCTION The Arizona Department of Economic Security, Division of Developmental Disabilities (the Division or DDD) is required by statute to “rebase” the rates paid to community based providers of services to its members every five years. This RebaseBook documents the rate rebasing activities of the Division that were conducted in SFY 2014 for the services which had rates originally set for services that were not modified in the last five years. . This version of the RebaseBook is being released for public comment, together with the Provider Cost Survey – Final Report. Once public comment has been received and considered, the new Benchmark Rates will be established and submitted to AHCCCS for review. Because the rebase study and establishment of Benchmark Rates are independent of funding considerations, Adopted Rates will not change without additional legislative appropriations. After the establishment of the new Benchmark Rates, a long term strategy will be developed based on funding requirements and availability for the implementation of new Adopted Rates. This RebaseBook is similar to the Division’s RateBook that is published pursuant to statutory directive every time the Division’s rates for community services change. It is important to note that this RebaseBook does not contain the rates that will be paid by the Division during SFY 2014 or SFY 2015. This draft RebaseBook is the documentation of the rebasing effort and the proposed Benchmark Rates for implementation in SFY 2015. This RebaseBook is composed of the following sections: Rebasing Background The Rebasing Process Summary of Proposed Changes to Existing Rates General Methodologies for Rebased Rates Specific Methodologies for Each Service Proposed Models for Rebased Rates Proposed Rebased Rate Schedule Appendices

RebaseBook 2014 2 October 8, 2013
PROVIDING WRITTEN COMMENTS Interested parties may submit their written comments on the rates, the methodologies and assumptions used to determine the rates, and related subjects concerning this rebasing effort. DATES Written comments and opinions on the Rate Rebase Study will be accepted until 11:59 PM (M.S.T.) on November 9, 2013, and will be considered when the changes are to be made final. SUBMISSION OF COMMENTS The Department prefers that comments be submitted electronically at [email protected]. However, you may submit comments, identified by “DDD Rate Rebase 2014”, using any one of the following methods:
1. Email: [email protected] 2. Fax: 602/241-8529 3. Mail: Burns & Associates, Inc.
Attn : Steven Abele 3030 N. 3rd Street, Suite 200 Phoenix, AZ, 85013
4. Hand Delivery: Between 9 a.m. and 5 p.m., Monday through Friday (except
State Holidays). The telephone number is 602/241-8521.
Burns & Associates, Inc. Attn : Steven Abele 3030 N. 3rd Street, Suite 200 Phoenix, AZ, 85013
To avoid duplication, please use only one of these four methods. Please include the following information about the Commenter in the submittal:
First, Middle, and Last Name Mailing Address, including City, State, Postal Code Email Address Phone Number Fax Number Organization’s Name

RebaseBook 2014 3 October 8, 2013
To ensure that comments are best understood, please reference the service and the page number in the document. FOR FURTHER INFORMATION CONTACT Steven Abele Burns & Associates, Inc. Tel: (602) 241-8520 or Holly Bertoli-Brown Navigant Consulting, Inc. Tel: (312) 583-6836

RebaseBook 2014 4 October 8, 2013
REBASING BACKGROUND This section of the RebaseBook presents background information that places the rebase project into context. The section is divided into the following four discussions: Statutory requirements Services included in the rebase project Benchmark and Adopted Rates Independent cost models in rate setting
Statutory Requirements The Division is mandated by law to establish a rate structure for service providers, to review that rate structure annually, and to “perform a complete study of reimbursement rates” every five years1. The statutes prescribe: The rate structure is to ensure “an equitable funding basis for private nonprofit or
for profit agencies”. The annual review is to be performed with the assistance of an independent
consulting firm and the review shall study the “adequacy and appropriateness of … reimbursement rates to service providers for the developmentally disabled program.”
The complete study of reimbursement rates is to occur “no less than every five years”.
The Division is to publish a rate book “to announce the rate structure that shall be incorporated by reference in contracts for client services”.
Services Included in the Rebase Project The Division instituted its community service provider rate structure in SFY 2004. At that time, approximately 20 services had rates set and published2. Since then a number of new services have been added, or existing services have been modified or redefined and added to the rate schedule. Pursuant to state law, the Division has conducted a study of the reimbursement rates initially published for SFY 2004 and any other service developed since then that has not been reviewed or updated in the prior five-year period. The Consultant Work Group (CWG) has developed proposed rebased models and associated rates for those services. The services covered by this rebasing activity are displayed in Table 1 on the following page:
1 See A.R.S. 36-557 K. and A.R.S. 36-2959 2 The count of the number of rates set can vary by how a service is defined, e.g. day treatment for children could be one rate, or two rates depending on whether or not “after school” and “summer” are counted as one rate or two.

RebaseBook 2014 5 October 8, 2013
Table 1 Services Covered by the SFY 2014 Rebasing
Category of Service Specific Services Home-Based Services Attendant Care
Habilitation, Support Homemaker Respite
Independent Living Services
Habilitation, Individually Designed Living Arrangement o Hourly o Daily
Day Treatment and Training Services
Day Treatment and Training – Adult Day Treatment and Training – Child
o After-School o Summer
Rural Day Treatment and Training – Adult Day Treatment and Training – Intense
Developmental Home Services Habilitation, Vendor Supported Development Home (Adult & Child)
Room and Board, Vendor Supported Dev Home (Adult & Child)
Group Home Services Habilitation, Community Protection and Treatment, Group Home Habilitation, Group Home Habilitation, Nursing Supported Group Home Room and Board, All Group Homes
o Urban o Rural
Professional Services Home Health Aide Nursing, Visit Nursing, Intermittent Nursing, Continuous Nursing, Respite Therapy Services, Clinical (PT, OT, SLP) Therapy Services, Natural (PT, OT, SLP) Therapy Service Assistants, Clinical (PTA, OTA, SLPA) Therapy Service Assistants, Natural (PTA, OTA, SLPA) Respiratory Therapy, Clinical Respiratory Therapy, Natural
Employment Support Services Center-Based Employment Group Supported Employment Individual Supported Employment
o Job Coaching o Job Development
Transition to Employment
Specialized Habilitation Services Habilitation with Music Therapy Habilitation, Consultation
o Licensed Psychologist o Licensed Behavior Analyst o BCBA o BCABA
Habilitation, Early Childhood Autism Specialized o Masters o Bachelors o Habilitation
Transportation Services Flat Trip Rate for Regularly Scheduled Daily Transportation o Urban o Rural
Single Person Modified o Urban o Rural
Extensive Transportation

RebaseBook 2014 6 October 8, 2013
Readers interested in the methodologies employed to set the rates for services not included in the SFY 2014 rebase project are referred to the current edition of the Division’s RateBook, released in July of 2013. The definitions of the services that are covered by the rebase project are described in the Division’s Requests for Qualified Vendors Application (RFQVA) DDD 710000. These service definitions can be viewed at https://www.azdes.gov/main.aspx?menu=96&id=10788. The service definitions from this RFQVA were followed during the rebase project to determine various factors to be included/excluded within individual rate models. Rates developed for any new services (e.g. Transition to Employment) utilized proposed service specifications provided by the Division for future incorporation into the RFQVA. The rebase project focused exclusively on rates paid to Qualified Vendors3 (QVs). There are several thousand independent providers in the Division’s service provider network that are not QVs. Independent providers do not employ staff and are legally employed by the Division’s members, although the payments to these providers are funded by the Division and the payments and employment related administrative responsibilities are managed by a Division contracted fiscal intermediary. The rates paid to independent providers are set through the Arizona Independent Rate Assessment Tool and are in part a function of the rates paid to QVs. The Division will revise the independent rate schedule in accordance with the final rates published within this Rebase process. A discussion of the methodology used to set rates for independent providers is contained in the current edition of the Division’s RateBook. Benchmark and Adopted Rates In the past, the Division has used a rate implementation device to harmonize “fair and equitable rates” required by statute with budget realities. The Division defines the fair and equitable rates to be “Benchmark Rates” and the rates actually paid to providers to be “Adopted Rates”. Both rates appear in the Rate Schedule portion of the Division’s RateBook and are noted in the independent models used to derive the rates. Adopted Rates are employed in situations where inflationary adjustments (or rebased rates) are set at levels that cannot be supported by the Division’s annual appropriation (in which case they are set at a level lower than the Benchmark Rate) or in situations where a Benchmark Rate has been reduced and actual payment rates will be frozen or phased in (in which case the Adopted Rate may be higher than the Benchmark Rate). With the Adopted Rate concept the Division has been able to separate the determination of “fair and equitable rates” from the budget process. The rebase project has exclusively focused on the determination of “fair and equitable rates”, i.e. Benchmark Rates. No decisions have been made concerning the implementation of the proposed rebased rates. The Division will consider these final 3 For a discussion of Qualified Vendors go to the Division’s web site at https://www.azdes.gov/ddd

RebaseBook 2014 7 October 8, 2013
recommendations from the CWG and then develop a long term implementation strategy for the Adopted Rates based on funding availability and legislative authority. Independent Cost Models in Rate Setting The Division uses an independent cost model approach to rate setting. In this approach, a model is constructed of the costs providers face in delivering a particular service. In constructing the models, there are five primary cost areas that are modeled for each service: Direct service staff wages Direct service staff employment related expenditures (ERE) The productivity of direct service staff, i.e. the amount of time in each workday
that direct staff time can (or cannot) be charged to member service The program support costs faced by providers (new as a specific category in the
rebased cost models) The administrative expenses faced by providers
Any particular service could have additional cost areas added, but the five enumerated areas represent the basic outline of the cost model for every service. In constructing the specific model for a specific service, the service definition contained in the RFQVA (i.e. the contract with the providers) is reviewed to determine service requirements for that service. For new services (e.g. Transition to Employment), proposed service specifications provided by the Division for future incorporation into the RFQVA were utilized. These specific requirements could include such elements as direct service staff qualifications, training and supervision requirements, the inclusion/exclusion of transportation within the service, and whether the service is facility based or home based. Once the outline of the cost model is determined, the model is populated with data that represents the costs/factors that providers face. The rebase project utilized three broad sources of data for the cost models: a provider survey; special studies; and published sources. Each of these data sources are discussed in more detail throughout this document. The different model components contribute differing amounts to the ultimate rate for a particular service. For perspective, consider the Attendant Care proposed rebased model. In that model, each of the five basic components contributes the following amounts to the final proposed rate: Direct service wages 51.4% Direct service ERE 18.0% Productivity of service staff 9.4% Mileage 3.2% Program support 8.0% Administrative expenses 10.0%

RebaseBook 2014 8 October 8, 2013
This distribution of weights does not hold true for every service for which a rate is set – for example, Group Home Room and Board does not contain any staffing – but generally depicts the fact that for most services direct staff wages and ERE constitute the majority of the expenses that are accounted for in the rates.

RebaseBook 2014 9 October 8, 2013
THE REBASING PROCESS This section of the RebaseBook outlines the process that was used in the rebase project. The section is divided into two discussions: Guiding Principles, the CWG and Special Studies. Guiding Principles In approaching the rebasing project, the Division adopted principles to guide the process. Among the principles adopted were:
Rebasing should be a collaborative process that involves providers, and Division staff.
Rather than relying on a single consulting firm to assist in rebasing, the
Division should engage two firms and have them work collaboratively. Each firm would be assigned special research projects, a subset of the services to be rebased, and perform peer review functions on the other firms’ findings and recommendations.
Continue to use the independent model approach to rate setting. The Division
believes that the independent model approach makes decisions and logic transparent, and allows data to be verified by independent parties.
The goal of the rebase project is a valid and sustainable rate structure. As
such, the consultants and the Division’s project team should:
o “Play it down the middle of the fairway”; that is, let the data and common sense dictate the outcome of the rebasing activity without regard to the direction or degree to which existing rates might change.
o Determine rates independent of the budgetary impact. o Perform a survey of providers and allow the data pulled from the
survey to guide (though not necessarily determine) the decisions in building independent models.
o Verify, to the extent possible, the information collected through the survey with independent data sources. Such sources can then be referenced in the future for updating the models.
In the rebasing process the Division did indicate one area of bias that the models should address: direct service staff compensation and training. The Division believes that direct service staff ensures the continuity of care and the daily health and safety of its members. Therefore it is important that the cost models reflect appropriate wages, benefits and training hours for these key personnel. In the case of “close calls” in making decisions in these three areas, the Division instructed the CWG to fully appreciate the importance it placed on these components of the rate models.
RebaseBook 2014 10 October 8, 2013
The Consultant Work Group and Special Studies Each consulting firm was assigned a list of services for which it was responsible for collecting or compiling data and making recommendations to the project team. The Division project staff along with the CWG reviewed data and recommendations and generally reached consensus positions on all factors and methodologies used in the models. In addition to assigning each of the firms to specific service categories for primary work in rate development, the Division commissioned eight special studies or areas of investigation. Those five areas were: Provider focus groups pertaining to varying services and/or service groups, A summary of Division rate changes since the inception of the rate schedule, A wage analysis for direct care staff, A provider survey, Impact of the Affordable Care Act on provider costs, Review of the operation and costs of Habilitation, Nursing Supported Group
Homes, Review of the operation and costs of Habilitation, Community Protection and
Treatment, Group Homes, Medicare eligibility and the potential impact Third Party Liability billings for
some services, and A review of Intermediate Care Facility (ICF-IDD) rate structure
Focus Groups As part of the Rebase project, the Division requested the CWG lead a series of service provider focus group meetings. The plan included sessions over four (4) weeks throughout the project that would address the following topics:
Week 1: Introduction to the Project; Rate model structure & methodology; Introduction of the provider survey
Week 2: Review of the provider survey materials; Feedback on rate model structure
Week 3: Review of provider survey results Week 4: Review of DRAFT rate models
Each topic was presented to sixteen (16) separate groups and discussed during meetings scheduled for three hours each. To date, the CWG has conducted the meetings and separate documentation regarding the discussion topics and issues raised will be made available in a document separate from this treatment.
RebaseBook 2014 11 October 8, 2013
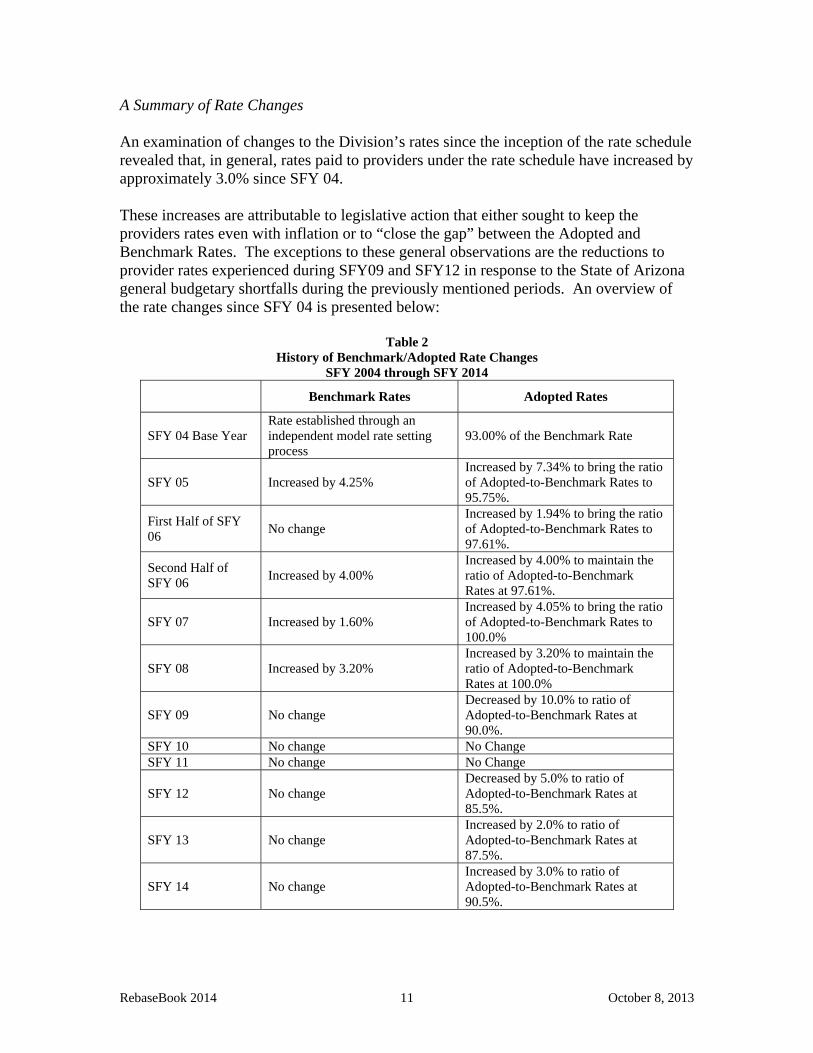
A Summary of Rate Changes An examination of changes to the Division’s rates since the inception of the rate schedule revealed that, in general, rates paid to providers under the rate schedule have increased by approximately 3.0% since SFY 04. These increases are attributable to legislative action that either sought to keep the providers rates even with inflation or to “close the gap” between the Adopted and Benchmark Rates. The exceptions to these general observations are the reductions to provider rates experienced during SFY09 and SFY12 in response to the State of Arizona general budgetary shortfalls during the previously mentioned periods. An overview of the rate changes since SFY 04 is presented below:
Table 2 History of Benchmark/Adopted Rate Changes
SFY 2004 through SFY 2014
Benchmark Rates Adopted Rates
SFY 04 Base Year Rate established through an independent model rate setting process
93.00% of the Benchmark Rate
SFY 05 Increased by 4.25% Increased by 7.34% to bring the ratio of Adopted-to-Benchmark Rates to 95.75%.
First Half of SFY 06
No change Increased by 1.94% to bring the ratio of Adopted-to-Benchmark Rates to 97.61%.
Second Half of SFY 06
Increased by 4.00% Increased by 4.00% to maintain the ratio of Adopted-to-Benchmark Rates at 97.61%.
SFY 07 Increased by 1.60% Increased by 4.05% to bring the ratio of Adopted-to-Benchmark Rates to 100.0%
SFY 08 Increased by 3.20% Increased by 3.20% to maintain the ratio of Adopted-to-Benchmark Rates at 100.0%
SFY 09 No change Decreased by 10.0% to ratio of Adopted-to-Benchmark Rates at 90.0%.
SFY 10 No change No Change SFY 11 No change No Change
SFY 12 No change Decreased by 5.0% to ratio of Adopted-to-Benchmark Rates at 85.5%.
SFY 13 No change Increased by 2.0% to ratio of Adopted-to-Benchmark Rates at 87.5%.
SFY 14 No change Increased by 3.0% to ratio of Adopted-to-Benchmark Rates at 90.5%.

RebaseBook 2014 12 October 8, 2013
The estimated impact of the proposed Benchmark Rates is presented in Table 3.
Table 3 Percent Change to the Division’s Rate Schedule
Proposed Benchmark Rates to SFY 2014 Adopted Rates
CWG Rebase Rates
% Increase Dollar Increase HCBS Agency 46.5% $85,370,477 EI & Day Treatment 13.6% $6,302,320 Residential 22.0% $41,372,718 Professional 50.1% $28,219,419 Employment 39.8% $6,467,977 Spec. Habilitation 125.5% $694,150 Transportation 49.8% $4,379,085 Grand Total 25.6% $172,806,147
A Direct Care Staff Wage Analysis The direct care staff wage analysis examined data published by the Bureau of Labor Statistics (BLS) from May of 2012. The examination was undertaken because wages, and the associated employee benefits, determine approximately 70% of the rate set through the use of the independent models. The wage analysis conducted for the rebasing project estimated the level of direct care service as compared to the market. The three overarching conclusions from the study were:
Providers are generally paying below the 25th percentile of the market The largest differences between market and direct service staff compensation
levels are in the Day Treatment and Group Home services The assumptions used in the (rebased) models are generally above the
provider survey responses and set at the midpoint between the 25th and the 50th percentile of the market study
The summary of the direct care staff wage analysis is contained as Appendix I. A Provider Survey A survey of providers was sent to 526 Qualified Vendors contracted with the Division and was “in the field” for approximately 85 days. Providers in attendance at Focus Group meetings were involved in reviewing the questions and these providers were enlisted to encourage providers to complete the survey. Overall, 78 providers completed and returned completed surveys. However, these providers represented 35% of the payments for the rebased services in SFY 12 and included 4 of the 10 largest providers, and 12 of the 25 largest providers. In summary, the compilation of the survey data suggested that:

RebaseBook 2014 13 October 8, 2013
Wages paid to direct care staff are lower than the wage levels contained in the Division’s current rate setting models, with the most significant deviation occurring in day treatment services
All in-home services appear to be treated as interchangeable by providers – that is, there appears to be little wage difference for direct care staff across the in-home services
Similarly, there appears to be no difference in wages for the community protection and regular group home services
A separate document has been prepared that summarizes the results of the provider survey and is available on the Division’s web site at http://www.azdes.gov/ddd.

RebaseBook 2014 14 October 8, 2013
SUMMARY OF PROPOSED CHANGES TO EXISTING RATES The following discussion outlines various assumptions that are generally represented throughout all of the models developed for the services reviewed during the Rebase project. Productivity Factors: Productivity factors are derived to portray the required activities of Direct Care staff for which QVs may not bill for. Productivity provides a factor that positively impacts staff compensation to ensure adequate funding is available to QVs for service delivery. Training: Rebase service models include an adjustment for training. Most all non-professional services include an adjustment of 40 hours annually for training while all professional services include an adjustment of 56 hours annually. The only service as an exception to this rule is the Day Treatment and Training program for children due to the general nature of the employment and service delivery. Generally this factor was determined based upon an assumption that staff remain employed (on average) for a period of three years. Employer Time: Rebase service models generally include an adjustment equivalent to one-half hour per week. This assumption is the basis to allow QVs to include non-billable time for Direct Staff to attend various activities including (but not limited to) staff meetings, supervisory time or other business operations involving direct staff that would not allow these staff to provide direct services. Transportation/Mobility Costs: The Division has modified the In-Home services rate models, including Attendant Care, Habilitation Support, Homemaker, Respite hourly and daily, to include a cost factor for ‘community mobility’. The allowance (per shift) is the costs incurred to allow for staff to accompany members on community integration activities (e.g. bus, light rail, etc.). Curriculum Development Costs: The curriculum development cost for all Day Programs that was previously shown separately in the rate models has been removed. In its place, all rate models, including those for Day Programs, have been modified to include an additional cost for program support that is intended to encompass these costs. Enhanced Mileage Rate: The Enhanced Mileage Rate (EMR) for Day Programs, Group Home and Transportation services have been modified based upon additional data and input from stakeholders. The details of the changes can be reviewed in the particular sections describing the EMR.

RebaseBook 2014 15 October 8, 2013
Program Support Costs: The Division has modified the approach for capturing program costs in the rate models for all rebased services. The program support factor is 8% for all services except professional services, which include a factor of 4% for program support. Professional services include all nursing and therapy services and some specialized habilitation services. Program support costs represent 8% or 4% of the overall Benchmark Rate for each service, as applicable. Administrative Costs: The Division has modified the calculation of administrative costs for all of the rebased services. Administrative costs equal 10% of the overall Benchmark Rate for each service. Previously, administrative costs were calculated as an add-on of 10% based on the non-travel costs for each service. There may be additional changes to individual rate models not listed here. This listing is intended to provide highlights of the changes included within these materials. For detail on any individual service, please refer to the section discussing the service. Results: Exhibit 1 presents the rebase rates for the services that have been reviewed to date. Also presented on the Exhibit are the original Benchmark Rates (effective at implementation for the individual service) and the SFY14 Adopted Rates that are currently in effect for each service. In general, the proposed rebased rates are higher than the SFY14 Adopted Rates. The notable exception is the Developmental Home category of service. The Developmental Home category of services is proposed to decline by the following amounts for the following specific services. For more specific details on the factors impact these rates please refer to the SPECIFIC METHODOLOGIES FOR REBASED RATES, Developmental Home section on page 41 of this document. Vendor Supported Developmental Home, Adult: approximately 6.5% Vendor Supported Developmental Home, Child: approximately 8.3%
Other services that are proposed to decline include: Group Supported Employment:
o 1:2 ratio (Urban): approximately 1.2% o 1:2 ratio (Rural): approximately 10.3% o 1:3 ratio (Rural): approximately 1.3%
Habilitation Consultation: o Licensed Psychologist: approximately 0.2% o Licensed Behavior Analyst: approximately 0.9%

RebaseBook 2014 16 October 8, 2013
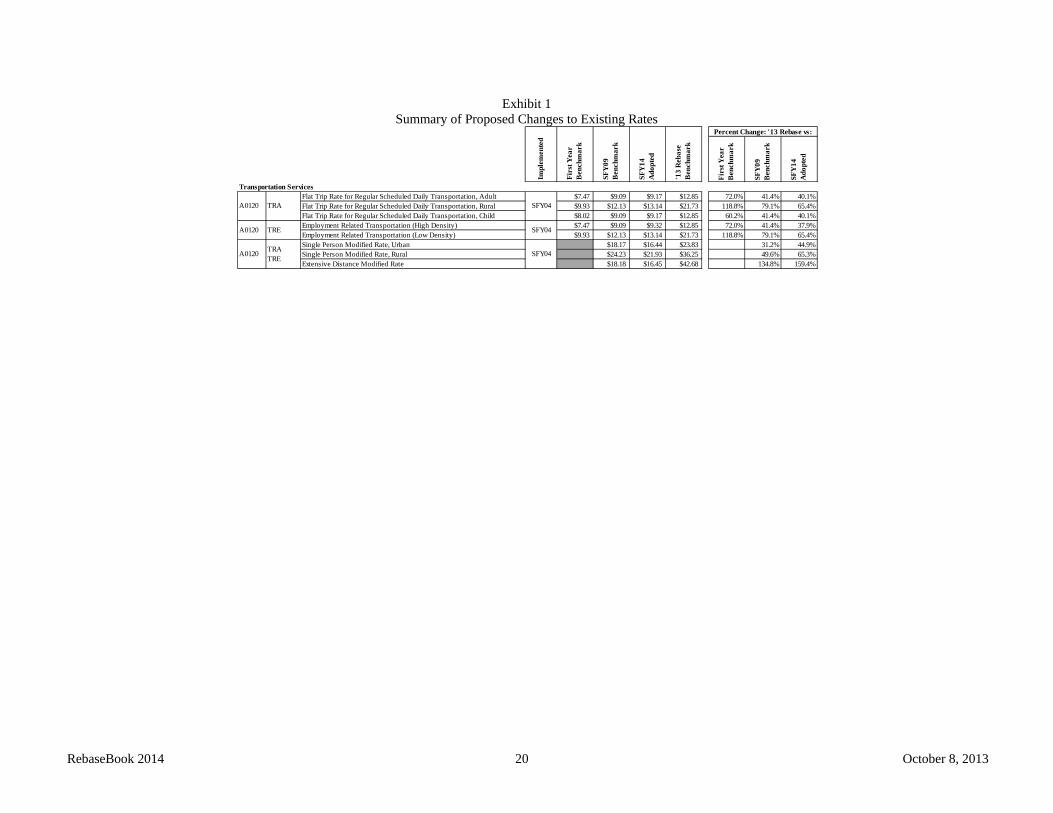
The balance of the services that have been reviewed during the rebased are proposed to increase. These increases range from 0.9% (Transition to Employment, Rural) to 159.4% (Transportation, Extensive Distance Modified). By category of services, the ranges of increases/decreases compared to the current Benchmark Rates are:
Category of Services
Lowest Percentage
Change
Highest Percentage
Change Home Based Services 37.9% 42.2% Independent Living Services 7.8% 24.3% Day Treatment and Training Services 4.7% 37.2% Developmental Home Services -8.3% 48.6% Group Home Services 2.0% 41.3% Professional Services 12.7% 92.4% Employment Services -10.3% 106.0% Special Habilitation Services -0.9% 113.5% Transportation Services 37.9% 159.4%
Following the Exhibit are discussions of the General Methodologies and Specific Methodologies that were used in developing the proposed rebased rates.

RebaseBook 2014 17 October 8, 2013
Exhibit 1 Summary of Proposed Changes to Existing Rates
F
irst
Yea
r B
ench
mar
k
SFY
09
Ben
chm
ark
SFY
14A
dopt
ed
Home-Based ServicesS5125 ATC Attendant Care SFY04 $14.15 $16.09 $14.56 $19.87 40.4% 23.5% 36.5%H2017 HPH Habilitation, Community Protection and Treatment, Hourly SFY04 $18.97 $21.57 $18.58H2017 HAH Habilitation, Support SFY04 $18.06 $20.53 $18.58 $26.20 45.1% 27.6% 41.0%S5130 HSK Housekeeping SFY04 $13.04 $14.82 $13.41 $17.82 36.7% 20.2% 32.9%S5150 RSP Respite, Hourly SFY04 $13.87 $15.77 $14.27 $20.29 46.3% 28.7% 42.2%S5151 RSD Respite, Day (12 hours or more)* SFY04 $169.61 $192.81 $192.81 $269.77 59.1% 39.9% 39.9%* Respite, Long-Term (hourly rate) for service visits greater than 8 hours per day was developed during SFY08 ReBase ($14.07)
Independent Living ServicesT2017 HAI Habilitation, Individually Designed Living Arrangement SFY04 $18.25 $20.74 $18.77 $23.33 27.8% 12.5% 24.3%T2017 HID Habilitation, Individually Designed Living Arrangement SFY04 $18.25 $20.74 $18.77 $20.24 10.9% -2.4% 7.8%
Day Treatment and Training ServicesDay Treatment and Training, Adult (1:3.5) $7.87 $10.53 $9.53 $9.98 26.8% -5.2% 4.7%Day Treatment and Training, Adult (1:5.5) $5.73 $7.66 $6.93 $7.51 31.1% -2.0% 8.4%Day Treatment and Training, Adult (1:7.5) $4.74 $6.33 $5.73 $6.38 34.6% 0.8% 11.3%Day Treatment and Training, Adult (1:9.5) $4.16 $5.56 $5.03Day Treatment and Training, Children (After-School) (1:3.5) $8.05 $10.16 $9.19 $11.51 43.0% 13.3% 25.2%Day Treatment and Training, Children (After-School) (1:5.5) $6.20 $7.83 $7.09 $9.31 50.2% 18.9% 31.3%Day Treatment and Training, Children (After-School) (1:7.5) $5.34 $6.75 $6.11 $8.38 56.9% 24.1% 37.2%Day Treatment and Training, Children (After-School) (1:9.5) $4.84 $6.11 $5.53Day Treatment and Training, Children (Summer) (1:3.5) $8.05 $10.16 $9.19 $11.51 43.0% 13.3% 25.2%Day Treatment and Training, Children (Summer) (1:5.5) $6.20 $7.83 $7.09 $9.31 50.2% 18.9% 31.3%Day Treatment and Training, Children (Summer) (1:7.5) $5.34 $6.75 $6.11 $8.38 56.9% 24.1% 37.2%Day Treatment and Training, Children (Summer) (1:9.5) $4.84 $6.11 $5.53Day Treatment and Training, Adult - Rural (1:3.5) $10.28 $11.69 $10.58 $11.36 10.5% -2.8% 7.4%Day Treatment and Training, Adult - Rural (1:5.5) $7.75 $8.81 $7.97 $8.92 15.1% 1.2% 11.9%Day Treatment and Training, Adult - Rural (1:7.5) $6.60 $7.51 $6.80 $7.82 18.5% 4.1% 15.0%Day Treatment and Training, Adult - Rural (1:9.5) $5.92 $6.73 $6.09
T2021 DTI Day Treatment and Training, Intense SFY04 $18.06 $20.53 $18.58 $20.80 15.2% 1.3% 11.9%* Separate Rate Models for DTT Summer versus After-School were developed during the SFY08 ReBase
Developmental Home ServicesT2016 HBA Habilitation, Vendor Supported Developmental Home (Adult) SFY04 $94.85 $107.83 $99.32 $92.91 -2.0% -13.8% -6.5%T2016 HBC Habilitation, Vendor Supported Developmental Home (Child) SFY04 $94.85 $109.98 $101.31 $92.91 -2.0% -15.5% -8.3%DD031 RBD Room and Board, Vendor Supported Dev Home (Adult) SFY04 $11.90 $13.53 $12.85 $19.09 60.4% 41.1% 48.6%DD031 RBD Room and Board, Vendor Supported Dev Home (Child) SFY04 $11.90 $13.53 $12.85 $19.09 60.4% 41.1% 48.6%
Group Home ServicesT2016 HPD Habilitation, Community Protection and Treatment Group Home SFY04 $18.97 $21.57 $17.55 $20.76 9.4% -3.8% 18.3%T2016 HAB Habilitation, Group Home SFY04 $17.06 $19.39 $17.55 $20.61 20.8% 6.3% 17.4%
Habilitation, Nursing Supported Group Home, Level I $400.64 $417.47 $323.09 $368.57 -8.0% -11.7% 14.1%Habilitation, Nursing Supported Group Home, Level II $481.14 $501.35 $388.00 $402.84 -16.3% -19.6% 3.8%Habilitation, Nursing Supported Group Home, Level III $549.38 $583.91 $443.03 $451.83 -17.8% -22.6% 2.0%Room and Board, All Group Homes (Maricopa/Urban) 3BR $20.50 $23.80 $22.61 $29.19 42.4% 22.6% 29.1%Room and Board, All Group Homes (Maricopa/Urban) 4BR $18.27 $21.20 $20.14 $26.79 46.6% 26.4% 33.0%Room and Board, All Group Homes (Maricopa/Urban) 5BR $17.78 $20.61 $19.58 $26.21 47.4% 27.2% 33.9%Room and Board, All Group Homes (Flagstaff/Rural) 3BR $20.94 $23.20 $22.14 $29.08 38.9% 25.3% 31.3%Room and Board, All Group Homes (Flagstaff/Rural) 4BR $18.65 $20.77 $19.73 $27.88 49.5% 34.2% 41.3%Room and Board, All Group Homes (Flagstaff/Rural) 5BR $18.13 $20.21 $19.20 $26.70 47.3% 32.1% 39.1%
* Historical Rates not reflected in Rate Models in this packet due to change in methodology
Percent Change: '13 Rebase vs:
T2021 DTA SFY04
Impl
emen
ted
Fir
st Y
ear
Ben
chm
ark
SFY
09
Ben
chm
ark
T2021 DTT SFY04
T2021 DTT* SFY04
SFY
14A
dopt
ed
'13
Reb
ase
Ben
chm
ark
DD030 RRB* SFY04
T2021 DTR SFY04
T2016 HAN SFY04

RebaseBook 2014 18 October 8, 2013
Exhibit 1 Summary of Proposed Changes to Existing Rates
F
irst
Yea
r B
ench
mar
k
SFY
09
Ben
chm
ark
SFY
14A
dopt
ed
Professional ServicesT1021 HHA Home Health Aide SFY04 $16.72 $19.01 $17.20 $25.83 54.5% 35.9% 50.2%
Nursing Visit (Urban) $40.57 $36.72Nursing Visit (Rural)Nursing Visit (RN) $67.97 0.0% 67.5% 85.1%Nursing Visit (LPN) $53.33 0.0% 31.5% 45.2%Nursing, Intermittent (Urban) $35.69 $40.57 $36.72 67.2%Nursing, Intermittent (Rural)Nursing, Intermittent (RN) $70.65 98.0% 74.1% 92.4%Nursing, Intermittent (LPN) $55.21 54.7% 36.1% 50.4%Nursing, Continuous SFY04 $35.69 $39.31 $36.72Nursing, Continuous (RN) $53.64 50.3% 32.2% 46.1%Nursing, Continuous (LPN) $41.40 16.0% 2.0% 12.7%Nursing, Respite SFY04 $35.69 $39.31 $36.72Nursing, Respite (RN) $53.64 50.3% 32.2% 46.1%Nursing, Respite (LPN) $41.40 16.0% 2.0% 12.7%Occupational Therapy (Clinic, Base Rate) $57.52 $57.52 $56.83 $69.17 20.3% 20.3% 21.7%Occupational Therapy (Natural, Base Rate) $77.94 $77.94 $70.54 $91.81 17.8% 17.8% 30.2%Occupational Therapy/Early Intervention (Clinic, Base Rate) $57.52 $57.52 $56.83 $69.17 20.3% 20.3% 21.7%Occupational Therapy/Early Intervention (Natural, Base Rate) $77.94 $77.94 $70.54 $91.81 17.8% 17.8% 30.2%Occupational Therapy Evaluation (Clinic) $172.56 $172.56 $156.17 $207.51 20.3% 20.3% 32.9%Occupational Therapy Evaluation (Natural) $192.98 $192.98 $174.65 $230.15 19.3% 19.3% 31.8%Occupational Therapy/Early Intervention Evaluation (Clinic) $172.56 $172.56 $156.17 $207.51 20.3% 20.3% 32.9%Occupational Therapy/Early Intervention Evaluation (Natural) $192.98 $192.98 $174.65 $230.15 19.3% 19.3% 31.8%Occupational Therapy Assistant (Clinic, Base Rate) $48.00 0.0% 0.0% 0.0%Occupational Therapy Assistant (Natural, Base Rate) $64.14Occupational Therapy/Early Intervention Assistant (Clinic, Base Rate) $48.00 0.0% 0.0% 0.0%Occupational Therapy/Early Intervention Assistant (Natural, Base Rate) $64.14Physical Therapy (Clinic, Base Rate) $57.52 $57.52 $56.83 $69.17 20.3% 20.3% 21.7%Physical Therapy (Natural, Base Rate) $77.94 $77.94 $70.54 $91.81 17.8% 17.8% 30.2%Physical Therapy/Early Intervention (Clinic, Base Rate) $57.52 $57.52 $56.83 $69.17 20.3% 20.3% 21.7%Physical Therapy/Early Intervention (Natural, Base Rate) $77.94 $77.94 $70.54 $91.81 17.8% 17.8% 30.2%Physical Therapy Evaluation (Clinic) $172.56 $172.56 $156.17 $207.51 20.3% 20.3% 32.9%Physical Therapy Evaluation (Natural) $192.98 $192.98 $174.65 $230.15 19.3% 19.3% 31.8%Physical Therapy/Early Intervention Evaluation (Clinic) $172.56 $172.56 $156.17 $207.51 20.3% 20.3% 32.9%Physical Therapy/Early Intervention Evaluation (Natural) $192.98 $192.98 $174.65 $230.15 19.3% 19.3% 31.8%Physical Therapy Assistant (Clinic, Base Rate) $48.00 0.0% 0.0% 0.0%Physical Therapy Assistant (Natural, Base Rate) $64.14Physical Therapy/Early Intervention Assistant (Clinic, Base Rate) $48.00 0.0% 0.0% 0.0%Physical Therapy/Early Intervention Assistant (Natural, Base Rate) $64.14Speech Therapy (Clinic, Base Rate) $57.52 $57.52 $56.83 $69.17 20.3% 20.3% 21.7%Speech Therapy (Natural, Base Rate) $77.94 $77.94 $70.54 $91.81 17.8% 17.8% 30.2%Speech Therapy/Early Intervention (Clinic, Base Rate) $57.52 $57.52 $56.83 $69.17 20.3% 20.3% 21.7%Speech Therapy/Early Intervention (Natural, Base Rate) $77.94 $77.94 $70.54 $91.81 17.8% 17.8% 30.2%Speech Therapy Evaluation (Clinic) $172.56 $172.56 $156.17 $207.51 20.3% 20.3% 32.9%Speech Therapy Evaluation (Natural) $192.98 $192.98 $174.65 $230.15 19.3% 19.3% 31.8%Speech Therapy/Early Intervention Evaluation (Clinic) $172.56 $172.56 $156.17 $207.51 20.3% 20.3% 32.9%Speech Therapy/Early Intervention Evaluation (Natural) $192.98 $192.98 $174.65 $230.15 19.3% 19.3% 31.8%Speech Language Pathology Assistant (Clinic) $43.86 $39.69 $48.00 9.4% 0.0% 20.9%Speech Language Pathology Assistant (Natural) $64.14Speech Language Pathology Assistant/Early Intervention (Clinic) $43.86 $39.69 $48.00 46.2% 0.0% 61.6%Speech Language Pathology Assistant/Early Intervention (Natural) $64.14Respiratory Therapy (Clinic) $37.01 $33.49 $45.44 22.8% 0.0% 35.7%Respiratory Therapy (Natural) $60.37 0.0% 0.0% 0.0%
* Nursing, Long-Term (hourly rate) for extended service visits was developed during SFY08 ReBase ($42.58 & $46.41)
'13
Reb
ase
Ben
chm
ark
Percent Change: '13 Rebase vs:
Fir
st Y
ear
Ben
chm
ark
SFY
09
Ben
chm
ark
SFY
14A
dopt
ed
S5181 RP1 04/10
92507 STA SFY11
92507 SPL SFY11
92506 SEA 11/07
92506 SPV 11/07
92507 STA 11/07
92507 SPL 11/07
97530 PTA SFY15
97530 PHL SFY15
97001 PEA 11/07
97001 PHV 11/07
97530 PTA 11/07
97530 PHL 11/07
97535 OTA SFY15
97535 OCL SFY15
97004 OEA 11/07
97004 OCV 11/07
97535 OTA 11/07
97535 OCL 11/07
G0155 HN9SFY04
S9123 HN1*
S9124 HNR*
G0154 HNV08/12
Impl
emen
ted

RebaseBook 2014 19 October 8, 2013
Exhibit 1 Summary of Proposed Changes to Existing Rates
Fir
st Y
ear
Ben
chm
ark
SFY
09
Ben
chm
ark
SFY
14A
dopt
ed
Employment Support ServicesCenter-Based Employment (High Density) (1:3) $10.88 0.0% 0.0% 0.0%Center-Based Employment (Low Density) (1:3) $11.24Center-Based Employment (High Density) (1:6) $5.26 $5.51 $4.99 $6.16 17.1% 11.8% 23.4%Center-Based Employment (Low Density) (1:6) $5.78 $6.06 $5.48 $6.54Center-Based Employment (High Density) (1:9) $4.62 0.0% 0.0% 0.0%Center-Based Employment (Low Density) (1:9) $5.01Employment Support Aide - GSE/ISE (High Density) $17.66 $18.23 $16.50Employment Support Aide - GSE/ISE (Low Density) $19.43 $20.05 $18.15Employment Support Aide - CBE (High Density) $15.30 $16.04 $14.52Employment Support Aide - CBE (Low Density) $16.83 $17.64 $15.96Group Supported Employment (High Density) (1:2) $17.44 $18.28 $16.55 $16.35 -6.3% -10.6% -1.2%Group Supported Employment (High Density) (1:3) $11.62 $12.19 $11.03 $11.79 1.5% -3.3% 6.9%Group Supported Employment (High Density) (1:4) $8.46 $8.87 $8.02 $9.52 12.5% 7.3% 18.7%Group Supported Employment (High Density) (1:5) $6.76 $7.09 $6.42 $8.17 20.9% 15.2% 27.3%Group Supported Employment (High Density) (1:6) $5.64 $5.91 $5.35 $7.28 29.1% 23.2% 36.1%Group Supported Employment (Low Density) (1:2) $20.01 $20.98 $18.99 $17.03 -14.9% -18.8% -10.3%Group Supported Employment (Low Density) (1:3) $13.34 $13.99 $12.66 $12.48 -6.4% -10.8% -1.4%Group Supported Employment (Low Density) (1:4) $9.73 $10.20 $9.23 $10.21 4.9% 0.1% 10.6%Group Supported Employment (Low Density) (1:5) $7.78 $8.16 $7.39 $8.87 14.0% 8.7% 20.0%Group Supported Employment (Low Density) (1:6) $6.49 $6.80 $6.16 $7.99 23.1% 17.5% 29.7%Individual Supported Employment (High Density) $26.74 $28.04 $25.38Individual Supported Employment (Low Density) $29.42 $30.85 $27.92Individual Supported Employment, Job Coaching (High Density) $41.76 56.2% 48.9% 64.5%Individual Supported Employment, Job Coaching (Low Density) $57.51 95.5% 86.4% 106.0%Individual Supported Employment, Job Development (High Density) $40.63 51.9% 44.9% 60.1%Individual Supported Employment, Job Development (Low Density) $43.24 47.0% 40.2% 54.9%Transition to Employment (1:4), Urban $12.19 $11.03 $10.30 -15.5% 0.0% -6.6%Transition to Employment (1:4), Rural $12.19 $11.03 $11.13 -8.7% 0.0% 0.9%
Specialized Habilitation ServicesT2017 HAM Specialized Habilitation with Music Therapy SFY04 $35.28 $40.10 $18.58 $39.66 12.4% -1.1% 113.5%T2017 HBB Specialized Habilitation, Behavioral-B 11/05 $34.91 $36.60T2017 HBM Specialized Habilitation, Behavioral-M 11/05 $53.88 $56.49
Habilitation, Communication, Level I $18.87 $19.78Habilitation, Communication, Level II $24.72 $25.92Habilitation, Communication, Level III $30.58 $32.06Habilitation Consultation, Psychologist (Urban) $125.00 $124.77 0.0% 0.0% -0.2%Habilitation Consultation, Psychologist (Rural) $140.00 $147.97 0.0% 0.0% 5.7%Habilitation Consultation, Licensed Behavior Analyst $60.00 $59.45 0.0% 0.0% -0.9%Habilitation Consultation, BCBA $54.30 $54.85 0.0% 0.0% 1.0%
T2020 HCB Habilitation Consultation, BCABA SFY14 $36.20 $42.84 0.0% 0.0% 18.3%T2020 ECM Habilitation, Early Childhood Autism Specialized (Masters) SFY14 $54.30 $54.85 0.0% 0.0% 1.0%T2021 ECB Habilitation, Early Childhood Autism Specialized (Bachelors) SFY14 $36.20 $42.84 0.0% 0.0% 18.3%T2022 ECH Habilitation, Early Childhood Autism Spec Hourly Habilitation SFY14 $20.53 $25.38 0.0% 0.0% 23.6%
'13
Reb
ase
Ben
chm
ark
Percent Change: '13 Rebase vs:
Impl
emen
ted
Fir
st Y
ear
Ben
chm
ark
SFY
09
Ben
chm
ark
SFY
14A
dopt
ed
T2017 HCM SFY14
T2019 TTE SFY14
T2017 HCH 11/05
T2019 ISE SFY06
T2019 ISE SFY15
T2019 ESA SFY06
T2019 GSE SFY06
T2019 CBE SFY06
RebaseBook 2014 20 October 8, 2013
Exhibit 1 Summary of Proposed Changes to Existing Rates
Fir
st Y
ear
Ben
chm
ark
SFY
09
Ben
chm
ark
SFY
14A
dopt
ed
Transportation ServicesFlat Trip Rate for Regular Scheduled Daily Transportation, Adult $7.47 $9.09 $9.17 $12.85 72.0% 41.4% 40.1%Flat Trip Rate for Regular Scheduled Daily Transportation, Rural $9.93 $12.13 $13.14 $21.73 118.8% 79.1% 65.4%Flat Trip Rate for Regular Scheduled Daily Transportation, Child $8.02 $9.09 $9.17 $12.85 60.2% 41.4% 40.1%Employment Related Transportation (High Density) $7.47 $9.09 $9.32 $12.85 72.0% 41.4% 37.9%Employment Related Transportation (Low Density) $9.93 $12.13 $13.14 $21.73 118.8% 79.1% 65.4%Single Person Modified Rate, Urban $18.17 $16.44 $23.83 0.0% 31.2% 44.9%Single Person Modified Rate, Rural $24.23 $21.93 $36.25 0.0% 49.6% 65.3%Extensive Distance Modified Rate $18.18 $16.45 $42.68 0.0% 134.8% 159.4%
SFY
14A
dopt
ed
'13
Reb
ase
Ben
chm
ark
Percent Change: '13 Rebase vs:
Impl
emen
ted
Fir
st Y
ear
Ben
chm
ark
SFY
09
Ben
chm
ark
A0120 TRE SFY04
A0120TRATRE
SFY04
A0120 TRA SFY04

RebaseBook 2014 21 October 8, 2013
GENERAL METHODOLOGIES FOR REBASED RATES This section of the RebaseBook describes the general methodologies that were applied during the rebase project. The section is divided into the following discussions:
Wages Employment Related Expenditures (ERE) Productivity of Direct Service Staff Program support Administrative Expenses Multiple client rates Other factors
Wages As previously indicated, wages generally constitute the largest single component of the cost model and the Division placed a special emphasis on assuring that the wage levels used in the cost model were appropriate. As a result, the rebasing project undertook a direct care staff wage analysis special study and the provider survey focused considerable attention to collecting data on wages paid to direct care staff. The results of the special study are presented in Table 4 below. In brief, the study found that wages actually paid by providers were generally at or below the 25th percentile of the market. Wages were above the 25th percentile for six of the services that were compared (Attendant Care, Developmental Home, Day Treatment and Training Child summer and after school, Nursing LPN, Therapy Assistants and Speech Language Pathology Assistants) with Speech and Language Pathology Assistants representing the greatest percentage above the 25th percentile (at 213%). Conversely, wages were below the 25th percentile for thirteen services (Habilitation Support, Housekeeping, Respite, Habilitation IDLA, Day Treatment Adult and Rural (2), Group Homes (2), Nursing RNs, Habilitation with Music Component, and Employment services (3). The greatest percentage below the 25th percentile was in the Nursing for RNs (at approximately 83%). As compared to the 50th percentile of the market, the study revealed that only one service exceeded that measurement – Speech Language Pathology Assistant.

RebaseBook 2014 22 October 8, 2013
Table 4
Direct Care Wages Paid Compared to Market
ATCHAHECH HSK RSP HAI HBA/HBC 2 HBA/HBC 3 HPD HAB HAN-RN 1 HAN-CNA 1
DTADTR
Current Model (Unadjusted) $9.12 $10.99 $8.09 $9.12 $12.36 $16.04 $13.97 $12.09 $10.99 NA NA $13.22Wages at the Median $10.82 $12.82 $10.35 $10.82 $12.82 18.92 16.355 12.738 12.738 $36.41 $13.98 12.738Survey Compared to Median 84.3% 85.7% 78.2% 84.3% 96.4% 84.8% 85.4% 94.9% 86.3% N/A N/A 103.8%Wages at the 25th Percentile $9.61 $10.54 $9.15 $9.61 $10.54 $16.74 $14.14 $10.13 $10.13 $31.15 $12.31 $10.13Survey Compared to 25th 105.4% 95.9% 113.0% 105.4% 85.3% 104.4% 101.2% 83.8% 92.2% N/A N/A 76.7%Wages at the 25th/50th Percentile $10.22 $11.68 $9.75 $10.22 $11.68 $17.83 $15.25 $11.44 $11.44 $33.78 $13.15 $11.44Survey Compared to 25th/50th 112.1% 106.3% 120.5% 112.1% 94.5% 111.2% 109.1% 94.6% 104.1% N/A N/A 86.5%
DTCDTS
HNV, HN9
HN1, HNR 5
(Mixed)
HNV, HN9
HN1, HNR 5
(RN)
HNV, HN9
HN1, HNR 5
(LPN)
OTAPTASTA RP1 1 SLP 6 HHA 1 CBE TTE GSE ISE
Current Model (Unadjusted) $13.22 $20.11 $20.11 $20.11 $32.83 $20.41 $24.62 $8.67 $11.17 NA $12.53 $14.34Wages at the Median $12.74 $27.78 $36.41 $25.62 $39.48 26.74 22.35 $11.09 12.995 18.08 13.766 15.982Survey Compared to Median 96.4% 138.1% 181.1% 127.4% 120.3% 131.0% 90.8% 127.9% 116.3% N/A 109.9% 111.5%Wages at the 25th Percentile $10.13 24.07 31.15 22.3 33.79 23.21 12.46 9.85 10.4305 15.315 11.32 13.15Survey Compared to 25th 76.7% 119.7% 154.9% 110.9% 102.9% 113.7% 50.6% 113.6% 93.4% N/A 90.3% 91.7%Wages at the 25th/50th Percentile $11.44 $25.92 $33.78 $23.96 $36.63 $24.98 $17.41 $10.47 $11.71 $16.70 $12.54 $14.56Survey Compared to 25th/50th 86.5% 128.9% 168.0% 119.1% 111.6% 122.4% 70.7% 120.8% 104.9% N/A 100.1% 101.6%
HAHM
HCM
Psychologist 1
HCMLic. Beh. Ana
1
HCM
BCBA 1 HCB 1 ECM 1 ECB 1
Current Model (Unadjusted) $20.53 NA NA NA NA NA NAWages at the Median $24.03 $46.02 $30.18 $30.18 $23.59 $30.18 $23.59Survey Compared to Median 117.1% N/A N/A N/A N/A N/A N/AWages at the 25th Percentile $15.41 $33.51 $23.04 $23.04 $17.41 $23.04 $17.41Survey Compared to 25th 75.1% N/A N/A N/A N/A N/A N/AWages at the 25th/50th Percentile $19.72 $39.77 $26.61 $26.61 $20.50 $26.61 $20.50Survey Compared to 25th/50th 96.1% N/A N/A N/A N/A N/A N/A
1 No survey responses 4 Survey Responses reflect, "Weighted Averages, excluding Outliers for Employees, excluding Supervis2 Job Categories comprising Training Staff for Developmental Home 5 Survey results reflect RNs only3 Job Categories comprising Supervision & Monitoring Staff for Developmental Home 6 Current model wage reflects 75% of Therapy wage data

RebaseBook 2014 23 October 8, 2013
A more detailed presentation of the direct staff wage data is included as Appendix I. When the survey results were compared (on an inflation adjusted basis) to the rates used in the current cost models (unadjusted), only 8 of the 19 services for which survey data was collected exceeded the rates used in the models. The most significant difference where the survey rates exceeded the rate used in the current cost models occurred in Nursing (where the cost model utilized a blended rate of $20.11 and the survey indicated wages for RNs were being paid at $25.86). The most significant difference where the survey rates fell below the rate used in the current cost models occurred in the Day Treatment Programs (where the cost model utilized a rate of $13.22 and the survey indicated wages were being paid at $9.77 for adult programs and $10.67 for children’s programs). The results of the survey wage rates compared to the current cost model rates (on an inflation adjusted basis) as well as the wage rates selected for the rebased models are presented in the following Table 5.

RebaseBook 2014 24 October 8, 2013
Table 5 Direct Care Wages Paid Compared to the
Current Cost Models and the Proposed Rebased Model
ATCHAHECH HSK RSP HAI HBA/HBC 2 HBA/HBC 3 HPD HAB HAN-RN 1 HAN-CNA 1
DTADTR
Current Model (Unadjusted) $9.12 $10.99 $8.09 $9.12 $12.36 $16.04 $13.97 $12.09 $10.99 NA NA $13.222013 Rebase Mix $10.22 $11.68 $9.75 $10.22 $11.68 $17.83 $15.25 $11.44 $11.44 $33.78 $13.15 $11.44
Percentage Inc/(Dec) 12.1% 6.3% 20.5% 12.1% -5.5% 11.2% 9.1% -5.4% 4.1% -13.5%
DTCDTS
HNV, HN9
HN1, HNR 5
(Mixed)
HNV, HN9
HN1, HNR 5
(RN)
HNV, HN9
HN1, HNR 5
(LPN)
OTAPTASTA RP1 1 SLP 6 HHA 1 CBE TTE GSE ISE
Current Model (Unadjusted) $13.22 $20.11 $20.11 $20.11 $32.83 $20.41 $24.62 $8.67 $11.17 NA $12.53 $14.342013 Rebase Mix $11.44 $25.92 $33.78 $23.96 $36.63 $24.98 $17.41 $10.47 $11.71 $16.70 $12.54 $14.56
Percentage Inc/(Dec) -13.5% 28.9% 68.0% 19.1% 11.6% 22.4% -29.3% 20.8% 4.9% 0.1% 1.6%
HAHM
HCM
Psychologist 1
HCMLic. Beh. Ana
1
HCM
BCBA 1 HCB 1 ECM 1 ECB 1
Current Model (Unadjusted) $20.53 NA NA NA NA NA NA2013 Rebase Mix $19.72 $39.77 $26.61 $26.61 $20.50 $26.61 $20.50
Percentage Inc/(Dec) -3.9%
1 No survey responses 4 Survey Responses reflect, "Weighted Averages, excluding Outliers for Employees, excluding Supervis2 Job Categories comprising Training Staff for Developmental Home 5 Survey results reflect RNs only3 Job Categories comprising Supervision & Monitoring Staff for Developmental Home 6 Current model wage reflects 75% of Therapy wage data

RebaseBook 2014 25 October 8, 2013
The direct care wage rates selected for the rebased models were derived from the Bureau of Labor Statistics (BLS) data for Arizona job classifications. The BLS data was selected because of its wide availability and acceptance as a standard. The mid-point between the 25th and 50th percentile data points for Arizona wage data from BLS the as published in May of 2012 (the most recent data available during the rebase project) was used to determine the hourly wages for specific occupational categories. Depending on the requirements of the direct staff job activities delineated in the service descriptions, certain services reflect a blended rate of wage data of more than one occupational code. Wages were adjusted for inflation with the CMS Home Health Agency Market Basket inflation data from the Health Care Cost Review, published by Global Insight. The inflation factor for all wage categories is 6.33%. This reflects inflation from the May 2012 wage period of 1.10% for 2012 (June through December), 2.4% for 2013 and 2.7% for 2014. Appendix II contains the Arizona statewide BLS wage data as of May 2012 that was used in the proposed SFY 2015 rebased rate models by occupational category. In addition to presenting the mid-point between the 25th and 50th percentile wage rates by occupation, the allocation used by the project team of the occupational categories into the direct service wage rate for each of the rebased services is presented. In this latter presentation, the distribution by occupational category for the proposed SFY 2015 rebased cost models are compared to the allocation used in the SFY 2004 cost models. One significant difference between the allocation of occupations in the SFY 2004 models and the SFY 2015 proposed rebased models was the deletion in the proposed rebased models of the supervisory occupations from all of the service categories. This deletion was made because of the addition in the rebased models of the “program support” costs which is partially designed to capture the costs of supervision. Professional services such as nursing or therapy services include a separate supervision and oversight adjustment in addition to the program support costs where the supervision of assistants is required. Employment Related Expenditures (ERE) Following wages, employment related expenses (ERE) generally constitute the second largest single component of the cost models. Since there are no readily available data sources that track the Division’s providers’ costs for ERE, the CWG relied heavily on the provider survey results to determine ERE rates for the cost models. The provider survey asked questions of providers relating to paid time off (including extended illness benefits), retirement programs, health, dental, vision and disability programs, as well as FUTA/SUTA and workers contribution rates. The survey also asked for information relating to waiting periods for new employees as well as employee participation rates.

RebaseBook 2014 26 October 8, 2013
Generally, the results of the survey revealed: Most providers (62%) offer health insurance as a benefit to full-time employees, but
require new employees to wait 90 days before they qualify for the benefit. Average cost to the provider (weighted by provider revenue) was $339 per employee per month.
Most providers (64%) offer paid time off as a benefit to full-time employees, but
require new employees to wait 90 days before they qualify for the benefit. Average paid time off (weighted by provider revenue) averaged approximately 8 days.
Approximately 28% of providers offered a retirement plan to full-time employees.
Of the employees at these responding providers, less than a quarter (25%) of the employees eligible for the plans participates.
Less than half the responding providers other benefits to their full-time employees. The average cost of these benefits based on the survey was $26.
A detailed analysis of the survey results is contained in the Provider Cost Survey – Final Report document that has been posted to the Division’s web site. Based on the results of the provider survey and factoring in the ERE required by law (FICA, workers compensation), the CWG compiled a package of ERE to consider for use in the rate models. The results of this compilation revealed that the ERE percentage varied from a high of nearly 42% for the survey results package at a $9.00 per hour wage level, to a low of nearly 23% for the CWG package at the $20.00 wage level. Summary results are displayed in following Table 6 and a more detailed presentation is contained in Appendix II.
Table 6 ERE Packages Compared to Various Direct Care Wages Levels
Direct Care Staff Wage Level
Survey Results ERE Package
Consultant Work Group ERE Package
$9.00 42.2% 37.7% $11.00 37.8% 34.0% $13.00 34.8% 31.3% $13.01 34.8% 31.3% $19.99 29.0% 26.3% $20.00 29.0% 26.3% $30.00 25.3% 23.2%
The primary reason that the ERE percentage rate declines as wages increase is the use of a fixed cost (of $370 per employee per month) for health insurance cost across all wage levels. Additionally, the reader should note that the Survey results do not include adjustments for: turnover, waiting periods or participation. The figures for the survey results displayed would be lower if consideration of these factors was included

RebaseBook 2014 27 October 8, 2013
For the proposed rebase models, the CWG recommended that three percentages of direct care staff wages be adopted: an ERE rate of 35% on wages less than $13.00, 30% for wages between $13.01 and $19.99, and for models that use hourly wages of $20.00 or more, 23.0%. These ERE rates proposed for the rebased models differ from the ERE that is used in the current cost models. The current models use a straight 30% ERE factor for all wage levels in almost all services.4 The detailed ERE percentages derived from the CWG ERE package that are contained in Appendix III are summarized below:
Table 7 ERE, Agency Providers, Hourly Wages less than $13.00
4 Day Treatment and Training, Child (After-School & Summer) services utilize an ERE factor less than the standard due to the part-time nature of theses services.
Hourly Rate $9.00 $11.00 $13.00
Annual Wage 1
$18,720 $22,880 $27,040
FUTA / SUTA 2
2.80% $196 1.05% $196 0.86% $196 0.72%
FICA 3
7.65% $1,432 7.65% $1,750 7.65% $2,069 7.65%
Workers' Compensation 2.00% $374 2.00% $458 2.00% $541 2.00%Legally required benefits 12.45% $2,002 10.70% $2,404 10.51% $2,805 10.37%
Part Time Adj Factor 76.00%
Paid Time Off 4
25 days/yr $1,368 7.31% $1,672 7.31% $1,976 7.31%Extended Illness Benefit 0 days/yr $0 0.00% $0 0.00% $0 0.00%
Other BenefitsRetirement Plan 0.00% $0 0.00% $0 0.00% $0 0.00%Health Insurance $370.00 $3,374 18.03% $3,374 14.75% $3,374 12.48%Dental Insurance $0.00 $0 0.00% $0 0.00% $0 0.00%Vision Insurance $0.00 $0 0.00% $0 0.00% $0 0.00%Other Benefits $35.00 $319 1.71% $319 1.40% $319 1.18%
Total ERE per employee $7,064 37.74% $7,770 33.96% $8,475 31.34%

RebaseBook 2014 28 October 8, 2013
Table 8 ERE, Agency Providers, Hourly Wages of $13.01 - $19.99
Table 9 ERE, Agency Providers, Hourly Wages greater than $20.00 (or greater)
The ERE assumptions used in the rebase models include an adjustment for the providers’ use of part-time employees. Based on the provider survey, the CWG determined that
Hourly Rate $13.01 $19.99
Annual Wage 1
$27,061 $41,579
FUTA / SUTA 2
2.80% $196 0.72% $196 0.47%
FICA 3
7.65% $2,070 7.65% $3,181 7.65%
Workers' Compensation 2.00% $541 2.00% $832 2.00%Legally required benefits 12.45% $2,807 10.37% $4,208 10.12%
Part Time Adj Factor 76.00%
Paid Time Off 4
25 days/yr $1,978 7.31% $3,038 7.31%Extended Illness Benefit 0 days/yr $0 0.00% $0 0.00%
Other BenefitsRetirement Plan 0.00% $0 0.00% $0 0.00%Health Insurance $370.00 $3,374 12.47% $3,374 8.12%Dental Insurance $0.00 $0 0.00% $0 0.00%Vision Insurance $0.00 $0 0.00% $0 0.00%Other Benefits $35.00 $319 1.18% $319 0.77%
Total ERE per employee $8,478 31.33% $10,940 26.31%
Hourly Rate $20.00 $30.00
Annual Wage 1
$41,600 $62,400
FUTA / SUTA 2
2.80% $196 0.47% $196 0.31%
FICA 3
7.65% $3,182 7.65% $4,774 7.65%
Workers' Compensation 2.00% $832 2.00% $1,248 2.00%Legally required benefits 12.45% $4,210 10.12% $6,218 9.96%
Part Time Adj Factor 76.00%
Paid Time Off 4
25 days/yr $3,040 7.31% $4,560 7.31%Extended Illness Benefit 0 days/yr $0 0.00% $0 0.00%
Other BenefitsRetirement Plan 0.00% $0 0.00% $0 0.00%Health Insurance $370.00 $3,374 8.11% $3,374 5.41%Dental Insurance $0.00 $0 0.00% $0 0.00%Vision Insurance $0.00 $0 0.00% $0 0.00%Other Benefits $35.00 $319 0.77% $319 0.51%
Total ERE per employee $10,944 26.31% $14,471 23.19%

RebaseBook 2014 29 October 8, 2013
approximately 24% of the services delivered were provided by part-time employees. Therefore, a downward adjustment of 24% was applied to the cost of the optional benefits such as paid time off, health insurance, and other optional benefits. The ERE assumptions do not include an adjustment for the combined effects of employee turnover or the waiting periods required of new employees to become eligible for some benefits. As an illustration of the impact that these factors would have on the ERE percentage, the CWG performed a calculation of ERE percentages assuming a 30% employee turnover rate. For the rebased models, applying this assumption would reduce the ERE percentage for the less than $13.00 per hour employee group to approximately 27%. It is important to note that the Division chose not to adjust the ERE rates for turnover. Productivity of Direct Service Staff Productivity factors are reductions to the amount of time during an eight hour day that direct service staff cannot bill for service delivery. Obvious examples of reduced productivity would be the time it takes for a direct service staff person to travel to a member’s home to deliver services or the time that the staff person spends in training. Since the staff person is, in most instances, paid for an eight hour day, the wage (and ERE) rates that the staff person is paid must be “grossed up” in the rate models to account for non-productive (or non-billable) time spent during the day. A simple example will illustrate the concept:
If a direct service staff person were being paid $10 per hour, yet half of the staff member’s eight hour day was spent on activities that were non-productive (or non-billable), the wage rate that should be included in the rate model would be $20. In the above situation, 8 hours multiplied by $10 equals $80 – the amount the staff person is being paid. However, with 4 hours of billable time, 4 hours multiplied by $20 equals $80 – the amount the provider must bill in a day in order to recover the full cost of the staff person’s wages.
Productivity factors were included in the SFY 2015 cost models. Questions were included in the provider survey to update the factors. The questions varied by service, but in general included such items as: The number of visits in a day and the length of each visit for services delivered in
the members’ homes The amount of travel time in a day that a staff person travels to members’ homes The amount of time spent updating notes and medical records The amount of “down time” or employer time each staff member spends each day
(down time was defined in the survey instructions as “the non-billable activity required for the employee such as staff meetings and other commitments to the employing organization”)

RebaseBook 2014 30 October 8, 2013
The amount of training time provided by the employer per staff member per year The summary results from the provider survey and the assumptions adopted by the CWG are included in Appendix III. Some factors were standardized across all rebased rate models, and some productivity factors were set uniquely for one or two services. The more general productivity factors applied (or not applied) to the models include: Recordkeeping and Documentation: This productivity factor was generally
included in the rate models as the Division chose to include adequate time for recordkeeping as this is considered non-billable time. The Division made three exceptions to this general rule: Homemaker, IDLA Daily and Residential services.
Down Time or Employer Time: The productivity factor for “down time” was not
included in the rate models. Previously down time was used to account for weekly team meeting to support service delivery. In general, all rate models now include a factor for employer time which includes such meetings.
Training Time: A standard productivity factor of 40 hours of annual training time
was included for all non-professional rebased rate models and 56 hours of annual training time was allotted for all professional services. The only exception to this is the Day Treatment and Training Child Summer and After-school program for which 78 hours of training time annually is allotted. These hours represent average training hours annually over a three year period.
Missed Appointments: There was no standard productivity factor for missed
appointments though adjustments were made for specific Home-Based services. Travel Time: There was no standard productivity factor for travel time though
adjustments were made for specific home based services. The specific rebased productivity adjustments for each service are included in the discussions of the service specific assumptions and methodologies, as well as in the rebased rate models. Program Support The rebased models include for the first time a specific component for program support or the indirect costs of the provider. Questions concerning indirect costs were included in the provider survey. In the instructions for the survey, these program support or indirect costs were defined as follows:
Program support costs are expenses that are neither direct care nor administrative. Such activities are program-specific, but not billable.
The provider survey instructions identified certain indirect expenses. Included in the list of identified cost elements were such items as:

RebaseBook 2014 31 October 8, 2013
Salaries and Wages (and ERE), Program Supervision Salaries and Wages (and ERE), Program Support Rents/Mortgage Payments for Indirect Office Program Development Quality Assurance Utility costs associated with direct care staff
The results of the provider survey indicated that providers incurred 9.7% of total revenue as program support or indirect expense. The CWG assumed a rate of 8% of the total proposed rebased rate as a standard factor for most of the rebased cost models. With the addition of the program support factor, specific program support costs (such as program compliance and supervisor wages) were generally eliminated from the rebased cost models. However, certain services (Nursing and Therapy services) retained specific program support costs as these were judged to provide significant costs within the model. The specifics for each service can be seen through a review of the cost model section of this RebaseBook. Administrative Expenses The rebased models include (as have the previous cost models) a specific component for administrative expenses of the provider. Consistent with the approach for collecting information around program support costs, we included questions concerning administrative expenses in the provider survey. In the instructions for the survey, these administrative expenses were defined as follows:
Administrative costs are those associated with the operation of your organization, but which are not program-specific. Employees that are typically considered administrative include general management, financial/accounting, and human resource staff.
The provider survey instructions identified certain administrative expenses. Included in the list of identified cost elements were such items as: Compensation of general management Wages (and ERE) for Administrative Staff Rents/Mortgage Payments for Admin Office(s) Financial and Accounting
The results of the provider survey indicated that providers incurred 12.8% of total revenue as administrative expense. The CWG assumed a rate of 10% of the total proposed rebased rate as a standard factor for all the rebased cost models. The 10% of the total proposed rebased rate is a shift in methodology from the SFY 2004 rate models. In the current models, administrative expenses are calculated as 10% of

RebaseBook 2014 32 October 8, 2013
non-travel costs. The 10% of the total proposed rebased rate calculation will result in an approximate 1.5 percentage point increase for this model component. An example of the impact of the difference in the calculation of administrative expense is displayed in the table below:
Table 10 Example of the Impact of the Changed Methodology for
Calculating Administrative Expenses
SFY 04 Model Proposed
Rebased Model Hourly Wage $9.12 $10.22 Annual Wage $18,978 $21,258
Hourly Wage with ERE $11.86 $13.80
Hourly Wage with Productivity Adjustment $12.65 $15.66
Hourly Mileage Cost $0.23 $0.64
Total Non-Travel Costs $12.65 $16.30 Total Benchmark Rate $14.15 $19.87
Administrative Costs Calculation7 $12.65 * 10% $19.87 * 10% Costs $1.27 $1.99
As can be seen in the example, the 10% administrative expense under the proposed model is $1.99. If the methodology of the current rate model was applied to the data in the proposed model then the administrative costs would be $1.63. This change in calculation methodology results in an increase of $0.36 per unit in this example. Multiple Client Rate Calculation For some services (most notably home-based services) it is possible for a provider to deliver services simultaneously to multiple members. The convention used in both the SFY 2014 and the rebased cost models is to apply the following formula to determine the rate for each member receiving services:
(Regular Rate * ((1 + (25% * number of additional members))) / Total number of members)
Travel Time Calculation For some services where a staff member is required to travel between member sessions, travel time was included as a factor in productivity. The calculation of travel time was standardized between all of the rebased models. The following formula was used to determine the travel time.
(Number of miles traveled/25 mph)+0.17

RebaseBook 2014 33 October 8, 2013
It is assumed the average speed is 25 miles per hour and an add-on of 10 minutes (10 minutes/60 minutes = 0.17) is included to allow for loading and unloading into the vehicle. Other Factors Mileage Reimbursement Rate
The rebased models include a standard mileage reimbursement rate of 56.5 cents per mile, except for day treatment, group home and day treatment related transportation services. These services use an ‘enhanced mileage rate’ that is discussed in the specific methodologies. The standard mileage rate used in the rebase models is the published 2013 rate available from the Internal Revenue Service at http://www.igrc.org/pages/detail/1884.
Urban & Rural
Multiple services reviewed under the Rebase project have been denoted to have two variations of rate models proposed “Urban” and “Rural”. Unless specifically denoted for a service the general definition of for these terms, and the application of the rate models are:
Urban: Services provided within the geographic area encompassed by Maricopa and Pima counties are to be billed using “Urban” rates.
Rural: Services provided outside of the geographic area encompassed by Maricopa and Pima counties are to be billed using “Rural” rates.
Exceptions: Both the services of Therapy (or Therapy Assistant) or Nursing are eligible for a three-area geographic modified rate. Both of these services utilize geographic area defined by State of Arizona counties. Below are the listings of the counties eligible for the various geographic areas based upon the service provided. Therapy (or Therapy Assistant)
Base Area: Coconino, Maricopa, Pinal & Yavapai Counties Area 1: Cochise, Gila, La Paz, Mojave, Navajo, Pima & Santa Cruz Counties Area 2: Apache, Greenlee, Graham & Yuma Counties
Nursing
Base Area: Maricopa, Pima & Pinal Counties Area 1: Coconino, Gila, La Paz, Mojave, Navajo, Santa Cruz, Yavapai & Yuma Counties Area 2: Apache, Greenlee, Graham & Cochise Counties
Currently for Therapy, Therapy Assistant and Nursing services, the CWG has proposed that the rate model determines the rate valid for the Base Area. Additional premiums of 10% and 25% are utilized to determine the rates Area 1 and Area 2 (respectively).

RebaseBook 2014 34 October 8, 2013
Days, hours, etc. The rebased models include the following standardized assumptions:
365 days per year 30.4 days per month 2,080 working hours per year for one full-time equivalent (FTE) 260 working days per year for one FTE 8 working hours per shift for one FTE

RebaseBook 2014 35 October 8, 2013
SPECIFIC METHODOLOGIES FOR EACH SERVICE This section of the RebaseBook describes the specific methodologies used for each service during the rebase project. The section is divided into the following discussions: Home-Based Services Independent Living Services Day Treatment and Training Services Developmental Home Services Group Home Services Professional Services Employment Services Specialized Habilitation Services Transportation Services
Home-Based Services The rebasing project included four Home-Based services: Attendant Care Habilitation, Support Homemaker Respite
Changes to Rate Models In addition to the general methodological changes and assumptions applied to all of the rebased rate models and discussed in the GENERAL METHODOLOGIES FOR REBASED RATES section of this RebaseBook, the following changes to the rebased cost models were made as compared to the SFY 2004 cost models: Respite (Hourly and Day): Respite is a service that members use for either short
periods of time (97.7% of visits are 8 hours or less) or for full days. Despite this high percentage of utilization of 8 hours or less of service, providers felt it was necessary to maintain a daily respite rate model. The current respite rate structure pays providers an hourly rate for visits of 1 to 12 hours; however, for visits of longer durations, providers are paid a daily rate.
The CWG is proposing a revised hourly rate structure for both Hourly (12 or less hours per day) and Day (more than 12 hours per day) Respite. The proposed rebased Respite, Day rate equates to $269.77 for more than 12 hours of service, compared to the old Respite, Day rate of $192.81. The proposed rebased Respite, Day rate is based on 16 hours of service and will provide incentives for supplying 9 to 13 hours of service. In the current model providers

RebaseBook 2014 36 October 8, 2013
do not have an incentive to provide 13 hours of service. Based on an analysis conducted by the CWG of the number of units billed per member per day, it was determined no members received greater than 12 units per day of Respite services during SFY 2012.
The following Tables contain the specific assumptions associated with the Home-Based services.
Table 11 Attendant Care
Assumption/Result Value Comments Unit of Service 60 minutes
Hourly wage $10.22
This assumption is consistent with Arizona statewide hourly wage for Personal and Home Care Aide (SOC Code 39-9021) of $9.61, taken from BLS as of May 2012 and inflated to December 2014 (6.33%).
ERE 35.0% of wages Average travel 0.39 hours per shift Recordkeeping 0.20 hours per shift 1 hour per week Training Time 0.15 hours per shift Approx. 40 hours per year, for 3 years of employment
Missed Appointments 0.05 hours per shift 0.25 hours per week. Adjustment due to appointments missed (e.g. member unavailable).
Employer Time 0.10 hours per shift 0.50 hours per week ISP Meetings 0.06 hours per shift 0.30 hours per week
Average on-site time 7.05 hours per day Billable Hours – difference between Total Hours and other productivity components
Mileage 5.5 miles Average distance for travel Miles Transporting Members
2.5 miles
Mileage reimbursement 56.5 cents per mile Program support 8% Administrative overhead 10% SFY 15 Benchmark Rate $19.87
Table 12
Habilitation, Support Assumption/Result Value Comments
Unit of Service 60 minutes
Hourly wage $11.68
Blended Rate: - 30% Rehabilitation Counselors (SOC Code 21-1015) of
$14.20 - 70% Personal and Home Care Aide (SOC Code 39-9021) of
$9.61 All wages were taken from BLS as of May 2012 and inflated to December 2014 (6.33%)
ERE 35.0% of wages Average travel 0.89 hours per shift Recordkeeping 0.20 hours per shift 1 hour per week Training Time 0.15 hours per shift Approx. 40 hours per year, for 3 years of employment
Missed Appointments 0.05 hours per shift 0.25 hours per week. Adjustment due to appointments missed (e.g. member unavailable).
Employer Time 0.10 hours per shift 0.50 hours per week ISP Meetings 0.06 hours per shift 0.30 hours per week Participating in Assessments
0.10 hours per shift 0.50 hours per week
Average on-site time 6.45 hours per day Billable Hours – difference between Total Hours and other productivity components
Mileage 18 miles Average distance for each trip of 7.5 miles Miles Transporting Members
4 miles
Mileage reimbursement 56.5 cents per mile Program support 8% Administrative overhead 10%

RebaseBook 2014 37 October 8, 2013
Assumption/Result Value Comments SFY 15 Benchmark Rate $26.20
Table 13
Homemaker Assumption/Result Value Comments
Unit of Service 60 minutes
Hourly wage $9.75
Blended Rate: - 50% Arizona statewide hourly wage for Janitors and
Cleaners (SOC Code 37-2011) of $9.65 - 50% Arizona statewide hourly wage for Maids and
Housekeeping Cleaners (SOC Code 37-2012) of $8.69 Wages taken from BLS as of May 2012 and inflated to December 2014 (6.33%)
ERE 35.0% of wages Average travel 0.36 hours per shift Recordkeeping 0.00 hours per shift Included in direct service time. Training Time 0.15 hours per shift Approx. 40 hours per year, for 3 years of employment Employer Time 0.10 hours per shift 0.50 hours per week Mileage 4.8 miles
Average on-site time 7.39 hours per day Billable Hours – difference between Total Hours and other productivity components
Mileage reimbursement 56.5 cents per mile Program support 8% Administrative overhead 10% SFY 15 Benchmark Rate $17.82
Table 14
Respite, Hourly Assumption/Result Value Comments
Unit of Service 60 minutes For use when services is provided up to twelve (12) hours or less to an individual within a calendar day.
Hourly wage $10.22
This assumption is consistent with Arizona statewide hourly wage for Personal and Home Care Aide (SOC Code 39-9021) of $9.61, taken from BLS as of May 2012 and inflated to December 2014 (6.33%)
ERE 35% of wages
Average travel 0.59 hours per shift Travel time is only included as a productivity adjustment to the hourly model.
Recordkeeping 0.08 hours per shift 0.40 hours per week Employer Time 0.10 hours per shift 0.50 hours per week Training Time 0.15 hours per shift Approx. 40 hours per year, for 3 years of employment
Average on-site time 7.08 hours per day Billable Hours – difference between Total Hours and other productivity components
Mileage 10.6 miles Average distance for one trip Miles Transporting Members
2.5 miles
Mileage reimbursement 56.5 cents per mile Program support 8% Administrative overhead 10% SFY 15 Benchmark Rate $20.29
Table 15
Respite, Day Assumption/Result Value Comments
Unit of Service 1 Day For use when services is provided for twelve (12) hours or more to an individual within a calendar day.
Hourly wage $10.22
This assumption is consistent with Arizona statewide hourly wage for Personal and Home Care Aide (SOC Code 39-9021) of $9.61, taken from BLS as of May 2012 and inflated to December 2014 (6.33%)
ERE 35% of wages Average travel 0.00 hours per shift Assumes employee stays at one residence for the entire shift Recordkeeping 0.06 hours per shift 0.30 hours per week, balance of time included in direct service time Employer Time 0.10 hours per shift 0.50 hours per week

RebaseBook 2014 38 October 8, 2013
Assumption/Result Value Comments Training Time 0.15 hours per shift Approx. 40 hours per year, for 3 years of employment
Average on-site time 7.69 hours per day Billable Hours – difference between Total Hours and other productivity components
Mileage 0 miles Miles Transporting Members
2.0 miles
Mileage reimbursement 56.5 cents per mile Program support 4% Administrative overhead 10% SFY 15 Benchmark Rate $269.76
Independent Living Services The rebasing project included two Independent Living services: Habilitation, Individually Designed Living Arrangement, Hourly Habilitation, Individually Designed Living Arrangement, Daily
Changes to Rate Models In addition to the general methodological changes and assumptions applied to all of the rebased rate models and discussed in the GENERAL METHODOLOGIES FOR REBASED RATES section of the RebaseBook, the following changes to the rebased cost models were made as compared to the SFY 2004 cost models: The independent living category of services currently has a single rate model (that
provides for an hourly unit of service). The proposed rebased models will have two rates, one for hourly or intermittent services, and one for extended services (services eligible for Daily service).
In the current model, the daily rate is calculated based on the hourly IDLA rate
and varying ranges of authorized hours of service per week to members. In the proposed rate models, the daily IDLA rate is also calculated based on an hourly rate. However, productivity and travel assumptions of this hourly rate have been adjusted to better reflect productivity and travel for a daily service as opposed to an hourly service. The daily IDLA rate is still calculated based on the same ranges of authorized hours of service per week as found in the current model.
The following Tables contain the specific assumptions associated with the Independent Living services.
Table 16 Habilitation, Individually Designed Living Arrangement, Hourly
Assumption/Result Value Comments Unit of Service 60 minutes
Hourly wage $11.68
Blended Rate: - 30% Rehabilitation Counselors (SOC Code 21-1015) of
$14.20 - 70% Personal and Home Care Aide (SOC Code 39-9021)
of $9.61 All wages were taken from BLS as of May 2012 and inflated to December 2014 (6.33%)

RebaseBook 2014 39 October 8, 2013
Assumption/Result Value Comments ERE 35.0% of wages Travel time for Employee 0.37 hours per shift Recordkeeping 0.25 hours per shift 1.25 hours per week Training time 0.15 hours per shift Approx. 40 hours per year, for 3 years of employment Employer Time 0.10 hours per shift 0.50 hours per week ISP Meetings 0.12 hours per shift 0.60 hours per week Participating in Assessments 0.14 hours per shift 0.70 hours per week
Average on-site time 6.87 hours per day Billable Hours – difference between Total Hours and other productivity components
Mileage 5 Miles Transporting Members 4.4 miles Mileage reimbursement 56.5 cents per mile Program support 8% Administrative overhead 10% SFY 15 Benchmark Rate $23.33
Table 17
Habilitation, Individually Designed Living Arrangement, Daily Assumption/Result Value Comments
Unit of Service 60 minutes
Hourly wage $11.68
Blended Rate: - 30% Rehabilitation Counselors (SOC Code 21-1015) of
$14.20 - 70% Personal and Home Care Aide (SOC Code 39-9021) of
$9.61 All wages were taken from BLS as of May 2012 and inflated to December 2014 (6.33%)
ERE 35% of wages Travel time for Employee 0 Assumes employee stays at one residence for the entire shift Recordkeeping 0 Included in direct service time. Employer Time 0.10 hours per shift 0.50 hours per week Training time 0.15 hours per shift Approx. 40 hours per year, for 3 years of employment
Average on-site time 7.75 hours per day Billable Hours – difference between Total Hours and other productivity components
Mileage 0 Assumes employee stays at one residence for the entire shift Miles Transporting Members
4.4 miles
Mileage reimbursement 56.5 cents per mile Program support 8% Administrative overhead 10% SFY 15 Benchmark Rate $20.24
Day Treatment and Training Services The rebasing project included five Day Treatment and Training services: Day Treatment and Training, Adult Day Treatment and Training, Child, After-School Day Treatment and Training, Child, Summer Rural Day Treatment and Training Day Treatment and Training, Intense
Changes to Rate Models In addition to the general methodological changes and assumptions applied to all of the rebased rate models and discussed in the GENERAL METHODOLOGIES FOR REBASED RATES section of the RebaseBook, the following changes to the rebased cost models were made as compared to the SFY 2004 cost models:

RebaseBook 2014 40 October 8, 2013
The cost element for the ‘Transition Staffing Factor” (TSF) has been eliminated
from the models (as the transition time has passed) and the assumptions regarding member participation were adjusted.
The cost element for ‘Program Transport Cost’ has been eliminated from the
models and an ‘Enhanced Mileage Rate’ has replaced the standard mileage rate. The derivation of the ‘Enhanced Mileage Rate’ is explained below.
The staffing ratio of 1:9.5 in the adult, rural, child after-school and child summer
rate models has been removed because these staffing ratios are not utilized. Previously the “Behaviorally or Medically Intense Day Treatment and Training”
rate was identical to the rate for “Habilitation, Support” service in the Home-Based service group. The proposed rebased rate for this service is derived from a separate independent rate model.
Additional Assumptions The proposed rebased rate models for the Adult and Child Day Treatment and Training programs have additional assumptions: For the Adult programs: There are two rate models for Adult programs – Urban and Rural. Three sub-models were developed to distinguish different staff to member ratios. Facilities are assumed to be in service for 250 days per year, although expenses
are allocated over 212 days of member attendance – thereby assuming an attendance rate of 85%
Total hours of work per day per direct care staff are assumed to be 8 hours. Average staff productivity per day is assumed to be (no more than) 7.04 hours for
urban and rural Each program is assumed to have 16 members (Urban) and 7 members (Rural)
per day. Capital requirements are assumed as follows:
o Each facility is assumed to provide 125 square feet per member for urban locations and 271 square feet per member in rural locations.
o Average cost per square foot is assumed at $20.07 for urban facilities per annum, based upon a review of data reported in the provider surveys . For rural facilities the cost per square foot is assumed at $15.00.
Mileage rates are based upon the ‘Enhanced Mileage Rate’ discussed on the following page.
For the Children’s programs: There is one rate model for the After-School and Summer Children programs

RebaseBook 2014 41 October 8, 2013
Three sub-models were developed to distinguish different staff to member ratios Facilities are assumed to be in service 190 days per year. Total hours of work per direct care staff are assumed to be 4.5 hours per day). Average staff productivity at the program is assumed to be (no more than) 3.45
hours per day. Each program is assumed to have 16 members per day. Capital requirements are assumed as follows:
o Each facility assumed to provide 100 square feet per member. o Average cost per square foot is assumed at $20.07 per annum, based upon
a review of the data reported in the provider surveys.. Mileage rates are based upon the ‘Enhanced Mileage Rate’ discussed below. Employee related expenses (ERE) are assumed to be 17.5% due to the part-time
nature of the program. The “Program Transport Cost” element in the existing models is proposed to be replaced with an “Enhanced Mileage Rate”. In essence, the enhanced mileage rate is a rate per mile that is greater than the standard mileage rate of $.565 per mile. Enhancements are made to the standard mileage rate with the additional expenses associated with the acquisition of the vehicle for day programs. The ‘Enhanced Mileage Rates’ used within the Day Treatment and Training models are: $ 0.82, for all day treatment services except Rural
In building the ‘Enhanced Mileage Rates’ the following assumptions were used: The composition of the Enhanced Mileage Rate is:
o Standard mileage rate $0.565 o Discount acquisition -$0.230 o Addition for acquisition adjustment +$0.485
The resulting rate is $0.82 per mile.
Assumptions:
o Acquisition cost of the vehicle is $37,500 o Lift installation costs are assumed at $16,000 o The salvage value at the end of the 100,000 mile period is $5,000. If the
asset is disposed of prior to/after this mileage threshold, the salvage will be higher/lower than assumed.
o The lifespan cost of the vehicle, including acquisition and lift installation is $48,500.
o An attendance factor of 90%. The following Tables contain the specific assumptions associated with the Day Treatment and Training services.

RebaseBook 2014 42 October 8, 2013
Table 18 Day Treatment and Training, Adult (1:3.5)
Assumption/Result Value Comments Unit of Service 1 member hour
Hourly wage $11.44
Blended Rate: - 20% Rehabilitation Counselors (SOC Code 21-1015) of $14.20 - 80% Personal and Home Care Aides (SOC Code 39-9021) of
$9.61. All wages taken from BLS as of May 2012 and inflated to December 2014 (6.33%).
ERE 35.0% of wages Program preparation (etc.) 0.50 hours per shift 2.5 hours per week per staff Recordkeeping 0.15 hours per shift 15 minutes per member per week per member Training Time 0.15 hours per shift Approx. 40 hours per year, for 3 years of employment Employer Time 0.10 hours per shift 0.50 hours per week ISP Meetings 0.06 hours per shift Includes time for 4 meetings per member per year
Average on-site time 7.04 hours per day Billable Hours – difference between Total Hours and other productivity components. Represents 1:3.5 ratio.
Number of staff members 4.57 Based on ratio of total direct care service staff hours with members present at the program to total member hours
Mileage: program-related 2 miles per day Per member per day Mileage reimbursement 82.0 cents per mile Enhanced mileage rate Capital expense $1.68 Per member per hour Supplies $0.36 Per member per hour ($2.50 per day) Program support 8% Administrative overhead 10% SFY 15 Benchmark Rate $9.98 Other rates $7.51 (ratio of 1:5.5) to $6.38 (1:7.5)
Table 19
Day Treatment and Training, Children – After-School & Summer Programs (1:3.5) Assumption/Result Value Comments
Unit of Service 1 member hour
Hourly wage $11.44
Blended Rate: - 20% Rehabilitation Counselors (SOC Code 21-1015) of $14.20 - 80% Personal and Home Care Aides (SOC Code 39-9021) of
$9.61. All wages taken from BLS as of May 2012 and inflated to December 2014 (6.33%).
ERE 17.5% of wages Reduced ERE due to the part-time nature of the program Program preparation (etc.) 0.50 hours per shift 2.5 hours per week per staff Recordkeeping 0.15 hours per shift 15 minutes per member per week per member Training Time 0.30 hours per shift Increased factor due to nature of program Employer Time 0.10 hours per shift 0.50 hours per week
Average on-site time 3.45 hours per day Billable Hours – difference between Total Hours and other productivity components. Represents a 1:3.5 ratio.
Number of staff members 16 Based on ratio of total direct care service staff hours with members present at the program to total member hours
Mileage: program-related 2 miles per day Mileage reimbursement 82.0 cents per mile Enhance mileage rate (identical derivation as Adult, Urban) Capital expense $2.95 Per member per hour Food $0.23 Per member per hour ($0.80 per day) Supplies $0.58 Per member per hour ($2.00 per day) Program support 8% Administrative overhead 10% SFY 15 Benchmark Rate $11.51 Other rates $9.31 (ratio of 1:5.5) to $8.38 (1:7.5)

RebaseBook 2014 43 October 8, 2013
Table 20 Day Treatment and Training, Adult, Rural (1:3.5)
Assumption/Result Value Comments Unit of Service 1 member hour
Hourly wage $11.44
Blended Rate: - 20% Rehabilitation Counselors (SOC Code 21-1015) of $14.20 - 80% Personal and Home Care Aides (SOC Code 39-9032) of
$9.61. All wages taken from BLS as of May 2012 and inflated to December 2014 (6.33%).
ERE 35.0% of wages Program preparation (etc.) 0.50 hours per shift 2.5 hours per week per staff Recordkeeping 0.15 hours per shift 15 minutes per member per week per member Training Time 0.15 hours per shift Increased factor due to nature of program Employer Time 0.10 hours per shift 0.50 hours per week ISP Meetings 0.06 hours per shift Includes time for 4 meetings per member per year
Average on-site time 7.04 hours per day Billable Hours – difference between Total Hours and other productivity components. Represents a 1:3.5 ratio.
Number of staff members 4.57 Based on ratio of total direct care service staff hours with members present at the program to total member hours
Mileage: program-related 4 miles per day Mileage reimbursement 56.5 cents per mile Standard mileage rate Capital expense $2.73 Per member per hour Supplies $0.36 Per member per hour ($2.50 per day) Program support 8% Administrative overhead 10% SFY 15 Benchmark Rate $11.36 Other rates $8.92 (ratio of 1:5.5) to $7.82 (1:7.5)
Table 21
Day Treatment and Training, Intense Assumption/Result Value Comments
Unit of Service 1 member hour
Blended Rate: - 30% Rehabilitation Counselors (SOC Code 21-1015) of $14.20 - 70% Personal and Home Care Aide (SOC Code 39-9021) of
$9.61 All wages were taken from BLS as of May 2012 and inflated to December 2014 (6.33%)
Hourly wage $11.68 ERE 35% of wages Recordkeeping 0.20 hours per shift 1 hour per week Training Time 0.15 hours per shift Increased factor due to nature of program Travel Time 0.00 hours per shift Assumed to be with one member for entire day ISP Meetings 0.02 hours per day Based on assumption of 4 hours per member per year. Employer Time 0.10 hours per shift 0.50 hours per week
Average on-site time 7.53 hours per day Billable Hours – difference between Total Hours and other productivity components.
Mileage Transporting Members
4 miles per day
Mileage reimbursement $0.565 per mile Standard mileage rate Program support 8% Administrative overhead 10% SFY 15 Benchmark Rate $20.80
Developmental Home Services The rebasing project included Four Developmental Home services: Vendor Supported Developmental Home, Adult Vendor Supported Developmental Home, Child Room & Board, Vendor Supported Developmental Home, Adult Room & Board, Vendor Supported Developmental Home, Child
RebaseBook 2014 44 October 8, 2013
Changes to Rate Models In addition to the general methodological changes and assumptions applied to all of the rebased rate models and discussed in the GENERAL METHODOLOGIES FOR REBASED RATES section of the RebaseBook, the following changes to the rebased cost models were made as compared to the SFY 2004 cost models: The rate models for both the Developmental Home and Room & Board services
have been combined into a single model. Due to little variation between the two services, the CWG has recommended combining the services for to reduce administrative burden. When variances have occurred, the CWG has defaulted to the value that results in the larger factor (e.g. training requirements for child placements are higher).
The assumed length of the relationship between the Qualified Vendor and the
home has been decreased to four (4) years. Any costs amortized over the length of the relationship have been modified appropriately (e.g. licensure costs).
The Habilitation hourly rate included in the payments to families has been
modified to reflect the wage rate plus required benefits (as opposed to the agency rate schedule rate) to better reflect the cost of this service.
For the agency training staff, ERE was included at 30% as the wage level for
these positions exceeded $17.00 The mileage cost included for the agency staff that monitors the home is
calculated based on mileage per visit and number of visits per year. This differs from the approach in the current model of calculating the annual mileage costs based on the number of miles per year.
The base methodology for home oversight and supervision has been modified
from reflecting a pre-defined number of visits and hours with the family to a ‘caseload’ model. It is assumed that staff performing these duties can oversee 12 placements annually.
The costs associated with any Home-Based supports (e.g. Respite) provided by the QV to support the placement has been removed from the model. The CWG has recommended the Division update authorization and billing practices to allow for the approved Respite services to ensure separate tracking and monitoring.
The following assumptions were updated for the payments to family portion of the proposed rebased service model: The food expense is assumed at $288.86 per person per month, or $9.50 per
person per day, based on USDA Moderate-Cost Food Plan variations as of May

RebaseBook 2014 45 October 8, 2013
2012, inflated to December 2014, as indicated in Table 23. The USDA costs can be viewed at www.usda.gov.
Table 22
Food Costs Age Monthly Inflated Daily
20-50 years $294.90 $298.84 $9.8351 years and over $275.20 $278.88 $9.17Assumed Cost: Average $285.05 $288.86 $9.50
Table 23
Vendor Supported Developmental Home (Adult and Child) Assumption/Result Value Comments
Unit of Service 1 day Years family is under agency supervision
4
Days per year family under agency supervision
365
Initial Home Licensure, per year
$1242.98 ACYF rate of $2,809, multiplied by 50% DDD premium, spread over 5 years
Hourly wage for training staff
$17.83 This assumption is consistent with Arizona statewide hourly wage for Child, Family and School Social Worker (SOC Code 21-1021), taken from BLS as of May 2012 and inflated to December 2014 (6.33%).
ERE 30.0% of wages
Per guideline that wages in excess of $13.01 receive ERE at 30%
Initial Training, per year $487.50 84 hours plus $1,950 initial cost, spread over 5 years Ongoing Training, per year
$312.92 18 hours per year plus $417.22 cost spread over 5 years
Hourly wage for administrative/ Monitoring staff
$15.25
Blended Rate: - 50% Arizona statewide hourly wage for Child, Family and School
Social Worker (SOC Code 21-1021) of $16.26 - 50% Social and Human Service Assistant (SOC Code 21-1093) of
$14.09 Wages taken from BLS as of May 2012 and inflated to December 2014 (6.33%)
ERE 30% of wages Placements Supervised 12 Individual staff can monitor 12 placements annually Mileage, per year 840 miles 35 miles per visit and 24 visits per year
Mileage reimbursement 56.5 cents per mile
Program support 8% Administrative overhead 10% Total Retained by Agency $34.93 Total Payment to Family $57.98 Total Payment to Agency SFY 15
$92.91
Table 24
Room & Board, Vendor Supported Developmental Home, Adults and Children Assumption/Result Value Comments
Unit of Service 1 day Number of days receiving service
365
Square footage 250 Cost per square foot $14.00 Includes maintenance, utilities, phone Meals per individual per day
$9.50
Total RRB $19.09 Habilitation hours 4
Habilitation hourly rate $12.95 Consistent with the Habilitation, Support base wage rate plus required benefits.
Monthly number of miles 250 miles
Mileage reimbursement 56.5 cents per mile

RebaseBook 2014 46 October 8, 2013
Assumption/Result Value Comments Administrative overhead 2% Total Payment to Family $57.98 Room & Board $19.09
Group Home Services The rebasing project included four Group Home services: Habilitation, Community Protection and Treatment Group Home Habilitation, Group Home Habilitation, Nursing Supported Group Home Room and Board, All Group Homes
Changes to Rate Models In addition to the general methodological changes and assumptions applied to all of the rebased rate models and discussed in the GENERAL METHODOLOGIES FOR REBASED RATES section of the RebaseBook, the following changes to the rebased cost models were made as compared to the SFY 2004 cost models: The proposed rebased models are continuing to express the Habilitation, Group
Home reimbursement in terms of a staff hour unit. The methodology for determining the reimbursement for transportation costs has
been changed. In the current models, vehicle acquisition was allocated to the staff hour. The proposed rebased models have instead replaced the standard mileage rate of $0.565 per mile with an ‘enhanced mileage rate’, similar to the enhanced mileage rate that is included in the Day Treatment and Training rebased models.
The following assumptions were used to determine the enhanced mileage rate:
o Standard mileage rate $0.565 o Discount acquisition -$0.230 o Addition for acquisition adjustment +$0.485
The resulting rate is $0.82 per mile.
Table 25
Group Home Daily Mileage Assumption Activity Mileage Doctor’s appointment 15 Day Treatment and Training or similar 20 Recreational activities 15 Total 50
Total average staff hours per day are assumed at 42.86, calculated as:
(5.34 average FTE per site per day) x (8 hours per day) = 42.86 hours per day.

RebaseBook 2014 47 October 8, 2013
On average, every staff hour has 1.17 miles allocated, calculated as: (50 miles per day) / (42.86 hours per day) = 1.17 miles per staff hour.
For Room and Board, the proposed rebased model changes the methodology used
to determine the “blended” daily rates. In the current models, it is assumed that up to two (2) individuals could occupy a single bedroom. In the proposed rebased model it is assumed that only one (1) individual occupies a bedroom. This is based on the results of the provider survey and other research by the CWG.
The following assumptions were made for Room and Board, All Group Homes,
rate models:
o The CWG has recommended only two (2) rate models be supported for Room & Board. These models are included in this document as Urban and Rural models. Generally, the factors utilized for each model are based upon the maximum value for any geographic data obtained for the appropriate portion of the state. For example, rental costs were obtained for various geographic areas, the maximum value between Maricopa and Pima counties was utilized for the Urban model.
o Rental payments were derived based on the size of the home and its
geographical location from a number of data sources. The current rate model, the provider survey and data from the U.S. Department of Housing and Urban Development (HUD) were reviewed. The data from HUD was taken from Fair Market Rent History (2013) (available at www.huduser.org/portal/datasets/fmr.html) and information was extracted for Maricopa, Pima, and Coconino counties as well as the combined data for Yuma/Yavapai counties. As a general rule, the proposed rebased model assumes the HUD data as the factor for rent.
Table 26
Percentage of HUD Reported Data Used for Rental Payments Number of bedrooms
1 2 3 4 5 6 Coconino County 100% 100% 100% 100% 100% 100% Maricopa County 100% 100% 100% 100% 100% 100% Pima County 100% 100% 100% 100% 100% 100% Yavapai County 100% 100% 100% 100% 100% 100%
Table 27
Rental Payment Values Used in Room and Board Models Number of bedrooms
1 2 3 4 5 6 Urban Maricopa&Pima
$748.00 $925.00 $1,363.00 $1,592.00 $1,899.50 $2,196.50
Rural (Excludes Maricopa & Pima)
$852.00 $1066.00 $1,353.00 $1,724.00 $1,974.50 $2,264.80
o Utility payments (including electricity, water, trash, phone, etc.) were
developed as state-wide figures. The data for electricity payments were obtained from the Arizona Public Service standard pricing plan. Data

RebaseBook 2014 48 October 8, 2013
obtained from the city of Phoenix standard rates and CenturyLink standard pricing plan. The values used for utility payments are depicted in Table 28.
Table 28
Utility Payment Values Used in Room and Board Models Number of bedrooms (per month costs)
1 2 3 4 5 6 Electricity $84.68 $135.84 $187.01 $238.18 $340.52 $419.45 Water, trash, etc. $51.50 $58.50 $65.50 $72.50 $79.50 $86.50 Total $136.18 $194.34 $252.51 $310.68 $420.02 $505.95
o Maintenance expenses are assumed to be $50 per month for a one-
bedroom home with a $10.00 increase for each additional bedroom in the home. Household consumables expenses are assumed to be $50 per month for a one-bedroom home with a $5.00 increase for each additional bedroom in the home. The values used for maintenance and household consumables expense are depicted in Table 29:
Table 29
Maintenance Expense Values Used in Room and Board Models (Including Maintenance and Household Consumables)
Number of bedrooms 1 2 3 4 5 6
Maintenance $50.00 $60.00 $70.00 $80.00 $90.00 $100.00 Household Consumables $50.00 $55.00 $60.00 $65.00 $70.00 $75.00
o Food expenses are assumed to be $288.86 per person per month. Meal
expense is based on USDA Moderate-Cost Plan variations as of May 2012, inflated to December 2014, as indicated in Table 30:
Table 30
Food Cost Used in Room and Board Models Age Monthly Inflated Daily
20-50 years $294.90 $298.84 $9.8351 years and over $275.20 $278.88 $9.17Assumed Cost: Average $285.05 $288.86 $9.50
The application of the Room and Board assumptions are displayed in the
following Table. The Table indicates the daily per-person Room and Board rate calculated with the following assumptions:
o A two-bedroom home o Two members residing in the home o The home is located in the Flagstaff metropolitan area (Rural) o There are 30.4 days per month (on average).

RebaseBook 2014 49 October 8, 2013
Table 31 Example of the Monthly and Daily Values Used in Room and Board Models
Amounts are Per Person
Expense Area Calculation Daily Value Daily /
Resident Rent $1066.00/2 $35.07 $17.53 Utilities $239.34/2 $7.87 $3.94 Maintenance $60.00/2 $1.97 $0.99 Household Consumables $55.00/2 $1.81 $0.90 Food $577.72/2 $19.00 $9.50 Total $32.86
Table 32
Habilitation, Community Protection & Treatment, Group Home Assumption/Result Value Comments
Unit of Service 60 minutes
Hourly wage $11.44
Blended Rate: - 30% Rehabilitation Counselors (SOC Code 21-1015) of $14.70 - 70% Personal and Home Care Aide (SOC Code 39-9021) of $9.79 All wages were taken from BLS as of May 2012 and inflated to December 2014 (6.33%)
ERE 35.0% of wages Recordkeeping 0 Included in direct service time. Training Time 0.21 hours per shift Approx. 56 hours per year, for 3 years of employment Employer Time 0.10 hours per shift 0.50 hours per week
Average on-site time 7.69 hours per day Billable Hours – difference between Total Hours and other productivity components
Mileage 1.17 miles Based on transportation assumptions Mileage reimbursement 82.0 cents per mile Utilizing ‘Enhanced Mileage Rate’ Program support 8% Administrative overhead 10% SFY 15 Benchmark Rate $20.76
Table 33
Habilitation, Group Home Assumption/Result Value Comments
Unit of Service 60 minutes
Hourly wage $11.44
Blended Rate: - 30% Rehabilitation Counselors (SOC Code 21-1015) of $14.70 - 70% Personal and Home Care Aide (SOC Code 39-9021) of $9.79 All wages were taken from BLS as of May 2012 and inflated to December 2014 (6.33%)
ERE 35.0% of wages Recordkeeping 0 Included in direct service time. Training Time 0.15 hours per shift Approx. 40 hours per year, for 3 years of employment Employer Time 0.10 hours per shift 0.50 hours per week
Average on-site time 7.75 hours per day Billable Hours – difference between Total Hours and other productivity components
Mileage 1.17 miles Based on transportation assumptions Mileage reimbursement 82.0 cents per mile Utilizing ‘Enhanced Mileage Rate’ Program support 8% Administrative overhead 10% SFY 15 Benchmark Rate $20.61
Table 34
Habilitation, Nursing Supported Group Home (Level I) Assumption/Result Value Comments
Unit of Service 60 minutes
Hourly wage $33.78 (RN) $13.15 (CNA)
Rate: - 100% Registered Nurse (SOC Code 29-1141) of $31.77 - 100% Nursing Assistant (SOC Code 31.1041) of $12.37 All wages were taken from BLS as of May 2012 and inflated to December 2014 (6.33%)
ERE 23.0% - (RN)

RebaseBook 2014 50 October 8, 2013
Assumption/Result Value Comments 30.0% - (CNA)
Avg. Daily Hours 4.80 - RN 4.80 - CNA
Average daily staffing for five (5) residents in Level I home
Recordkeeping 0 Included in direct service time. Training Time 0.21 hours per shift Approx. 56 hours per year, for 3 years of employment
Average on-site time 7.79 hours per day Billable Hours – difference between Total Hours and other productivity components
Mileage 80.0 miles Total miles for home Mileage reimbursement 82.0 cents per mile Utilizing ‘Enhanced Mileage Rate’ Program support 8% Administrative overhead 10% SFY 15 Benchmark Rate $368.57 Other rates $402.84 (Level II) to $451.83 (Level III)
Professional Services The rebasing project included eleven Professional services: Home Health Aide Nursing, Visit Nursing, Intermittent Nursing, Continuous Nursing, Respite Therapy Services, Clinical Therapy Services, Natural Therapy Service Assistants, Clinical Therapy Service Assistants, Natural Respiratory Therapy, Clinical Respiratory Therapy, Natural
Changes to Rate Models In addition to the general methodological changes and assumptions applied to all of the rebased rate models and discussed in the GENERAL METHODOLOGIES FOR REBASED RATES section of the RebaseBook, the following changes to the rebased cost models were made as compared to the SFY 2004 cost models: Based upon feedback and to better meet the needs of members the Division
directed the CWG to construct a Nursing, Visit rate for use when services are provided to a member for less than one hour.
The rates for the Nursing services have been separated into a rate for RNs and a
rate for LPNs – there is no longer a “blended rate” as in the current rate structure
For the Nursing services, the proposed rebased models have been restructured to conform to AHCCCS billing rules. Under the new rate structure:
The Nursing, Visit rate is to be utilized for individual visits for a member
of up to 55 minutes, up to 4 visits per day. If more than 4 visits occur within the same calendar day for the same member, the provider must

RebaseBook 2014 51 October 8, 2013
utilize either the Nursing, Intermittent or Nursing, Continuous rates as appropriate.
The Nursing, Intermittent hourly rate is to be utilized for services to the
same member, on the same calendar day, not to exceed 2 hours per visit and no more than 4 hours in one calendar day.
The Nursing, Continuous hourly rate is to be utilized for services to the
same member, on the same calendar day, for more than 2 continuous hours in one calendar or for more than 4 hours in one calendar day.
The Nursing, Respite hourly rate is to be utilized in place of Respite,
Hourly for members that require the service be provided by a skilled nurse.
For Therapy services, the CWG is recommending ‘unifying’ the billing processes
for Therapy Assistants. Currently, Therapy Assistants of differing disciplines bill the Division and are reimbursed under differing processes. To support this effort, the CWG has recommended a single ‘unified’ Therapy Assistant service rate model.
Table 35
Home Health Aide Assumption/Result Value Comments
Unit of Service 60 minutes
Hourly wage $10.47 This assumption is consistent with Arizona statewide hourly wage for Home Health Aide (SOC Code 31-1011) of $9.85, taken from BLS as of May 2012 and inflated to December 2014 (6.33%)
ERE 35.0% of wages Average travel 1.07 hours per shift Recordkeeping 0.20 hours per shift 1 hour per week Training time 0.15 hours per shift Approx. 40 hours per year, for 3 years of employment
Missed Appointments 0.05 hours per shift 0.25 hours per week, Adjustment due to appointments missed (e.g. member unavailable).
Employer Time 0.10 hours per shift 0.50 hours per week
Average on-site time 6.43 hours per day Billable Hours – difference between Total Hours and other productivity components
Supervisor hourly wage $33.78 Daily portion of supervision
0.25 hours per day
Mileage 22.5 miles Average distance for each trip of 7.5 miles Mileage reimbursement 56.5 cents per mile Program support 8% Administrative overhead 10% SFY 15 Benchmark Rate $25.83
Table 36
Nursing, Visit RN Assumption/Result Value Comments
Unit of Service 1 visit Less than 55 minutes per visit and not to exceed four hours per day
Hourly wage $33.78
- 100% Arizona statewide hourly wage for Registered Nurse (SOC Code 29-1111) of $31.77
All wages were taken from BLS as of May 2012 and inflated to December 2014 (6.33%)
ERE 23.0% of wages Average travel 1.57 hours per shift
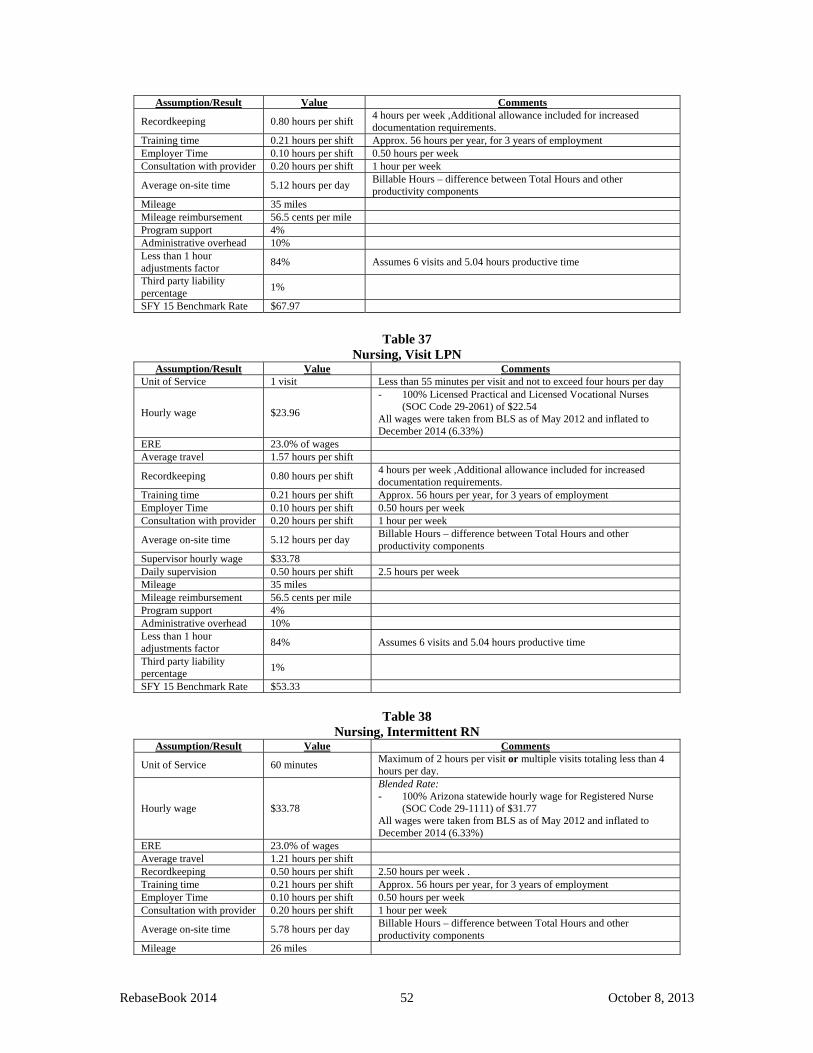
RebaseBook 2014 52 October 8, 2013
Assumption/Result Value Comments
Recordkeeping 0.80 hours per shift 4 hours per week ,Additional allowance included for increased documentation requirements.
Training time 0.21 hours per shift Approx. 56 hours per year, for 3 years of employment Employer Time 0.10 hours per shift 0.50 hours per week Consultation with provider 0.20 hours per shift 1 hour per week
Average on-site time 5.12 hours per day Billable Hours – difference between Total Hours and other productivity components
Mileage 35 miles Mileage reimbursement 56.5 cents per mile Program support 4% Administrative overhead 10% Less than 1 hour adjustments factor
84% Assumes 6 visits and 5.04 hours productive time
Third party liability percentage
1%
SFY 15 Benchmark Rate $67.97
Table 37
Nursing, Visit LPN Assumption/Result Value Comments
Unit of Service 1 visit Less than 55 minutes per visit and not to exceed four hours per day
Hourly wage $23.96
- 100% Licensed Practical and Licensed Vocational Nurses (SOC Code 29-2061) of $22.54
All wages were taken from BLS as of May 2012 and inflated to December 2014 (6.33%)
ERE 23.0% of wages Average travel 1.57 hours per shift
Recordkeeping 0.80 hours per shift 4 hours per week ,Additional allowance included for increased documentation requirements.
Training time 0.21 hours per shift Approx. 56 hours per year, for 3 years of employment Employer Time 0.10 hours per shift 0.50 hours per week Consultation with provider 0.20 hours per shift 1 hour per week
Average on-site time 5.12 hours per day Billable Hours – difference between Total Hours and other productivity components
Supervisor hourly wage $33.78 Daily supervision 0.50 hours per shift 2.5 hours per week Mileage 35 miles Mileage reimbursement 56.5 cents per mile Program support 4% Administrative overhead 10% Less than 1 hour adjustments factor
84% Assumes 6 visits and 5.04 hours productive time
Third party liability percentage
1%
SFY 15 Benchmark Rate $53.33
Table 38
Nursing, Intermittent RN Assumption/Result Value Comments
Unit of Service 60 minutes Maximum of 2 hours per visit or multiple visits totaling less than 4 hours per day.
Hourly wage $33.78
Blended Rate: - 100% Arizona statewide hourly wage for Registered Nurse
(SOC Code 29-1111) of $31.77 All wages were taken from BLS as of May 2012 and inflated to December 2014 (6.33%)
ERE 23.0% of wages Average travel 1.21 hours per shift Recordkeeping 0.50 hours per shift 2.50 hours per week . Training time 0.21 hours per shift Approx. 56 hours per year, for 3 years of employment Employer Time 0.10 hours per shift 0.50 hours per week Consultation with provider 0.20 hours per shift 1 hour per week
Average on-site time 5.78 hours per day Billable Hours – difference between Total Hours and other productivity components
Mileage 26 miles

RebaseBook 2014 53 October 8, 2013
Assumption/Result Value Comments Mileage reimbursement 56.5 cents per mile Program support 4% Administrative overhead 10% Third party liability percentage
1%
SFY 15 Benchmark Rate $70.65
Table 39
Nursing, Intermittent LPN Assumption/Result Value Comments
Unit of Service 60 minutes Maximum of 2 hours per visit or multiple visits totaling less than 4 hours per day.
Hourly wage $23.96
Blended Rate: - 100% Licensed Practical and Licensed Vocational Nurses
(SOC Code 29-2061) of $22.54 All wages were taken from BLS as of May 2012 and inflated to December 2014 (6.33%)
ERE 23.0% of wages Average travel 1.21 hours per shift Recordkeeping 0.50 hours per shift 2.50 hours per week Training time 0.21 hours per shift Approx. 56 hours per year, for 3 years of employment Employer Time 0.10 hours per shift 0.50 hours per week Consultation with provider 0.20 hours per shift 1 hour per week
Average on-site time 5.78 hours per day Billable Hours – difference between Total Hours and other productivity components
Supervisor hourly wage $33.78 Daily supervision 0.50 hours per shift 2.50 hours per week Mileage 26 miles Mileage reimbursement 56.5 cents per mile Program support 4% Administrative overhead 10% Third party liability percentage
1%
SFY 15 Benchmark Rate $55.21
Table 40
Nursing, Continuous/Respite RN Assumption/Result Value Comments
Unit of Service 60 minutes Utilized for visits of more than 2 hours or multiple visits totaling more than 4 hours per day.
Hourly wage $33.78
- 100% Arizona statewide hourly wage for Registered Nurse (SOC Code 29-1111) of $31.77
All wages were taken from BLS as of May 2012 and inflated to December 2014 (6.33%)
ERE 23.0% of wages Average travel 0 Recordkeeping 0.20 hours per shift 1.00 hours per week . Training time 0.21 hours per shift Approx. 56 hours per year, for 3 years of employment Employer Time 0.10 hours per shift 0.50 hours per week Consultation with provider 0.20 hours per shift 1 hour per week
Average on-site time 7.29 hours per day Billable Hours – difference between Total Hours and other productivity components
Mileage 0 miles Mileage reimbursement 56.5 cents per mile Program support 4% Administrative overhead 10% Third party liability percentage
1%
SFY 15 Benchmark Rate $53.64

RebaseBook 2014 54 October 8, 2013
Table 41 Nursing, Continuous/Respite LPN
Assumption/Result Value Comments
Unit of Service 60 minutes Utilized for visits of more than 2 hours or multiple visits totaling more than 4 hours per day.
Hourly wage $23.96
- 100% Licensed Practical and Licensed Vocational Nurses (SOC Code 29-2061) of $22.54
All wages were taken from BLS as of May 2012 and inflated to December 2014 (6.33%)
ERE 23.0% of wages Average travel 0 Recordkeeping 0.20 hours per shift 1.00 hours per week . Training time 0.21 hours per shift Approx. 56 hours per year, for 3 years of employment Employer Time 0.10 hours per shift 0.50 hours per week Consultation with provider 0.20 hours per shift 1 hour per week
Average on-site time 7.29 hours per day Billable Hours – difference between Total Hours and other productivity components
Supervisor hourly wage $33.78 Daily supervision 0.50 hours per shift 2.50 hours per week Mileage 0 miles Mileage reimbursement 56.5 cents per mile Program support 4% Administrative overhead 10% Third party liability percentage
1%
SFY 15 Benchmark Rate $41.40
Table 42
Therapy Services, Clinical Assumption/Result Value Comments
Unit of Service 60 minutes
Hourly wage $36.63 - 100% Physical Therapist (SOC Code 29-1123) of $36.63 All wages were taken from BLS as of May 2012 and inflated to December 2014 (6.33%)
ERE 23.0% of wages Average travel 0 Recordkeeping and Documentation
0.65 hours per shift 3.25 hour per week
Consultation provider/family
0.40 hours per shift 2 hours per week
Employer Time 0.10 hours per shift 0.50 hours per week Missed Appointments 0.05 hours per shift 0.25 hours per week Training time 0.21 hours per shift Approx. 56 hours per year, for 3 years of employment
Average on-site time 6.59 hours per day Billable Hours – difference between Total Hours and other productivity components
Mileage 0 miles
Rent $3.51 Rent cost per hour. Assumes 300 sq. ft., cost of $20.07 per sq. ft. allocated over 1,713 hours per year.
Capital Cost $0.58 Capital cost per hour. Assumes $3,000 costs for maintenance over 3 years allocated over 1,713 hours per year.
Program support 4% Administrative overhead 10% Third party liability percentage
1%
SFY 15 Benchmark Rate $69.17
Table 43
Therapy Services, Natural Assumption/Result Value Comments
Unit of Service 60 minutes
Hourly wage $36.63 - 100% Physical Therapist (SOC Code 29-1123) of $36.63 All wages were taken from BLS as of May 2012 and inflated to December 2014 (6.33%)
ERE 23.0% of wages Average travel 1.77 hours per day

RebaseBook 2014 55 October 8, 2013
Assumption/Result Value Comments Recordkeeping and Documentation
0.65 hours per shift 3.25 hour per week
Consultation provider/family
0.40 hours per shift 2 hours per week
Employer Time 0.10 hours per shift 0.50 hours per week Missed Appointments 0.05 hours per shift 0.25 hours per week Training time 0.21 hours per shift Approx. 56 hours per year, for 3 years of employment
Average on-site time 5.04 hours per day Billable Hours – difference between Total Hours and other productivity components
Mileage 40 miles Mileage reimbursement 56.5 cents per mile
Rent $1.53 Rent cost per hour. Assumes 100 sq. ft., cost of $20.07 per sq. ft. allocated over 1,310 hours per year.
Capital Cost $0.51 Capital cost per hour. Assumes $2,000 costs for maintenance over 3 years allocated over 1,310 hours per year.
Program support 4% Administrative overhead 10% Third party liability percentage
1%
SFY 15 Benchmark Rate $91.81
Table 44
Therapy Assistant, Clinical Assumption/Result Value Comments
Unit of Service 60 minutes
Hourly wage $17.41
- 100% Physical Therapy Assistants (SOC Code 31-2021) of $17.41
All wages were taken from BLS as of May 2012 and inflated to December 2014 (6.33%)
ERE 30.0% of wages Average travel 0 Recordkeeping and Documentation
0.53 hours per shift 2.65 hour per week
Consultation provider/family
0.32 hours per shift 1.60 hours per week
Employer Time 0.30 hours per shift 1.50 hours per week; Additional time to meet with supervisor Missed Appointments 0.05 hours per shift 0.25 hours per week Training time 0.21 hours per shift Approx. 56 hours per year, for 3 years of employment
Average on-site time 6.59 hours per day Billable Hours – difference between Total Hours and other productivity components
Mileage 0 miles
Rent $3.51 Rent cost per hour. Assumes 300 sq. ft., cost of $20.07 per sq. ft. allocated over 1,713 hours per year.
Capital Cost $0.58 Capital cost per hour. Assumes $3,000 costs for maintenance over 3 years allocated over 1,713 hours per year.
Supervision Cost $9.23 per hour Based on 1.35 hours of supervision per day by Therapist. Program support 4% Administrative overhead 10% Third party liability percentage
1%
SFY 15 Benchmark Rate $48.00
Table 45
Therapy Assistant, Natural Assumption/Result Value Comments
Unit of Service 60 minutes
Hourly wage $17.41
- 100% Physical Therapy Assistants (SOC Code 31-2021) of $17.41
All wages were taken from BLS as of May 2012 and inflated to December 2014 (6.33%)
ERE 30.0% of wages Average travel 1.77 hours per day Recordkeeping and Documentation
0.38 hours per shift 1.90 hour per week

RebaseBook 2014 56 October 8, 2013
Assumption/Result Value Comments Consultation provider/family
0.20 hours per shift 1.00 hours per week
Employer Time 0.30 hours per shift 1.50 hours per week; Additional time to meet with supervisor Missed Appointments 0.10 hours per shift 0.50 hours per week Training time 0.21 hours per shift Approx. 56 hours per year, for 3 years of employment
Average on-site time 5.04 hours per day Billable Hours – difference between Total Hours and other productivity components
Mileage 40 miles Mileage reimbursement 56.5 cents per mile
Rent $1.53 Rent cost per hour. Assumes 100 sq. ft., cost of $20.07 per sq. ft. allocated over 1,310 hours per year.
Capital Cost $0.51 Capital cost per hour. Assumes $2,000 costs for maintenance over 3 years allocated over 1,310 hours per year.
Supervision Cost $12.07 per hour Based on 1.35 hours of supervision per day by Therapist. Program support 4% Administrative overhead 10% Third party liability percentage
1%
SFY 15 Benchmark Rate $64.14
Table 46
Respiratory Therapy, Clinical Assumption/Result Value Comments
Unit of Service 60 minutes
Hourly wage $24.98 - 100% Respiratory Therapist (SOC Code 29-1126) of $24.98 All wages were taken from BLS as of May 2012 and inflated to December 2014 (6.33%)
ERE 23.0% of wages Average travel 0 Recordkeeping and Documentation
1.00 hours per shift 5.0 hours per week
Consultation provider/family
0.25 hours per shift 1.25 hours per week
Employer Time 0.20 hours per shift 1.0 hour per week Missed Appointments 0.05 hours per shift 0.25 hours per week Training time 0.21 hours per shift Approx. 56 hours per year, for 3 years of employment
Average on-site time 6.29 hours per day Billable Hours – difference between Total Hours and other productivity components
Mileage 0 miles Program support 4% Administrative overhead 10% SFY 15 Benchmark Rate $45.44
Table 47
Respiratory Therapy, Natural Assumption/Result Value Comments
Unit of Service 60 minutes
Hourly wage $24.98 - 100% Respiratory Therapist (SOC Code 29-1126) of $24.98 All wages were taken from BLS as of May 2012 and inflated to December 2014 (6.33%)
ERE 23.0% of wages Average travel 1.77 hours per day Recordkeeping and Documentation
0.47 hours per shift 2.35 hours per week
Consultation provider/family
0.13 hours per shift 0.65 hours per week
Employer Time 0.20 hours per shift 1.0 hour per week Missed Appointments 0.05 hours per shift 0.25 hours per week Training time 0.21 hours per shift Approx. 56 hours per year, for 3 years of employment
Average on-site time 5.17 hours per day Billable Hours – difference between Total Hours and other productivity components
Mileage 40 miles Mileage reimbursement 56.5 cents per mile Program support 4% Administrative overhead 10%

RebaseBook 2014 57 October 8, 2013
Assumption/Result Value Comments SFY 15 Benchmark Rate $60.37
Employment Services The rebasing project includes four Employment services: Center-Based Employment Group Supported Employment Individual Supported Employment Transition to Employment
Changes to Rate Models In addition to the general methodological changes and assumptions applied to all of the rebased rate models and discussed in the GENERAL METHODOLOGIES FOR REBASED RATES section of the RebaseBook, the following changes to the rebased cost models were made as compared to the SFY 2004 cost models: The Center-Based Employment model includes ratios of 1:3 and 1:9 in addition to
the 1:6 ratio for both urban and rural services. There is a capital adjustment factor of 25% for the capital costs in the Center-
Based Employment model. This factor represents a change in the methodology in that 25% of the capital costs are reimbursed by the Division. This adjustment factor is not included in the current ratebook.
The In-Program Transportation component in the current model for Center-Based Employment is not included in the rebased model.
The presentation of the Group Supported Employment rate model was adjusted to be consistent with the format used in the Day Treatment and other Employment to calculated rates at different staffing ratios. The ratios of 1:7 and 1:8 have been removed from the model.
The capital costs component has been removed from the Group Supported Employment model.
Transition to Employment is a new service that has been added to the employment models. This service is built based on a 1:4 ratio.
Table 48
Center-Based Employment, Urban (1:3) Assumption/Result Value Comments
Unit of Service 60 minutes
Hourly wage $11.71
- 5% Educational, Guidance, and Vocational Counselors (SOC Code 21-1012) of $19.41
- 15% Rehabilitation counselors (SOC Code 21-1015) of $14.20 - 80% Recreation Workers (SOC Code 39-9032) of $9.90 All wages were taken from BLS as of May 2012 and inflated to December 2014 (6.33%)
ERE 35.0% of wages
ISP Meetings 0.06 hours per shift 0.30 hours per week; Assumes 4 hours per person per year. Varies based on the staffing ratio.
Recordkeeping and Documentation
0.15 hours per shift 0.75 hours per week; Assumes 15 minutes per person per week.
Employer Time 0.10 hours per shift 0.50 hours per week

RebaseBook 2014 58 October 8, 2013
Assumption/Result Value Comments Training time 0.15 hours per shift Approx. 40 hours per year, for 3 years of employment Job Development Time 0.25 hours per shift 1.25 hours per week Program set-up/clean-up 0.75 hours per shift 3.75 per week
Average on-site time 6.54 hours per day Billable Hours – difference between Total Hours and other productivity components
Supplies Cost $2.50 per day Supply costs per individual per day of $2.50.
Capital Costs $12.54 per day This is the cost per person per day for urban. The capital cost per day per person in the rural models is $20.36.
Capital adjustment factor 25% Program support 8% Administrative overhead 10% SFY 15 Benchmark Rate $10.88 Other rates $6.16 (1:6) & $4.62 (1:9)
Table 49
Center-Based Employment, Rural (1:3) Assumption/Result Value Comments
Unit of Service 60 minutes
Hourly wage $11.71
- 5% Educational, Guidance, and Vocational Counselors (SOC Code 21-1012) of $19.41
- 15% Rehabilitation counselors (SOC Code 21-1015) of $14.20 - 80% Recreation Workers (SOC Code 39-9032) of $9.90 All wages were taken from BLS as of May 2012 and inflated to December 2014 (6.33%)
ERE 35.0% of wages
ISP Meetings 0.06 hours per shift 0.30 hours per week; Assumes 4 hours per person per year. Varies based on the staffing ratio.
Recordkeeping and Documentation
0.15 hours per shift 0.75 hours per week; Assumes 15 minutes per person per week.
Employer Time 0.10 hours per shift 0.50 hours per week Training time 0.15 hours per shift Approx. 40 hours per year, for 3 years of employment Job Development Time 0.25 hours per shift 1.25 hours per week Program set-up/clean-up 0.75 hours per shift 3.75 per week
Average on-site time 6.54 hours per day Billable Hours – difference between Total Hours and other productivity components
Supplies Cost $2.50 per day Supply costs per individual per day of $2.50.
Capital Costs $20.36 per day This is the cost per person per day for urban. The capital cost per day per person in the rural models is $20.36.
Capital adjustment factor 25% Program support 8% Administrative overhead 10% SFY 15 Benchmark Rate $11.24 Other rates $6.54 (1:6) & $5.01 (1:9)
Table 50
Group Supported Employment, Urban (1:2) Assumption/Result Value Comments
Unit of Service 60 minutes
Hourly wage $12.54
- 20% Educational, Guidance, and Vocational Counselors (SOC Code 21-1012) of $19.41
- 80% Recreation Workers (SOC Code 39-9032) of $9.90 All wages were taken from BLS as of May 2012 and inflated to December 2014 (6.33%)
ERE 35.0% of wages Recordkeeping and Documentation
0.10 hours per shift 0.50 hours per week; Assumes 15 minutes per person per week.
Employer Time 0.10 hours per shift 0.50 hours per week Training time 0.15 hours per shift Approx. 40 hours per year, for 3 years of employment Job Development Time 0.25 hours per shift 1.25 hours per week
ISP Meetings 0.04 hours per shift 0.20 hours per week; Assumes 4 hours per person per year. Varies based on the staffing ratio.
Average on-site time 7.36 hours per day Billable Hours – difference between Total Hours and other productivity components
Supplies Cost $1.75 per day Supply costs per individual per day. Number of Miles 15 miles per day Mileage reimbursement $0.82 per mile

RebaseBook 2014 59 October 8, 2013
Assumption/Result Value Comments Program support 8% Administrative overhead 10% SFY 15 Benchmark Rate $16.35 Other rates $11.79 (1:3),$9.52 (1:4), $8.17 (1:5) & $7.28 (1:6)
Table 51
Group Supported Employment, Rural (1:2) Assumption/Result Value Comments
Unit of Service 60 minutes
Hourly wage $12.54
- 20% Educational, Guidance, and Vocational Counselors (SOC Code 21-1012) of $19.41
- 80% Recreation Workers (SOC Code 39-9032) of $9.90 All wages were taken from BLS as of May 2012 and inflated to December 2014 (6.33%)
ERE 35.0% of wages Recordkeeping and Documentation
0.10 hours per shift 0.50 hours per week; Assumes 15 minutes per person per week.
Employer Time 0.10 hours per shift 0.50 hours per week Training time 0.15 hours per shift Approx. 40 hours per year, for 3 years of employment Job Development Time 0.25 hours per shift 1.25 hours per week
ISP Meetings 0.04 hours per shift 0.20 hours per week; Assumes 4 hours per person per year. Varies based on the staffing ratio.
Average on-site time 7.36 hours per day Billable Hours – difference between Total Hours and other productivity components
Supplies Cost $1.75 per day Supply costs per individual per day. Number of Miles 20 miles per day Mileage reimbursement $0.82 per mile Program support 8% Administrative overhead 10% SFY 15 Benchmark Rate $17.03 Other rates $12.48 (1:3),$10.21 (1:4), $8.87 (1:5) & $7.99 (1:6)
Table 52
Individual Supported Employment, Job Coaching, Urban Assumption/Result Value Comments
Unit of Service 60 minutes
Hourly wage $14.56
- 40% Educational, Guidance, and Vocational Counselors (SOC Code 21-1012) of $19.41
- 60% Recreation Workers (SOC Code 39-9032) of $9.90 All wages were taken from BLS as of May 2012 and inflated to December 2014 (6.33%)
ERE 30.0% of wages Recordkeeping and Documentation
0.50 hours per shift 2.50 hours per week
Employer Time 0.10 hours per shift 0.50 hours per week ISP Meetings 0.15 hours per shift 0.75 hours per week Participating in Assessments
0.10 hours per shift 0.50 hours per week
Training time 0.15 hours per shift Approx. 40 hours per year, for 3 years of employment Job Development Time 0.50 hours per shift 2.5 hours per week Travel Time 1.52 hours per shift
Average on-site time 4.98 hours per day Billable Hours – difference between Total Hours and other productivity components
Number of Miles 33.8 miles per day Mileage reimbursement 56.5 cents per mile Program support 8% Administrative overhead 10% SFY 15 Benchmark Rate $41.76

RebaseBook 2014 60 October 8, 2013
Table 53 Individual Supported Employment, Job Coaching, Rural
Assumption/Result Value Comments Unit of Service 60 minutes
Hourly wage $14.56
- 40% Educational, Guidance, and Vocational Counselors (SOC Code 21-1012) of $19.41
- 60% Recreation Workers (SOC Code 39-9032) of $9.90 All wages were taken from BLS as of May 2012 and inflated to December 2014 (6.33%)
ERE 30.0% of wages Recordkeeping and Documentation
0.50 hours per shift 2.50 hours per week
Employer Time 0.10 hours per shift 0.50 hours per week ISP Meetings 0.15 hours per shift 0.75 hours per week Participating in Assessments
0.10 hours per shift 0.50 hours per week
Training time 0.15 hours per shift Approx. 40 hours per year, for 3 years of employment Job Development Time 0.50 hours per shift 2.5 hours per week Travel Time 2.57 hours per shift
Average on-site time 3.93 hours per day Billable Hours – difference between Total Hours and other productivity components
Number of Miles 60 miles per day Mileage reimbursement 56.5 cents per mile Program support 8% Administrative overhead 10% SFY 15 Benchmark Rate $57.51
Table 54
Individual Supported Employment, Job Development, Urban Assumption/Result Value Comments
Unit of Service 60 minutes
Hourly wage $14.56
- 40% Educational, Guidance, and Vocational Counselors (SOC Code 21-1012) of $19.41
- 60% Recreation Workers (SOC Code 39-9032) of $9.90 All wages were taken from BLS as of May 2012 and inflated to December 2014 (6.33%)
ERE 30.0% of wages Recordkeeping and Documentation
0.50 hours per shift 2.50 hours per week
Employer Time 0.10 hours per shift 0.50 hours per week ISP Meetings 0.15 hours per shift 0.75 hours per week Participating in Assessments
0.10 hours per shift 0.50 hours per week
Training time 0.15 hours per shift Approx. 40 hours per year, for 3 years of employment Job Development Time 2.00 hours per shift 10.0 hours per week Travel Time 0.37 hours per shift
Average on-site time 4.63 hours per day Billable Hours – difference between Total Hours and other productivity components
Number of Miles 5 miles per day Mileage reimbursement 56.5 cents per mile Program support 8% Administrative overhead 10% SFY 15 Benchmark Rate $40.63
Table 55
Individual Supported Employment, Job Development, Rural Assumption/Result Value Comments
Unit of Service 60 minutes
Hourly wage $14.56
- 40% Educational, Guidance, and Vocational Counselors (SOC Code 21-1012) of $19.41
- 60% Recreation Workers (SOC Code 39-9032) of $9.90 All wages were taken from BLS as of May 2012 and inflated to December 2014 (6.33%)
ERE 30.0% of wages

RebaseBook 2014 61 October 8, 2013
Assumption/Result Value Comments Recordkeeping and Documentation
0.50 hours per shift 2.50 hours per week
Employer Time 0.10 hours per shift 0.50 hours per week ISP Meetings 0.15 hours per shift 0.75 hours per week Participating in Assessments
0.10 hours per shift 0.50 hours per week
Training time 0.15 hours per shift Approx. 40 hours per year, for 3 years of employment Job Development Time 2.00 hours per shift 10.0 hours per week Travel Time 0.57 hours per shift
Average on-site time 4.43 hours per day Billable Hours – difference between Total Hours and other productivity components
Number of Miles 10 miles per day Mileage reimbursement 56.5 cents per mile Program support 8% Administrative overhead 10% SFY 15 Benchmark Rate $43.24
Table 56
Transition to Employment, Urban Assumption/Result Value Comments
Unit of Service 60 minutes
Hourly wage $16.70
- 50% Social and Human Service Assistants (SOC Code 21-1093) of $11.91
- 50% Special education teachers, middle school (SOC Code 25-2053) of $19.50
All wages were taken from BLS as of May 2012 and inflated to December 2014 (6.33%)
ERE 30.0% of wages Recordkeeping and Documentation
0.50 hours per shift 2.50 hours per week
Employer Time 0.10 hours per shift 0.50 hours per week ISP Meetings 0.08 hours per shift 0.40 hours per week Program set-up/clean-up 0.25 hours per shift 1.25 hours week Training time 0.15 hours per shift Approx. 40 hours per year, for 3 years of employment
Average on-site time 6.92 hours per day Billable Hours – difference between Total Hours and other productivity components
Number of Miles 2 miles per day Mileage reimbursement $0.82 per mile Capital Costs $2.51 per day Capital costs per individual per day. Program support 8% Administrative overhead 10% SFY 15 Benchmark Rate $10.30
Table 57
Transition to Employment, Rural Assumption/Result Value Comments
Unit of Service 60 minutes
Hourly wage $16.70
- 50% Social and Human Service Assistants (SOC Code 21-1093) of $11.91
- 50% Special education teachers, middle school (SOC Code 25-2053) of $19.50
All wages were taken from BLS as of May 2012 and inflated to December 2014 (6.33%)
ERE 30.0% of wages Recordkeeping and Documentation
0.50 hours per shift 2.50 hours per week
Employer Time 0.10 hours per shift 0.50 hours per week ISP Meetings 0.08 hours per shift 0.40 hours per week Program set-up/clean-up 0.25 hours per shift 1.25 hours week Training time 0.15 hours per shift Approx. 40 hours per year, for 3 years of employment
Average on-site time 6.92 hours per day Billable Hours – difference between Total Hours and other productivity components
Number of Miles 4 miles per day Mileage reimbursement $0.82 per mile

RebaseBook 2014 62 October 8, 2013
Assumption/Result Value Comments Capital Costs $5.63 per day Capital costs per individual per day. Program support 8% Administrative overhead 10% SFY 15 Benchmark Rate $11.13
Specialized Habilitation Services The rebasing project included three Specialized Habilitation services: Habilitation with Music Therapy Habilitation, Consultation
o Licensed Psychologist o Licensed Behavior Analyst o BCBA (Board Certified Behavior Analyst) o BCABA (Board Certified Assistant Behavior Analyst)
Habilitation, Early Childhood Autism Specialized o Masters o Bachelors o Habilitation Hourly
Changes to Rate Models There are no additional changes to this model other than the general methodological changes and assumptions applied to all of the rebased rate models and discussed in the GENERAL METHODOLOGIES FOR REBASED RATES section of the RebaseBook.
Table 58 Habilitation with Music Therapy
Assumption/Result Value Comments Unit of Service 60 minutes
Hourly wage $19.72
Blended Rate: - 10% Arizona statewide hourly wage for Child, Family and School
Social Worker (SOC Code 21-1021) of $17.70 - 90% Health Educators (21-1091) of $22.34 All wages were taken from BLS as of May 2012 and inflated to December 2014 (6.33%)
ERE 30% of wages Average travel 0.89 hours per shift Trips between members (60 minutes). Recordkeeping and Documentation
0.20 hours per shift 1.00 hours per week
Training Time 0.21 hours per shift Approx. 56hours per year, for 3 years of employment Employer Time 0.10 hours per shift 0.50 hours per week
Missed Appointments 0.05 hours per shift 0.25 hours per week; Adjustment due to appointments missed (e.g. member unavailable).
ISP Meetings 0.06 hours per shift Approx. 16 hours per year ISP Meetings 0.10 hours per shift Approx. 26 hours per year
Average on-site time 6.39 hours per day Billable Hours – difference between Total Hours and other productivity components
Mileage 18 miles Mileage reimbursement 56.5 cents per mile Program support 4% Administrative overhead 10% SFY 15 Benchmark Rate $39.66

RebaseBook 2014 63 October 8, 2013
Table 59 Habilitation, Consultation Licensed Psychologist Urban
Assumption/Result Value Comments Unit of Service 60 minutes
Hourly wage $60.97
Blended Rate: - 40% Psychologists, All Other (SOC Code 19-3039) of $37.40 - 60% Psychiatrists (29-1066) of $70.63 All wages were taken from BLS as of May 2012 and inflated to December 2014 (6.33%)
ERE 23.0% of wages Average travel 0.77 hours per shift Trips between members (60 minutes). Recordkeeping and Documentation
1.00 hours per shift 5.00 hours per week
Training Time 0.21 hours per shift Approx. 56hours per year, for 3 years of employment Employer Time 0.30 hours per shift 1.50 hours per week; Additional time for supervision/review activities
Missed Appointments 0.05 hours per shift 0.25 hours per week; Adjustment due to appointments missed (e.g. member unavailable).
Average on-site time 5.67 hours per day Billable Hours – difference between Total Hours and other productivity components
Mileage 15 miles Mileage reimbursement 56.5 cents per mile Program support 4% Administrative overhead 10% SFY 15 Benchmark Rate $124.77
Table 60
Habilitation, Consultation Licensed Psychologist Rural Assumption/Result Value Comments
Unit of Service 60 minutes
Hourly wage $60.97
Blended Rate: - 40% Psychologists, All Other (SOC Code 19-3039) of $37.40 - 60% Psychiatrists (29-1066) of $70.63 All wages were taken from BLS as of May 2012 and inflated to December 2014 (6.33%)
ERE 23.0% of wages Average travel 1.57 hours per shift Trips between members (80 minutes). Recordkeeping and Documentation
1.00 hours per shift 5.00 hours per week
Training Time 0.21 hours per shift Approx. 56hours per year, for 3 years of employment Employer Time 0.30 hours per shift 1.50 hours per week; Additional time for supervision/review activities
Missed Appointments 0.05 hours per shift 0.25 hours per week; Adjustment due to appointments missed (e.g. member unavailable).
Average on-site time 4.87 hours per day Billable Hours – difference between Total Hours and other productivity components
Mileage 35 miles Average distance for each trip of 7.5 miles Mileage reimbursement 56.5 cents per mile Program support 4% Administrative overhead 10% SFY 15 Benchmark Rate $147.97
Table 61
Habilitation, Consultation, Licensed Behavioral Analyst Assumption/Result Value Comments
Unit of Service 60 minutes
Hourly wage $26.61
Blended Rate: - 25% Social Scientists and Related Workers, All Other (SOC Code
19-3099) of $32.85 - 75% Therapists, All Other (29-1129) of $22.42 All wages were taken from BLS as of May 2012 and inflated to December 2014 (6.33%)
ERE 23.0% of wages Average travel 1.07 hours per shift Trips between members (55 minutes). Recordkeeping and Documentation
1.00 hours per shift 5.00 hours per week
Training Time 0.21 hours per shift Approx. 56hours per year, for 3 years of employment

RebaseBook 2014 64 October 8, 2013
Assumption/Result Value Comments Employer Time 0.30 hours per shift 1.50 hours per week; Additional time for supervision/review activities
Missed Appointments 0.05 hours per shift 0.25 hours per week; Adjustment due to appointments missed (e.g. member unavailable).
Average on-site time 5.37 hours per day Billable Hours – difference between Total Hours and other productivity components
Mileage 22.5 miles Average distance for each trip of 7.5 miles Mileage reimbursement 56.5 cents per mile Program support 4% Administrative overhead 10% SFY 15 Benchmark Rate $59.45 Assessment Benchmark equivalent to five (5) hours $297.25
Table 62
Habilitation, Consultation BCBA Assumption/Result Value Comments
Unit of Service 60 minutes
Hourly wage $26.61
Blended Rate: - 25% Social Scientists and Related Workers, All Other (SOC Code
19-3099) of $32.85 - 75% Therapists, All Other (29-1129) of $22.42 All wages were taken from BLS as of May 2012 and inflated to December 2014 (6.33%)
ERE 23.0% of wages Average travel 1.07 hours per shift Trips between members (55 minutes). Recordkeeping and Documentation
0.75 hours per shift 3.75 hours per week
Training Time 0.21 hours per shift Approx. 56hours per year, for 3 years of employment Employer Time 0.10 hours per shift 0.50 hours per week
Missed Appointments 0.05 hours per shift 0.25 hours per week; Adjustment due to appointments missed (e.g. member unavailable).
Average on-site time 5.82 hours per day Billable Hours – difference between Total Hours and other productivity components
Mileage 22.5 miles Average distance for each trip of 7.5 miles Mileage reimbursement 56.5 cents per mile Program support 4% Administrative overhead 10% SFY 15 Benchmark Rate $54.85
Table 63
Habilitation, Consultation BCABA Assumption/Result Value Comments
Unit of Service 60 minutes
Hourly wage $20.50
Blended Rate: - 75% Counselors, All Other (SOC Code 21-1019) of $18.24 - 25% Therapists, All Other (29-1129) of $22.42 All wages were taken from BLS as of May 2012 and inflated to December 2014 (6.33%)
ERE 23.0% of wages Average travel 1.07 hours per shift Trips between members (55 minutes). Recordkeeping and Documentation
0.75 hours per shift 3.75 hours per week
Training Time 0.21 hours per shift Approx. 56hours per year, for 3 years of employment Employer Time 0.10 hours per shift 0.50 hours per week
Missed Appointments 0.05 hours per shift 0.25 hours per week; Adjustment due to appointments missed (e.g. member unavailable).
Average on-site time 5.82 hours per day Billable Hours – difference between Total Hours and other productivity components
Mileage 22.5 miles Average distance for each trip of 7.5 miles Mileage reimbursement 56.5 cents per mile Program support 4% Administrative overhead 10% SFY 15 Benchmark Rate $42.84

RebaseBook 2014 65 October 8, 2013
Table 64 Habilitation, Early Childhood Autism Specialized (Masters)
Assumption/Result Value Comments Unit of Service 60 minutes
Hourly wage $26.61
Blended Rate: - 25% Social Scientists and Related Workers, All Other (SOC Code
19-3099) of $32.85 - 75% Therapists, All Other (29-1129) of $22.42 All wages were taken from BLS as of May 2012 and inflated to December 2014 (6.33%)
ERE 23.0% of wages Average travel 1.07 hours per shift Trips between members (55 minutes). Recordkeeping and Documentation
0.75 hours per shift 3.75 hours per week
Training Time 0.21 hours per shift Approx. 56hours per year, for 3 years of employment Employer Time 0.10 hours per shift 0.50 hours per week
Missed Appointments 0.05 hours per shift 0.25 hours per week; Adjustment due to appointments missed (e.g. member unavailable).
Average on-site time 5.82 hours per day Billable Hours – difference between Total Hours and other productivity components
Mileage 22.5 miles Average distance for each trip of 7.5 miles Mileage reimbursement 56.5 cents per mile Program support 4% Administrative overhead 10% SFY 15 Benchmark Rate $54.85
Table 65
Habilitation, Early Childhood Autism Specialized (Bachelors) Assumption/Result Value Comments
Unit of Service 60 minutes
Hourly wage $20.50
Blended Rate: - 75% Counselors, All Other (SOC Code 21-1019) of $18.24 - 25% Therapists, All Other (29-1129) of $22.42 All wages were taken from BLS as of May 2012 and inflated to December 2014 (6.33%)
ERE 23.0% of wages Average travel 1.07 hours per shift Ttrips between members (55 minutes). Recordkeeping and Documentation
0.75 hours per shift 3.75 hours per week
Training Time 0.21 hours per shift Approx. 56hours per year, for 3 years of employment Employer Time 0.10 hours per shift 0.50 hours per week
Missed Appointments 0.05 hours per shift 0.25 hours per week; Adjustment due to appointments missed (e.g. member unavailable).
Average on-site time 5.82 hours per day Billable Hours – difference between Total Hours and other productivity components
Mileage 22.5 miles Average distance for each trip of 7.5 miles Mileage reimbursement 56.5 cents per mile Program support 4% Administrative overhead 10% SFY 15 Benchmark Rate $42.84
Table 66
Habilitation, Early Childhood Autism Specialized Hourly Habilitation Assumption/Result Value Comments
Unit of Service 60 minutes
Hourly wage $11.68
Blended Rate: - 30% Rehabilitation Counselors (SOC Code 21-1015) of $14.20 - 70% Personal and Home Care Aide (SOC Code 39-9021) of
$9.61 All wages were taken from BLS as of May 2012 and inflated to December 2014 (6.33%)
ERE 35.0% of wages Average travel 0.89 hours per shift Trips between members (40 minutes). Recordkeeping and Documentation
0.20 hours per shift 1.00 hours per week
Training Time 0.21 hours per shift Approx. 56hours per year, for 3 years of employment

RebaseBook 2014 66 October 8, 2013
Assumption/Result Value Comments Employer Time 0.10 hours per shift 0.50 hours per week
Missed Appointments 0.05 hours per shift 0.25 hours per week; Adjustment due to appointments missed (e.g. member unavailable).
Average on-site time 6.55 hours per day Billable Hours – difference between Total Hours and other productivity components
Mileage 18.0 miles Average distance for each trip of 7.5 miles Mileage reimbursement 55.6 cents per mile Program support 8% Administrative overhead 10% SFY 15 Benchmark Rate $25.38
Transportation Services The rebasing project included two Transportation services: Flat Trip Rate for Regularly Scheduled Daily Transportation, Urban (Adult) Flat Trip Rate for Regularly Scheduled Daily Transportation, Rural (Adult) Single Person Modified (Urban) Single Person Modified (Rural) Extensive Transportation
Changes to Rate Models In addition to the general methodological changes and assumptions applied to all of the rebased rate models and discussed in the GENERAL METHODOLOGIES FOR REBASED RATES section of the RebaseBook, the following changes to the rebased cost models were made as compared to the SFY 2004 cost models: The rate models for Flat Trip Rate for Regularly Scheduled Daily Transportation
include only the portion of staff time and expenses related to transporting members to/from programs. “In program” transportation costs are now entirely reflected within the Day Program rate models.
The cost element for ‘Transportation Capital’ has been eliminated from the
models and an ‘Enhanced Mileage Rate’ has replaced this element. The derivation of the ‘Enhanced Mileage Rate’ is explained in the discussion for the Day Treatment and Training services above.
The following Tables contain the specific assumptions associated with the Transportation services.
Table 67 Flat Trip Rate for Regularly Scheduled Daily Transportation, Urban (Adult and Child)
Assumption/Result Value Comments Unit of Service Per Trip
Hourly wage $11.44
Blended Rate: - 20% Rehabilitation Counselors (SOC Code 21-1015) of $14.20 - 80% Personal and Home Care Aides (SOC Code 39-9021) of
$9.61 All wages taken from BLS as of May 2012 and inflated to December 2014 (6.33%).
ERE 35% of wages

RebaseBook 2014 67 October 8, 2013
Assumption/Result Value Comments Staff hours per day assigned to Transportation
3.0 Allocated from Day Program
Additional Staff hours per day
1.5 Transportation aide time added to allow for average of 1.5 staff per vehicle
Average number of members transported per day
6
Average mileage per member per day
10 miles
Mileage reimbursement 82.0 cents per mile Enhanced mileage rate Program support 8% Administrative overhead 10% SFY 15 Benchmark Rate $12.85
Table 68
Flat Trip Rate for Regularly Scheduled Daily Transportation, Rural (Adult) Assumption/Result Value Comments
Unit of Service Per Trip
Hourly wage $11.44
Blended Rate: - 20% Rehabilitation Counselors (SOC Code 21-1015) of $14.20 - 80% Personal and Home Care Aides (SOC Code 39-9021) of
$9.61 All wages taken from BLS as of May 2012 and inflated to December 2014 (6.33%).
ERE 35.0% of wages Staff hours per day assigned to Transportation
3.50 Allocated from Day Program
Additional Staff hours per day
1.75 Transportation aide time added to allow for average of 1.5 staff per vehicle
Average number of members transported per day
4
Average mileage per member per day
16 miles
Mileage reimbursement 82.0 cents per mile Enhanced mileage rate Program support 8% Administrative overhead 10% SFY 15 Benchmark Rate $21.73
Table 69
Single Person Modified, Urban Assumption/Result Value Comments
Unit of Service Per Trip
Hourly wage $11.44
Blended Rate: - 20% Rehabilitation Counselors (SOC Code 21-1015) of $14.20 - 80% Personal and Home Care Aides (SOC Code 39-9021) of
$9.61. All wages taken from BLS as of May 2012 and inflated to December 2014 (6.33%).
ERE 35.0% of wages Staff hours per day assigned to Transportation
1.0 Allocated from Day Program
Additional Staff hours per day
1.0
Average number of members transported per day
1
Average mileage per member per day
10 miles
Mileage reimbursement 82.0 cents per mile Enhanced mileage rate Program support 8% Administrative overhead 10% SFY 15 Benchmark Rate $23.83

RebaseBook 2014 68 October 8, 2013
Table 70 Single Person Modified, Rural
Assumption/Result Value Comments Unit of Service Per Trip
Hourly wage $11.44
Blended Rate: - 20% Rehabilitation Counselors (SOC Code 21-1015) of $14.20 - 80% Personal and Home Care Aides (SOC Code 39-9021) of
$9.61 All wages taken from BLS as of May 2012 and inflated to December 2014 (6.33%).
ERE 35.0% of wages Staff hours per day assigned to Transportation
1.5 Allocated from Day Program
Additional Staff hours per day
1.5 Transportation aide time added to allow for average of 1.5 staff per vehicle
Average number of members transported per day
1
Average mileage per member per day
16 miles
Mileage reimbursement 82.0 cents per mile Enhanced mileage rate Program support 8% Administrative overhead 10% SFY 15 Benchmark Rate $36.25
Table 71
Extensive Transportation Assumption/Result Value Comments
Unit of Service Per Trip
Hourly wage $11.44
Blended Rate: - 20% Rehabilitation Counselors (SOC Code 21-1015) of $14.20 - 80% Personal and Home Care Aides (SOC Code 39-9021) of
$9.61 All wages taken from BLS as of May 2012 and inflated to December 2014 (6.33%).
ERE 35.0% of wages Staff hours per day assigned to Transportation
3.0 Allocated from Day Program
Additional Staff hours per day
1.5 Transportation aide time added to allow for average of 1.5 staff per vehicle
Average number of members transported per day
6
Average mileage per member per day
10 miles
Wages Add-On per additional mile
$0.93 Accounts for additional wages for 1.5 staff per vehicle
Additional miles 40 miles Mileage reimbursement 82.0 cents per mile Enhanced mileage rate Program support 8% Administrative overhead 10% SFY 15 Benchmark Rate $42.68

RebaseBook 2014 69 October 8, 2013
RebaseBook 2014
Independent Rate Models
October 8, 2013

Independent Rate ModelsHome-Based Services
Attendant Care
Current ModelSFY13ReBase
ServiceUnit of Service 1 hour 1 hourDDD Taxonomy Code T03809 T03809
Hourly Wage $9.12 $10.22Annual Wage $18,978 $21,258
ERE (as percent of wages) 30.0% 35.0%Hourly Compensation (wages + ERE) $11.86 $13.80Annual Compensation (wages + ERE) $24,671 $28,698
Productivity Assumptions- Total Hours 8.00 8.00- Travel Time 0.25 0.39- Recordkeeping 0.25 0.20
- Missed Appointments 0.05
- Employer Time 0.10
- ISP Meetings 0.06
- Training 0.15
- Average on-site time; "Billable Hours" 7.50 7.05
- Productivity Adjustment 1.07 1.13Hourly Compensation After Adjustment $12.65 $15.66Annual Compensation After Adjustment $24,671 $28,698
Mileage- Number of Miles 5.0 5.50- Miles Transporting Clients 2.50- Amount per mile $0.345 $0.565
Total Mileage Amount $1.73 $4.52Hourly mileage cost $0.23 $0.64
Program Support Cost- Program Support Percent 8%- Total cost $16.30
Hourly Program Support Cost $1.59
Administrative Overhead- Administrative Cost Percent 10% 10%- Non-travel cost/Total Cost $12.65 $16.30
HourlyAdministrative Cost $1.27 $1.99
SFY 04Benchmark Rate $14.15 Adopted Rate Factor 93.0%Adopted Rate $13.16
SFY 14 (7/1/13 - 6/30/14)Benchmark Rate Inflation Adjustment 0.00%Benchmark Rate $16.09 Adopted Rate Factor 90.50%Adopted Rate - 1 Staff, 1 Client $14.56 - 1 staff, 2 clients $9.10- 1 staff, 3 clients $7.28
SFY 15 (7/1/14 - 6/30/15)Benchmark Rate $19.87Adopted Rate FactorAdopted Rate - 1 Staff, 1 Client- 1 staff, 2 clients- 1 staff, 3 clients
Attendant Care
RebaseBook 2014 70 October 8, 2013

Independent Rate ModelsHome-Based ServicesHabilitation, Support
Current ModelSFY13ReBase
ServiceUnit of Service 1 hour 1 hourDDD Taxonomy Code T03827 T03827
Hourly Wage $10.99 $11.68Annual Wage $22,866 $24,294
ERE (as percent of wages) 30.0% 35.0%Hourly Compensation (wages + ERE) $14.29 $15.77Annual Compensation (wages + ERE) $29,726 $32,797
Productivity Assumptions- Total Hours 8.00 8.00- Travel Time 0.50 0.89- Recordkeeping 0.25 0.20
- Missed Appointments 0.05
- Down Time 0.00 0.00
- Employer Time 0.10
- ISP Meetings 0.06
- Participating in Assessments 0.10
- Training 0.15
- Average on-site time; "Billable Hours" 7.25 6.45
- Productivity Adjustment 1.10 1.24Hourly Compensation After Adjustment $15.77 $19.56Annual Compensation After Adjustment $29,726 $32,797
Mileage- Number of Miles 15 18.0- Miles Transporting Clients 4.0- Amount per mile $0.345 $0.565
Total Mileage Amount $5.18 $12.43Hourly mileage cost $0.71 $1.93
Program Support Cost- Program Support Percent 8%- Total cost $21.48
Hourly Program Support Cost $2.10
Administrative Overhead- Administrative Percent 10% 10%- Non-travel cost or Total Cost (2013) $15.77 $21.48
Hourly Administrative Cost $1.58 $2.62
SFY 04Benchmark Rate $18.06 Adopted Rate Factor 93.0%Adopted Rate - 1 Staff, 1 Client $16.80
SFY 14 (7/1/13 - 6/30/14)Benchmark Rate Inflation Adjustment 0.00%Benchmark Rate $20.53 Adopted Rate Factor 90.50%Adopted Rate - 1 Staff, 1 Client $18.58 - 1 staff, 2 clients $11.61- 1 staff, 3 clients $9.29
SFY 15 (7/1/14 - 6/30/15)Benchmark Rate $26.20 Adopted Rate FactorAdopted Rate - 1 Staff, 1 Client- 1 staff, 2 clients- 1 staff, 3 clients
Habilitation, Support
RebaseBook 2014 71 October 8, 2013

Independent Rate ModelsHome-Based Services
Homemaker
Current ModelSFY13ReBase
ServiceUnit of Service 1 hour 1 hourDDD Taxonomy Code T03802 T03802
Hourly Wage $8.09 $9.75Annual Wage $16,835 $20,280
ERE (as percent of wages) 30.0% 35.0%Hourly Compensation (wages + ERE) $10.52 $13.16Annual Compensation (wages + ERE) $21,886 $27,378
Productivity Assumptions- Total Hours 8.00 8.00- Travel Time 0.50 0.36- Recordkeeping 0.00 0.00
- Missed Appointments 0.00
- Down Time 0.00 0.00
- Employer Time 0.10
- Training 0.15
- Average on-site time; "Billable Hours" 7.50 7.39
- Productivity Adjustment 1.07 1.08Hourly Compensation After Adjustment $11.22 $14.25Annual Compensation After Adjustment $21,886 $27,378
Mileage- Number of Miles 15 4.8- Amount per mile $0.345 $0.565
Total Mileage Amount $5.18 $2.71Hourly mileage cost $0.69 $0.37
Program Support Cost- Program Support Percent 8%- Total cost $14.62
Hourly Program Support Cost $1.43
Administrative Overhead- Administrative Percent 10% 10%- Non-travel cost or Total Cost (2013) $11.22 $14.62
Hourly administrative cost $1.12 $1.78
SFY 04Benchmark Rate $13.04 Adopted Rate Factor 93.0%Adopted Rate - 1 Staff, 1 Client $12.13
SFY 14 (7/1/13 - 6/30/14)Benchmark Rate Inflation Adjustment 0.00%Benchmark Rate $14.82 Adopted Rate Factor 90.50%Adopted Rate - 1 Staff, 1 Client $13.41 - 1 staff, 2 clients $8.38- 1 staff, 3 clients $6.71
SFY 15 (7/1/14 - 6/30/15)Benchmark Rate $17.82 Adopted Rate FactorAdopted Rate - 1 Staff, 1 Client- 1 staff, 2 clients- 1 staff, 3 clients
Homemaker
RebaseBook 2014 72 October 8, 2013

Independent Rate ModelsHome-Based Services
Respite Services
Current ModelSFY13ReBase
Current ModelSFY13ReBase
ServiceUnit of Service 1 hour 1 hour 13+ hours 12+ hoursDDD Taxonomy Code T03807 T03807 T03807 T03807
Hourly Wage $9.12 $10.22 $9.12 $10.22Annual Wage $18,978 $21,258 $18,978 $21,258
ERE (as percent of wages) 30.0% 35.0% 30.0% 35.0%Hourly Compensation (wages + ERE) $11.86 $13.80 $11.86 $13.80Annual Compensation (wages + ERE) $24,671 $28,698 $24,671 $28,698
Productivity Assumptions - Total Hours 8.00 8.00 8.00 8.00- Travel Time 0.25 0.59 0.00 0.00- Recordkeeping 0.10 0.08 0.00 0.06
- Missed Appointments 0.00 0.00
- Down Time 0.00 0.00 0.00 0.00
- Employer Time 0.10 0.10
- ISP Meetings 0.00 0.00
- Participating in Assessments 0.00 0.00
- Training 0.15 0.15
- Average on-site time; "Billable Hours" 7.65 7.08 8.00 7.69
- Productivity Adjustment 1.05 1.13 1.00 1.04Hourly Compensation After Adjustment $12.40 $15.59 $11.86 $14.35Annual Compensation After Adjustment $24,671 $28,698 $24,671 $28,698
Mileage- Number of Miles 5.0 10.6- Miles Transporting Clients 2.5 2.0- Amount per mile $0.345 $0.565 $0.345 $0.565
Total Mileage Amount $1.73 $7.40 $0.00 $1.13Hourly mileage cost $0.23 $1.05 $0.00 $0.15
Program Support Cost- Program Support Percent 8% 4%- Total cost $16.64 $14.50
Hourly Program Support Cost $1.62 $0.67
Administrative Overhead- Administrative Percent 10% 10% 10% 10%- Non-travel cost or Total Cost (2013) $12.40 $16.64 $11.86 $14.50
Hourly Administrative Cost $1.24 $2.03 $1.19 $1.69
SFY 04Benchmark Rate $13.87 $169.61 Adopted Rate Factor 93.0% 93.0%Adopted Rate - 1 Staff, 1 Client $12.90 $157.74
SFY 14 (7/1/13 - 6/30/14)Benchmark Rate Inflation Adjustment 0.00% 0.00%Benchmark Rate $15.77 $192.81 Adopted Rate Factor 90.50% 100.00%Adopted Rate - 1 Staff, 1 Client $14.27 $192.81 - 1 staff, 2 clients $8.92 $120.51- 1 staff, 3 clients $7.14 $96.41
SFY 15 (7/1/14 - 6/30/15)Benchmark Rate $20.29 $269.77 Adopted Rate FactorAdopted Rate - 1 Staff, 1 Client- 1 staff, 2 clients- 1 staff, 3 clients
Respite, ContinuousRespite, Hourly
RebaseBook 2014 73 October 8, 2013

Independent Rate ModelsIndependent Living Services
Habilitation, Individually Designed Living Arrangement
Current Model
DailyUnit of Service 1 hour 1 hour 1 hourDDD Taxonomy Code T03827 T03827 T03827
Hourly Wage $12.36 $11.68 $11.68Annual Wage $25,712 $24,294 $24,294
ERE (as percent of wages) 30.0% 35.0% 35.0%Hourly Compensation (wages + ERE) $16.07 $15.77 $15.77Annual Compensation (wages + ERE) $33,425 $32,797 $32,797
Productivity Assumptions- Total Hours 8.00 8.00 8.00- Travel Time 0.00 0.37 0.00- Recordkeeping 0.25 0.25 0.00
- Missed Appointments 0.00 0.00
- Down Time 0.00 0.00 0.00
- Employer Time 0.10 0.10
- ISP Meetings 0.12 0.00
- Participating in Assessments 0.14 0.00
- Training 0.15 0.15
- Average on-site time; "Billable Hours" 7.75 6.87 7.75
- Productivity Adjustment 1.03 1.16 1.03Hourly Compensation After Adjustment $16.59 $18.36 $16.28Annual Compensation After Adjustment $33,425 $32,797 $32,797
Mileage- Number of Miles 0 5- Miles Transporting Clients 4.4 4.4- Amount per mile $0.345 $0.565 $0.565
Total Mileage Amount $0.00 $5.31 $2.49Hourly mileage cost $0.00 $0.77 $0.32
Program Support Cost- Program Support Percent 8% 8%- Total cost $19.13 $16.60
Hourly Program Support Cost $1.87 $1.62
Administrative Overhead- Administrative Percent 10% 10% 10%- Non-travel cost or Total Cost (2013) $16.59 $19.13 $16.60
Hourly administrative cost $1.66 $2.33 $2.02
SFY 04Benchmark Rate $18.25 Adopted Rate Factor 93.0%Adopted Rate - 1 Staff, 1 Client $16.97
SFY 14 (7/1/13 - 6/30/14)Benchmark Rate Inflation Adjustment 0.00%Benchmark Rate $20.74 Adopted Rate Factor 90.50%Adopted Rate - 1 Staff, 1 Client $18.77 - 1 staff, 2 clients $11.73- 1 staff, 3 clients $9.39
SFY 14 (7/1/13 - 6/30/14)Benchmark Rate $23.33 $20.24 Adopted Rate FactorAdopted Rate - 1 Staff, 1 Client- 1 staff, 2 clients- 1 staff, 3 clients
Habilitation, Individually Designed Living Arrangement
SFY13ReBase
HourlyService
RebaseBook 2014 74 October 8, 2013

Independent Rate ModelsDay Treatment & Training ServicesDay Treatment and Training, Adult
ServiceStaff-to-Client Ratio 1:3.5 1:5.5 1:7.5 1:9.5Unit of Service 1 client hour 1 client hour 1 client hour 1 client hourDDD Taxonomy Code T04003 T04003 T04003 T04003
Hourly Wage $13.22 $13.22 $13.22 $13.22Annual Wage $27,506 $27,506 $27,506 $27,506
ERE (as percent of wages) 30% 30% 30% 30%Hourly Compensation (wages + ERE) $17.19 $17.19 $17.19 $17.19Annual Compensation (wages + ERE) $35,758 $35,758 $35,758 $35,758
Productivity Assumptions- Total Hours 8.00 8.00 8.00 8.00- Direct Care Travel Time: Charged to Transportation 0.80 0.80 0.80 0.80- Total Hours before productivity adjustments 7.20 7.20 7.20 7.20- Time allocated to facility preparation and notes 0.20 0.20 0.20 0.20- Recordkeeping- Program preparation/set-up/clean-up- Down Time 0.00 0.00 0.00 0.00- Employer Time- ISP Meetings- Training- Average on-site time; "Billable Hours" 7.00 7.00 7.00 7.00
- Transportation Time 0.00 0.00 0.00 0.00- Facility Time 7.00 7.00 7.00 7.00
- Productivity Adjustment 1.03 1.03 1.03 1.03Hourly Compensation After Adjustment $17.68 $17.68 $17.68 $17.68Annual Compensation After Adjustment $32,182 $32,182 $32,182 $32,182
Days AdjustmentDays Billable 200 200 200 200 Days Paid 250 250 250 250 Ratio 0.80 0.80 0.80 0.80 Hourly Rate $22.10 $22.10 $22.10 $22.10Annual Compensation $32,182 $32,182 $32,182 $32,182
Staffing- Number of Staff Members 3.66 2.33 1.71 1.35- Number of Individuals Served 16 16 16 16
Ratio of staff to individual 1:3.5 1:5.5 1:7.5 1:9.5Total Staff Compensation $117,788 $74,985 $55,032 $43,446
Total Hourly Compensation After Adjustment $80.90 $51.50 $37.80 $29.84Hourly Compensation per Individual $5.26 $3.35 $2.46 $1.94
Mileage- Program-Related Transportation 2 2 2 2- Amount per mile $0.345 $0.345 $0.345 $0.345
Total Mileage Amount $0.69 $0.69 $0.69 $0.69 Hourly Mileage Cost per Individual $0.10 $0.10 $0.10 $0.10
Program Transport Cost per Individual per Day $3.28 $3.28 $3.28 $3.28 Hourly Transportation Cost per Individual $0.47 $0.47 $0.47 $0.47
Capital- Square Footage 2,000 2,000 2,000 2,000- Cost per Square Foot $12.00 $12.00 $12.00 $12.00- Number of Days in Service 200 200 200 200
Total Square Footage per Individual per Day $7.50 $7.50 $7.50 $7.50 Hourly Capital Cost per Individual $1.07 $1.07 $1.07 $1.07
SuppliesSupplies per Individual per Day $1.00 $1.00 $1.00 $1.00
Hourly Supply Cost per Individual $0.14 $0.14 $0.14 $0.14
Current Model
Day Treatment and Training, Adult
RebaseBook 2014 75 October 8, 2013

Independent Rate ModelsDay Treatment & Training ServicesDay Treatment and Training, Adult
Service
Current Model
Day Treatment and Training, Adult
Hourly Program Compliance cost- Compliance Percent 2% 2% 2% 2%- Non-travel cost $6.94 $5.03 $4.14 $3.62
Hourly Program Compliance cost $0.14 $0.10 $0.08 $0.07
Program Support Costs- Program Support Cost Percent- Non-travel cost or Total Cost (2013)
Hourly Program Support cost
Administrative Overhead- Administrative Cost Percent 10% 10% 10% 10%- Non-travel cost or Total Cost (2013) $6.94 $5.03 $4.14 $3.62
Hourly Administrative cost $0.69 $0.50 $0.41 $0.36
SFY 04 OriginalBenchmark Rate $7.87 $5.73 $4.74 $4.16 Transition Staffing Factor (TSF) 85.0% 85.0% 85.0% 85.0%Transition Staffing Adjustment (Dividing by TSF) $9.26 $6.74 $5.58 $4.89 Adopted Rate Factor 93.0% 93.0% 93.0% 93.0%Calculated Adopted Rate $8.61 $6.27 $5.19 $4.55 Adopted Rate - Rounded $8.60 $6.25 $5.20 $4.55
SFY 14 (7/1/13 - 6/30/14)Benchmark Rate Inflation Adjustment 0.00% 0.00% 0.00% 0.00%Benchmark Rate $10.53 $7.66 $6.33 $5.56 Adopted Rate Factor 90.50% 90.50% 90.50% 90.50%Adopted Rate $9.53 $6.93 $5.73 $5.03
SFY 15 (7/1/13 - 6/30/14)Benchmark RateAdopted Rate FactorAdopted Rate
RebaseBook 2014 76 October 8, 2013

Independent Rate ModelsDay Treatment & Training ServicesDay Treatment and Training, Adult
ServiceStaff-to-Client RatioUnit of ServiceDDD Taxonomy Code
Hourly WageAnnual Wage
ERE (as percent of wages)Hourly Compensation (wages + ERE)Annual Compensation (wages + ERE)
Productivity Assumptions- Total Hours- Direct Care Travel Time: Charged to Transportation- Total Hours before productivity adjustments- Time allocated to facility preparation and notes- Recordkeeping- Program preparation/set-up/clean-up- Down Time- Employer Time- ISP Meetings- Training- Average on-site time; "Billable Hours"
- Transportation Time- Facility Time
- Productivity AdjustmentHourly Compensation After AdjustmentAnnual Compensation After Adjustment
Days AdjustmentDays BillableDays PaidRatioHourly RateAnnual Compensation
Staffing- Number of Staff Members- Number of Individuals Served
Ratio of staff to individualTotal Staff Compensation
Total Hourly Compensation After AdjustmentHourly Compensation per Individual
Mileage- Program-Related Transportation- Amount per mile
Total Mileage AmountHourly Mileage Cost per Individual
Program Transport Cost per Individual per DayHourly Transportation Cost per Individual
Capital- Square Footage- Cost per Square Foot- Number of Days in Service
Total Square Footage per Individual per DayHourly Capital Cost per Individual
SuppliesSupplies per Individual per Day
Hourly Supply Cost per Individual
1:3.5 1:5.5 1:7.51 client hour 1 client hour 1 client hour
T04003 T04003 T04003
$11.44 $11.44 $11.44$23,795 $23,795 $23,795
35% 35% 35%$15.44 $15.44 $15.44
$32,124 $32,124 $32,124
8.00 8.00 8.000.00 0.00 0.008.00 8.00 8.00
0.15 0.25 0.350.50 0.50 0.500.00 0.00 0.000.10 0.10 0.100.06 0.10 0.130.15 0.15 0.157.04 6.90 6.770.00 0.00 0.007.04 6.90 6.771.14 1.16 1.18
$17.55 $17.91 $18.25$32,124 $32,124 $32,124
212 212 212 250 250 250 0.85 0.85 0.85
$20.70 $21.12 $21.52$32,124 $32,124 $32,124
4.57 2.91 2.1316 16 16
1:3.5 1:5.5 1:7.5$146,850 $93,450 $68,530
$94.61 $61.43 $45.91$5.91 $3.84 $2.87
2 2 2$0.82 $0.82 $0.82$1.64 $1.64 $1.64 $0.23 $0.24 $0.24
2,000 2,000 2,000$20.07 $20.07 $20.07
212 212 212 $11.83 $11.83 $11.83
$1.68 $1.72 $1.75
$2.50 $2.50 $2.50$0.36 $0.36 $0.37
SFY13 ReBase
Day Treatment and Training, Adult
RebaseBook 2014 77 October 8, 2013

Independent Rate ModelsDay Treatment & Training ServicesDay Treatment and Training, Adult
Service
Hourly Program Compliance cost- Compliance Percent- Non-travel cost
Hourly Program Compliance cost
Program Support Costs- Program Support Cost Percent- Non-travel cost or Total Cost (2013)
Hourly Program Support cost
Administrative Overhead- Administrative Cost Percent- Non-travel cost or Total Cost (2013)
Hourly Administrative cost
SFY 04 OriginalBenchmark RateTransition Staffing Factor (TSF)Transition Staffing Adjustment (Dividing by TSF)Adopted Rate FactorCalculated Adopted RateAdopted Rate - Rounded
SFY 14 (7/1/13 - 6/30/14)Benchmark Rate Inflation AdjustmentBenchmark RateAdopted Rate FactorAdopted Rate
SFY 15 (7/1/13 - 6/30/14)Benchmark RateAdopted Rate FactorAdopted Rate
SFY13 ReBase
Day Treatment and Training, Adult
8% 8% 8%8.18 6.15 5.23
$0.80 $0.60 $0.51
10% 10% 10%8.18 6.15 5.23
$1.00 $0.75 $0.64
$9.98 $7.51 $6.38
RebaseBook 2014 78 October 8, 2013

Independent Rate ModelsDay Treatment & Training ServicesDay Treatment and Training, Child
Service
Staff-to-Client Ratio 1:3.5 1:5.5 1:7.5 1:9.5Unit of Service 1 client hour 1 client hour 1 client hour 1 client hourDDD Taxonomy Code T04003 T04003 T04003 T04003
Hourly Wage $13.22 $13.22 $13.22 $13.22Annual Wage $27,506 $27,506 $27,506 $27,506
ERE (as percent of wages) 15% 15% 15% 15%Hourly Compensation (wages + ERE) $15.21 $15.21 $15.21 $15.21Annual Compensation (wages + ERE) $31,632 $31,632 $31,632 $31,632
Productivity Assumptions- Total Hours 4.25 4.25 4.25 4.25- Direct Care Travel Time: Charged to Transportation 0.00 0.00 0.00 0.00- Total Hours before productivity adjustments 4.25 4.25 4.25 4.25- Travel Time 0.00 0.00 0.00 0.00- Time allocated to facility preparation and notes 0.25 0.25 0.25 0.25- Recordkeeping- Program preparation/set-up/clean-up- Down Time 0.00 0.00 0.00 0.00- Employer Time- ISP Meetings- Training- Average on-site time; "Billable Hours" 4.00 4.00 4.00 4.00- Productivity Adjustment 1.06 1.06 1.06 1.06
Hourly Compensation After Adjustment $16.16 $16.16 $16.16 $16.16Annual Compensation After Adjustment $31,632 $31,632 $31,632 $31,632
Days AdjustmentDays BillableDays PaidRatioHourly RateAnnual Compensation
Staffing- Number of Staff Members 1.71 1.09 0.80 0.63- Number of Individuals Served 6 6 6 6
Ratio of staff to individual 1:3.5 1:5.5 1:7.5 1:9.5
Total Hourly Compensation After Adjustment $27.70 $17.63 $12.93 $10.21Hourly Compensation per Individual $4.62 $2.94 $2.15 $1.70
Mileage- Program-Related Transportation 2 2 2 2- Amount per mile $0.345 $0.345 $0.345 $0.345
Total Mileage Amount per Individual $0.69 $0.69 $0.69 $0.69 Hourly Mileage Cost per Individual $0.17 $0.17 $0.17 $0.17
Transportation Capital Cost per Individual (program) $1.22 $1.22 $1.22 $1.22Hourly Transportation Capital Cost per Individual (program) $0.31 $0.31 $0.31 $0.31
Capital- Square Footage 1,000 1,000 1,000 1,000- Cost per Square Foot $10.00 $10.00 $10.00 $10.00- Number of Days in Service
$6.94 $6.94 $6.94 $6.94Hourly Capital Cost per Individual $1.74 $1.74 $1.74 $1.74
Food- Snack per Individual per Day $1.00 $1.00 $1.00 $1.00
Hourly Food Cost per Individual $0.25 $0.25 $0.25 $0.25
Supplies- Supplies per Facility per Day $6.00 $6.00 $6.00 $6.00
Supplies per Individual per Day $1.00 $1.00 $1.00 $1.00Hourly Supply Cost per Individual $0.25 $0.25 $0.25 $0.25
Current Model
Daily Capital Cost per Individual
Day Treatment and Training,Child After School and Summer
RebaseBook 2014 79 October 8, 2013

Independent Rate ModelsDay Treatment & Training ServicesDay Treatment and Training, Child
Service
Current Model
Day Treatment and Training,Child After School and Summer
Program Support Cost- Program Support Cost Percent- Non-travel cost or Total Cost (2013)
Hourly Program Support cost
Administrative Overhead- Administrative Cost Percent 10% 10% 10% 10%- Non-travel cost or Total Cost (2013) $7.16 $5.48 $4.70 $4.24
Hourly Administrative Cost $0.72 $0.55 $0.47 $0.42
SFY 04 OriginalBenchmark Rate $8.05 $6.20 $5.34 $4.84 Transition Staffing Factor (TSF) 90.0% 90.0% 90.0% 90.0%Transition Staffing Adjustment (Dividing by TSF) $8.94 $6.89 $5.93 $5.38 Adopted Rate Factor 93.0% 93.0% 93.0% 93.0%Calculated Adopted Rate $8.32 $6.41 $5.52 $5.00 Adopted Rate - Rounded $8.30 $6.40 $5.50 $5.00
SFY 14 (7/1/13 - 6/30/14)Benchmark Rate Inflation Adjustment 0.00% 0.00% 0.00% 0.00%Benchmark Rate $10.16 $7.83 $6.75 $6.11 Adopted Rate Factor 90.50% 90.50% 90.50% 90.50%Adopted Rate $9.19 $7.09 $6.11 $5.53
SFY 15 (7/1/13 - 6/30/14)Benchmark RateAdopted Rate FactorAdopted Rate
RebaseBook 2014 80 October 8, 2013

Independent Rate ModelsDay Treatment & Training ServicesDay Treatment and Training, Child
Service
Staff-to-Client RatioUnit of ServiceDDD Taxonomy Code
Hourly WageAnnual Wage
ERE (as percent of wages)Hourly Compensation (wages + ERE)Annual Compensation (wages + ERE)
Productivity Assumptions- Total Hours- Direct Care Travel Time: Charged to Transportation- Total Hours before productivity adjustments- Travel Time- Time allocated to facility preparation and notes- Recordkeeping- Program preparation/set-up/clean-up- Down Time- Employer Time- ISP Meetings- Training- Average on-site time; "Billable Hours"- Productivity Adjustment
Hourly Compensation After AdjustmentAnnual Compensation After Adjustment
Days AdjustmentDays BillableDays PaidRatioHourly RateAnnual Compensation
Staffing- Number of Staff Members- Number of Individuals Served
Ratio of staff to individual
Total Hourly Compensation After AdjustmentHourly Compensation per Individual
Mileage- Program-Related Transportation- Amount per mile
Total Mileage Amount per IndividualHourly Mileage Cost per Individual
Transportation Capital Cost per Individual (program)Hourly Transportation Capital Cost per Individual (program)
Capital- Square Footage- Cost per Square Foot- Number of Days in Service
Hourly Capital Cost per Individual
Food- Snack per Individual per Day
Hourly Food Cost per Individual
Supplies- Supplies per Facility per Day
Supplies per Individual per DayHourly Supply Cost per Individual
Daily Capital Cost per Individual
1:3.5 1:5.5 1:7.51 client hour 1 client hour 1 client hour
T04003 T04003 T04003
$11.44 $11.44 $11.44$23,795 $23,795 $23,795
17.5% 17.5% 17.5%$13.44 $13.44 $13.44
$27,959 $27,959 $27,959
4.50 4.50 4.50
0.00 0.00 0.00
0.15 0.25 0.350.50 0.50 0.500.00 0.00 0.000.10 0.10 0.100.00 0.00 0.000.30 0.30 0.303.45 3.35 3.251.30 1.34 1.38
$17.53 $18.06 $18.61$27,959 $27,959 $27,959
171 171 171190 190 190
0.90 0.90 0.90$19.48 $20.06 $20.68
$27,959 $27,959 $27,959
4.57 2.91 2.1316 16 16
1:3.5 1:5.5 1:7.5
$89.06 $58.36 $44.12$5.57 $3.65 $2.76
2 2 2$0.82 $0.82 $0.82$1.64 $1.64 $1.64 $0.48 $0.49 $0.50
1,600 1,600 1,600$20.07 $20.07 $20.07
$8.92 $8.92 $8.92 $2.59 $2.66 $2.74
$0.80 $0.80 $0.80$0.23 $0.24 $0.25
$2.00 $2.00 $2.00$0.58 $0.60 $0.62
Day Treatment and Training,Child After School and Summer
SFY13 ReBase
RebaseBook 2014 81 October 8, 2013

Independent Rate ModelsDay Treatment & Training ServicesDay Treatment and Training, Child
Service
Program Support Cost- Program Support Cost Percent- Non-travel cost or Total Cost (2013)
Hourly Program Support cost
Administrative Overhead- Administrative Cost Percent- Non-travel cost or Total Cost (2013)
Hourly Administrative Cost
SFY 04 OriginalBenchmark RateTransition Staffing Factor (TSF)Transition Staffing Adjustment (Dividing by TSF)Adopted Rate FactorCalculated Adopted RateAdopted Rate - Rounded
SFY 14 (7/1/13 - 6/30/14)Benchmark Rate Inflation AdjustmentBenchmark RateAdopted Rate FactorAdopted Rate
SFY 15 (7/1/13 - 6/30/14)Benchmark RateAdopted Rate FactorAdopted Rate
Day Treatment and Training,Child After School and Summer
SFY13 ReBase
8% 8% 8%9.44 7.64 6.87
$0.92 $0.74 $0.67
10% 10% 10%9.44 7.64 6.87
$1.15 $0.93 $0.84
$11.51 $9.31 $8.38
RebaseBook 2014 82 October 8, 2013

Independent Rate ModelsDay Treatment & Training ServicesDay Treatment and Training, Rural
ServiceStaff-to-Client Ratio 1:3.5 1:5.5 1:7.5 1:9.5Unit of Service 1 client hour 1 client hour 1 client hour 1 client hourDDD Taxonomy Code T04003 T04003 T04003 T04003
Hourly Wage $13.22 $13.22 $13.22 $13.22Annual Wage $27,506 $27,506 $27,506 $27,506
ERE (as percent of wages) 30% 30% 30% 30%Hourly Compensation (wages + ERE) $17.19 $17.19 $17.19 $17.19Annual Compensation (wages + ERE) $35,758 $35,758 $35,758 $35,758
Productivity Assumptions- Total Hours 8.00 8.00 8.00 8.00- Direct Care Travel Time: Charged to Transportation 0.80 0.80 0.80 0.80- Total Hours before productivity adjustments 7.20 7.20 7.20 7.20- Time allocated to facility preparation and notes 0.20 0.20 0.20 0.20- Recordkeeping- Program preparation/set-up/clean-up- Down Time 0.00 0.00 0.00 0.00- Employer Time- ISP Meetings- Training- Average on-site time; "Billable Hours" 7.00 7.00 7.00 7.00
- Transportation Time 0.00 0.00 0.00 0.00- Facility Time 7.00 7.00 7.00 7.00
- Productivity Adjustment 1.03 1.03 1.03 1.03Hourly Compensation After Adjustment $17.68 $17.68 $17.68 $17.68Annual Compensation After Adjustment $32,182 $32,182 $32,182 $32,182
Days AdjustmentDays Billable 200 200 200 200 Days Paid 250 250 250 250 Ratio 0.80 0.80 0.80 0.80 Hourly Rate $22.10 $22.10 $22.10 $22.10Annual Compensation $32,182 $32,182 $32,182 $32,182
Staffing- Number of Staff Members 1.37 0.87 0.64 0.51- Number of Individuals Served 6 6 6 6
Ratio of staff to individual 1:3.5 1:5.5 1:7.5 1:9.5Total Staff Compensation $44,090 $27,999 $20,597 $16,261
Total Hourly Compensation After Adjustment $30.28 $19.23 $14.15 $11.17Hourly Compensation per Individual $5.25 $3.33 $2.45 $1.94
Mileage- Program-Related Transportation 4 4 4 4- Amount per mile $0.345 $0.345 $0.345 $0.345
Total Mileage Amount $1.38 $1.38 $1.38 $1.38 Hourly Mileage Cost per Individual $0.20 $0.20 $0.20 $0.20
Program Transport Cost per Individual per Day $5.64 $5.64 $5.64 $5.64 Hourly Transportation Cost per Individual $0.81 $0.81 $0.81 $0.81
Capital- Square Footage 1,000 1,000 1,000 1,000- Cost per Square Foot $12.00 $12.00 $12.00 $12.00- Number of Days in Service 200 200 200 200
Total Square Footage per Individual per Day $10.00 $10.00 $10.00 $10.00 Hourly Capital Cost per Individual $1.43 $1.43 $1.43 $1.43
SuppliesSupplies per Individual per Day $1.00 $1.00 $1.00 $1.00
Hourly Supply Cost per Individual $0.14 $0.14 $0.14 $0.14
Day Treatment and Training, Rural
Current Model
RebaseBook 2014 83 October 8, 2013

Independent Rate ModelsDay Treatment & Training ServicesDay Treatment and Training, Rural
Service Day Treatment and Training, Rural
Current Model
Hourly Program Compliance cost- Compliance Percent 2% 2% 2% 2%- Non-travel cost $7.63 $5.71 $4.83 $4.31
Hourly Program Compliance cost $0.15 $0.11 $0.10 $0.09
Program Support Cost- Administrative and Program Support Percent- Non-travel cost or Total Cost (2013)
Hourly Program Support cost
Administrative Overhead- Administrative and Program Support Percent 10% 10% 10% 10%- Non-travel cost or Total Cost (2013) $7.63 $5.71 $4.83 $4.31
Hourly Administrative cost $0.76 $0.57 $0.48 $0.43
SFY 04 OriginalBenchmark Rate $8.74 $6.59 $5.61 $5.03 Transition Staffing Factor (TSF) 85.0% 85.0% 85.0% 85.0%Transition Staffing Adjustment (Dividing by TSF) $10.28 $7.75 $6.60 $5.92 Adopted Rate Factor 93.0% 93.0% 93.0% 93.0%Calculated Adopted Rate $9.56 $7.21 $6.14 $5.50 Adopted Rate - Rounded $9.60 $7.20 $6.15 $6.15
SFY 14 (7/1/13 - 6/30/14)Benchmark Rate Inflation Adjustment 0.00% 0.00% 0.00% 0.00%Benchmark Rate $11.69 $8.81 $7.51 $6.73 Adopted Rate Factor 90.50% 90.50% 90.50% 90.50%Adopted Rate $10.58 $7.97 $6.80 $6.09
SFY 15 (7/1/13 - 6/30/14)Benchmark RateAdopted Rate FactorAdopted Rate
RebaseBook 2014 84 October 8, 2013

Independent Rate ModelsDay Treatment & Training ServicesDay Treatment and Training, Rural
ServiceStaff-to-Client RatioUnit of ServiceDDD Taxonomy Code
Hourly WageAnnual Wage
ERE (as percent of wages)Hourly Compensation (wages + ERE)Annual Compensation (wages + ERE)
Productivity Assumptions- Total Hours- Direct Care Travel Time: Charged to Transportation- Total Hours before productivity adjustments- Time allocated to facility preparation and notes- Recordkeeping- Program preparation/set-up/clean-up- Down Time- Employer Time- ISP Meetings- Training- Average on-site time; "Billable Hours"
- Transportation Time- Facility Time
- Productivity AdjustmentHourly Compensation After AdjustmentAnnual Compensation After Adjustment
Days AdjustmentDays BillableDays PaidRatioHourly RateAnnual Compensation
Staffing- Number of Staff Members- Number of Individuals Served
Ratio of staff to individualTotal Staff Compensation
Total Hourly Compensation After AdjustmentHourly Compensation per Individual
Mileage- Program-Related Transportation- Amount per mile
Total Mileage AmountHourly Mileage Cost per Individual
Program Transport Cost per Individual per DayHourly Transportation Cost per Individual
Capital- Square Footage- Cost per Square Foot- Number of Days in Service
Total Square Footage per Individual per DayHourly Capital Cost per Individual
SuppliesSupplies per Individual per Day
Hourly Supply Cost per Individual
1:3.5 1:5.5 1:7.51 client hour 1 client hour 1 client hour
T04003 T04003 T04003
$11.44 $11.44 $11.44$23,795 $23,795 $23,795
35% 35% 35%$15.44 $15.44 $15.44
$32,124 $32,124 $32,124
8.00 8.00 8.000.00 0.00 0.008.00 8.00 8.00
0.15 0.25 0.350.50 0.50 0.500.00 0.00 0.000.10 0.10 0.100.06 0.10 0.130.15 0.15 0.157.04 6.90 6.770.00 0.00 0.007.04 6.90 6.771.14 1.16 1.18
$17.55 $17.91 $18.25$30,888 $30,888 $30,888
212 212 212 250 250 250 0.85 0.85 0.85
$20.70 $21.12 $21.52$30,888 $30,888 $30,888
2.00 1.27 0.937 7 7
1:3.5 1:5.5 1:7.5$61,776 $39,312 $28,829
$41.39 $26.87 $20.09$5.91 $3.84 $2.87
4.0 4.0 4.0$0.565 $0.565 $0.565
$2.26 $2.26 $2.26 $0.32 $0.33 $0.33
1,900 1,900 1,900$15.00 $15.00 $15.00
212 212 212 $19.20 $19.20 $19.20
$2.73 $2.78 $2.84
$2.50 $2.50 $2.50$0.36 $0.36 $0.37
SFY13 ReBase
Day Treatment and Training, Rural
RebaseBook 2014 85 October 8, 2013

Independent Rate ModelsDay Treatment & Training ServicesDay Treatment and Training, Rural
Service
Hourly Program Compliance cost- Compliance Percent- Non-travel cost
Hourly Program Compliance cost
Program Support Cost- Administrative and Program Support Percent- Non-travel cost or Total Cost (2013)
Hourly Program Support cost
Administrative Overhead- Administrative and Program Support Percent- Non-travel cost or Total Cost (2013)
Hourly Administrative cost
SFY 04 OriginalBenchmark RateTransition Staffing Factor (TSF)Transition Staffing Adjustment (Dividing by TSF)Adopted Rate FactorCalculated Adopted RateAdopted Rate - Rounded
SFY 14 (7/1/13 - 6/30/14)Benchmark Rate Inflation AdjustmentBenchmark RateAdopted Rate FactorAdopted Rate
SFY 15 (7/1/13 - 6/30/14)Benchmark RateAdopted Rate FactorAdopted Rate
SFY13 ReBase
Day Treatment and Training, Rural
8% 8% 8%9.32 7.31 6.41
$0.91 $0.71 $0.63
10% 10% 10%9.32 7.31 6.41
$1.14 $0.89 $0.78
$11.36 $8.92 $7.82
RebaseBook 2014 86 October 8, 2013

Independent Rate ModelsDay Treatment & Training ServicesDay Treatment and Training, Intense
Current ModelSFY13ReBase
Service
Unit of Service 1 hour 1 hourDDD Taxonomy Code T03827 T03827
Hourly Wage $10.99 $11.68Annual Wage $22,866 $24,294
ERE (as percent of wages) 30.0% 35.0%Hourly Compensation (wages + ERE) $14.29 $15.77Annual Compensation (wages + ERE) $29,726 $32,797
Productivity Assumptions- Total Hours 8.00 8.00- Travel Time 0.50 0.00- Recordkeeping 0.25 0.20
- Missed Appointments 0.00
- Down Time 0.00 0.00
- Employer Time 0.10
- ISP Meetings 0.02
- Training 0.15
- Average on-site time; "Billable Hours" 7.25 7.53
- Productivity Adjustment 1.10 1.06Hourly Compensation After Adjustment $15.77 $16.75Annual Compensation After Adjustment $29,726 $32,797
Mileage- Number of Miles 15 0.0- Miles Transporting Clients 4.0- Amount per mile $0.345 $0.565
Total Mileage Amount $5.18 $2.26Hourly mileage cost $0.71 $0.30
Program Support Cost- Administrative and Program Support Percent 8%- Non-travel cost or Total Cost (2013) $17.05
Hourly Program Support cost $1.66
Administrative Overhead- Administrative Percent 10% 10%- Non-travel cost or Total Cost (2013) $15.77 $17.05
Hourly administrative cost $1.58 $2.08
SFY 04Benchmark Rate $18.06 Adopted Rate Factor 93.0%Adopted Rate - 1 Staff, 1 Client $16.80
SFY 14 (7/1/13 - 6/30/14)Benchmark Rate Inflation Adjustment 0.00%Benchmark Rate $20.53 Adopted Rate Factor 90.50%Adopted Rate - 1 Staff, 1 Client $18.58 - 1 staff, 2 clients $11.61
SFY 15 (7/1/14 - 6/30/15)Benchmark Rate $20.80 Adopted Rate FactorAdopted Rate - 1 Staff, 1 ClientAdopted Rate - 1 Staff, 2 Client
Day Treatment and Training, Intense
RebaseBook 2014 87 October 8, 2013

Independent Rate ModelsDevelopmental Home Services
Habilitation, Vendor Supported Developmental Home (Adult & Child)
CurrentModel
SFY13ReBase
1 day 1 day1 individual 1 individual
5 4.0365 365
- ACYF rate $750.00 $2,809- Inflation Factor 1.3228 1.18- DDD Premium 10.0% 50.0%
$1,100.00 $4,971.93Annual Cost (spread over 5 years) $220.00 $1,242.98
License Renewal- Percentage of Initial Home Licensure Payment 55.0%
License Renewal $605.00Annual Cost (spread over 5 years) $484.00
Total Fixed Cost of Licensure $704.00 $1,242.98
Training- Salary
- Training Staff $16.04 $17.83- Annual Wage $33,357 $37,086- ERE (as percent of wages) 30.0% 30.0%Hourly Compensation (wages + ERE) $20.85 $23.18Annual Compensation (wages + ERE) $43,364 $48,212
- Initial Training- Hours of Training (1st year) 20 84.0- Cost of Training $420.00 $1,950.00Annual Cost (spread over 5 years) $84.00 $487.50
- Ongoing Training- Hours of Training (Included in renewal) 10 18.0- Cost of Training $210.00 $417.22Annual Cost (spread over 5 years) $168.00 $312.92
Total Fixed Cost of Training $252.00 $800.42
Respite/Relief- Respite Hours Allowance 720- Respite Hourly Respite (less Admin. Overhead) $12.63
Annual Cost of Respite/Relief $9,100.00
Habilitation- Habilitation Hours Allowance 50- Habilitation Hourly Rate (HAH), less Admin. Overhead $16.48
Annual Cost of Habilitation $830.00
Attendant Care- Attendant Care Hours Allowance 50- Attendant Care Hourly Rate (ATC), less Admin. Overhead $12.88
Annual Cost of Attendant Care $650.00
Supervision and Monitoring Staff- Hourly Wage $13.97 $15.25- ERE (as percent of wages) 30.0% 30.0%- Annual Total Compensation (Wages & Benefits) $41,236.00- Number of Homes Supervised 12.0- Number of Visits to Family, per Year 26.0- Duration of Each Visit, in Hours 1.0
Annual Cost of Supervision and Monitoring Staff $472.24 $3,436.33
Initial Home Licensure
Initial Home Licensure
Number of Days Under Supervision, per Year
ServiceHabilitation, Vendor Supported
Developmental HomeUnit of ServiceDaily Rate Based on
Number of Years Under Supervision, on Average
RebaseBook 2014 88 October 8, 2013

Independent Rate ModelsDevelopmental Home Services
Habilitation, Vendor Supported Developmental Home (Adult & Child)
CurrentModel
SFY13ReBase
1 day 1 day1 individual 1 individual
ServiceHabilitation, Vendor Supported
Developmental HomeUnit of ServiceDaily Rate Based on
Mileage- Number of Miles, per Month 100- Number of Miles, per Year 1,200- Average Miles per Visit 35.0- Average Number of Visits per Year 24.0- Amount per Mile $0.345 $0.565
Annual Mileage Cost $414.00 $474.60
Program Support Cost- Program Support Percent 8.0%- Non-travel/Total cost - Agency $5,954- Total Cost - Payments to Family $27,570- Total Cost $33,524
Total Program Support Cost $3,270.65- Less: Amount for Payments to Family $562.10
Total Program Support Cost $2,708.55
Administrative Overhead- Administrative Percent 10.0% 10.0%- Non-travel cost $12,008 $33,524
Total Administrative Cost $1,200.82 $4,088.31
Total Cost per Family per Year $13,623.06 $12,751.20Total Cost per Family per Day $37.32 $34.93
Payment to Family- Room and Board $11.90 $19.09 - Other $57.53 $57.98
Total Payment to Family, per Day $69.43 $77.07
- Dev Home Payment (Agency Payment) $37.32 $34.93 - Dev Home Payment (Family - Other) $57.53 $57.98 - Total Dev Home Payment $94.85 $92.91
- Room & Board Payment $11.90 $19.09
Total Payment to Agency, per Day $106.75 $112.00
SFY 04Benchmark Rate $94.85 Adopted Rate Factor 93.0%Calculated Adopted Rate $88.21 Adopted Rate $109.75
SFY 14 (7/1/13 - 6/30/14)Benchmark Rate Inflation Adjustment 0.00%Benchmark Rate $109.98Adopted Rate Factor 90.50%Calculated Adopted Rate $99.53Adopted Rate = 90.5% of SFY 07 (as of 7/1/08) $101.31
SFY 15 (7/1/14 - 6/30/15)Benchmark Rate $92.91Adopted Rate FactorAdopted Rate Factor
RebaseBook 2014 89 October 8, 2013
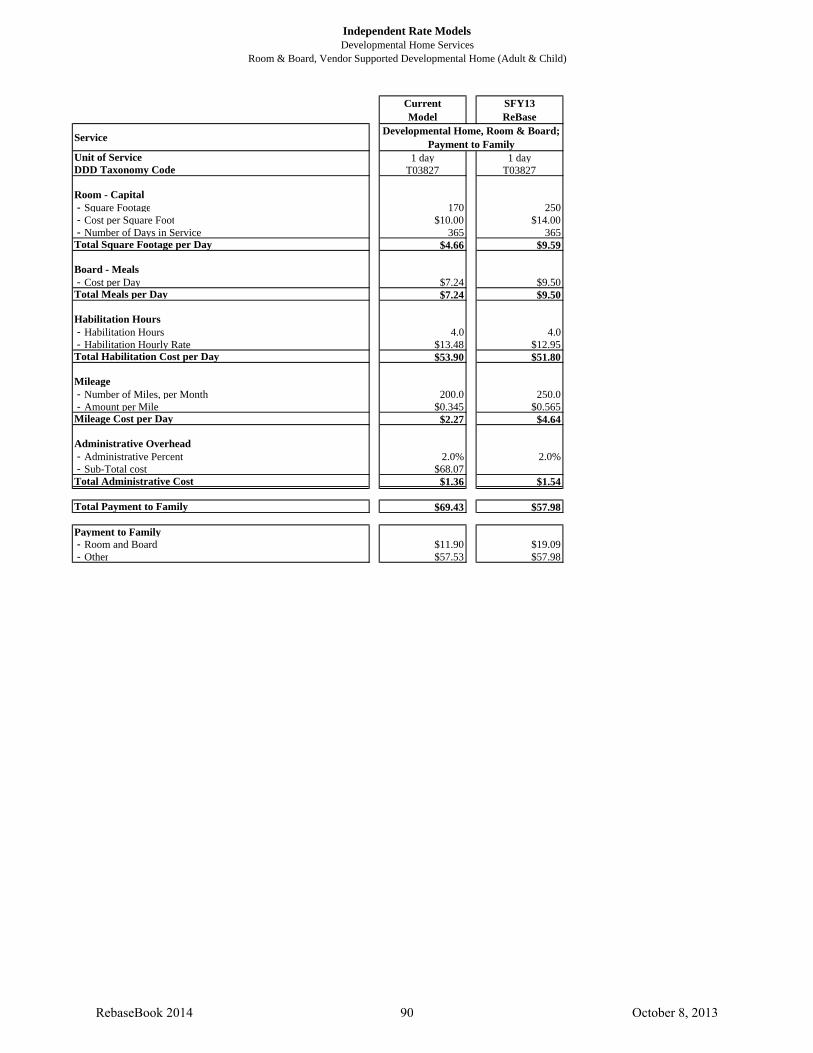
Independent Rate ModelsDevelopmental Home Services
Room & Board, Vendor Supported Developmental Home (Adult & Child)
CurrentModel
SFY13ReBase
Service
Unit of Service 1 day 1 dayDDD Taxonomy Code T03827 T03827
Room - Capital- Square Footage 170 250- Cost per Square Foot $10.00 $14.00- Number of Days in Service 365 365
Total Square Footage per Day $4.66 $9.59
Board - Meals- Cost per Day $7.24 $9.50
Total Meals per Day $7.24 $9.50
Habilitation Hours- Habilitation Hours 4.0 4.0- Habilitation Hourly Rate $13.48 $12.95
Total Habilitation Cost per Day $53.90 $51.80
Mileage- Number of Miles, per Month 200.0 250.0- Amount per Mile $0.345 $0.565
Mileage Cost per Day $2.27 $4.64
Administrative Overhead- Administrative Percent 2.0% 2.0%- Sub-Total cost $68.07
Total Administrative Cost $1.36 $1.54
Total Payment to Family $69.43 $57.98
Payment to Family- Room and Board $11.90 $19.09 - Other $57.53 $57.98
Developmental Home, Room & Board; Payment to Family
RebaseBook 2014 90 October 8, 2013

Independent Rate ModelsGroup Home Services
Habilitation, Community Protection and Treatment, Group Home
CurrentModel
SFY13ReBase
Unit of Service 1 hour 1 hourDDD Taxonomy Code T03827 T03827
Hourly Wage $12.09 $11.44Annual Wage $25,153 $23,795
ERE (as percent of wages) 30.0% 35.0%Hourly Compensation (wages + ERE) $15.72 $15.44Annual Compensation (wages + ERE) $32,699 $32,124
Productivity Assumptions- Total Hours 8.00 8.00
- Travel Time 0.00 0.00
- Time allocated to notes/med records 0.00 0.00
- Down Time 0.00 0.00
- Training Time 0.21
- Employer Time 0.10
- Average on-site time; "Billable Hours" 8.00 7.69
- Productivity Adjustment 1.00 1.04Hourly Compensation After Adjustment $15.72 $16.07Annual Compensation After Adjustment $32,699 $32,124
Transportation- Vehicle allocation $0.6556- Number of Miles per Staff Hour 1.14 1.17- Amount per mile/Enhanced Amount per Mile $0.345 $0.820
Total Mileage Amount $0.39 $0.96Hourly Transportation Cost $1.05 $0.96
Hourly Program Compliance cost- Compliance Percent 4.0%- Non-travel/Total cost $15.72
Hourly Program Compliance Cost $0.63
Program Support Cost- Program Support Percent 0.0% 8.0%- Non-travel/Total cost $15.72 $17.03
Total Program Support Cost $0.00 $1.66
Administrative Overhead- Administrative Percent 10.0% 10.0%- Non-travel/Total cost $15.72 $17.03
Hourly Administrative Cost $1.57 $2.08
SFY 04Benchmark Rate $18.97 Adopted Rate Factor 93.0%Adopted Rate $17.64
SFY 14 (7/1/13 - 6/30/14)Benchmark Rate Inflation Adjustment 0.00%Benchmark Rate $21.57 Adopted Rate Factor 81.36%Adopted Rate $17.55
SFY 15 (7/1/14 - 6/30/15)Benchmark Rate $20.76 Adopted Rate FactorAdopted Rate
ServiceHabilitation, Community Protection
and Treatment, Group Home
RebaseBook 2014 91 October 8, 2013

Independent Rate ModelsGroup Home Services
Habilitation, Group Home
CurrentModel
SFY13ReBase
Unit of Service 1 hour 1 hourDDD Taxonomy Code T03827 T03827
Hourly Wage $10.99 $11.44Annual Wage $22,866 $23,795
ERE (as percent of wages) 30.0% 35.0%Hourly Compensation (wages + ERE) $14.29 $15.44Annual Compensation (wages + ERE) $29,726 $32,124
Productivity Assumptions- Total Hours 8.00 8.00
- Travel Time 0.00 0.00
- Time allocated to notes/med records 0.00 0.00
- Down Time 0.00 0.00
- Training Time 0.15
- Employer Time 0.10
- Average on-site time; "Billable Hours" 8.00 7.75
- Productivity Adjustment 1.00 1.03Hourly Compensation After Adjustment $14.29 $15.94Annual Compensation After Adjustment $29,726 $32,124
Transportation- Vehicle allocation $0.6556- Number of Miles per Staff Hour 1.14 1.17- Amount per mile/Enhanced Amount per Mile $0.345 $0.820
Total Mileage Amount $0.39 $0.96Hourly Transportation Cost $1.05 $0.96
Hourly Program Compliance cost- Compliance Percent 2.0%- Non-travel/Total cost $14.29
Hourly Program Compliance Cost $0.29
Program Support Cost- Program Support Percent 0.0% 8.0%- Non-travel/Total cost $14.29 $16.90
Hourly Program Support Cost $0.00 $1.65
Administrative Overhead- Administrative Percent 10.0% 10.0%- Non-travel/Total cost $14.29 $16.90
Hourly Administrative Cost $1.43 $2.06
SFY 04Benchmark Rate $17.06 Adopted Rate Factor 93.0%Adopted Rate $15.87
SFY 14 (7/1/13 - 6/30/14)Benchmark Rate Inflation Adjustment 0.00%Benchmark Rate $19.39 Adopted Rate Factor 90.50%Adopted Rate $17.55
SFY 15 (7/1/14 - 6/30/15)Benchmark Rate $20.61 Adopted Rate FactorAdopted Rate
Service Habilitation, Group Home
RebaseBook 2014 92 October 8, 2013

Independent Rate ModelsGroup Home Services
Habilitation, Nursing Supported Group Home
CurrentModel
SFY13ReBase
CurrentModel
SFY13ReBase
Unit of Service 1 Day 1 Day 1 Day 1 DayService Level Level I Level I Level II Level II
Average Home Size 5.0 5.0
Registered Nurse (RN)Hourly Wage $33.78 $33.78ERE (as percent of wages) 23.0% 23.0%Hourly Compensation (wages + ERE) $41.55 $41.55
Certified Nurse Assistant (CNA)Hourly Wage $13.15 $13.15ERE (as percent of wages) 30.0% 30.0%Hourly Compensation (wages + ERE) $17.10 $17.10
Average Daily HoursRN 24.00 24.00CNA 24.00 32.00
Average Daily Hours per ResidentRN 4.80 4.80CNA 4.80 6.40
Avg. Daily Compensation (wages + ERE) $281.52 $308.88
Productivity Assumptions- Total Hours 8.00 8.00
- Travel Time 0.00 0.00
- Recordkeeping & Documentation 0.00 0.00
- Down Time 0.00 0.00
- Training Time 0.21 0.21
- Average on-site time; "Billable Hours" 7.79 7.79
- Productivity Adjustment 1.03 1.03Daily Compensation After Adjustment $289.11 $317.21
Transportation- Number of Miles per Day 80.00 80.00- Amount per mile/Enhanced Amount per Mile $0.820 $0.820
Total Mileage Amount $65.60 $65.60Daily Transportation Cost / Resident $13.12 $13.12
Program Support Cost- Program Support Percent 8.0% 8.0%- Total cost $302.23 $330.33
Program Support Cost $29.49 $32.23
Administrative Overhead- Administrative Percent 10.0% 10.0%- Total cost $302.23 $330.33
Administrative Cost $36.86 $40.28
SFY 14 (7/1/13 - 6/30/14)Benchmark Rate $357.00 $428.73 Adopted Rate $323.09 $388.00
SFY 15 (7/1/14 - 6/30/15)Benchmark Rate $368.57 $402.84 Adopted Rate FactorAdopted Rate
Habilitation, Nursing Supported Group HomeService
RebaseBook 2014 93 October 8, 2013

Independent Rate ModelsGroup Home Services
Habilitation, Nursing Supported Group Home
Unit of ServiceService Level
Average Home Size
Registered Nurse (RN)Hourly WageERE (as percent of wages)Hourly Compensation (wages + ERE)
Certified Nurse Assistant (CNA)Hourly WageERE (as percent of wages)Hourly Compensation (wages + ERE)
Average Daily HoursRNCNA
Average Daily Hours per ResidentRNCNA
Avg. Daily Compensation (wages + ERE)
Productivity Assumptions- Total Hours
- Travel Time
- Recordkeeping & Documentation
- Down Time
- Training Time
- Average on-site time; "Billable Hours"
- Productivity AdjustmentDaily Compensation After Adjustment
Transportation- Number of Miles per Day- Amount per mile/Enhanced Amount per Mile
Total Mileage AmountDaily Transportation Cost / Resident
Program Support Cost- Program Support Percent- Total cost
Program Support Cost
Administrative Overhead- Administrative Percent- Total cost
Administrative Cost
SFY 14 (7/1/13 - 6/30/14)Benchmark RateAdopted Rate
SFY 15 (7/1/14 - 6/30/15)Benchmark RateAdopted Rate FactorAdopted Rate
Service
CurrentModel
SFY13ReBase
1 Day 1 DayLevel III Level III
5.0
$33.7823.0%$41.55
$13.1530.0%$17.10
32.0024.00
6.404.80
$348.00
8.000.000.000.000.217.791.03
$357.38
80.00$0.820$65.60$13.12
8.0%$370.50
$36.15
10.0%$370.50
$45.18
$489.54 $443.03
$451.83
Habilitation, Nursing Supported Group Home
RebaseBook 2014 94 October 8, 2013

Independent Rate ModelsGroup Home Services
Room & Board, All Group Homes
1 Bedroom 2 Bedroom 3 Bedroom 4 Bedroom 5 Bedroom 6 Bedroom
Occupancy 1 2 3 4 5 6Number of Days per Month 30.4 30.4 30.4 30.4 30.4 30.4
Monthly FactorsRent $692.25 $870.45 $1,210.63 $1,425.54 $1,639.37 $1,885.28Utilities $156.52 $174.70 $192.15 $208.53 $224.28 $241.12Telephone $21.60 $27.00 $35.05 $43.11 $51.16 $59.22Maintenance $48.60 $46.73 $46.73 $46.73 $46.73 $46.73Household Consumables $0.00 $0.00 $0.00 $0.00 $0.00 $0.00Food $235.81 $471.62 $707.43 $943.24 $1,179.05 $1,414.86
Daily FactorsRent $22.75 $28.62 $39.80 $46.87 $53.90 $61.98Utilities $5.15 $5.74 $6.32 $6.86 $7.37 $7.93Telephone $0.71 $0.89 $1.15 $1.42 $1.68 $1.95Maintenance $1.60 $1.54 $1.54 $1.54 $1.54 $1.54Household Consumables $0.00 $0.00 $0.00 $0.00 $0.00 $0.00Food $7.75 $15.51 $23.26 $31.01 $38.76 $46.52
Per Occupant, Per Day FactorsRent $22.75 $14.31 $13.27 $11.72 $10.78 $10.33Utilities $5.15 $2.87 $2.11 $1.71 $1.47 $1.32Telephone $0.71 $0.44 $0.38 $0.35 $0.34 $0.32Maintenance $1.60 $0.77 $0.51 $0.38 $0.31 $0.26Household Consumables $0.00 $0.00 $0.00 $0.00 $0.00 $0.00Food $7.75 $7.75 $7.75 $7.75 $7.75 $7.75
Rate Per person $37.96 $26.15 $24.02 $21.92 $20.65 $19.98
Contracted Capacity 1 2 3 4 5 6Capacity Rate $37.96 $52.29 $72.07 $87.69 $103.25 $119.91
Unoccupied Capacity DiscountTelephone* $0.71 $0.44 $0.38 $0.35 $0.34 $0.32Food $7.75 $7.75 $7.75 $7.75 $7.75 $7.75
Total Discount per Occupant $8.46 $8.20 $8.14 $8.11 $8.09 $8.08
1 2 3 4 5 61 $37.96 $44.09 $55.79 $63.37 $70.90 $79.522 $26.15 $31.96 $35.74 $39.49 $43.803 $24.02 $26.53 $29.02 $31.894 $21.92 $23.79 $25.945 $20.65 $22.376 $19.98
Urban (Current Phoenix Model)Current Factors, Inflated
Benchmark Rates
Occupancy (Persons)Contracted Capacity
RebaseBook 2014 95 October 8, 2013

Independent Rate ModelsGroup Home Services
Room & Board, All Group Homes
OccupancyNumber of Days per Month
Monthly FactorsRentUtilitiesTelephoneMaintenanceHousehold ConsumablesFood
Daily FactorsRentUtilitiesTelephoneMaintenanceHousehold ConsumablesFood
Per Occupant, Per Day FactorsRentUtilitiesTelephoneMaintenanceHousehold ConsumablesFood
Rate Per person
Contracted CapacityCapacity Rate
Unoccupied Capacity DiscountTelephone*Food
Total Discount per Occupant
123456
Occupancy (Persons)
1 Bedroom 2 Bedroom 3 Bedroom 4 Bedroom 5 Bedroom 6 Bedroom
1 2 3 4 5 630.4 30.4 30.4 30.4 30.4 30.4
$748.00 $925.00 $1,363.00 $1,592.00 $1,899.50 $2,196.50$176.18 $239.34 $302.51 $365.68 $480.02 $570.95
$50.00 $60.00 $70.00 $80.00 $90.00 $100.00$50.00 $55.00 $60.00 $65.00 $70.00 $75.00
$288.86 $577.72 $866.58 $1,155.44 $1,444.30 $1,733.16
$24.61 $30.43 $44.84 $52.37 $62.48 $72.25$5.80 $7.87 $9.95 $12.03 $15.79 $18.78$0.00 $0.00 $0.00 $0.00 $0.00 $0.00$1.64 $1.97 $2.30 $2.63 $2.96 $3.29$1.64 $1.81 $1.97 $2.14 $2.30 $2.47$9.50 $19.00 $28.51 $38.01 $47.51 $57.01
$24.61 $15.21 $14.95 $13.09 $12.50 $12.04$5.80 $3.94 $3.32 $3.01 $3.16 $3.13$0.00 $0.00 $0.00 $0.00 $0.00 $0.00$1.64 $0.99 $0.77 $0.66 $0.59 $0.55$1.64 $0.90 $0.66 $0.53 $0.46 $0.41$9.50 $9.50 $9.50 $9.50 $9.50 $9.50
$43.19 $30.54 $29.19 $26.79 $26.21 $25.63
1 2 3 4 5 6$43.19 $61.09 $87.57 $107.18 $131.05 $153.80
$0.00 $1.29 $0.86 $0.64 $0.85 $0.58$9.50 $9.50 $9.50 $9.50 $9.50 $9.50$9.50 $10.79 $10.36 $10.14 $10.35 $10.08
1 2 3 4 5 6$43.19 $50.30 $66.84 $76.75 $89.64 $103.39
$30.54 $38.60 $43.45 $50.00 $56.74$29.19 $32.34 $36.78 $41.19
$26.79 $30.17 $33.41$26.21 $28.74
$25.63
Urban (Maricopa & Pima)SFY13 ReBase
Benchmark RatesContracted Capacity
RebaseBook 2014 96 October 8, 2013

Independent Rate ModelsGroup Home Services
Room & Board, All Group Homes
1 Bedroom 2 Bedroom 3 Bedroom 4 Bedroom 5 Bedroom 6 Bedroom
Occupancy 1 2 3 4 5 6Number of Days per Month 30.4 30.4 30.4 30.4 30.4 30.4
Monthly FactorsRent $712.77 $925.52 $1,240.87 $1,490.34 $1,713.89 $1,970.98Utilities $156.52 $174.70 $192.15 $208.53 $224.28 $241.12Telephone $21.60 $27.00 $35.05 $43.11 $51.16 $59.22Maintenance $48.60 $54.00 $78.43 $102.86 $127.28 $151.71Household Consumables $0.00 $0.00 $0.00 $0.00 $0.00 $0.00Food $235.81 $471.62 $707.43 $943.24 $1,179.05 $1,414.86
Daily FactorsRent $23.43 $30.43 $40.80 $49.00 $56.35 $64.80Utilities $5.15 $5.74 $6.32 $6.86 $7.37 $7.93Telephone $0.71 $0.89 $1.15 $1.42 $1.68 $1.95Maintenance $1.60 $1.78 $2.58 $3.38 $4.18 $4.99Household Consumables $0.00 $0.00 $0.00 $0.00 $0.00 $0.00Food $7.75 $15.51 $23.26 $31.01 $38.76 $46.52
Per Occupant, Per Day FactorsRent $23.43 $15.21 $13.60 $12.25 $11.27 $10.80Utilities $5.15 $2.87 $2.11 $1.71 $1.47 $1.32Telephone $0.71 $0.44 $0.38 $0.35 $0.34 $0.32Maintenance $1.60 $0.89 $0.86 $0.85 $0.84 $0.83Household Consumables $0.00 $0.00 $0.00 $0.00 $0.00 $0.00Food $7.75 $7.75 $7.75 $7.75 $7.75 $7.75
Rate Per person $38.64 $27.17 $24.70 $22.92 $21.67 $21.03
Contracted Capacity 1 2 3 4 5 6Capacity Rate $38.64 $54.34 $74.10 $91.66 $108.35 $126.18
Unoccupied Capacity DiscountTelephone* $0.71 $0.44 $0.38 $0.35 $0.34 $0.32Food $7.75 $7.75 $7.75 $7.75 $7.75 $7.75
Total Discount per Occupant $8.46 $8.20 $8.14 $8.11 $8.09 $8.08
1 2 3 4 5 61 $38.64 $46.14 $57.83 $67.34 $75.99 $85.792 $27.17 $32.98 $37.72 $42.04 $46.933 $24.70 $27.85 $30.72 $33.984 $22.92 $25.07 $27.515 $21.67 $23.626 $21.03
Rural (Current Flagstaff Model)Current Factors, Inflated
Benchmark Rates
Occupancy (Persons)Contracted Capacity
RebaseBook 2014 97 October 8, 2013
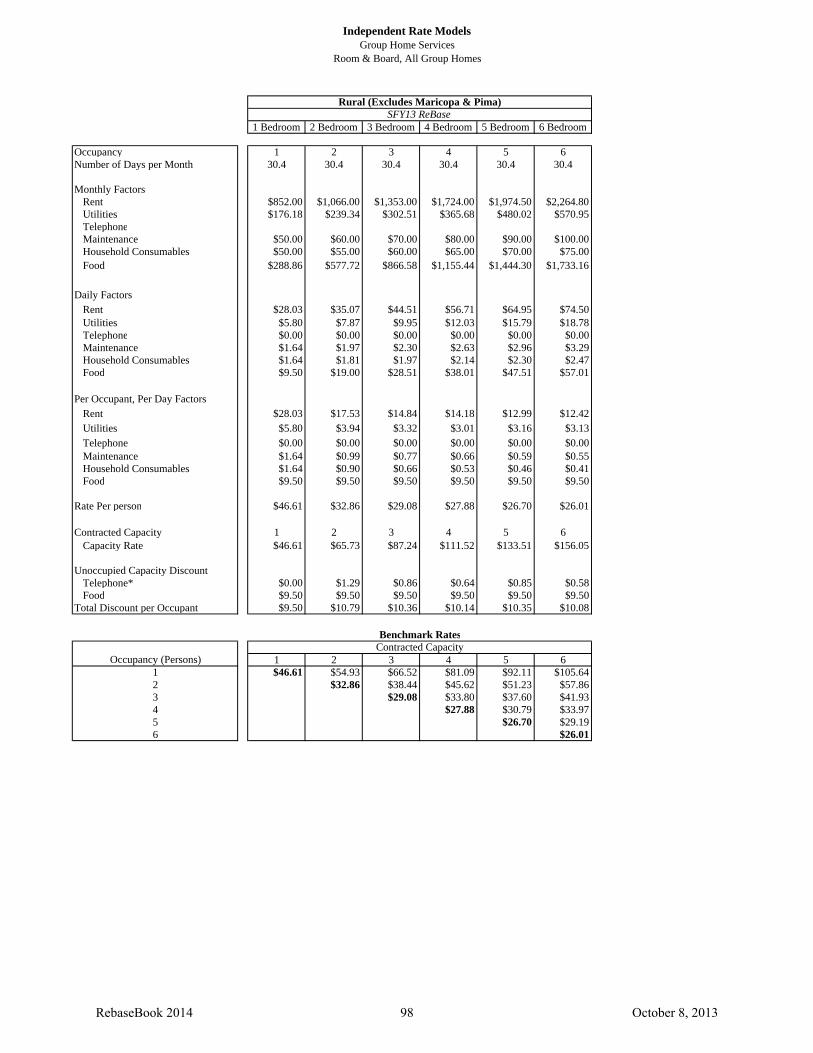
Independent Rate ModelsGroup Home Services
Room & Board, All Group Homes
OccupancyNumber of Days per Month
Monthly FactorsRentUtilitiesTelephoneMaintenanceHousehold ConsumablesFood
Daily FactorsRentUtilitiesTelephoneMaintenanceHousehold ConsumablesFood
Per Occupant, Per Day FactorsRentUtilitiesTelephoneMaintenanceHousehold ConsumablesFood
Rate Per person
Contracted CapacityCapacity Rate
Unoccupied Capacity DiscountTelephone*Food
Total Discount per Occupant
123456
Occupancy (Persons)
1 Bedroom 2 Bedroom 3 Bedroom 4 Bedroom 5 Bedroom 6 Bedroom
1 2 3 4 5 630.4 30.4 30.4 30.4 30.4 30.4
$852.00 $1,066.00 $1,353.00 $1,724.00 $1,974.50 $2,264.80$176.18 $239.34 $302.51 $365.68 $480.02 $570.95
$50.00 $60.00 $70.00 $80.00 $90.00 $100.00$50.00 $55.00 $60.00 $65.00 $70.00 $75.00
$288.86 $577.72 $866.58 $1,155.44 $1,444.30 $1,733.16
$28.03 $35.07 $44.51 $56.71 $64.95 $74.50$5.80 $7.87 $9.95 $12.03 $15.79 $18.78$0.00 $0.00 $0.00 $0.00 $0.00 $0.00$1.64 $1.97 $2.30 $2.63 $2.96 $3.29$1.64 $1.81 $1.97 $2.14 $2.30 $2.47$9.50 $19.00 $28.51 $38.01 $47.51 $57.01
$28.03 $17.53 $14.84 $14.18 $12.99 $12.42$5.80 $3.94 $3.32 $3.01 $3.16 $3.13$0.00 $0.00 $0.00 $0.00 $0.00 $0.00$1.64 $0.99 $0.77 $0.66 $0.59 $0.55$1.64 $0.90 $0.66 $0.53 $0.46 $0.41$9.50 $9.50 $9.50 $9.50 $9.50 $9.50
$46.61 $32.86 $29.08 $27.88 $26.70 $26.01
1 2 3 4 5 6$46.61 $65.73 $87.24 $111.52 $133.51 $156.05
$0.00 $1.29 $0.86 $0.64 $0.85 $0.58$9.50 $9.50 $9.50 $9.50 $9.50 $9.50$9.50 $10.79 $10.36 $10.14 $10.35 $10.08
1 2 3 4 5 6$46.61 $54.93 $66.52 $81.09 $92.11 $105.64
$32.86 $38.44 $45.62 $51.23 $57.86$29.08 $33.80 $37.60 $41.93
$27.88 $30.79 $33.97$26.70 $29.19
$26.01
Rural (Excludes Maricopa & Pima)SFY13 ReBase
Benchmark RatesContracted Capacity
RebaseBook 2014 98 October 8, 2013

Independent Rate ModelsProfessional Services
Home Health Aide
CurrentModel
SFY13ReBase
Unit of Service 1 hour 1 hourDDD Taxonomy Code T01609 T01609
Hourly Wage $8.67 $10.47Annual Wage $18,035 $21,778
ERE (as percent of wages) 30.0% 35.0%Hourly Compensation (wages + ERE) $11.27 $14.13Annual Compensation (wages + ERE) $23,446 $29,400
Factors Offsetting Direct Care Service Hours- Total Hours 8.00 8.00- Travel Time 0.60 1.07- Time allocated to notes/med records 0.50 0.20
- Training Time 0.00 0.15
- Time allocated to missed appointments 0.00 0.05
- Employer Time 0.10
- Average on-site time; "Billable Hours" 6.90 6.43
- Productivity Adjustment 1.16 1.24Hourly Compensation After Adjustment $13.07 $17.59Annual Compensation After Adjustment $27,184 $36,578
Mileage- Number of Miles 30 22.5- Amount per mile $0.345 $0.565
Total Mileage Amount $10.35 $12.71Hourly mileage cost $1.50 $1.98
Supervision- Hourly Wage $24.41 $33.78 - ERE (as percent of wages) 23.0%- Daily portion of an hour 0.25 0.25
Hourly Supervision Cost $0.76 $1.62
Program Support Costs- Program Support Percent 0.0% 8.0%- Non-travel/Total cost $13.83 $21.18
Hourly Program Support Cost $0.00 $2.07
Administrative Overhead- Administrative Percent 10.0% 10.0%- Non-travel/Total cost $13.83 $21.18
Hourly Administrative Cost $1.38 $2.58
SFY 04Benchmark Rate $16.72 Adopted Rate Factor 93.0%Adopted Rate $15.55
SFY 14 (7/1/13 - 6/30/14)Benchmark Rate Inflation Adjustment 0.00%Benchmark Rate $19.01 Adopted Rate Factor 90.50%Adopted Rate $17.20
SFY 15 (7/1/14 - 6/30/15)Benchmark Rate $25.83 Adopted Rate FactorAdopted Rate
Service Home Health Aide
RebaseBook 2014 99 October 8, 2013

Independent Rate ModelsProfessional Services
Nursing Services
CurrentModel
RN/LPN RN LPNUnit of Service 1 visit 1 visit 1 visitDDD Taxonomy Code T02304 T02304 T02304
Hourly Wage $20.11 $33.78 $23.96Annual Wage $41,836 $70,262 $49,837
ERE (as percent of wages) 30.0% 23.0% 23.0%Hourly Compensation (wages + ERE) $26.15 $41.55 $29.47Annual Compensation (wages + ERE) $54,387 $86,423 $61,299
Productivity Assumptions- Total Hours 8.00 8.00 8.00- Travel Time 0.60 1.57 1.57- Time allocated to notes/med records 0.50 0.80 0.80
- Down Time 0.00 0.00 0.00
- Employer Time 0.10 0.10
- Consultation with provider 0.20 0.20
- Training 0.21 0.21
- Average on-site time; "Billable Hours" 6.90 5.12 5.12
- Productivity Adjustment 1.16 1.56 1.56Hourly Compensation After Adjustment $30.32 $64.92 $46.05Annual Compensation After Adjustment $54,387 $86,423 $61,299
Supervision- Supervisor Wage $24.41 $33.78 - Supervisor ERE 23.0%- Hourly Services Oversight Cost $41.55 - Hours per Day 0.25 0.5
Hourly supervision cost $0.76 $4.06
Mileage- Number of Miles 30 35 35- Amount per mile $0.345 $0.565 $0.565
Total Mileage Amount $10.35 $19.78 $19.78Hourly mileage cost $1.50 $3.86 $3.86
Program Support Costs- Program Support Cost Percent 4.0% 4.0%- Total Cost $68.78 $53.97
Hourly Program Support cost $3.24 $2.54
Administrative Overhead- Administrative Percent 10% 10.0% 10.0%- Third Party Liability Pct. 1.00% 1.00%- Non-travel cost or Total Cost (2013) $31.08 $68.78 $53.97
Hourly administrative cost $3.11 $8.90 $6.98
SFY 04Benchmark Rate $35.69 Adopted Rate Factor 93.0%Calculated Adopted Rate $33.19 Adopted Rate (with SFY03 Floor) $35.00
SFY 14 (7/1/13 - 6/30/14)Benchmark Rate Inflation Adjustment 0.00%Benchmark Rate $40.57 Adopted Rate Factor 90.50%Adopted Rate - 1 Staff, 1 Client $36.72
Service
SFY13ReBase
Nursing, Visit
RebaseBook 2014 100 October 8, 2013

Independent Rate ModelsProfessional Services
Nursing Services
CurrentModel
RN/LPN RN LPNService
SFY13ReBase
Nursing, Visit
SFY 15 (7/1/14 - 6/30/15)Benchmark Rate $80.92 $63.49 Less than 1 hour adjustment factor (assumes 6 visits and 5.04 hours productive time)
84% 84%
Adjusted Benchmark Rate $67.97 $53.33 Area 1 $74.77 $58.66 Area 2 $84.97 $66.66
Adopted Rate FactorAdopted Rate - 1 Staff, 1 Client
RebaseBook 2014 101 October 8, 2013

Independent Rate ModelsProfessional Services
Nursing Services
Current Model
RN/LPN RN LPNUnit of Service 1 hour 1 hour 1 hourDDD Taxonomy Code T02304 T02304 T02304
Hourly Wage $20.11 $33.78 $23.96Annual Wage $41,836 $70,262 $49,837
ERE (as percent of wages) 30.0% 23.0% 23.0%Hourly Compensation (wages + ERE) $26.15 $41.55 $29.47Annual Compensation (wages + ERE) $54,387 $86,423 $61,299
Productivity Assumptions- Total Hours 8.00 8.00 8.00- Travel Time 0.60 1.21 1.21- Time allocated to notes/med records 0.50 0.50 0.50
- Down Time 0.00 0.00 0.00
- Employer Time 0.10 0.10
- Consultation with provider 0.20 0.20
- Training 0.21 0.21
- Average on-site time; "Billable Hours" 6.90 5.78 5.78
- Productivity Adjustment 1.16 1.38 1.38Hourly Compensation After Adjustment $30.32 $57.51 $40.79Annual Compensation After Adjustment $54,387 $86,423 $61,299
Supervision- Supervisor Wage $24.41 $33.78 - Supervisor ERE 23.0%- Hourly Services Oversight Cost $41.55- Hours per Day 0.25 0.5
Hourly supervision cost $0.76 $3.59
Mileage- Number of Miles 30 26 26- Amount per mile $0.345 $0.565 $0.565
Total Mileage Amount $10.35 $14.69 $14.69Hourly mileage cost $1.50 $2.54 $2.54
Program Support Costs- Program Support Cost Percent 4.0% 4.0%- Non-travel cost or Total Cost (2013) $60.05 $46.93
Hourly Program Support cost $2.83 $2.21
Administrative Overhead- Administrative Percent 10% 10.0% 10.0%- Third Party Liability Pct. 1.0% 1.0%- Non-travel cost or Total Cost (2013) $31.08 $60.05 $46.93
Hourly administrative cost $3.11 $7.77 $6.07
SFY 04Benchmark Rate $35.69 Adopted Rate Factor 93.0%Calculated Adopted Rate $33.19 Adopted Rate = Floor Rate for SFY 03 Provider Increase $35.00
SFY 14 (7/1/13 - 6/30/14)Benchmark Rate Inflation Adjustment 0.00%Benchmark Rate $40.57 Adopted Rate Factor 90.50%Adopted Rate - 1 Staff, 1 Client $36.72
SFY 15 (7/1/14 - 6/30/15)Benchmark Rate $70.65 $55.21
Area 1 $77.72 $60.73 Area 2 $88.31 $69.01
Adopted Rate FactorAdopted Rate - 1 Staff, 1 Client
Service Nursing, Intermittent
SFY13ReBase
RebaseBook 2014 102 October 8, 2013

Independent Rate ModelsProfessional Services
Nursing Services
Current Model
RN/LPN RN LPNUnit of Service 16+ hours 1 hour 1 hourDDD Taxonomy Code T02304 T02304 T02304
Hourly Wage $20.11 $33.78 $23.96Annual Wage $41,836 $70,262 $49,837
ERE (as percent of wages) 30.0% 23.0% 23.0%Hourly Compensation (wages + ERE) $26.15 $41.55 $29.47Annual Compensation (wages + ERE) $54,387 $86,423 $61,299
Productivity Assumptions- Total Hours 8.00 8.00 8.00- Travel Time 0.60 0.00 0.00- Time allocated to notes/med records 0.50 0.20 0.20
- Down Time 0.00 0.00 0.00
- Employer Time 0.10 0.10
- Consultation with provider 0.20 0.20
- Training 0.21 0.21
- Average on-site time; "Billable Hours" 6.90 7.29 7.29
- Productivity Adjustment 1.16 1.10 1.10Hourly Compensation After Adjustment $30.32 $45.60 $32.34Annual Compensation After Adjustment $54,387 $86,423 $61,299
Supervision- Supervisor Wage $24.41 $33.78 - Supervisor ERE 23.0%- Hourly Services Oversight Cost $41.55 - Hours per Day 0.25 0.5
Hourly supervision cost $0.76 $2.85
Mileage- Number of Miles 30 0 0- Amount per mile $0.345 $0.565 $0.565
Total Mileage Amount $10.35 $0.00 $0.00Hourly mileage cost $1.50 $0.00 $0.00
Program Support Costs- Program Support Cost Percent 4.0% 4.0%- Non-travel cost or Total Cost (2013) $45.60 $35.19
Hourly Program Support cost $2.15 $1.66
Administrative Overhead- Administrative Percent 10% 10.0% 10.0%- Third Party Liability Pct. 1.0% 1.0%- Non-travel cost or Total Cost (2013) $31.08 $45.60 $35.19
Hourly administrative cost $3.11 $5.90 $4.55
SFY 04Benchmark Rate $35.69 Adopted Rate Factor 93.0%Calculated Adopted Rate $33.19 Adopted Rate = Floor Rate for SFY 03 Provider Increase $35.00
SFY 14 (7/1/13 - 6/30/14)Benchmark Rate Inflation Adjustment 0.00%Benchmark Rate $40.57 Adopted Rate Factor 90.50%Adopted Rate - 1 Staff, 1 Client $36.72
SFY 15 (7/1/14 - 6/30/15)Benchmark Rate Inflation Adjustment 0.00% 0.00%Benchmark Rate $53.64 $41.40
Area 1 $59.00 $45.54 Area 2 $67.05 $51.75
Adopted Rate FactorAdopted Rate - 1 Staff, 1 Client
Service Nursing, Continuous
SFY13ReBase
RebaseBook 2014 103 October 8, 2013

Independent Rate ModelsProfessional Services
Nursing Services
Current Model
RN/LPN RN LPNUnit of Service 16+ hours 1 hour 1 hourDDD Taxonomy Code T02304 T02304 T02304
Hourly Wage $20.11 $33.78 $23.96Annual Wage $41,836 $70,262 $49,837
ERE (as percent of wages) 30.0% 23.0% 23.0%Hourly Compensation (wages + ERE) $26.15 $41.55 $29.47Annual Compensation (wages + ERE) $54,387 $86,423 $61,299
Productivity Assumptions- Total Hours 8.00 8.00 8.00- Travel Time 0.60 0.00 0.00- Time allocated to notes/med records 0.50 0.20 0.20
- Down Time 0.00 0.00 0.00
- Employer Time 0.10 0.10
- Consultation with provider 0.20 0.20
- Training 0.21 0.21
- Average on-site time; "Billable Hours" 6.90 7.29 7.29
- Productivity Adjustment 1.16 1.10 1.10Hourly Compensation After Adjustment $30.32 $45.60 $32.34Annual Compensation After Adjustment $54,387 $86,423 $61,299
Supervision- Supervisor Wage $24.41 $33.78 - Supervisor ERE 23.0%- Hourly Services Oversight Cost $41.55 - Hours per Day 0.25 0.5
Hourly supervision cost $0.76 $2.85
Mileage- Number of Miles 30 0 0- Amount per mile $0.345 $0.565 $0.565
Total Mileage Amount $10.35 $0.00 $0.00Hourly mileage cost $1.50 $0.00 $0.00
Program Support Costs- Program Support Cost Percent 4.0% 4.0%- Non-travel cost or Total Cost (2013) $45.60 $35.19
Hourly Program Support cost $2.15 $1.66
Administrative Overhead- Administrative Percent 10% 10.0% 10.0%- Third Party Liability Pct. 1.0% 1.0%- Non-travel cost or Total Cost (2013) $31.08 $45.60 $35.19
Hourly administrative cost $3.11 $5.90 $4.55
SFY 04Benchmark Rate $35.69 Adopted Rate Factor 93.0%Calculated Adopted Rate $33.19 Adopted Rate = Floor Rate for SFY 03 Provider Increase $35.00
SFY 14 (7/1/13 - 6/30/14)Benchmark Rate Inflation Adjustment 0.00%Benchmark Rate $40.57 Adopted Rate Factor 90.50%Adopted Rate - 1 Staff, 1 Client $36.72
SFY 15 (7/1/14 - 6/30/15)Benchmark Rate Inflation Adjustment 0.00% 0.00%Benchmark Rate $53.64 $41.40
Area 1 $59.00 $45.54 Area 2 $67.05 $51.75
Adopted Rate FactorAdopted Rate - 1 Staff, 1 Client
Service Nursing, Respite
SFY13ReBase
RebaseBook 2014 104 October 8, 2013

Independent Rate ModelsProfessional Services
Therapy Services (Physical, Occupational & Speech)
CurrentModel
SFY13ReBase
Unit of Service: 1 hour 1 hourSetting: Clinic Clinic
Hourly Wage $32.83 $36.63 Annual Wage $68,286 $76,190
ERE as a Pct. of Wages 30.0% 23.0%Hourly Compensation (wages + ERE) $42.68 $45.05Annual Compensation (wages + ERE) $88,772 $93,714
Productivity Assumptions- Total Hours 8.00 8.00 - Travel Time 0.00 0.00 - Recordkeeping & Documentation 0.65 - Consultation with Providers/Family 0.40 - Employer Time 0.10 - Missed Appointments 0.50 0.05 - Training/Continuous Education 0.20 0.21 - Other Non-Billable Activity 0.30 0.00 - Average on-site time; "Billable Hours" 7.00 6.59 - Productivity Adjustment 1.14 1.21 Hourly Compensation After Adjustment $48.78 $54.69 Annual Compensation After Adjustment $88,772 $93,714
Mileage- Number of Miles 1.50 0.00- Amount per mile $0.445 $0.565
Total Mileage Amount $0.67 $0.00 Hourly Mileage Amount $0.10 $0.00
Rent- Square Footage 250.00 300.00- Cost per Square Foot $15.50 $20.07 - Hours of Allocation per Year 1,820 1,713
Hourly Rent Amount $2.13 $3.51
Capital- Cost of Equipment and Maintenance $2,000.00 $3,000.00 - Year of Amortization 3.00 3.00- Annual Cost $666.67 $1,000.00 - Hours of Allocation per Year 1,820 1,713
Hourly Cost of Capital $0.37 $0.58
Program Support Costs- Program Support Percent 4.0%- Non-travel/Total cost $58.79
Hourly Program Support Cost $2.77
Administrative Overhead- Administrative Pct. 10.0% 10.0%- Third Party Liability Pct. 2.0% 1.0%- Non-travel/Total cost $51.27 $58.79
Hourly Administrative Cost $6.15 $7.61
SFY 08 (11/01/07 - 6/30/08)Benchmark Rate $57.52 Adopted Rate Factor 100.0%Calculated Adopted Rate $57.52 Adopted Rate, Floor (SFY 08) $62.80 Adopted Rate $62.80
Therapy, EvaluationBenchmark Rate $172.56 Adopted Rate $172.56
ServiceTherapy Services (Physical, Occupational and Speech)
RebaseBook 2014 105 October 8, 2013

Independent Rate ModelsProfessional Services
Therapy Services (Physical, Occupational & Speech)
CurrentModel
SFY13ReBase
Unit of Service: 1 hour 1 hourSetting: Clinic Clinic
ServiceTherapy Services (Physical, Occupational and Speech)
SFY 14 (7/1/13 - 6/30/14)Benchmark Rate Inflation Adjustment 0.00%Benchmark Rate $57.52 Adopted Rate Factor 90.50%Calculated Adopted Rate $52.06 Adopted Rate, Floor $56.83 Adopted Rate $56.83
Tier 1 $57.26 Tier 2 $65.07 Tier 3 $78.08
Therapy, EvaluationBenchmark Rate $172.56 Adopted Rate $156.17
SFY 15 (7/1/14 - 6/30/15)Benchmark Rate $69.17
Area 1 $76.09 Area 2 $86.46
Benchmark Rate, Evaluation $207.51 Adopted Rate FactorAdopted Rate
RebaseBook 2014 106 October 8, 2013

Independent Rate ModelsProfessional Services
Therapy Services (Physical, Occupational & Speech)
CurrentModel
SFY13ReBase
Unit of Service: 1 hour 1 hourSetting: Natural Natural
Hourly Wage $32.83 $36.63 Annual Wage $68,286 $76,190
ERE as a Pct. of Wages 30.0% 23.0%Hourly Compensation (wages + ERE) $42.68 $45.05Annual Compensation (wages + ERE) $88,772 $93,714
Productivity Assumptions- Total Hours 8.00 8.00 - Travel Time 1.50 1.77 - Recordkeeping & Documentation 0.47 - Consultation with Providers/Family 0.26 - Employer Time 0.20 - Missed Appointments 0.50 0.05 - Training/Continuous Education 0.20 0.21 - Other Non-Billable Activity 0.30 0.00 - Average on-site time; "Billable Hours" 5.50 5.04 - Productivity Adjustment 1.45 1.59 Hourly Compensation After Adjustment $62.08 $71.52 Annual Compensation After Adjustment $88,772 $93,714
Mileage- Number of Miles 60.00 40.00- Amount per mile $0.445 $0.565
Total Mileage Amount $26.70 $22.60 Hourly Mileage Amount $4.85 $4.48
Rent- Square Footage 250.00 100.00- Cost per Square Foot $15.50 $20.07 - Hours of Allocation per Year 1,430 1,310
Hourly Rent Amount $2.71 $1.53
Capital- Cost of Equipment and Maintenance $2,000.00 $2,000.00 - Year of Amortization 3.00 3.00- Annual Cost $666.67 $666.67 - Hours of Allocation per Year 1,430 1,310
Hourly Cost of Capital $0.47 $0.51
Program Support Costs- Program Support Percent 4.0%- Non-travel/Total cost $78.04
Hourly Program Support Cost $3.67
Administrative Overhead- Administrative Pct. 10.0% 10.0%- Third Party Liability Pct. 2.0% 1.0%- Non-travel/Total cost $65.25 $78.04
Hourly Administrative Cost $7.83 $10.10
SFY 08 (11/01/07 - 6/30/08)Benchmark Rate $77.94 Adopted Rate Factor 100.0%Calculated Adopted Rate $77.94 Adopted Rate, Floor (SFY 08) $62.80 Adopted Rate $77.94
Therapy, EvaluationBenchmark Rate $192.98 Adopted Rate $192.98
ServiceTherapy Services (Physical, Occupational and Speech)
RebaseBook 2014 107 October 8, 2013

Independent Rate ModelsProfessional Services
Therapy Services (Physical, Occupational & Speech)
CurrentModel
SFY13ReBase
Unit of Service: 1 hour 1 hourSetting: Natural Natural
ServiceTherapy Services (Physical, Occupational and Speech)
SFY 14 (7/1/13 - 6/30/14)Benchmark Rate Inflation Adjustment 0.00%Benchmark Rate $77.94 Adopted Rate Factor 90.50%Calculated Adopted Rate $70.54 Adopted Rate, Floor $56.83 Adopted Rate $70.54
Tier 1 $77.59 Tier 2 $88.17 Tier 3 $105.80
Therapy, EvaluationBenchmark Rate $192.98 Adopted Rate $174.65
SFY 15 (7/1/14 - 6/30/15)Benchmark Rate $91.81
Area 1 $100.99 Area 2 $114.76
Benchmark Rate, Evaluation $230.15 Adopted Rate FactorAdopted Rate
RebaseBook 2014 108 October 8, 2013

Independent Rate ModelsProfessional Services
Therapy Assistant Services (Physical, Occupational & Speech)
CurrentModel
SFY13ReBase
Unit of Service: 1 hour 1 hourSetting: Clinic Clinic
Hourly Wage $24.62 $17.41 Annual Wage $51,210 $36,213
ERE as a Pct. of Wages 30.0% 30.0%Hourly Compensation (wages + ERE) $32.01 $22.63Annual Compensation (wages + ERE) $66,572 $47,077
Productivity Assumptions- Total Hours 8.00 8.00 - Travel Time 0.00 0.00 - Recordkeeping & Documentation 0.53 - Consultation with Providers/Family 0.32 - Employer Time 0.30 - Missed Appointments 0.50 0.05 - Training/Continuous Education 0.20 0.21 - Other Non-Billable Activity 0.30 0.00 - Average on-site time; "Billable Hours" 7.00 6.59 - Productivity Adjustment 1.14 1.21 Hourly Compensation After Adjustment $36.58 $27.48 Annual Compensation After Adjustment $66,572 $47,077
Mileage- Number of Miles 1.50 0.00- Amount per mile $0.445 $0.565
Total Mileage Amount $0.67 $0.00 Hourly Mileage Amount $0.10 $0.00
Rent- Square Footage 250.00 300.00- Cost per Square Foot $15.50 $20.07 - Hours of Allocation per Year 1,820 1,713
Hourly Rent Amount $2.13 $3.51
Capital- Cost of Equipment and Maintenance $2,000.00 $3,000.00 - Year of Amortization 3.00 3.00- Annual Cost $666.67 $1,000.00 - Hours of Allocation per Year 1,820 1,713
Hourly Cost of Capital $0.37 $0.58
Supervision & Services Oversight- Supervisor Wage $36.63 - Supervisor ERE 23.0%- Hourly Services Oversight Cost $45.05 - Hours per Day 1.35
Hourly Cost of Capital $9.23
Program Support Costs- Program Support Percent 4.0%- Non-travel/Total cost $40.80
Hourly Program Support Cost $1.92
Administrative Overhead- Administrative Pct. 10.0% 10.0%- Third Party Liability Pct. 2.0% 1.0%- Non-travel/Total cost $39.07 $40.80
Hourly Administrative Cost $4.69 $5.28
ServiceTherapy Assistant (Physical,
Occupational and Speech)
RebaseBook 2014 109 October 8, 2013

Independent Rate ModelsProfessional Services
Therapy Assistant Services (Physical, Occupational & Speech)
CurrentModel
SFY13ReBase
Unit of Service: 1 hour 1 hourSetting: Clinic Clinic
ServiceTherapy Assistant (Physical,
Occupational and Speech)
SFY 11/12 (7/1/10 - 9/30/11)Benchmark Rate $43.86 Adopted Rate Factor 90.0%Adopted Rate $39.47
SFY 14 (7/1/13 - 6/30/14)Benchmark Rate Inflation Adjustment 0.00%Benchmark Rate $43.86 Adopted Rate Factor 90.5%Adopted Rate $39.69
Tier 1 $43.67 Tier 2 $49.62 Tier 3 $59.54
SFY 15 (7/1/14 - 6/30/15)Benchmark Rate $48.00
Area 1 $52.80 Area 2 $60.00
Adopted Rate FactorAdopted Rate
RebaseBook 2014 110 October 8, 2013

Independent Rate ModelsProfessional Services
Therapy Assistant Services (Physical, Occupational & Speech)
CurrentModel
SFY13ReBase
Unit of Service: 1 hour 1 hourSetting: Natural Natural
Hourly Wage $24.62 $17.41 Annual Wage $51,210 $36,213
ERE as a Pct. of Wages 30.0% 30.0%Hourly Compensation (wages + ERE) $32.01 $22.63Annual Compensation (wages + ERE) $66,572 $47,077
Productivity Assumptions- Total Hours 8.00 8.00 - Travel Time 1.50 1.77 - Recordkeeping & Documentation 0.38 - Consultation with Providers/Family 0.20 - Employer Time 0.30 - Missed Appointments 0.50 0.10 - Training/Continuous Education 0.20 0.21 - Other Non-Billable Activity 0.30 0.00 - Average on-site time; "Billable Hours" 5.50 5.04 - Productivity Adjustment 1.45 1.59 Hourly Compensation After Adjustment $46.55 $35.93 Annual Compensation After Adjustment $66,572 $47,077
Mileage- Number of Miles 60.00 40.00- Amount per mile $0.445 $0.565
Total Mileage Amount $26.70 $22.60 Hourly Mileage Amount $4.85 $4.48
Rent- Square Footage 250.00 100.00- Cost per Square Foot $15.50 $20.07 - Hours of Allocation per Year 1,430 1,310
Hourly Rent Amount $2.71 $1.53
Capital- Cost of Equipment and Maintenance $2,000.00 $2,000.00 - Year of Amortization 3.00 3.00- Annual Cost $666.67 $666.67 - Hours of Allocation per Year 1,430 1,310
Hourly Cost of Capital $0.47 $0.51
Services Oversight- Supervisor Wage $36.63 - Supervisor ERE 23.0%- Hourly Services Oversight Cost $45.05 - Hours per Day 1.35
Hourly Cost of Capital $12.07
Program Support Costs- Program Support Percent 4.0%- Non-travel/Total cost $54.52
Hourly Program Support Cost $2.57
Administrative Overhead- Administrative Pct. 10.0% 10.0%- Third Party Liability Pct. 2.0% 1.0%- Non-travel/Total cost $49.73 $54.52
Hourly Administrative Cost $5.97 $7.06
ServiceTherapy Assistant (Physical,
Occupational and Speech)
RebaseBook 2014 111 October 8, 2013
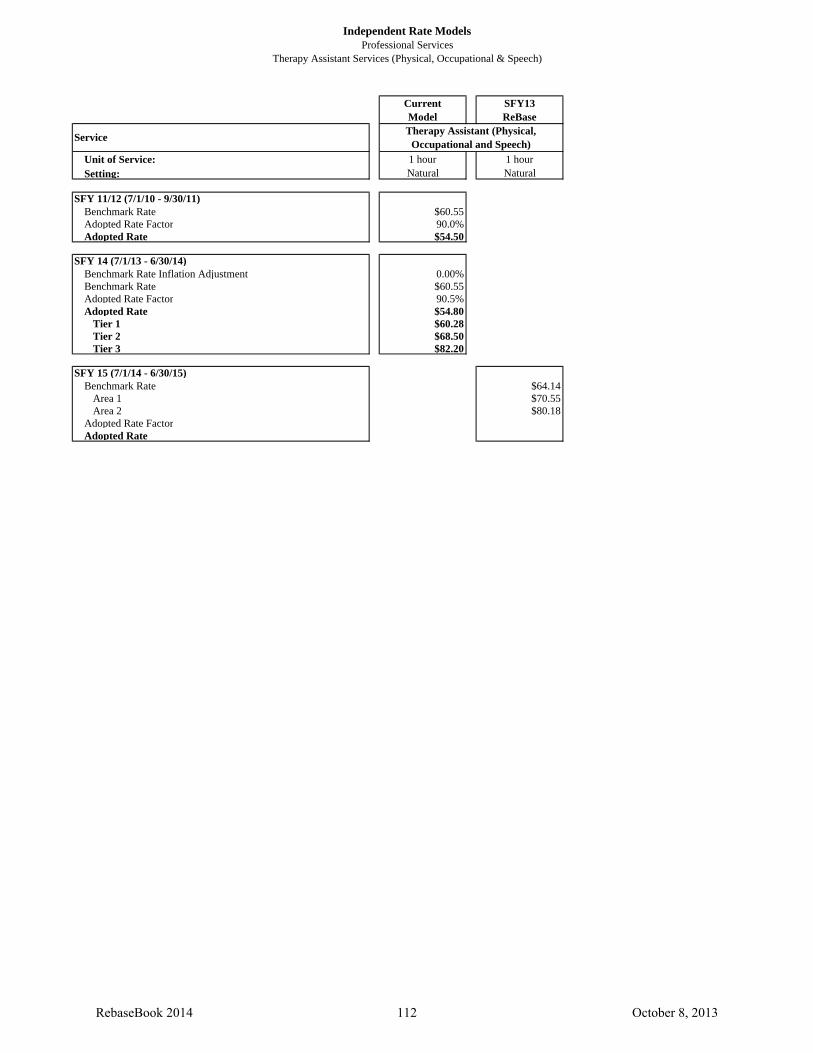
Independent Rate ModelsProfessional Services
Therapy Assistant Services (Physical, Occupational & Speech)
CurrentModel
SFY13ReBase
Unit of Service: 1 hour 1 hourSetting: Natural Natural
ServiceTherapy Assistant (Physical,
Occupational and Speech)
SFY 11/12 (7/1/10 - 9/30/11)Benchmark Rate $60.55 Adopted Rate Factor 90.0%Adopted Rate $54.50
SFY 14 (7/1/13 - 6/30/14)Benchmark Rate Inflation Adjustment 0.00%Benchmark Rate $60.55 Adopted Rate Factor 90.5%Adopted Rate $54.80
Tier 1 $60.28 Tier 2 $68.50 Tier 3 $82.20
SFY 15 (7/1/14 - 6/30/15)Benchmark Rate $64.14
Area 1 $70.55 Area 2 $80.18
Adopted Rate FactorAdopted Rate
RebaseBook 2014 112 October 8, 2013

Independent Rate ModelsProfessional Services
Respiratory Therapy Services
CurrentModel
SFY13ReBase
Unit of Service: 1 hour 1 hourSetting: Clinical Clinical
Hourly Wage $20.41 $24.98 Annual Wage $42,453 $51,958
ERE as a Pct. of Wages 30% 23.0%Hourly Compensation (wages + ERE) $26.53 $30.73 Annual Compensation (wages + ERE) $55,189 $63,909
Productivity Assumptions- Total Hours 8.00 8.00 - Average Travel Time 1.00 0.00 - Recordkeeping & Documentation 1.00 - Consultation with Providers/Family 0.25 - Missed Appointments 0.00 0.05 - Training Time 0.08 0.21 - Employer Time 0.20 - Other Non-Billable Activity 0.25 0.00 - Average on-site time; "Billable Hours" 6.67 6.29 - Productivity Adjustment 1.20 1.27 Hourly Compensation After Adjustment $31.82 $39.08 Annual Compensation After Adjustment $55,189 $63,909
Mileage- Number of Miles 30.0 0.0- Amount per mile $0.445 $0.565
Total Mileage Amount $13.35 $0.00 Hourly Mileage Amount $2.00 $0.00
Program Support Costs- Program Support Percent 4.0%- Non-travel/Total cost $39.08
Hourly Program Support Cost $1.82
Administrative Overhead- Administrative Pct. 10.0% 10.0%- Non-travel cost/Total Cost $31.82 $39.08
Hourly Administrative Cost $3.18 $4.54
SFY 10/11/12 (4/1/10 - 9/30/11)Benchmark Rate $37.01 Adopted Rate Factor 90.00%Adopted Rate $33.31
SFY 14 (7/1/13 - 6/30/14)Benchmark Rate Inflation Adjustment 0.00%Benchmark Rate $37.01 Adopted Rate Factor 90.50%Adopted Rate $33.49
SFY 15 (7/1/14 - 6/30/15)Benchmark Rate $45.44 Adopted Rate FactorAdopted Rate
Service Respiratory Therapy
RebaseBook 2014 113 October 8, 2013

Independent Rate ModelsProfessional Services
Respiratory Therapy Services
CurrentModel
SFY13ReBase
Unit of Service: 1 hour 1 hourSetting: Natural Natural
Hourly Wage $20.41 $24.98 Annual Wage $42,453 $51,958
ERE as a Pct. of Wages 30% 23.0%Hourly Compensation (wages + ERE) $26.53 $30.73 Annual Compensation (wages + ERE) $55,189 $63,909
Productivity Assumptions- Total Hours 8.00 8.00 - Average Travel Time 1.00 1.77 - Recordkeeping & Documentation 0.47 - Consultation with Providers/Family 0.13 - Missed Appointments 0.00 0.05 - Training Time 0.08 0.21 - Employer Time 0.20 - Other Non-Billable Activity 0.25 0.00 - Average on-site time; "Billable Hours" 6.67 5.17 - Productivity Adjustment 1.20 1.55 Hourly Compensation After Adjustment $31.82 $47.54 Annual Compensation After Adjustment $55,189 $63,909
Mileage- Number of Miles 30.0 40.0- Amount per mile $0.445 $0.565
Total Mileage Amount $13.35 $22.60 Hourly Mileage Amount $2.00 $4.37
Program Support Costs- Program Support Percent 4.0%- Non-travel/Total cost $51.92
Hourly Program Support Cost $2.41
Administrative Overhead- Administrative Pct. 10.0% 10.0%- Non-travel cost/Total Cost $31.82 $51.92
Hourly Administrative Cost $3.18 $6.04
SFY 10/11/12 (4/1/10 - 9/30/11)Benchmark Rate $37.01 Adopted Rate Factor 90.00%Adopted Rate $33.31
SFY 14 (7/1/13 - 6/30/14)Benchmark Rate Inflation Adjustment 0.00%Benchmark Rate $37.01 Adopted Rate Factor 90.50%Adopted Rate $33.49
SFY 15 (7/1/14 - 6/30/15)Benchmark Rate $60.37 Adopted Rate FactorAdopted Rate
Service Respiratory Therapy
RebaseBook 2014 114 October 8, 2013

Independent Rate ModelsEmployment Support Services
Center-Based Employment
ServiceStaff-to-Client Ratio 1:6.0 1:6.0 1:3.0 1:3.0Setting High Density Low Density Urban RuralUnit of Service Client Hour Client Hour Client Hour Client Hour
Hourly Wage $11.17 $11.17 $11.71 $11.71Annual Wage $22,340 $22,340 $24,357 $24,357
ERE (as percent of wages) 34% 34% 35% 35%Hourly Compensation (wages + ERE) $14.97 $14.97 $15.81 $15.81Annual Compensation (wages + ERE) $29,936 $29,936 $32,882 $32,882
Productivity Assumptions- Total Hours 8.00 8.00 8.00 8.00- ISP Meetings 0.06 0.06- Recordkeeping & Documentation 0.15 0.15- Employer Time 0.10 0.10- Training 0.20 0.20 0.15 0.15- Job Development 0.25 0.25- Program Prep/Set up/Clean up 0.80 0.80 0.75 0.75- Average on-site time; "Billable Hours" 7.00 7.00 6.54 6.54- Productivity Adjustment 1.14 1.14 1.22 1.22
Hourly Compensation After Adjustment $17.11 $17.11 $19.34 $19.34 Annual Compensation After Adjustment $31,133 $31,133 $32,882 $32,882
Days AdjustmentDays Billable 215 215 200 200 Days Paid 250 250 250 250 Ratio 0.86 0.86 0.80 0.80 Hourly Rate $19.89 $19.89 $24.17 $24.17Annual Compensation $29,936 $29,936 $32,882 $32,882
Staffing- Number of Staff Members 2.29 0.86 4.67 2.33- Number of Individuals Served 16 6 14 7
Ratio of staff to individual 1:6.0 1:6.0 1:3.0 1:3.0Total Staff Compensation $68,652 $25,745 $153,448 $76,724
Total Hourly Compensation After Adjustment $45.62 $17.11 $112.80 $56.40Hourly Compensation per Individual $2.85 $2.85 $8.06 $8.06
In-Program Transportation- Total Number of Client Trips 1.50 1.50 - Number of Miles 6.00 15.00 - Amount per Mile $0.41 $0.41 - Total Transportation Cost $3.69 $9.23 - Transportation Hourly Cost $0.53 $1.32
Hourly Transportation Cost per Individual $0.03 $0.22
SuppliesSupplies per Individual per Day $2.00 $2.00 $2.50 $2.50
Hourly Supply Cost per Individual $0.29 $0.29 $0.38 $0.38
Capital- Square Footage 2,000 1,000 1,750 1,900 - Cost per Square Foot $12.00 $11.50 $20.07 $15.00 - Number of Days in Service 225 225 200 200 - Total Cost per Individual per Day $6.67 $8.52 $12.54 $20.36 - Capital adjustment factor 25% 25%
Hourly Capital Cost per Individual $0.95 $1.22 $0.48 $0.78
Program Compliance- Compliance Percentage 2.0% 2.0%
Hourly Compliance Cost per Individual $0.06 $0.06
Program Support Costs- Program Support Percent 8.0% 8.0%- Total Cost $8.92 $9.22
Hourly Program Support Cost $0.87 $0.90
Current Model SFY 2013 ReBase
Center Based Employment
RebaseBook 2014 115 October 8, 2013

Independent Rate ModelsEmployment Support Services
Center-Based Employment
Service
Current Model SFY 2013 ReBase
Center Based Employment
Administrative Overhead- Administrative Cost Percent 12.0% 12.0% 10.0% 10.0%- Non-travel/Total Cost $8.92 $9.22
Hourly Administrative Cost $0.34 $0.34 $1.09 $1.12
Rate Loaded with Admin Per Individual per Billable Hour $4.52 $4.97
Absence Factor 10.0% 10.0%Absence Factor Adjustment $0.74 $0.81
SFY 06Benchmark Rate $5.26 $5.78 Adopted Rate Factor* 99.0% 99.0%Adopted Rate $5.21 $5.72
SFY 14 (7/1/13 - 6/30/14)Benchmark Rate Inflation Adjustment 0.00% 0.00%Benchmark Rate $5.51 $6.06 Adopted Rate Factor 90.50% 90.50%Adopted Rate $4.99 $5.48
SFY 15 (7/1/14 - 6/30/15)Benchmark Rate $10.88 $11.24 Adopted Rate FactorAdopted Rate
RebaseBook 2014 116 October 8, 2013

Independent Rate ModelsEmployment Support Services
Center-Based Employment
ServiceStaff-to-Client RatioSettingUnit of Service
Hourly WageAnnual Wage
ERE (as percent of wages)Hourly Compensation (wages + ERE)Annual Compensation (wages + ERE)
Productivity Assumptions- Total Hours- ISP Meetings- Recordkeeping & Documentation- Employer Time- Training- Job Development- Program Prep/Set up/Clean up- Average on-site time; "Billable Hours"- Productivity Adjustment
Hourly Compensation After AdjustmentAnnual Compensation After Adjustment
Days AdjustmentDays BillableDays PaidRatioHourly RateAnnual Compensation
Staffing- Number of Staff Members- Number of Individuals Served
Ratio of staff to individualTotal Staff Compensation
Total Hourly Compensation After AdjustmentHourly Compensation per Individual
In-Program Transportation- Total Number of Client Trips- Number of Miles- Amount per Mile- Total Transportation Cost- Transportation Hourly Cost
Hourly Transportation Cost per Individual
SuppliesSupplies per Individual per Day
Hourly Supply Cost per Individual
Capital- Square Footage- Cost per Square Foot- Number of Days in Service- Total Cost per Individual per Day- Capital adjustment factor
Hourly Capital Cost per Individual
Program Compliance- Compliance Percentage
Hourly Compliance Cost per Individual
Program Support Costs- Program Support Percent- Total Cost
Hourly Program Support Cost
1:6.0 1:6.0 1:9.0 1:9.0Urban Rural Urban Rural
Client Hour Client Hour Client Hour Client Hour
$11.71 $11.71 $11.71 $11.71$24,357 $24,357 $24,357 $24,357
35% 35% 35% 35%$15.81 $15.81 $15.81 $15.81
$32,882 $32,882 $32,882 $32,882
8.00 8.00 8.00 8.000.12 0.12 0.18 0.180.30 0.30 0.45 0.450.10 0.10 0.10 0.100.15 0.15 0.15 0.150.25 0.25 0.25 0.250.75 0.75 0.75 0.756.33 6.33 6.12 6.121.26 1.26 1.31 1.31
$19.98 $19.98 $20.66 $20.66 $32,882 $32,882 $32,882 $32,882
200 200 200 200 250 250 250 250 0.80 0.80 0.80 0.80
$24.97 $24.97 $25.83 $25.83$32,882 $32,882 $32,882 $32,882
2.33 1.17 1.56 0.7814 7 14 7
1:6.0 1:6.0 1:9.0 1:9.0$76,724 $38,362 $51,149 $25,575
$58.27 $29.14 $40.18 $20.09$4.16 $4.16 $2.87 $2.87
$2.50 $2.50 $2.50 $2.50 $0.39 $0.39 $0.41 $0.41
1,750 1,900 1,750 1,900 $20.07 $15.00 $20.07 $15.00
200 200 200 200 $12.54 $20.36 $12.54 $20.36
25% 25% 25% 25%$0.50 $0.80 $0.51 $0.83
8.0% 8.0% 8.0% 8.0%$5.05 $5.36 $3.79 $4.11 $0.49 $0.52 $0.37 $0.40
Center Based Employment
SFY 2013 ReBase
RebaseBook 2014 117 October 8, 2013

Independent Rate ModelsEmployment Support Services
Center-Based Employment
Service
Administrative Overhead- Administrative Cost Percent- Non-travel/Total Cost
Hourly Administrative Cost
Rate Loaded with Admin Per Individual per Billable Hour
Absence Factor Absence Factor Adjustment
SFY 06Benchmark RateAdopted Rate Factor*Adopted Rate
SFY 14 (7/1/13 - 6/30/14)Benchmark Rate Inflation AdjustmentBenchmark RateAdopted Rate FactorAdopted Rate
SFY 15 (7/1/14 - 6/30/15)Benchmark RateAdopted Rate FactorAdopted Rate
Center Based Employment
SFY 2013 ReBase
10.0% 10.0% 10.0% 10.0%$5.05 $5.36 $3.79 $4.11 $0.62 $0.65 $0.46 $0.50
$6.16 $6.54 $4.62 $5.01
RebaseBook 2014 118 October 8, 2013

Independent Rate ModelsEmployment Support ServicesGroup Supported Employment
ServiceStaff-to-Client Ratio 1:5.0 1:5.0 1:2.5 1:2.5Setting High Density Low Density High Density Low Density Unit of Service Client Hour Client Hour Client Hour Client Hour
Hourly Wage $12.53 $12.53 $12.53 $12.53Annual Wage $25,060 $25,060 $25,060 $25,060
ERE (as percent of wages) 34% 34% 34% 34%Hourly Compensation (wages + ERE) $16.79 $16.79 $16.79 $16.79Annual Compensation (wages + ERE) $33,580 $33,580 $33,580 $33,580
Productivity Assumptions- Total Hours 8.00 8.00 8.00 8.00 - Job Development Time, Employer Contact Time 0.25 0.25 0.25 0.25 - Travel Time Between Employer Sites 0.75 1.25 0.75 1.25 - Training 0.25 0.25 0.25 0.25 - ISP Meetings- Employer Time- Recordkeeping 0.75 0.75 0.75 0.75 - Average on-site time; "Billable Hours" 6.00 5.50 6.00 5.50 - Productivity Adjustment 1.33 1.45 1.33 1.45 Hourly Compensation After Adjustment $22.39 $24.42 $23.99 $26.18 Annual Compensation After Adjustment $33,580 $33,580 $35,992 $35,992
Days - Total Client Work Days- Days Agency Open- Ratio- Hourly Rate- Annual Compensation
Staffing- Actual Number of Individuals Served- Number of Staff Members Required
Ratio of Staff to IndividualsTotal Staff Compensation
Total Hourly Compensation After AdjustmentHourly Compensation per Individual
In-Program Transportation- Total Number of Client Trips 2.00 2.00 2.00 2.00 - Number of Miles per Individual 17.50 25.00 11.00 18.00 - Amount per Mile $0.41 $0.41 $0.41 $0.41 - Total Transportation Cost $14.35 $20.50 $9.02 $14.76 Hourly Transportation Cost per Individual $2.39 $3.73 $1.50 $2.68
Supplies- Supplies per Individual per Day $1.50 $1.50 $1.00 $1.00 Hourly Supply Cost per Individual $0.25 $0.27 $0.17 $0.18
Capital- Square Footage (Storage) 600 700 600 700 - Cost per Square Foot $12.00 $12.00 $12.00 $12.00 - Number of Days in Service 250 250 250 250 Capital Cost per Billable Hour $4.80 $6.11 $4.80 $6.11
Program Compliance- Compliance Percentage 2.0% 2.0% 2.0% 2.0%Hourly Compliance Cost $0.45 $0.49 $0.48 $0.52
Program Support Costs- Program Support Percent- Non-travel/Total costHourly Program Support Cost
Current Model
Group Supported Employment
RebaseBook 2014 119 October 8, 2013

Independent Rate ModelsEmployment Support ServicesGroup Supported Employment
Service
Current Model
Group Supported Employment
Administrative Overhead- Administrative Percent 12.0% 12.0% 12.0% 12.0%- Total CostHourly Administrative Cost $2.69 $13.53 $9.83 $12.64
Rate Loaded with AdminPer Staff Hour $32.97 $37.95 $33.82 $38.82
Client Absence Rate 10.0% 10.0% 10.0% 10.0%Absence Billable Recovery Rate 75.0% 75.0% 70.0% 70.0%Effective Client Absence Rate 2.5% 2.5% 3.0% 3.0%Absence Factor Adjustment $0.85 $0.97 $1.05 $1.20
SFY 06Benchmark Rate $33.82 $38.92 $34.87 $40.02 Adopted Rate Factor* 99.0% 99.0% 99.0% 99.0%Adopted Rate $33.48 $38.53 $34.52 $39.62
SFY 14 (7/1/13 - 6/30/14)Benchmark Rate Inflation Adjustment 0.00% 0.00% 0.00% 0.00%Benchmark Rate $35.46 $40.81 $36.56 $41.96 Adopted Rate Factor 90.50% 90.50% 90.50% 90.50%Adopted Rate $32.09 $36.93 $33.09 $37.97
SFY 15 (7/1/14 - 6/30/15)Benchmark RateAdopted Rate FactorAdopted Rate
RebaseBook 2014 120 October 8, 2013

Independent Rate ModelsEmployment Support ServicesGroup Supported Employment
ServiceStaff-to-Client RatioSettingUnit of Service
Hourly WageAnnual Wage
ERE (as percent of wages)Hourly Compensation (wages + ERE)Annual Compensation (wages + ERE)
Productivity Assumptions- Total Hours- Job Development Time, Employer Contact Time- Travel Time Between Employer Sites - Training- ISP Meetings- Employer Time- Recordkeeping- Average on-site time; "Billable Hours"- Productivity AdjustmentHourly Compensation After AdjustmentAnnual Compensation After Adjustment
Days - Total Client Work Days- Days Agency Open- Ratio- Hourly Rate- Annual Compensation
Staffing- Actual Number of Individuals Served- Number of Staff Members Required
Ratio of Staff to IndividualsTotal Staff Compensation
Total Hourly Compensation After AdjustmentHourly Compensation per Individual
In-Program Transportation- Total Number of Client Trips- Number of Miles per Individual- Amount per Mile- Total Transportation CostHourly Transportation Cost per Individual
Supplies- Supplies per Individual per DayHourly Supply Cost per Individual
Capital- Square Footage (Storage)- Cost per Square Foot- Number of Days in ServiceCapital Cost per Billable Hour
Program Compliance- Compliance PercentageHourly Compliance Cost
Program Support Costs- Program Support Percent- Non-travel/Total costHourly Program Support Cost
1:2.0 1:2.0 1:3.0 1:3.0Urban Rural Urban Rural
Client Hour Client Hour Client Hour Client Hour
$12.54 $12.54 $12.54 $12.54$26,083 $26,083 $26,083 $26,083
35% 35% 35% 35%$16.93 $16.93 $16.93 $16.93
$35,212 $35,212 $35,212 $35,212
8.00 8.00 8.00 8.00 0.25 0.25 0.25 0.25 0.00 0.00 0.00 0.00 0.15 0.15 0.15 0.15 0.04 0.04 0.06 0.06 0.10 0.10 0.10 0.10 0.10 0.10 0.15 0.15 7.36 7.36 7.29 7.29 1.09 1.09 1.10 1.10
$18.40 $18.40 $18.58 $18.58 $35,212 $35,212 $35,212 $35,212
200 200 200 200 250 250 250 250 0.80 0.80 0.80 0.80
$23.00 $23.00 $23.22 $23.22 $35,212 $35,212 $35,212 $35,212
14.00 5.00 14.00 5.00 7.00 2.50 4.67 1.67
1:2 1:2 1:3 1:3$246,486 $88,031 $164,324 $58,687
$161.01 $57.50 $108.37 $38.70 $11.50 $11.50 $7.74 $7.74
15.00 20.00 15.00 20.00 $0.82 $0.82 $0.82 $0.82
$12.30 $16.40 $12.30 $16.40 $1.67 $2.23 $1.69 $2.25
$1.75 $1.75 $1.75 $1.75 $0.24 $0.24 $0.24 $0.24
8.0% 8.0% 8.0% 8.0%$13.41 $13.97 $9.67 $10.23
$1.31 $1.36 $0.94 $1.00
Group Supported Employment
SFY 2013 ReBase
RebaseBook 2014 121 October 8, 2013

Independent Rate ModelsEmployment Support ServicesGroup Supported Employment
Service
Administrative Overhead- Administrative Percent- Total CostHourly Administrative Cost
Rate Loaded with AdminPer Staff Hour
Client Absence RateAbsence Billable Recovery RateEffective Client Absence RateAbsence Factor Adjustment
SFY 06Benchmark RateAdopted Rate Factor*Adopted Rate
SFY 14 (7/1/13 - 6/30/14)Benchmark Rate Inflation AdjustmentBenchmark RateAdopted Rate FactorAdopted Rate
SFY 15 (7/1/14 - 6/30/15)Benchmark RateAdopted Rate FactorAdopted Rate
Group Supported Employment
SFY 2013 ReBase
10% 10% 10% 10%$13.41 $13.97 $9.67 $10.23
$1.64 $1.70 $1.18 $1.25
$16.35 $17.03 $11.79 $12.48
RebaseBook 2014 122 October 8, 2013

Independent Rate ModelsEmployment Support ServicesGroup Supported Employment
ServiceStaff-to-Client RatioSettingUnit of Service
Hourly WageAnnual Wage
ERE (as percent of wages)Hourly Compensation (wages + ERE)Annual Compensation (wages + ERE)
Productivity Assumptions- Total Hours- Job Development Time, Employer Contact Time- Travel Time Between Employer Sites - Training- ISP Meetings- Employer Time- Recordkeeping- Average on-site time; "Billable Hours"- Productivity AdjustmentHourly Compensation After AdjustmentAnnual Compensation After Adjustment
Days - Total Client Work Days- Days Agency Open- Ratio- Hourly Rate- Annual Compensation
Staffing- Actual Number of Individuals Served- Number of Staff Members Required
Ratio of Staff to IndividualsTotal Staff Compensation
Total Hourly Compensation After AdjustmentHourly Compensation per Individual
In-Program Transportation- Total Number of Client Trips- Number of Miles per Individual- Amount per Mile- Total Transportation CostHourly Transportation Cost per Individual
Supplies- Supplies per Individual per DayHourly Supply Cost per Individual
Capital- Square Footage (Storage)- Cost per Square Foot- Number of Days in ServiceCapital Cost per Billable Hour
Program Compliance- Compliance PercentageHourly Compliance Cost
Program Support Costs- Program Support Percent- Non-travel/Total costHourly Program Support Cost
1:4.0 1:4.0 1:5.0 1:5.0Urban Rural Urban Rural
Client Hour Client Hour Client Hour Client Hour
$12.54 $12.54 $12.54 $12.54$26,083 $26,083 $26,083 $26,083
35% 35% 35% 35%$16.93 $16.93 $16.93 $16.93
$35,212 $35,212 $35,212 $35,212
8.00 8.00 8.00 8.00 0.25 0.25 0.25 0.25 0.00 0.00 0.00 0.00 0.15 0.15 0.15 0.15 0.08 0.08 0.10 0.10 0.10 0.10 0.10 0.10 0.20 0.20 0.25 0.25 7.22 7.22 7.15 7.15 1.11 1.11 1.12 1.12
$18.76 $18.76 $18.94 $18.94 $35,212 $35,212 $35,212 $35,212
200 200 200 200 250 250 250 250 0.80 0.80 0.80 0.80
$23.45 $23.45 $23.68 $23.68 $35,212 $35,212 $35,212 $35,212
14.00 5.00 14.00 5.00 3.50 1.25 2.80 1.00
1:4 1:4 1:5 1:5$123,243 $44,015 $98,594 $35,212
$82.07 $29.31 $66.30 $23.68 $5.86 $5.86 $4.74 $4.74
15.00 20.00 15.00 20.00 $0.82 $0.82 $0.82 $0.82
$12.30 $16.40 $12.30 $16.40 $1.70 $2.27 $1.72 $2.29
$1.75 $1.75 $1.75 $1.75 $0.24 $0.24 $0.24 $0.24
8.0% 8.0% 8.0% 8.0%$7.81 $8.38 $6.70 $7.27 $0.76 $0.82 $0.65 $0.71
Group Supported Employment
SFY 2013 ReBase
RebaseBook 2014 123 October 8, 2013
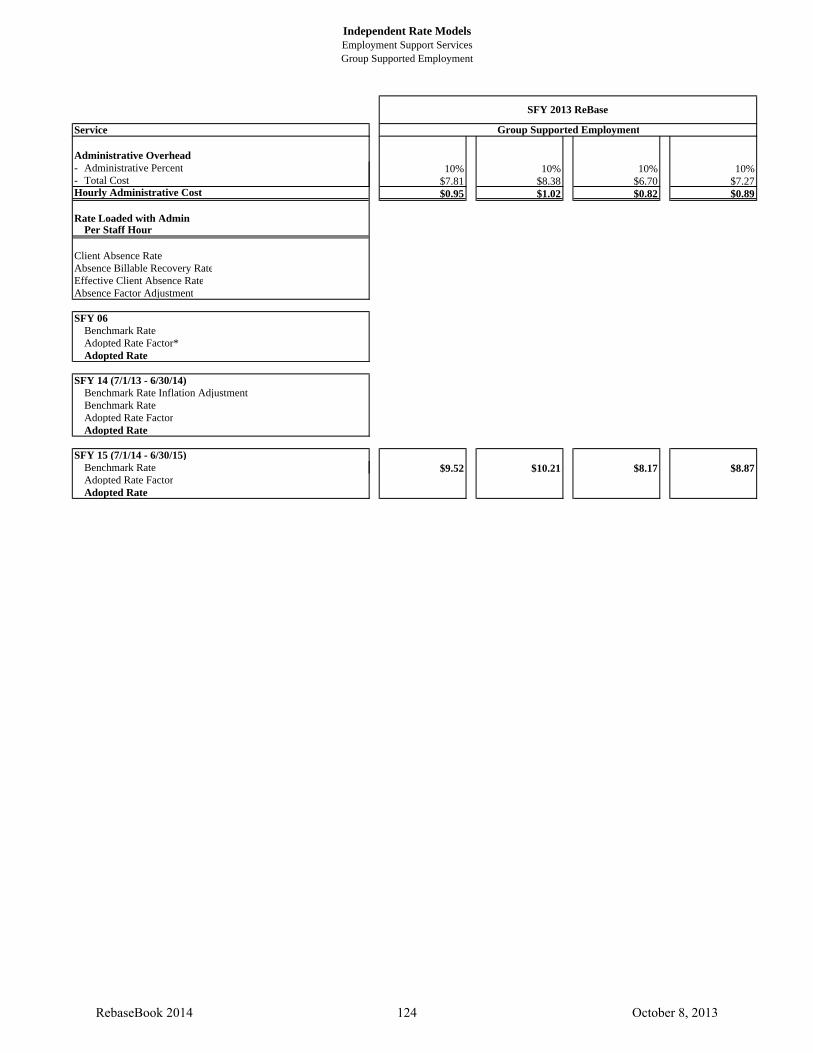
Independent Rate ModelsEmployment Support ServicesGroup Supported Employment
Service
Administrative Overhead- Administrative Percent- Total CostHourly Administrative Cost
Rate Loaded with AdminPer Staff Hour
Client Absence RateAbsence Billable Recovery RateEffective Client Absence RateAbsence Factor Adjustment
SFY 06Benchmark RateAdopted Rate Factor*Adopted Rate
SFY 14 (7/1/13 - 6/30/14)Benchmark Rate Inflation AdjustmentBenchmark RateAdopted Rate FactorAdopted Rate
SFY 15 (7/1/14 - 6/30/15)Benchmark RateAdopted Rate FactorAdopted Rate
Group Supported Employment
SFY 2013 ReBase
10% 10% 10% 10%$7.81 $8.38 $6.70 $7.27 $0.95 $1.02 $0.82 $0.89
$9.52 $10.21 $8.17 $8.87
RebaseBook 2014 124 October 8, 2013

Independent Rate ModelsEmployment Support ServicesGroup Supported Employment
ServiceStaff-to-Client RatioSettingUnit of Service
Hourly WageAnnual Wage
ERE (as percent of wages)Hourly Compensation (wages + ERE)Annual Compensation (wages + ERE)
Productivity Assumptions- Total Hours- Job Development Time, Employer Contact Time- Travel Time Between Employer Sites - Training- ISP Meetings- Employer Time- Recordkeeping- Average on-site time; "Billable Hours"- Productivity AdjustmentHourly Compensation After AdjustmentAnnual Compensation After Adjustment
Days - Total Client Work Days- Days Agency Open- Ratio- Hourly Rate- Annual Compensation
Staffing- Actual Number of Individuals Served- Number of Staff Members Required
Ratio of Staff to IndividualsTotal Staff Compensation
Total Hourly Compensation After AdjustmentHourly Compensation per Individual
In-Program Transportation- Total Number of Client Trips- Number of Miles per Individual- Amount per Mile- Total Transportation CostHourly Transportation Cost per Individual
Supplies- Supplies per Individual per DayHourly Supply Cost per Individual
Capital- Square Footage (Storage)- Cost per Square Foot- Number of Days in ServiceCapital Cost per Billable Hour
Program Compliance- Compliance PercentageHourly Compliance Cost
Program Support Costs- Program Support Percent- Non-travel/Total costHourly Program Support Cost
1:6.0 1:6.0Urban Rural
Client Hour Client Hour
$12.54 $12.54$26,083 $26,083
35% 35%$16.93 $16.93
$35,212 $35,212
8.00 8.00 0.25 0.25 0.00 0.00 0.15 0.15 0.12 0.12 0.10 0.10 0.30 0.30 7.08 7.08 1.13 1.13
$19.13 $19.13 $35,212 $35,212
200 200 250 250 0.80 0.80
$23.91 $23.91 $35,212 $35,212
14.00 5.00 2.33 0.83
1:6 1:6$82,162 $29,344
$55.79 $19.93 $3.99 $3.99
15.00 20.00 $0.82 $0.82
$12.30 $16.40 $1.74 $2.32
$1.75 $1.75 $0.25 $0.25
8.0% 8.0%$5.97 $6.55 $0.58 $0.64
SFY 2013 ReBase
Group Supported Employment
RebaseBook 2014 125 October 8, 2013

Independent Rate ModelsEmployment Support ServicesGroup Supported Employment
Service
Administrative Overhead- Administrative Percent- Total CostHourly Administrative Cost
Rate Loaded with AdminPer Staff Hour
Client Absence RateAbsence Billable Recovery RateEffective Client Absence RateAbsence Factor Adjustment
SFY 06Benchmark RateAdopted Rate Factor*Adopted Rate
SFY 14 (7/1/13 - 6/30/14)Benchmark Rate Inflation AdjustmentBenchmark RateAdopted Rate FactorAdopted Rate
SFY 15 (7/1/14 - 6/30/15)Benchmark RateAdopted Rate FactorAdopted Rate
SFY 2013 ReBase
Group Supported Employment
10% 10%$5.97 $6.55 $0.73 $0.80
$7.28 $7.99
RebaseBook 2014 126 October 8, 2013

Independent Rate ModelsEmployment Support Services
Individual Supported Employment
Service
Staff-to-Client Ratio 1:1.0 1:1.0 1:1.0 1:1.0Setting High Density Low Density Urban RuralUnit of Service Staff Hour Staff Hour Staff Hour Staff Hour
Hourly Wage $14.34 $14.34 $14.56 $14.56Annual Wage $28,680 $28,680 $30,285 $30,285
ERE (as percent of wages) 34% 34% 30% 30%Hourly Compensation (wages + ERE) $19.22 $19.22 $18.93 $18.93Annual Compensation (wages + ERE) $38,431 $38,431 $39,370 $39,370
Productivity AssumptionsTotal Hours 8.00 8.00 8.00 8.00
- Job Development 0.50 0.50 0.50 0.50 - Travel Time Between Employer Sites 1.00 1.50 1.52 2.57 - Recordkeeping 0.50 0.50 0.50 0.50 - ISP Meetings 0.15 0.15 - Participating in Assessments 0.10 0.10 - Employer Time 0.10 0.10 - Training 0.15 0.15 - Non client Time 0.25 0.25- Average on-site time; "Billable Hours" 5.75 5.25 4.98 3.93 - Productivity Adjustment 1.03 1.03 1.61 2.04 Hourly Compensation After Adjustment $19.84 $19.84 $30.41 $38.53 Annual Compensation After Adjustment $38,431 $38,431 $39,370 $39,370
In-Program Transportation- Total Number of Client Trips 4.00 4.00 - Number of Miles 7.50 15.00 33.80 60.00 - Amount per Mile $0.41 $0.41 $0.565 $0.565 - Total Transportation Cost $12.30 $24.60 $19.10 $33.90 Transportation Cost per Billable Hour $1.59 $3.17 $3.83 $8.63
Supplies- Supplies per Individual per Day $1.50 $1.50 Supply Cost per Billable Hour $0.19 $0.19
Capital- Square Footage (office space) 400 575 - Cost per Square Foot $12.00 $12.00 - Number of Days in Service 250 250 Capital Cost per Billable Hour $2.48 $3.56
Program Compliance- Compliance Percentage 2.0% 2.0%Hourly Compliance Cost $0.40 $0.40
Program Support Costs- Program Support Percent 8.0% 8.0%- Total cost $34.24 $47.16 Hourly Program Support Cost $3.34 $4.60
Administrative Overhead- Administrative Percentage 11.0% 11.0% 10.0% 10.0%- Total Cost $34.24 $47.16 Hourly Administrative Cost $2.18 $2.18 $4.18 $5.75
Rate Loaded with AdminPer Staff Hour $26.67 $29.35
Client Absence Rate 1.0% 1.0%Absence Billable Recovery Rate 75.0% 75.0%Effective Client Absence Rate 0.25% 0.25%Absence Factor Adjustment $0.07 $0.07
Individual Supported Employment
Current Model SFY 2013 ReBase
Individual Supported Employment, Job Coaching
RebaseBook 2014 127 October 8, 2013

Independent Rate ModelsEmployment Support Services
Individual Supported Employment
Service Individual Supported Employment
Current Model SFY 2013 ReBase
Individual Supported Employment, Job Coaching
SFY 06Benchmark Rate $26.74 $29.42 Adopted Rate Factor* 99.0% 99.0%Adopted Rate $26.47 $29.13
SFY 14 (7/1/13 - 6/30/14)Benchmark Rate Inflation Adjustment 0.00% 0.00%Benchmark Rate $28.04 $30.85 Adopted Rate Factor 90.50% 90.50%Adopted Rate $25.38 $27.92
SFY 15 (7/1/14 - 6/30/15)Benchmark Rate $41.76 $57.51 Adopted Rate FactorAdopted Rate
RebaseBook 2014 128 October 8, 2013

Independent Rate ModelsEmployment Support Services
Individual Supported Employment
Service
Staff-to-Client RatioSettingUnit of Service
Hourly WageAnnual Wage
ERE (as percent of wages)Hourly Compensation (wages + ERE)Annual Compensation (wages + ERE)
Productivity AssumptionsTotal Hours
- Job Development- Travel Time Between Employer Sites - Recordkeeping- ISP Meetings- Participating in Assessments- Employer Time- Training- Non client Time- Average on-site time; "Billable Hours"- Productivity AdjustmentHourly Compensation After AdjustmentAnnual Compensation After Adjustment
In-Program Transportation- Total Number of Client Trips- Number of Miles- Amount per Mile- Total Transportation CostTransportation Cost per Billable Hour
Supplies- Supplies per Individual per DaySupply Cost per Billable Hour
Capital- Square Footage (office space)- Cost per Square Foot- Number of Days in ServiceCapital Cost per Billable Hour
Program Compliance- Compliance PercentageHourly Compliance Cost
Program Support Costs- Program Support Percent- Total costHourly Program Support Cost
Administrative Overhead- Administrative Percentage- Total CostHourly Administrative Cost
Rate Loaded with AdminPer Staff Hour
Client Absence RateAbsence Billable Recovery RateEffective Client Absence RateAbsence Factor Adjustment
1:1.0 1:1.0Urban Rural
Staff Hour Staff Hour
$14.56 $14.56$30,285 $30,285
30% 30%$18.93 $18.93
$39,370 $39,370
8.00 8.00 2.00 2.00 0.37 0.57 0.50 0.50 0.15 0.15 0.10 0.10 0.10 0.10 0.15 0.15
4.63 4.43 1.73 1.81
$32.70 $34.18 $39,370 $39,370
5.00 10.00 $0.565 $0.565
$2.83 $5.65 $0.61 $1.28
8.0% 8.0%$33.32 $35.46
$3.25 $3.46
10.0% 10.0%$33.32 $35.46
$4.06 $4.32
Individual Supported Employment, Job Development
SFY 2013 ReBase
RebaseBook 2014 129 October 8, 2013

Independent Rate ModelsEmployment Support Services
Individual Supported Employment
Service
SFY 06Benchmark RateAdopted Rate Factor*Adopted Rate
SFY 14 (7/1/13 - 6/30/14)Benchmark Rate Inflation AdjustmentBenchmark RateAdopted Rate FactorAdopted Rate
SFY 15 (7/1/14 - 6/30/15)Benchmark RateAdopted Rate FactorAdopted Rate
Individual Supported Employment, Job Development
SFY 2013 ReBase
$40.63 $43.24
RebaseBook 2014 130 October 8, 2013

Independent Rate ModelsEmployment Support Services
Transition to Employment
Current ModelSFY 2013 ReBase
Current ModelSFY 2013 ReBase
ServiceStaff-to-Client Ratio 1:4.0 1:4.0Setting High Density Urban Low Density RuralUnit of Service Client Hour Client Hour Client Hour Client Hour
Hourly Wage $16.70 $16.70Annual Wage $34,736 $34,736
ERE (as percent of wages) 30% 30%Hourly Compensation (wages + ERE) $21.71 $21.71Annual Compensation (wages + ERE) $45,157 $45,157
Productivity AssumptionsTotal Hours 8.00 8.00
- ISP Meetings 0.08 0.08 - Recordkeeping & Documentation 0.50 0.50 - Employer Time 0.10 0.10 - Training 0.15 0.15 - Program Prep/Set up/Clean up 0.25 0.25 - Average on-site time; "Billable Hours" 6.92 6.92 - Productivity Adjustment 1.16 1.16
Hourly Compensation After Adjustment $25.10 $25.10 Annual Compensation After Adjustment $45,157 $45,157
Days - Total Client Work Days 200 200 - Days Agency Open 250 250 - Ratio 0.80 0.80 - Hourly Rate $31.37 $31.37 - Annual Compensation $45,157 $45,157
Staffing- Number of Individuals Served 13.00 6.00 - Number of Staff Members Required 3.25 1.50
Ratio of Staff to Individuals 1:4 1:4Total Staff Compensation $146,760 $67,735
Total Hourly Compensation After Adjustment $101.96 $47.06 Hourly Compensation per Individual $7.84 $7.84
In-Program Transportation- Number of Miles per Individual 2.0 4.0 - Amount per Mile $0.82 $0.82 - Total Transportation Cost $1.64 $3.28
Hourly Transportation Cost per Individual $0.24 $0.47
Capital- Square Footage 325 450 - Cost per Square Foot $20.07 $15.00 - Number of Days in Service 200 200 - Total Cost per Individual per Day $2.51 $5.63
Hourly Capital Cost per Individual $0.36 $0.81
Program Support Costs- Program Support Percent 8.0% 8.0%- Non-travel/Total Cost $8.44 $9.13
Hourly Program Support Cost $0.82 $0.89
Administrative Overhead- Administrative Cost Percent 10.0% 10.0%- Non-travel/Total Cost $8.44 $9.13
Hourly Administrative Cost $1.03 $1.11
SFY 14 (7/1/13 - 6/30/14)Benchmark Rate $12.19 $13.99 Adopted Rate Factor 90.5% 90.5%Adopted Rate $11.03 $12.66
Transition to Employment
RebaseBook 2014 131 October 8, 2013

Independent Rate ModelsEmployment Support Services
Transition to Employment
Current ModelSFY 2013 ReBase
Current ModelSFY 2013 ReBase
Service Transition to EmploymentSFY 15 (7/1/14 - 6/30/15)
Benchmark Rate $10.30 $11.13 Adopted Rate FactorAdopted Rate
RebaseBook 2014 132 October 8, 2013

Independent Rate ModelsSpecialized Habilitation ServicesHabilitation with Music Therapy
CurrentModel
SFY13ReBase
ServiceUnit of Service 1 hour 1 hour
Hourly Wage $20.53 $19.72Annual Wage $42,711 $41,018
ERE (as percent of wages) 30.0% 30.0%Hourly Compensation (wages + ERE) $26.69 $25.64Annual Compensation (wages + ERE) $55,524 $53,323
Factors Offsetting Direct Care Service Hours- Total Hours 8.00 8.00- Travel Time 0.75 0.89- Recordkeeping & Documentation 0.25 0.20
- Training Time 0.00 0.21
- Employer Time 0.10
- Missed Appointments 0.00 0.05
- ISP Meetings 0.06
- Participating in Assessments 0.10
- Average on-site time; "Billable Hours" 7.00 6.39
- Productivity Adjustment 1.14 1.25Hourly Compensation After Adjustment $30.51 $32.10Annual Compensation After Adjustment $63,456 $66,758
Mileage- Number of Miles 35 18- Amount per mile $0.345 $0.565
Total Mileage Amount $12.08 $13.35Hourly mileage cost $1.73 $2.01
Program Support Costs- Program Support Percent 4.0%- Non-travel/Total cost $34.11
Hourly Program Support Cost $1.59
Administrative Overhead- Administrative Percent 10.0% 10.0%- Non-travel/Total cost $30.51 $34.11
Hourly administrative cost $3.05 $3.97
SFY 04Benchmark Rate $35.28 Adopted Rate Factor 100.0%Adopted Rate $35.28
SFY 14 (7/1/13 - 6/30/14)Benchmark Rate Inflation Adjustment 0.00%Benchmark Rate $40.10 Adopted Rate Factor 46.33%Adopted Rate $18.58
SFY 15 (7/1/14 - 6/30/15)Benchmark Rate $39.66 Adopted Rate FactorAdopted Rate
Habilitation with Music Therapy
RebaseBook 2014 133 October 8, 2013

Independent Rate ModelsSpecialized Habilitation Services
Habilitation, Consultation
CurrentModel
SFY13ReBase
CurrentModel
SFY13ReBase
ServiceUnit of Service 1 hour 1 hourSetting Urban Rural
Hourly Wage $60.97 $60.97Annual Wage $126,818 $126,818
ERE (as percent of wages) 23.0% 23.0%Hourly Compensation (wages + ERE) $74.99 $74.99Annual Compensation (wages + ERE) $155,986 $155,986
Productivity Assumptions- Total Hours 8.00 8.00- Travel Time 0.77 1.57- Recordkeeping & Documentation 1.00 1.00
- Training Time 0.21 0.21
- Employer Time 0.30 0.30
- Missed Appointments 0.05 0.05
- Average on-site time; "Billable Hours" 5.67 4.87
- Productivity Adjustment 1.41 1.64Hourly Compensation After Adjustment $105.81 $123.19Annual Compensation After Adjustment $155,986 $155,986
Mileage- Number of Miles 15 35- Amount per mile $0.565 $0.565
Total Mileage Amount $8.48 $19.78Hourly mileage cost $1.49 $4.06
Program Support Costs- Program Support Percent 4.0% 4.0%- Non-travel/Total cost $107.31 $127.25
Hourly Program Support Cost $4.99 $5.92
Administrative Overhead- Administrative Percent 10.0% 10.0%- Non-travel cost $107.31 $127.25
Hourly administrative cost $12.48 $14.80
SFY 14 (7/1/13 - 6/30/14)Benchmark Rate $125.00 $140.00Adopted Rate Factor 100.0% 100.0%Calculated Adopted Rate $125.00 $140.00Adopted Rate
SFY 15 (7/1/14 - 6/30/15)Benchmark Rate $124.77 $147.97 Adopted Rate FactorAdopted Rate
Habilitation, Consultation, Licensed Psychologist
RebaseBook 2014 134 October 8, 2013

Independent Rate ModelsSpecialized Habilitation Services
Habilitation, Consultation
CurrentModel
SFY13ReBase
Service
Unit of Service 1 hour 1 hour
Hourly Wage $26.61Annual Wage $55,349
ERE (as percent of wages) 23.0%Hourly Compensation (wages + ERE) $32.73Annual Compensation (wages + ERE) $68,079
Productivity Assumptions- Total Hours 8.00- Travel Time 1.07- Recordkeeping & Documentation 1.00
- Training Time 0.21
- Employer Time 0.30
- Missed Appointments 0.05- Down Time 0.00- Average on-site time; "Billable Hours" 5.37- Productivity Adjustment 1.49
Hourly Compensation After Adjustment $48.76Annual Compensation After Adjustment $68,079
Mileage- Number of Miles 22.5- Amount per mile $0.565
Total Mileage Amount $12.71Hourly mileage cost $2.37
Program Support Costs- Program Support Percent 4.0%- Non-travel/Total cost $51.13
Hourly Program Support Cost $2.38
Administrative Overhead- Administrative Percent 10.0%- Non-travel cost $51.13
Hourly administrative cost $5.95
SFY 14 (7/1/13 - 6/30/14)Benchmark Rate $60.00 Adopted Rate Factor 100.00%Adopted Rate $60.00
Assessment $300.00
SFY 15 (7/1/14 - 6/30/15)Benchmark Rate $59.45
Assessment $297.25 Adopted Rate FactorAdopted Rate
Habilitation, Consultation, Licensed Behavior Analyst
RebaseBook 2014 135 October 8, 2013

Independent Rate ModelsSpecialized Habilitation Services
Habilitation, Consultation
CurrentModel
SFY13ReBase
Service
Unit of Service 1 hour 1 hour
Hourly Wage $26.61Annual Wage $55,349
ERE (as percent of wages) 23.0%Hourly Compensation (wages + ERE) $32.73Annual Compensation (wages + ERE) $68,079
Productivity Assumptions- Total Hours 8.00- Travel Time 1.07- Recordkeeping & Documentation 0.75
- Training Time 0.21
- Employer Time 0.10
- Missed Appointments 0.05- Down Time 0.00- Average on-site time; "Billable Hours" 5.82
- Productivity Adjustment 1.37Hourly Compensation After Adjustment $44.99Annual Compensation After Adjustment $68,079
Mileage- Number of Miles 22.5- Amount per mile $0.565
Total Mileage Amount $12.71Hourly mileage cost $2.18
Program Support Costs- Program Support Percent 4.0%- Non-travel/Total cost $47.17
Hourly Program Support Cost $2.19
Administrative Overhead- Administrative Percent 10.0%- Non-travel cost $47.17
Hourly administrative cost $5.49
SFY 14 (7/1/13 - 6/30/14)Benchmark Rate $60.00 Adopted Rate Factor 90.50%Adopted Rate $54.30
SFY 15 (7/1/14 - 6/30/15)Benchmark Rate $54.85 Adopted Rate FactorAdopted Rate
Habilitation, Consultation, BCBA
RebaseBook 2014 136 October 8, 2013

Independent Rate ModelsSpecialized Habilitation Services
Habilitation, Consultation
CurrentModel
SFY13ReBase
Service
Unit of Service 1 hour 1 hour
Hourly Wage $20.50Annual Wage $42,640
ERE (as percent of wages) 23.0%Hourly Compensation (wages + ERE) $25.22Annual Compensation (wages + ERE) $52,447
Productivity Assumptions- Total Hours 8.00- Travel Time 1.07- Recordkeeping & Documentation 0.75
- Training Time 0.21
- Employer Time 0.10
- Missed Appointments 0.05
- Down Time 0.00
- Average on-site time; "Billable Hours" 5.82
- Productivity Adjustment 1.37Hourly Compensation After Adjustment $34.66Annual Compensation After Adjustment $52,447
Mileage- Number of Miles 22.5- Amount per mile $0.565
Total Mileage Amount $12.71Hourly mileage cost $2.18
Program Support Costs- Program Support Percent 4.0%- Non-travel/Total cost $36.84
Hourly Program Support Cost $1.71
Administrative Overhead- Administrative Percent 10.0%- Non-travel cost $36.84
Hourly administrative cost $4.28
SFY 14 (7/1/13 - 6/30/14)Benchmark Rate $40.00 Adopted Rate Factor 90.50%Adopted Rate $36.20
SFY 15 (7/1/14 - 6/30/15)Benchmark Rate $42.84 Adopted Rate FactorAdopted Rate
Habilitation, Consultation, BCABA
RebaseBook 2014 137 October 8, 2013

Independent Rate ModelsSpecialized Habilitation Services
Habilitation, Early Childhood Autism Specialized
CurrentModel
SFY13ReBase
Service
Unit of Service 1 hour 1 hour
Hourly Wage $26.61Annual Wage $55,349
ERE (as percent of wages) 23.0%Hourly Compensation (wages + ERE) $32.73Annual Compensation (wages + ERE) $68,079
Productivity Assumptions- Total Hours 8.00- Travel Time 1.07- Recordkeeping & Documentation 0.75
- Training Time 0.21
- Employer Time 0.10
- Missed Appointments 0.05
- Down Time 0.00
- Average on-site time; "Billable Hours" 5.82
- Productivity Adjustment 1.37Hourly Compensation After Adjustment $44.99Annual Compensation After Adjustment $68,079
Mileage- Number of Miles 22.5- Amount per mile $0.565
Total Mileage Amount $12.71Hourly mileage cost $2.18
Program Support Costs- Program Support Percent 4.0%- Non-travel/Total cost $47.17
Hourly Program Support Cost $2.19
Administrative Overhead- Administrative Percent 10.0%- Non-travel cost $47.17
Hourly administrative cost $5.49
SFY 14 (7/1/13 - 6/30/14)Benchmark Rate $60.00 Adopted Rate Factor 90.50%Adopted Rate $54.30
SFY 15 (7/1/14 - 6/30/15)Benchmark Rate Inflation Adjustment $54.85 Adopted Rate FactorAdopted Rate
Habilitation, Early Childhood Autism Specialized (Masters)
RebaseBook 2014 138 October 8, 2013

Independent Rate ModelsSpecialized Habilitation Services
Habilitation, Early Childhood Autism Specialized
CurrentModel
SFY13ReBase
Service
Unit of Service 1 hour 1 hour
Hourly Wage $20.50Annual Wage $42,640
ERE (as percent of wages) 23.0%Hourly Compensation (wages + ERE) $25.22Annual Compensation (wages + ERE) $52,447
Productivity Assumptions- Total Hours 8.00- Travel Time 1.07- Recordkeeping & Documentation 0.75
- Training Time 0.21
- Employer Time 0.10
- Missed Appointments 0.05
- Down Time 0.00
- Average on-site time; "Billable Hours" 5.82
- Productivity Adjustment 1.37Hourly Compensation After Adjustment $34.66Annual Compensation After Adjustment $52,447
Mileage- Number of Miles 22.5- Amount per mile $0.565
Total Mileage Amount $12.71Hourly mileage cost $2.18
Program Support Costs- Program Support Percent 4.0%- Non-travel/Total cost $36.84
Hourly Program Support Cost $1.71
Administrative Overhead- Administrative Percent 10.0%- Non-travel cost $36.84
Hourly administrative cost $4.28
SFY 14 (7/1/13 - 6/30/14)Benchmark Rate $40.00 Adopted Rate Factor 90.50%Adopted Rate $36.20
SFY 15 (7/1/14 - 6/30/15)Benchmark Rate $42.84 Adopted Rate FactorAdopted Rate
Habilitation, Early Childhood Autism Specialized (Bachelors)
RebaseBook 2014 139 October 8, 2013

Independent Rate ModelsSpecialized Habilitation Services
Habilitation, Early Childhood Autism Specialized
CurrentModel
SFY13ReBase
Unit of Service 1 hour 1 hour
Hourly Wage $11.68Annual Wage $24,294
ERE (as percent of wages) 35.0%Hourly Compensation (wages + ERE) $15.77Annual Compensation (wages + ERE) $32,797
Factors Offsetting Direct Care Service Hours- Total Hours 8.00- Travel Time 0.89- Recordkeeping & Documentation 0.20
- Training Time 0.21
- Missed Appointments 0.05
- Employer Time 0.10
- Average on-site time; "Billable Hours" 6.55
- Productivity Adjustment 1.22Hourly Compensation After Adjustment $19.26Annual Compensation After Adjustment $32,797
Mileage- Number of Miles 18.0- Amount per mile $0.565
Total Mileage Amount $10.17Hourly mileage cost $1.55
Program Support Costs- Program Support Percent 8.0%- Non-travel/Total cost $20.81
Hourly program support cost $2.03
Administrative Overhead- Administrative Percent 10.0%- Non-travel/Total cost $20.81
Hourly administrative cost $2.54
SFY 14 (7/1/13 - 6/30/14)Benchmark Rate $20.53 Adopted Rate Factor 100.00%Adopted Rate $20.53
SFY 15 (7/1/14 - 6/30/15)Benchmark Rate $25.38 Adopted Rate FactorAdopted Rate - 1 Staff, 1 Client
ServiceHabilitation, Early Childhood Autism
Spec Hourly Habilitation
RebaseBook 2014 140 October 8, 2013
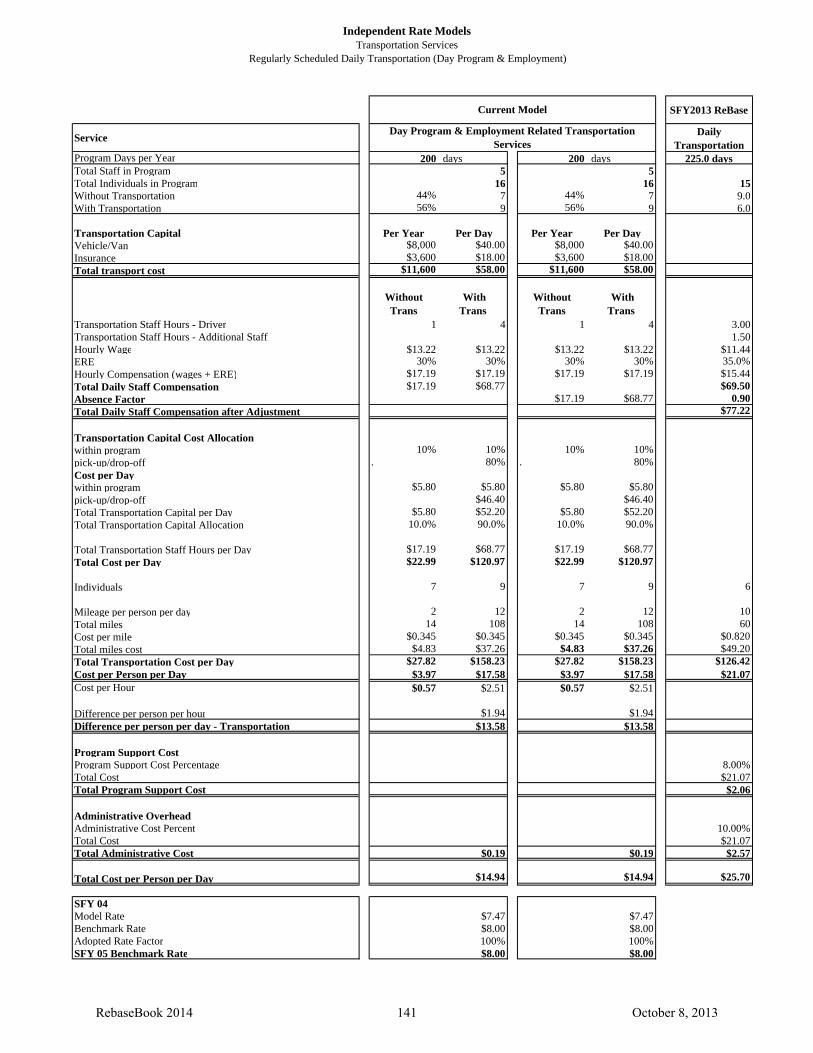
Independent Rate ModelsTransportation Services
Regularly Scheduled Daily Transportation (Day Program & Employment)
SFY2013 ReBase
ServiceDaily
TransportationProgram Days per Year 200 days 200 days 225.0 daysTotal Staff in Program 5 5Total Individuals in Program 16 16 15Without Transportation 44% 7 44% 7 9.0With Transportation 56% 9 56% 9 6.0
Transportation Capital Per Year Per Day Per Year Per Day Vehicle/Van $8,000 $40.00 $8,000 $40.00Insurance $3,600 $18.00 $3,600 $18.00Total transport cost $11,600 $58.00 $11,600 $58.00
WithoutTrans
WithTrans
WithoutTrans
WithTrans
Transportation Staff Hours - Driver 1 4 1 4 3.00Transportation Staff Hours - Additional Staff 1.50Hourly Wage $13.22 $13.22 $13.22 $13.22 $11.44ERE 30% 30% 30% 30% 35.0%Hourly Compensation (wages + ERE) $17.19 $17.19 $17.19 $17.19 $15.44Total Daily Staff Compensation $17.19 $68.77 $69.50Absence Factor $17.19 $68.77 0.90Total Daily Staff Compensation after Adjustment $77.22
Transportation Capital Cost Allocationwithin program 10% 10% 10% 10%pick-up/drop-off . 80% . 80%Cost per Daywithin program $5.80 $5.80 $5.80 $5.80pick-up/drop-off $46.40 $46.40Total Transportation Capital per Day $5.80 $52.20 $5.80 $52.20Total Transportation Capital Allocation 10.0% 90.0% 10.0% 90.0%
Total Transportation Staff Hours per Day $17.19 $68.77 $17.19 $68.77Total Cost per Day $22.99 $120.97 $22.99 $120.97
Individuals 7 9 7 9 6
Mileage per person per day 2 12 2 12 10Total miles 14 108 14 108 60Cost per mile $0.345 $0.345 $0.345 $0.345 $0.820Total miles cost $4.83 $37.26 $4.83 $37.26 $49.20Total Transportation Cost per Day $27.82 $158.23 $27.82 $158.23 $126.42Cost per Person per Day $3.97 $17.58 $3.97 $17.58 $21.07Cost per Hour $0.57 $2.51 $0.57 $2.51
Difference per person per hour $1.94 $1.94Difference per person per day - Transportation $13.58 $13.58
Program Support CostProgram Support Cost Percentage 8.00%Total Cost $21.07Total Program Support Cost $2.06
Administrative OverheadAdministrative Cost Percent 10.00%Total Cost $21.07Total Administrative Cost $0.19 $0.19 $2.57
Total Cost per Person per Day $14.94 $14.94 $25.70
SFY 04Model Rate $7.47 $7.47Benchmark Rate $8.00 $8.00Adopted Rate Factor 100% 100%SFY 05 Benchmark Rate $8.00 $8.00
Current Model
Day Program & Employment Related Transportation Services
RebaseBook 2014 141 October 8, 2013

Independent Rate ModelsTransportation Services
Regularly Scheduled Daily Transportation (Day Program & Employment)
SFY2013 ReBase
ServiceDaily
Transportation
Current Model
Day Program & Employment Related Transportation Services
SFY 14 (7/1/13 - 6/30/14)Benchmark Rate Inflation Adjustment 0.00% 0.00%Benchmark Rate $9.09 $9.09 Adopted Rate Factor 90.50% 90.50%Adopted Rate $8.23 $8.23
Effective cost per mile due to rate adj., SFY 04 - SFY 07 $0.391 $0.376Temporary increase in cost per mile* $0.485 $0.485Percent increase in cost per mile 24.0% 29.0%
Mileage allowance in model 10 10Portion of mileage in SFY 06 model $3.91 $3.76Adjusted mileage cost $4.85 $4.85Adjustment for higher cost per mile* $0.94 $1.09Remaining portion of the model (constant) $4.32 $4.47Adjusted Adopted Rate $9.17 $9.32
* This adjustment to cost per mile is temporary until further notice from the DES/DDD Assistant Director.
SFY 15 (7/1/14 - 6/30/15)Benchmark Rate $12.85 Adopted Rate FactorAdopted Rate
RebaseBook 2014 142 October 8, 2013

Independent Rate ModelsTransportation Services
Regularly Scheduled Daily Transportation, Rural (Day Program & Employment)
SFY2013 ReBase
ServiceDaily
TransportationProgram Days per Year 200 days 200 days 225.0 daysTotal Staff in Program 2.0 2 1.7Total Individuals in Program 6.0 6 6.0Without Transportation 33% 2.0 33% 2 2.0With Transportation 67% 4.0 67% 4 4.0
Transportation Capital Per Year Per Day Per Year Per Day Vehicle/Van $5,200 $26.00 $5,200 $26.00Insurance $3,600 $18.00 $3,600 $18.00Total tranport cost $8,800 $44.00 $8,800 $44.00
WithoutTrans
WithTrans
WithoutTrans
WithTrans
Transportation Staff Hours - Driver 0.4 1.6 0.4 1.6 3.50Transportation Staff Hours - Additional Staff 1.75Hourly Wage $13.22 $13.22 $13.22 $13.22 $11.44ERE 30% 30% 30% 30% 35.0%Hourly Compensation (wages + ERE) $17.19 $17.19 $17.19 $17.19 $15.44Total Daily Staff Compensation $6.88 $27.51 $6.88 $27.51 $81.08Absence Factor 0.90Total Daily Staff Compensation after Adjustment $90.09
Transportation Capital Cost Allocationwithin program 10% 10% 10% 10%pick-up/drop-off . 80% . 80%Cost per Daywithin program $4.40 $4.40 $4.40 $4.40pick-up/drop-off $35.20 $35.20Total Transportation Capital per Day $4.40 $39.60 $4.40 $39.60Total Transportation Capital Allocation 10.0% 90.0% 10.0% 90.0%
Total Transportation Staff Hours per Day $6.88 $27.51 $6.88 $27.51Total Cost per Day $11.28 $67.11 $11.28 $67.11
Individuals 2 4 2 4 4.0
Mileage per person per day 4 24 4 24 16.0Total miles 8 96 8 96 64Cost per mile $0.345 $0.345 $0.345 $0.345 $0.820Total miles cost $2.76 $33.12 $2.76 $33.12 $52.48Total Transportation Cost per Day $14.04 $100.23 $14.04 $100.23 $142.57Cost per Person per Day $7.02 $25.06 $7.02 $25.06 $35.64Cost per Hour $1.00 $3.58 $1.00 $3.58
Difference per person per hour $2.58 $2.58Difference per person per day - Transportation $18.06 $18.06
Program Support CostProgram Support Cost Percentage 8.00%Total Cost $35.64Total Program Support Cost $3.48
Administrative OverheadAdministrative Cost Percent 10.00%Total Cost $35.64Total Administrative Cost $0.26 $0.26 $4.35
Total Cost per Person per Day $19.86 $19.86 $43.47
SFY 04Model Rate $9.93 $9.93Benchmark Rate $10.67 $10.67Adopted Rate Factor 100% 100%SFY 05 Benchmark Rate $10.67 $10.67
Current Model
Day Program & Employment Related Transportation Services, Rural
RebaseBook 2014 143 October 8, 2013

Independent Rate ModelsTransportation Services
Regularly Scheduled Daily Transportation, Rural (Day Program & Employment)
SFY2013 ReBase
ServiceDaily
Transportation
Current Model
Day Program & Employment Related Transportation Services, Rural
SFY 14 (7/1/13 - 6/30/14)Benchmark Rate Inflation Adjustment 0.00% 0.00%Benchmark Rate $12.13 $12.13 Adopted Rate Factor 90.50% 90.50%Adopted Rate $10.98 $10.98
Effective cost per mile due to rate adj., SFY 04 - SFY 06 $0.377 $0.377Temporary increase in cost per mile* $0.485 $0.485Percent increase in cost per mile 28.6% 28.6%
Mileage allowance in model 20 20Portion of mileage in SFY 06 model $7.54 $7.54Adjusted mileage cost $9.70 $9.70Adjustment for higher cost per mile* $2.16 $2.16Remaining portion of the model (constant) $3.44 $3.44Adjusted Adopted Rate $13.14 $13.14* This adjustment to cost per mile is temporary until further notice from the DES/DDD Assistant Director.
SFY 15 (7/1/14 - 6/30/15)Benchmark Rate $21.73 Adopted Rate FactorAdopted Rate
RebaseBook 2014 144 October 8, 2013

Independent Rate ModelsTransportation Services
Modified Transportation Rates
CurrentModel
SFY2013 ReBaseCurrentModel
SFY2013 ReBase
ServiceProgram Days per Year 225.0 days 225.0 daysTotal Staff in Program 4.6 1.7Total Individuals in ProgramWithout TransportationWith Transportation 1.0 1.0
Transportation Staff Hours - Driver 1.00 1.50Transportation Staff Hours - Additional Staff 1.00 1.50Hourly Wage $11.44 $11.44ERE 35.0% 35.0%Hourly Compensation (wages + ERE) $15.44 $15.44Total Daily Staff Compensation $30.89 $46.33Absence Factor 1.00 1.00Total Daily Staff Compensation after Adjustment $30.89 $46.33
Individuals 1 1Mileage per person per day 10 16Total miles 10 16Cost per mile $0.820 $0.820Total miles cost $8.20 $13.12Total Transportation Cost per Day $39.09 $59.45Cost per Person per Day $39.09 $59.45
Program Support CostProgram Support Cost Percentage 8.00% 8.00%Total Cost $39.09 $59.45Total Program Support Cost $3.81 $5.80
Administrative OverheadAdministrative Cost Percent 10.00% 10.00%Total Cost $39.09 $59.45Total Administrative Cost $4.77 $7.25
Total Cost per Person per Day $47.67 $72.50
Add-On Factor per Additional MileWages Add-OnMileage Add-OnTotal Add-On Cost Per Mile
Additional Miles per Person per DayTotal Add-On Cost per Person per Day
SFY 14 (7/1/13 - 6/30/14)Benchmark Rate $18.17 $24.23 Adopted Rate Factor 90.50% 90.50%Adopted Rate $16.44 $21.93
SFY 15 (7/1/14 - 6/30/15)Benchmark Rate $23.83 $36.25 Adopted Rate FactorAdopted Rate
Single Person Modified Urban Single Person Modified Rural
RebaseBook 2014 145 October 8, 2013

Independent Rate ModelsTransportation Services
Modified Transportation Rates
ServiceProgram Days per YearTotal Staff in ProgramTotal Individuals in ProgramWithout TransportationWith Transportation
Transportation Staff Hours - DriverTransportation Staff Hours - Additional StaffHourly WageEREHourly Compensation (wages + ERE)Total Daily Staff CompensationAbsence FactorTotal Daily Staff Compensation after Adjustment
IndividualsMileage per person per dayTotal milesCost per mileTotal miles costTotal Transportation Cost per DayCost per Person per Day
Program Support CostProgram Support Cost PercentageTotal CostTotal Program Support Cost
Administrative OverheadAdministrative Cost PercentTotal CostTotal Administrative Cost
Total Cost per Person per Day
Add-On Factor per Additional MileWages Add-OnMileage Add-OnTotal Add-On Cost Per Mile
Additional Miles per Person per DayTotal Add-On Cost per Person per Day
SFY 14 (7/1/13 - 6/30/14)Benchmark RateAdopted Rate FactorAdopted Rate
SFY 15 (7/1/14 - 6/30/15)Benchmark RateAdopted Rate FactorAdopted Rate
CurrentModel
SFY2013 ReBase
225.0 days4.615
9.06.0
3.001.50
$11.4435.0%$15.44$69.50
0.90$77.22
61060
$0.820$49.20
$126.42$21.07
8.00%$21.07
$2.06
10.00%$21.07
$2.57
$25.70
$0.93$0.565
$1.49
40$59.67
$18.18 90.50%$16.45
$42.68
Extensive Transportation
RebaseBook 2014 146 October 8, 2013

RebaseBook 2014 147 October 8, 2013
RebaseBook 2014
Rate Schedules
October 8, 2013

Arizona Department of Economic Security, Division of Developmental DisabilitiesSFY 14 Benchmark, SFY 14 Adopted Rates & Proposed ReBase
Home-Based Services
HCPCS ServiceCode
DDD ServiceCode
Unit ofService
MultipleClients
Benchmark Rate
Adopted RateProposed ReBase
Attendent CareS5125 ATC Client Hour 1 $16.09 $14.56 $19.87 S5125 ATC Client Hour 2 $10.06 $9.10 $12.42 S5125 ATC Client Hour 3 $8.05 $7.28 $9.94
S5125 ATC Client Hour 1 $16.09 $14.56 $19.87 S5125 ATC Client Hour 2 $10.06 $9.10 $12.42 S5125 ATC Client Hour 3 $8.05 $7.28 $9.94
Attendant Care (Non-Family Member)Attendant Care (Non-Family Member)
Attendant Care (Family Member)Attendant Care (Family Member)Attendant Care (Family Member)
Use of an additional modifer is required: U3 - Spouse caregiver, U4 - Family member not residing with individual, U5 - Family member residing with individual.
Saturday, 12:00 A.M. to 3:00 P.M.Services ProvidedServices BilledServices Authorization
15 hours1 unit (S5150/RSD)12 hours reduced from authorization
Description
Attendant Care (Non-Family Member)
Services ProvidedServices BilledServices Authorization
10 hours10 hours (S5151/RSP)10 hours reduced from authorization
2. Respite provided from Friday at 4:00 P.M. until Saturday at 3:00 P.M.Friday, 4:00 P.M. to 11:59 P.M.
Services ProvidedServices BilledServices Authorization
8 hours8 hours (S5151/RSP)8 hours reduced from authorization
Saturday, 12:00 A.M. to 10:00 A.M.
Unit of Service1. The basis of payment for all Home-Based Services except for Respite, Day is an hourly unit of direct service time. Direct service time is the period of time spent with the consumer and verified by the consumer. When billing, the Qualified Vendor should round its direct service time to the nearest 15-minute increment, as illustrated in the examples below:- If services were provided for 65 minutes, bill for 1 hour.- If services were provided for 68 minutes, bill for 1.25 hour.- If services were provided for 50 minutes, bill for .75 hour.
2. If the Qualified Vendor provides respite for a total of 12 or more hours (consecutive or non-consecutive) in one calendar day, this is considered to be Respite, Day. A calendar day is a 24-hour stretch of time that begins at midnight and ends at 11:59 p.m. of the same day. One unit of Respite, Day equals equals one day (12 or more hours in one calendar day) of direct service time. A Qualified Vendor billing for Respite, Day will bill for the appropriate number of days of service and will include the actual cumulative hours of service provided on the billing document as required by the Division.
3. In no event will more than three consumers receive the same service with a single direct service staff person at the same time.
4. Other modifiers related to Time of Day (UF, UG, UH or UJ) may be required for billing Home-Based Services.Examples of Billing: Respite, Day1. Respite provided from Friday at 4:00 P.M. until Saturday at 10:00 A.M.
Friday, 4:00 P.M. to 11:59 P.M.Services ProvidedServices BilledServices Authorization
8 hours8 hours (S5151/RSP)8 hours reduced from authorization
RebaseBook 2014 148 October 8, 2013

Arizona Department of Economic Security, Division of Developmental DisabilitiesSFY 14 Benchmark, SFY 14 Adopted Rates & Proposed ReBase
Home-Based Services
HCPCS ServiceCode
DDD ServiceCode
Unit ofService
MultipleClients
Benchmark Rate
Adopted RateProposed ReBase
Description
Habilitation, SupportH2017 HAH Client Hour 1 $20.53 $18.58 $26.20 H2017 HAH Client Hour 2 $12.83 $11.61 $16.38 H2017 HAH Client Hour 3 $10.27 $9.29 $13.10
HousekeepingS5130 HSK Client Hour 1 $14.82 $13.41 $17.82 S5130 HSK Client Hour 2 $9.26 $8.38 $11.14 S5130 HSK Client Hour 3 $7.41 $6.71 $8.91
Respite, HourlyS5150 RSP Client Hour 1 $15.77 $14.27 $20.29 S5150 RSP Client Hour 2 $9.86 $8.92 $12.68 S5150 RSP Client Hour 3 $7.89 $7.14 $10.15
Respite, DayS5151 RSD Day 1 $192.81 $192.81 $269.77 S5151 RSD Day 2 $120.51 $120.51 $168.61 S5151 RSD Day 3 $96.41 $96.41 $134.89
Respite, Day (12 hours or more)Respite, Day (12 hours or more)Respite, Day (12 hours or more)
HousekeepingHousekeepingHousekeeping
Respite, HourlyRespite, HourlyRespite, Hourly
Habilitation, SupportHabilitation, SupportHabilitation, Support
RebaseBook 2014 149 October 8, 2013

Arizona Department of Economic Security, Division of Developmental DisabilitiesSFY 14 Benchmark, SFY 14 Adopted Rates & Proposed ReBase
Independent Living Services
Rate1. The hourly rate for this service is based on hour (60 minutes) of direct service time.
2. The daily rate for this service is based on Staff Hour unit of service. Staff Hours are the hours provided by the Qualified Vendor that the Division authorizes the Qualified Vendor to schedule and provide at the service site to assure health, safety, and the delivery of habilitation services to the residents.
- The Division will make payments to the Qualified Vendor on the per diem basis based on the hourly rate for the Staff Hour unit of service, the number of residents at the site, and the direct service hours provided up to the number of authorized direct service hours for the site.
Unit of Service – Hourly1. The basis of payment for this service is an hourly unit of direct service time. Direct service time is the period of time spent with the consumer and verified by the consumer. The Qualified Vendor may bill the Division an hourly rate if and only if the Division authorizes this invoicing of an hourly rate. The Division will authorize an hourly rate if:
- Direct service time that is authorized in a given setting is less than 16 hours (consecutive or non-consecutive) on any calendar day. A calendar day is a 24-hour stretch of time that begins at midnight and ends at 11:59 p.m. of the same day, or:
- Direct service time that is authorized in a given setting is less than 112 hours in a week. A week is a consecutive seven day stretch of time that begins at midnight on Sunday and ends at 11:59 p.m. the following Saturday.
2. If the Qualified Vendor provides an hourly unit of direct service time, when billing the Qualified Vendor should round its direct service time to the nearest 15-minute increment, as illustrated in the examples below:- If services were provided for 65 minutes, bill for 1 hour.- If services were provided for 68 minutes, bill for 1.25 hour.- If services were provided for 50 minutes, bill for 0.75 hour.
3. If the Qualified Vendor provides an hourly unit of direct service time and the Qualified Vendor provides this service with a single direct service staff person to multiple consumers at the same time, the basis of payment for each consumer will be the total direct service time multiplied by the appropriate multiple client rate for the same unit of service. In no event will more than three consumers receive this service with a single direct service staff person at the same time.
Unit of Service – Daily1. The basis of payment for this service is an hourly unit of direct service time converted into a daily rate. Direct service time is the period of time spent with the consumer and verified by the consumer. The Qualified Vendor may bill the Division a daily rate if and only if the Division authorizes this invoicing of a daily rate. The Division will authorize a daily rate if:
- Direct service time that is authorized in a given setting is more than 16 hours (consecutive or non-consecutive) on any calendar day in a week. A calendar day is a 24-hour stretch of time that begins at midnight and ends at 11:59 p.m. of the same day, or: - Direct service time that is authorized in a given setting is more than 112 hours in a week. A week is a consecutive seven day stretch of time that begins at midnight on Sunday and ends at 11:59 p.m. the following Saturday.
RebaseBook 2014 150 October 8, 2013

Arizona Department of Economic Security, Division of Developmental DisabilitiesSFY 14 Benchmark, SFY 14 Adopted Rates & Proposed ReBase
Independent Living Services
HCPCS ServiceCode
DDD ServiceCode
Unit ofService
MultipleClients
Benchmark Rate
Adopted RateProposed ReBase
Independent Living Services, HourlyT2017 HAI Client Hour 1 $20.74 $18.77 $23.33 T2017 HAI Client Hour 2 $12.96 $11.73 $14.58 T2017 HAI Client Hour 3 $10.37 $9.39 $11.67
Independent Living Services, Daily*T2017 HID Client Hour 1 $20.74 $18.77 $20.24 T2017 HID Client Hour 2 $12.96 $11.73 $12.65 T2017 HID Client Hour 3 $10.37 $9.39 $10.12 * For use with the Weekly Staffing Matrix
Habilitation, Individually Designed Living ArrangementHabilitation, Individually Designed Living Arrangement
Habilitation, Individually Designed Living ArrangementHabilitation, Individually Designed Living ArrangementHabilitation, Individually Designed Living Arrangement
4. If the Qualified Vendor elects to calculate a monthly average of weekly direct service hours at the end of the month, the Qualified Vendor shall determine the total number of direct service hours in a given month and determine the average number of direct service hours per week by dividing (the total number of direct service hours in a month) by (the number of weeks in a month).a. If there are 31 days in a month, then the number of weeks in a month is 4.43b. If there are 30 days in a month, then the number of weeks in a month is 4.29c. If there are 29 days in a month, then the number of weeks in a month is 4.14d. If there are 28 days in a month, then the number of weeks in a month is 4.00
5. The per diem rates paid to a Qualified Vendor with multiple sites will vary among homes according to the authorized direct service hours, actual direct service hours provided, and number of residents at each home.
6. Because direct service hours provided can vary by week (if the Qualified Vendor does not elect to calculate a monthly average of weekly direct service hours, and the number of occupants can vary both by week and within a week, the Qualified Vendor may bill more than one per diem rate for each resident on their monthly invoice, but none of the rates billed shall be in excess of the rate which reflects the number of authorized direct service hours.
7. The Qualified Vendor shall use the actual resident occupancy receiving services to determine the per diem rate to be billed to the Division. The actual resident occupancy includes all residents, whether or not they are funded by the Division. The Qualified Vendor must notify the DDD Program Administrator/Manager or designee about movement into or out of a site by any resident, whether or not funded by the Division. The Division shall determine if direct service hours will be adjusted on a temporary or permanent basis to reflect the need for direct service hours.
8. If a resident is not at the site on a particular day, the Qualified Vendor shall not bill the Division for this resident. In this situation, the Qualified Vendor shall bill the Division the per diem rate for the actual number of Division-funded residents.
Description
Habilitation, Individually Designed Living Arrangement
2. The Daily Rates schedule for Habilitation, Individually Designed Living Arrangement contains 22 tables with Daily Rates, and each table refers to one of 22 ranges. Each range represents a level of staffing with the number of direct service hours that are authorized by the Division to be provided by the Qualified Vendor at a particular site during a week. The number of hours specified in each range represents the number of direct service hours the Qualified Vendor must provide in a week in order to bill the per diem rates associated with that range. These Daily Rates are statewide for all Habilitation, Individually Designed Living Arrangement.
3. The Qualified Vendor shall invoice for payment for each consumer the per diem rate on the Daily Rates schedule for Habilitation, Individually Designed Living Arrangement that reflects the number of residents in the facility and the range of hours provided in a week that reflect the lesser of 1) the authorized direct service hours, or 2) the actual direct service hours delivered. The Qualified Vendor may calculate the weekly direct service hours weekly, or may calculate a monthly average of weekly direct service hours at the end of the month for that month.
RebaseBook 2014 151 October 8, 2013

Arizona Department of Economic Security, Division of Developmental DisabilitiesSFY 14 Benchmark, SFY 14 Adopted Rates & Proposed ReBase
Day Treatment and Training Services
Unit of Service1. The basis of payment for this service is the ratio rate. To determine the appropriate billing rate, the Qualified Vendor shall: a. Divide (the total billable hours consumers attended the program including hours allowed pursuant to item 3 below, excluding hours for behaviorally or medically intense consumers with a specially authorized rate) by (the total direct service staff hours with consumers present at the program, excluding hours related to behaviorally or medically intense consumers with a specially authorized rate); andb. Use the resulting quotient, which is the number of consumer billable hours per direct service staff hours and can be stated as “1: (result from step a.)” staff to consumer ratio, to find the appropriate staff to consumer ratio rate on the rate schedule.c. The Qualified Vendor may calculate this ratio on a daily basis using actual hours for each day or may calculate the ratio at the end of the calendar month using the actual number of hours for the entire month to determine an average ratio for the month.
For example, if the number of hours attended by all consumers in a program plus the hours allowed pursuant to item 3 below (excluding behaviorally or medically intense consumers with a specially authorized rate) totaled 110 hours for a day (2,200 for the month), and the number of hours worked by direct service staff when consumers were present at the program (excluding hours related to behaviorally or medically intense consumers with a specially authorized rate) totaled 28 for that day (560 for the month), then the calculation would be:- Total billable consumer hours divided by total direct service staff hours = 110 / 28 or 2,200 / 560 = 3.928- This program’s ratio for this day is 1:3.928
Providers have the option of using one of the following methods to determine units:#1 For both consumers and direct service staff, units shall be recorded daily on the per consumer and per direct service staff basis, shall be expressed in terms of hours and shall be rounded to the nearest hour, as illustrated in examples below:- If total hours for a consumer or direct service staff were equal to 3 hours and 5 minutes, round the total to 3 hours- If total hours for a consumer or direct service staff were equal to 5 hours and 24 minutes, round the total to 5 hours- If total hours for a consumer or direct service staff were equal to 5 hours and 30 minutes, round the total to 6 hours- If total hours for a consumer or direct service staff were equal to 6 hours and 48 minutes, round the total to 7 hours
#2 For both consumers and direct service staff, units shall be recorded daily on the per consumer and per direct service staff basis, shall be expressed in terms of hours and shall be rounded to the nearest 15-minutes, as illustrated in examples below:- If services were provided for 3 hours and 5 minutes, bill 3.00 units.- If services were provided for 5 hours and 24 minutes, bill 5.50 units.- If services were provided for 6 hours and 48 minutes, bill 6.75 units.
For Day Treatment and Training, Adult:2. Absences do not constitute a billable unit except as provided in item 3 below. An absence factor was built into the model rates. The Division will not compensate Qualified Vendors for any absences. For example, if a consumer stays in the day program for two hours in the morning, then leaves for two hours, and then returns for three hours, and all activity takes place within the same program day, total hours for this consumer shall be equal to five for that day. If the consumer permanently stops attending the Qualified Vendor’s facility, then the Qualified Vendor shall notify the DDD Program Administrator/Manager or designee. The Qualified Vendor shall not bill the Division for vacancies.
3. Qualified Vendors that do not provide transportation for a particular consumer may include up to one hour per day if that consumer arrives after his/her scheduled arrival time on that day or if that consumer leaves before his/her scheduled departure time on that day. The calculation of the ratio will use the billable hours. However, if the client is absent for the entire day, the Qualified Vendor may not include hours for that day for that client in the ratio. In no event shall the Qualified Vendor submit a claim for more than the number of hours authorized for that consumer.
RebaseBook 2014 152 October 8, 2013

Arizona Department of Economic Security, Division of Developmental DisabilitiesSFY 14 Benchmark, SFY 14 Adopted Rates & Proposed ReBase
Day Treatment and Training Services
HCPCS ServiceCode
DDD ServiceCode
Unit of ServiceBenchmark
RateAdopted Rate
Proposed ReBase
Day Treatment and Training, Adult*
T2021 DTA Program Hour $10.53 $9.53 $9.98
T2021 DTA Program Hour $7.66 $6.93 $7.51
T2021 DTA Program Hour $6.33 $5.73 $6.38
T2021 DTA Program Hour $5.56 $5.03
Day Treatment and Training, Children*
T2021 DTT Program Hour $10.16 $9.19 $11.51
T2021 DTT Program Hour $7.83 $7.09 $9.31
T2021 DTT Program Hour $6.75 $6.11 $8.38
T2021 DTT Program Hour $6.11 $5.53
T2021 DTS Program Hour $10.16 $9.19 $11.51
T2021 DTS Program Hour $7.83 $7.09 $9.31
T2021 DTS Program Hour $6.75 $6.11 $8.38
T2021 DTS Program Hour $6.11 $5.53
Description
Day Treatment and Training, Adult - Staff : Consumer Ratio Of 1:2.5 To 1:4.5Day Treatment and Training, Adult - Staff : Consumer Ratio Of 1:4.51 To 1:6.5
Day Treatment and Training, Adult - Staff : Consumer Ratio Of 1:8.51 To 1:10.5
Day Treatment and Training, Children (After-School) - Staff : Consumer Ratio Of 1:2.5 To 1:4.5Day Treatment and Training, Children (After-School) - Staff : Consumer Ratio Of 1:4.51 To 1:6.5Day Treatment and Training, Children (After-School) - Staff : Consumer Ratio Of 1:6.51 To 1:8.5Day Treatment and Training, Children (After-School) - Staff : Consumer Ratio Of 1:8.51 To 1:10.5
Day Treatment and Training, Children (Summer) - Staff : Consumer Ratio Of 1:2.5 To 1:4.5Day Treatment and Training, Children (Summer) - Staff : Consumer Ratio Of 1:4.51 To 1:6.5Day Treatment and Training, Children (Summer) - Staff : Consumer Ratio Of 1:6.51 To 1:8.5Day Treatment and Training, Children (Summer) - Staff : Consumer Ratio Of 1:8.51 To 1:10.5
Day Treatment and Training, Adult - Staff : Consumer Ratio Of 1:6.51 To 1:8.5
For Day Treatment and Training, Children:4. Absences do not constitute a billable unit except as provided in item 5 below. An absence factor was built into the model rates. The Division will not compensate Qualified Vendors for any absences. For example, if a consumer stays in the day program for two hours in the morning, then leaves for two hours, and then returns for three hours, and all activity takes place within the same program day, total hours for this consumer shall be equal to five for that day. If the consumer permanently stops attending the Qualified Vendor’s facility, then the Qualified Vendor shall notify the DDD Program Administrator/Manager or designee. The Qualified Vendor shall not bill the Division for vacancies.
5. Qualified Vendors that do not provide transportation for a particular consumer may include up to 30 minutes per day if that consumer arrives after his/her scheduled arrival time on that day or if that consumer leaves before his/her scheduled departure time on that day. The calculation of the ratio will use the billable hours. However, if the client is absent for the entire day, the Qualified Vendor may not include hours for that day for that client in the ratio. In no event shall the Qualified Vendor submit a claim for more than the number of hours authorized for that consumer.
RebaseBook 2014 153 October 8, 2013

Arizona Department of Economic Security, Division of Developmental DisabilitiesSFY 14 Benchmark, SFY 14 Adopted Rates & Proposed ReBase
Day Treatment and Training Services
HCPCS ServiceCode
DDD ServiceCode
Unit of ServiceBenchmark
RateAdopted Rate
Proposed ReBase
Description
Modified Rates
T2021 DTA Program Hour $11.69 $10.58 $11.36
T2021 DTA Program Hour $8.81 $7.97 $8.92
T2021 DTA Program Hour $7.51 $6.80 $7.82
T2021 DTA Program Hour $6.73 $6.09
T2021 DTA Program Hour $20.53 $18.58 $20.80
T2021 DTA Program Hour $12.83 $11.61 $13.00
T2021 DTT Program Hour $20.53 $18.58 $20.80
T2021 DTT Program Hour $12.83 $11.61 $13.00
T2021 DTS Program Hour $20.53 $18.58 $20.80
T2021 DTS Program Hour $12.83 $11.61 $13.00
Behaviorally or Medically Intense Day Treatment and Training, Children (After-School) - Staff : Consumer Ratio Of 1:2
Behaviorally or Medically Intense Day Treatment and Training, Children (Summer) - Staff : Consumer Ratio Of 1:1Behaviorally or Medically Intense Day Treatment and Training, Children (Summer) - Staff : Consumer Ratio Of 1:2
Rural Day Treatment and Training, Adult - Staff : Consumer Ratio Of 1:6.51 To 1:8.5Rural Day Treatment and Training, Adult - Staff : Consumer Ratio Of 1:8.51 To 1:10.5
Behaviorally or Medically IntenseThe Division established a separate rate for this service to behaviorally or medically intense consumers. This modified rate is authorized on an individual consumer basis. Special authorization for these consumers is required by the DDD Program Administrator/Manager or designee . The hours for these consumers and the direct service staff hours shall not be considered in determining the overall program staffing ratio for the remaining consumers.
Behaviorally or Medically Intense Day Treatment and Training, Adult - Staff : Consumer Ratio Of 1:1Behaviorally or Medically Intense Day Treatment and Training, Adult - Staff : Consumer Ratio Of 1:2
Behaviorally or Medically Intense Day Treatment and Training, Children (After-School) - Staff : Consumer Ratio Of 1:1
Rural Day Treatment and Training, Adult - Staff : Consumer Ratio Of 1:4.51 To 1:6.5
Rural*The Division established a separate rate for this service in the rural areas of the state. This modified rate is authorized on a program basis and has a premium over the standard rate for this service. The Qualified Vendor shall bill the Division this modified rate only after it receives authorization from the DDD Program Administrator/Manager or designee. The general guideline for authorizing the modified rate for rural areas is that the be located in an area designated as Rural by the DDD Program Administrator/Manager or desingee.
Rural Day Treatment and Training, Adult - Staff : Consumer Ratio Of 1:2.5 To 1:4.5
RebaseBook 2014 154 October 8, 2013

Arizona Department of Economic Security, Division of Developmental DisabilitiesSFY 14 Benchmark, SFY 14 Adopted Rates & Proposed ReBase
Developmental Home Services
HCPCS ServiceCode
DDD ServiceCode
Unit of Service
DistrictContractedCapacity
ActualOccupancy
Benchmark Rate
Adopted RateProposed ReBase
Developmental Home Services
T2016 HBA Day All N/A N/A $107.83 $99.32 $92.91
T2016 HBA Day All N/A N/A $111.83 $103.32 $97.16
T2016 HBA Day All N/A N/A $110.83 $102.32 $97.41
T2016 HBA Day All N/A N/A $114.83 $106.32 $101.66
T2016 HBC Day All N/A N/A $109.98 $101.31 $92.91
T2016 HBC Day All N/A N/A $113.98 $105.31 $97.16
T2016 HBC Day All N/A N/A $112.98 $104.31 $97.41
T2016 HBC Day All N/A N/A $116.98 $108.31 $101.66
DD031 RBD Day All N/A N/A $13.53 $12.85 $19.09 Room and Board, Vendor Supported Developmental Home (Child and Adult)
Unit of Service1. For the Developmental Home services, one unit of service equals one day (24 hours) of service time. A day begins at midnight and ends at 11:59 p.m. Unit of service includes transportation time spent with consumers during daily activities.
2. For Room and Board, one unit equals one day (24 hours). If the consumer is a resident at 11:59 p.m. on a given day, the Qualified Vendor may bill that day for that consumer. If the consumer is not a resident at 11:59 p.m. on a given day, the Qualified Vendor may bill that day for the consumer if the Qualified Vendor has a current authorization for service.
3. For Incontience Supplies and Nutritutional Supplements, the Qualified Vendor will be paid these modified rates only for those residents that require them and when payment of these modified rates has been approved by the Division.
Description
Habilitation, Vendor Supported Developmental Home (Adult)
Habilitation, Vendor Supported Developmental Home (Adult) with Nutrituional SupplementHabilitation, Vendor Supported Developmental Home (Adult) with Incontienence SuppliesHabilitation, Vendor Supported Developmental Home (Adult) with Nutrituional Supplement & Incontienence Supplies
Habilitation, Vendor Supported Developmental Home (Child)
Habilitation, Vendor Supported Developmental Home (Child) with Nutrituional SupplementHabilitation, Vendor Supported Developmental Home (Child) with Incontienence SuppliesHabilitation, Vendor Supported Developmental Home (Child) with Nutrituional Supplement & Incontienence Supplies
RebaseBook 2014 155 October 8, 2013

Arizona Department of Economic Security, Division of Developmental DisabilitiesSFY 14 Benchmark, SFY 14 Adopted Rates & Proposed ReBase
Group Home Services
HCPCS ServiceCode
DDD ServiceCode
Unit of Service
SettingNumber of Bedrooms
ActualOccupancy
Benchmark Rate
Adopted RateProposed ReBase
Group Home Services*
T2016 HPD Staff Hour All N/A N/A $21.57 $17.55 $20.76
T2016 HAB Staff Hour All N/A N/A $19.39 $17.55 $20.61
* See Conversion to Daily Rates Schedule for daily rates
T2016 HAN Day All N/A N/A $357.00 $323.09 $368.57
T2016 HAN Day All N/A N/A $361.00 $327.09 $372.82
T2016 HAN Day All N/A N/A $360.00 $326.09 $373.07
T2016 HAN Day All N/A N/A $364.00 $330.09 $377.32
T2016 HAN Day All N/A N/A $428.73 $388.00 $402.84
T2016 HAN Day All N/A N/A $357.00 $323.09 $368.57
T2016 HAN Day All N/A N/A $357.00 $323.09 $368.57
T2016 HAN Day All N/A N/A $357.00 $323.09 $368.57
T2016 HAN Day All N/A N/A $489.54 $443.03 $451.83
T2016 HAN Day All N/A N/A $357.00 $323.09 $368.57
T2016 HAN Day All N/A N/A $357.00 $323.09 $368.57
T2016 HAN Day All N/A N/A $357.00 $323.09 $368.57
Habilitation, Nursing Supported Group Home - Level II with Nutritional Supplement & Incontienence Supplies
Habilitation, Nursing Supported Group Home - Level III
Habilitation, Nursing Supported Group Home - Level III with Nutritional SupplementHabilitation, Nursing Supported Group Home - Level III with Incontienence SuppliesHabilitation, Nursing Supported Group Home - Level III with Nutritional Supplement & Incontienence Supplies
Habilitation, Nursing Supported Group Home - Level II with Incontienence Supplies
Unit of Service1. For the Group Home services except for Habilitation, Nursing Supported Group Home, one unit of service equals one hour (60 minutes) of direct service time. Direct service time is the period of time spent with the consumer and can be verified by consumer attendance records and includes transportation time spent with consumers during daily activities. This unit of service is converted to a daily rate for billing purposes. Staff hours shaonly apply to the provision of service by awake staff.
2. For Habilitation, Nursing Supported Group Home, one unit of service equals one day (24 hours) of service time. A day begins at midnight and ends at 11:59 p.m. Unit of service includes transportation time spent with consumers during daily activities.
3. For Room and Board, All Group Home, one unit equals one day (24 hours). If the consumer is a resident at 11:59 p.m. on a given day, the Qualified Vendor may bill that day for that consumer. If the consumer is not a resident at 11:59 p.m. on a given day, the Qualified Vendor may bill that day for the consumer if the Qualified Vendor has a current authorization for service.
4. For Incontience Supplies and Nutritutional Supplements, the Qualified Vendor will be paid these modified rates only for those residents that require them and when payment of these modified rates has been approved by the Division.
Description
Habilitation, Community Protection and Treatment Group Home*
Habilitation, Group Home*
Habilitation, Nursing Supported Group Home - Level I
Habilitation, Nursing Supported Group Home - Level I with Nutritional SupplementHabilitation, Nursing Supported Group Home - Level I with Incontienence SuppliesHabilitation, Nursing Supported Group Home - Level I with Nutritional Supplement & Incontienence Supplies
Habilitation, Nursing Supported Group Home - Level II
Habilitation, Nursing Supported Group Home - Level II with Nutritional Supplement
RebaseBook 2014 156 October 8, 2013

Arizona Department of Economic Security, Division of Developmental DisabilitiesSFY 14 Benchmark, SFY 14 Adopted Rates & Proposed ReBase
Group Home Services
HCPCS ServiceCode
DDD ServiceCode
Unit of Service
SettingNumber of Bedrooms
ActualOccupancy
Benchmark Rate
Adopted RateProposed ReBase
Description
Room and Board, All Group HomesDD030 RRB Day 1 1 $39.96 $37.96 $43.19 DD030 RRB Day 2 1 $43.18 $41.02 $50.30 DD030 RRB Day 2 2 $25.90 $24.60 $30.54 DD030 RRB Day 3 1 $52.85 $50.21 $66.84 DD030 RRB Day 3 2 $30.69 $29.16 $38.60 DD030 RRB Day 3 3 $23.30 $22.14 $29.19 DD030 RRB Day 4 1 $57.64 $54.75 $76.75 DD030 RRB Day 4 2 $33.06 $31.41 $43.45 DD030 RRB Day 4 3 $24.87 $23.63 $32.34 DD030 RRB Day 4 4 $20.77 $19.73 $26.79
DD030 RRB Day 1 1 $35.18 $33.42 $46.61 DD030 RRB Day 2 1 $38.48 $36.56 $54.93 DD030 RRB Day 2 2 $23.55 $22.38 $32.86 DD030 RRB Day 3 1 $47.34 $44.97 $66.52 DD030 RRB Day 3 2 $27.94 $26.55 $38.44 DD030 RRB Day 3 3 $21.47 $20.40 $29.08 DD030 RRB Day 4 1 $51.45 $48.88 $81.09 DD030 RRB Day 4 2 $29.97 $28.47 $45.62 DD030 RRB Day 4 3 $22.80 $21.66 $33.80 DD030 RRB Day 4 4 $19.22 $18.26 $27.88
Rur
al
Room and Board, All Group HomesRoom and Board, All Group HomesRoom and Board, All Group HomesRoom and Board, All Group HomesRoom and Board, All Group HomesRoom and Board, All Group HomesRoom and Board, All Group HomesRoom and Board, All Group HomesRoom and Board, All Group Homes
Room and Board, All Group Homes
Urb
an
Room and Board, All Group HomesRoom and Board, All Group HomesRoom and Board, All Group HomesRoom and Board, All Group HomesRoom and Board, All Group HomesRoom and Board, All Group HomesRoom and Board, All Group HomesRoom and Board, All Group HomesRoom and Board, All Group Homes
Room and Board, All Group Homes
Urban & RuralThe Division established a separate rate for the Room & Board service in the rural areas of the state. This modified rate is authorized on a program basis and has a premium over the standard rate for this service. The Qualified Vendor shall bill the Division this modified rate only after it receives authorization from the DDD Program Administrator/Manager or designee. The general guideline for authorizing the modified rate for rural areas is that the be located in an area designated as Rural by the DDD Program Administrator/Manager or desingee.
RebaseBook 2014 157 October 8, 2013

Arizona Department of Economic Security, Division of Developmental DisabilitiesSFY 14 Benchmark, SFY 14 Adopted Rates & Proposed ReBase
Professional Services
General InformationEach Nurse, therapist and therapy assistant, as appropriate, must apply and obtain their National Provider Identification (NPI) from the Centers for Medicare and Medicaid Services (CMS). The NPI must be recorded on each claim line under the Provider of Service heading.
Qualified Vendor’s Providers of Service are required to use CPT/HCPCS codes that are within their AHCCCS registration (Category of Service). Billing CPT/HCPCS codes that are not within the AHCCCS approved category of service will cause a claim denial.
Effective for May 2013 dates of services (June 2013 claims), providers are required to submit CPT/HCPCS codes on all claim lines in the billing file. If those CPT/HCPCS codes do not match the approved AHCCCS CPT/HCPCS codes assigned to the provider of service, payment of the claim may be delayed or denied.
Unit of Service1. For Home Health Aide1.1 The basis of payment for Home Health Aide is an hourly unit of direct service time. Direct service time is the period of time spent with the consumer and verified by the consumer. When billing, the Qualified Vendor should round its direct service time to the nearest 15-minute increment, as illustrated in the examples below:- If services were provided for 65 minutes, bill for 1 hour.- If services were provided for 68 minutes, bill for 1.25 hour.- If services were provided for 50 minutes, bill for .75 hour.
2. For Nursing Services:Nursing services are provided as either: - Intermittent: Nursing Service(s) not to exceed 2 hours per visit and no more than 4 hours in one calendar day. - Continuous: Nursing Service(s) either (i) for more than 2 continuous hours in one calendar or (ii) for more than 4 hours in one calendar day.
The Division utilizes four (4) service codes to distinguish the Nursing Service provided - Intermittent service includes: Nursing, Visit (HNV); less than fifty-five (55) minutes per visit, and Nursing, Intermittent (HN9); exceeds one hour in length but will not exceed 2 hours per visit and is limited to 4 hours in one calendar day - Continuous service includes: Nursing, Continuous (HN1); nursing is needed for more than 2 continuous hours, or more than 4 hours in one calendar day. Nursing, Respite (HNR); respite service need to be provided by a skilled nurse. The maximum number of units per benefit year are 600 units. A benefit year is October 1st through September 30th.
2.1 The basis of payment for Nursing, Visit is a single visit for up to fifty-five (55) minutes of continuous service.
2.2 The basis of payment for Nursing, Intermittent and Nursing, Continuous is an hourly unit of direct service time. Direct service time is the period of time spent with the consumer and verified by the consumer.
2.3 When billing Nursing, Intermittent and Nursing Continuous services, the Qualified Vendor should round its direct service time to the nearest 15-minute increment, as illustrated in the examples below:- If services were provided for 65 minutes, bill for 1 hour.- If services were provided for 68 minutes, bill for 1.25 hour.- If services were provided for 110 minutes, bill for 1.75 hour.
2.4 If the Qualified Vendor provides nursing services for more than 2 contuous hours or more than 4 hours in one calendar day, this is considered to be Nursing, Continuous. One unit of Nursing, Continuous equals one hour of direct service. A Qualified Vendor billing for Nursing, Continuous shall bill for the appropriate number of hours of service and include the actual cumulative hours of service provided in the calendar day on the billing document as required by the Division.2.5 The Division has designated client county of residence in the state as Medically Underserved using three areas.- Services provided in Area 1 (Base Rate) will receive the service model rate.- Services provided in Area 2 will receive a 10% premium over the model rate as noted on the rate schedule.- Services provided in Area 3 will receive a 25% premium over the model rate as noted on the rate schedule
RebaseBook 2014 158 October 8, 2013

Arizona Department of Economic Security, Division of Developmental DisabilitiesSFY 14 Benchmark, SFY 14 Adopted Rates & Proposed ReBase
Professional Services
HCPCS ServiceCode
DDD ServiceCode
Unit ofService
MultipleClients
Benchmark Rate
Adopted RateProposed ReBase
Home Health AideT1021 HHA Client Hour 1 $19.01 $17.20 $25.83 T1021 HHA Client Hour 2 $11.88 $10.75 $16.14 T1021 HHA Client Hour 3 $9.51 $8.60 $12.92
Nursing, VisitG0154 HNV Visit 1 $40.57 $36.72 $67.97 G0154 HNV Visit 2 $25.36 $22.95 $42.48 G0154 HNV Visit 3 $20.29 $18.36 $33.99 G0154 HNV Visit 1 $74.77 G0154 HNV Visit 2 $46.73 G0154 HNV Visit 3 $37.39 G0154 HNV Visit 1 $84.97 G0154 HNV Visit 2 $53.11 G0154 HNV Visit 3 $42.49
Nursing, Visit, RN, Area 1Nursing, Visit, RN, Area 2Nursing, Visit, RN, Area 2Nursing, Visit, RN, Area 2
Nursing, Visit, RN, Base RateNursing, Visit, RN, Area 1Nursing, Visit, RN, Area 1
Third Pary Liability (TPL)Medicaid is the payer of last resort. It is critical that the Qualified Vendor identify any other available insurance coverage(s) for the member and bill the other insurances as primary.
It is the responsibility of the Qualified Vendor to submit claims for ALL Division authorized Medicaid services delivered to the member including services that are paid entirely by the TPL.
Upon the receipt of payment or denial by the other insurers, the Qualified Vendor submits its claim to the Division.
1. In the event the Qualified Vendor is paid by the TPL, the Qualified Vendor submits a claim to the Division reflecting the payment amount received, up to the Division’s allowed amount.
2. In the event the Qualified Vendor is denied the TPL, the Qualified Vendor submits a waiver request along with a legible copy of the Explanation of Benefits (EOB) reflecting denial of an AHCCCS approved CPT/HCPCS code from the other insurer(s).
Description
Home Health AideHome Health AideHome Health Aide
3. For Therapies:3.1 One unit of evaluation equals one visit for evaluation.
3.2 The basis of payment for this service other than evaluation is an hourly unit of direct service time. Direct service time is the period of time spent with the consumer and verified by the consumer. When billing, the Qualified Vendor should round its direct service time to the nearest 15-minute increment, as illustrated in the examples below:- If services were provided for 65 minutes, bill for 1 hour.- If services were provided for 68 minutes, bill for 1.25 hour.- If services were provided for 50 minutes, bill for 0.75 hour.
3.3 In no event will more than three consumers receive the same service with a single direct service staff person at the same time.
3.4 Clinical and Natural setting. A clinical setting includes the office or central location of the provider and generally requires the consumer to travel to the provider specifically to receive the service. A Natural setting includes the client’s home and community settings, such as a park, restaurant, child care provider, etc, in which persons without disabilities participate.
3.5 The Medically Underserved adjustment is only applied to Ongoing Therapies. The Medically Underserved adjustment will not apply to therapy evaluation services.
3.5.1 The Division has designated client county of residence in the state as Medically Underserved using three areas.- Services provided in Base Rate will receive the service model rate.- Services provided in Area 1 will receive a 10% premium over the model rate as noted on the rate schedule.- Services provided in Area 2 will receive a 25% premium over the model rate as noted on the rate schedule
Nursing, Visit, RN, Base RateNursing, Visit, RN, Base Rate
RebaseBook 2014 159 October 8, 2013

Arizona Department of Economic Security, Division of Developmental DisabilitiesSFY 14 Benchmark, SFY 14 Adopted Rates & Proposed ReBase
Professional Services
HCPCS ServiceCode
DDD ServiceCode
Unit ofService
MultipleClients
Benchmark Rate
Adopted RateProposed ReBase
Description
G0154 HNV Visit 1 $40.57 $36.72 $53.33 G0154 HNV Visit 2 $25.36 $22.95 $33.33 G0154 HNV Visit 3 $20.29 $18.36 $26.67 G0154 HNV Visit 1 $58.66 G0154 HNV Visit 2 $36.66 G0154 HNV Visit 3 $29.33 G0154 HNV Visit 1 $66.66 G0154 HNV Visit 2 $41.66 G0154 HNV Visit 3 $33.33
Nursing, IntermittentG0155 HN9 Client Hour 1 $40.57 $36.72 $70.65 G0155 HN9 Client Hour 2 $25.36 $22.95 $44.16 G0155 HN9 Client Hour 3 $20.29 $18.36 $35.33 G0155 HN9 Client Hour 1 $77.72 G0155 HN9 Client Hour 2 $48.58 G0155 HN9 Client Hour 3 $38.86 G0155 HN9 Client Hour 1 $88.31 G0155 HN9 Client Hour 2 $55.19 G0155 HN9 Client Hour 3 $44.16
G0155 HN9 Client Hour 1 $40.57 $36.72 $55.21 G0155 HN9 Client Hour 2 $25.36 $22.95 $34.51 G0155 HN9 Client Hour 3 $20.29 $18.36 $27.61 G0155 HN9 Client Hour 1 $60.73 G0155 HN9 Client Hour 2 $37.96 G0155 HN9 Client Hour 3 $30.37 G0155 HN9 Client Hour 1 $69.01 G0155 HN9 Client Hour 2 $43.13 G0155 HN9 Client Hour 3 $34.51
Nursing, ContinuousS9123S9124
HN1 Day 1 $40.57 $36.72 $53.64
S9123S9124
HN1 Day 2 $25.36 $22.95 $33.53
S9123S9124
HN1 Day 3 $20.29 $18.36 $26.82
S9123S9124
HN1 Day 1 $59.00
S9123S9124
HN1 Day 2 $36.88
S9123S9124
HN1 Day 3 $29.50
S9123S9124
HN1 Day 1 $67.05
S9123S9124
HN1 Day 2 $41.91
S9123S9124
HN1 Day 3 $33.53
Nursing, Continuous, RN, Area 1
Nursing, Continuous, RN, Area 1
Nursing, Continuous, RN, Area 2
Nursing, Continuous, RN, Area 2
Nursing, Continuous, RN, Base Rate
Nursing, Continuous, RN, Base Rate
Nursing, Continuous, RN, Base Rate
Nursing, Intermittent, RN, Area 1
Nursing, Intermittent, LPN, Area 1Nursing, Intermittent, LPN, Area 1Nursing, Intermittent, LPN, Area 2Nursing, Intermittent, LPN, Area 2
Nursing, Intermittent, RN, Area 1Nursing, Intermittent, RN, Area 2Nursing, Intermittent, RN, Area 2Nursing, Intermittent, RN, Area 2
Nursing, Visit, LPN, Base RateNursing, Visit, LPN, Base RateNursing, Visit, LPN, Base RateNursing, Visit, LPN, Area 1Nursing, Visit, LPN, Area 1Nursing, Visit, LPN, Area 1Nursing, Visit, LPN, Area 2Nursing, Visit, LPN, Area 2Nursing, Visit, LPN, Area 2
Nursing, Intermittent, LPN, Base RateNursing, Intermittent, LPN, Base RateNursing, Intermittent, LPN, Base Rate
Nursing, Continuous, RN, Area 1
Nursing, Intermittent, LPN, Area 2
Nursing, Continuous, RN, Area 2
Nursing, Intermittent, RN, Base RateNursing, Intermittent, RN, Base RateNursing, Intermittent, RN, Base RateNursing, Intermittent, RN, Area 1
Nursing, Intermittent, LPN, Area 1
RebaseBook 2014 160 October 8, 2013

Arizona Department of Economic Security, Division of Developmental DisabilitiesSFY 14 Benchmark, SFY 14 Adopted Rates & Proposed ReBase
Professional Services
HCPCS ServiceCode
DDD ServiceCode
Unit ofService
MultipleClients
Benchmark Rate
Adopted RateProposed ReBase
Description
S9123S9124
HN1 Day 1 $40.57 $36.72 $41.40
S9123S9124
HN1 Day 2 $25.36 $22.95 $25.88
S9123S9124
HN1 Day 3 $20.29 $18.36 $20.70
S9123S9124
HN1 Day 1 $45.54
S9123S9124
HN1 Day 2 $28.46
S9123S9124
HN1 Day 3 $22.77
S9123S9124
HN1 Day 1 $51.75
S9123S9124
HN1 Day 2 $32.34
S9123S9124
HN1 Day 3 $25.88
Occupational TherapyOTAOCL
Client Hour 1 $57.52 $56.83 $69.17
OTAOCL
Client Hour 2 $35.95 $35.52 $43.23
OTAOCL
Client Hour 3 $28.76 $28.42 $34.59
OTAOCL
Client Hour 1 $63.27 $57.26 $76.09
OTAOCL
Client Hour 2 $39.54 $35.79 $47.56
OTAOCL
Client Hour 3 $31.64 $28.63 $38.05
OTAOCL
Client Hour 1 $71.90 $65.07 $86.46
OTAOCL
Client Hour 2 $44.94 $40.67 $54.04
OTAOCL
Client Hour 3 $35.95 $32.54 $43.23
OTAOCL
Client Hour 1 $77.94 $70.54 $91.81
OTAOCL
Client Hour 2 $48.71 $44.09 $57.38
OTAOCL
Client Hour 3 $38.97 $35.27 $45.91
OTAOCL
Client Hour 1 $85.73 $77.59 $100.99
OTAOCL
Client Hour 2 $53.58 $48.49 $63.12
OTAOCL
Client Hour 3 $42.87 $38.80 $50.50 Mus
t Mee
t AH
CC
CS
Bill
ing
Req
uire
men
ts
Nursing, Continuous, LPN, Base Rate
Nursing, Continuous, LPN, Base Rate
Nursing, Continuous, LPN, Base Rate
Nursing, Continuous, LPN, Area 1
Nursing, Continuous, LPN, Area 1
Occupational Therapy/Early Intervention, Natural Setting, Base Rate
Occupational Therapy/Early Intervention, Natural Setting, Base Rate
Occupational Therapy/Early Intervention, Natural Setting, Base Rate
Occupational Therapy/Early Intervention, Natural Setting, Area 1
Occupational Therapy/Early Intervention, Natural Setting, Area 1
Occupational Therapy/Early Intervention, Natural Setting, Area 1
Occupational Therapy/Early Intervention, Clinical Setting, Area 1
Occupational Therapy/Early Intervention, Clinical Setting, Area 1
Occupational Therapy/Early Intervention, Clinical Setting, Area 2
Occupational Therapy/Early Intervention, Clinical Setting, Area 2
Occupational Therapy/Early Intervention, Clinical Setting, Area 2
Mus
t Mee
t AH
CC
CS
Bill
ing
Req
uire
men
ts Occupational Therapy/Early Intervention, Clinical Setting, Base Rate
Occupational Therapy/Early Intervention, Clinical Setting, Base Rate
Occupational Therapy/Early Intervention, Clinical Setting, Base Rate
Occupational Therapy/Early Intervention, Clinical Setting, Area 1
Nursing, Continuous, LPN, Area 1
Nursing, Continuous, LPN, Area 2
Nursing, Continuous, LPN, Area 2
Nursing, Continuous, LPN, Area 2
RebaseBook 2014 161 October 8, 2013

Arizona Department of Economic Security, Division of Developmental DisabilitiesSFY 14 Benchmark, SFY 14 Adopted Rates & Proposed ReBase
Professional Services
HCPCS ServiceCode
DDD ServiceCode
Unit ofService
MultipleClients
Benchmark Rate
Adopted RateProposed ReBase
Description
OTAOCL
Client Hour 1 $97.43 $88.17 $114.76
OTAOCL
Client Hour 2 $60.89 $55.11 $71.73
OTAOCL
Client Hour 3 $48.72 $44.09 $57.38
Occupational Therapy EvaluationsSee
OTA/OCLOEAOCV
Evaluation 1 $172.56 $156.17 $207.51
See OTA/OCL
OEAOCV
Evaluation 1 $192.98 $174.65 $230.15
Occupational Therapy AssistantOTAOCL
Client Hour 1 $43.86 $39.69 $48.00
OTAOCL
Client Hour 2 $27.41 $24.81 $30.00
OTAOCL
Client Hour 3 $21.93 $19.85 $24.00
OTAOCL
Client Hour 1 $48.25 $43.67 $52.80
OTAOCL
Client Hour 2 $30.16 $27.29 $33.00
OTAOCL
Client Hour 3 $24.13 $21.84 $26.40
OTAOCL
Client Hour 1 $54.83 $49.62 $60.00
OTAOCL
Client Hour 2 $34.27 $31.01 $37.50
OTAOCL
Client Hour 3 $27.42 $24.81 $30.00
OTAOCL
Client Hour 1 $60.55 $54.80 $64.14
OTAOCL
Client Hour 2 $37.84 $34.25 $40.09
OTAOCL
Client Hour 3 $30.28 $27.40 $32.07
OTAOCL
Client Hour 1 $66.61 $60.28 $70.55
OTAOCL
Client Hour 2 $41.63 $37.68 $44.09
OTAOCL
Client Hour 3 $33.31 $30.14 $35.28
OTAOCL
Client Hour 1 $75.69 $68.50 $80.18
OTAOCL
Client Hour 2 $47.31 $42.81 $50.11
OTAOCL
Client Hour 3 $37.85 $34.25 $40.09
Mus
t Mee
t A
HC
CC
S B
illin
g R
equi
rem
ents
Occupational Therapy/Early Intervention Assistant, Clinical Setting, Area 1
Occupational Therapy/Early Intervention Assistant, Clinical Setting, Area 2
Occupational Therapy/Early Intervention Evaluation, Clinical Setting
Occupational Therapy/Early Intervention Evaluation, Natural Setting
Mus
t Mee
t AH
CC
CS
Bill
ing
Req
uire
men
ts
Occupational Therapy/Early Intervention Assistant, Natural Setting, Base RateOccupational Therapy/Early Intervention Assistant, Natural Setting, Base Rate
Occupational Therapy/Early Intervention Assistant, Natural Setting, Area 1
Occupational Therapy/Early Intervention Assistant, Natural Setting, Area 2
Occupational Therapy/Early Intervention Assistant, Natural Setting, Area 2
Occupational Therapy/Early Intervention Assistant, Natural Setting, Area 2
Mus
t Mee
t AH
CC
CS
Bill
ing
Req
uire
men
ts
Occupational Therapy/Early Intervention Assistant, Clinical Setting, Base RateOccupational Therapy/Early Intervention Assistant, Clinical Setting, Base RateOccupational Therapy/Early Intervention Assistant, Clinical Setting, Base RateOccupational Therapy/Early Intervention Assistant, Clinical Setting, Area 1
Occupational Therapy/Early Intervention Assistant, Clinical Setting, Area 1
Occupational Therapy/Early Intervention Assistant, Clinical Setting, Area 2
Occupational Therapy/Early Intervention Assistant, Natural Setting, Base RateOccupational Therapy/Early Intervention Assistant, Natural Setting, Area 1
Occupational Therapy/Early Intervention Assistant, Natural Setting, Area 1
Occupational Therapy/Early Intervention Assistant, Clinical Setting, Area 2
Occupational Therapy/Early Intervention, Natural Setting, Area 2
Occupational Therapy/Early Intervention, Natural Setting, Area 2
Occupational Therapy/Early Intervention, Natural Setting, Area 2
RebaseBook 2014 162 October 8, 2013

Arizona Department of Economic Security, Division of Developmental DisabilitiesSFY 14 Benchmark, SFY 14 Adopted Rates & Proposed ReBase
Professional Services
HCPCS ServiceCode
DDD ServiceCode
Unit ofService
MultipleClients
Benchmark Rate
Adopted RateProposed ReBase
Description
Physical TherapyPTAPHL
Client Hour 1 $57.52 $56.83 $69.17
PTAPHL
Client Hour 2 $35.95 $35.52 $43.23
PTAPHL
Client Hour 3 $28.76 $28.42 $34.59
PTAPHL
Client Hour 1 $63.27 $57.26 $76.09
PTAPHL
Client Hour 2 $39.54 $35.79 $47.56
PTAPHL
Client Hour 3 $31.64 $28.63 $38.05
PTAPHL
Client Hour 1 $71.90 $65.07 $86.46
PTAPHL
Client Hour 2 $44.94 $40.67 $54.04
PTAPHL
Client Hour 3 $35.95 $32.54 $43.23
PTAPHL
Client Hour 1 $77.94 $70.54 $91.81
PTAPHL
Client Hour 2 $48.71 $44.09 $57.38
PTAPHL
Client Hour 3 $38.97 $35.27 $45.91
PTAPHL
Client Hour 1 $85.73 $77.59 $100.99
PTAPHL
Client Hour 2 $53.58 $48.49 $63.12
PTAPHL
Client Hour 3 $42.87 $38.80 $50.50
PTAPHL
Client Hour 1 $97.43 $88.17 $114.76
PTAPHL
Client Hour 2 $60.89 $55.11 $71.73
PTAPHL
Client Hour 3 $48.72 $44.09 $57.38
Physicial Therapy Evaluations
See PTA/PHL PEAPHV
Evaluation 1 $172.56 $156.17 $207.51
See PTA/PHL PEAPHV
Evaluation 1 $192.98 $174.65 $230.15
Physical Therapy AssistantPTAPHL
Client Hour 1 $43.86 $39.69 $48.00
PTAPHL
Client Hour 2 $27.41 $24.81 $30.00
PTAPHL
Client Hour 3 $21.93 $19.85 $24.00 Mus
t Mee
t A
HC
CC
S B
illin
g R
equi
rem
ents
Physical Therapy/Early Intervention Assistant, Clinical Setting, Base Rate
Physical Therapy/Early Intervention Assistant, Clinical Setting, Base Rate
Physical Therapy/Early Intervention Assistant, Clinical Setting, Base Rate
Mus
t Mee
t AH
CC
CS
Bill
ing
Req
uire
men
ts
Physical Therapy/Early Intervention, Natural Setting, Area 1
Physical Therapy/Early Intervention, Natural Setting, Area 2
Physical Therapy/Early Intervention, Natural Setting, Area 2
Mus
t Mee
t AH
CC
CS
Bill
ing
Req
uire
men
ts Physical Therapy/Early Intervention, Clinical Setting, Base Rate
Physical Therapy/Early Intervention, Clinical Setting, Base Rate
Physical Therapy/Early Intervention, Clinical Setting, Base Rate
Physical Therapy/Early Intervention, Clinical Setting, Area 1
Physical Therapy/Early Intervention, Clinical Setting, Area 1
Physicial Therapy/Early Intervention Evaluation, Clinical Setting
Physical Therapy/Early Intervention, Clinical Setting, Area 2
Physical Therapy/Early Intervention, Natural Setting, Base Rate
Physical Therapy/Early Intervention, Natural Setting, Base Rate
Physical Therapy/Early Intervention, Natural Setting, Base Rate
Physical Therapy/Early Intervention, Natural Setting, Area 1
Physical Therapy/Early Intervention, Natural Setting, Area 1
Physical Therapy/Early Intervention, Clinical Setting, Area 1
Physicial Therapy/Early Intervention Evaluation, Natural Setting
Physical Therapy/Early Intervention, Clinical Setting, Area 2
Physical Therapy/Early Intervention, Clinical Setting, Area 2
Physical Therapy/Early Intervention, Natural Setting, Area 2
RebaseBook 2014 163 October 8, 2013

Arizona Department of Economic Security, Division of Developmental DisabilitiesSFY 14 Benchmark, SFY 14 Adopted Rates & Proposed ReBase
Professional Services
HCPCS ServiceCode
DDD ServiceCode
Unit ofService
MultipleClients
Benchmark Rate
Adopted RateProposed ReBase
Description
PTAPHL
Client Hour 1 $48.25 $43.67 $52.80
PTAPHL
Client Hour 2 $30.16 $27.29 $33.00
PTAPHL
Client Hour 3 $24.13 $21.84 $26.40
PTAPHL
Client Hour 1 $54.83 $49.62 $60.00
PTAPHL
Client Hour 2 $34.27 $31.01 $37.50
PTAPHL
Client Hour 3 $27.42 $24.81 $30.00
PTAPHL
Client Hour 1 $60.55 $54.80 $64.14
PTAPHL
Client Hour 2 $37.84 $34.25 $40.09
PTAPHL
Client Hour 3 $30.28 $27.40 $32.07
PTAPHL
Client Hour 1 $66.61 $60.28 $70.55
PTAPHL
Client Hour 2 $41.63 $37.68 $44.09
PTAPHL
Client Hour 3 $33.31 $30.14 $35.28
PTAPHL
Client Hour 1 $75.69 $68.50 $80.18
PTAPHL
Client Hour 2 $47.31 $42.81 $50.11
PTAPHL
Client Hour 3 $37.85 $34.25 $40.09
Speech TherapySTASPL
Client Hour 1 $57.52 $56.83 $69.17
STASPL
Client Hour 2 $35.95 $35.52 $43.23
STASPL
Client Hour 3 $28.76 $28.42 $34.59
STASPL
Client Hour 1 $63.27 $57.26 $76.09
STASPL
Client Hour 2 $39.54 $35.79 $47.56
STASPL
Client Hour 3 $31.64 $28.63 $38.05
STASPL
Client Hour 1 $71.90 $65.07 $86.46
STASPL
Client Hour 2 $44.94 $40.67 $54.04
STASPL
Client Hour 3 $35.95 $32.54 $43.23
Mus
t Mee
t AH
CC
CS
Bill
ing
Req
uire
men
ts
Mus
t Mee
t AH
CC
CS
Bill
ing
Req
uire
men
ts
Mus
t Mee
t AH
CC
CS
Bill
ing
Req
uire
men
ts Physical Therapy/Early Intervention Assistant, Natural Setting, Base Rate
Physical Therapy/Early Intervention Assistant, Natural Setting, Area 1
Physical Therapy/Early Intervention Assistant, Natural Setting, Area 1
Physical Therapy/Early Intervention Assistant, Natural Setting, Area 1
Physical Therapy/Early Intervention Assistant, Natural Setting, Area 2
Physical Therapy/Early Intervention Assistant, Natural Setting, Area 2
Physical Therapy/Early Intervention Assistant, Natural Setting, Area 2
Physical Therapy/Early Intervention Assistant, Clinical Setting, Area 1
Physical Therapy/Early Intervention Assistant, Clinical Setting, Area 1
Physical Therapy/Early Intervention Assistant, Clinical Setting, Area 1
Physical Therapy/Early Intervention Assistant, Clinical Setting, Area 2
Physical Therapy/Early Intervention Assistant, Clinical Setting, Area 2
Physical Therapy/Early Intervention Assistant, Clinical Setting, Area 2
Physical Therapy/Early Intervention Assistant, Natural Setting, Base Rate
Speech Therapy/Early Intervention, Clinical Setting, 3 Client,Tier 2
Physical Therapy/Early Intervention Assistant, Natural Setting, Base Rate
Speech Therapy/Early Intervention, Clinical Setting, 1 Client,Base RateSpeech Therapy/Early Intervention, Clinical Setting, 2 Client,Base RateSpeech Therapy/Early Intervention, Clinical Setting, 3 Client,Base RateSpeech Therapy/Early Intervention, Clinical Setting, 1 Client,Tier 1Speech Therapy/Early Intervention, Clinical Setting, 2 Client,Tier 1Speech Therapy/Early Intervention, Clinical Setting, 3 Client,Tier 1Speech Therapy/Early Intervention, Clinical Setting, 1 Client,Tier 2Speech Therapy/Early Intervention, Clinical Setting, 2 Client,Tier 2
RebaseBook 2014 164 October 8, 2013

Arizona Department of Economic Security, Division of Developmental DisabilitiesSFY 14 Benchmark, SFY 14 Adopted Rates & Proposed ReBase
Professional Services
HCPCS ServiceCode
DDD ServiceCode
Unit ofService
MultipleClients
Benchmark Rate
Adopted RateProposed ReBase
Description
STASPL
Client Hour 1 $77.94 $70.54 $91.81
STASPL
Client Hour 2 $48.71 $44.09 $57.38
STASPL
Client Hour 3 $38.97 $35.27 $45.91
STASPL
Client Hour 1 $85.73 $77.59 $100.99
STASPL
Client Hour 2 $53.58 $48.49 $63.12
STASPL
Client Hour 3 $42.87 $38.80 $50.50
STASPL
Client Hour 1 $97.43 $88.17 $114.76
STASPL
Client Hour 2 $60.89 $55.11 $71.73
STASPL
Client Hour 3 $48.72 $44.09 $57.38
Speech Therapy Evaluations
See STA/SPL SEASPV
Evaluation 1 $172.56 $156.17 $207.51
See STA/SPL SEASPV
Evaluation 1 $192.98 $174.65 $230.15
Speech Language Pathology AssistantSTASPL
Client Hour 1 $43.86 $39.69 $48.00
STASPL
Client Hour 2 $27.41 $24.81 $30.00
STASPL
Client Hour 3 $21.93 $19.85 $24.00
STASPL
Client Hour 1 $48.25 $43.67 $52.80
STASPL
Client Hour 2 $30.16 $27.29 $33.00
STASPL
Client Hour 3 $24.13 $21.84 $26.40
STASPL
Client Hour 1 $54.83 $49.62 $60.00
STASPL
Client Hour 2 $34.27 $31.01 $37.50
STASPL
Client Hour 3 $27.42 $24.81 $30.00
STASPL
Client Hour 1 $60.55 $54.80 $64.14
STASPL
Client Hour 2 $37.84 $34.25 $40.09
STASPL
Client Hour 3 $30.28 $27.40 $32.07 Mus
t Mee
t A
HC
CC
S B
illin
g R
equi
rem
ents
Mus
t Mee
t AH
CC
CS
Bill
ing
Req
uire
men
ts Speech Language Pathology Assistant, Clinical Setting, Base Rate
Speech Language Pathology Assistant, Clinical Setting, Base Rate
Speech Language Pathology Assistant, Clinical Setting, Base Rate
Speech Language Pathology Assistant, Clinical Setting, Area 1
Speech Language Pathology Assistant, Clinical Setting, Area 1
Speech Therapy/Early Intervention Evaluation, Clinical Setting
Speech Therapy/Early Intervention Evaluation, Natural Setting
Speech Language Pathology Assistant, Clinical Setting, Area 1
Speech Language Pathology Assistant, Clinical Setting, Area 2
Speech Language Pathology Assistant, Clinical Setting, Area 2
Speech Language Pathology Assistant, Clinical Setting, Area 2
Speech Therapy/Early Intervention, Natural Setting, 2 Client,Tier 1Speech Therapy/Early Intervention, Natural Setting, 3 Client,Tier 1Speech Therapy/Early Intervention, Natural Setting, 1 Client,Tier 2Speech Therapy/Early Intervention, Natural Setting, 2 Client,Tier 2Speech Therapy/Early Intervention, Natural Setting, 3 Client,Tier 2
Speech Language Pathology Assistant, Natural Setting, Base Rate
Speech Language Pathology Assistant, Natural Setting, Base Rate
Speech Language Pathology Assistant, Natural Setting, Base Rate
Mus
t Mee
t AH
CC
CS
Bill
ing
Req
uire
men
ts
Speech Therapy/Early Intervention, Natural Setting, 1 Client,Base RateSpeech Therapy/Early Intervention, Natural Setting, 2 Client,Base RateSpeech Therapy/Early Intervention, Natural Setting, 3 Client,Base RateSpeech Therapy/Early Intervention, Natural Setting, 1 Client,Tier 1
RebaseBook 2014 165 October 8, 2013

Arizona Department of Economic Security, Division of Developmental DisabilitiesSFY 14 Benchmark, SFY 14 Adopted Rates & Proposed ReBase
Professional Services
HCPCS ServiceCode
DDD ServiceCode
Unit ofService
MultipleClients
Benchmark Rate
Adopted RateProposed ReBase
Description
STASPL
Client Hour 1 $66.61 $60.28 $70.55
STASPL
Client Hour 2 $41.63 $37.68 $44.09
STASPL
Client Hour 3 $33.31 $30.14 $35.28
STASPL
Client Hour 1 $75.69 $68.50 $80.18
STASPL
Client Hour 2 $47.31 $42.81 $50.11
STASPL
Client Hour 3 $37.85 $34.25 $40.09
Respiratory TherapyS5181 RP1 Client Hour 1 $37.01 $33.49 $45.44 S5181 RP1 Client Hour 2 $23.13 $20.93 $28.40 S5181 RP1 Client Hour 3 $18.50 $16.75 $22.72
S5181 RP1 Client Hour 1 $37.01 $33.49 $60.37 S5181 RP1 Client Hour 2 $23.13 $20.93 $37.73 S5181 RP1 Client Hour 3 $18.50 $16.75 $30.19
Mus
t Mee
t AH
CC
CS
Bill
ing
Req
uire
men
ts
Respiratory Therapy, Clinical Setting
Respiratory Therapy, Natural SettingRespiratory Therapy, Natural SettingRespiratory Therapy, Natural Setting
Speech Language Pathology Assistant, Natural Setting, Area 2
Speech Language Pathology Assistant, Natural Setting, Area 2
Respiratory Therapy, Clinical Setting
Speech Language Pathology Assistant, Natural Setting, Area 1
Speech Language Pathology Assistant, Natural Setting, Area 1
Speech Language Pathology Assistant, Natural Setting, Area 1
Speech Language Pathology Assistant, Natural Setting, Area 2
Respiratory Therapy, Clinical Setting
RebaseBook 2014 166 October 8, 2013

Arizona Department of Economic Security, Division of Developmental DisabilitiesSFY 14 Benchmark, SFY 14 Adopted Rates & Proposed ReBase
Employment Support Services
3. The basis of payment for this service is the ratio rate. To determine the appropriate billing rate, the Qualified Vendor shall: Di id (th t t l bill bl h tt d d th t d l t) b (th t t l di t i t ff h ith t t th l di h f l t t id )
Unit of Service
For Center-Based Service1. The basis of payment for this service is an hourly unit of time in which the consumer is in attendance in contact with direct service staff and verified by the consumer. Any fraction of an hour should be billed in 15-minute increments. When billing, the Qualified Vendor should round consumer attendance time to the nearest 15-minute increment, as illustrated in the examples below:1. If consumer attended for 65 minutes, bill for 1 hour.2. If consumer attended for 68 minutes, bill for 1.25 hour.3. If consumer attended for 50 minutes, bill for .75 hour.
2. Total hours for a consumer’s attendance shall not include time spent during transportation to/from the consumer’s residence.
3. Absences do not constitute a billable unit except as provided in item 4 below. An absence factor was built into the rates. The Division will not compensate Qualified Vendors for any absences. For example, if a consumer stays in the employment program for two hours, then leaves for two hours, and then returns for three hours, and all activity takes place within the same program day, total hours for this consumer shall be equal to five for that day.
4. Qualified Vendors that do not provide transportation for a particular consumer may include up to one hour per day (up to 30 minutes associated with a late arrival and up to 30 minutes associated with an early departure) if the consumer arrives after his/her scheduled arrival or leaves before his/her scheduled departure time on a given day. However, if the consumer is absent for the entire day, the Qualified Vendor may not bill any hours for that day for that consumer.
5. If a consumer permanently stops attending the Qualified Vendor’s program, then the Qualified Vendor shall notify the DDD support coordinator/supervisor and District Employment Program Specialist. The Qualified Vendor shall not bill the Division for vacancies.
For Group Supported Employment1. The basis of payment for this service is an hourly unit of time in which the consumer is in attendance in contact with direct service staff and verified by the consumer. Direct service time begins when the consumer shows up at the job site or staging area, whichever is earlier. Any fraction of an hour should be billed in 15-minute increments. When billing, the Qualified Vendor should round consumer attendance time to the nearest 15-minute increment, as illustrated in the examples below:� If services were provided for 65 minutes, bill for 1 hour.� If services were provided for 68 minutes, bill for 1.25 hour.� If services were provided for 50 minutes, bill for .75 hour.
2. Total hours for the consumer shall not include time spent during transportation to/from the consumer’s residence.
a. Divide (the total billable hours consumers attended the group supported employment) by (the total direct service staff hours with consumers present at the program, excluding hours of employment support aides); andb. Use the resulting quotient, which is the number of consumer billable hours per direct service staff hours and can be stated as “1: (result from step a.)” staff to consumer ratio, to find the appropriate staff to consumer ratio rate on the rate schedule. c. The Qualified Vendor may calculate this ratio on a daily basis using actual hours for each day or may calculate the ratio at the end of the calendar month using the actual number of hours for the entire month to determine an average ratio for the month.
RebaseBook 2014 167 October 8, 2013

Arizona Department of Economic Security, Division of Developmental DisabilitiesSFY 14 Benchmark, SFY 14 Adopted Rates & Proposed ReBase
Employment Support Services
For Individual Supported Employment1. The basis of payment for this service is an hourly unit of Qualified Vendor staff time spent directly with or specific to the consumer and verified by the consumer. A job coach/job search hour shall include activities such as:
1.1. Meetings with the consumer and/or employer;1.2. Travel time of Qualified Vendor staff to and from the consumer’s worksite; and1.3. Other tasks necessary to support the consumer to keep or obtain the job and be successful including, but not limited to, job development, career development counseling, on-the-job training, job coaching, ongoing employer contact, job search activities, mobility training, worksite analysis and report writing.
2. When billing, the Qualified Vendor should round its staff time to the nearest 15-minute increment, as illustrated in the examples below:� If activities were conducted for 65 minutes, bill for 1 hour.� If activities were conducted for 68 minutes, bill for 1.25 hour.� If activities were conducted for 50 minutes, bill for .75 hour.
3. If the consumer permanently stops participating in the Qualified Vendor’s program, then the Qualified Vendor shall notify the DDD Support Coordinator/Supervisor/designee and the District Employment Program
4. Absences do not constitute a billable unit, including late arrivals and early departures. As absence factor was built into model rates. The Division will not compensate Qualified Vendors for any absences. For example, if a consumer stays in the employment program for two hours, then leaves for two hours, and then returns for three hours, and all activity takes place within the same program day, total hours for this consumer shall be equal to five for that day.
5. If a consumer permanently stops receiving services from the Qualified Vendor, then the Qualified Vendor shall notify the DDD support coordinator/supervisor and District Employment Specialist. The Qualified Vendor shall not bill the Division for vacancies.
For example, if the number of hours attended by all consumers in a group supported employment program totaled 30 hours for a day (600 for the month), and the number of hours worked by direct service staff when consumers were present at the program (excluding employment support aide hours) totaled 6 for that day (120 for the month), then the calculation would be:� Total billable consumer hours divided by total direct service staff hours = 30 / 6 or 600 / 120 = 5.0� This program’s ratio is 1:5
For both consumers and direct service staff, units shall be recorded daily on the per consumer and per direct service staff basis, shall be expressed in terms of hours and shall be rounded to the nearest 15-minute increment, as illustrated in examples below:� If total hours for a consumer or direct service staff were equal to 3 hours and 5 minutes, round the total to 3 hours� If total hours for a consumer or direct service staff were equal to 5 hours and 24 minutes, round the total to 5.5 hours� If total hours for a consumer or direct service staff were equal to 5 hours and 48 minutes, round the total to 6 hours
Specialist. The Qualified Vendor shall not bill the Division for non-participation.
For Employment Support Aide1. The basis of payment for this service is an hourly unit of direct staff service time. Direct service time is the period of time spent by the Employment Support Aide with the consumer and verified by the consumer. When billing, the Qualified Vendor should round its direct service time to the nearest 15-minute increment, as illustrated in the examples below:� If services were provided for 65 minutes, bill for 1 hour.� If services were provided for 68 minutes, bill for 1.25 hour.� If services were provided for 50 minutes, bill for 0.75 hour.
RebaseBook 2014 168 October 8, 2013

Arizona Department of Economic Security, Division of Developmental DisabilitiesSFY 14 Benchmark, SFY 14 Adopted Rates & Proposed ReBase
Employment Support Services
HCPCS ServiceCode
DDD ServiceCode
SettingUnit ofService
Benchmark Rate
Adopted Rate
Proposed ReBase
Center-Based Employment
T2019 CBE Urban Client Hour $10.88
T2019 CBE Rural Client Hour $11.24
T2019 CBE Urban Client Hour $5.51 $4.99 $6.16
T2019 CBE Rural Client Hour $6.06 $5.48 $6.54
T2019 CBE Urban Client Hour $4.62
T2019 CBE Rural Client Hour $5.01
Group Supported Employment
T2019 GSE Urban Client Hour $18.28 $16.55 $16.35
T2019 GSE Rural Client Hour $20.98 $18.99 $17.03
T2019 GSE Urban Client Hour $12.19 $11.03 $11.79
T2019 GSE Rural Client Hour $13.99 $12.66 $12.48
T2019 GSE Urban Client Hour $8.87 $8.02 $9.52
T2019 GSE Rural Client Hour $10.20 $9.23 $10.21
Group Supported Employment - Staff : Consumer Ratio Of 1:2Group Supported Employment - Staff : Consumer Ratio Of 1:2Group Supported Employment - Staff : Consumer Ratio Of 1:3
Group Supported Employment - Staff : Consumer Ratio Of 1:4Group Supported Employment - Staff : Consumer Ratio Of 1:4G S d l
Group Supported Employment - Staff : Consumer Ratio Of 1:3
Center-Based Employment - Staff : Consumer Ratio Of 1:4.51 To 1:7.5
Center-Based Employment - Staff : Consumer Ratio Of 1:7.51 To 1:10.5
Center-Based Employment - Staff : Consumer Ratio Of 1:4.51 To 1:7.5Center-Based Employment - Staff : Consumer Ratio Of 1:7.51 To 1:10.5
Description
Center-Based Employment - Staff : Consumer Ratio Of 1:1.51 To 1:4.5Center-Based Employment - Staff : Consumer Ratio Of 1:1.51 To 1:4.5
T2019 GSE Urban Client Hour $7.09 $6.42 $8.17
T2019 GSE Rural Client Hour $8.16 $7.39 $8.87
T2019 GSE Urban Client Hour $5.91 $5.35 $7.28
T2019 GSE Rural Client Hour $6.80 $6.16 $7.99
Individual Supported EmploymentT2019 ISE Urban Staff Hour $28.04 $25.38 $41.76 T2019 ISE Rural Staff Hour $30.85 $27.92 $57.51
T2019 ISE Urban Staff Hour $28.04 $25.38 $40.63 T2019 ISE Rural Staff Hour $30.85 $27.92 $43.24
Transition to EmploymentT2019 TTE Urban Client Hour $12.19 $11.03 $10.30 T2019 TTE Rural Client Hour $13.99 $12.66 $11.13
Individual Supported Employment, Job Development
Transition to EmploymentTransition to Employment
Individual Supported Employment, Job Coaching
Group Supported Employment - Staff : Consumer Ratio Of 1:5Group Supported Employment - Staff : Consumer Ratio Of 1:5Group Supported Employment - Staff : Consumer Ratio Of 1:6Group Supported Employment - Staff : Consumer Ratio Of 1:6
Individual Supported Employment, Job Coaching
Individual Supported Employment, Job Development
RebaseBook 2014 169 October 8, 2013

Arizona Department of Economic Security, Division of Developmental DisabilitiesSFY 14 Benchmark, SFY 14 Adopted Rates & Proposed ReBase
Specialized Habilitation Services
HCPCS ServiceCode
DDD ServiceCode
Unit ofService
MultipleClients
Benchmark Rate
Adopted RateProposed ReBase
Habilitation with Music TherapyT2017 HAM Client Hour 1 $40.10 $18.58 $39.66 T2017 HAM Client Hour 2 $25.06 $11.61 $24.79 T2017 HAM Client Hour 3 $20.05 $9.29 $19.83
Habilitation, Consultation
T2017 HCM Client Hour 1 $125.00 $125.00 $124.77
T2017 HCM Client Hour 1 $140.00 $140.00 $147.97
T2017 HCM Client Hour 1 $60.00 $60.00 $59.45
T2017 HCM Client Hour 1 $60.00 $54.30 $54.85
T2017 HCB Client Hour 1 $40.00 $54.30 $54.85
Habilitation, Consultation Assessment
T2020 HCA Assessment 1 $300.00 $300.00 $297.25
Habilitation, ConsultationBoard Certified Assistant Behavior Analyst
Habilitation, ConsultationAssessment & Planning
Habilitation, ConsultationLicensed Behavior AnalystHabilitation, ConsultationBoard Certified Behavior Analyst
Habilitation with Music TherapyHabilitation with Music TherapyHabilitation with Music Therapy
Unit of Service1. The basis of payment for Habilitation with Music Therapy, Habilitation, Consultation and Habilitation, Early Childhood Autism Specilized is an hourly unit of direct service time. Direct service time is the period of time spent with the consumer and verified by the consumer. When billing, the Qualified Vendor should round its direct service time to the nearest 15-minute increment, as illustrated in the examples below:- If services were provided for 65 minutes, bill for 1 hour.- If services were provided for 68 minutes, bill for 1.25 hour.- If services were provided for 50 minutes, bill for .75 hour.
2. If the Qualified Vendor provides Habilitation with Music Therapy, Habilitaiton, Consultation and Habilitation, Early Childhood Autism Specilzed with a single direct service staff person to multiple consumers at the same time, the basis of payment for each consumer will be the total direct service time multiplied by the appropriate multiple client rate for the same unit of service. In no event will more than three consumers receive this service with a single direct service staff person at the same time.
3. For Habilitation, Consultation , the Qualified Vendor shall use the following guideline to determine the billing rate:- To bill at the "Licensed Psychologist" (Urban or Rural) rate, the direct service staff must have be a Licensed Psychologists, a Licensed Behavior Analyst with a PhD in an appropriate field or the Qualified Vendor must have a current License obtained from the Office of Behavioral Health Licensing (ADHS).
- To bill at the "Licensed Behavior Analyst" rate, the direct service staff must be currently licensed under the Arizona Board of Psychologist Examiners.
- To bill at the "Board Certified Behavior Analyst" rate, the direct service staff must be currently certified under the Behavioral Analyst Certification Board and supervised by a Licensed Behavior Analyst.
Description
Habilitation, ConsultationLicensed Psychologist - Urban Setting
Habilitation, ConsultationLicensed Psychologist - Rural Setting
RebaseBook 2014 170 October 8, 2013

Arizona Department of Economic Security, Division of Developmental DisabilitiesSFY 14 Benchmark, SFY 14 Adopted Rates & Proposed ReBase
Specialized Habilitation Services
HCPCS ServiceCode
DDD ServiceCode
Unit ofService
MultipleClients
Benchmark Rate
Adopted RateProposed ReBase
Description
Habilitation, Early Childhood Autism Specialized
T2017 ECM Client Hour 1 $60.00 $54.30 $54.85
T2017 ECB Client Hour 1 $40.00 $36.20 $42.84
T2017 ECH Client Hour 1 $20.53 $20.53 $25.38
Habilitation, Early Childhood Autism SpecializedMasters LevelHabilitation, Early Childhood Autism SpecializedBachelors LevelHabilitation, Early Childhood Autism SpecializedHourly Habilitation
RebaseBook 2014 171 October 8, 2013

Arizona Department of Economic Security, Division of Developmental DisabilitiesSFY 14 Benchmark, SFY 14 Adopted Rates & Proposed ReBase
Transportation Services
HCPCS ServiceCode
DDD ServiceCode
Location / DensityUnit ofService
Benchmark Rate
Adopted RateProposed ReBase
Day Program Related Transportation Services
A0120 TRA Urban Per Trip $9.09 $9.17 $12.85
A0120 TRA Rural Per Trip $12.13 $13.14 $21.73
Employment Related Transportation ServicesA0120 TRE Urban Per Trip $9.09 $9.32 $12.85 A0120 TRE Rural Per Trip $12.13 $13.14 $21.73
Day Program and Employment Related Modified RatesThe Division established separate exceptional transportation modified rates for "Flat Trip Rate for Regularly Scheduled Daily Transportation" and 'Employment Related Transportation." Those situations where these modified rates are used will be considered time-limited in order to seek day programs closer to a consumer’s home long term or to develop an alternative so that consumers are not transported for so much of their day. For "Flat Trip Rate for Regularly Scheduled Daily Transportation," these modified rates are capped at 50 consumers statewide annually based on the premise that these are temporary or transitional modified rates.
Rates1. Separate urban and rural rates and procedure codes are established for transportation services.
2. The “Flat Trip Rate for Regularly Scheduled Daily Transportation" (TRA) and "Employment Related Transportation" (TRE) and exceptional transportation modified rates can only be used, and shall be the only rate used, for transportation of a consumer to a day treatment program by a Qualified Vendor that is not an independent provider.
3. Separate urban and rural rates are established for the “Flat Trip Rate for Regularly Scheduled Daily Transportation.” The Qualified Vendor shall bill the Division the rural rate only after it receives authorization from the DDD Program Administrator/Manager or designee . The general guideline for authorizing the rural “Flat Trip Rate for Regularly Scheduled Daily Transportation” rate for rural areas is that the potential Day Treatment and Training client base of the program size has fewer than 20 consumers in a 40 mile radius.
4. For "Employment Related Transportation, the Qualified Vendor shall bill the Division the rural rate only when a low-density rate has been authorized for the same consumer's employment supports and services.
Unit of Service1. One unit of service equals one trip per person one way, one mile of traveled distance, or 30 minutes of waiting time.
2. Mileage reimbursement is limited to loaded mileage. Loaded mileage is the distance traveled, measured in statute miles, while a consumer is on board and being transported.
Description
Flat Trip Rate for Regularly Scheduled Daily Transportation*
Flat Trip Rate for Regularly Scheduled Daily Transportation*
* The adopted rate is higher than the benchmark rate due to an adjustment for higher mileage cost. This adjustment is temporary until further notice from the DES/DDD Assistant Director.
Employment Related Transportation*Employment Related Transportation*
* The adopted rate is higher than the benchmark rate due to an adjustment for higher mileage cost. This adjustment is temporary until further notice from the DES/DDD Assistant Director.
RebaseBook 2014 172 October 8, 2013

Arizona Department of Economic Security, Division of Developmental DisabilitiesSFY 14 Benchmark, SFY 14 Adopted Rates & Proposed ReBase
Transportation Services
HCPCS ServiceCode
DDD ServiceCode
Location / DensityUnit ofService
Benchmark Rate
Adopted RateProposed ReBase
Description
A0120 TRA Urban Per Trip $18.17 $16.44 $23.83
A0120 TRA Rural Per Trip $24.23 $21.93 $36.25
A0120 TRE Urban Per Trip $18.17 $16.44 $23.83 A0120 TRE Rural Per Trip $24.23 $21.93 $36.25
A0120 TRA Urban Per Trip $18.18 $16.45 $42.68
A0120 TRA Rural Per Trip $24.24 $21.94
A0120 TRE Urban Per Trip $18.18 $16.45 $42.68
A0120 TRE Rural Per Trip $24.24 $21.94
Extensive Distance, Flat Trip Rate for Regularly Scheduled Daily TransportationExtensive Distance, Flat Trip Rate for Regularly Scheduled Daily Transportation
Extensive Distance, Employment Related Transportation
Extensive Distance, Employment Related Transportation
Single Person Modified Rate1. This modified rate is to be used when a consumer has significant transportation needs associated with behavior needs (e.g. needs an aide to ride on the vehicle), wheelchair or other equipment needs or location and needs a single person transport.
2. The DDD Program Administer/Manager, Central Office Business Operations and Program Operations must approve the request for a single person modified rate . The request needs to include an explanation of what the consumer’s support needs are and what alternatives were explored, such as vendor calls or finding routes that the consumer can share a ride with others.
Single Person, Flat Trip Rate for Regularly Scheduled Daily TransportationSingle Person, Flat Trip Rate for Regularly Scheduled Daily Transportation
Single Person, Employment Related TransportationSingle Person, Employment Related Transportation
Extensive Distance Modified Rate1. This modified rate is to be used when a consumer must travel 25 to 90 miles one way to attend a day program.
2. The DDD program Administrator/Manager, Central Office Business Operations, and Program Operations must approve the request for an extensive distance modified rate . The request must include an explanation of all alternatives researched such as finding a day program closer to the consumer’s home, developing a new program tailored to the consumer’s needs and in their home community, etc.
RebaseBook 2014 173 October 8, 2013

RebaseBook 2014 A.1-1 October 8, 2013
RebaseBook 2014
Appendix I
Supporting Wage Data, Composition & Calculations
October 8, 2013

Appendix ISupporting Wage Data, Composition & Calculations
Service Code Key
3-Digit Code DescriptionATC Attendant CareCBE Center-Based EmploymentDTA Adult Day Treatment and TrainingDTC Day Treatment and Training, Children (After-School)DTR Day Treatment and Training, Adult - RuralDTS Day Treatment and Training, Children (Summer)ECH Habilitation, Early Childhood Autism Specialized, Hourly HabilitationECM Habilitation, Early Childhood Autism Specialized, MastersEMB Habilitation, Early Childhood Autism Specialized, BachelorsGSE Group Supported EmploymentHAB Habilitation, Group HomeHAH Habilitation, SupportHAHM Specialized Habilitation, MusicHAI Habilitation, Individually Designed Living ArrangementHAN-CNA Habilitation, Nursing Supported Group Home - CNAHAN-RN Habilitation, Nursing Supported Group Home - RNHBA Developmental Home, AdultHBC Developmental Home, ChildHCB Habilitation, Consultation (BCABA)HCM Habilitation, Consultation (Lic Psychologist, Lic Beh Analyst, BCBA)HHA Home Health AideHN1 Nursing, ContinuousHN9 Nursing, IntermittantHNR Nursing, RespiteHNV Nursing, VisitHPD Habilitation, Community Protection & Treatment, Group HomeHSK HomemakerISE Individual Supported EmploymentOTA Occupational TherapyPTA Physical TherapyRP1 Respiratory TherapyRSP Respite, Hourly & ContinuousSLP Speech Langauage Pathologist AssistantSTA Speech Therapy
RebaseBook 2014 A.1-2 October 8, 2013

Appendix ISupporting Wage Data, Composition & Calculations
Service Code Key
ATCHAHECH HSK RSP HAI HBA/HBC 2 HBA/HBC 3 HPD HAB HAN-RN 1 HAN-CNA 1
DTADTR
Current Model (Unadjusted) $9.12 $10.99 $8.09 $9.12 $12.36 $16.04 $13.97 $12.09 $10.99 NA NA $13.22
BLS Wages - Mid-Point 25th/Median UninflatedCurrent Job Mix $9.61 $11.48 $9.17 $9.61 $12.89 $16.77 $14.34 $12.85 $11.68 NA NA $13.042008 Rebase Mix $9.61 $10.99 $9.17 $9.61 $10.99 $16.77 $14.34 $10.76 $10.76 NA NA $10.762013 Rebase Mix $9.61 $10.99 $9.17 $9.61 $10.99 $16.77 $14.34 $10.76 $10.76 $31.77 $12.37 $10.76
BLS Wages - Mid-Point 25th/Median InflatedCurrent Job Mix $10.22 $12.21 $9.75 $10.22 $13.71 $17.83 $15.25 $13.66 $12.42 NA NA $13.862008 Rebase Mix $10.22 $11.68 $9.75 $10.22 $11.68 $17.83 $15.25 $11.44 $11.44 NA NA $11.442013 Rebase Mix $10.22 $11.68 $9.75 $10.22 $11.68 $17.83 $15.25 $11.44 $11.44 $33.78 $13.15 $11.44
Survey Response 4 $9.68 $9.53 $8.91 $9.55 $9.42 $16.35 $15.54 $9.50 $9.36 NA NA $9.77
Percentage Inc/(Dec)2013 Inflated : Current 12.1% 6.3% 20.5% 12.1% -5.5% 11.2% 9.1% -5.4% 4.1% -13.5%2013 Inflated : Survey 5.6% 22.6% 9.3% 7.1% 24.1% 9.0% -1.9% 20.4% 22.1% 17.1%
DTCDTS
HNV, HN9
HN1, HNR 5
(Mixed)
HNV, HN9
HN1, HNR 5
(RN)
HNV, HN9
HN1, HNR 5
(LPN)
OTAPTASTA RP1 1 SLP 6 HHA 1 CBE TTE GSE ISE
Current Model (Unadjusted) $13.22 $20.11 $20.11 $20.11 $32.83 $20.41 $24.62 $8.67 $11.17 NA $12.53 $14.34
BLS Wages - Mid-Point 25th/Median UninflatedCurrent Job Mix $13.04 $27.15 $31.77 $22.54 $34.46 $23.49 $25.84 $9.85 NA NA NA NA2008 Rebase Mix $10.76 $24.38 $31.77 $22.54 $34.46 $23.49 $25.84 $9.85 NA NA NA NA2013 Rebase Mix $10.76 $24.38 $31.77 $22.54 $34.46 $23.49 $16.37 $9.85 $11.02 $15.70 $11.80 $13.70
BLS Wages - Mid-Point 25th/Median InflatedCurrent Job Mix $13.86 $28.87 $33.78 $23.96 $36.63 $24.98 $27.47 $10.47 NA NA NA NA2008 Rebase Mix $11.44 $25.92 $33.78 $23.96 $36.63 $24.98 $27.47 $10.47 NA NA NA NA2013 Rebase Mix $11.44 $25.92 $33.78 $23.96 $36.63 $24.98 $17.41 $10.47 $11.71 $16.70 $12.54 $14.56
Survey Response $10.67 NA $25.86 $24.91 $34.53 NA $26.56 NA $10.27 NA $10.56 $10.81
Percentage Inc/(Dec)2013 Inflated : Current -13.5% 28.9% 68.0% 19.1% 11.6% 22.4% -29.3% 20.8% 4.9% 0.1% 1.6%2013 Inflated : Survey 7.2% 30.6% -3.8% 6.1% -34.5% 14.1% 18.8% 34.8%
1 No survey responses 4 Survey Responses reflect, "Weighted Averages, excluding Outliers for Employees, excluding Supervisors"2 Job Categories comprising Training Staff for Developmental Home 5 Survey results reflect RNs only3 Job Categories comprising Supervision & Monitoring Staff for Developmental Home 6 Current model wage reflects 75% of Therapy wage data
RebaseBook 2014 A.1-3 October 8, 2013

Appendix ISupporting Wage Data, Composition & Calculations
Service Code Key
HAHM
HCM
Psychologist 1
HCM
Lic. Beh. Ana 1
HCM
BCBA 1 HCB 1 ECM 1 ECB 1
Current Model (Unadjusted) $20.53 NA NA NA NA NA NA
BLS Wages - Mid-Point 25th/Median UninflatedCurrent Job Mix $17.95 NA NA NA NA NA NA2008 Rebase Mix $18.55 NA NA NA NA NA NA2013 Rebase Mix $18.55 $57.34 $25.03 $25.03 $19.28 $25.03 $19.28
BLS Wages - Mid-Point 25th/Median InflatedCurrent Job Mix $19.09 NA NA NA NA NA NA2008 Rebase Mix $19.72 NA NA NA NA NA NA2013 Rebase Mix $19.72 $60.97 $26.61 $26.61 $20.50 $26.61 $20.50
Survey Response $13.15 NA NA NA NA NA NA
Percentage Inc/(Dec)2013 Inflated : Current -3.9%2013 Inflated : Survey 50.0%
1 No survey responses
RebaseBook 2014 A.1-4 October 8, 2013
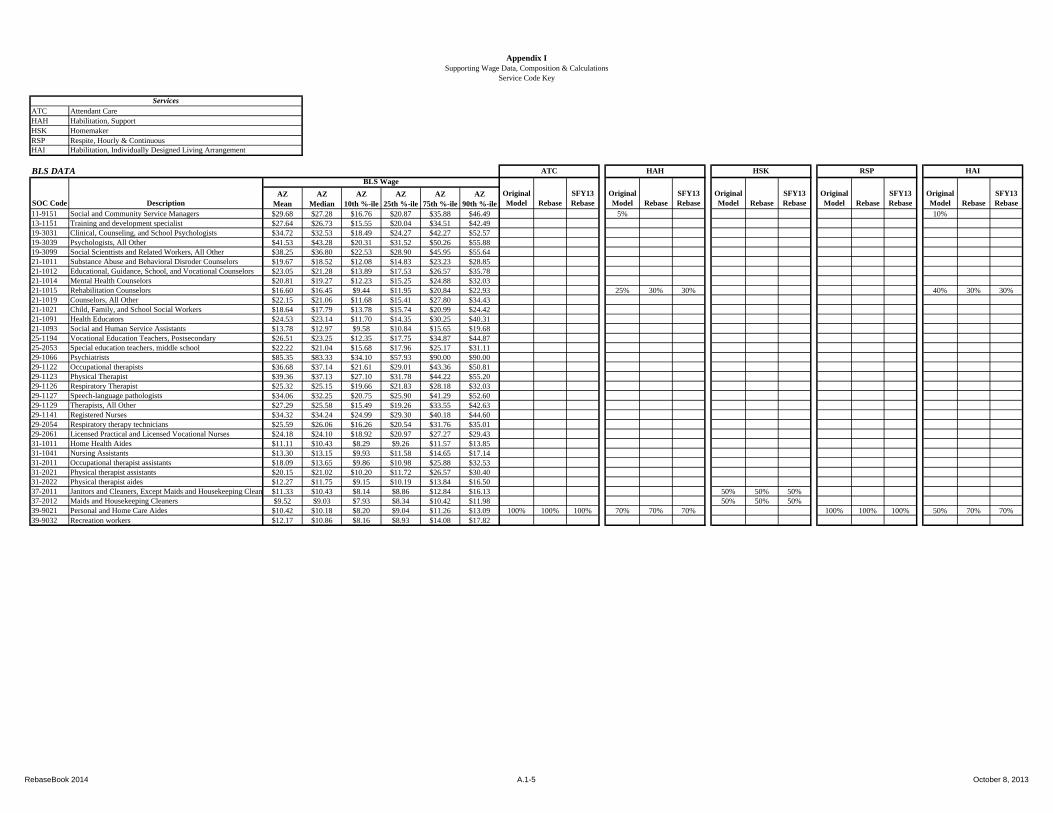
Appendix ISupporting Wage Data, Composition & Calculations
Service Code Key
ATCHAHHSKRSPHAI
AZMean
AZMedian
AZ10th %-ile
AZ25th %-ile
AZ75th %-ile
AZ90th %-ile
11-9151 Social and Community Service Managers $29.68 $27.28 $16.76 $20.87 $35.88 $46.49 5% 10%13-1151 Training and development specialist $27.64 $26.73 $15.55 $20.04 $34.51 $42.4919-3031 Clinical, Counseling, and School Psychologists $34.72 $32.53 $18.49 $24.27 $42.27 $52.5719-3039 Psychologists, All Other $41.53 $43.28 $20.31 $31.52 $50.26 $55.8819-3099 Social Scienttists and Related Workers, All Other $38.25 $36.80 $22.53 $28.90 $45.95 $55.6421-1011 Substance Abuse and Behavioral Disroder Counselors $19.67 $18.52 $12.08 $14.83 $23.23 $28.8521-1012 Educational, Guidance, School, and Vocational Counselors $23.05 $21.28 $13.89 $17.53 $26.57 $35.7821-1014 Mental Health Counselors $20.81 $19.27 $12.23 $15.25 $24.88 $32.0321-1015 Rehabilitation Counselors $16.60 $16.45 $9.44 $11.95 $20.84 $22.93 25% 30% 30% 40% 30% 30%21-1019 Counselors, All Other $22.15 $21.06 $11.68 $15.41 $27.80 $34.4321-1021 Child, Family, and School Social Workers $18.64 $17.79 $13.78 $15.74 $20.99 $24.4221-1091 Health Educators $24.53 $23.14 $11.70 $14.35 $30.25 $40.3121-1093 Social and Human Service Assistants $13.78 $12.97 $9.58 $10.84 $15.65 $19.6825-1194 Vocational Education Teachers, Postsecondary $26.51 $23.25 $12.35 $17.75 $34.87 $44.8725-2053 Special education teachers, middle school $22.22 $21.04 $15.68 $17.96 $25.17 $31.1129-1066 Psychiatrists $85.35 $83.33 $34.10 $57.93 $90.00 $90.0029-1122 Occupational therapists $36.68 $37.14 $21.61 $29.01 $43.36 $50.8129-1123 Physical Therapist $39.36 $37.13 $27.10 $31.78 $44.22 $55.2029-1126 Respiratory Therapist $25.32 $25.15 $19.66 $21.83 $28.18 $32.0329-1127 Speech-language pathologists $34.06 $32.25 $20.75 $25.90 $41.29 $52.6029-1129 Therapists, All Other $27.29 $25.58 $15.49 $19.26 $33.55 $42.6329-1141 Registered Nurses $34.32 $34.24 $24.99 $29.30 $40.18 $44.6029-2054 Respiratory therapy technicians $25.59 $26.06 $16.26 $20.54 $31.76 $35.0129-2061 Licensed Practical and Licensed Vocational Nurses $24.18 $24.10 $18.92 $20.97 $27.27 $29.4331-1011 Home Health Aides $11.11 $10.43 $8.29 $9.26 $11.57 $13.8531-1041 Nursing Assistants $13.30 $13.15 $9.93 $11.58 $14.65 $17.1431-2011 Occupational therapist assistants $18.09 $13.65 $9.86 $10.98 $25.88 $32.5331-2021 Physical therapist assistants $20.15 $21.02 $10.20 $11.72 $26.57 $30.4031-2022 Physical therapist aides $12.27 $11.75 $9.15 $10.19 $13.84 $16.5037-2011 Janitors and Cleaners, Except Maids and Housekeeping Clean $11.33 $10.43 $8.14 $8.86 $12.84 $16.13 50% 50% 50%37-2012 Maids and Housekeeping Cleaners $9.52 $9.03 $7.93 $8.34 $10.42 $11.98 50% 50% 50%39-9021 Personal and Home Care Aides $10.42 $10.18 $8.20 $9.04 $11.26 $13.09 100% 100% 100% 70% 70% 70% 100% 100% 100% 50% 70% 70%39-9032 Recreation workers $12.17 $10.86 $8.16 $8.93 $14.08 $17.82
RSP HAIBLS DATA ATC HAH HSK
Rebase Rebase RebaseOriginal Model
SFY13 Rebase
Original Model RebaseSOC Code
SFY13 Rebase
SFY13 Rebase
SFY13 Rebase
BLS Wage
RebaseSFY13 RebaseDescription
Original Model
Original Model
Services
Habilitation, Individually Designed Living Arrangement
Attendant Care
HomemakerHabilitation, Support
Respite, Hourly & Continuous
Original Model
RebaseBook 2014 A.1-5 October 8, 2013

Appendix ISupporting Wage Data, Composition & Calculations
Service Code Key
HBAHBCHPDHABHAN-RN
AZMean
AZMedian
AZ10th %-ile
AZ25th %-ile
AZ75th %-ile
AZ90th %-ile
11-9151 Social and Community Service Managers $29.68 $27.28 $16.76 $20.87 $35.88 $46.49 5.5% 5%13-1151 Training and development specialist $27.64 $26.73 $15.55 $20.04 $34.51 $42.4919-3031 Clinical, Counseling, and School Psychologists $34.72 $32.53 $18.49 $24.27 $42.27 $52.5719-3039 Psychologists, All Other $41.53 $43.28 $20.31 $31.52 $50.26 $55.8819-3099 Social Scienttists and Related Workers, All Other $38.25 $36.80 $22.53 $28.90 $45.95 $55.6421-1011 Substance Abuse and Behavioral Disroder Counselors $19.67 $18.52 $12.08 $14.83 $23.23 $28.8521-1012 Educational, Guidance, School, and Vocational Counselors $23.05 $21.28 $13.89 $17.53 $26.57 $35.7821-1014 Mental Health Counselors $20.81 $19.27 $12.23 $15.25 $24.88 $32.0321-1015 Rehabilitation Counselors $16.60 $16.45 $9.44 $11.95 $20.84 $22.93 27.5% 20% 20.0% 25% 20% 20%21-1019 Counselors, All Other $22.15 $21.06 $11.68 $15.41 $27.80 $34.4321-1021 Child, Family, and School Social Workers $18.64 $17.79 $13.78 $15.74 $20.99 $24.42 100% 100% 100% 50% 50% 50%21-1091 Health Educators $24.53 $23.14 $11.70 $14.35 $30.25 $40.3121-1093 Social and Human Service Assistants $13.78 $12.97 $9.58 $10.84 $15.65 $19.68 50% 50% 50%25-1194 Vocational Education Teachers, Postsecondary $26.51 $23.25 $12.35 $17.75 $34.87 $44.8725-2053 Special education teachers, middle school $22.22 $21.04 $15.68 $17.96 $25.17 $31.1129-1066 Psychiatrists $85.35 $83.33 $34.10 $57.93 $90.00 $90.0029-1122 Occupational therapists $36.68 $37.14 $21.61 $29.01 $43.36 $50.8129-1123 Physical Therapist $39.36 $37.13 $27.10 $31.78 $44.22 $55.2029-1126 Respiratory Therapist $25.32 $25.15 $19.66 $21.83 $28.18 $32.0329-1127 Speech-language pathologists $34.06 $32.25 $20.75 $25.90 $41.29 $52.6029-1129 Therapists, All Other $27.29 $25.58 $15.49 $19.26 $33.55 $42.6329-1141 Registered Nurses $34.32 $34.24 $24.99 $29.30 $40.18 $44.60 100%29-2054 Respiratory therapy technicians $25.59 $26.06 $16.26 $20.54 $31.76 $35.0129-2061 Licensed Practical and Licensed Vocational Nurses $24.18 $24.10 $18.92 $20.97 $27.27 $29.4331-1011 Home Health Aides $11.11 $10.43 $8.29 $9.26 $11.57 $13.8531-1041 Nursing Assistants $13.30 $13.15 $9.93 $11.58 $14.65 $17.1431-2011 Occupational therapist assistants $18.09 $13.65 $9.86 $10.98 $25.88 $32.5331-2021 Physical therapist assistants $20.15 $21.02 $10.20 $11.72 $26.57 $30.4031-2022 Physical therapist aides $12.27 $11.75 $9.15 $10.19 $13.84 $16.5037-2011 Janitors and Cleaners, Except Maids and Housekeeping Clean $11.33 $10.43 $8.14 $8.86 $12.84 $16.1337-2012 Maids and Housekeeping Cleaners $9.52 $9.03 $7.93 $8.34 $10.42 $11.9839-9021 Personal and Home Care Aides $10.42 $10.18 $8.20 $9.04 $11.26 $13.0939-9032 Recreation workers $12.17 $10.86 $8.16 $8.93 $14.08 $17.82 77.0% 80% 80.0% 70% 80% 80%
HAN-RN
RebaseDescriptionOriginal Model Rebase
Original Model
HPD HAB
Original Model
SFY13 Rebase
Developmental Home, ChildHabilitation, Comm. Prot. & Treat., Group HomeHabilitation, Group Home
2 Job Categories comprising Supervision & Monitoring Staff for Developmental Home
Original Model
HBA/HBC2HBA/HBC1
SFY13 Rebase
1 Job Categories comprising Training Staff for Developmental Home
BLS DATA
SOC Code RebaseSFY13 Rebase
Original Model
SFY13 Rebase
BLS Wage
3 Factor(s) not published in SFY08 ReBase Book
Rebase 3
ServicesDevelopmental Home, Adult
Habilitation, Nursing Supp. Group Home (RN Staff)
RebaseSFY13 Rebase
RebaseBook 2014 A.1-6 October 8, 2013

Appendix ISupporting Wage Data, Composition & Calculations
Service Code Key
HAN-CNADTADTSHNVHN9HN1HNR
AZMean
AZMedian
AZ10th %-ile
AZ25th %-ile
AZ75th %-ile
AZ90th %-ile
11-9151 Social and Community Service Managers $29.68 $27.28 $16.76 $20.87 $35.88 $46.49 10% 10%13-1151 Training and development specialist $27.64 $26.73 $15.55 $20.04 $34.51 $42.4919-3031 Clinical, Counseling, and School Psychologists $34.72 $32.53 $18.49 $24.27 $42.27 $52.5719-3039 Psychologists, All Other $41.53 $43.28 $20.31 $31.52 $50.26 $55.8819-3099 Social Scienttists and Related Workers, All Other $38.25 $36.80 $22.53 $28.90 $45.95 $55.6421-1011 Substance Abuse and Behavioral Disroder Counselors $19.67 $18.52 $12.08 $14.83 $23.23 $28.8521-1012 Educational, Guidance, School, and Vocational Counselors $23.05 $21.28 $13.89 $17.53 $26.57 $35.7821-1014 Mental Health Counselors $20.81 $19.27 $12.23 $15.25 $24.88 $32.0321-1015 Rehabilitation Counselors $16.60 $16.45 $9.44 $11.95 $20.84 $22.93 40% 20% 20% 40% 20% 20%21-1019 Counselors, All Other $22.15 $21.06 $11.68 $15.41 $27.80 $34.4321-1021 Child, Family, and School Social Workers $18.64 $17.79 $13.78 $15.74 $20.99 $24.4221-1091 Health Educators $24.53 $23.14 $11.70 $14.35 $30.25 $40.3121-1093 Social and Human Service Assistants $13.78 $12.97 $9.58 $10.84 $15.65 $19.6825-1194 Vocational Education Teachers, Postsecondary $26.51 $23.25 $12.35 $17.75 $34.87 $44.8725-2053 Special education teachers, middle school $22.22 $21.04 $15.68 $17.96 $25.17 $31.1129-1066 Psychiatrists $85.35 $83.33 $34.10 $57.93 $90.00 $90.0029-1122 Occupational therapists $36.68 $37.14 $21.61 $29.01 $43.36 $50.8129-1123 Physical Therapist $39.36 $37.13 $27.10 $31.78 $44.22 $55.2029-1126 Respiratory Therapist $25.32 $25.15 $19.66 $21.83 $28.18 $32.0329-1127 Speech-language pathologists $34.06 $32.25 $20.75 $25.90 $41.29 $52.6029-1129 Therapists, All Other $27.29 $25.58 $15.49 $19.26 $33.55 $42.6329-1141 Registered Nurses $34.32 $34.24 $24.99 $29.30 $40.18 $44.60 50% 20% 20% 100% 100% 100%29-2054 Respiratory therapy technicians $25.59 $26.06 $16.26 $20.54 $31.76 $35.0129-2061 Licensed Practical and Licensed Vocational Nurses $24.18 $24.10 $18.92 $20.97 $27.27 $29.43 50% 80% 80%31-1011 Home Health Aides $11.11 $10.43 $8.29 $9.26 $11.57 $13.8531-1041 Nursing Assistants $13.30 $13.15 $9.93 $11.58 $14.65 $17.14 100%31-2011 Occupational therapist assistants $18.09 $13.65 $9.86 $10.98 $25.88 $32.5331-2021 Physical therapist assistants $20.15 $21.02 $10.20 $11.72 $26.57 $30.4031-2022 Physical therapist aides $12.27 $11.75 $9.15 $10.19 $13.84 $16.5037-2011 Janitors and Cleaners, Except Maids and Housekeeping Clean $11.33 $10.43 $8.14 $8.86 $12.84 $16.1337-2012 Maids and Housekeeping Cleaners $9.52 $9.03 $7.93 $8.34 $10.42 $11.9839-9021 Personal and Home Care Aides $10.42 $10.18 $8.20 $9.04 $11.26 $13.0939-9032 Recreation workers $12.17 $10.86 $8.16 $8.93 $14.08 $17.82 50% 80% 80% 50% 80% 80%
Nursing, Respite
Rebase
Habilitation, Nursing Supp. Group Home (CNA Staff)
Description Rebase
HNV, HN9, HN1 & HNR(RN)
Nursing, IntermittantNursing, Continuous
Day Treatment & Training, AdultDay Treatment & Training, Child (After-School & Summer)Nursing, Visit
BLS Wage
HAN-CNA
Original Model
Services
DTA/DTR
RebaseSFY13 Rebase
Original Model Rebase
SFY13 Rebase
SFY13 Rebase
BLS DATA
RebaseOriginal Model
DTS/DTC
SFY13 Rebase
Original Model
HNV, HN9, HN1 & HNR(Mixed)
Original ModelSOC Code
SFY13 Rebase
RebaseBook 2014 A.1-7 October 8, 2013

Appendix ISupporting Wage Data, Composition & Calculations
Service Code Key
HNV PTAHN9 STAHN1 RP1HNR SLPOTA HHA
AZMean
AZMedian
AZ10th %-ile
AZ25th %-ile
AZ75th %-ile
AZ90th %-ile
11-9151 Social and Community Service Managers $29.68 $27.28 $16.76 $20.87 $35.88 $46.4913-1151 Training and development specialist $27.64 $26.73 $15.55 $20.04 $34.51 $42.4919-3031 Clinical, Counseling, and School Psychologists $34.72 $32.53 $18.49 $24.27 $42.27 $52.5719-3039 Psychologists, All Other $41.53 $43.28 $20.31 $31.52 $50.26 $55.8819-3099 Social Scienttists and Related Workers, All Other $38.25 $36.80 $22.53 $28.90 $45.95 $55.6421-1011 Substance Abuse and Behavioral Disroder Counselors $19.67 $18.52 $12.08 $14.83 $23.23 $28.8521-1012 Educational, Guidance, School, and Vocational Counselors $23.05 $21.28 $13.89 $17.53 $26.57 $35.7821-1014 Mental Health Counselors $20.81 $19.27 $12.23 $15.25 $24.88 $32.0321-1015 Rehabilitation Counselors $16.60 $16.45 $9.44 $11.95 $20.84 $22.9321-1019 Counselors, All Other $22.15 $21.06 $11.68 $15.41 $27.80 $34.4321-1021 Child, Family, and School Social Workers $18.64 $17.79 $13.78 $15.74 $20.99 $24.4221-1091 Health Educators $24.53 $23.14 $11.70 $14.35 $30.25 $40.3121-1093 Social and Human Service Assistants $13.78 $12.97 $9.58 $10.84 $15.65 $19.6825-1194 Vocational Education Teachers, Postsecondary $26.51 $23.25 $12.35 $17.75 $34.87 $44.8725-2053 Special education teachers, middle school $22.22 $21.04 $15.68 $17.96 $25.17 $31.1129-1066 Psychiatrists $85.35 $83.33 $34.10 $57.93 $90.00 $90.0029-1122 Occupational therapists $36.68 $37.14 $21.61 $29.01 $43.36 $50.8129-1123 Physical Therapist $39.36 $37.13 $27.10 $31.78 $44.22 $55.20 100% 100% 100% 75% 75%29-1126 Respiratory Therapist $25.32 $25.15 $19.66 $21.83 $28.18 $32.03 100% 100% 100%29-1127 Speech-language pathologists $34.06 $32.25 $20.75 $25.90 $41.29 $52.6029-1129 Therapists, All Other $27.29 $25.58 $15.49 $19.26 $33.55 $42.6329-1141 Registered Nurses $34.32 $34.24 $24.99 $29.30 $40.18 $44.6029-2054 Respiratory therapy technicians $25.59 $26.06 $16.26 $20.54 $31.76 $35.0129-2061 Licensed Practical and Licensed Vocational Nurses $24.18 $24.10 $18.92 $20.97 $27.27 $29.43 100% 100% 100%31-1011 Home Health Aides $11.11 $10.43 $8.29 $9.26 $11.57 $13.85 100% 100% 100%31-1041 Nursing Assistants $13.30 $13.15 $9.93 $11.58 $14.65 $17.1431-2011 Occupational therapist assistants $18.09 $13.65 $9.86 $10.98 $25.88 $32.5331-2021 Physical therapist assistants $20.15 $21.02 $10.20 $11.72 $26.57 $30.40 100%31-2022 Physical therapist aides $12.27 $11.75 $9.15 $10.19 $13.84 $16.5037-2011 Janitors and Cleaners, Except Maids and Housekeeping Clean $11.33 $10.43 $8.14 $8.86 $12.84 $16.1337-2012 Maids and Housekeeping Cleaners $9.52 $9.03 $7.93 $8.34 $10.42 $11.9839-9021 Personal and Home Care Aides $10.42 $10.18 $8.20 $9.04 $11.26 $13.0939-9032 Recreation workers $12.17 $10.86 $8.16 $8.93 $14.08 $17.82
Physical TherapySpeech TherapyRespiratory TherapySpeech Language Pathology Assistant
Services
Nursing, Continuous
RP1OTA/PTA/STAHNV, HN9, HN1 & HNR
(LPN)
Nursing, Respite
SLP1
Home Health Aide
ServicesNursing, Visit
BLS DATA HHA
Nursing, Intermittant
Occupational Therapy
RebaseOriginal Model Rebase
Original Model Rebase
SFY13 Rebase
Original ModelSOC Code Description
Original Model Rebase
SFY13 Rebase
1 Wage reflects 75% of data available from BLS
BLS Wage
SFY13 Rebase Rebase
SFY13 Rebase
Original Model
SFY13 Rebase
RebaseBook 2014 A.1-8 October 8, 2013

Appendix ISupporting Wage Data, Composition & Calculations
Service Code Key
CBETTEGSEISEHAHM
AZMean
AZMedian
AZ10th %-ile
AZ25th %-ile
AZ75th %-ile
AZ90th %-ile
11-9151 Social and Community Service Managers $29.68 $27.28 $16.76 $20.87 $35.88 $46.4913-1151 Training and development specialist $27.64 $26.73 $15.55 $20.04 $34.51 $42.4919-3031 Clinical, Counseling, and School Psychologists $34.72 $32.53 $18.49 $24.27 $42.27 $52.5719-3039 Psychologists, All Other $41.53 $43.28 $20.31 $31.52 $50.26 $55.8819-3099 Social Scienttists and Related Workers, All Other $38.25 $36.80 $22.53 $28.90 $45.95 $55.6421-1011 Substance Abuse and Behavioral Disroder Counselors $19.67 $18.52 $12.08 $14.83 $23.23 $28.8521-1012 Educational, Guidance, School, and Vocational Counselors $23.05 $21.28 $13.89 $17.53 $26.57 $35.78 5% 20% 40%21-1014 Mental Health Counselors $20.81 $19.27 $12.23 $15.25 $24.88 $32.0321-1015 Rehabilitation Counselors $16.60 $16.45 $9.44 $11.95 $20.84 $22.93 15%21-1019 Counselors, All Other $22.15 $21.06 $11.68 $15.41 $27.80 $34.4321-1021 Child, Family, and School Social Workers $18.64 $17.79 $13.78 $15.74 $20.99 $24.42 40% 10% 10%21-1091 Health Educators $24.53 $23.14 $11.70 $14.35 $30.25 $40.31 60% 90% 90%21-1093 Social and Human Service Assistants $13.78 $12.97 $9.58 $10.84 $15.65 $19.68 50%25-1194 Vocational Education Teachers, Postsecondary $26.51 $23.25 $12.35 $17.75 $34.87 $44.8725-2053 Special education teachers, middle school $22.22 $21.04 $15.68 $17.96 $25.17 $31.11 50%29-1066 Psychiatrists $85.35 $83.33 $34.10 $57.93 $90.00 $90.0029-1122 Occupational therapists $36.68 $37.14 $21.61 $29.01 $43.36 $50.8129-1123 Physical Therapist $39.36 $37.13 $27.10 $31.78 $44.22 $55.2029-1126 Respiratory Therapist $25.32 $25.15 $19.66 $21.83 $28.18 $32.0329-1127 Speech-language pathologists $34.06 $32.25 $20.75 $25.90 $41.29 $52.6029-1129 Therapists, All Other $27.29 $25.58 $15.49 $19.26 $33.55 $42.6329-1141 Registered Nurses $34.32 $34.24 $24.99 $29.30 $40.18 $44.6029-2054 Respiratory therapy technicians $25.59 $26.06 $16.26 $20.54 $31.76 $35.0129-2061 Licensed Practical and Licensed Vocational Nurses $24.18 $24.10 $18.92 $20.97 $27.27 $29.4331-1011 Home Health Aides $11.11 $10.43 $8.29 $9.26 $11.57 $13.8531-1041 Nursing Assistants $13.30 $13.15 $9.93 $11.58 $14.65 $17.1431-2011 Occupational therapist assistants $18.09 $13.65 $9.86 $10.98 $25.88 $32.5331-2021 Physical therapist assistants $20.15 $21.02 $10.20 $11.72 $26.57 $30.4031-2022 Physical therapist aides $12.27 $11.75 $9.15 $10.19 $13.84 $16.5037-2011 Janitors and Cleaners, Except Maids and Housekeeping Clean $11.33 $10.43 $8.14 $8.86 $12.84 $16.1337-2012 Maids and Housekeeping Cleaners $9.52 $9.03 $7.93 $8.34 $10.42 $11.9839-9021 Personal and Home Care Aides $10.42 $10.18 $8.20 $9.04 $11.26 $13.0939-9032 Recreation workers $12.17 $10.86 $8.16 $8.93 $14.08 $17.82 80% 80% 60%
ServicesCenter-Based EmploymentTransition to Employment
SFY13 Rebase
Original Model Rebase
TTE GSE
Original Model Rebase Rebase
Original ModelSOC Code Description
BLS Wage
Habilitation with Music TherapyIndividual Supported Employment
HAHM
Group Supported Employment
SFY13 Rebase
Original Model Rebase
ISE
SFY13 Rebase
Original Model Rebase
SFY13 Rebase
BLS DATA CBE
SFY13 Rebase
RebaseBook 2014 A.1-9 October 8, 2013

Appendix ISupporting Wage Data, Composition & Calculations
Service Code Key
HCMHCMHCMHCBECM
AZMean
AZMedian
AZ10th %-ile
AZ25th %-ile
AZ75th %-ile
AZ90th %-ile
11-9151 Social and Community Service Managers $29.68 $27.28 $16.76 $20.87 $35.88 $46.4913-1151 Training and development specialist $27.64 $26.73 $15.55 $20.04 $34.51 $42.4919-3031 Clinical, Counseling, and School Psychologists $34.72 $32.53 $18.49 $24.27 $42.27 $52.5719-3039 Psychologists, All Other $41.53 $43.28 $20.31 $31.52 $50.26 $55.88 40%19-3099 Social Scienttists and Related Workers, All Other $38.25 $36.80 $22.53 $28.90 $45.95 $55.64 25% 25% 25%21-1011 Substance Abuse and Behavioral Disroder Counselors $19.67 $18.52 $12.08 $14.83 $23.23 $28.8521-1012 Educational, Guidance, School, and Vocational Counselors $23.05 $21.28 $13.89 $17.53 $26.57 $35.7821-1014 Mental Health Counselors $20.81 $19.27 $12.23 $15.25 $24.88 $32.0321-1015 Rehabilitation Counselors $16.60 $16.45 $9.44 $11.95 $20.84 $22.9321-1019 Counselors, All Other $22.15 $21.06 $11.68 $15.41 $27.80 $34.43 75%21-1021 Child, Family, and School Social Workers $18.64 $17.79 $13.78 $15.74 $20.99 $24.4221-1091 Health Educators $24.53 $23.14 $11.70 $14.35 $30.25 $40.3121-1093 Social and Human Service Assistants $13.78 $12.97 $9.58 $10.84 $15.65 $19.6825-1194 Vocational Education Teachers, Postsecondary $26.51 $23.25 $12.35 $17.75 $34.87 $44.8725-2053 Special education teachers, middle school $22.22 $21.04 $15.68 $17.96 $25.17 $31.1129-1066 Psychiatrists $85.35 $83.33 $34.10 $57.93 $90.00 $90.00 60%29-1122 Occupational therapists $36.68 $37.14 $21.61 $29.01 $43.36 $50.8129-1123 Physical Therapist $39.36 $37.13 $27.10 $31.78 $44.22 $55.2029-1126 Respiratory Therapist $25.32 $25.15 $19.66 $21.83 $28.18 $32.0329-1127 Speech-language pathologists $34.06 $32.25 $20.75 $25.90 $41.29 $52.6029-1129 Therapists, All Other $27.29 $25.58 $15.49 $19.26 $33.55 $42.63 75% 75% 25% 75%29-1141 Registered Nurses $34.32 $34.24 $24.99 $29.30 $40.18 $44.6029-2054 Respiratory therapy technicians $25.59 $26.06 $16.26 $20.54 $31.76 $35.0129-2061 Licensed Practical and Licensed Vocational Nurses $24.18 $24.10 $18.92 $20.97 $27.27 $29.4331-1011 Home Health Aides $11.11 $10.43 $8.29 $9.26 $11.57 $13.8531-1041 Nursing Assistants $13.30 $13.15 $9.93 $11.58 $14.65 $17.1431-2011 Occupational therapist assistants $18.09 $13.65 $9.86 $10.98 $25.88 $32.5331-2021 Physical therapist assistants $20.15 $21.02 $10.20 $11.72 $26.57 $30.4031-2022 Physical therapist aides $12.27 $11.75 $9.15 $10.19 $13.84 $16.5037-2011 Janitors and Cleaners, Except Maids and Housekeeping Clean $11.33 $10.43 $8.14 $8.86 $12.84 $16.1337-2012 Maids and Housekeeping Cleaners $9.52 $9.03 $7.93 $8.34 $10.42 $11.9839-9021 Personal and Home Care Aides $10.42 $10.18 $8.20 $9.04 $11.26 $13.0939-9032 Recreation workers $12.17 $10.86 $8.16 $8.93 $14.08 $17.82
SFY13 Rebase
HCM - BCBA
ServicesHabilitation, Consultation (Licensed Psychologist)
Original Model Rebase
SFY13 Rebase
BLS DATA
SOC Code
Habilitation, Consultation (Liecnsed Behavioral Analyst)Habilitation, Consultation (BCBA)Habilitation, Consultation (BCABA)Habilitation, Early Childhood Autism (Masters)
ECM
Original Model Rebase
SFY13 Rebase
HCB
Original Model Rebase
SFY13 Rebase
HCM - Psychologist
Original Model Rebase
SFY13 Rebase
HCM - LicensedBeh Analyst
Original ModelDescription
BLS Wage
Rebase
RebaseBook 2014 A.1-10 October 8, 2013

Appendix ISupporting Wage Data, Composition & Calculations
Service Code Key
ECBECH
AZMean
AZMedian
AZ10th %-ile
AZ25th %-ile
AZ75th %-ile
AZ90th %-ile
11-9151 Social and Community Service Managers $29.68 $27.28 $16.76 $20.87 $35.88 $46.49 5%13-1151 Training and development specialist $27.64 $26.73 $15.55 $20.04 $34.51 $42.4919-3031 Clinical, Counseling, and School Psychologists $34.72 $32.53 $18.49 $24.27 $42.27 $52.5719-3039 Psychologists, All Other $41.53 $43.28 $20.31 $31.52 $50.26 $55.8819-3099 Social Scienttists and Related Workers, All Other $38.25 $36.80 $22.53 $28.90 $45.95 $55.6421-1011 Substance Abuse and Behavioral Disroder Counselors $19.67 $18.52 $12.08 $14.83 $23.23 $28.8521-1012 Educational, Guidance, School, and Vocational Counselors $23.05 $21.28 $13.89 $17.53 $26.57 $35.7821-1014 Mental Health Counselors $20.81 $19.27 $12.23 $15.25 $24.88 $32.0321-1015 Rehabilitation Counselors $16.60 $16.45 $9.44 $11.95 $20.84 $22.93 25% 30% 30%21-1019 Counselors, All Other $22.15 $21.06 $11.68 $15.41 $27.80 $34.43 75%21-1021 Child, Family, and School Social Workers $18.64 $17.79 $13.78 $15.74 $20.99 $24.4221-1091 Health Educators $24.53 $23.14 $11.70 $14.35 $30.25 $40.3121-1093 Social and Human Service Assistants $13.78 $12.97 $9.58 $10.84 $15.65 $19.6825-1194 Vocational Education Teachers, Postsecondary $26.51 $23.25 $12.35 $17.75 $34.87 $44.8725-2053 Special education teachers, middle school $22.22 $21.04 $15.68 $17.96 $25.17 $31.1129-1066 Psychiatrists $85.35 $83.33 $34.10 $57.93 $90.00 $90.0029-1122 Occupational therapists $36.68 $37.14 $21.61 $29.01 $43.36 $50.8129-1123 Physical Therapist $39.36 $37.13 $27.10 $31.78 $44.22 $55.2029-1126 Respiratory Therapist $25.32 $25.15 $19.66 $21.83 $28.18 $32.0329-1127 Speech-language pathologists $34.06 $32.25 $20.75 $25.90 $41.29 $52.6029-1129 Therapists, All Other $27.29 $25.58 $15.49 $19.26 $33.55 $42.63 25%29-1141 Registered Nurses $34.32 $34.24 $24.99 $29.30 $40.18 $44.6029-2054 Respiratory therapy technicians $25.59 $26.06 $16.26 $20.54 $31.76 $35.0129-2061 Licensed Practical and Licensed Vocational Nurses $24.18 $24.10 $18.92 $20.97 $27.27 $29.4331-1011 Home Health Aides $11.11 $10.43 $8.29 $9.26 $11.57 $13.8531-1041 Nursing Assistants $13.30 $13.15 $9.93 $11.58 $14.65 $17.1431-2011 Occupational therapist assistants $18.09 $13.65 $9.86 $10.98 $25.88 $32.5331-2021 Physical therapist assistants $20.15 $21.02 $10.20 $11.72 $26.57 $30.4031-2022 Physical therapist aides $12.27 $11.75 $9.15 $10.19 $13.84 $16.5037-2011 Janitors and Cleaners, Except Maids and Housekeeping Clean $11.33 $10.43 $8.14 $8.86 $12.84 $16.1337-2012 Maids and Housekeeping Cleaners $9.52 $9.03 $7.93 $8.34 $10.42 $11.9839-9021 Personal and Home Care Aides $10.42 $10.18 $8.20 $9.04 $11.26 $13.09 70% 70% 70%39-9032 Recreation workers $12.17 $10.86 $8.16 $8.93 $14.08 $17.82
Services
Original Model Rebase
SFY13 Rebase
Habilitation, Early Childhood Autism (Bachelors)Habilitation, Early Childhood Autism, Hourly
BLS DATA ECB ECH
SOC Code Description
BLS Wage
Original Model Rebase
SFY13 Rebase
RebaseBook 2014 A.1-11 October 8, 2013

Appendix ISupporting Wage Data, Composition & Calculations
Service Code Key
Rsp Hrs Min Max Median Hrs Min Max Median Rsp Hrs Min Max Medianw/ otl. w/o otl. w/ otl. w/o otl. w/ otl. w/o otl.
In-Home Supports and Specialized HabilitationHabilitation 27 499,921 $1.43 $32.14 $9.89 $9.65 $9.58 447,307 $1.43 $12.94 $9.84 $9.62 $9.53 1 7,447 $11.00 $11.00 $11.00 $11.00 $11.00Attendant Care 25 911,399 $1.43 $24.52 $9.90 $9.72 $9.71 817,785 $1.43 $12.94 $9.84 $9.68 $9.68 1 10,155 $11.00 $11.00 $11.00 $11.00 $11.00Homemaker 5 63,230 $8.50 $12.17 $10.23 $9.14 $9.14 62,097 $8.67 $10.79 $10.23 $8.91 $8.91 0 0Respite 30 732,362 $1.43 $32.14 $9.78 $9.67 $9.60 634,655 $1.43 $12.29 $9.58 $9.63 $9.55 1 16,248 $11.00 $11.00 $11.00 $11.00 $11.00Indiv. Design. Liv. Arrang. 9 597,800 $1.43 $29.33 $9.40 $9.77 $9.77 581,268 $1.43 $18.27 $9.46 $9.42 $9.42 0 0Hab. Specialized Behavioral 0 0 0 0 0Habilitation w/ Music 3 16,874 $11.86 $22.43 $14.49 $13.15 $13.15 16,874 $11.86 $22.43 $14.49 $13.15 $13.15 0 0
Residential ServicesGroup Home 18 4,472,843 $8.25 $29.33 $9.80 $9.84 $9.73 3,930,451 $8.25 $15.32 $9.50 $9.50 $9.36 0 0Medical Grp. Home 1 56,763 $14.57 $27.50 $21.02 $21.02 $21.02 27,072 $14.57 $15.10 $14.94 $14.94 $14.94 0 0CPT Group Home 1 42,873 $9.50 $11.50 $9.78 $9.78 $9.78 36,788 $9.50 $9.50 $9.50 $9.50 $9.50 0 0Adult Dev. Home-Supervision 6 20,486 $10.13 $27.79 $16.63 $16.16 $16.16 16,755 $10.13 $21.45 $15.74 $15.59 $15.59 0 0Adult Dev. Home-Recruit/Train 6 12,361 $9.99 $24.40 $16.80 $16.96 $16.96 8,711 $9.99 $24.40 $16.44 $16.67 $16.67 0 0Child Dev. Home-Supervision 6 24,894 $10.13 $27.79 $16.55 $17.50 $17.50 19,509 $10.13 $21.45 $15.66 $15.54 $15.54 0 0Child Dev. Home-Recruit/Train 6 14,938 $9.99 $24.40 $17.09 $16.96 $16.96 10,247 $9.99 $24.40 $16.35 $16.35 $16.35 0 0
Day Treatment and TrainingDTA, Adult 30 1,174,151 $8.64 $30.12 $10.18 $10.28 $10.19 1,029,777 $8.64 $18.28 $9.60 $9.82 $9.77 0 0DTA, Child 12 43,506 $7.65 $30.12 $11.30 $13.68 $13.68 38,965 $7.65 $20.60 $9.36 $13.03 $10.67 0 0
Employment ServicesInd. Supp. Emp. 8 4,375 $9.00 $56.00 $10.79 $16.88 $13.34 4,018 $9.00 $18.38 $10.09 $10.81 $10.81 0 0Group Supp. Emp. 12 246,326 $8.80 $56.00 $10.61 $11.14 $11.14 196,009 $8.80 $22.63 $9.91 $10.56 $10.56 0 0Center-Based Emp. 9 192,929 $8.62 $56.00 $11.01 $12.27 $12.27 163,178 $8.62 $26.76 $10.47 $11.28 $10.27 0 0Emp. Support Aide-Individual 3 3,715 $10.40 $56.00 $11.07 $11.81 $11.81 3,234 $10.40 $11.07 $10.88 $10.88 $10.88 0 0Emp. Support Aide-Group 1 2,116 $8.97 $8.97 $8.97 $8.97 $8.97 2,116 $8.97 $8.97 $8.97 $8.97 $8.97 0 0Emp. Support Aide-Center 0 0 0 0 0
TransportationTransportation 22 123,054 $7.25 $245.19 $9.83 $10.87 $10.16 117,945 $7.25 $32.50 $9.82 $10.43 $10.11 0 0
Professional ServicesNursing, Registered Nurses 4 427,666 $24.42 $51.43 $26.86 $26.79 $26.79 327,393 $24.42 $27.41 $26.23 $25.86 $25.86 0 0Nursing, Lic. Prac. Nurses 3 203,500 $22.00 $41.25 $24.05 $24.91 $24.91 203,459 $22.00 $41.25 $24.05 $24.91 $24.91 0 0Home Health Aide 1 4,993 $14.98 $14.98 $14.98 #DIV/0! #DIV/0! 4,993 $14.98 $14.98 $14.98 #DIV/0! #DIV/0! 0 0Therapy, Therapists 12 66,456 $19.76 $135.00 $33.62 $38.36 $34.13 51,366 $23.61 $50.50 $33.62 $38.43 $34.53 8 48,049 $35.00 $65.00 $48.17 $50.70 $50.70Therapy, Assistants 5 3,179 $17.00 $31.17 $22.00 $26.56 $26.56 3,179 $17.00 $31.17 $22.00 $26.56 $26.56 4 4,801 $25.00 $42.50 $32.30 $32.53 $32.53Respiratory Therapy 0 0 0 0 0
1 All weighting is based on fiscal year 2012 claim payments for a given service
Wghtd Avg.1 Wghtd Avg.1 Wghtd Avg.1
Employees ContractorsAll Employees Excluding Supervisors All Contractors
RebaseBook 2014 A.1-12 October 8, 2013

Appendix ISupporting Wage Data, Composition & Calculations
Service Code Key
Wage Data to be inflated to December 2014
Inflation Factor utilized for BLS wage inflationGlobal Insight Q2 2012 editionTable 6.5CY: Home Health Agency Market Basket - Quarterly HistoryUsing 4th Qtr %MOVAVG on Compensation
Rate Schedule Year End
Rate Schedule Mid-Point
Period
Inflate to December
2012
Inflate to December
2013
Inflate to December
2014TOTAL
INFLATIONAs a
PercentFull Year of inflation 1.0190 1.0240 1.0270Months of inflation 7 12 12
5/31/2012 12/31/2014 1.0110 1.0240 1.0270 1.0633 6.33%
RebaseBook 2014 A.1-13 October 8, 2013

RebaseBook 2014 A.2-1 October 8, 2013
RebaseBook 2014
Appendix II
Supporting ERE Data & Calculations
October 8, 2013

Appendix IISupporting ERE Data & Calculations
Proposed ERE Contribution & Calculations
Hourly Rate $9.00 $11.00 $13.00 $13.01 $19.99 $20.00 $30.00
Annual Wage 1 $18,720 $22,880 $27,040 $27,061 $41,579 $41,600 $62,400
FUTA / SUTA 2 2.80% $196 1.05% $196 0.86% $196 0.72% $196 0.72% $196 0.47% $196 0.47% $196 0.31%
FICA 3 7.65% $1,432 7.65% $1,750 7.65% $2,069 7.65% $2,070 7.65% $3,181 7.65% $3,182 7.65% $4,774 7.65%
Workers' Compensation 2.00% $374 2.00% $458 2.00% $541 2.00% $541 2.00% $832 2.00% $832 2.00% $1,248 2.00%Legally required benefits 12.45% $2,002 10.70% $2,404 10.51% $2,805 10.37% $2,807 10.37% $4,208 10.12% $4,210 10.12% $6,218 9.96%
Part Time Adj Factor 76.00%
Paid Time Off 4 25 days/yr $1,368 7.31% $1,672 7.31% $1,976 7.31% $1,978 7.31% $3,038 7.31% $3,040 7.31% $4,560 7.31%Extended Illness Benefit 0 days/yr $0 0.00% $0 0.00% $0 0.00% $0 0.00% $0 0.00% $0 0.00% $0 0.00%
Other BenefitsRetirement Plan 0.00% $0 0.00% $0 0.00% $0 0.00% $0 0.00% $0 0.00% $0 0.00% $0 0.00%Health Insurance $370.00 $3,374 18.03% $3,374 14.75% $3,374 12.48% $3,374 12.47% $3,374 8.12% $3,374 8.11% $3,374 5.41%Dental Insurance $0.00 $0 0.00% $0 0.00% $0 0.00% $0 0.00% $0 0.00% $0 0.00% $0 0.00%Vision Insurance $0.00 $0 0.00% $0 0.00% $0 0.00% $0 0.00% $0 0.00% $0 0.00% $0 0.00%Other Benefits $35.00 $319 1.71% $319 1.40% $319 1.18% $319 1.18% $319 0.77% $319 0.77% $319 0.51%
Total ERE per employee $7,064 37.74% $7,770 33.96% $8,475 31.34% $8,478 31.33% $10,940 26.31% $10,944 26.31% $14,471 23.19%
30.00% 23.00%35.00%
Employee Related Expense (ERE) Assumptions
Up to $13.00 $13.01 - $19.99 $20.00 or More
1 Assumes 2,080 hours/year2 FUTA/SUTA values combined to reflect single amount3 Combined Social Security tax rate of 6.2% and the Medicare tax rate of 1.45% on a maximum of $113,700 in wages
$18,720 $22,880 $27,040 $27,061 $41,579 $41,600 $62,400$7,064 37.74% $7,770 33.96% $8,475 31.34% $8,478 31.33% $10,940 26.31% $10,944 26.31% $14,471 23.19%
% Turnover 30.0% 30.0% 30.0% 30.0% 30.0% 30.0% 30.0% 30.0%Total ERE $5,546 $6,160 $6,774 $6,777 $8,921 $8,924 $11,995Total ERE per employee 29.62% 26.92% 25.05% 25.04% 21.46% 21.45% 19.22%
ERE without Turnover
4 Assumes 10 holidays, 7 vacation days, 6 sick days & 2 personal days per year
ERE with 30% Turnover AssumptionsAnnual Wage without Turnover
RebaseBook 2014 A.2-2 October 8, 2013

Appendix IISupporting ERE Data & Calculations
Current Model ERE Contribution & Calculations
Hourly Rate $9.00 $11.00 $13.00 $13.01 $19.99 $20.00 $30.00
Annual Wage 1 $18,720 $22,880 $27,040 $27,061 $41,579 $41,600 $62,400
FUTA / SUTA 2.80% $196 1.05% $196 0.86% $196 0.72% $196 0.72% $196 0.47% $196 0.47% $196 0.31%FICA 7.65% $1,432 7.65% $1,750 7.65% $2,069 7.65% $2,070 7.65% $3,181 7.65% $3,182 7.65% $4,774 7.65%Workers' Compensation 0.00% $0 0.00% $0 0.00% $0 0.00% $0 0.00% $0 0.00% $0 0.00% $0 0.00%Legally required benefits 10.45% $1,628 8.70% $1,946 8.51% $2,265 8.37% $2,266 8.37% $3,377 8.12% $3,378 8.12% $4,970 7.96%
Paid Time Off 2 25.0 days/yr $1,800 9.62% $2,200 9.62% $2,600 9.62% $2,602 9.62% $3,998 9.62% $4,000 9.62% $6,000 9.62%Extended Illness Benefit 0 days/yr $0 0.00% $0 0.00% $0 0.00% $0 0.00% $0 0.00% $0 0.00% $0 0.00%
Other BenefitsRetirement Plan 0.00% $0 0.00% $0 0.00% $0 0.00% $0 0.00% $0 0.00% $0 0.00% $0 0.00%Health Insurance $170.00 $2,040 10.90% $2,040 8.92% $2,040 7.54% $2,040 7.54% $2,040 4.91% $2,040 4.90% $2,040 3.27%Dental Insurance $0.00 $0 0.00% $0 0.00% $0 0.00% $0 0.00% $0 0.00% $0 0.00% $0 0.00%Vision Insurance $0.00 $0 0.00% $0 0.00% $0 0.00% $0 0.00% $0 0.00% $0 0.00% $0 0.00%Other Benefits 0.00% $0 0.00% $0 0.00% $0 0.00% $0 0.00% $0 0.00% $0 0.00% $0 0.00%
Total ERE per employee $5,468 29.21% $6,186 27.04% $6,905 25.53% $6,908 25.53% $9,415 22.64% $9,418 22.64% $13,010 20.85%
All services in published RateBook (excepting Employment Services) utilize a 30.0% factor for ERE, Employment Services utilize a 34.0% factor for ERE
Current RateBook Employee Related Expense (ERE) Assumptions
1 Assumes 2,080 hours/year2 Assumes 9 holidays, 10 vacation days & 6 sick days days per year
RebaseBook 2014 A.2-3 October 8, 2013

Appendix IISupporting ERE Data & Calculations
Provider Survey Results 07/12/13
FT PT# of Responding Providers 77 77# of Reported Staff 4,153 4,369
Benefit
Res
pond
ents
# th
at O
ffer
% th
at O
ffer
0-1
Mon
ths
3-6
Mon
ths
12+
Mon
ths
Ave
rage
(M
ean)
Wei
ghte
d A
vera
ge1
Med
ian
Ave
rage
(M
ean)
Wei
ghte
d A
vera
ge1
Med
ian
Ave
rage
(M
ean)
Wei
ghte
d A
vera
ge1
Med
ian
Low
Hig
h
Ave
rage
(M
ean)
with
O
utlie
rs
Ave
rage
(M
ean)
w
itho
ut O
utlie
rs
Wei
ghte
d A
vera
ge
with
Out
liers
Wei
ghte
d A
vera
ge
wit
hout
Out
liers
Med
ian
% o
f S
taff
Rec
eivi
ng
Ben
efit
Eff
ecti
ve B
enef
it
Lev
el3
FULL-TIME STAFF
Holidays 75 46 61% 21 25 0 24.4 26.1 30.0 87% 91% 100% 2.0 15.0 8.0 8.1 7.8 7.9 7.5 56% 4.4Paid Time Off 74 47 64% 10 37 0 26.4 27.0 30.0 88% 93% 100% 3.0 139.0 21.4 17.3 29.2 25.7 15.0 59% 15.1
Health Insur. 74 46 62% 16 32 0 31.5 31.2 32.0 89% 93% 100% 54% 46% 53% $100 $1,744 $451 $341 $339 $326 $346 27% $87
Retirement 74 21 28% 5 5 15 24.1 26.3 30.0 92% 98% 100% 46% 22% 23% 0.0% 11.5% 3.4% 3.1% 2.3% 2.2% 3.8% 6% 0.1%
Other Benefits 72 28 39% 11 16 2 27.5 29.5 30.0 91% 96% 100% 71% 64% 76% $2 $185 $32 $26 $26 $20 $19 24% $5
PART-TIME STAFF
Holidays 64 19 30% 12 6 0 7.4 3.6 1.0 88% 40% 100% 2.0 12.0 7.6 8.3 7.0 7.1 8.0 12% 0.8Paid Time Off 64 17 27% 4 13 0 10.9 12.9 9.0 74% 55% 90% 3.0 62.0 14.7 11.4 12.6 11.6 12.0 15% 1.7
Health Insur. 63 11 17% 5 6 0 26.4 28.6 30.0 58% 83% 55% 8% 9% 0% $344 $595 $470 $470 $360 $360 $470 1% $5
Retirement 59 10 17% 1 3 6 14.7 17.3 20.0 66% 57% 71% 30% 20% 27% 0.0% 11.5% 3.9% 3.1% 3.1% 2.8% 3.8% 2% 0.1%
Other Benefits 57 8 14% 5 3 0 12.2 15.5 20.0 92% 84% 100% 53% 38% 53% $3 $56 $19 $19 $14 $14 $13 4% $1
AZ Unemployment Insurance 0.0% 19.0% 2.3% 2.0% 2.6% 2.3% 2.0%Workers' Compensation $0.00 $4.93 $2.00 $1.87 $2.51 $2.37 $1.98
1Weighted means are weighted using reported direct support employees2Holidays and PTO are annual amounts; health insurance and other benefits are monthly amounts; and retirement is a percent of salary3Effective benefit level is calculated by multiplying weighted average benefit level by weighted average "% that Offer" by weighted average "% of Staff Elig." by weighted averageparticipation (all weighted averages exclude outliers)
Totals Across All Staff
Offer Benefit Eligibility among Agencies that Offer Benefit Participation Benefit Level Among Staff Receiving Benefit 2
Waiting Period Req.'d Work Hrs./ Wk. to Quality
% of Staff Eligible % of Eligible Staff Participating
RebaseBook 2014 A.2-4 October 8, 2013

Appendix IISupporting ERE Data & Calculations
Estimated ERE Contribution & Calculations using Survey Responses (as Indicated)
Hourly Rate $9.00 $11.00 $13.00 $13.01 $19.99 $20.00 $30.00
Annual Wage 2 $18,720 $22,880 $27,040 $27,061 $41,579 $41,600 $62,400
FUTA / SUTA 3 2.0% $137 0.73% $137 0.60% $137 0.50% $137 0.50% $137 0.33% $137 0.33% $137 0.22%
FICA 4 7.65% $1,432 7.65% $1,750 7.65% $2,069 7.65% $2,070 7.65% $3,181 7.65% $3,182 7.65% $4,774 7.65%
Workers' Compensation 1.98% $370 1.98% $452 1.98% $534 1.98% $534 1.98% $821 1.98% $822 1.98% $1,232 1.98%Legally required benefits 11.58% $1,938 10.35% $2,339 10.22% $2,739 10.13% $2,741 10.13% $4,138 9.95% $4,141 9.95% $6,143 9.84%
Paid Time Off 5 22 days/yr $1,584 8.46% $1,936 8.46% $2,288 8.46% $2,290 8.46% $3,518 8.46% $3,520 8.46% $5,280 8.46%
Extended Illness Benefit 6 0 days/yr $0 0.00% $0 0.00% $0 0.00% $0 0.00% $0 0.00% $0 0.00% $0 0.00%
Other Benefits
Retirement Plan 7 0.00% $0 0.00% $0 0.00% $0 0.00% $0 0.00% $0 0.00% $0 0.00% $0 0.00%
Health Insurance $346.00 $4,152 22.18% $4,152 18.15% $4,152 15.36% $4,152 15.34% $4,152 9.99% $4,152 9.98% $4,152 6.65%
Dental Insurance 8 $0.00 $0 0.00% $0 0.00% $0 0.00% $0 0.00% $0 0.00% $0 0.00% $0 0.00%
Vision Insurance 8 $0.00 $0 0.00% $0 0.00% $0 0.00% $0 0.00% $0 0.00% $0 0.00% $0 0.00%
Other Benefits $19.00 $228 1.22% $228 1.00% $228 0.84% $228 0.84% $228 0.55% $228 0.55% $228 0.37%
Total ERE per employee $7,902 42.21% $8,655 37.83% $9,407 34.79% $9,411 34.78% $12,037 28.95% $12,041 28.94% $15,803 25.32%
$18,720 $22,880 $27,040 $27,061 $41,579 $41,600 $62,400$7,902 42.21% $8,655 37.83% $9,407 34.79% $9,411 34.78% $12,037 28.95% $12,041 28.94% $15,803 25.32%
% Turnover 30.0% 30.0% 30.0% 30.0% 30.0% 30.0% 30.0% 30.0%Total ERE $6,113 $6,760 $7,407 $7,410 $9,667 $9,671 $12,905Total ERE per employee 32.66% 29.55% 27.39% 27.38% 23.25% 23.25% 20.68%
ERE without Turnover
ERE with 30% Turnover AssumptionsAnnual Wage without Turnover
Employee Related Expense (ERE) Assumptions - Based on Provider Survey Results 1
1 Survey results presented here (generally) represent the "Median" responses2 Assumes 2,080 hours/year3 FUTA/SUTA values combined to reflect single amount4 Combined Social Security tax rate of 6.2% and the Medicare tax rate of 1.45% on a maximum of $113,700 in wages
5 Assumes 7 holidays & 15 vacation days days per year6 Assumes zero days due to low participation rate for providers7 Assumes zero contribution based upon low participation8 Provider survey did not ask for responses detailing these specific benefits
RebaseBook 2014 A.2-5 October 8, 2013

RebaseBook 2014 A.3-1 October 8, 2013
RebaseBook 2014
Appendix III
Detailed Productivity Comparisons & Data
October 8, 2013

Appendix IIIDetailed Productivity Comparisons & Data
Comparison of Current Model, SFY08 Rebase Proposed Model Factors
Hrs:0 - 16
Hrs:17 - 24
Hrs:0 - 16
Hrs:17 - 24
- Total Hours 8.00 8.00 8.00 8.00 8.00 8.00 8.00 8.00 8.00 8.00 8.00 8.00 8.00 8.00 8.00 8.00 8.00- Travel Time 0.25 0.25 0.39 0.50 0.50 0.89 0.50 0.50 0.36 0.25 0.25 0.59 0.00 0.00 0.00 0.00 0.00- Time allocated to notes/med records 0.25 0.00 0.20 0.25 0.00 0.20 0.00 0.00 0.00 0.10 0.00 0.08 0.00 0.00 0.00 0.06 0.00- Training Time 0.00 0.21 0.15 0.00 0.21 0.15 0.00 0.00 0.15 0.00 0.21 0.15 0.00 0.21 0.00 0.15 0.00- Time allocated to missed appointments 0.00 0.15 0.05 0.00 0.15 0.05 0.00 0.00 0.00 0.00 0.15 0.00 0.00 0.00 0.00 0.00 0.00- Employer Time 0.00 0.00 0.10 0.00 0.00 0.10 0.00 0.00 0.10 0.00 0.00 0.10 0.00 0.00 0.00 0.10 0.00- ISP Meetings 0.00 0.00 0.06 0.00 0.00 0.06 0.00 0.00 0.00 0.00 0.00 0.00 0.00 0.00 0.00 0.00 0.00- Participating in Assessments 0.00 0.00 0.00 0.00 0.00 0.10 0.00 0.00 0.00 0.00 0.00 0.00 0.00 0.00 0.00 0.00 0.00- Average on-site time; "Billable Hours" 7.50 7.39 7.05 7.25 7.14 6.45 7.50 7.50 7.39 7.65 7.39 7.08 8.00 7.79 8.00 7.69 8.00- Productivity Adjustment 1.07 1.08 1.13 1.10 1.12 1.24 1.07 1.07 1.08 1.05 1.08 1.13 1.00 1.03 1.00 1.04 1.00
- Total Hours 8.00 8.00 8.00 8.00 8.00 8.00 8.00 8.00- Travel Time 0.00 0.50 0.00 0.50 0.37 0.00- Time allocated to notes/med records 0.00 0.00 0.25 0.00 0.25 0.00- Training Time 0.00 0.25 0.00 0.21 0.15 0.15- Time allocated to missed appointments 0.00 0.08 0.00 0.15 0.00 0.00- Employer Time 0.00 0.00 0.10 0.10- ISP Meetings 0.00 0.00 0.12 0.12- Participating in Assessments 0.00 0.00 0.14 0.14- Average on-site time; "Billable Hours" 8.00 7.17 7.75 7.14 6.87 7.75 7.14 7.49- Productivity Adjustment 1.00 1.12 1.03 1.12 1.16 1.03 1.12 1.07
Current Model
SFY08 Rebase
SFY 2013 Rebase
Current Model
SFY08 Rebase
SFY 2013 Rebase
Current Model
SFY08 Rebase
SFY 2013 Rebase
Current Model
SFY08 Rebase
SFY 2013 Rebase
1:3.5 1:3.5 1:3.5 1:3.5 1:3.5 1:3.5 1:3.5 1:3.5 1:3.5 1:3.5 1:3.5 1:3.5- Total Hours 8.00 8.00 8.00 4.25 3.92 4.50 4.25 5.05 4.50 8.00 8.00 8.00 8.00 6.72- Direct Care Travel Time: Charged to Transportation 0.80 0.66 0.00 0.00 0.26 0.00 0.00 0.66 0.00 0.80 1.17 0.00- Total Hours before productivity adjustments 7.20 7.34 8.00 4.25 3.66 4.50 4.25 4.39 4.50 7.20 6.83 8.00- Time allocated to facility preparation 0.20 0.50 0.50 0.25 0.25 0.50 0.25 0.25 0.50 0.20 0.50 0.50- Time allocated to notes & medical records 0.00 0.00 0.25 0.00 0.00 0.25 0.00 0.00 0.25 0.00 0.00 0.25 0.25 0.00- Training Time 0.00 0.22 0.15 0.00 0.11 0.30 0.00 0.11 0.30 0.00 0.22 0.15 0.00 0.00- Time allocated to missed appointments- Employer Time 0.00 0.10 0.10 0.00 0.05 0.10 0.00 0.06 0.10 0.00 0.10 0.10 0.00 0.22- ISP Meetings 0.00 0.00 0.06 0.00 0.00 0.00 0.00 0.00 0.00 0.00 0.00 0.06 0.00 0.00- Participating in Assessments 0.00 0.00 0.00 0.00 0.00 0.00 0.00 0.00 0.00 0.00 0.00 0.00 0.00 0.00- Travel Time 0.00 0.00 0.00 0.00 0.50 0.00- Average on-site time; "Billable Hours" 7.00 6.53 6.94 4.00 3.25 3.35 4.00 3.97 3.35 7.00 6.01 6.94 7.25 6.50- Productivity Adjustment 1.03 1.13 1.15 1.06 1.13 1.34 1.06 1.11 1.34 1.03 1.14 1.15 1.10 1.03
Homemaker Respite, Hourly Respite, Daily (Long-Term)
Current Model
SFY08Rebase
SFY 2013 Rebase
Current Model
Attendant Care Habilitation, Support
SFY08Rebase
SFY 2013 Rebase
SFY 2013 Rebase
Current Model
SFY08 Rebase SFY 2013 RebaseCurrent Model
SFY 2013 Rebase
Current Model
Factors Offsetting Direct Care Service Hours(Productivity)
Habilitation, IDLA, Hourly Habilitation, IDLA, DailyCurrent Model
SFY08Rebase
SFY 2013 Rebase
SFY08Rebase
Factors Offsetting Direct Care Service Hours(Productivity)
Day Treatment & Training, ChildSummer
Current Model
SFY08Rebase
SFY 2013 Rebase
Current Model
SFY08Rebase
SFY 2013 Rebase
SFY08Rebase
SFY 2013 Rebase
Day Treatment & Training, AdultIntense
Current Model
Habilitation, Community Protection & Treatment Hourly
SFY08Rebase
Day Treatment & Training, AdultRural
Factors Offsetting Direct Care Service Hours(Productivity)
Day Treatment & Training, AdultDay Treatment & Training, Child,
After-School
RebaseBook 2014 A.3-2 October 8, 2013

Appendix IIIDetailed Productivity Comparisons & Data
Comparison of Current Model, SFY08 Rebase Proposed Model Factors
- Total Hours 8.00 8.00 8.00 8.00 8.00 8.00 8.00 8.00 8.00- Travel Time 0.00 0.50 0.00 0.00 0.00 0.00 0.60 0.75 1.07- Time allocated to notes/med records 0.00 0.00 0.00 0.00 0.00 0.00 0.50 0.00 0.20- Training Time 0.00 0.25 0.15 0.00 0.00 0.21 0.00 0.21 0.15- Time allocated to missed appointments 0.00 0.08 0.00 0.00 0.21 0.00 0.00 0.15 0.05- Employer Time 0.00 0.00 0.10 0.10 0.10- ISP Meetings 0.00 0.00 0.00- Participating in Assessments 0.00 0.00 0.00- Average on-site time; "Billable Hours" 8.00 7.17 7.75 8.00 7.79 7.69 6.90 6.89 6.43- Productivity Adjustment 1.00 1.12 1.03 1.00 1.03 1.04 1.16 1.16 1.24
- Total Hours 8.00 8.00 8.00 8.00 8.00 8.00 8.00 8.00 8.00 8.00 8.00 8.00- Number of visits per day 10.00 6.00 5.00- Travel time per visit 0.20 0.28 0.24- Travel Time 0.60 2.00 1.65 0.60 1.00 1.19 0.60 0.60 0.00 0.00 0.00 0.00- Time allocated to notes/med records 0.50 0.83 0.80 0.50 0.50 0.50 0.50 0.50 0.20 0.00 0.00 0.20- Training Time 0.00 0.21 0.21 0.00 0.21 0.21 0.00 0.21 0.21 0.00 0.00 0.21- Time allocated to missed appointments 0.00 0.00 0.00 0.00 0.00 0.00 0.00 0.00 0.00 0.00 0.00 0.00- Employer Time 0.10 0.10 0.10 0.10- ISP Meetings 0.00 0.00 0.00 0.00- Participating in Assessments 0.00 0.00 0.00 0.00- Consultation with provider 0.20 0.20 0.20 0.20- Average on-site time; "Billable Hours" 6.90 4.96 5.04 6.90 6.29 5.80 6.90 6.69 7.29 8.00 8.00 7.29- Productivity Adjustment 1.16 1.61 1.59 1.16 1.27 1.38 1.16 1.20 1.10 1.00 1.00 1.10
- Total Hours 8.00 8.00 8.00 8.00 8.00 8.00 8.00 8.00- Travel Time 0.00 0.00 1.50 1.77 0.00 0.00 1.50 1.77- Recordkeeping & Documentation 0.65 0.47 0.53 0.38- Consultation with Providers/Family 0.40 0.31 0.32 0.20- Missed Appointments 0.50 0.05 0.50 0.10 0.50 0.05 0.50 0.10- Training/Continuous Education 0.20 0.21 0.20 0.21 0.20 0.21 0.20 0.21- Other Non-Billable Activity 0.30 0.00 0.30 0.00 0.30 0.00 0.30 0.00- Employer Time 0.10 0.10 0.30 0.30- ISP Meetings 0.00 0.00 0.00 0.00- Participating in Assessments 0.00 0.00 0.00 0.00- Average on-site time; "Billable Hours" 7.00 6.59 5.50 5.04 7.00 6.59 5.50 5.04- Productivity Adjustment 1.14 1.21 1.45 1.59 1.14 1.21 1.45 1.59
- Total Hours 8.00 8.00 8.00 8.00- Travel Time 1.00 0.00 1.00 1.77- Time allocated to notes/med records 1.00 0.47- Consultation with Providers/Family 0.25 0.13- Missed Appointments 0.00 0.05 0.00 0.05- Training/Continuous Education 0.08 0.21 0.08 0.21- Other Non-Billable Activity 0.25 0.00 0.25 0.00- Employer Time 0.20 0.20- ISP Meetings 0.00 0.00- Participating in Assessments 0.00 0.00- Average on-site time; "Billable Hours" 6.67 6.29 6.67 5.17- Productivity Adjustment 1.20 1.27 1.20 1.55
Current Model
SFY 2013 Rebase
Current Model
SFY08Rebase
SFY 2013 Rebase
Factors Offsetting Direct Care Service Hours(Productivity)
Nursing, Visit Nursing, Short-Term Nursing, Long-Term
SFY08Rebase
SFY 2013 Rebase
Current Model
SFY08Rebase
Factors Offsetting Direct Care Service Hours(Productivity)
Habilitation, Group Home Habilitation, Group Home, CPT Home Health Aide
Nursing, RespiteCurrent Model
SFY08Rebase
SFY 2013 Rebase
Current Model
SFY08Rebase
SFY 2013 Rebase
Current Model
SFY08Rebase
SFY 2013 Rebase
Current Model
SFY08Rebase
SFY 2013 Rebase
Current Model
SFY08Rebase
SFY 2013 Rebase
Current Model
SFY08Rebase
SFY 2013 Rebase
Current Model
SFY08Rebase
SFY 2013 Rebase
Current Model
SFY08Rebase
SFY08Rebase
Factors Offsetting Direct Care Service Hours(Productivity)
Therapy, Clinical Therapy, Natural SLPA, Clinical SLPA, NaturalSFY 2013
RebaseCurrent Model
SFY 2013 Rebase
Factors Offsetting Direct Care Service Hours(Productivity)
Respiratory Therapy, Clinical Respiratory Therapy, NaturalCurrent Model
SFY08Rebase
SFY 2013 Rebase
RebaseBook 2014 A.3-3 October 8, 2013

Appendix IIIDetailed Productivity Comparisons & Data
Comparison of Current Model, SFY08 Rebase Proposed Model Factors
- Total Hours 8.00 8.00 8.00 8.00- Direct Service Time 7.00 6.29 7.75 6.94- Travel Time 0.00- Training 0.20 0.15 0.15- Reporting Facility Set-up 0.80 0.50 0.25- Time Allocated to Notes & Records 0.75 0.25 0.50- Employer Time 0.10 0.10- Job Development 0.15- ISP Meetings 0.06 0.06- Participating in Assessments 0.00 0.00- Productivity Adjustment 1.14 1.27 1.03 1.15
- Total Hours 8.00 8.00 8.00 8.00 8.00 8.00 8.00- Direct Service Time 6.00 7.10 5.75 7.10 5.75 5.38 5.75- Job Development Time, Employer Contact Time 0.25 0.15 0.25 0.15 0.50 0.10 0.50- Travel Time Between Employer Sites 0.75 0.00 1.25 0.00 1.00 1.52 1.50- Training Time, Non-client related time 0.25 0.15 0.25 0.15 0.50 0.15 0.50- Report Writing Time 0.75 0.50 0.75 0.50 0.50 0.50- Non-Client Time 0.00 0.25 0.25- Employer Time 0.10 0.10 0.10- ISP Meetings 0.00 0.00 0.15- Participating in Assessments 0.00 0.00 0.10- Program Prep/Set up/Clean up 0.00 0.00- Billable Hours 6.00 7.10 5.50 7.10 7.75 5.38 5.25- Non-Billable Hours 2.00 0.90 2.50 0.90 0.25 2.62 0.75- Productivity Adjustment 1.33 1.13 1.45 1.13 1.03 1.49 1.03
- Total Hours 8.00- Direct Service Time 4.75- Job Development Time, Employer Contact Time 2.00- Travel Time Between Employer Sites 0.25- Training Time, Non-client related time 0.15- Report Writing Time 0.50- Non-Client Time- Employer Time 0.10- ISP Meetings 0.15- Participating in Assessments 0.10- Program Prep/Set up/Clean up 0.00- Billable Hours 4.75- Non-Billable Hours 3.25- Productivity Adjustment 1.68
SFY 2013 Rebase
Current Model
SFY08Rebase
SFY 2013 Rebase
Factors Offsetting Direct Care Service Hours(Productivity)
Group Supported EmploymentGroup Supported Employment - Low
DensityIndividual Supported Employment -
Job Coaching
Factors Offsetting Direct Care Service Hours(Productivity)
Center Based EmploymentEmployment Support Aide -
GSE/ISE Transition to EmploymentCurrent Model
SFY08Rebase
SFY 2013 Rebase
Current Model
SFY08Rebase
Individual Supported Employment - Job Coaching Low Density
Current Model
SFY08Rebase
SFY 2013 Rebase
Current Model
SFY08Rebase
SFY 2013 Rebase
Current Model
SFY08Rebase
SFY 2013 Rebase
Current Model
SFY08Rebase
SFY 2013 Rebase
Factors Offsetting Direct Care Service Hours(Productivity)
Individual Supported Employment - Job Development
Individual Supported Employment - Job Development Low Density
Current Model
SFY08Rebase
SFY 2013 Rebase
Current Model
SFY08Rebase
SFY 2013 Rebase
RebaseBook 2014 A.3-4 October 8, 2013

Appendix IIIDetailed Productivity Comparisons & Data
Comparison of Current Model, SFY08 Rebase Proposed Model Factors
- Total Hours 8.00 8.00 8.00 8.00 8.00 8.00- Travel Time 0.75 0.75 0.89 0.50 0.50 0.50- Time allocated to notes/med records 0.25 0.25 0.36 0.25 0.25 0.25- Training Time 0.00 0.00 0.21- Employer Time 0.10- Missed Appointments 0.00 0.00 0.05- Average on-site time; "Billable Hours" 7.00 7.00 6.39 7.25 7.25 7.25- Productivity Adjustment 1.14 1.14 1.25 1.10 1.10 1.10
- Total Hours 8.00 8.00 8.00 8.00- Travel Time 0.77 1.57 1.07 1.07- Time allocated to notes/med records 1.00 1.00 1.00 0.75- Training Time 0.21 0.21 0.21 0.21- Employer Time 0.30 0.30 0.30 0.10- Missed Appointments 0.05 0.05 0.05 0.05- Average on-site time; "Billable Hours" 5.67 4.87 5.37 5.82- Productivity Adjustment 1.41 1.64 1.49 1.37
- Total Hours 8.00 8.00 8.00 8.00- Travel Time 1.07 1.07 1.07 0.89- Time allocated to notes/med records 0.75 0.75 0.75 0.20- Training Time 0.21 0.21 0.21 0.21- Employer Time 0.10 0.10 0.10 0.10- Missed Appointments 0.05 0.05 0.05 0.05- Average on-site time; "Billable Hours" 5.82 5.82 5.82 6.55- Productivity Adjustment 1.37 1.37 1.37 1.22
Current Model
SFY08Rebase
SFY 2013 Rebase
Factors Offsetting Direct Care Service Hours(Productivity)
Habilitation, Consultation (Psychologist-Urban)
Habilitation, Consultation (Psychologist-Rural)
Habilitation, Consultation (Lic. Behavor Analyst) Habilitation, Consultation (BCBA)
Current Model
SFY 2013 Rebase
Current Model
SFY08Rebase
SFY 2013 Rebase
Current Model
SFY08Rebase
SFY 2013 Rebase
Current Model
SFY08Rebase
SFY 2013 Rebase
Factors Offsetting Direct Care Service Hours(Productivity)
Habilitation with Music TherapySpecialized Habilitation,
CommunicationSpecialized Habilitation, Behavioral-
BSpecialized Habilitation, Behavioral-
MCurrent Model
SFY08Rebase
SFY 2013 Rebase
SFY08Rebase
SFY 2013 Rebase
Current Model
SFY08Rebase
SFY 2013 Rebase
Current Model
SFY08Rebase
Early ChildhoodAutism (Masters)
Current Model
SFY08Rebase
SFY 2013 Rebase
SFY08Rebase
SFY 2013 Rebase
SFY08Rebase
SFY 2013 Rebase
Current Model
SFY08Rebase
SFY 2013 Rebase
Current Model
Factors Offsetting Direct Care Service Hours(Productivity)
Habilitation, Consultation (BCABA)Early Childhood
Autism (Bachelors)Early Childhood
Autism, HabilitationCurrent Model
RebaseBook 2014 A.3-5 October 8, 2013

Appendix IIIDetailed Productivity Comparisons & Data
Comparison of Current Model, SFY08 Rebase, Survey Results Proposed Model Factors
- Total Hours 40.00 40.00 40.00 40.00 40.00 40.00 40.00 40.00 40.00 40.00 40.00 40.00- Travel Time 1.25 1.25 1.67 1.95 2.50 2.50 2.41 4.45 2.50 2.50 0.44 1.80- Time allocated to notes/med records 1.25 0.00 1.24 1.00 1.25 0.00 1.12 1.00 0.00 0.00 0.00 0.00- Training Time 0.00 1.05 0.46 0.75 0.00 1.05 0.44 0.75 0.00 0.00 0.53 0.75- Time allocated to missed appointments 0.00 0.77 0.07 0.25 0.00 0.77 0.10 0.25 0.00 0.00 0.00 0.00- ISP meetings 0.30 0.30 1.06 0.30 0.00 0.00- Participating in assessments 0.05 0.00 0.88 0.50 0.00 0.00- Employer time (e.g. staff meetings) 0.25 0.50 0.47 0.50 0.86 0.50- Average on-site time; "Billable Hours" 37.50 36.93 35.96 35.25 36.25 35.68 33.52 32.25 37.50 37.50 38.17 36.95- Productivity Adjustment 1.07 1.08 1.11 1.13 1.10 1.12 1.19 1.24 1.07 1.07 1.05 1.08
Hrs:0 - 16
Hrs:17 - 24
- Total Hours 40.00 40.00 40.00 40.00 40.00 40.00 40.00 40.00 40.00- Travel Time 1.25 1.25 1.40 2.95 0.00 0.00 0.00 0.06 0.00- Time allocated to notes/med records 0.50 0.00 0.39 0.40 0.00 0.00 0.00 0.08 0.30- Training Time 0.00 1.05 0.45 0.75 0.00 1.05 0.00 0.39 0.75- Time allocated to missed appointments 0.00 0.77 0.01 0.00 0.00 0.00 0.00 0.03 0.00- ISP meetings 0.73 0.00 1.68 0.00- Participating in assessments 0.06 0.00 0.00 0.00- Employer time (e.g. staff meetings) 0.74 0.50 0.50 0.50- Average on-site time; "Billable Hours" 38.25 36.93 36.21 35.40 40.00 38.95 40.00 37.26 38.45- Productivity Adjustment 1.05 1.08 1.10 1.13 1.00 1.03 1.00 1.07 1.04
- Total Hours 40.00 40.00 0.00 40.00 40.00 40.00 40.00 8.00 8.00 40.00 40.00- Travel Time 0.00 2.50 0.00 0.00 2.50 1.10 1.85 0.37 1.85- Time allocated to notes/med records 0.00 0.00 0.00 1.25 0.00 0.78 1.25 0.25 1.25- Training Time 0.00 1.25 0.00 0.00 1.05 0.63 0.75 0.15 0.75- Time allocated to missed appointments 0.00 0.39 0.00 0.00 0.77 0.02 0.00 0.00 0.00- ISP meetings 0.00 0.57 0.60 0.10 0.60- Participating in assessments 0.00 0.70 0.70 0.12 0.70- Employer time (e.g. staff meetings) 0.00 0.66 0.50 0.14 0.50- Average on-site time; "Billable Hours" 40.00 35.87 0.00 38.75 35.68 35.54 34.35 7.75 7.14 38.87 34.35- Productivity Adjustment 1.00 1.12 #DIV/0! 1.03 1.12 1.13 1.16 1.03 1.12 1.03 1.16
Factors Offsetting Direct Care Service Hours(Productivity)
Attendant Care Habilitation, SupportSFY08Rebase
Survey Results
HomemakerCurrent Model
SFY08Rebase
Survey Results
SFY13Rebase
Current Model
SFY13Rebase
SFY13Rebase
Current Model
SFY08Rebase
Survey Results
Factors Offsetting Direct Care Service Hours(Productivity)
Respite, Hourly Respite, Daily (Long-Term)
Current Model
SFY08Rebase
SFY08 RebaseSurvey Results
SFY13Rebase
Survey Results
SFY13Rebase
Current Model
Factors Offsetting Direct Care Service Hours(Productivity)
Habilitation, Community Protection & Treatment Hourly Habilitation, IDLA, Hourly
Current Model
SFY08Rebase
Survey Results
SFY13Rebase
Survey Results
SFY13Rebase
Current Model
SFY08Rebase
Current Model
SFY08Rebase
Survey Results
SFY13Rebase
Habilitation, IDLA, Daily
RebaseBook 2014 A.3-6 October 8, 2013

Appendix IIIDetailed Productivity Comparisons & Data
Comparison of Current Model, SFY08 Rebase, Survey Results Proposed Model Factors
Current Model
SFY08 Rebase
Survey Results
SFY13 Rebase
Current Model
SFY08 Rebase
Survey Results
SFY13 Rebase
Current Model
SFY08 Rebase
Survey Results
SFY13 Rebase
1:3.5 1:3.5 1:3.5 1:3.5 1:3.5 1:3.5 1:3.5 1:3.5 1:3.5 1:3.5 1:3.5 1:3.5- Total Hours 40.00 40.00 40.00 40.00 21.25 19.60 40.00 22.50 21.25 25.25 40.00 22.50- Direct Care Travel Time: Charged to Transportation 4.00 3.28 0.83 0.00 0.00 1.31 0.00 0.00 0.00 3.28 4.32 0.00- Total Hours before productivity adjustments 36.00 36.72 39.17 40.00 21.25 18.29 40.00 22.50 21.25 21.97 35.68 22.50- Time allocated to facility preparation 1.00 2.50 0.78 2.50 1.25 1.25 4.26 2.50 1.25 1.25 2.40 2.50- Time allocated to notes & medical records 0.00 0.00 0.43 1.25 0.00 0.00 1.00 1.25 0.00 0.00 0.96 1.25- Training Time 0.00 1.10 0.58 0.75 0.00 0.55 0.56 1.50 0.00 0.55 0.79 1.50- Employer Time 0.00 0.48 0.53 0.50 0.00 0.25 2.77 0.50 0.00 0.30 0.81 0.50- ISP meetings 0.40 0.30 0.18 0.00 0.05 0.00- Participating in assessments 0.16 0.00 0.00 0.00 0.00 0.00- Program development 0.60 0.00 3.23 0.00 2.78 0.00- Average on-site time; "Billable Hours" 35.00 32.64 35.68 34.70 20.00 16.24 28.00 16.75 20.00 19.87 27.88 16.75- Productivity Adjustment 1.03 1.13 1.10 1.15 1.06 1.13 1.43 1.34 1.06 1.11 1.28 1.34
Current Model
SFY08 Rebase
Survey Results
SFY13 Rebase
1:3.5 1:3.5 1:3.5 1:3.5- Total Hours 40.00 40.00 40.00 40.00 33.60 40.00- Direct Care Travel Time: Charged to Transportation 4.00 5.83 0.00- Total Hours before productivity adjustments 36.00 34.17 40.00- Time allocated to facility preparation 1.00 2.50 2.50- Time allocated to notes & medical records 0.00 0.00 1.25 1.25 0.00 1.00- Training Time 0.00 1.10 0.75 0.00 0.00 0.75- Employer Time 0.00 0.50 0.50 0.00 1.10 0.50- Travel Time 2.50 0.00 4.45- ISP meetings 0.30 0.30- Participating in assessments 0.00 0.50- Program development 0.00- Average on-site time; "Billable Hours" 35.00 30.07 34.70 36.25 32.50 32.25- Productivity Adjustment 1.03 1.14 1.15 1.10 1.03 1.24
Factors Offsetting Direct Care Service Hours(Productivity)
Day Treatment & Training, AdultDay Treatment & Training, Child,
After-SchoolDay Treatment & Training, Child
Summer
SFY13Rebase
Factors Offsetting Direct Care Service Hours(Productivity)
Day Treatment & Training, AdultRural
Day Treatment & Training, AdultIntense
Current Model
SFY08Rebase
Survey Results
RebaseBook 2014 A.3-7 October 8, 2013

Appendix IIIDetailed Productivity Comparisons & Data
Comparison of Current Model, SFY08 Rebase, Survey Results Proposed Model Factors
- Total Hours 40.00 40.00 40.00 40.00 40.00 40.00 40.00 40.00 40.00 40.00- Travel Time 0.00 2.50 0.00 0.00 0.00 0.00 3.00 3.75 5.35- Time allocated to notes/med records 0.00 0.00 0.00 0.00 0.00 0.00 0.00 2.50 0.00 1.00- Training Time 0.00 1.25 0.57 0.75 0.00 0.00 1.05 0.00 1.05 0.75- Time allocated to missed appointments 0.00 0.39 0.00 0.00 0.00 1.05 0.00 0.00 0.77 0.25- Employer time (e.g. staff meetings) 0.56 0.50 0.50 0.50- ISP meetings 0.00 0.00 0.00 0.00- Participating in assessments - 0.00 0.00 0.00- Average on-site time; "Billable Hours" 40.00 35.87 38.87 38.75 40.00 38.95 38.45 34.50 34.43 32.15- Productivity Adjustment 1.00 1.12 1.03 1.03 1.00 1.03 1.04 1.16 1.16 1.24
- Total Hours 40.00 40.00 40.00 40.00 40.00 40.00 40.00 40.00 40.00 40.00 40.00 40.00- Number of visits per week 50.00 30.00 25.00 0.00- Travel time per visit 1.00 0.00 1.38 0.00 1.19 0.00 0.00- Travel Time 3.00 10.00 8.94 8.25 3.00 5.00 6.82 5.95 3.00 3.00 0.39 0.00- Time allocated to notes/med records 2.50 4.15 0.00 4.00 2.50 2.50 0.00 2.50 2.50 2.50 0.00 1.00- Training Time 0.00 1.05 0.44 1.05 0.00 1.05 0.44 1.05 0.00 1.05 0.37 1.05- Time allocated to missed appointments 0.00 0.00 0.89 0.00 0.00 0.00 1.21 0.00 0.00 0.00 0.20 0.00- Employer time (e.g. staff meetings) 0.89 0.50 0.90 0.50 0.52 0.50- ISP meetings 1.04 0.00 1.05 0.00 0.39 0.00- Participating in assessments 1.77 0.00 1.77 0.00 0.39 0.00- Average on-site time; "Billable Hours" 34.50 24.80 26.03 26.20 34.50 31.45 27.81 30.00 34.50 33.45 37.74 37.45- Productivity Adjustment 1.16 1.61 1.54 1.53 1.16 1.27 1.44 1.33 1.16 1.20 1.06 1.07
- Total Hours 40.00 40.00 40.00 40.00 40.00 40.00 40.00 40.00 40.00 40.00 40.00 40.00- Number of visits per week 50.00 30.00 25.00 0.00- Travel time per visit 1.00 0.00 1.38 0.00 1.19 0.00 0.00- Travel Time 3.00 10.00 8.94 8.25 3.00 5.00 6.82 5.95 3.00 3.00 0.42 0.00- Time allocated to notes/med records 2.50 4.15 0.00 4.00 2.50 2.50 0.00 2.50 2.50 2.50 0.00 1.00- Training Time 0.00 1.05 0.44 1.05 0.00 1.05 0.44 1.05 0.00 1.05 0.38 1.05- Time allocated to missed appointments 0.00 0.00 0.89 0.00 0.00 0.00 1.21 0.00 0.00 0.00 0.21 0.00- Employer time (e.g. staff meetings) 0.89 0.50 0.90 0.50 0.55 0.50- ISP meetings 1.04 0.00 1.05 0.00 0.41 0.00- Participating in assessments 1.77 0.00 1.77 0.00 0.42 0.00- Average on-site time; "Billable Hours" 34.50 24.80 26.03 26.20 34.50 31.45 27.81 30.00 34.50 33.45 37.63 37.45- Productivity Adjustment 1.16 1.61 1.54 1.53 1.16 1.27 1.44 1.33 1.16 1.20 1.06 1.07
Current Model
SFY08Rebase
Survey Results
SFY13Rebase
Current Model
Factors Offsetting Direct Care Service Hours(Productivity)
Habilitation, Group Home Habilitation, Group Home, CPTSFY08Rebase
Survey Results
Survey Results
SFY13Rebase
SFY13Rebase
Current Model
SFY08Rebase
Home Health Aide
Current Model
SFY08Rebase
Survey Results
Nursing, Visit (RN) Nursing, Short-Term (RN) Nursing, Long-Term (RN)Survey Results
SFY13Rebase
SFY13Rebase
Current Model
SFY08Rebase
SFY13Rebase
Current Model
SFY08Rebase
Survey Results
Nursing, Visit (LPN) Nursing, Short-Term (LPN) Nursing, Long-Term (LPN)Survey Results
SFY13Rebase
SFY13Rebase
Current Model
SFY08Rebase
Survey Results
Current Model
SFY08Rebase
Survey Results
SFY13Rebase
Current Model
SFY08Rebase
Factors Offsetting Direct Care Service Hours(Productivity)
Factors Offsetting Direct Care Service Hours(Productivity)
RebaseBook 2014 A.3-8 October 8, 2013

Appendix IIIDetailed Productivity Comparisons & Data
Comparison of Current Model, SFY08 Rebase, Survey Results Proposed Model Factors
- Total Hours 40.00 40.00 40.00 40.00 40.00 40.00 40.00 40.00 40.00- Travel Time 0.00 0.00 0.00 7.50 1.81 8.85 0.00 0.00 0.00- Recordkeeping & Documentation 1.65 3.25 1.81 2.35 5.39 2.65- Consultation with Providers/Family 0.92 2.00 0.87 1.55 2.37 1.60- Time allocated to missed appointments 2.50 1.17 0.25 2.50 0.79 0.50 2.50 1.93 0.25- Training Time 1.00 0.58 1.05 1.00 0.56 1.05 1.00 0.38 1.05- Other Non-Billable Activity 1.50 0.09 0.00 1.50 0.10 0.00 1.50 0.00 0.00- Employer time (e.g. staff meetings) 0.93 0.50 0.30 0.50 2.64 1.50- ISP meetings 0.37 0.00 0.27 0.00 0.49 0.00
Participating in assessments - 0.00 - 0.00 0.00- Average on-site time; "Billable Hours" 35.00 34.28 32.95 27.50 33.49 25.20 35.00 26.80 32.95- Productivity Adjustment 1.14 1.17 1.21 1.45 1.19 1.59 1.14 1.49 1.21
- Total Hours 40.00 40.00 40.00 40.00 40.00 40.00 40.00- Travel Time 7.50 2.99 8.85 5.00 0.00 5.00 8.85- Recordkeeping & Documentation 3.14 1.90 5.00 0.00 2.35- Consultation with Providers/Family 1.47 1.00 1.25 0.00 0.65- Time allocated to missed appointments 2.50 1.87 0.50 0.00 0.25 0.00 0.25- Training Time 1.00 0.42 1.05 0.40 1.05 0.40 1.05- Other Non-Billable Activity 1.50 0.75 0.00 1.25 0.00 1.25 0.00
Employer time (e.g. staff meetings) 1.14 1.50 1.00 0.00 1.00- ISP meetings 0.69 0.00 0.00 0.00- Participating in assessments 0.00 0.00 0.00- Average on-site time; "Billable Hours" 27.50 27.53 25.20 33.35 31.45 33.35 25.85- Productivity Adjustment 1.45 1.45 1.59 1.20 1.27 1.20 1.55
- Total Hours 40.00 40.00 40 40.00- Transporting clients 0.44- Total Hours before productivity adjustments 39.56- Direct Service Time 35.00 30.38 31.45 38.75- Training Time 1.00 0.79 0.75- Program prep./set-up/clean-up 4.00 1.94 2.5- Time Allocated to Notes & Records 3.85 3.75 1.25- Employer time (e.g. staff meetings) 1.20 0.5- ISP meetings 1.17 0.3- Participating in assessments 0.14 0- Program development 0.08- Productivity Adjustment 1.14 1.30 1.27 1.03
SFY08Rebase
Survey Results
SFY08Rebase
Therapy, Clinical Therapy, Natural SLPA, ClinicalSFY13Rebase
SFY13Rebase
Current Model
Factors Offsetting Direct Care Service Hours(Productivity)
SLPA, Natural Respiratory Therapy, ClinicalCurrent Model
Survey Results
Current Model
Survey Results
SFY13Rebase
SFY08Rebase
Survey Results
SFY13Rebase
Current Model
SFY13Rebase
Current Model
SFY08Rebase
SFY08Rebase
Survey Results
Employment Support Aide,Center Based Employment
Current Model
SFY08Rebase
Survey Results
SFY13Rebase
Survey Results
SFY13Rebase
Current Model
SFY08Rebase
Center Based EmploymentFactors Offsetting Direct Care Service Hours(Productivity)
Factors Offsetting Direct Care Service Hours(Productivity)
Respiratory Therapy, NaturalCurrent Model
SFY13Rebase
SFY08Rebase
Survey Results
RebaseBook 2014 A.3-9 October 8, 2013

Appendix IIIDetailed Productivity Comparisons & Data
Comparison of Current Model, SFY08 Rebase, Survey Results Proposed Model Factors
- Total Hours 40.00 40.00 40 40.00 40.00- Transporting clients 0.67 0.00- Total Hours before productivity adjustments 39.33 40 40.00- Direct Service Time 30.00 32.57 35.50 38.75 39.55- Job Development Time, Employer Contact Time 1.25 0.75- Travel Time 3.75 0.00 0.00 0.00- Training Time 1.25 0.71 0.75 0.45- Time Allocated to Notes & Records 3.75 2.63 2.50 1.25 0.00- Non-Client Time 0.00- Employer time (e.g. staff meetings) 1.39 0.50 0.00- ISP meetings 1.20 0.00 0.00- Participating in assessments 0.14 0.00 0.00- Program development 0.68 0.00 0.00- Productivity Adjustment 1.33 1.23 1.13 1.03 1.01
- Total Hours 40.00 40.00 40 40.00 40.00- Direct Service Time 28.75 30.12 26.9 38.75 39.55- Job Development Time, Employer Contact Time 2.50 0.5- Travel Time 5.00 1.35 7.6 0.00- Training Time 2.50 0.87 0.75 0.45- Time Allocated to Notes & Records 3.29 2.5 1.25 0.00- Non-Client Time 1.25- Employer time (e.g. staff meetings) 2.76 0.5 0.00- ISP meetings 1.35 0.75 0.00- Participating in assessments 0.26 0.5 0.00- Program development 0.00- Productivity Adjustment 1.39 1.33 1.49 1.03 1.01
Group Supported EmploymentEmployment Support Aide,
Group Supported EmploymentCurrent Model
SFY08Rebase
Survey Results
SFY13Rebase
Survey Results
SFY13Rebase
Current Model
SFY08Rebase
Individual Supported EmploymentEmployment Support Aide,
Individual Supported EmploymentCurrent Model
SFY08Rebase
Survey Results
SFY13Rebase
Survey Results
SFY08Rebase
Current Model
Factors Offsetting Direct Care Service Hours(Productivity)
Factors Offsetting Direct Care Service Hours(Productivity)
SFY13Rebase
RebaseBook 2014 A.3-10 October 8, 2013

Appendix IIIDetailed Productivity Comparisons & Data
Comparison of Current Model, SFY08 Rebase, Survey Results Proposed Model Factors
- Total Hours 40.00 40.00 40.00 40.00 40.00 40.00- Travel Time 3.75 3.75 0.66 4.45 2.50 2.50- Time allocated to notes/med records 1.25 1.25 0.40 1.80 1.25 1.25
Training Time 0.00 0.00 0.66 1.05- Time allocated to missed appointments 0.00 0.00 0.07 0.25- Employer time (e.g. staff meetings) 0.33 0.50- ISP meetings 0.00 0.00- Participating in assessments - 0.00- Average on-site time; "Billable Hours" 35.00 35.00 37.88 31.95 36.25 36.25- Productivity Adjustment 1.14 1.14 1.06 1.25 1.10 1.10
- Total Hours 40.00- Travel Time 2.50- Time allocated to notes/med records 1.25
Training Time 0.00- Time allocated to missed appointments 0.00- Employer time (e.g. staff meetings) 0.00- ISP meetings- Participating in assessments- Average on-site time; "Billable Hours" 36.25- Productivity Adjustment 1.10
Survey Results
Specialized Habilitationwith Music Component Specialized Habilitation, Communication
Current Model
SFY08Rebase
Survey Results
SFY13Rebase
SFY13Rebase
Current Model
SFY08Rebase
Factors Offsetting Direct Care Service Hours(Productivity)
Specialized Habilitation, Behavioral-BCurrent Model
SFY08Rebase
Survey Results
SFY13Rebase
Factors Offsetting Direct Care Service Hours(Productivity)
Specialized Habilitation, Behavioral-BCurrent Model
SFY08Rebase
Survey Results
SFY13Rebase
RebaseBook 2014 A.3-11 October 8, 2013

Appendix IIIDetailed Productivity Comparisons & Data
Detailed Survey Results 07/12/13
Att
enda
nt C
are
Hom
emak
er
Hab
ilit
atio
n
IDL
A -
Hou
rly
IDL
A -
Dai
ly
Res
pite
- H
ourl
y
Res
pite
- D
aily
Spe
cial
ized
Hab
. w
/ Mus
ic
Hom
e H
ealt
h
Nur
sing
, In
term
itte
nt (
RN
)
Nur
sing
, In
term
itte
nt
(LP
N)
Nur
sing
, Vis
it
(RN
)
Nur
sing
, Vis
it
(LP
N)
Nur
sing
, C
onti
nuou
s (R
N)
Nur
sing
, C
onti
nuou
s (L
PN
)
The
rapi
st, N
atur
al
Env
iron
men
t
The
rapi
st,
Cli
nica
l E
nvir
onm
ent
The
rapy
Ass
t.,
Nat
ural
Env
iro.
The
rapy
Ass
t.,
Cli
nica
l Env
iro.
Day
Tre
atm
ent/
T
rain
ing,
Adu
lt
Day
Tre
at./
Tra
in.,
Chi
ld
Aft
er S
choo
lD
ay T
reat
./ T
rain
., C
hild
S
umm
e r
Reporting Providers24 5 21 8 9 29 5 24 0 2 2 2 2 3 2 12 10 5 3 25 5 5
Staffing Pattern (scaled to 40 hr. wk.)Direct services 36.42 38.70 33.96 36.17 37.37 36.66 37.65 38.54 ###### 23.99 23.99 23.04 23.04 37.71 37.59 34.05 34.86 27.95 27.18 36.25 28.56 28.67ISP meetings 0.30 0.00 1.06 0.57 0.37 0.73 1.68 0.00 ###### 1.05 1.05 1.04 1.04 0.39 0.41 0.27 0.37 0.69 0.49 0.40 0.18 0.05Participating in assessments 0.05 0.00 0.88 0.70 0.02 0.06 0.00 - ###### 1.77 1.77 1.77 1.77 0.39 0.42 - - - - 0.16 0.00 0.00Travel between clients 1.67 0.44 2.41 1.10 0.41 1.40 0.06 0.66 ###### 6.82 6.82 8.94 8.94 0.39 0.42 1.81 0.00 2.99 0.00 - - -Transporting clients - - - - - - - - - - - - - - - - - - - 0.83 0.00 4.32Missed appointments 0.07 0.00 0.10 0.02 0.00 0.01 0.03 0.07 ###### 1.21 1.21 0.89 0.89 0.20 0.21 0.79 1.17 1.87 1.93 - - -Recordkeeping 1.24 0.00 1.12 0.78 0.96 0.39 0.08 0.40 ###### 4.27 4.27 3.43 3.43 0.39 0.42 1.81 1.65 3.14 5.39 0.43 1.00 0.96'Employer time' (e.g. staff meetings) 0.25 0.86 0.47 0.66 0.87 0.74 0.50 0.33 ###### 0.90 0.90 0.89 0.89 0.52 0.55 0.30 0.93 1.14 2.64 0.53 2.77 0.81Program development - - - - - - - - - - - - - - - - - - - 0.60 3.23 2.78Program prep./set-up/clean-up - - - - - - - - - - - - - - - - - - - 0.78 4.26 2.40Consulting w/ doctors, teachers, etc. - - - - - - - - - - - - - - - 0.87 0.92 1.47 2.37 - - -Other activities 0.00 0.00 0.00 0.00 0.00 0.00 0.00 0.00 ###### 0.00 0.00 0.00 0.00 0.00 0.00 0.10 0.09 0.75 0.00 0.00 0.00 0.00Total 40.00 40.00 40.00 40.00 40.00 40.00 40.00 40.00 ###### 40.00 40.00 40.00 40.00 40.00 40.00 40.00 40.00 40.00 40.00 40.00 40.00 40.00
Staff TrainingFirst year of employment 50 53 47 72 87 48 36 41 ###### 36 36 36 36 26 26 39 38 27 27 59 34 34After first year of employment 11 15 10 13 16 11 12 31 ###### 17 17 17 17 16 16 24 26 19 16 16 28 27
Mileage per Week (scaled to 40 hr. wk.)Between client sessions 27 24 79 35 31 65 34 85 ###### 128 210 216 216 22 12 187 - 198 - - - -Transporting clients 12 10 69 22 132 116 9 - ###### - - - - - - -
Equipment and SuppliesEquipment cost (per consumer per year) $7 $5 $7 $1,938 $4 $1 $36 $0 $0 $0 $0 - - $12 $26 $4 $12 - - -Supplies cost (per consumer per year) $12 $8 $11 $11 $841 $13 $12 $3 $1,280 $1,280 $10 $10 $107 $107 $5 $8 $11 $30 $328 $196 $27
*All figures are weighted averages (by revenue) without outliers
In-Home Supports and Specialized Habilitation Professional Services Day Treatment and Training
RebaseBook 2014 A.3-12 October 8, 2013

Appendix IIIDetailed Productivity Comparisons & Data
Detailed Survey Results 07/12/13
Reporting Providers
Staffing Pattern (scaled to 40 hr. wk.)Direct servicesISP meetingsParticipating in assessmentsTravel between clientsTransporting clientsMissed appointmentsRecordkeeping'Employer time' (e.g. staff meetings)Program developmentProgram prep./set-up/clean-upConsulting w/ doctors, teachers, etc.Other activitiesTotal
Staff TrainingFirst year of employmentAfter first year of employment
Mileage per Week (scaled to 40 hr. wk.)Between client sessionsTransporting clients
Equipment and SuppliesEquipment cost (per consumer per year)Supplies cost (per consumer per year)
*All figures are weighted averages (by revenue) without outliers
Cen
ter-
Bas
ed
Em
ploy
men
t
Cen
ter-
Bas
ed
Em
ploy
men
t A
ide
Gro
up S
uppo
rted
E
mpl
oym
ent
Gro
up S
uppo
rted
E
mpl
oym
ent
Aid
e
Indi
vidu
al S
upp.
E
mpl
oym
ent
Indi
vidu
al S
upp.
E
mpl
oym
ent
Aid
e
Tra
nspo
rtat
ion
Gro
up H
ome
(Urb
an+
Rur
al)
Adu
lt D
ev. H
ome
Sup
er
(Urb
an+
Rur
al)
Adu
lt D
ev. H
ome
Tra
iner
(U
rban
+R
ural
)C
hild
Dev
. Hom
e S
uper
(U
rban
+R
ural
)C
hild
Dev
. Hom
e T
rain
er
(Urb
an+
Rur
al)
7 0 12 1 7 3 18 19
31.17 32.92 40.00 27.17 29.12 39.61 39.28 20.58 29.32 13.81 17.981.17 1.20 0.00 1.35 0.88 - - 3.48 - 3.36 -0.14 0.14 0.00 0.26 0.33 - - 1.06 - 4.51 -
- - - - 4.93 3.06 - - 3.46 0.00 4.76 0.000.44 0.67 0.00 - - - - - - - -
- - - - 0.24 0.00 - - 1.06 1.29 1.50 0.643.85 2.63 0.00 3.29 3.88 - - 3.63 2.40 4.57 4.141.20 1.39 0.00 2.76 2.74 0.29 0.56 3.19 1.17 4.01 2.140.08 0.68 0.00 - - - - - - - -1.94 0.37 0.00 - - - - - - - -
- - - - - - - - - - - -0.00 0.00 0.00 0.00 0.00 0.11 0.16 3.53 5.82 3.48 15.10
40.00 40.00 40.00 40.00 40.00 40.00 40.00 40.00 40.00 40.00 40.00
75 68 50 99 39 57 6124 22 10 18 12 18 14
- - - - 226 282 - -- - - - 33 13 - -
- - - - - - - -$307 - - - - - -
6 6
Supported Employment Residential Services
118 14940 54
- -- -
- -- -
RebaseBook 2014 A.3-13 October 8, 2013