01399433
DESCRIPTION
4TRANSCRIPT
Decision Support for Automated Screening ofDiabetic Retinopathy
Pallavi Kahai Kamesh Rao Namuduri Hilary ThompsonECE, Wichita State University LSU Eye Center, Louisiana State University
Wichita, KS 67208 New Orleans, LA 2234
Abstract— Diabetic Retinopathy (DR) is the leading causeof blindness. DR results in retinal disorders that include: mi-croaneurysms, drusens, hard exudates and intra-retinal micro-vascular abnormalities (IRMA). The early signs of DR aredepicted by microaneurysms among other signs. A promptdiagnosis when the disease is at the early stage can help preventirreversible damages to the diabetic eye. This paper presents adecision support framework for automated screening of earlysigns of DR and classification schemes for deducing the presenceor absence of microaneurysms are developed and tested undera univariate environment. The detection rule is based on binaryhypothesis testing problem which simplifies the problem to yes/nodecisions. An analysis of the performance of the Bayes optimalitycriteria is also presented in the paper.
I. INTRODUCTION
According to the American Diabetes Association, 18.2million of the American population which constitutes 6.3% ofthe total population, has diabetes. In the United States alone,diabetes is responsible for 8% of legal blindness, making itthe leading cause of blindness in people 20 to 74 years ofage [1], [2], [3]. Because of the asymptotic nature of thedisease and severe aftermath, it is essential that identificationand treatment starts as early as possible. If the disease remainsundetected for long it leads to permanent complications inthe retina. Researchers including the authors of this paper [4]have therefore suggested an automated screening system fordiabetic retinopathy for prompt diagnosis. Since the disordersexhibited in the early stage do not affect the vision, detectionof the disease right at it’s onset can be done only if regulareye examination of the diabetic patients are performed.
This paper suggests an automated screening system thatwould detect early signs of non-proliferative diabetic retinopa-thy (NPDR). The focus of the paper is on microaneurysms asthese are the early signs of DR and are present at all thestages as the disease progresses from mild to severe NPDR.Univariate approach has been devised to test the suitabilityof the classification mechanism with respect to the detectionof retinopathy. The entire process is composed of recognition,training and classification mechanisms. Recognition involvesdeveloping algorithms for the detection of disorders. Traininguses supervised learning and training data is obtained by ap-plying the detection algorithms to retinal images. Classificationis performed by test data subjected to unsupervised learning.In order to test the performance of the machine the resultsobtained are compared with the physician’s diagnosis. Thisapproach has been developed for one particular feature but
the feature space can be extended depending on the numberof disorders needed to be detected.
The organization of the paper is as follows: Section II dis-cusses the methodologies employed for detection of disordersrelated to diabetic retinopathy. Section III presents the decisionframework adopted for the detection of microaneurysms fol-lowed by the experimental results and conclusions in sectionIV and V respectively.
II. DETECTION OF FEATURES USING IMAGE-PROCESSING
TECHNIQUES
Researchers [5], [6], [7], [8] have approached the problem offeature detection in varied ways. A modular system developedby [9] makes use of a large database of images where featureshave been identified by the physicians and which is laterused to detect similar features in new images. The recognitionprocess employs unsupervised learning mechanism and theclassification phase uses supervised learning.
Another technique developed by [10] automatically detectsand distinguishes between different lesions (hard exudates,cotton wool spots and haemorrhages) after image enhance-ment. The image is enhanced by taking the difference betweenthe background illumination and an edge detection operator.
The detection technique used to identify a pattern dependson the feature exhibited by it. Thus, different methodologiesare employed for detecting different features. We are workingon algorithms for detection of hard exudates, microaneurysms,drusens and venous beading. Wavelet transformation whichhelps in viewing the image at multiple resolutions is beingused for detecting the hard exudates. Matched filters areused to detect microaneurysms and drusens. This paper laysemphasis on the detection of the microaneurysms and developsdecision support framework and tests it’s validity using severalretinal images.This framework can be easily extended toinclude multiple features.
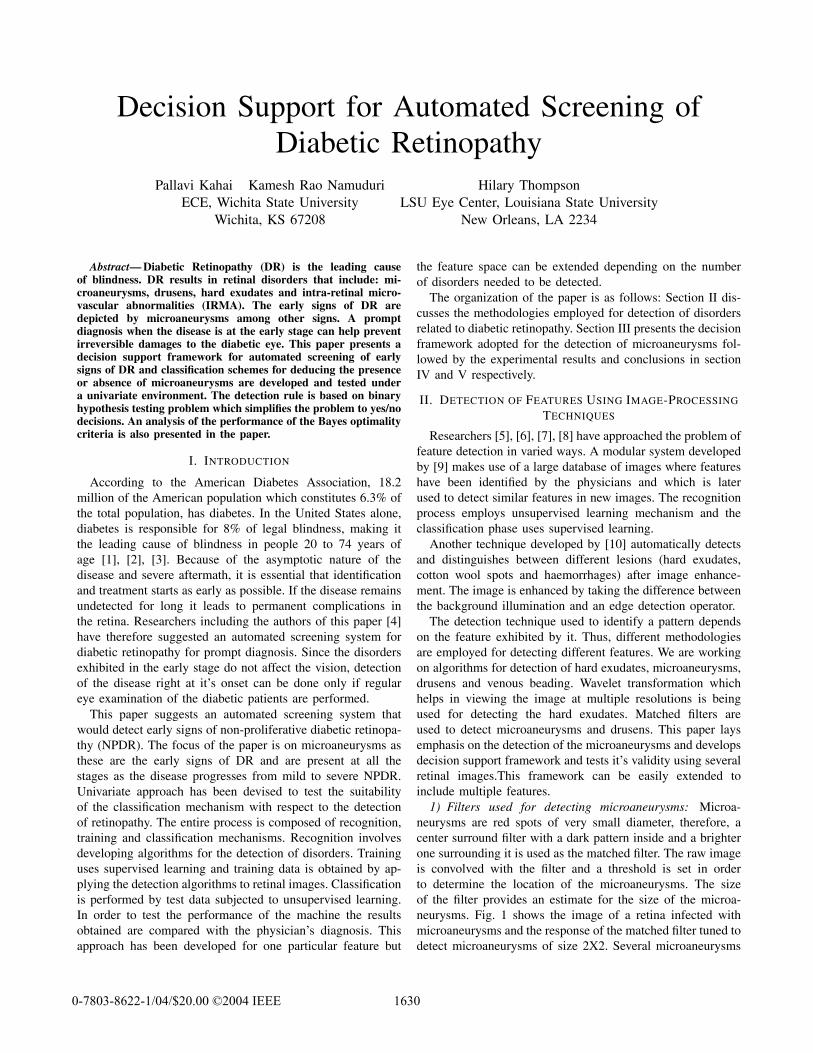
1) Filters used for detecting microaneurysms: Microa-neurysms are red spots of very small diameter, therefore, acenter surround filter with a dark pattern inside and a brighterone surrounding it is used as the matched filter. The raw imageis convolved with the filter and a threshold is set in orderto determine the location of the microaneurysms. The sizeof the filter provides an estimate for the size of the microa-neurysms. Fig. 1 shows the image of a retina infected withmicroaneurysms and the response of the matched filter tuned todetect microaneurysms of size 2X2. Several microaneurysms
16300-7803-8622-1/04/$20.00 ©2004 IEEE
have been identified on the blood vessels as well, these canbe excluded by applying appropriate constraints. For instance,detection of blood vessel can be performed first and a rulethat microaneurysms may not lie on the blood vessel can beimposed.
50 100 150 200 250
50
100
150
200
250
x x
xx xx x
xxxxx
xxx xxxx
50 100 150 200 250
50
100
150
200
250
Fig. 1. Retinal image (left) infected with microaneurysms and the matchedfilter response (right) that detects the microaneurysms of size 2X2
III. DECISION SUPPORT FRAMEWORK FOR DIABETIC
RETINOPATHY
Pattern classification can be performed using decision rules.This paper analyzes the performance of Bayes optimalitycriteria.
Diabetic Retinopathy is characterized by the presence ofone or all of the features discussed previously. Thus, a personsuffering from the disease might manifest one of the severalpatterns. Also, as the patterns are independent of each other,each of the features can be studied individually. We wouldinvestigate the presence or absence of one particular feature,that is, microaneurysms. Thus, the problem reduces to yes/nodecision making. Training data is obtained from the imagesof the retina provided by the physician. Each training instanceis composed of all the attributes and belongs to exactly oneclass among all the possible classes. For medical diagnosis, thetraining instances are the descriptions of patients with knownfinal diagnosis, attributes are the symptoms and classes arethe possible diagnosis. For the problem under considerationthe possible classes are affected retinal images (abnormalcase) and unaffected retinal images (normal case). Probabilitydensity functions are obtained for each of the states of nature,that is, for the case where a symptom is absent and for thecase where it is present.
There is a cost associated with each decision that dependson whether the decision coincides with the true diagnosis ornot. The probable classifications are thus given as:
• Correct accept/hit: A person affected with diabeticretinopathy has a true diagnosis.
• False accept/false alarm: A normal person diagnosed withdiabetic retinopathy.
• False reject/miss: An affected person diagnosed as nor-mal.
• Correct reject: A normal person classified as unaffected.
The erroneous classifications are given by false accept (FA)and false reject (FR) which are referred to as type I andtype II errors [11]. In relation to diabetic retinopathy ap-plication, the cost associated with each of these would begoverned by the amount of harm caused by a misdiagnosis.The repercussions incurred in categorizing a person affectedwith diabetic retinopathy as normal is obviously more thanthe converse. Some statisticians refer to the cost functionas the loss function. The cost or the loss associated withany misclassification is directly proportional to the severityinduced by the error.
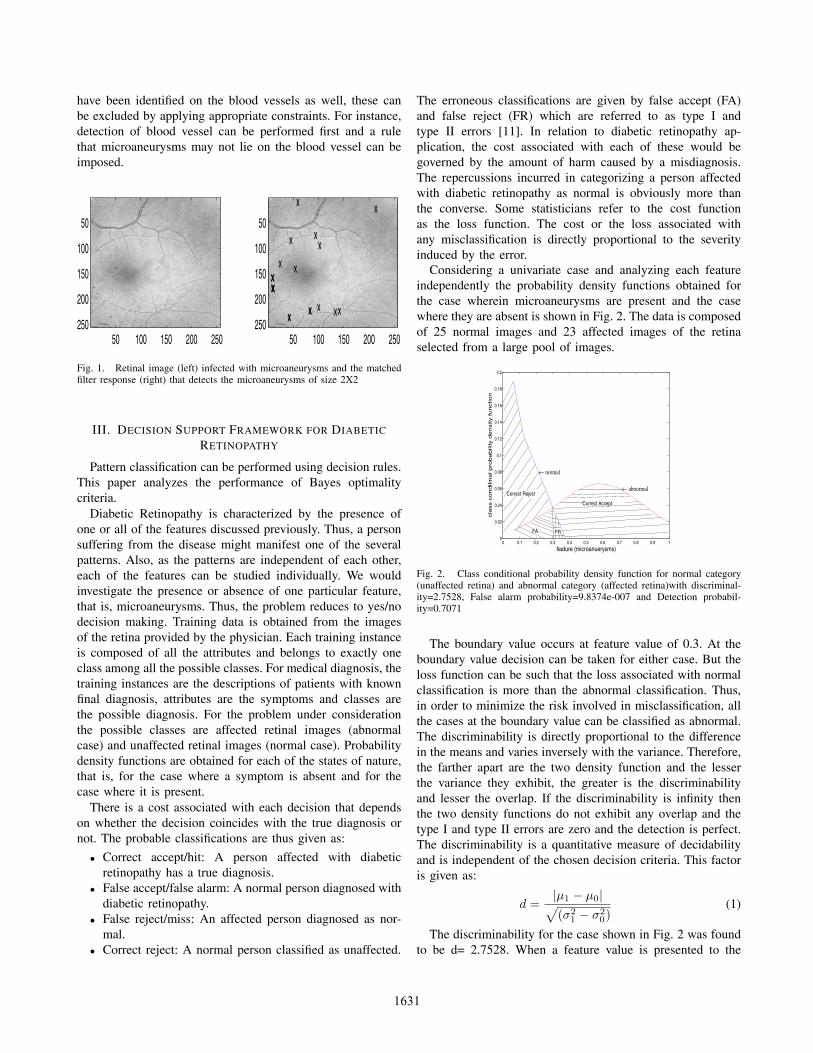
Considering a univariate case and analyzing each featureindependently the probability density functions obtained forthe case wherein microaneurysms are present and the casewhere they are absent is shown in Fig. 2. The data is composedof 25 normal images and 23 affected images of the retinaselected from a large pool of images.
0 0.1 0.2 0.3 0.4 0.5 0.6 0.7 0.8 0.9 10
0.02
0.04
0.06
0.08
0.1
0.12
0.14
0.16
0.18
0.2
feature (microanuerysms)
cla
ss c
onditin
al pro
babili
ty d
ensity function
← normal
← abnormalCorrect Reject
Correct Accept
FA FR
Fig. 2. Class conditional probability density function for normal category(unaffected retina) and abnormal category (affected retina)with discriminal-ity=2.7528, False alarm probability=9.8374e-007 and Detection probabil-ity=0.7071
The boundary value occurs at feature value of 0.3. At theboundary value decision can be taken for either case. But theloss function can be such that the loss associated with normalclassification is more than the abnormal classification. Thus,in order to minimize the risk involved in misclassification, allthe cases at the boundary value can be classified as abnormal.The discriminability is directly proportional to the differencein the means and varies inversely with the variance. Therefore,the farther apart are the two density function and the lesserthe variance they exhibit, the greater is the discriminabilityand lesser the overlap. If the discriminability is infinity thenthe two density functions do not exhibit any overlap and thetype I and type II errors are zero and the detection is perfect.The discriminability is a quantitative measure of decidabilityand is independent of the chosen decision criteria. This factoris given as:
d =|µ1 − µ0|√(σ2
1 − σ20)
(1)
The discriminability for the case shown in Fig. 2 was foundto be d= 2.7528. When a feature value is presented to the
1631
system then it can be either classified as normal or abnormal.This detection process can be treated as a binary hypothesestesting problem. The hypotheses supported are the null hy-pothesis, H0 (specifies the absence of the microaneurysms)and the alternative hypothesis, H1 (specifies the presence ofthe microaneurysms). Each of the hypothesis has a probabilitydensity function associated with it. In the case of diabeticretinopathy, each of the two categories, that is, the affectedand the unaffected, represent a Gaussian distribution wherethe feature values tend to a particular value (given by themean) but with a little variation (given by the variance). Forthe aforementioned data maximum likelihood estimation wascarried out in order to determine the conditional probabilitydensity functions and the problem was reduced to the detectionof following hypotheses:
H0 : p0 ∼ N(µ0, σ) (2)
versus
H1 : p1 ∼ N(µ1, σ) (3)
where, p0 and p1 are the density functions for the normal andthe affected case respectively. The variance obtained for thenormal and the abnormal case for the data under considerationwas found to be the same. The respective values obtained forthese two sample datasets are: µ0 = 0.0475 and µ1 = 0.5842for a variance of σ = 0.0832. Since the variance for the twocategories is the same and the difference between the meansis small, the discriminability is small. Decision rule, δ for H0
versus H1 is a function of the feature and can take either avalue of 1 or 0 depending on whether the feature belongs toH1 or H0. Also, if the feature does not belong to H1 thenit belongs to H0, i.e., H0 = Hc
1 . Therefore, the decision rulecan be mathematically represented as:
δ(x) = 1 if x ε H1
= 0 if x ε H0 = Hc1
where x is the feature. Detection can be performed by em-ploying any optimal decision criteria. This paper considersthe following detection methods.
A. Likelihood Ratio Test
The conditional p.d.f, pi(x) gives the likelihood that afeature value, x belongs to a particular state of nature Hi.The likelihood ratio is given by:
l(x) =p1(x)p0(x)
(4)
Detection method that compares the likelihood ratio with acertain threshold value is called the likelihood ratio test. Forthe Gaussian distributions considered for the two possibleclasses, the likelihood function is given as:
l(x) = eµ1−µ0
σ2 (x−µ0+µ12 ) (5)
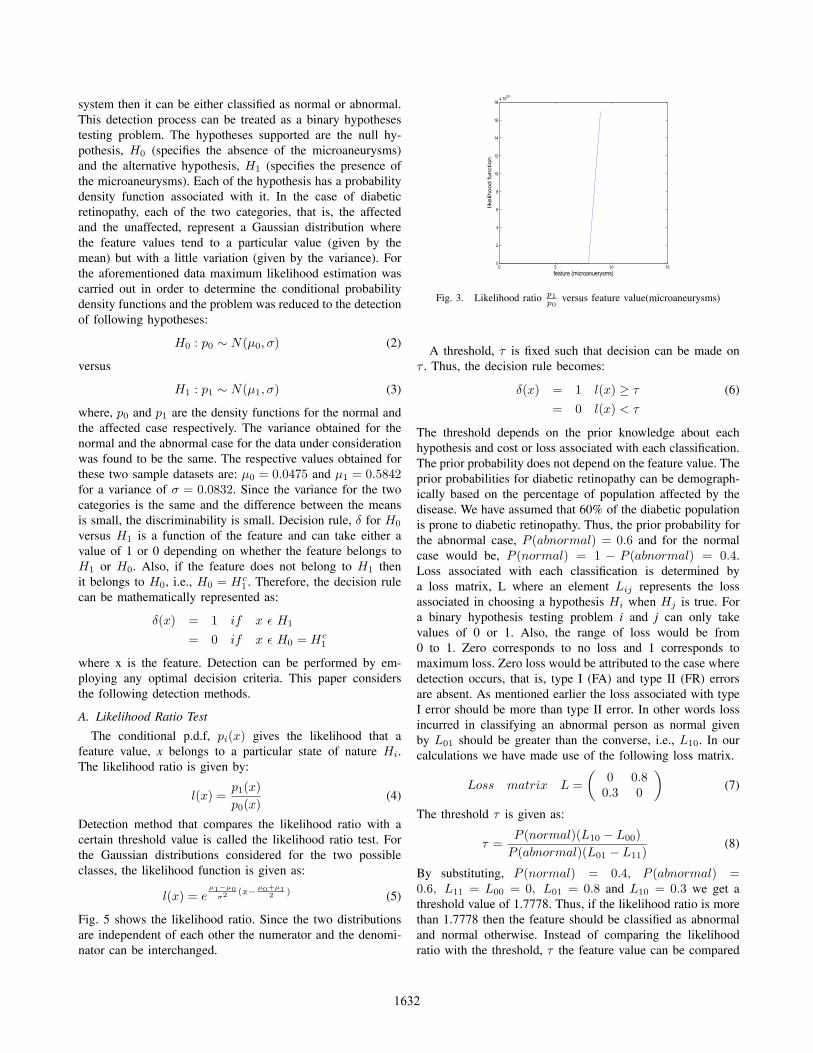
Fig. 5 shows the likelihood ratio. Since the two distributionsare independent of each other the numerator and the denomi-nator can be interchanged.
0 5 10 150
2
4
6
8
10
12
14
16
18x 10
291
feature (microanuerysms)
likelih
ood function
Fig. 3. Likelihood ratio p1p0
versus feature value(microaneurysms)
A threshold, τ is fixed such that decision can be made onτ . Thus, the decision rule becomes:
δ(x) = 1 l(x) ≥ τ (6)
= 0 l(x) < τ
The threshold depends on the prior knowledge about eachhypothesis and cost or loss associated with each classification.The prior probability does not depend on the feature value. Theprior probabilities for diabetic retinopathy can be demograph-ically based on the percentage of population affected by thedisease. We have assumed that 60% of the diabetic populationis prone to diabetic retinopathy. Thus, the prior probability forthe abnormal case, P (abnormal) = 0.6 and for the normalcase would be, P (normal) = 1 − P (abnormal) = 0.4.Loss associated with each classification is determined bya loss matrix, L where an element Lij represents the lossassociated in choosing a hypothesis Hi when Hj is true. Fora binary hypothesis testing problem i and j can only takevalues of 0 or 1. Also, the range of loss would be from0 to 1. Zero corresponds to no loss and 1 corresponds tomaximum loss. Zero loss would be attributed to the case wheredetection occurs, that is, type I (FA) and type II (FR) errorsare absent. As mentioned earlier the loss associated with typeI error should be more than type II error. In other words lossincurred in classifying an abnormal person as normal givenby L01 should be greater than the converse, i.e., L10. In ourcalculations we have made use of the following loss matrix.
Loss matrix L =(
0 0.80.3 0
)(7)
The threshold τ is given as:
τ =P (normal)(L10 − L00)
P (abnormal)(L01 − L11)(8)
By substituting, P (normal) = 0.4, P (abnormal) =0.6, L11 = L00 = 0, L01 = 0.8 and L10 = 0.3 we get athreshold value of 1.7778. Thus, if the likelihood ratio is morethan 1.7778 then the feature should be classified as abnormaland normal otherwise. Instead of comparing the likelihoodratio with the threshold, τ the feature value can be compared
1632
with a threshold, τ′
which can be derived from (5). Thresholdτ
′was found to be
τ ′ =µ0 + µ1
2+
σ2 log τ
µ1 − µ0(9)
Thus, the detector becomes:
δ(x) = 1 x ≥ µ0 + µ1
2+
σ2 log τ
µ1 − µ0(10)
= 0 x <µ0 + µ1
2+
σ2 log τ
µ1 − µ0
By substituting the appropriate value in the above equation weget τ ′ = 0.3233. Thus, if a feature value is above 0.3233 thenit can be classified as abnormal and normal otherwise.
B. Maximum a posteriori (MAP detector)
The posterior probability, unlike the prior probability, isthe conditional probability that a particular state of natureexists for a given feature value and is represented as P (Hk|x)where k represents the class index. For better comprehen-sion, we would represent the posterior probability for thenormal category as, P (normal|x) and for the abnormal caseas P (abnormal|x). In general, the posterior probability isobtained by the Bayes formula as follows:
P (Hk|x) =p(x|Hk)P (Hk)∑cl=1 p(x|Hl)P (Hl)
(11)
where, p(x|Hk) is the conditional probability or the likelihood,P (Hk) is the prior probability and c is the total number ofpossible hypotheses. The posterior probability for the normalcase is thus given as follows:
P (normal|x) =p0(x) ∗ P (normal)
p(x)(12)
where, p0(x) = p(x|H0).
Similarly, the posterior probability for the abnormal case is:
P (abnormal|x) =p1(x) ∗ P (abnormal)
p(x)(13)
where, p1(x) = p(x|H1).Here, p(x) is a scaling factor and is given as:
p(x) = p0(x) ∗ P (normal) + p1(x) ∗ P (abnormal)
Now, the decision rule is based on choosing that hypothesiswhose posterior probability is maximum and hence, it iscalled maximum a posterior estimator.So, the decision ruleis represented as:
Decide H1 if P (normal|x) > P (abnormal|x)Decide H0 otherwise
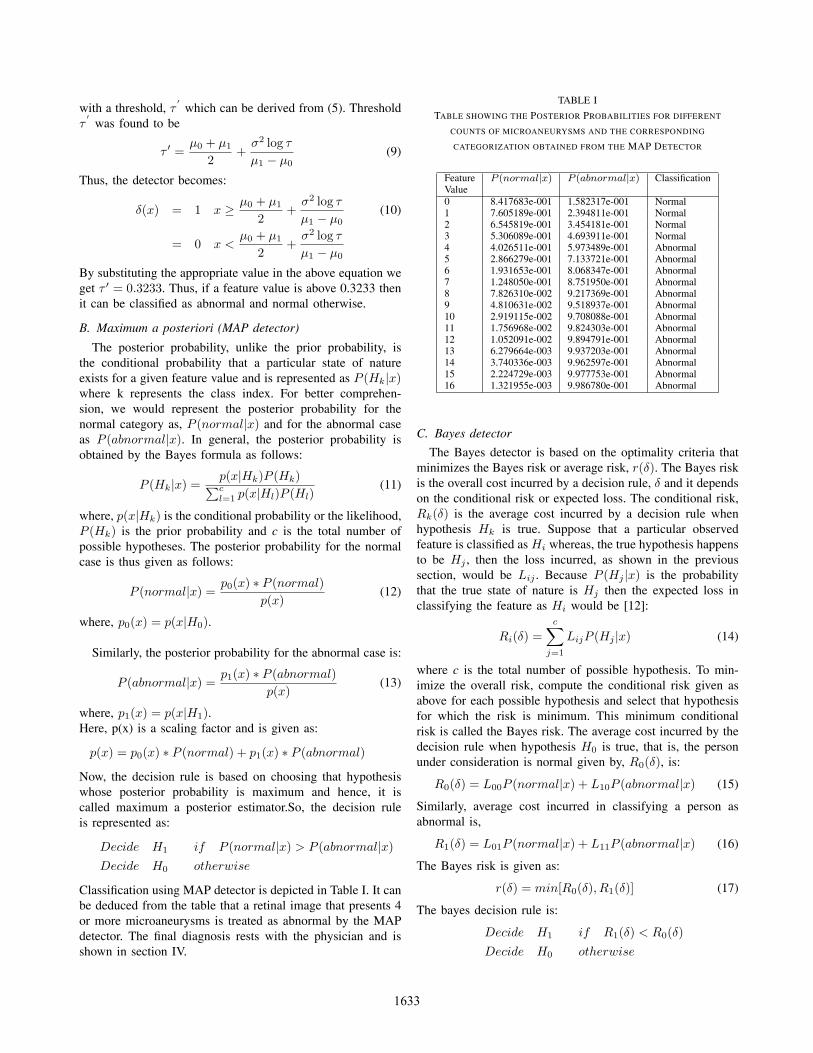
Classification using MAP detector is depicted in Table I. It canbe deduced from the table that a retinal image that presents 4or more microaneurysms is treated as abnormal by the MAPdetector. The final diagnosis rests with the physician and isshown in section IV.
TABLE I
TABLE SHOWING THE POSTERIOR PROBABILITIES FOR DIFFERENT
COUNTS OF MICROANEURYSMS AND THE CORRESPONDING
CATEGORIZATION OBTAINED FROM THE MAP DETECTOR
Feature P (normal|x) P (abnormal|x) ClassificationValue0 8.417683e-001 1.582317e-001 Normal1 7.605189e-001 2.394811e-001 Normal2 6.545819e-001 3.454181e-001 Normal3 5.306089e-001 4.693911e-001 Normal4 4.026511e-001 5.973489e-001 Abnormal5 2.866279e-001 7.133721e-001 Abnormal6 1.931653e-001 8.068347e-001 Abnormal7 1.248050e-001 8.751950e-001 Abnormal8 7.826310e-002 9.217369e-001 Abnormal9 4.810631e-002 9.518937e-001 Abnormal10 2.919115e-002 9.708088e-001 Abnormal11 1.756968e-002 9.824303e-001 Abnormal12 1.052091e-002 9.894791e-001 Abnormal13 6.279664e-003 9.937203e-001 Abnormal14 3.740336e-003 9.962597e-001 Abnormal15 2.224729e-003 9.977753e-001 Abnormal16 1.321955e-003 9.986780e-001 Abnormal
C. Bayes detector
The Bayes detector is based on the optimality criteria thatminimizes the Bayes risk or average risk, r(δ). The Bayes riskis the overall cost incurred by a decision rule, δ and it dependson the conditional risk or expected loss. The conditional risk,Rk(δ) is the average cost incurred by a decision rule whenhypothesis Hk is true. Suppose that a particular observedfeature is classified as Hi whereas, the true hypothesis happensto be Hj , then the loss incurred, as shown in the previoussection, would be Lij . Because P (Hj |x) is the probabilitythat the true state of nature is Hj then the expected loss inclassifying the feature as Hi would be [12]:
Ri(δ) =c∑
j=1
LijP (Hj |x) (14)
where c is the total number of possible hypothesis. To min-imize the overall risk, compute the conditional risk given asabove for each possible hypothesis and select that hypothesisfor which the risk is minimum. This minimum conditionalrisk is called the Bayes risk. The average cost incurred by thedecision rule when hypothesis H0 is true, that is, the personunder consideration is normal given by, R0(δ), is:
R0(δ) = L00P (normal|x) + L10P (abnormal|x) (15)
Similarly, average cost incurred in classifying a person asabnormal is,
R1(δ) = L01P (normal|x) + L11P (abnormal|x) (16)
The Bayes risk is given as:
r(δ) = min[R0(δ), R1(δ)] (17)
The bayes decision rule is:
Decide H1 if R1(δ) < R0(δ)Decide H0 otherwise
1633
The Bayes detector does not provide any condition at theboundary. Therefore, the boundary feature values at whichthe probability of classifying in to each of the categoriesis the same, the feature can be classified into any category.Specifically, at the boundary we should be able to classifyeach feature as abnormal so that a person for whom the truehypothesis is abnormal is not misdiagnosed.
IV. EXPERIMENTAL RESULTS
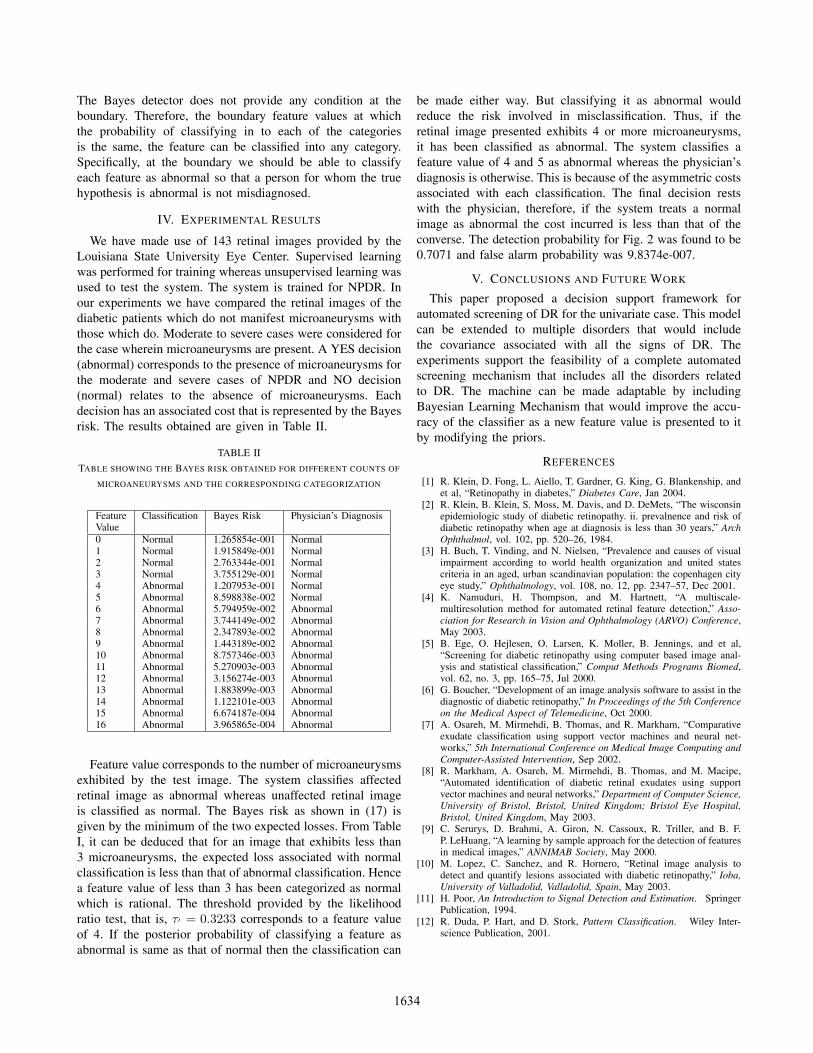
We have made use of 143 retinal images provided by theLouisiana State University Eye Center. Supervised learningwas performed for training whereas unsupervised learning wasused to test the system. The system is trained for NPDR. Inour experiments we have compared the retinal images of thediabetic patients which do not manifest microaneurysms withthose which do. Moderate to severe cases were considered forthe case wherein microaneurysms are present. A YES decision(abnormal) corresponds to the presence of microaneurysms forthe moderate and severe cases of NPDR and NO decision(normal) relates to the absence of microaneurysms. Eachdecision has an associated cost that is represented by the Bayesrisk. The results obtained are given in Table II.
TABLE II
TABLE SHOWING THE BAYES RISK OBTAINED FOR DIFFERENT COUNTS OF
MICROANEURYSMS AND THE CORRESPONDING CATEGORIZATION
Feature Classification Bayes Risk Physician’s DiagnosisValue0 Normal 1.265854e-001 Normal1 Normal 1.915849e-001 Normal2 Normal 2.763344e-001 Normal3 Normal 3.755129e-001 Normal4 Abnormal 1.207953e-001 Normal5 Abnormal 8.598838e-002 Normal6 Abnormal 5.794959e-002 Abnormal7 Abnormal 3.744149e-002 Abnormal8 Abnormal 2.347893e-002 Abnormal9 Abnormal 1.443189e-002 Abnormal10 Abnormal 8.757346e-003 Abnormal11 Abnormal 5.270903e-003 Abnormal12 Abnormal 3.156274e-003 Abnormal13 Abnormal 1.883899e-003 Abnormal14 Abnormal 1.122101e-003 Abnormal15 Abnormal 6.674187e-004 Abnormal16 Abnormal 3.965865e-004 Abnormal
Feature value corresponds to the number of microaneurysmsexhibited by the test image. The system classifies affectedretinal image as abnormal whereas unaffected retinal imageis classified as normal. The Bayes risk as shown in (17) isgiven by the minimum of the two expected losses. From TableI, it can be deduced that for an image that exhibits less than3 microaneurysms, the expected loss associated with normalclassification is less than that of abnormal classification. Hencea feature value of less than 3 has been categorized as normalwhich is rational. The threshold provided by the likelihoodratio test, that is, τ′ = 0.3233 corresponds to a feature valueof 4. If the posterior probability of classifying a feature asabnormal is same as that of normal then the classification can
be made either way. But classifying it as abnormal wouldreduce the risk involved in misclassification. Thus, if theretinal image presented exhibits 4 or more microaneurysms,it has been classified as abnormal. The system classifies afeature value of 4 and 5 as abnormal whereas the physician’sdiagnosis is otherwise. This is because of the asymmetric costsassociated with each classification. The final decision restswith the physician, therefore, if the system treats a normalimage as abnormal the cost incurred is less than that of theconverse. The detection probability for Fig. 2 was found to be0.7071 and false alarm probability was 9.8374e-007.
V. CONCLUSIONS AND FUTURE WORK
This paper proposed a decision support framework forautomated screening of DR for the univariate case. This modelcan be extended to multiple disorders that would includethe covariance associated with all the signs of DR. Theexperiments support the feasibility of a complete automatedscreening mechanism that includes all the disorders relatedto DR. The machine can be made adaptable by includingBayesian Learning Mechanism that would improve the accu-racy of the classifier as a new feature value is presented to itby modifying the priors.
REFERENCES
[1] R. Klein, D. Fong, L. Aiello, T. Gardner, G. King, G. Blankenship, andet al, “Retinopathy in diabetes,” Diabetes Care, Jan 2004.
[2] R. Klein, B. Klein, S. Moss, M. Davis, and D. DeMets, “The wisconsinepidemiologic study of diabetic retinopathy. ii. prevalnence and risk ofdiabetic retinopathy when age at diagnosis is less than 30 years,” ArchOphthalmol, vol. 102, pp. 520–26, 1984.
[3] H. Buch, T. Vinding, and N. Nielsen, “Prevalence and causes of visualimpairment according to world health organization and united statescriteria in an aged, urban scandinavian population: the copenhagen cityeye study,” Ophthalmology, vol. 108, no. 12, pp. 2347–57, Dec 2001.
[4] K. Namuduri, H. Thompson, and M. Hartnett, “A multiscale-multiresolution method for automated retinal feature detection,” Asso-ciation for Research in Vision and Ophthalmology (ARVO) Conference,May 2003.
[5] B. Ege, O. Hejlesen, O. Larsen, K. Moller, B. Jennings, and et al,“Screening for diabetic retinopathy using computer based image anal-ysis and statistical classification,” Comput Methods Programs Biomed,vol. 62, no. 3, pp. 165–75, Jul 2000.
[6] G. Boucher, “Development of an image analysis software to assist in thediagnostic of diabetic retinopathy,” In Proceedings of the 5th Conferenceon the Medical Aspect of Telemedicine, Oct 2000.
[7] A. Osareh, M. Mirmehdi, B. Thomas, and R. Markham, “Comparativeexudate classification using support vector machines and neural net-works,” 5th International Conference on Medical Image Computing andComputer-Assisted Intervention, Sep 2002.
[8] R. Markham, A. Osareh, M. Mirmehdi, B. Thomas, and M. Macipe,“Automated identification of diabetic retinal exudates using supportvector machines and neural networks,” Department of Computer Science,University of Bristol, Bristol, United Kingdom; Bristol Eye Hospital,Bristol, United Kingdom, May 2003.
[9] C. Serurys, D. Brahmi, A. Giron, N. Cassoux, R. Triller, and B. F.P. LeHuang, “A learning by sample approach for the detection of featuresin medical images,” ANNIMAB Society, May 2000.
[10] M. Lopez, C. Sanchez, and R. Hornero, “Retinal image analysis todetect and quantify lesions associated with diabetic retinopathy,” Ioba,University of Valladolid, Valladolid, Spain, May 2003.
[11] H. Poor, An Introduction to Signal Detection and Estimation. SpringerPublication, 1994.
[12] R. Duda, P. Hart, and D. Stork, Pattern Classification. Wiley Inter-science Publication, 2001.
1634