0126 67)ir資料fy2017 3q決算(e) 配布 v1ir...16.2 bn yen, in line with previous year levels....
TRANSCRIPT

Copyright © 2018 M3, Inc. All rights reserved.
M3, Inc.Presentation Material
M3, Inc.Presentation Material
January 2018

Copyright © 2018 M3, Inc. All rights reserved. 1
The following presentation contains forecasts, future plans, management targets and other forward-looking projections relating to M3, Inc. and/or its group. These statements are drawn from assumptions of future events based on data currently available to us, and there exist possibilities that such assumptions are objectively incorrect and/or may produce differing actual results from those mentioned in the statements.
Furthermore, information and data other than those concerning the Company and its subsidiaries/affiliates are quoted from public information, and the Company has not verified and will not warrant its accuracy or dependency.
M3, Inc.

Copyright © 2018 M3, Inc. All rights reserved. 2
Current Business Situation and Outlook

Copyright © 2018 M3, Inc. All rights reserved. 3
Overview
Evidence SolutionEvidence Solution
CareerSolutionCareer
Solution
OverseasOverseas
Other TopicsOther Topics
Sales of IDA and a dip in projects at SMO Neues resulted in sales of 16.2 bn yen, in line with previous year levels. However, backlog at Neues has revived to previous year levels, and CRO profits grew +16% yoy
Orders backlog remains at 29 bn yen, with op margins stable at 24%
Business expanded as user demand increased with sales at 8.2 bnyen (+24% yoy) and op. profit at 2.3 bn yen significant recovery and absorption of upfront investment in personnel in Q1, with Q3 stand alone op. profit growth at +79% yoy
Continued sales and profit growth led by the research business development and improvement in the US and UK. QQFS consolidation expanded membership panel to cover Norther Europe
Sales: 16.9 bn yen (+50% yoy), Op. Profit: 2.6 bn yen (+119% yoy)
Acceleration in initiatives within the field of advanced medicine– Approval for other utilities of DuraBeamTM proceeding as scheduled– Consolidation of JAMECS and capital alliance with Genomix
MedicalPlatformMedicalPlatform
Expansion of marketing support business for pharmaceutical and medical device companies, with orders increase of around +15% yoy
Sales: 24.4 bn yen (+19% yoy), Op. Profit: 11.7 bn yen (+10% yoy)

Copyright © 2018 M3, Inc. All rights reserved. 4
FY 2017 Q3 Results

Copyright © 2018 M3, Inc. All rights reserved. 5
FY2017 Q3 Consolidated Results (Apr~Dec 2017)
Sales Pretax Profit* Net ProfitOperating Profit
IFRS(million yen)
FY16Q3
FY17Q3
FY16Q3
FY17Q3
FY16Q3
FY17Q3
FY16Q3
FY17Q3
56,301
68,560
18,646
22,498
18,628
22,604
12,534
15,619
+25%+21%+22% +21%

Copyright © 2018 M3, Inc. All rights reserved. 6
IFRS
FY2017 Q3 Consolidated Results by Segment
(unit: million yen)FY2016
Q3FY2017
Q3YoY
(cumulative)
Medical Platform
Sales 20,464 24,408 +19% *Profit 10,653 11,728 +10%
Evidence Solution
Sales 16,502 16,215 -2% **Profit 3,912 3,824 -2%
CareerSolution
Sales 6,584 8,156 +24% ***Profit 2,101 2,315 +10%
OverseasSales 11,250 16,870 +50%Profit 1,186 2,597 +119%
Other Emerging Businesses
Sales 3,007 4,537 +51%Profit 764 1,057 +39%
* Consolidation of newly acquired subsidiaries contributed more to sales than profits.** Due to sale of IDA, and trough in sales at SMO Neues. *** Significant improvement after large upfront investment in Q1 in personnel.
US, EU, and China all healthy
Q1 incurred upfront hiring costs, however, Q3 acceleration outpaced that of Q2. Oct-Dec Profit: +79% yoy
Revival of orders seen at Neues, growth expected to end positive for the full year
Continuing expansion of future growth drivers
Organic business op. margin remains stable

Copyright © 2018 M3, Inc. All rights reserved. 7
Consolidated Sales Expansion and Business Breakdown
(unit: million yen)
Medical platform has shown sound growth, while platform linked and overseas have expanded rapidly.
3,854
14,646
78,143
35%
44%
21%
FY05 FY10 FY16
Overseas
Platform Linked

Copyright © 2018 M3, Inc. All rights reserved. 8
Medical PlatformMedical Platform
Platform Linked Business
M3’s Growth

Copyright © 2018 M3, Inc. All rights reserved. 9
Doctor’s Time Allocation vs Pharma’s Budget Allocation
Internet
Sales Reps
Other(conferences, publications, etc.)
Time Allocationof doctors collecting info
Marketing Budget Allocationof drug companies in Japan
Doctors spend the most time collecting information via the Internet. However, pharmaceutical firms operating in Japan spend the majority of their marketing budget on off-line sales rep related costs.
Sales Reps:
~1.5 tril yen
Other:~100 bn yen
Internet:~ 20 bn yen
Source: M3 research, percentages are approximate
44%
39%
17%
7%
1%
92%

Copyright © 2018 M3, Inc. All rights reserved. 10
Currently Full Potential
(approx.)
50Companies
100Companies
Main CLIENTS
GrowthPotentialof 4~5xcurrent levels
Increase in broader service usage from mid-sized clients.
Average revenues from top 20 clients grew at approx. 8% YoY
(approx.)
¥500 mnSALES per CLIENT
¥0.8 bn ~ ¥1 bnper client
drivers: # of products # of opt-in MDs Added value of contents
Medical Platform Growth Potential in Japan

Copyright © 2018 M3, Inc. All rights reserved. 11
Medical Platform Services
Strategy Planning
Content Production
Message Delivery Deal Closing
Marketing Process at Healthcare Related Companies
PharmaCompany
Needs
Corresponding Department
M3 Services
Product strategy development
Efficient message delivery to the medical scene
Product sales expansion
Corporate Planning
Marketing
MarketingMulti-channel
Group
SalesCorporate
Planning
M3 ResearchMx Data
Web Conference
One Point eDetail
CSOMedical
MarketerM3 Database
Key message identification and content production
Marketing
Web Content Creation
MR-kunMR-kun FamilyExtended Services
Agency Business
MR-kun
Expanded service line-up to accommodate a wider range of marketing needs, unlimited to just information delivery (original MR-kun), as a one stop shop

Copyright © 2018 M3, Inc. All rights reserved. 12
Medical Platform
Platform Linked BusinessPlatform Linked Business
M3’s Growth

Copyright © 2018 M3, Inc. All rights reserved. 13
“Making use of the Internet to increase, as much as possible, the number of people who can live longer and healthier lives, and to reduce as much as possible, the amount of unnecessary medical costs.”
~ 2010
2011 ~
Evolution via MR-kun for pharmaceuticale-Marketing
Evolution via Mr. Finder for pharmaceutical e-R&D
Power of Mr. Finder in Drug Development
PlusPlus

Copyright © 2018 M3, Inc. All rights reserved. 14
Case study
Patient Enrollment in Large-Scale Trials
Other SMOs
Mr. Finder dramatically outpaced competitors both by number and speed in enrolling cases for a particular Endocrinology trial
Num
ber o
f Pat
ient
s En
rolle
d
0100200300400500600700800900
1,0001,1001,2001,3001,4001,500
A B C D E F G H I J K Lm3.com
Expedited enrollment of motivated physicians and patients compared to other SMOs

Copyright © 2018 M3, Inc. All rights reserved. 15
Orders backlog remained around 29bn yen, with corresponding increases in headcount as upfront investment
Sales stayed flat due to a dip in projects at SMO Neues, however, margins remained high at 24%
IRFS
FY09 10 11 12 13 14 15 16 17Q3
Sales and Profit Trend of Evidence Solution(million yen)
Segment ProfitSales
FY17 FCT24 bn yen
1,370 1,860 2,3214,283
6,554
13,195
19,99222,313
16,215
-288 -58
423 517 1,126 1,7993,908
5,3283,824

Copyright © 2018 M3, Inc. All rights reserved. 16
+511 -5993,912 3,824
FY16Q3
CRO SMO,others
FY17Q3
Performance remained healthy at CROs, however, factors such as SMO Neues hitting a dip resulted in the quarter ending flat yoy. SMO orders recovery trend seen into Q4.
(unit: million jpy)
・Healthy sales and profits as expected. Oct-Dec sales +5% yoy
・Temporary dip in projects at SMONeues・Deconsolidation of IDA; expected to also impact Q42 by -80 mil yen. Full collection of invested capital, with profit of 85 mil yen.

Copyright © 2018 M3, Inc. All rights reserved. 17
Neues on Recovery Track
0
500
1,000
1,500
2,000
2,500
3,000
3,500
1Q 2Q 3Q 4Q 1Q 2Q 3Q 4Q
Backlog on recovery path
Oct-Dec turned profitable, with further improvement expected in Q4.
Orders hit a low in Q1 of FY17, and Q3 saw recovery to level of the previous year. Performance also improving.
Orders Backlog at Quarter Ends
FY2016 FY2017
(Million Yen)

Copyright © 2018 M3, Inc. All rights reserved. 18
(million yen)
FY17 FCT10.5 bn yen
IFRS
Career2Sales and Profit Trend of M3 Career
Ordinary ProfitSales
FY10 11 12 13 14 15 16 17Q3
Sales and profit expansion from increase in staff and productivity
FY17 should see continued traction from job placement for physicians
Absorbed upfront hiring impact from Q1, and returned to the usual growth rate
1,4332,191
3,235
4,5945,712
6,925
8,6318,156
177 437 749 1,0701,757
2,264 2,503 2,315

Copyright © 2018 M3, Inc. All rights reserved. 19
Medical Platform
Platform Linked Business
M3’s Growth

Copyright © 2018 M3, Inc. All rights reserved. 20
Japan (m3.com)
U.S.A (MDLinx)
U.K. (Doctors.net.uk)
Other Nations(M3 Global Research, MDLinx, Russia)Korea (Medigate)
(thousand)
China (Medlive)
FY08 09 10 11 12 13 14 15 16 17Q3
Number of Physician Members and Panelists (Global)
India
France, Germany, Spain (VidalGroup)
0
500
1,000
1,500
2,000
2,500
3,000
3,500
4,000
4,500
4+ millionmembers worldwide
Over 4 million physicians utilize M3’s global platforms

Copyright © 2018 M3, Inc. All rights reserved. 21
China: Membership ExpansionNumber of Physician Members in China
(thousands)
Topped 2 million physicians members, covering the majority of doctors in China
Marketing services for drug companies starting with MR-kun, and marketing research services showed steady growth
MR-kun is now being utilized for 35 drugs across 11 pharmaceutical companies
Launched career services for physicians
9531,019
1,0961,1541,250
1,3621,490
1,5611,6171,680
1,7531,838
1,9081,985
2,026
Q1 Q2 Q3 Q4 Q1 Q2 Q3 Q4 Q1 Q2 Q3 Q4 Q1 Q2 Q3FY14 FY15 FY16 FY17
Copyright © 2018 M3, Inc. All rights reserved. 22
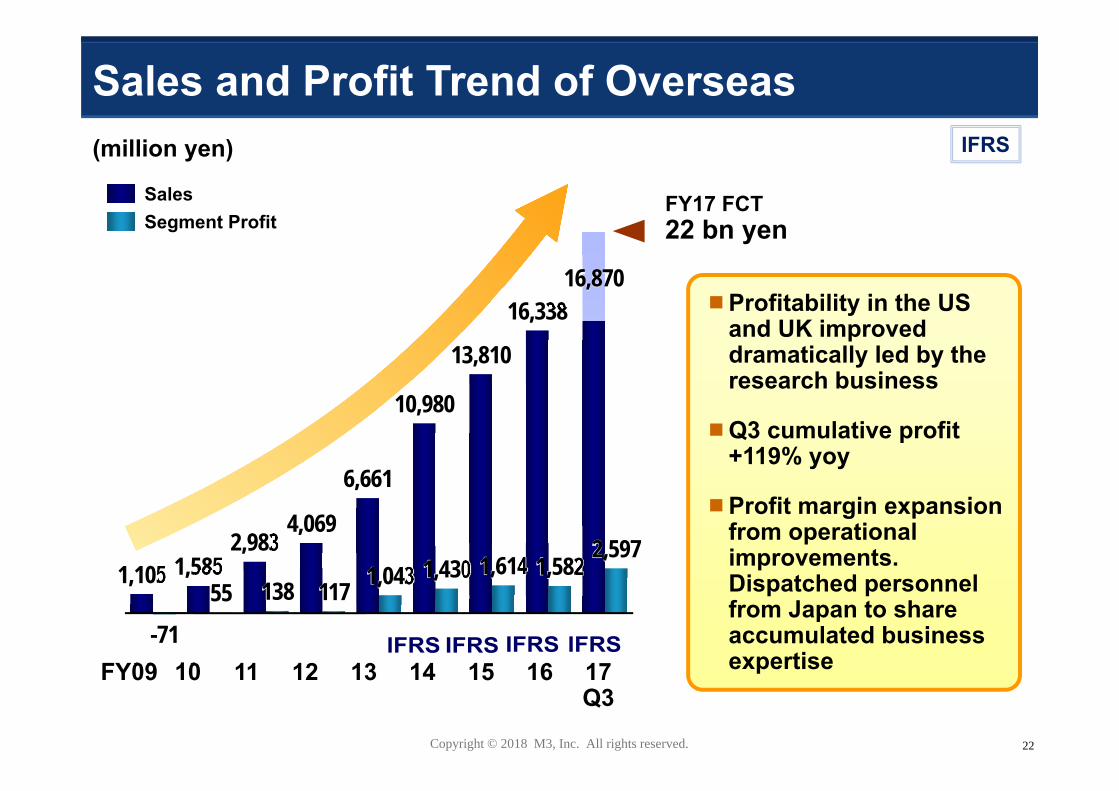
(million yen)
FY17 FCT22 bn yen
IFRS
Sales and Profit Trend of Overseas
Segment ProfitSales
FY09 10 11 12 13 14 15 16 17Q3
Profitability in the US and UK improved dramatically led by the research business
Q3 cumulative profit +119% yoy
Profit margin expansion from operational improvements. Dispatched personnel from Japan to share accumulated business expertise
1,105 1,5852,983
4,069
6,661
10,980
13,810
16,33816,870
-7155 138 117 1,043 1,430 1,614 1,582
2,597

Copyright © 2018 M3, Inc. All rights reserved. 23
+937+230 +115
+129
1,186
2,597Both sales and profit healthy as expected
Profitability improved led by research business
Research business healthy
Healthy expansion in China MR-kun, Q3 cumul. profit doubled yoy
Overseas Segment Profit Breakdown(million yen)
2.2xYoY
FY16Q1-3
FranceVidal
US UK China,Others
FY17Q1-3
US and UK profit expanded in addition to contribution from Vidal. China also at a growth stage.

Copyright © 2018 M3, Inc. All rights reserved. 24
M3 Group’s Business Strategy

Copyright © 2018 M3, Inc. All rights reserved. 25
New Service Development in the Medical Internet Sector
Internet-Powered PE Style Business Expansion in
Healthcare Industry(2000~2010) (2011~)
ApproachApproach Internet Internet + Real Operations
Service CoverageService
CoverageWeb-based
eTools Entire Value-Chain
Potential Business Domains
Potential Business Domains ~10 30 ~ 50
(~ 200 including overseas)
ProfitabilityProfitability High profitability(Mid absolute profit)
High absolute profit(Mid profitability)
M&AM&A Small Medium ~ Large
M3 is uniquely positioned to transform the health care industry via its 1) Platform 2) Industry Expertise and 3) Human Resources (management and engineering)
Strategy Change in Business Development

Copyright © 2018 M3, Inc. All rights reserved. 26
Evolution of M3 Growth Drivers
Main Initiatives
Full-scale entry into the field of Advanced Medicine, as the third growth driver for M3
Added ValueCreation
2000 2010 2020
Seeds Rocket / M3iVarious solutions within
cancer specialtiesM3 AI LaboGenome Diagnosis / G-TAC
e-Clinical TrialsM3 Career (Job placement
for physicians)
MR-kun FamilyWeb Surveys

Copyright © 2018 M3, Inc. All rights reserved. 27
Businesses Supported by the Advanced Medicine Platform
Continued fortification and commonization of the M3 platform.Objective to expand the advanced medicine business to equal or greater scale than existing businesses such as “MR-kun Family” and “Clinical Trials”
ClinicalTrial
Execution
MarketChannel
ExpansionAdministrationEnhancement
BusinessAdministrationEnhancement
WebMarketing
MarketabilityEvaluation
RegulatoryStrategy
Tama Bio COSMOTEC βα ・ ・ ・
Organic M&A
Advanced Medicine Platform
S u p p o r t S u p p o r t S u p p o r t S u p p o r t S u p p o r t
M&A
JAMECS

Copyright © 2018 M3, Inc. All rights reserved. 28
M3’s A.I. Initiatives within Healthcare
A I
Highly expert team
consisting 10+ members such
as A.I. engineers and data scientists
Analysis of user activity logs across M3 operated sites such as m3.com
Application of A.I. to optimally customize user experiences created an uplift of a few billion yen in profit
Established internal team dedicated to A.I. medical device regulations
Including induction of overseas technologies, results already seen in several diagnostic imaging areas, with product development (approval) in progress
Provision of M3 resources to support companies researching frontline A.I. medical technologies
Large scale partnerships in review
Accuracy of Diagnosis for Disease X
Personalized Content Delivery
94%
95%
Sensitivity
Specificity
LPixel β ・・・α
A.I. Support Platform
Support Support Support
Website Activation
A.I. Diagnostics
Incubation

Copyright © 2018 M3, Inc. All rights reserved. 29
M3’s Genome Business Development
GenomeBusiness
Expansion of professional genome diagnostic test lineup offered by GTAC. Partnerships with 11 overseas producers of leading edge diagnostics. Over 30 types of tests now available through the platform
Alliances with over 1,800 medical institutions to provide genome diagnostic tests offered by GTAC. Expected to top 2,000 institutions in the near future
Over 7 top medical institutions now offering P5’s cancer diagnostic test(OKAYAMA UNIVERSITY HOSPITAL, FUJITA HEALTH UNVERSITY HOSPITAL, Kobe City Medical Center General Hospital, others)
Addition of over 20 more institutions underway
Genome Diagnostics Lineup
GTAC Diagnostics Partnership Facilities
P5 Diagnostics Provision Facilities
1,600
1,700
1,800
1,900
2,000
Medical Site Alliances

Copyright © 2018 M3, Inc. All rights reserved. 30
M3 is Just Getting Started

Copyright © 2018 M3, Inc. All rights reserved. 31
Upfront Investment Costs for Future Growth
Total0.8~1.5mn yen
(Unit: Million Yen)
Special costs incurred in anticipation of 0.8~1.5 bn yen. Aggressive upfront investment to continue.
88
740
710 1,538

Copyright © 2018 M3, Inc. All rights reserved. 32
Sales Operating Profit & Net Profit
(mn yen) (mn yen)
* Extraordinary profit from acquisition of MPI: 1,034 mn yen
00(6m)
01 02 03 04 05 06 07 08 09 10 11 12 13 14 15 16 17FCT
Annual Results & Forecast for FY2017
Operating ProfitNet Profit
107 480 891 1,563 2,276 3,854 5,729 7,475 8,534 11,811
14,646 19,040
26,007
36,759
51,346
64,660
78,143
90,000
00(6m)
01 02 03 04 05 06 07 08 09 10 11 12 13 14 15 16 17FCT
13,738
8,878
-93
46 255 509 895 1,683 2,677
3,597 3,990 4,803 6,031
7,648 9,294
12,704*
16,061
20,022
25,050
29,000
-93
62 136 279 493 991 1,609 1,965 2,363 1,938 3,486
4,492 5,598 7,844*
10,428
13,493
16,938
19,500

Copyright © 2018 M3, Inc. All rights reserved. 33
M3
MedicineMediaMetamorphosis
Healthcare sector is enormous…
・ Japanese national spending on medical services is approximately ¥33tn (¥50tn including peripheral businesses)
・ Equivalent to 10% of Japanese GDP・ Sector controlled by only 290,000 physicians
(0.2% of the national population)
Aim to create new value
・ Provide solutions within the healthcare sector・ Provide new and unique business models・ Specialize in niches areas that provide opportunity for
high value creation and high profits in order to boost enterprise value
Creating New Value in Healthcare

Copyright © 2018 M3, Inc. All rights reserved. 34
Appendix

Copyright © 2018 M3, Inc. All rights reserved. 35
Segment Definition Changes
Combined all related businesses into this Medical Platform segment given the development of businesses that integrate internet and real operational capabilities
Extracted as a new segment due to the nature and expanded size of the business
Combined other emerging businesses and the consumer business originally under the previous Medical Portal
Previous and New Segment Correspondence ChartOriginal Segments
Medical Portal Evidence Solution
Clinical
Platform
Sales Platform
Overseas
Others
MR
-kun Fam
ily
Research
/Data
M3
Career
Ask
Doctors
New
Segm
ents
Medical Platform ● ● ● ●
Evidence Solution ●
Career Solution ●
Overseas ●
Other Emerging Businesses
● ●