012-041 gdf06 ch01 - world banksiteresources.worldbank.org/.../gdf2006chap1.pdf ·...
TRANSCRIPT

012-041_GDF06_ch01.qxd 5/24/06 2:30 PM Page 12

1Prospects for the Global Economy
Summary of the outlook
Confronted with capacity constraints in the re-source sector, sharp rises in commodity prices,
and a tightening of monetary policy among Or-ganisation for Economic Co-operation and Devel-opment (OECD) countries, the global economyhas slowed from the record pace posted in 2004.Nevertheless growth remains robust, especiallyamong developing countries. Their GDP increased6.4 percent in 2005 (4.3 percent for oil-importingdeveloping economies, excluding India and China)as compared with 2.8 percent among high-incomecountries. The resilience of developing countries—which reflects a sustained improvement in the po-tential growth rate of many developing countries—has been heartening, especially given the magnitudeof the oil-price shock. This brisk expansion is pro-jected to continue, but slow towards a more sus-tainable pace of 5.9 percent by 2008. Such rapidgrowth argues against a sharp decline in oil prices,which are expected to remain above or close to $60a barrel through 2008.
This relatively benign soft-landing scenariofor developing countries faces both internal andexternal risks. First, the high growth of the pastseveral years is generating tensions within individ-ual countries. In several East European countriesthis has taken the form of rising inflation, currencyappreciation, and high current-account deficits,while in others it has expressed itself in rising assetprices, inflationary pressure, and growing domes-tic tensions between fast and slower growing re-gions and sectors. Second, many of the buffers thatpermitted countries to absorb higher oil priceswith a minimum of disruption have been ex-hausted, and countries have yet to fully adjust to
13
.
higher oil prices. As a result, developing countriesare much more vulnerable to potential externalshocks, such as a disruptive resolution of globalimbalances, a decline in nonoil commodity prices,or a hike in oil prices following a supply shock.
High oil prices have had only a limited impacton global growthLower oil intensities, more flexible product andlabor markets, exchange rate flexibility, and morecredible monetary policy have all reduced the real-side and inflationary impacts of higher oil prices. Asa result, and in contrast to past episodes, monetarypolicy has remained accommodative and interestrates low. This, plus the fact that oil deliveries havecontinued to increase rapidly (as opposed to the1970s and 1980s, when supply was cut), helps ex-plain the resilience of output to higher oil prices. Anadditional factor for developing countries has beenthe substantial rise in the share of exports in GDP,which has increased the foreign currency inflowsavailable to finance a given increase in the oil bill.
Adjustment was facilitated by solid initial con-ditions. In particular, many oil-importing develop-ing countries entered the period of high oil pricesrunning current-account surpluses and building upforeign currency reserves. This, plus high nonoilcommodity prices and a rapid expansion in trade,meant that finding foreign currency to pay higheroil bills was relatively easy. In addition, foreign cur-rency inflows for the poorest countries were bol-stered by increasing aid flows, which in many casesrose by more than 0.5 percent of GDP in 2004 (thelast year for which data is available).
While output has remained resilient, develop-ing countries nevertheless have endured a large hit
012-041_GDF06_ch01.qxd 5/24/06 2:30 PM Page 13

G L O B A L D E V E L O P M E N T F I N A N C E 2 0 0 6
on their incomes. On average, the rise in oil pricesbetween 2003 and 2005 reduced real incomes inoil-importing countries by 3.6 percent and by asmuch as 10 percent for some low-income oil im-porters. For developing oil importers the addi-tional expenditure, some $137 billion annually,exceeds by a large margin official development as-sistance (ODA, $84 billion in 2005 net of addi-tional debt relief) and is about one-half of foreigndirect investment (FDI) inflows ($234 billion).
Unsurprisingly, some countries are having dif-ficulty adjusting. Fiscal deficits have risen alarm-ingly in several countries that subsidize domesticenergy prices. In many African countries, utilityfirms, unable to pay mounting energy bills, haveimposed rolling blackouts. Moreover, a few coun-tries appear to be financing their higher oil billthrough an unsustainably rapid reduction in inter-national reserves. Finally, rising food and trans-portation prices have pushed inflation to worri-some levels in several countries in Africa and, to alesser extent, South Asia. While it is not clear thatan inflationary spiral has begun, an eventual eco-nomic slowdown appears likely if policy makersare forced to use macro policy measures to bringinflation back under control.
Developing countries face further adjustmentchallenges over the medium termWhile the resilience of output to high oil prices isheartening, the initially comfortable current-accountpositions that allowed many developing countries toweather higher oil prices have now been absorbed.Moreover, many of the factors that allowed coun-tries to deal with higher oil prices relatively easily inthe short run imply that much real-side adjustmenthas yet to occur.
Adapting to more or less permanently higherprices poses substantial challenges, especially forthose countries where high oil prices are alreadygenerating economic strain, as evidenced by exces-sive increases in current-account or fiscal deficitsor by unsustainable financing of oil import billsthrough the depletion of reserves or bank borrow-ing. Policy makers in these countries must take ur-gent steps to increase energy efficiency in generaland reduce oil dependency in particular. Unwind-ing energy subsidization programs would simulta-neously relieve pressure on government financesand also promote private sector energy conserva-tion. For those countries that have managed the
recent rise in oil prices more easily, similar policysteps would reduce their vulnerability both to fur-ther oil shocks and other shocks, including a de-cline in nonoil commodity prices. For countriesbenefiting from fixed-price contracts at what arecurrently below-market prices, policy should en-courage energy conservation now before the con-tracts expire or are renegotiated.
More generally, because higher prices arelikely to be a more or less permanent fixture, coun-tries need to take steps to improve their interna-tional competitiveness. Policies that stimulate pro-ductivity growth and investment in the domesticeconomy are most likely to be successful. Countrieswith flexible exchange regimes are likely to havemore success in improving their export revenuesand diminishing nonoil imports so as to reestablisha comfortable margin on the current account.Trade reform—domestic, behind-the-border re-forms to improve competitiveness, accompanied byprogress at the multilateral level—could further ex-pand developing-country exports and the baseupon which oil and other imports essential to de-velopment can be financed.
For oil exporters the challenge will be to usepetroleum revenues in a way that minimizes eco-nomic distortions and maximizes developmentgain. Even if oil prices remain high for an extendedperiod, most countries do not have the capacity toabsorb these huge inflows immediately. As a result,they should resist the temptation to use oil-relatedbudgetary revenues for programs that are politi-cally popular but developmentally unsound. In-stead, they should consider introducing or expand-ing oil funds by sequestering that part of revenuesthat cannot be productively placed in the domesticmarket and investing it abroad, where it will gener-ate a permanent income stream to support develop-ment even after current prices ease or oil suppliesdwindle. Recent steps by some oil-exporting coun-tries that have unwound structural reforms forshort-term political gain are unlikely to be helpful.
Global imbalances may have been exacerbatedby high oil pricesThe rapid rise in oil prices has contributed toglobal imbalances by increasing the U.S. current-account deficit by some $125 billion since 2002.It also has changed the nature of those imbalancesby inducing a swing in the counterparts to theU.S. deficit away from oil importers and toward
14
012-041_GDF06_ch01.qxd 5/24/06 2:30 PM Page 14

P R O S P E C T S F O R T H E G L O B A L E C O N O M Y
oil-exporting countries. Their oil-related exportearnings are up some $400 billion since 2002.These are being recycled—partly through in-creased imports, approximately 65 percent of ad-ditional export revenues are being spent as addi-tional imports, and partly via financial flows. As aresult, there is little likelihood that an excess in oilexporters’ savings will lead to a global slowdown.Rather, increased financial flows—either directlyor through third-party intermediaries, are con-tributing to low interest rates and, both directlyand indirectly, to the financing of the U.S. current-account deficit.
Despite the ease with which the U.S. deficit isbeing financed, the continued accumulation of for-eign liabilities is not sustainable. Unwinding theseimbalances will almost certainly take a long time.Indeed, given the magnitude of the required ad-justment, a gradual approach is to be preferred toan abrupt one. However, the longer significantsteps to resolve the issue are delayed the greaterwill be the tensions implicit in the disequilibriumand the risk that they will be resolved in a disor-derly manner. Of particular concern is that someof the temporary factors holding down interestrates (including corporate balance-sheet restruc-turing and financial flows from oil revenues) willease, increasing the servicing costs on U.S. liabili-ties. That would add to the deficit and possiblyraise concerns about its sustainability, driving in-terest rates even higher.
Resolving these imbalances is a common butdifferentiated responsibility requiring increased pri-vate and public savings in the United States, in-creased demand outside of the United States, andmore flexible exchange rate management. Actionon all fronts is required, particularly because in theabsence of higher U.S. savings, increased foreigndemand or exchange rate appreciation is unlikelyto have a meaningful impact on imbalances.
The outlook for developing countries carriesboth internal and external risksProspects for a soft landing among developingcountries are good, but a hard landing is also possi-ble. In particular, many countries, notably in theEurope and Central Asia region, now have current-account deficits that exceed 5 or 6 percent of GDP.In some instances those deficits are associated withhigh interest rates, strong capital inflows, and ap-preciating currencies. The future ability of these
economies to finance current levels of consumptionand investment is vulnerable to changes in investorconfidence or additional external shocks. Else-where, rapidly rising incomes may be contributingto asset bubbles in regional real estate and stockmarkets. In other countries, tensions arising fromlocalized labor market shortages, combined withsignificant disparity in the degree to which regionsor segments of the population are benefiting fromgrowth, could prompt a harder-than-projectedlanding. These internal risks could generate a hardlanding on their own or they could be triggered byand exacerbate an external shock. In particular,growth in several countries in South Asia and a fewin Latin America is generating significant inflation-ary pressures requiring a tightening of macroeco-nomic policy if an abrupt slowdown in the future isto be avoided.
The principal external risks to the global econ-omy have not changed much since the publicationof the last edition of the World Bank’s Global Eco-nomic Prospects (2005). These include the possibil-ity that persistent global imbalances will resolvethemselves in a disorderly manner, either through asignificant increase in interest rates or a sharp de-preciation of the dollar; the possibility that a signif-icant supply shock will send oil prices even higher;and the possibility that nonoil commodity priceswill weaken. Should any of these risks be realized,they might reduce global growth by between 1 and3 percent, depending on the shock, with much ofthe slowdown borne by developing economies.Even if the impact of the shock is relatively benignat the global level, the increased current-accountdeficits of many oil-importing developing countriesmake them vulnerable. For heavily indebted coun-tries, the most serious risk stems from the possibil-ity of higher interest rates. For small oil-importingAfrican countries, the largest risk is that nonoilcommodity prices, particularly for metals and min-erals, will decline.
The outturn from the Doha trade liberaliza-tion round poses a balanced risk to the outlook.The baseline scenario assumes an unambitious ac-cord. However, an ambitious conclusion to theRound, including significant liberalization of tradein agricultural products and on-the-groundprogress in the aid-for-trade agenda, could yieldsubstantial benefits for developing countries. Moreimportantly, a failure of Doha could go beyond thisagreement by weakening the whole multilateral
15
012-041_GDF06_ch01.qxd 5/24/06 2:30 PM Page 15

G L O B A L D E V E L O P M E N T F I N A N C E 2 0 0 6
trade liberalization process—resulting in a morefragmented path forward with fewer benefits fordeveloping countries.
While a remote possibility, an influenzapandemic could have serious consequencesThe continued spread of avian influenza (bird flu)among wild birds, with limited bird-to-humantransmission, comprises part of the baseline fore-cast. A serious risk to the global economy is pre-sented by the possibility that avian influenza mu-tates into a form of the flu that is easilytransmitted between humans and to which thepopulation has only limited immunity.
The potential human and economic conse-quences of such a pandemic are very large. Theydepend importantly on the nature of the flu thatemerges and on the reactions of people as itspreads. Even a relatively moderate flu in terms oftransmission and mortality could have seriousconsequences for the world economy if the globalpopulation has limited immunity. Estimates sug-gest that, depending upon the severity of the even-tual disease, a combination of lost output due toillness, additional deaths, absenteeism, and privateand public efforts to avoid infection could lowerglobal GDP by between 2 and 5 percent (with thelatter number implying a global recession). Moreimportant, between 14 and 70 million peoplecould be killed.
Policy makers need to focus simultaneouslyon two critical tasks: (1) further strengthening ef-forts to monitor and curtail outbreaks of avian in-fluenza at points (such as domestic poultry flocks)where the likelihood is highest of the disease mu-tating into a viable human-to-human form; and(2) developing and putting systems in place tominimize the human cost of a pandemic if onedoes emerge, whether by developing effective con-tainment strategies or improving the world’s capac-ity to rapidly create and distribute vaccines.
Global growth
Despite oil prices that reached $60 a barrel inthe second half of the year, the world econ-
omy grew by a very robust 3.6 percent in 2005.Developing countries led the way, expanding by6.4 percent, more than twice as fast as high-incomecountries (table 1.1).
Outturns and prospects in high-income countriesGrowth among industrialized economies in 2005came in at 2.8 percent, substantially lower thanthe 3.3 percent recorded the year before. Industrialproduction and trade flows among these countrieswere particularly anemic. Industrial productiongrowth declined from more than 5 percent in mid-2004 to less than 1 percent in late spring. Growthhas since accelerated, reaching 3 percent (year-over-year) in the first quarter of 2006 (figure 1.1).
High oil prices, rising short-term interestrates, a cooling of the housing market, and an un-usually disruptive hurricane season helped slowgrowth in the United States to 3.5 percent in 2005as compared with 4.2 percent in 2004. Partly re-flecting a bounce-back in activity following aweak fourth quarter, GDP expanded 4.8 percent inthe first quarter of 2006. Although inflation
16
% change in volumes year-over-year
Developing countries(ex. China)
High-incomecountries China
(right axis)
2000 2001 2002 2003 2004 2005 2006
10
5
0
–5
–10
20
18
16
14
12
10
8
6
4
Figure 1.1 Industrial production remains robust
Source: World Bank.
% change, year-over-year
0
1
2
3
4
5
Jan.2002
July2002
Jan.2003
July2003
Jan.2004
Jan.2006
July2004
Jan.2005
July2005
U.S. all goods and services
EU all goods and services
U.S. coreinflation
EU core inflation
Figure 1.2 Inflation in high-income countries
Sources: World Bank, Datastream.
012-041_GDF06_ch01.qxd 5/24/06 2:30 PM Page 16

P R O S P E C T S F O R T H E G L O B A L E C O N O M Y
spiked following Katrina-related increases in gaso-line prices, it has since declined and remains rela-tively muted at 3.4 percent in March 2006. Coreinflation (price changes of goods and servicesother than energy and food) remains low at 2.1percent, below the rate recorded in December2004 (figure 1.2).
The relatively low oil intensity of Europeaneconomies, significant excess capacity, and a re-laxed macroeconomic policy stance limited theslowdown in Europe. For the year as a whole,growth was a relatively weak 1.5 percent (1.4 per-cent for the Euro Area), but this reflected a fourth-
quarter pause in exports following a strong accel-eration in the first nine months of the year. Sincethen economic activity has picked up with GDP inthe Euro Area estimated to have increased byaround 2.4 percent in the first quarter of 2006.
In Japan, growth has been strong, with indus-trial production ending the year up 5 percent andunemployment declining to 4.4 percent of thelabor force. Overall, GDP increased by 2.8 per-cent, with both domestic and external demandcontributing about equally to the overall result. Asa result, both consumer and business confidencehave improved.
17
Table 1.1 The global outlook in summary% change from previous year, except interest rates and oil prices
2004 2005* 2006** 2007** 2008**
Global conditionsWorld trade volume 10.6 7.1 7.6 7.7 7.8Consumer prices
G-7 countriesa,b 2.1 2.6 2.2 1.8 1.8United States 2.7 3.4 2.9 1.9 2.0
Commodity prices (US$ terms)Non-oil commodities 17.5 13.4 5.8 –3.2 –5.8
Oil price (US$ per barrel)c 37.7 53.4 64.2 61.0 56.9Oil price (% change) 30.6 41.5 20.2 –5.0 –6.8
Manufactures unit export valued 6.9 0.8 1.6 2.8 1.2Interest rates
$, 6-month (%) 1.6 3.6 5.1 5.2 4.9€, 6-month (%) 2.1 2.2 2.6 3.1 3.9
Real GDP growthe
World 4.1 3.6 3.7 3.5 3.5Memo item: World (PPP weights)f 5.3 4.6 4.6 4.5 4.5High-income countries 3.3 2.8 3.0 2.8 2.8
OECD Countries 3.2 2.7 2.9 2.7 2.8Euro Area 2.0 1.4 2.1 2.1 2.2Japan 2.7 2.8 2.8 2.1 1.8United States 4.2 3.5 3.5 3.3 3.3Non-OECD countries 6.2 5.5 5.1 4.7 4.7
Developing countries 7.1 6.4 6.3 6.0 5.9East Asia and Pacific 9.1 8.8 8.3 8.2 8.1Europe and Central Asia 7.2 5.7 5.5 5.4 5.1Latin America and Caribbean 6.0 4.4 4.6 4.0 3.7Middle East and N. Africa 4.7 4.8 5.3 5.2 5.1South Asia 6.7 7.7 6.8 6.5 6.2Sub-Saharan Africa 5.2 5.2 5.4 4.9 5.4
Memorandum itemsDeveloping countries
excluding transition countries 7.2 6.6 6.4 6.1 6.0excluding China and India 6.1 5.0 5.1 4.8 4.5
Source: World Bank.Note: PPP = purchasing power parity; * = estimate; ** = forecast. a. Canada, France, Germany, Italy, Japan, the United Kingdom, and the United States. b. In local currency, aggregated using 2000 GDP Weights. c. Simple average of Dubai, Brent and West Texas Intermediate. d. Unit value index of manufactured exports from major economies, expressed in US$. e. GDP in 2000 constant dollars; 2000 prices and market exchange rates. f. GDP mesaured at 2000 PPP weights.
012-041_GDF06_ch01.qxd 5/24/06 2:30 PM Page 17

G L O B A L D E V E L O P M E N T F I N A N C E 2 0 0 6
The increase in oil prices in 2005 and early2006 are expected to slow growth in high-incomecountries by about 0.25 of a percentage point in2006 compared with what it would have been hadprices remained stable. In the United States, im-proved net exports are projected to maintain thepace of growth in 2006, despite weaker consumerdemand due to higher interest rates and a coolingof the housing market. For 2007/8, the balance ofthese forces is expected to reverse somewhat, lead-ing to a moderate easing of growth.
Continued accommodative macroeconomicpolicy and pent-up investment demand followingseveral years of very weak growth should maintainthe recent acceleration of output in Europe during2006. As a result, GDP is projected to expand byabout 2.1 percent in 2006 and to continue grow-ing at close to its potential rate in 2007/8.
In Japan, vigorous growth in developing EastAsia, renewed consumer and business confidence,and reduced drag from consolidation are all ex-pected to keep the recovery strong in 2006. Whilethe economy is projected to slow somewhat(partly because of less expansionary monetary andfiscal policies), GDP should expand at or abovethe economy’s potential rate of growth.
Developing economy outturns and prospectsNotwithstanding high oil prices, economies inevery developing region continued to grow atabove-trend rates in 2005. Overall, the GDP oflow- and middle-income countries expanded byan estimated 6.4 percent. The expansion was par-ticularly robust in China and India, where outputincreased by 9.9 and about 8.0 percent, respec-tively. Excluding these countries, growth in otheroil-importing developing countries came in at anestimated 4.3 percent, down significantly from5.7 percent in 2004. At the same time, dwindlingspare capacity in the petroleum sector caused theexpansion of oil-exporting developing economiesto ease from 6.6 to 5.7 percent, even though oilrevenues continued to rise.
High oil prices, rising interest rates, andbuilding inflationary pressures are expected torestrain growth in most developing regions in2006/8 (figure 1.3). As a group, however, low-and middle-income countries should again out-perform high-income economies by a wide mar-gin. Growth in five of the six developing regions
is projected to exceed 5 percent through 2008,with the Latin America and Caribbean regionprojected to expand 4.1 percent on average overthe projection period.
Regional outlooksMore detailed descriptions of economic developments in de-veloping regions, including regional forecast summaries, areavailable at http://www.worldbank.org/globaloutlook.
East Asia and the Pacific1
The economies of the East Asia and Pacific regioncontinued to expand rapidly in 2005. Their GDP isestimated to have increased by 8.8 percent, downfrom 9.1 percent in 2004 (figure 1.4). Growth inChina was very strong (9.9 percent), despite a sub-stantial slowing in both private consumption andinvestment demand, because exports continued togrow rapidly, and imports slowed.
For other countries in the region, output ex-panded by a more modest 5.3 percent, as the slow-down in Chinese imports, weak global high-techdemand, and elevated oil prices translated into re-duced export growth and rapidly rising producerprices. Among larger oil-importing countries in theregion, GDP growth slowed relatively sharply inthe Philippines and Thailand. Among oil-exporters,growth slowed in Malaysia, but picked up in Viet-nam and Indonesia.
Strong exports and weak import demand inChina meant that the region’s current-account bal-
18
1999
GDP growth
1
2
3
6
7
4
5
8
2000 2001 2002 2003 2004 2005 2006 2007 2008
World
Developing countries
Figure 1.3 Developing-country growth remains robust
Source: World Bank.
012-041_GDF06_ch01.qxd 5/24/06 2:30 PM Page 18

P R O S P E C T S F O R T H E G L O B A L E C O N O M Y
ance improved, reaching a surplus of $143 billion(4.9 percent of GDP). Of the larger economies, onlyThailand and Vietnam are running current-accountdeficits, while the surpluses of China and Malaysiaexceed 6 and 15 percent of their respective GDP.
Output in the region continues to feel the ef-fects of endemic bird-to-bird avian influenza.Cambodia, China, Indonesia, Laos, Thailand, andVietnam are the countries most affected. So farsome 200 million domestic birds (less than 1 per-cent of domestic bird production in the region butrising to 12 percent in Vietnam) have died or beenkilled to prevent the spread of the disease. As ofearly May 2006 no new outbreaks have beenrecorded among birds in Thailand and Vietnam,attesting to the effectiveness of preventive mea-sures. However, new outbreaks have beenrecorded in China, East Java, Indonesia, Malaysiaand Myanmar2.
While the disease has had only a limited effecton GDP so far (depending on the country, the sec-tor represents between 0.6 to 2 percent of GDP),its impact on incomes has likely been more acute.Poultry accounts for as much as 7 percent of theincomes of the poor.
As higher oil prices take hold, reduced invest-ment growth in China and reduced global liquidityare expected to slow regional growth to around 8.1percent by 2008. This reflects a modest slowdownin China, as slower export growth is partially offsetby stronger domestic demand. Excluding China,growth in the remaining economies in the region isexpected to come in at about 5.5 percent in 2006through 2008. Stronger domestic demand, terms of
trade effects and some currency appreciation areprojected to result in about a $25 billion decline inthe region’s current-account surplus.
Europe and Central Asia Economic activity in the Europe and Central Asiaregion grew by a robust 5.7 percent in 2005. Highoil prices boosted demand in the region’s oil produc-ers, particularly in the Russian Federation, wherereal GDP increased 6.4 percent. That, in turn, con-tributed to strong exports for other countries in theregion, notably the Baltics and the Commonwealthof Independent States. Turkey and other CentralEuropean countries participated in the export boomto a lesser extent, as they reoriented exports awayfrom a still weak European Union.
The region received record capital inflows in2005, reflecting favorable international credit con-ditions and the advancing EU accession processfor new and candidate members. These flows con-tributed to rapid credit growth in the Baltics, Bul-garia, Romania, Turkey, and Ukraine, and a signif-icant deterioration in current-account positions.High oil prices, substantial increases in the pricepaid for imported natural gas in some countries,and lax fiscal policy in the Czech Republic, Hun-gary, the Kyrgyz Republic, and Poland alsoboosted current-account deficits.
About half of the region’s economies postedcurrent-account deficits equal to or in excess of 5percent of GDP in 2005. Current-account deficitsexceeded 6 percent of GDP in Albania, Bulgaria,Croatia, Estonia, Georgia, Hungary, Latvia,Lithuania, Romania, and Turkey.
19
% change, GDP
2
3
7
10
East Asia& Pacific
Europe &Central Asia
Latin America& Caribbean
Middle East& North Africa
SouthAsia
Sub-SaharanAfrica
Oilexporters
Oil importers(ex. China)
4
5
6
8
92004 2005 2006 2007 2008
Figure 1.4 Regional growth trends
Source: World Bank.
012-041_GDF06_ch01.qxd 5/24/06 2:30 PM Page 19

G L O B A L D E V E L O P M E N T F I N A N C E 2 0 0 6
At the regional level these deficits were signifi-cantly offset by improved external positions of oilexporters, including Azerbaijan, where the deficitshifted from a 30 percent share of GDP in 2004 to5 percent in 2005, as new oil capacity came onstream. This also propelled Azerbaijan’s growth tomore than 25 percent.
GDP growth is projected to slow slightly in2006, coming in at 5.5 percent, as tighter inter-national credit conditions and monetary policyare expected to slow domestic growth in theCommonwealth of Independent States (CIS) sub-region. Elevated energy revenues, investment ex-penditure, and the projected recovery of westernEuropean demand are expected to sustain growthat relatively high levels in 2007/8. High fiscal andcurrent-account deficits in a number of countries,including Hungary and Turkey, pose serious risksto the outlook. For regional oil exporters, keychallenges include the need to foster greater in-vestment and productive capacity in the nonoilsectors so as to improve economic diversification,control inflation, and prevent excessive exchangerate appreciation.
Latin America and the Caribbean Economic activity in Latin America and theCaribbean is estimated to have increased by some4.4 percent during 2005. Outturns were strongthroughout the region, reflecting high levels of in-ternational liquidity, strong global demand, andhigh prices for the region’s exports. Macroeco-nomic policy has also played a role. Except inBrazil and Mexico, where rising interest rates con-tributed to a slowdown in 2005, monetary policyin the region has been generally accommodative.Fiscal policy, in turn, has been relatively neutral.Despite windfall revenues from high internationalcommodity prices and reduced debt servicingcharges (due to reduced interest rates and lowerdebt stocks) most countries, with the notable ex-ception of República Bolivariana de Venezuela,have avoided a significant pro-cyclical surge inspending. As a result, government deficits in theregion have declined and “structural” balances ac-tually improved in some countries. Nevertheless,structural rigidities in public expenditures remainan issue in a number of countries.
Increases in coffee, sugar, and metal priceslargely offset the effect of higher oil prices andlower agricultural prices (notably soybeans) in
many countries. High nonoil commodity pricesand strong inflows of remittance prevented mostcountries in the region from experiencing a signifi-cant deterioration in their current-account posi-tions. Indeed, with a few exceptions (Honduras,Nicaragua, Panama, Paraguay, and Uruguay), thecurrent-account balances of most countries in theregion have either remained constant or improvedsince 2002. These favorable external conditionscontributed to a general pressure toward exchangerate appreciation that has been checked by accu-mulation of international reserves.
Looking forward, regional growth is pro-jected to pick up in 2006 as easier monetary policyboosts output in Mexico and Brazil. Growth inmost countries in the region is expected to bebroadly stable in 2007 and 2008, slowing onlysomewhat in the face of a modest weakening incommodity prices and a gradual moderation incapital inflows. However, the expansion for the re-gion as a whole is projected to slow toward 3.7percent in 2008, reflecting a significant slowing inArgentina and República Bolivariana de Venezuelatoward more sustainable growth rates.
Growth trends in Central American countriesare projected to improve, partly because of the re-cent Central American Free Trade Agreement. Theagreement should boost both trade (the UnitedStates is these countries’ major trading partner)and investment, thereby lifting longer-term growthprospects. However, to reap the full benefits of thisreform, further steps need to be taken towards im-proving road quality, increasing port and customsefficiency, boosting financial depth, and raising thequality and coverage of education.
A central risk to this forecast remains the pos-sibility that as growth slows and commodity pricesease, government deficits will rise, potentially rais-ing inflation or increasing uncertainty. Either re-sult could lead to higher-than-projected interestrates and slower growth.
Middle East and North Africa3
High oil prices and strong oil demand continue tobe key drivers for the developing economies of theMiddle East and North Africa4, where GDP is esti-mated to have increased by 4.8 percent in 2005. A40 percent increase in oil revenues, to some $250billion or (66 percent of their GDP), boosted pub-lic spending in oil-exporting developing countriesin the region, causing their GDP to expand by 5.3
20
012-041_GDF06_ch01.qxd 5/24/06 2:30 PM Page 20

P R O S P E C T S F O R T H E G L O B A L E C O N O M Y
percent. This had spillover effects for the region’soil importers in the form of strong exports,tourism revenues, and inflows of investment andremittances. All of these factors helped to sustainrobust growth among regional oil importers (4.2percent), despite higher oil-import bills and rela-tively weak demand in Europe.
Looking forward, high oil prices are ex-pected to continue feeding domestic demand inoil-producing countries—outstripping domesticsupply and causing imports to continue risingrapidly, even as growth of export revenues slows.As a result, GDP in developing oil-exporting coun-tries should expand by 5.2 percent in 2006 beforeslowing to around 4.8 percent in 2008. Their cur-rent-account surpluses should decline from around20 percent of GDP in 2005 to about 8 percent ofGDP in 2008. In the oil-importing economies,growth is expected to accelerate to about 5.3 per-cent, supported by stronger European growth, con-tinued exports of goods and services to regional oilexporters, and a weaker negative effect from the re-duction in textile and clothing quotas.
Prospects for the region remain clouded bygeopolitical developments. For the region as awhole, western investors’ risk perceptions haveworsened. For the moment, this has been offset byan intraregional recycling of oil revenues, whichhas contributed to a sharp inflation in asset prices.
South Asia Strong external demand and private consumptiongrowth, supported by generally accommodativemonetary policies, spurred growth in South Asiato a very robust 7.7 percent in 2005, led by Indiaand Pakistan, which both expanded by about 8percent. Excluding these two countries, regionalgrowth was still a strong 5.3 percent. Robust re-gional clothing exports following the removal ofquotas helped limit the overall deterioration of thecurrent account, the deficit of which is estimatedat 2.6 percent of regional GDP in 2005.
Despite some efforts to raise retail energyprices, higher oil prices have not been completelypassed through to consumers. Nevertheless, infla-tionary pressures in the region have been building.Consumer prices rose 9.1 percent in 2005 as com-pared with 3.6 percent in 2003. To a significantdegree, higher inflation reflects fluctuations infood prices. However, rapid growth, particularlystrong domestic demand in response to a relaxed
monetary policy stance in both India and Pakistanalso played a role.
Because higher oil prices have not been passedthrough fully, there remains significant latent in-flationary pressure from this source. In addition,implicit energy subsidies have raised fiscal deficitsby as much as 0.7 percent of GDP between 2002and 2005, apparently crowding out spending oneducation and health care in India (Devarajan andGhani 2006).5 Moreover, by impeding the pricemechanism from restraining energy demand, thepass-through policy (along with robust domesticdemand) has contributed to a deterioration equalto 4.0 percent of GDP in the region’s current-account balance since 2003.
Growth is projected to weaken to about 6.8percent in 2006, reflecting continued above trendgrowth in Pakistan and India. However, domesticcapacity constraints and rising inflation are pro-jected to cause growth to decline to a more sus-tainable 6.2 percent by 2008.
Notwithstanding this cyclical slowdown,growth is projected to remain robust with invest-ment in both India and Pakistan expected to con-tinue to benefit from strong external and domes-tic interest. This, plus a four-year infrastructureproject (Build India) valued at 5 percent of GDP,are projected to augment capacity and supportdemand over the projection period. The servicessector in India is expected to continue expandingrapidly, as a result of strong FDI inflows and out-sourcing. Export growth throughout the regionshould remain strong, despite slower growth inthe United States, partly because of increased de-mand from Europe.
Solid domestic demand should cause the cur-rent-account deficit to grow further, reachingaround 3.5 percent of GDP in 2006 before im-proving somewhat as demand slows.
Sub-Saharan Africa GDP in Sub-Saharan Africa expanded by an esti-mated 5.2 percent in 2005, bolstered by robustgrowth in resource-rich countries. Indeed, oil-exporting economies grew an estimated 6.4 percentin 2005, while growth in South Africa came in at4.9 percent, lifted by high metal prices, strong con-sumer confidence, and low nominal interest rates.Economic activity in small oil-importing economiesexpanded by a slower but still robust 4.3 percent,down from 4.7 percent in 2004.
21
012-041_GDF06_ch01.qxd 5/24/06 2:30 PM Page 21

G L O B A L D E V E L O P M E N T F I N A N C E 2 0 0 6
This strong performance marks a sharp depar-ture from the weak and relatively volatile growthrecorded by the region in the 1980s and 1990s.2005 was the fifth year in a row that regionalgrowth was at least 3.5 percent, and ended the first5 year period since the 1960s that per capita growthremained positive in every year. Hearteningly thisimproved performance reflects stronger growth bymany countries rather than very fast growth by afew. More than half of Sub-Saharan African coun-tries have grown by 4 percent or more on averageduring the past five years, compared with fewerthan one-quarter during the period 1980–95.6
Better subsistence and cash crops bolsteredagricultural incomes and industrial production inmany West African countries, while performancein East Africa was also good, despite drought insome areas. High metal prices bolstered growth insmall resource-rich oil-importing economies.
The current-account position of oil exportersimproved significantly because of higher oil rev-enues. However, external balances in many oil-importing countries have come under pressure.Excluding South Africa, the current-account posi-tion of oil importers deteriorated by 2.8 percent-age points in 2005, reaching 6.4 percent of GDP.In Ghana, for example, the current-accountdeficit is estimated to have more than doubled toreach 6.8 percent of GDP, while in Tanzania itsurged close to 6.2 percent of GDP. In severalother countries, a failure to fully pass throughhigher prices has placed fiscal accounts under se-rious strain (Madagascar, Mauritius, Rwanda, andUganda) or forced utilities to ration energy con-sumption by imposing rolling electrical blackouts(Madagascar, Malawi).
Looking forward, growth in established oil-exporting countries is projected to average morethan 6 percent as new oil production is expectedto come online in Angola, Republic of Congo,Equatorial Guinea, and Sudan. Moreover, Mauri-tania and São Tomé and Principe are expected tobegin exporting oil in 2006.
Small oil importers are also expected to dowell, with growth remaining at about 4.5 percentin 2008 as many countries benefit from debt write-offs and increased aid flows. Madagascar, Tanza-nia, and Uganda are expected to continue to profitfrom prudent macroeconomic policies and reformsimplemented in previous years. In contrast,growth in sugar and textile producers (Lesotho,
Mauritius, and Swaziland) is expected to weaken asEuropean sugar preferences are withdrawn, whilestrong competition from low-cost textile producersin China and South Asia will continue to be a dragon regional exports. Continued rapid expansion inSouth Africa is expected to spill over into the South-ern Africa Development Community. A more peace-ful and stable sociopolitical environment will serveto accelerate growth in Liberia, Sierra Leone, andseveral other countries. On the other hand, shouldlow-level conflicts, in places such as Chad, Côted’Ivoire, Nigeria, and the Sudan escalate, they couldbring down regional growth to a significant degree.
Commodity marketsThe oil marketThe sharp rise in oil prices since 2003,7 which wasdriven by strong demand and dwindling spare ca-pacity, showed signs of ending toward the end of2005. Beginning in September 2005, the trend risein oil prices marked a pause, with barrel pricesfluctuating around $63. However, the market re-mains tight, and the pricing power of OPEC hasincreased. As a result, prices are volatile, and sen-sitive to small changes in perceptions such as con-cerns over future supply, which sent barrel pricestoward the $73 mark in early May 2006, beforedeclining once again (figure 1.5).
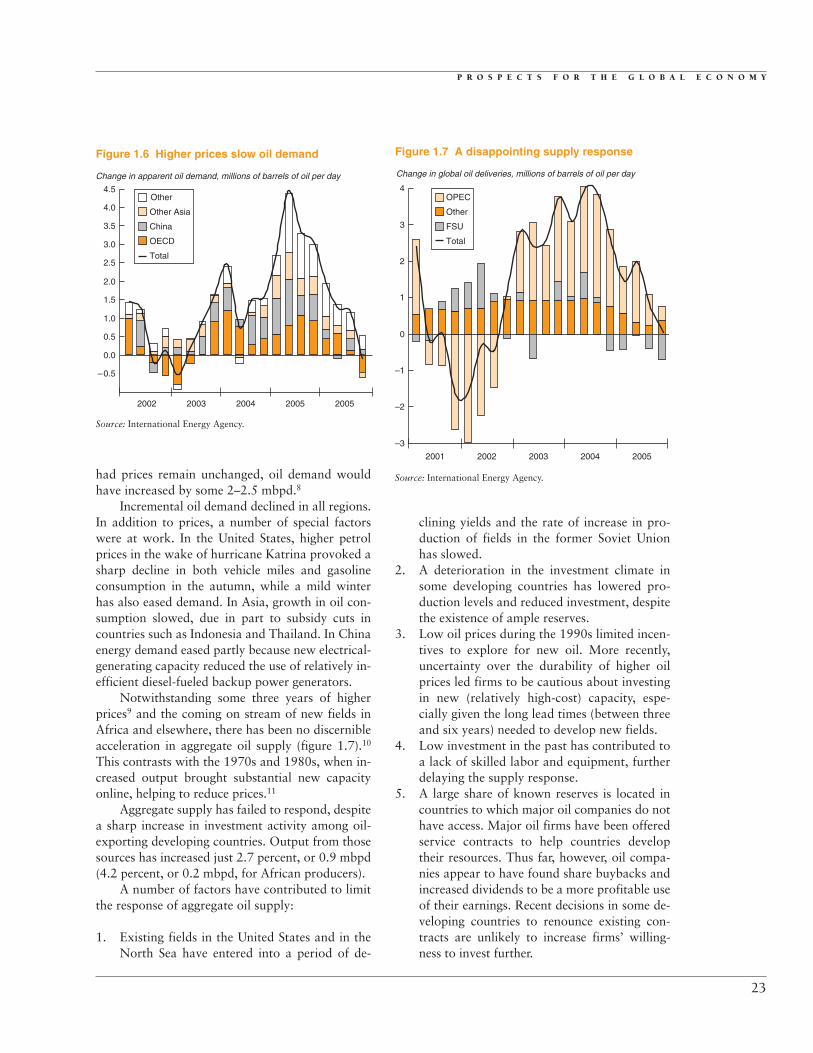
Oil demand slowed to 0.5 million barrels perday (mbpd) in the second half of 2005, from 3.5mbpd in the first half of 2004 (figure 1.6). Whileslower GDP growth played a role in this decline,the most important factor appears to have beenhigher oil prices. Econometric models suggest that
22
World Bank average, oil, $ per barrel
15
25
55
75 May 15, 2006
35
45
65
Jan.2002
July2002
Jan.2003
July2003
Jan.2004
July2004
Jan.2005
July2005
Jan.2006
May2006
Figure 1.5 An end to the trend rise in oil prices?
Sources: Datastream, World Bank.
012-041_GDF06_ch01.qxd 5/24/06 2:30 PM Page 22
P R O S P E C T S F O R T H E G L O B A L E C O N O M Y
had prices remain unchanged, oil demand wouldhave increased by some 2–2.5 mbpd.8
Incremental oil demand declined in all regions.In addition to prices, a number of special factorswere at work. In the United States, higher petrolprices in the wake of hurricane Katrina provoked asharp decline in both vehicle miles and gasolineconsumption in the autumn, while a mild winterhas also eased demand. In Asia, growth in oil con-sumption slowed, due in part to subsidy cuts incountries such as Indonesia and Thailand. In Chinaenergy demand eased partly because new electrical-generating capacity reduced the use of relatively in-efficient diesel-fueled backup power generators.
Notwithstanding some three years of higherprices9 and the coming on stream of new fields inAfrica and elsewhere, there has been no discernibleacceleration in aggregate oil supply (figure 1.7).10
This contrasts with the 1970s and 1980s, when in-creased output brought substantial new capacityonline, helping to reduce prices.11
Aggregate supply has failed to respond, despitea sharp increase in investment activity among oil-exporting developing countries. Output from thosesources has increased just 2.7 percent, or 0.9 mbpd(4.2 percent, or 0.2 mbpd, for African producers).
A number of factors have contributed to limitthe response of aggregate oil supply:
1. Existing fields in the United States and in theNorth Sea have entered into a period of de-
clining yields and the rate of increase in pro-duction of fields in the former Soviet Unionhas slowed.
2. A deterioration in the investment climate insome developing countries has lowered pro-duction levels and reduced investment, despitethe existence of ample reserves.
3. Low oil prices during the 1990s limited incen-tives to explore for new oil. More recently,uncertainty over the durability of higher oilprices led firms to be cautious about investingin new (relatively high-cost) capacity, espe-cially given the long lead times (between threeand six years) needed to develop new fields.
4. Low investment in the past has contributed toa lack of skilled labor and equipment, furtherdelaying the supply response.
5. A large share of known reserves is located incountries to which major oil companies do nothave access. Major oil firms have been offeredservice contracts to help countries developtheir resources. Thus far, however, oil compa-nies appear to have found share buybacks andincreased dividends to be a more profitable useof their earnings. Recent decisions in some de-veloping countries to renounce existing con-tracts are unlikely to increase firms’ willing-ness to invest further.
23
2002 2003 2004 2005 2005
–0.5
0.0
0.5
1.0
1.5
3.0
3.5
4.0
2.0
2.5
4.5Other
Other Asia
China
OECD
Total
Change in apparent oil demand, millions of barrels of oil per day
Figure 1.6 Higher prices slow oil demand
Source: International Energy Agency.
2001 2002 2003 2004 2005
Change in global oil deliveries, millions of barrels of oil per day
–3
0
–2
–1
1
3
2
4OPEC
Other
Total
FSU
Figure 1.7 A disappointing supply response
Source: International Energy Agency.
012-041_GDF06_ch01.qxd 5/24/06 2:30 PM Page 23

G L O B A L D E V E L O P M E N T F I N A N C E 2 0 0 6
The combination of still growing demand anda weak supply response has meant that althoughspare production capacity has improved, it re-mains tight (figure 1.8). Looking forward, invest-ments in new productive capacity are increasing(up some 15 percent in 2005). Moreover, contin-ued high prices will increase incentives to adoptmore petroleum-efficient technologies and con-serve fuel. As a result, demand growth is expectedto remain relatively moderate (at about 1.5–2 mil-lion barrels per day).
Unless non-OPEC supplies rise much fasterthan expected (the International Energy Agency,2005, projects non-OPEC supply to increase by 3mbpd over the next three years), spare capacitywill remain limited and OPEC’s pricing powerhigh. The organization has signaled its willingnessto reduce output in line with demand.
Prices are expected to remain volatile butshould gradually decline, reflecting the counter-vailing influences of continued strong growth inglobal output and limited increases in non-OPECoil on the supply side, and increasing energy effi-ciency on the demand side. While the precise pathto be taken in these conditions is largely unknow-able, the forecasts reported in this chapter assumethat barrel prices will begin moderating in 2006,averaging $64 for the year and decline graduallytowards $57 in 2008.
However, the market remains vulnerable todisruption, whether by natural disasters or geo-political events.12 Hence, the possibility of suddenupward spikes in oil prices cannot be ignored,even if the general trend is one of stabilization orslight decline.
Nonoil commoditiesThe rise in oil prices since 2003 has been accompa-nied by increasing prices for agricultural goods, met-als, and minerals (figure 1.9). Reflecting continuedstrong growth in global output, metals and mineralsprices increased by some 27 percent in 2005 and upan additional 24 percent in the first four months of2006. Increases in 2005 were concentrated in indus-trial metals, such as iron ore (up 72 percent), zinc(up 38 percent), and copper (up 21 percent). Pricesfor other metals and minerals also rose, but by less.Tin, the price of which fell by 13 percent over theyear, stands out as an exception.
At the global level, prices of agricultural prod-ucts have been relatively stable, up 9.3 percent be-tween April 2006 and the same date a year earlier.High prices early in 2005 reflected a poor monsoonseason in South Asia and drought conditions inSub-Saharan Africa. Improved weather conditions,in combination with increased supply in some coun-tries, contributed to an easing in agricultural pricesthrough much of 2005, followed by a modestpickup in prices in the first quarter of 2006. Rawmaterials are up 11 percent since April 2005.
The recent strength of nonoil commodityprices is primarily a reflection of strong world de-mand in recent years and low spare capacitybrought on by low prices during the 1990s. Pricesalso have been influenced by strong energy prices,because energy is a major input in the productionof many commodities (notably aluminum), andbecause several commodities are important substi-tutes for petroleum-based products (such as rub-ber and sugar used in the production of ethanol).Overall, about one-third of the increase in nonoil
24
Index, 1990 = 100
50
100
150
200
250
300
2001 2002 2003 2004 2005 2006
Energy
Metals andminerals
Agriculturalproducts
Figure 1.9 Commodity prices
Source: World Bank.
OPEC spare production capacity, millions of barrels per day
0
1
3
2
4
5
6
7
Jan.2002
Jan.2003
Jan.2004
Jan.2006
Jan.2005
Figure 1.8 Spare production capacity remains low
Sources: World Bank, International Energy Agency.
012-041_GDF06_ch01.qxd 5/24/06 2:30 PM Page 24

P R O S P E C T S F O R T H E G L O B A L E C O N O M Y
commodity prices between 2002 and 2005 was dueto higher oil prices (Baffes 2005).13 Some of thevery recent strength in the prices of precious metalsmay also reflect investor uncertainty in the face of adeclining dollar and continued global imbalances.
Improved supply should ease the prices ofmost agricultural commodities beginning in 2006.However, the prices of close energy substitutes andenergy-intensive products are expected to rise fur-ther. Overall, agricultural prices are projected torise by about 10 percent in 2006 before easing byabout 3 percent in each of 2007 and 2008. Strongdemand from China and other developingeconomies, low stocks, and high energy prices areprojected to push metals and mineral prices upsome 25 percent in 2006, before they begin easingby about 5 percent in 2007 and 12 percent in2008. Demand-driven increases in energy pricesrepresent an upside risk to energy-sensitive non-oilcommodities including food stuffs, whose yieldsdepend on energy-intensive fertilizers.
Inflation, interest rates, and global imbalancesInflationPerhaps the most critical explanation for the lim-ited impact of higher oil prices on output has beenthe weak response of inflation to higher oilprices—especially in high-income countries, whereworld interest rates are determined.
While inflation is up in virtually every region,most of the increase appears to reflect the directimpact of higher oil prices. With perhaps the ex-ception of South Asia and Sub-Saharan Africa (seediscussion below), there is little evidence of therapid price pass-through or the wage–price spiralsthat characterized the oil shocks of the 1970s and1980s (figure 1.10). Despite a pickup toward theend of 2005 in the United States, core inflation (therate of price increase of goods and services, exclud-ing food and energy) has increased relatively little(see figure 1.2). As a result, inflation expectationsand interest rates have remained low, eliminatingone of the principal mechanisms through whichpast oil shocks have slowed growth.
Many factors explain this inflationary per-formance—among them more flexible labor andproduct markets in high-income countries, loweroil intensities, more credible monetary policy,
and more prudent fiscal policies. In addition, therapidly expanding role of Asia and, to a lesserextent, the countries of the former Soviet bloc aslow-cost manufacturing centers have served todampen price inflation in high-income countries,where many of these products are consumed.
The pickup of inflation in Sub-Saharan Africaand South Asia is partly explained by food prices,which increased substantially in both regions dur-ing the course of 2005 and should be expected toease in 2006 as crops improve. However, as is thecase in a few Latin American countries, it alsolikely reflects overheating in those regions, whichhave been growing at historically high rates.
This possibility is particularly worrisome inthe case of Africa, because the credibility of mone-tary authorities is not yet well entrenched. Shouldan inflationary spiral develop, it could have seriousconsequences for macroeconomic stability and af-fect the ability of those economies to sustain thestrong growth of the past several years. In themeantime, continued aid flows to finance improvedgovernance and social and physical infrastructureinvestments will be essential to raising the trendgrowth rate that these countries can sustain.
Interest ratesThe subdued response of inflation has allowedmonetary (and fiscal) policy to remain relatively ac-commodative. While short-term interest rates are
25
End of period, year-over-year monthly inflation rate
0
1
6
10
2
3
4
5
7
8
9
East A
sia
& Pac
ific
Europ
e &
Centra
l Asia
Latin
Am
erica
& Car
ibbea
n
Midd
le Eas
t &
North
Afri
ca
South
Asia
Sub-S
ahar
an A
frica
High-in
com
e
coun
tries
Mar. 2006
20052004
20032002
Figure 1.10 Moderate increases in inflation
Source: World Bank.
012-041_GDF06_ch01.qxd 5/24/06 2:31 PM Page 25

G L O B A L D E V E L O P M E N T F I N A N C E 2 0 0 6
rising, they remain low in real terms, and long-term rates have only recently begun rising in high-income countries. As a result, the yield curve hasflattened significantly, with short-term bond yieldsvirtually equal to longer term yields.
Indeed, on several occasions during Februaryand March 2006 the yield on two-year U.S. Trea-sury bonds marginally exceeded that of the 10-year bond (figure 1.11). Such yield-curve “inver-sion” has historically been a good indicator of afuture recession (Estrella 2005).14 As such, theseinversions may signal a slowing of the U.S. econ-omy. However, they were very small and occurredwith both short- and long-term real interest ratesat low levels. Moreover, while the yield curve re-mains flat, long-term rates in April and early Maywere once again higher than short-term rates. Inthis context, the flattening of the yield curve re-flects a broadly positive outlook for globalgrowth, characterized by stable expectations forinflation, significant spare capacity in Europe, andan American economy that continues to expandquickly even as it slows in response to a more neu-tral monetary policy stance.
Developing economies experienced a similarflattening of the yield curve. Bond spreads contin-ued to decline, reaching a historic low of 174 basispoints for sovereign borrowers in May 2006. How-ever, the combination of relatively stable bankspreads (around 100 basis points) and rising ratesin high-income countries means that the averageinterest rate paid by developing countries actuallyrose over the past 12 months (see chapter 2).15
26
Depreciation
Resource R
ichR
esource Poor
Appreciation
% change, Jan. 2006–Dec. 2002
–45 –30 –15 0 15 30 60 75 9045
TurkeySlovak Rep.
RomaniaKenyaGhana
MoldovaTonga
Western SamoaNamibiaEthiopia
Czech Rep.ArmeniaBulgaria
GuatemalaAlbania
TogoPhilippines
Dominican Rep.UkraineKiribati
Burkina FasoMalta
FijiThailand
CyprusEstonia
SloveniaCroatia
HungaryUruguay
PolandIndia
ParaguayPakistanJamaicaBurundi
BeninSlovenia
PeruMacedonia, FYR
MoroccoSolomon Islands
Taiwan, ChinaSt. Lucia
NicaraguaAntiguaGuyana
ChinaBelize
LithuaniaNetherlands Antilles
LatviaGrenadaUgandaBelarusJordan
Costa RicaMozambique
DominicaVatican
Congo, Dem. Rep.Malawi
MauritiusTunisia
Bahamas, TheSierra Leone
Gambia, TheSt. Kitts and Nevis
Central African Rep.Bolivia
Egypt, Arab Rep. ofLesothoZambia
BrazilAngola
South AfricaRussian Fed.
NigeriaEquatorial Guinea
ColombiaChile
Papua New GuineaKazakhstan
Iran, Islamic Rep.Trinidad and Tobago
IndonesiaArgentina
Côte d’IvoireCameroon
VietnamGabon
ChadMexico
MalaysiaAlgeria
EcuadorR.B. de Venezuela
Figure 1.12 Changes in real effective exchange rate
Sources: World Bank, IMF.
Yield on 10- and 2-year U.S. Treasury bills
0
1
2
3
4
5
Jan.2003
July2003
Jan.2004
July2004
Jan.2005
July2005
Jan.2006
2-year Treasury bill yield
10-year Treasury bill yield
Figure 1.11 Flattening yield curve
Source: World Bank.
012-041_GDF06_ch01.qxd 5/24/06 2:31 PM Page 26
P R O S P E C T S F O R T H E G L O B A L E C O N O M Y
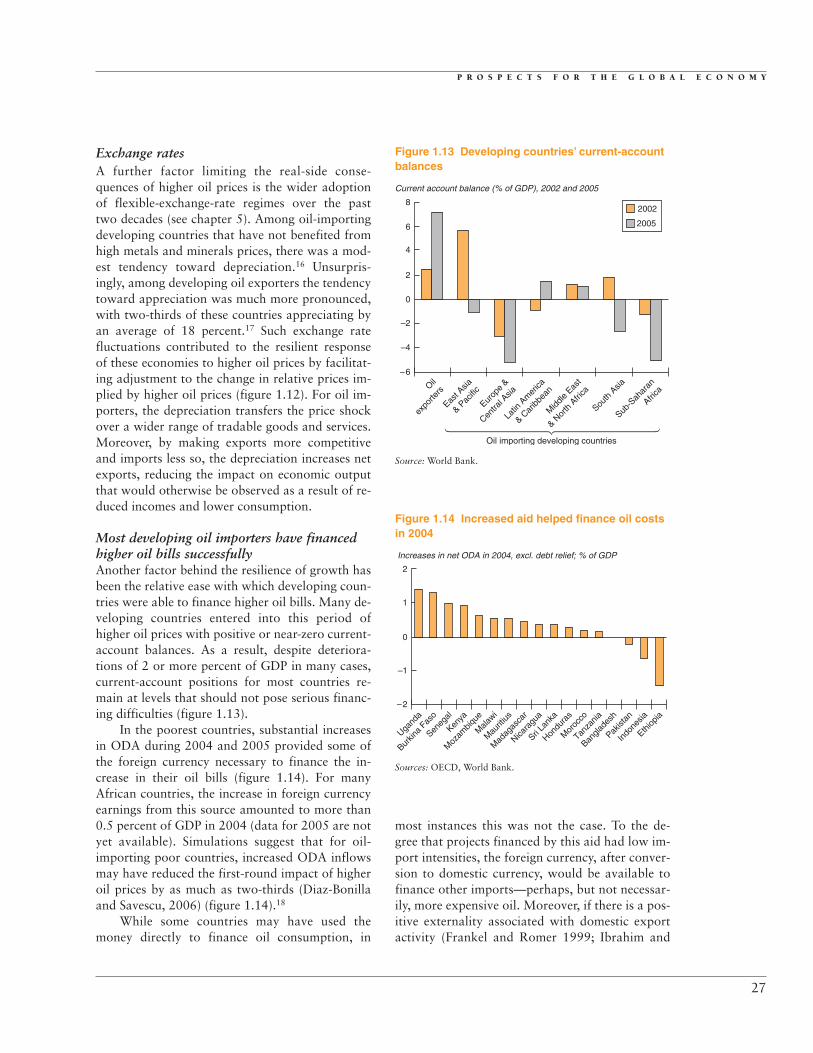
most instances this was not the case. To the de-gree that projects financed by this aid had low im-port intensities, the foreign currency, after conver-sion to domestic currency, would be available tofinance other imports—perhaps, but not necessar-ily, more expensive oil. Moreover, if there is a pos-itive externality associated with domestic exportactivity (Frankel and Romer 1999; Ibrahim and
27
Exchange ratesA further factor limiting the real-side conse-quences of higher oil prices is the wider adoptionof flexible-exchange-rate regimes over the pasttwo decades (see chapter 5). Among oil-importingdeveloping countries that have not benefited fromhigh metals and minerals prices, there was a mod-est tendency toward depreciation.16 Unsurpris-ingly, among developing oil exporters the tendencytoward appreciation was much more pronounced,with two-thirds of these countries appreciating byan average of 18 percent.17 Such exchange ratefluctuations contributed to the resilient responseof these economies to higher oil prices by facilitat-ing adjustment to the change in relative prices im-plied by higher oil prices (figure 1.12). For oil im-porters, the depreciation transfers the price shockover a wider range of tradable goods and services.Moreover, by making exports more competitiveand imports less so, the depreciation increases netexports, reducing the impact on economic outputthat would otherwise be observed as a result of re-duced incomes and lower consumption.
Most developing oil importers have financedhigher oil bills successfullyAnother factor behind the resilience of growth hasbeen the relative ease with which developing coun-tries were able to finance higher oil bills. Many de-veloping countries entered into this period ofhigher oil prices with positive or near-zero current-account balances. As a result, despite deteriora-tions of 2 or more percent of GDP in many cases,current-account positions for most countries re-main at levels that should not pose serious financ-ing difficulties (figure 1.13).
In the poorest countries, substantial increasesin ODA during 2004 and 2005 provided some ofthe foreign currency necessary to finance the in-crease in their oil bills (figure 1.14). For manyAfrican countries, the increase in foreign currencyearnings from this source amounted to more than0.5 percent of GDP in 2004 (data for 2005 are notyet available). Simulations suggest that for oil-importing poor countries, increased ODA inflowsmay have reduced the first-round impact of higheroil prices by as much as two-thirds (Diaz-Bonillaand Savescu, 2006) (figure 1.14).18
While some countries may have used themoney directly to finance oil consumption, in
Current account balance (% of GDP), 2002 and 2005
–6
Oil importing developing countries
0
–4
–2
2
4
6
8
Oil
expo
rters
East A
sia
& Pac
ific
Europ
e &
Centra
l Asia
Latin
Am
erica
& Car
ibbea
n
Midd
le Eas
t
& Nor
th A
frica
South
Asia
Sub-S
ahar
an
Africa
2002
2005
Figure 1.13 Developing countries’ current-accountbalances
Source: World Bank.
Increases in net ODA in 2004, excl. debt relief; % of GDP
–2
0
–1
1
2
Ugand
a
Burkin
a Fas
o
Seneg
al
Kenya
Moz
ambiq
ue
Mala
wi
Mau
ritius
Mad
agas
car
Nicara
gua
Sri La
nka
Hondu
ras
Mor
occo
Tanza
nia
Bangla
desh
Pakist
an
Indo
nesia
Ethiop
ia
Figure 1.14 Increased aid helped finance oil costsin 2004
Sources: OECD, World Bank.
012-041_GDF06_ch01.qxd 5/24/06 2:31 PM Page 27

G L O B A L D E V E L O P M E N T F I N A N C E 2 0 0 6
MacPhee 2003), the negative oil shock may actu-ally have improved development prospects bypartially offsetting the Dutch-disease effect associ-ated with the increased aid.19
Despite these offsetting factors, several coun-tries appear to be encountering difficulties financ-ing their higher oil bills. In Africa, current accountdeficits among oil-importers (excluding SouthAfrica) have soared and average more than 6 per-cent of GDP. Current-account deficits have alsoreached worrisome levels in many European andCentral Asian countries. Many countries are expe-riencing fiscal difficulties because of less-than-complete pass-through. Madagascar, Malawi, andSierra Leone have been forced to ration electricityconsumption through rotating blackouts in an ef-fort to conserve energy, suggesting that they mayhave met binding current-account constraints andare unable to finance additional oil imports. Sev-eral other countries appear to be consuming inter-national reserves at unsustainable rates (Benin,Guinea Bissau, Mali, Tanzania) (figure 1.15). Instill others, reserves represent a dangerously lowshare of monthly import cover (Bangladesh,Madagascar, Namibia, Swaziland). In all of thesecountries, policy makers will need to take concretesteps, including currency depreciation and energyconservation measures, so that domestic demandand the country’s net revenue positions adjust torecent changes in relative prices.
Of particular concern are a number of coun-tries that combine high current-account deficits,significant capital inflows, high interest rates, andan appreciating currency, notably Bulgaria, Roma-nia, and Turkey (figure 1.16). These conditionspose serious problems for policy makers, as thecapital inflows (initially in the form of direct in-vestments) prompt an appreciation of the cur-rency, increase domestic money supply, and raiseinflationary pressures. In each of these countriesmonetary institutions have responded by raisinginterest rates, which reduces domestic money sup-ply growth but has also induced additional finan-cial inflows, adding to domestic liquidity and in-flationary pressures.20 While tighter fiscal policyhas helped combat these tendencies, externaldeficits continue to rise and currencies to appreci-ate in many of these countries. Should capital in-flows slow or stop, financing current levels of ex-penditure could be very difficult, placing thesecurrencies under significant pressure. A sudden de-preciation could generate an inflationary push—partially undoing recent achievements in stabiliz-ing currencies and controlling domestic inflation.
More generally, the deterioration in the cur-rent-account position of oil-importing developingcountries means that they are much more vulnera-ble now than they were in 2003. An importantsupply disruption that pushed oil prices evenhigher, or a decline in nonoil commodity prices,would be much more difficult to finance and couldprecipitate painful adjustments (see risks section).
28
Swazila
nd
Namibi
a
Bangla
desh
Mad
agas
car
Mau
ritius M
ali
Benin
Tanza
nia
Guinea
Bissau
Import coverage in months of imports
0
1
2
3
4
5
6
7
8
9
10
2003
2004 2005
18.9
Figure 1.15 Reserves in some countries are fallingrapidly or worrisomely low
Source: World Bank.
–10,000
10,000
5,000
0
–5,000
15,000
20,000
25,000
2002 2003 2004 2005
Sources of finance in Turkey’s balance of payments, US$ millions
Private investment flows
Fin req (CA Bal)
Bonds Other Reserves
Figure 1.16 Tensions associated with fast growth,the case of Turkey
Source: IMF.
012-041_GDF06_ch01.qxd 5/24/06 2:31 PM Page 28

P R O S P E C T S F O R T H E G L O B A L E C O N O M Y
Global imbalances persistThe imbalances in global spending patterns thathave characterized the world economy over thepast five years, with the United States consumingsignificantly more than it produces and running alarge current-account deficit, persisted in 2005(figure 1.17). High oil prices both exacerbated im-balances and changed their nature, contributing toabout 40 percent of the additional deterioration ofthe U.S. current-account deficit in 2005.21 At thesame time, high oil prices caused the current-account position of almost all oil-importingcountries to deteriorate and substantially boostedthose of exporters. As a result, whereas in 2002oil-importers in virtually every region except theUnited States were running a current-accountsurplus, now almost all are running deficits—with the notable exceptions China, Japan, Korea,and a few other high-income countries.
The sustainability of these imbalances andtheir financing is a question of growing concern(IMF 2006; World Bank 2005a, 2005b). Persistentcurrent-account deficits have transformed theUnited States from being the world’s most impor-tant creditor nation (with a net international in-vestment position of 13 percent of GDP in 1979)to being the world’s largest debtor (with a net assetposition of –21 percent of GDP in 2004). Unlesssavings in the United States increase substantially,
its net asset position is set to deteriorate sharply,reaching between 65 and 48 percent of GDP by2015 (Higgins, Klitgaard, and Tille 2005).22
So far, financing of these deficits has notposed a serious problem for the United States, inpart because of low interest rates and because of ageneralized willingness of foreigners to hold Amer-ican assets that yield lower returns than the for-eign assets held by Americans.23 As a result, de-spite the deterioration of its net asset position, theUnited States has continued to earn a positive netreturn on foreign investments.24 If investor’s will-ingness to continue accumulating such assetschanged, U.S. interest rates would rise and the cur-rent account balance would deteriorate (by about0.5 percent of GDP for every 100-basis-point risein U.S. interest rates relative to foreign rates).25
Over the past year, short-term interest rates in theUnited States have risen by about 100 basis pointsmore than in Europe, bringing the overall differ-ence to 220 basis points. The long-term differen-tial is now some 100 basis points (figure 1.18). Al-though it is certainly too early to tell, thismovement (and the decline in emerging-marketrisk premia against the dollar) could reflect a re-assessment of the dollar as a safe haven.
Independent of the reasons for these move-ments, the course of long-term interest rates contin-ues to be sensitive to the willingness of nonmarketsources of finance (formerly developing-countrycentral banks and now, increasingly, authorities in
29
–1000
0
–200
–400
–600
–800
200
400
US
A
Eur
ope
Japa
n
Oth
er h
igh-
inco
me
impo
rter
s
Eas
t Asi
a &
Pac
ific
(ex.
Chi
na)
Chi
na
Eur
ope
& C
entr
al A
sia
Oth
er d
evel
opin
gim
port
ers
Hig
h-in
com
eex
port
ers
Low
-inco
me
expo
rter
s
Current account balance, $ billions, 2002 and 2005
Oil importers Oil exporters
2002 2005
Figure 1.17 Global imbalances
Source: World Bank.
10-year U.S. yield
10-year euro yield
3-month euro yield
3-month U.S. yield
3-month and 10-year bond yield, %
0Jan.2002
Jan.2003
Jan.2004
Jan.2005
Jan.2006
1
2
3
4
5
6
Figure 1.18 Interest rate spreads support the dollar
Sources: World Bank, Datastream.
012-041_GDF06_ch01.qxd 5/24/06 2:31 PM Page 29

G L O B A L D E V E L O P M E N T F I N A N C E 2 0 0 6
oil-exporting countries) to purchase low-yield dol-lar-denominated assets. Lower reserve accumula-tion by oil-importing developing economies trans-lated into a $130 billion decline in their purchasesof U.S. Treasury bills and official assets (figure1.19). This was only partly offset by a $14 billionincrease in purchases by oil exporters. The need tomeet this (nonmarket) financing shortfall may havebeen among the factors that pushed up long-termU.S. interest rates.
The tensions implicit in the U.S. current-account deficit are building and need to be ad-dressed. Reducing global imbalances is a shared in-ternational responsibility, requiring a tightening offiscal policy in the United States, increased importsabroad and increased exchange-rate flexibility. Im-plementation must necessarily be gradual—toavoid excessive disruption, both within the UnitedStates as macro policy is tightened and in devel-oped and developing Asia as currencies are allowedto appreciate. However, to be effective and pre-empt market jitters the effort must be credible. Inparticular, in the absence of increased savings in theUnited States, increased domestic demand abroadand greater exchange rate flexibility are unlikely tohave a significant effect on global imbalances andwould likely exacerbate global capacity con-straints—reducing the likelihood of a soft landing.
Although in the near term global imbalancesare unlikely to provoke the serious currency crisissuggested by some (Roubini and Setser 2005), theydo imply that the dollar will face further down-
ward pressure and that U.S. interest rates will con-tinue to exceed those in Europe. Indeed, betweenJanuary and early May 2006, dollar cross rateshave been relatively sensitive to interest rate differ-entials. During this period, it has depreciated 7percent against the euro (4 percent against thewon and 0.7 percent against the renminbi) and 2.3percent in real-effective terms. Looking forwardthese trends are expected to continue and the dol-lar to depreciate slowly by about 5 percent peryear over the projection period.
World trade
Overall, merchandise trade growth slowedsomewhat in 2005, expanding by 8.9 per-
cent, as compared with 11.8 percent in 2004 (fig-ure 1.20). Most of the slowdown occurred duringthe first half of the year and among high-incomecountries. For 2005 as a whole, their export vol-umes increased only 6.0 percent, down from 10.2percent the year before. However, toward the sec-ond half of the year and into 2006, outturns haveimproved, in part because of increased Europeanexports to the Middle East.
In contrast, China’s export volume expandedby 27.8 percent in 2005, almost exactly as fast asin 2004. Moreover, despite a slowing in the paceof Chinese foreign sales towards the end of 2005,export volumes have once again picked up—ex-panding by more than 25 percent during the first
30
–200
0
200
400
600
800
1,000
2004 2005
Net flows by asset class, US$ billions
U.S. corporate bondsFDI
Equities
Treasuries
Banking
Official assets
Figure 1.19 Funding the U.S. current account deficit
Source: World Bank.
% change, year-over-year
–15
20
25
15
10
5
0
–5
–10
20052004 20062003200220012000
China (right axis)
60
50
40
30
20
10
0
–10
Developing countries (ex. China)
High-income countries
Figure 1.20 Healthy growth in world trade
Source: World Bank.
012-041_GDF06_ch01.qxd 5/24/06 2:31 PM Page 30

P R O S P E C T S F O R T H E G L O B A L E C O N O M Y
two months of 2006. Other developing countriesalso continued to expand their market share. Theirexport volumes increased 10.3 percent, only some-what slower than the year before. Here, too, tradegrowth decelerated early in the second half of2005 but has since picked up.
Oil revenues of developing-country oil ex-porters nearly doubled between 2002 and 2005,increasing by some $215 billion. For all oil ex-porters, the increase was about $400 billion.However, oil exporters have increased their ownimports markedly, and more than three-quartersof additional export revenues have been spent onadditional imports.
Oil exporters are also recycling petrodollarsthrough financial markets. Between 2002 and2005, oil-exporting developing countries increasedforeign currency reserves by $255 billion (with$117 billion of the increase accounted for by theRussian Federation). In total some $245 billion hasflowed into the United States as securities, bonds orbank deposits, while about $50 billion has beenplaced directly into the European banking sector.Unfortunately, because of the use of third-party in-termediaries and reduced reliance on the bankingsector (as compared with past episodes of high oilprices) it is particularly difficult to trace the desti-nation of these funds (BIS 2005).
Not all regions shared equally in the recyclingof petrodollars. In particular, the share of theUnited States in the imports of oil-exporting coun-tries fell from 25 to 20 percent during this period.26
In contrast, most developing countries increasedtheir market share in the imports of oil-exportingcountries. However, the increase in their exportrevenues paled in comparison with the increase intheir oil bills.
Can developing countries continue to gainmarket share at recent rates?The strong economic performance of low- andmiddle-income countries over the past severalyears reflects both rapid growth in world exports(up 90 percent since 1995) and an almost 50 per-cent increase in the market share of developingeconomies, up from 20 percent in 1995 to almost30 percent in 2005. This improvement is due, inlarge part, to increases in the market share ofChina. Nevertheless, every developing region (ex-cept East Asia excluding China) has seen its globalmarket share increase (figure 1.21).
The export boom of China is similar to pastbooms in a number of countries that are now clas-sified as high income (Israel, Japan, the Republicof Korea, and Taiwan) in that it was mostly drivenby an expansion in the range of goods exported.Thus, while technological progress, investment,and labor productivity growth contributed to a290 percent increase in Chinese sales to the UnitedStates of products already on sale in 1992, morethan 60 percent of the total increase came from thesale of goods that China did not export to theUnited States in 1992.27 This contrasts withBangladesh, for example (figure 1.22). That coun-try’s revenues from exports of traditional productsto the United States increased by an impressive 173percent between 1992 and 2005, but comparedwith China it managed only to generate one-tenthas much additional revenue from new products.
While not as marked as in China, there is evi-dence that other developing countries are diversi-fying the range of goods that they export andmoving up the value-added ladder. Today, the rev-enues of developing countries from exports tohigh-income countries depend much less on rawmaterials (figure 1.23) and much more on higher-value-added goods (and services).
The rapid increase in the market share ofChina and other developing countries resultedfrom the exploitation of preexisting competitive
31
East A
sia
& Pac
ific
East A
sia
ex. C
hina
Europ
e &
Centra
l Asia
Latin
Am
erica
& Car
ibbea
n
Midd
le Eas
t
& Nor
th A
frica
South
Asia
Sub-S
ahar
an
Africa
0.5
–0.5
4.5
5.0
4.0
3.5
3.0
2.5
2.0
1.5
1.0
0.0
% increase in global market share, 2005, since1995
Figure 1.21 Regional increases in market share
Source: World Bank.
012-041_GDF06_ch01.qxd 5/24/06 2:31 PM Page 31

G L O B A L D E V E L O P M E N T F I N A N C E 2 0 0 6
advantages that have been exposed by market lib-eralization and domestic policy reforms. These in-clude trade liberalization (both multilateral and,importantly, autonomous liberalization [WorldBank 2005]), and behind-the-border reforms, suchas regulatory reform, liberalization of foreign in-vestment regimes, and improved labor marketregulations.28
The important role that expanding the rangeof goods exported has played in China's successsuggests that trade expansion need not be boundby increases in productivity or lower wages.Rather, it reflects the exposure of preexisting com-
parative advantages to new markets, the applica-tion of lessons learned in existing sectors to newones, and a widening of the product base.
Long- term prospects for deve lopingeconomies will depend importantly on their abilityto continue increasing market share in this way.For countries and regions that, like Bangladesh,have yet to enjoy an export boom, trade liberaliza-tion and facilitation comprise key agendas. ForChina, the boost in exports associated with acces-sion to the World Trade Organization (WTO) maybe easing (accession is estimated to have increasedexport growth by 12 percentage points). Neverthe-less, China’s volume of exports can be expected tocontinue growing at around 18 percent.29
More generally, developing countries must es-tablish and maintain low tariffs across the board,minimize administrative burdens associated withtrade, and reduce transit times so that markets canbe served in a timely manner (Newfarmer 2005).On the multilateral front, efforts need to be con-centrated on agriculture, the most heavily pro-tected sector and one where many developingcountries enjoy a comparative advantage. Liberal-ization here would allow these countries to reapthe same kind of benefits that have accrued tocountries specialized in manufacturing followingthe liberalization of that sector. Second, countriesneed to reduce rigidities in product, labor, and fi-nancial markets so that firms can react with agilityto new opportunities to expand the range of prod-ucts they produce and sell.
Risks
The relatively benign soft-landing scenario fordeveloping countries that is described above is
subject to a number of important downside risks.
Managing fast growthInternal risks exist on both the upside and down-side. Following several years of very fast growth, anumber of economies are showing signs of strain,as capacity constraints appear in some sectors oras weaknesses in their infrastructure or institu-tional frameworks are exposed. In several coun-tries in the Europe and Central Asia region, strongFDI inflows attracted by privatizations and theprospects of accession to the European Union haveprompted an appreciation of domestic currencies,
32
20051992 1992 2005
Index of the value of exports to the USA, 1992 = 100
0
900
800
700
600
500
400
300
200
100
1,000New export products
Goods being sold in 1992
Bangladesh
China
Figure 1.22 Increased product range explainsmost of Chinese export growth
Source: World Bank.
1978 2002
Product shares in exports of developing countries (ex. India & China)to high-income countries, %
0
90
80
70
60
50
40
30
20
10
100ManufacturesElectronics Machinery, equipment
Motor vehicles, partsLumber, paperTextiles, apparel, leatherBeverages, tobaccoFood productsMetals, mineralsGasOil
FishingForestryCrops
Figure 1.23 Exports of developing countries havediversified
Source: World Bank.
012-041_GDF06_ch01.qxd 5/24/06 2:31 PM Page 32

P R O S P E C T S F O R T H E G L O B A L E C O N O M Y
high current-account deficits, and domestic mone-tary expansion. Subsequent increases in domesticinterest rates have attracted further financial in-flows, exacerbating the current account and ex-change rate pressures. While, these pressures areprojected to ease in our baseline projection, theycarry with them the potential to prompt a cur-rency crisis—possibly resulting in a hard landing—in one or more of these countries.
The rapid expansion of investment and domes-tic credit in some Asian economies may be overex-tending the banking sector in these countries inways that are not yet obvious, potentially resultingin a sharp reversal of fortunes. The rapid rise instock-market valuations, housing prices, and pricesof other assets in several oil-exporting countriesmay also spur a crisis if conditions change rapidly.
Finally, the real-income shocks that developingcountries have been subjected to are large, and ad-justment to them remains incomplete. While infla-tionary pressures in most countries have been con-tained so far, pressures on wages are being felt insome. Rising inflation in a few countries in LatinAmerica, South Asia, and, perhaps, Sub-SaharanAfrica are suggestive of the beginning of an infla-tionary spiral. Unless fiscal and monetary authori-ties succeed in slowing growth, inflationary expec-tations may become engrained requiring a sharperslowdown later on as authorities intervene to con-tain them.
External risksThe external environment of the past few yearshas been especially propitious for growth, charac-terized by ample liquidity, rapidly expanding de-mand for the exports developing countries. Look-ing forward, conditions will be less benign.Interest rates are rising, while very high current ac-count deficits in a number of developing countriessuggests that many have yet to adjust fully tohigher oil prices and that they have become morevulnerable to additional shocks.
The principal external risks facing the globaleconomy have changed little over the past severalyears. They include: (1) the possibility that a sup-ply shock will cause the price of oil to rise evenfurther; (2) the possibility that interest rates de-manded by foreign investors to finance the largeU.S. current-account will rise, either gradually, inresponse to depreciation of the dollar, or more pre-cipitously, because of a change in perceptions or
behavior; and (3) the possibility that nonoil com-modity prices will fall significantly.
The effects on output in the global economy,should those risks be realized, have been pre-sented in past editions of Global DevelopmentFinance and Global Economic Prospects. Ratherthan discuss them at length here (past results aresummarized briefly below), this section explorestheir potential effects on the most vulnerable oflow- and middle-income countries, particularlythose that have significantly less room for ma-neuver than they did in 2002 because of the re-cent increases in oil prices.
Table 1.2 summarizes the results from previ-ous simulations of three hypothetical shocks: (1) areduction of 2 million barrels per day in oil supply,resulting in a rise in oil prices to $100 a barrel forthree months and $80 for a further nine months;(2) a 200-basis-point increase in long-term interestrates and risk premia; and (3) a 15-percent declinein the price of nonoil commodities.
While for analytical clarity these simulationsare presented independently, there are likely to beinteractions between them. For example, were out-put to slow following a disruptive resolution ofglobal imbalances both oil and non-oil commodityprices would likely decline. This kind of interac-tion is accounted for in table 1.2, but not in themore detailed impact analyses presented in tables1.3–5. Similarly the probabilities of these externalshocks differ. The probability of a disruptive reso-lution of global imbalances is low (but grows thelonger corrective steps are not taken), while ex-perts argue that there is a 70 percent chance of a 2mbpd supply disruption sometime in the next 10years (Beccue & Huntington, 2005).
In the first scenario, a substantial disruption inglobal oil supply pushes oil prices to $100 for onequarter and to $80 for a further nine months. As aresult, global growth slows by about 0.75 percent ayear over two years. The impact is more severe inlarge low-income and middle-income countries,both because of higher energy intensities and agreater inflationary impact, which requires a largercontraction to eliminate. On average, the current-account position of oil importing countries woulddeteriorate by about 1.1 percent of GDP.
In the second scenario, concerns over the U.S.current-account deficit push long-term interestrates up by 200 basis points. Heightened insecu-rity, especially because the dollar—the traditional
33
012-041_GDF06_ch01.qxd 5/24/06 2:31 PM Page 33

G L O B A L D E V E L O P M E N T F I N A N C E 2 0 0 6
safe haven currency—is the source of disruption,causes developing country risk premia to increaseby an additional 200 basis points. World growthslows by about one-half for a period of two years,as higher interest rates cut into investment andconsumption demand, both through classic trans-mission mechanisms and via the impact of interestrates on housing prices and consumer wealth.Slower growth eases inflationary pressure andglobal tensions, allowing monetary policy toloosen. Growth starts to pick up again.
In the third scenario, a 15 percent fall in nonoilcommodity prices affects global growth only mar-ginally. The bulk of the impact is felt by Sub-Saha-ran African oil-importing countries, which sustain aterms-of-trade loss equal to 1 percent of GDP. In thecontext of already elevated current-account deficits,this translates into a substantial reduction in domes-tic demand but only a limited fall in output, becausenet exports increase as a lack of access to foreigncurrency forces non-oil import volumes to declinein line with the increased oil bill.
Potential impacts in the most vulnerable countriesFor the majority of developing countries, the fun-damental improvements (increased globalizationin both product and financial markets, improved
credibility of monetary policy, and more flexiblelabor and product markets) that allowed them toabsorb the recent hike in oil prices with limited ef-fects on output should also permit them to dealwith the kinds of shocks modeled above withouttoo much difficulty.
For other countries, however, the recent oilprice hike caused a substantial deterioration intheir current-account position. In addition to thereal-side consequences of higher interest rates or afurther increase in oil prices, the macroeconomicposition of these countries could be placed underserious strain by the shocks assumed here—result-ing in significant disruption. In the case of an in-terest rate shock, heavily indebted countries andmiddle-income countries would be most vulnera-ble, while a further increase in oil prices wouldstrike the most oil-intensive economies hardest. Adecline in nonoil commodity prices could alsohave important consequences for countries thatare currently benefiting from strong nonoil com-modity prices, notably metals and minerals.
Tables 1.3 through 1.5 summarize these sensi-tivities by highlighting the expected first-round im-pacts of the three shocks outlined above on thecurrent accounts of developing economies. Thesesimulations are meant to be illustrative—not pred-icative. Both the likelihood of a shock and its
34
Table 1.2 Estimated impact of three risk scenarios
GDP (% change from baseline) First-round impact, Year 1 Year 2 Year 3 % of GDP
Scenario 1: a 2-million-barrels-per-day negative supply shocka Scenario 3: a 15 percent decline in non-oil commodity pricesWorld –1.0 –1.5 –1.1 High-income countries 0.0High-income countries –0.7 –1.5 –1.3 Low- and middle-income countries –0.1Middle-income countries –1.6 –1.6 –0.1 Low- and middle-income oil exporters 0.0Large low-income countries –1.7 –2.8 –1.8 Low- and middle-income other –0.1 Current-account-constrained Low-income countries 0.0
low-income countries –0.3 0.1 0.0 Low-income oil exporters 0.2Low-income other –0.1
Scenario 2: a 200-basis-point increase in interest ratesb East Asia & Pacific 0.1World –1.7 –2.9 –1.9 Latin America & Caribbean –0.4High-income countries –1.5 –2.7 –2.5 Europe & Central Asia –0.2Low- and middle-income countries –2.4 –3.5 –3.0 Middle East & North Africa 0.5
South Asia 0.2Sub-Saharan Africa –0.7
Oil exporters 0.3Oil importers –1.1Oil importers less South Africa –1.1
HIPC –0.7Oil exporters 0.0Other –1.2
Source: World Bank.a. For more details see (World Bank 2005b, Table 1.5)b. For more details see (World Bank 2005b, Table 1.6)
012-041_GDF06_ch01.qxd 5/24/06 2:31 PM Page 34
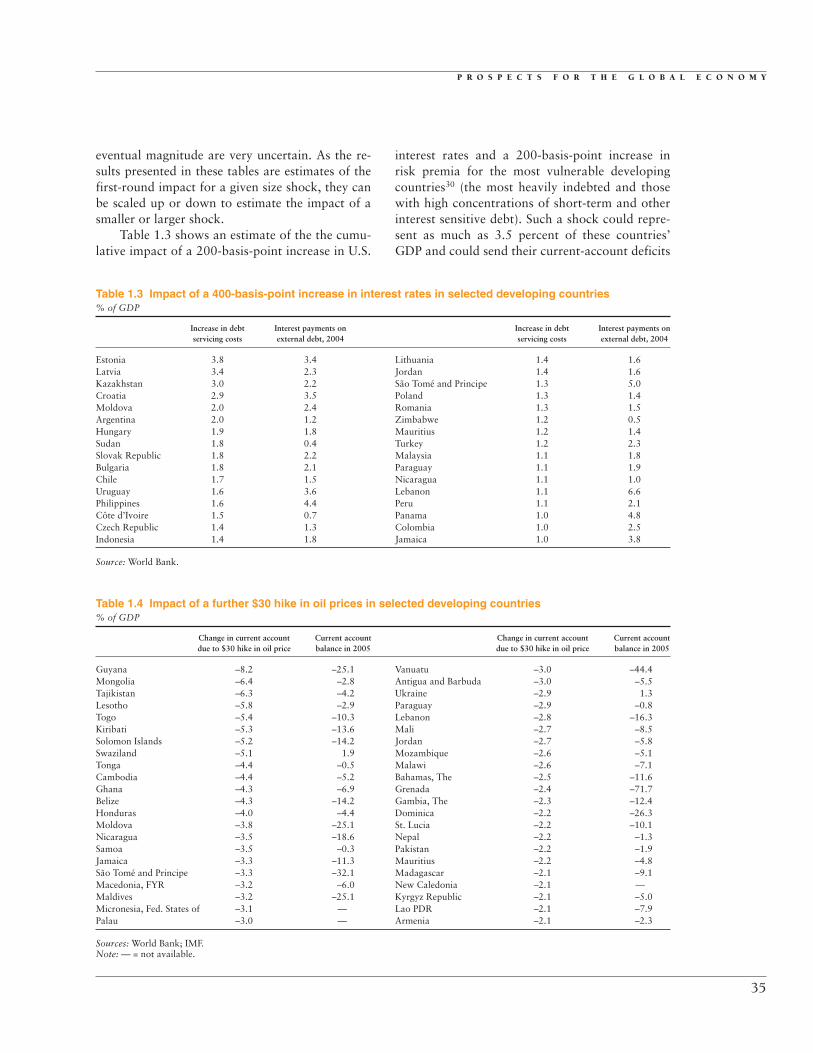
P R O S P E C T S F O R T H E G L O B A L E C O N O M Y
eventual magnitude are very uncertain. As the re-sults presented in these tables are estimates of thefirst-round impact for a given size shock, they canbe scaled up or down to estimate the impact of asmaller or larger shock.
Table 1.3 shows an estimate of the the cumu-lative impact of a 200-basis-point increase in U.S.
interest rates and a 200-basis-point increase inrisk premia for the most vulnerable developingcountries30 (the most heavily indebted and thosewith high concentrations of short-term and otherinterest sensitive debt). Such a shock could repre-sent as much as 3.5 percent of these countries’GDP and could send their current-account deficits
35
Table 1.3 Impact of a 400-basis-point increase in interest rates in selected developing countries% of GDP
Increase in debt Interest payments on Increase in debt Interest payments on servicing costs external debt, 2004 servicing costs external debt, 2004
Estonia 3.8 3.4 Lithuania 1.4 1.6 Latvia 3.4 2.3 Jordan 1.4 1.6 Kazakhstan 3.0 2.2 São Tomé and Principe 1.3 5.0 Croatia 2.9 3.5 Poland 1.3 1.4 Moldova 2.0 2.4 Romania 1.3 1.5 Argentina 2.0 1.2 Zimbabwe 1.2 0.5 Hungary 1.9 1.8 Mauritius 1.2 1.4 Sudan 1.8 0.4 Turkey 1.2 2.3 Slovak Republic 1.8 2.2 Malaysia 1.1 1.8 Bulgaria 1.8 2.1 Paraguay 1.1 1.9 Chile 1.7 1.5 Nicaragua 1.1 1.0 Uruguay 1.6 3.6 Lebanon 1.1 6.6 Philippines 1.6 4.4 Peru 1.1 2.1 Côte d’Ivoire 1.5 0.7 Panama 1.0 4.8 Czech Republic 1.4 1.3 Colombia 1.0 2.5 Indonesia 1.4 1.8 Jamaica 1.0 3.8
Source: World Bank.
Table 1.4 Impact of a further $30 hike in oil prices in selected developing countries% of GDP
Change in current account Current account Change in current account Current account due to $30 hike in oil price balance in 2005 due to $30 hike in oil price balance in 2005
Guyana –8.2 –25.1 Vanuatu –3.0 –44.4Mongolia –6.4 –2.8 Antigua and Barbuda –3.0 –5.5Tajikistan –6.3 –4.2 Ukraine –2.9 1.3Lesotho –5.8 –2.9 Paraguay –2.9 –0.8Togo –5.4 –10.3 Lebanon –2.8 –16.3Kiribati –5.3 –13.6 Mali –2.7 –8.5Solomon Islands –5.2 –14.2 Jordan –2.7 –5.8Swaziland –5.1 1.9 Mozambique –2.6 –5.1Tonga –4.4 –0.5 Malawi –2.6 –7.1Cambodia –4.4 –5.2 Bahamas, The –2.5 –11.6Ghana –4.3 –6.9 Grenada –2.4 –71.7Belize –4.3 –14.2 Gambia, The –2.3 –12.4Honduras –4.0 –4.4 Dominica –2.2 –26.3Moldova –3.8 –25.1 St. Lucia –2.2 –10.1Nicaragua –3.5 –18.6 Nepal –2.2 –1.3Samoa –3.5 –0.3 Pakistan –2.2 –1.9Jamaica –3.3 –11.3 Mauritius –2.2 –4.8São Tomé and Principe –3.3 –32.1 Madagascar –2.1 –9.1Macedonia, FYR –3.2 –6.0 New Caledonia –2.1 —Maldives –3.2 –25.1 Kyrgyz Republic –2.1 –5.0Micronesia, Fed. States of –3.1 — Lao PDR –2.1 –7.9Palau –3.0 — Armenia –2.1 –2.3
Sources: World Bank; IMF.Note: — = not available.
012-041_GDF06_ch01.qxd 5/24/06 2:31 PM Page 35

G L O B A L D E V E L O P M E N T F I N A N C E 2 0 0 6
to unsustainable levels. Depending on the avail-ability of additional financing, this would requiresubstantial retrenchment in these countries, likelyimplying large cuts in government spending andreductions in domestic demand that would likelytranslate into a period of sustained lower growthor a sharp recession. Encouragingly, a number ofheavily indebted countries have taken advantageof favorable financing conditions to restructuretheir debt, reducing their sensitivity to changes ininterest rates. As a result, countries that have expe-rienced financial crises in the past, such as Brazil,Mexico and Thailand, appear to be much less vul-nerable to a rapid rise in interest rates and do notappear in table 1.3.
On average, for oil-importing low-incomecountries, the initial terms-of-trade shock of a fur-ther $30 hike in oil prices is estimated at 4.1 per-cent of their GDP. This would translate into a 2.7percent decline in domestic demand, with poten-tially serious impacts on poverty. For the most oil-intensive economies, this could amount to as muchas 8 percent of GDP (table 1.4). While many coun-tries throughout the developing world would behard hit, most countries could be expected againto manifest the same resilience they showed duringthe previous oil hike. Problems are most likely tocrop up in those countries that combine a large ex-
pected impact with already large current-accountdeficits. Such countries are unlikely to be able tofind additional financing for their oil bills and, asa result, could be expected to undergo significantreal-side adjustments as the volume of domesticdemand, as well as oil (and nonoil) imports, wouldhave to be cut in order to finance the higher costof imported oil.
Table 1.5 reports the expected terms-of-tradeimpact from a 15 percent reduction in nonoil com-modity prices, as well as estimates for the current-account deficit in 2005, for those countries wherethe impact would be greater than 2 percent ofGDP. While countries throughout the developingworld would be hard hit, large impacts are con-centrated in developing Africa. Indeed, for the re-gion as a whole, the negative impact would be 0.7percent of GDP, or 1.2 percent of the GDP ofheavily indebted poor countries. While many ofthese countries currently have healthy current-account balances (for example, Côte d’Ivoire,Papua New Guinea, Paraguay, and Ukraine) andcan be expected to absorb even such a large shockrelatively easily, many others are already in a vul-nerable state. For these countries, taking stepsnow to improve the competitiveness of their ex-port industries and reduce reliance on imports iseven more critical.
Avian influenza
The continued spread of the bird-to-bird ver-sion of avian influenza (or bird flu, also
known by its scientific identifier H5N1), with lim-ited bird-to-human transmission comprises part ofthe baseline forecast. A serious risk to the globaleconomy stems from the possibility that avian in-fluenza might mutate into a form of flu that is eas-ily transmitted between humans and for which thepopulation has limited immunity.31 The humanand economic consequences of such a pandemicare potentially very large and depend importantlyon the nature of the flu that emerges and on the re-actions of people as it spreads.
Economic consequences of a further spread of bird-to-bird fluThe principal economic impact of the H5N1 virusso far has come in the rural sectors of severalAsian economies in which the disease is endemic.
36
Table 1.5 Impact of a 15 percent fall in non-oilcommodity % of GDP
Change in current Current accountaccount balance balance (2005)
Guyana –8.3 –25.1Tajikistan –7.3 –4.2Suriname –7.0 –12.3Solomon Islands –4.5 –14.2Belize –3.8 –14.2Mauritania –3.8 –29.6Mongolia –3.7 –2.8Paraguay –3.5 –0.8Papua New Guinea –3.5 10.0Kyrgyz Republic –3.1 –5.0Mali –3.0 –8.5Côte d’Ivoire –2.9 2.2Ghana –2.9 –6.9Malawi –2.8 –7.1Chile –2.5 –0.9Zimbabwe –2.3 46.6Zambia –2.2 –10.3Ukraine –2.0 1.3Jamaica –2.0 –11.3
Source: World Bank; IMF.
012-041_GDF06_ch01.qxd 5/24/06 2:31 PM Page 36

P R O S P E C T S F O R T H E G L O B A L E C O N O M Y
Its appearance in a number of European andAfrican countries suggests that the disease may be-come as prevalent among the wild birds of thesecontinents as it is currently in Asia.
Table 1.6 reports an effort to estimate the eco-nomic impact of such a spreading of the currentbird-to-bird flu. The reported results are based ona scenario where bird-to bird flu becomes endemicthroughout the world to the degree observed inVietnam in 2004 (approximately 12 percent of alldomestic birds died from the disease or wereculled to prevent spread). While direct costs aresmall (only 0.1 percent of world GDP),32 differingdegrees of international specialization and coststructures suggest that, allowing for interactionswith other sectors, regional impacts could be ashigh as 0.7 percent of GDP.33 Because the sector ismore important in developing countries and rela-tively labor intensive, job losses could representabout 0.2 percent of the global work force, orsome 5 million jobs during the time it takes theglobal economy to adjust.
Possible economic consequences of a human pandemicEven a flu with “normal” characteristics in terms oftransmissibility and deadliness could have seriousconsequences for the global economy if the world’spopulation has limited immunity. Estimates suggestthat such a flu could infect as much as 35 percent ofthe world’s population (WHO 2005), spreadingthroughout the world in as few as 180 days (RTI,2006). As compared with a normal flu season,where some 0.2–1.5 million die (WHO 2003),34
deaths from even a mild new flu might include an
additional 1.4 million people worldwide. A morevirulent form, such as the 1918-9 flu, which wasmore deadly for healthy adults than a normal flu,could have much more serious consequences, killingas many as 1 in 40 infected individuals (Barry 2005)or some 71 million, with some authors suggestingthat as many as 180–260 million could die in aworst-case scenario (Osterholm 2005).
Table 1.7 reports the results of three separatesimulations of the economic consequences of apandemic (McKibbin and Sidorenko 2006). Thefirst (mild) scenario is modeled on the Hong Kongflu of 1968-9; the moderate flu has the characteris-tics of the 1957 Asian flu; and the severe simula-tion is benchmarked on the 1918-9 Spanish flu.35
Each of these scenarios assumes that efforts by in-dividuals and official agencies to limit the spreadof the disease are no more effectual than those ob-served during previous epidemics and reflects dif-ferences in population density, poverty, and thequality of health care available. For the world as awhole, a mild pandemic would reduce output byless than 1 percent of GDP, a moderate outbreakby more than 2 percent, and a severe pandemic byalmost 5 percent, constituting a major global re-cession. Generally speaking, developing countrieswould be hardest hit, because of higher populationdensities, poverty and weaker health infrastruc-ture.36 In addition, as modeled, less flexible mar-ket mechanisms accentuate the economic impactsin some countries.
Table 1.8 shows an alternative modeling of apandemic. It is based on a pandemic similar interms of mortality to the Asian flu epidemic of1958. This scenario is presented with a view to bet-ter understanding the factors driving the aggregate
37
Table 1.7 Possible economic impacts of flu pandemic % change in GDP, first-year
Mild Moderate Severe
World –0.7 –2.0 –4.8High-income countries –0.7 –2.0 –4.7Developing countries –0.6 –2.1 –5.3East Asia & Pacific –0.8 –3.5 –8.7Europe & Central Asia –2.1 –4.8 –9.9Middle-East & North Africa –0.7 –2.8 –7.0South Asia –0.6 –2.1 –4.9
Deaths (millions) 1.4 14.2 71.1
Source: World Bank calculations based on McKibbin & Sidorenko(2006).
Table 1.6 Impact of a widening of bird-bird flu % change in GDP, relative to the baseline
Bird-birda
World total –0.1High-income countries –0.1
Low- & middle-income countries –0.4
East Asia & Pacific –0.4Europe & Central Asia –0.4Latin America & Caribbean –0.7Middle East & North Africa –0.4South Asia –0.4Sub-Saharan Africa –0.3
Source: World Bank.a. Assumes that 12 percent of domestic birds in each region diefrom the disease or are killed in efforts to prevent its spread.
012-041_GDF06_ch01.qxd 5/24/06 2:31 PM Page 37

G L O B A L D E V E L O P M E N T F I N A N C E 2 0 0 6
numbers in such simulations. The first columnshows the impact in terms of GDP lost in the firstyear of the pandemic purely from additional deaths(here roughly equal to McKibbin and Sidorenko’ssevere scenario). The second column builds in theimpact on aggregate productivity resulting fromthe infection of some 35 percent of the population.Even though individuals are only temporarily un-available from work, the impact on output here ismore than twice as large as from the loss of life, be-cause the affected population is so much larger.
The third column shows the largest impact.Here individuals are assumed to change their be-havior in the face of the pandemic by (a) reducingair travel in order to avoid infection in the en-closed space of a plane, (b) avoiding travel to in-fected destinations, and (c) reducing consumptionof services such as restaurant dining, tourism,mass transport, and nonessential retail shopping.The degree to which such reactions would occur isnecessarily uncertain. In this scenario it was as-sumed that for the year as a whole air travel woulddecline by 20 percent and that tourism, restaurantmeals, and consumption of mass transportationservices would also decline by 20 percent.
This compares with a peak decline of 75 per-cent in air travel to Hong Kong during the SARSepidemic and an average decline of 50–60 percentduring the four-month period the outbreak wasactive. Retail sales declined by 15 percent at thepeak and by about 9 percent over the four month
period—implying about 15 percent decline fromtrend (Siu and Wong, 2004). Higher declines on anannualized basis are assumed in these simulationsbecause a flu pandemic would likely last morethan a year (pandemics are typically experiencedin at least two waves with a peak period of infec-tion during the winter).
The total impact of a shock combining allthese elements is 3.1 percent for the global econ-omy and ranges from 4.4 percent in Latin Americaand the Caribbean to 2.6 percent in the East Asiaand Pacific region, mainly reflecting the relativeimportance and labor intensity of tourism andother services in each region.
The modeling attempted to take into accountthe possibility that the economic effects of an out-break would be greatest in the country where thehuman-to-human strain originates, the main fac-tor here being private and public efforts to isolateand contain the disease by avoiding travel and im-posing quarantines. However, simulations of anoutbreak beginning in Thailand suggest that what-ever additional costs the originating country mayendure, these would be dominated by secondaryeffects as the disease spreads to other countriesand global economic activity declines.
Given the tremendous uncertainties surround-ing the possibility and eventual nature of a pan-demic, these simulations must be viewed as purelyillustrative. They provide a sense of the overallmagnitude of potential costs. Actual costs, both in
38
Table 1.8 A breakdown of economic impacts of a potential human-to-human pandemic % of GDP
Impact of illness Impact of efforts Total Mortalitya and absenteeismb to avoid infectionc Total ($ billions)
World total –0.4 –0.9 –1.9 –3.1 –965.4 High-income countries –0.3 –0.9 –1.8 –3.0 –744.9 Low- and middle-income countries –0.6 –0.9 –2.1 –3.6 –220.4 East Asia & Pacific –0.7 –0.7 –1.2 –2.6 –44.8 Europe & Central Asia –0.4 –0.7 –2.3 –3.4 –21.7 Latin America & Caribbean –0.5 –0.9 –2.9 –4.4 –87.3 Middle East & North Africa –0.7 –1.2 –1.8 –3.7 –32.2 South Asia –0.6 –0.8 –2.2 –3.6 –22.7 Sub-Saharan Africa –0.6 –0.9 –2.2 –3.7 –11.8
Source: World Bank.a. Assumes a human flu pandemic similar to the 1958 Asian flu. Globally 1.08 percent of the world population dies, with regional mortallityrates varying from 0.3 percent in the U.S. to more than 2 percent in some developing countries. b. Assumes that for every person that dies 3 are seriously ill, requiring hospitalization for a week and absence from work for two weeks, 4 require medical treatment and are absent from work for a week and approximately 27 percent of the population has a mild bout of flu requiring two days absence from work. It assumes that in addition for every sick day another absentee day is registered either because peoplestay at home to care for a sick person or to avoid illness. c. Efforts to avoid infection are modelled as a demand shock, reflecting reduced travel, restaurant dining, hotels, tourism and theatre as individuals seek to avoid contact with others.
012-041_GDF06_ch01.qxd 5/24/06 2:31 PM Page 38

P R O S P E C T S F O R T H E G L O B A L E C O N O M Y
terms of human lives and economic losses, arelikely to be very different.
That said, these simulations serve to underlinethe importance of mobilizing global efforts tomeet this potential crisis. Monitoring outbreaks ofbird-to-bird and bird-to-human infections andculling infected flocks appear to be effective strate-gies to reduce bird-to-human transmission and re-duce the likelihood that the disease will mutateinto a form that is easily transmissible between hu-mans. The fact that there have been no reportedcases of bird flu in Vietnam in the 2005-6 flu sea-son suggests that such preventative efforts can beeffective.
However, even with such efforts, an eventualhuman pandemic at some unknown point in thefuture is virtually inevitable (WHO, 2004). Be-cause such a pandemic would spread very quickly,substantial efforts need to be put into place to de-velop effective strategies and contingency plansthat could be enacted at short notice. Much moreresearch and coordination at the global level arerequired.
Notes1. In addition to the Prospects for the Global Economy
web site (http://www.worldbank.org/outlook) the WorldBank’s East Asia update provides more detailed informationon recent developments and prospects for the East Asia andPacific region (http://www.worldbank.org/eapupdate/).
2. The World Bank’s East Asia Update provides addi-tional detail on avian influenza in the region (http://www.worldbank.org/eapupdate/).
3. In addition to the Prospects for the Global Economyweb site (http://www.worldbank.org/globaloutlook), whichprovides more detail on the regional forecasts, the WorldBank’s Middle East and North Africa Region’s Economic De-velopments and Prospects (http://www.worldbank.org/mena)provides country-specific analysis of economic developments,projections, and policy priorities.
4. For the purposes of this report, the developing coun-tries of the region are Algeria, Egypt, Jordan, Iran, Mo-rocco, Oman, Syria, Tunisia, and Yemen. A lack of data pre-vented inclusion of Djibouti, Iraq, Lebanon, and Libya fromthe projections. Important regional players include the high-income countries of Bahrain, Kuwait, Qatar, Saudi Arabia,and the United Arab Emirates.
5. Fiscal and quasi-fiscal spending increased by 0.7percent of GDP in Bangladesh, by 0.5 percent of GDP inIndia, and by significant, though lesser, amounts in othercountries of the region.
6. More than one-third grew faster than 5 percent onaverage between 2000 and 2005, compared with less than10 percent during the period 1980–1995.
7. While large in percentage terms, the increase in oilprices from around $10 to $20 a barrel between 1999 and2000 is not considered as part of the oil shock, because itmerely reflected the reversal of a similar fall in prices theyear before.
8. The short-term price elasticity of oil demand is esti-mated at between –0.01 and –0.2 percent (Burger 2005),implying that immediately following a 100-percent increasein oil prices, such as observed between 2002 and 2005, oildemand would be expected to decelerate by between 1 and20 percent. Long-term elasticities are larger (between –0.2and –0.6 percent), implying that the negative effect of higherprices over the past few years will continue to be felt.
9. The current rise in oil prices began in early 2003.10. OPEC did increase its deliveries during 2004 by
drawing down its spare capacity, but so far investments toincrease that capacity have been limited.
11. In the three years following both the 1973 and1979 oil price hikes, non-OPEC non-former Soviet Unionoil producers increased their output by some 3.5 millionbarrels per day. In contrast, since 2002, production fromthese sources has actually declined.
12. Beccue and Huntington (2005) estimate the proba-bility of a 2 mbpd supply shock occurring during the next10 years as 70 percent for one lasting 6 months and 35 per-cent for one lasting 18 months.
13. Baffes (2005) estimates the elasticity of nonoilcommodity prices to oil prices to be 0.15.
14. Normally, the yield curve is upward sloping, im-plying that bonds of shorter duration yield lower rates of re-turn than longer term bonds. This upward slope is generallythought to reflect individuals’ time preference for money, onthe one hand, and the increased risk associated with longerterm lending.
15. For low- and middle-income countries as a whole,net bank lending actually exceeded bond emissions by asmall margin.
16. About as many appreciated as depreciated. Over-all, the unweighted average impact was a real effective de-preciation of just 1 percent.
17. The unweighted average appreciation of oil andmineral exporters was smaller, at around 9 percent.
18. Simulations using the World Bank’s MAMS model(a computable general equilibrium model for studying theimpact of aid on achieving the Millennium Developmentgoals) indicate that a negative term-of-trade shock of 1 per-cent of GDP would reduce import volume growth in thefirst year by 2 percent. When combined with a 1 percent ofGDP increase in aid flows, imports fall by only 0.7 percent.
19. The same simulations suggest that the real apprecia-tion from a permanent increase in aid inflows equal to 1 per-cent of GDP would reduce exports by about 3 percent in thefirst year and .66 percent per annum over a 10-year period.When combined with a negative terms-of-trade effect equal to1 percent of GDP, the appreciation is reduced by half and theimpact on export growth rates reduced by 10 percent.
20. In the case of Turkey, the central bank has tight-ened policy rates, while in Bulgaria the rise in interest ratesis an automatic response to capital inflows by the country’scurrency board system.
39
012-041_GDF06_ch01.qxd 5/24/06 2:31 PM Page 39

G L O B A L D E V E L O P M E N T F I N A N C E 2 0 0 6
21. The current-account deficit of the United Statescame in at $805 billion or about 6.4 percent of U.S. GDP.
22. These estimates are based on three scenarios. In thefirst, the current-account deficit is assumed to remain con-stant at 6 percent of GDP; nominal GDP is projected to in-crease by 5 percent per annum; and exchange rates and ratesof return of U.S. and foreign assets are to remain constant.Because net returns fall to –1.2 percent of GDP, this impliesan improvement in the U.S. current-account deficit equal to1 percent of GDP. A second scenario assumes that the cur-rent-account deficit declines to 2.5 percent of GDP, implyinga substantial improvement in the U.S. trade balance equal to0.5 percentage point per year. In the third scenario, the ratesof return on U.S. and foreign assets are assumed to equalize,increasing net debt-servicing costs to 2.1 percent of GDP.
23. Empirically, this willingness takes three principalforms. First, foreigners hold a higher share of relativelylow-yield dollar-denominated assets than do Americans—reducing the overall earnings on their assets. Secondly, asrecorded in the balance of payments, American investmentsabroad earn a significantly higher rate of return than doforeign investments in the United States (6.9 percent vs. 2.5percent over the past 10 years). Finally, foreigners holdlarge quantities of dollars in cash, which earn no return.These three factors, in combination, mean that despite thenegative net international asset position of the UnitedStates, the country continues to earn a small but positivenet income from capital services.
24. Haussman and Sturzenegger (2005), in a controver-sial article, take this observation to an extreme. They arguethat if the United States earns a positive return on its net for-eign asset position, in economic terms, it must be positive.They propose to measure it as the net present value of the in-come stream recorded in the balance of payments. They thenredefine the current-account balance as the change in thatnet asset position (effectively 20 times the annual change inincome flow). Finally, they define the difference between thismeasure and the normal current account of the balance ofpayments as exports of “dark matter,” or know-how servicesembodied in FDI, insurance services provided by less riskyU.S. assets, and liquidity services deriving from the quality ofthe U.S. dollar as the world reserve currency. On this basisthey compute that the net asset position of the United Stateswas actually a small surplus in 2004.
25. Interestingly, such a change in the willingness of in-vestors to hold U.S. assets would cause Haussman andSturzenegger’s (2005) definition of the net international in-vestment position of the United States to deteriorate by 10percent of GDP, and would imply an equal fall in their esti-mate of the current account—highlighting the sensitivity oftheir measures to interest rates and unmeasurable confi-dence factors.
26. While economic factors certainly have played arole (the erosion of market share among high-income coun-tries mirrors earlier developments), political factors alsoplayed a role. In particular, the imports of oil importersfrom the United States declined substantially in the period2001/2. While growth rates since then have been on a par
with other high-income countries, the lost market share hasnot been recouped.
27. Between 1972 and 2004, China went from exporting510 separate goods to 10,199 (Borda and Weinstein 2004).
28. In the case of China, many behind-the-borderchanges were precipitated by the country’s desire to join theWorld Trade Organization. Similarly, many reforms in theEuropean transition countries were motivated by the desireof those countries to join the European Union.
29. Econometric estimates suggest that over the pastthree years the underlying trend growth in China was 11.7percent. WTO accession contributed an additional 12 per-cent to Chinese export growth. Market growth was worth6.3 percent. Relative price changes reduced the total by 4.2percent (Martel Garcia, forthcoming).
30. Only countries where the estimated impact equalsor exceeds 1 percent of GDP are shown.
31. There are a number of kinds of avian influenza thatare carried by many wild bird species with no apparent harm.Some of these make other bird species, notably domestic poul-try, sick. Typically, the birds are mildly sick, but the H5N1virus that is currently circulating is relatively dangerous for do-mestic birds. Most forms of avian influenza viruses are highlyspecies-specific and do not normally infect people. However,H5N1 has crossed the species barrier to infect humans onthree occasions in recent years—in Hong Kong in 1997 andduring the current outbreak, which began in December 2003.While deadly (115 human deaths among 208 confirmed casesas of May 12, 2006), the virus in its current form is not easilytransmitted to or between humans (WHO 2006).
32. Direct costs are small. Six percent of the worldpopulation of domestic poultry amounts to some 170 mil-lion birds. At a retail price of $2 per bird, and assuming(based on the Vietnamese experience) 0.75 cents in costs as-sociated with monitoring and culling infected birds, thiswould amount to about $760 million worldwide, or about0.02 percent of world GDP.
33. While the poultry sector represents less than 0.2percent of the GDP of high-income countries, its share indeveloping countries is about 1.2 percent of GDP, rising to2.4 percent of GDP in the East Asia and Pacific region.
34. The World Health Organization (2003) estimatesbetween 200,000 and 500,000 deaths each year. Osterholm(2005) reports a higher death toll of between 1 and 1.5 mil-lion people worldwide from influenza infections or relatedcomplications, making it the third most deadly infectiousdisease after AIDS and tuberculosis, but ahead of malaria.
35. McKibbin and Sidorenko also model an “Ultra” flu,which is not based on any known previous pandemic, but hasthe characteristics of the Spanish flu, plus higher mortality forolder people. This simulation is not reported here.
36. McKibbin and Sidorenko’s model has relativelylimited country coverage: 20 economies. comprised of 10high-income countries and 1 residual high-income region; 5low- and middle-income countries in East Asia and one inSouth Asia; and three additional developing regions. Re-gional aggregates in table 1.7 are approximations based onthe countries and regions modeled.
40
012-041_GDF06_ch01.qxd 5/24/06 2:31 PM Page 40

P R O S P E C T S F O R T H E G L O B A L E C O N O M Y
References
Baffes, John. 2005. “Oil Spills over to Other Commodities.”Unpublished paper, World Bank, Washington, DC.
Barry, John M. 2005. The Great Influenza: The Epic Storyof the Deadliest Plague in History. London: Penguin.
Beccue, Phillip C., and Hillard G. Huntington. 2005. “AnAssessment of Oil Market Disruption Risks.” EnergyModeling Forum, Stanford University. October.http://www.stanford.edu/group/EMF/publications/doc/EMFSR8.pdf
Billings, Molly. 1997. “The Influenza Pandemic of 1918.”Stanford University. http://www.stanford.edu/group/virus/uda/.
Borda, C., and D. C. Weinstein. 2004. “Globalization and theGains from Variety.” NBER Working Paper 10314, Na-tional Bureau of Economic Research, Cambridge, MA.
Buiter, Willem. 2006. “Dark Matter or Cold Fusion.”Global Economics Paper 136. Goldman Sachs, NewYork. January.
Cline, William. 2005. The United States as a Debtor Nation.Washington, DC: Institute for International Economics.
Devarajan, Shantayanan, and Ejaz Ghani. 2006. “Oil PriceShocks, Fiscal Adjustment, and Poverty Reduction inAsia.” Paper presented at the SAARC finance seminar on“Current Oil Price Shock and Its Implications on SouthAsian Economies,” Colombo, Sri Lanka. January.
Diaz-Bonilla, Carolina, and Cristina Savescu. 2006. “Simu-lations of Economic Impacts of Official DevelopmentAssistance and Oil Price Increases: Ethiopia.” Unpub-lished paper, World Bank, Washington, DC.
Estrella, Arturo. 2005. “Why does the yield curve predictoutput and inflation?” Economic Journal. July.
Frankel, Jeffrey A., and David Romer. 1999. “Does TradeCause Growth?” American Economic Review 89 (3):379–99.
Higgins, Mathew, Thomas Klitgaard, and Cedric Tille.2005. “The Implications of Rising U.S. InternationalLiabilities.” Current Economic Issues (Federal ReserveBank of New York) 11 (5). December.
Hausmann, Ricardo, and Federico Sturzenegger. 2005.“Global Imbalances or Bad Accounting? The MissingDark Matter in the Wealth of Nations.” Unpublishedpaper, Harvard University.
Hummels, D., and P. J. Klenow. 2004. “The Variety andQuality of a Nation’s Exports.” Unpublished paper.Purdue University and Stanford University.
Ibrahim, Izani, and Craig MacPhee. 2003. “Export External-ities and Economic Growth.” Journal of InternationalTrade & Economic Development 12 (3): 257–83.
IMF (International Monetary Fund). 2006. World EconomicOutlook. IMF: Washington, DC.
Kehoe, T. J., and K. J. Ruhl. 2003. “How Important Is theNew Goods Margin in International Trade?” ResearchDepartment Staff Report 324, Federal Reserve Bank ofMinneapolis.
Laster, David, and Robert N. McCauley. 1994. “MakingSense of the Profits of Foreign Firms in the UnitedStates.” Quarterly Review (Federal Reserve Bank ofNew York) 19 (2).
Martel Garcia, Fernando. 2006. “Understanding Long Ex-port Booms: The Case of China.” Unpublished paper,World Bank, Washington, DC.
Mataloni, Raymond J. 2001. “An Examination of the LowRates of Return of Foreign-Owned U.S. Companies.”Survey of Current Business (March): 55–73.
McKibbin, Warwick, and Alexandra Sidorenko. 2006.“Global Macroeconomic Consequences of PandemicInfluenza.” Lowy Institute for International Policy,Sydney Australia.
Newfarmer, Richard, ed. 2005. Trade, Doha, and Develop-ment: A Window into the Issues. World Bank, Wash-ington, DC.
Osterholm, Michael T. 2005. “Preparing for the Next Pan-demic.” New England Journal of Medicine 352 (May):1839–42.
Roubini, Nouriel, and Brad Setser. 2005. “Will the BrettonWoods 2 Regime Unravel Soon? The Risk of a HardLanding in 2005–2006.” Paper presented at conferenceon “Revived Bretton Woods System: A New Paradigmfor Asian Development,” San Francisco, February 4.
Setser, Brad. 2006. “On the Origins of Dark Matter.” Janu-ary http://www.rgemonitor.com/blog/setser/113810.
Siu, Alan, and Y. C. Richard Wong. 2004. “Economic Im-pact of SARS: The Case of Hong Kong.” Hong KongInstitute of Economics and Business Strategy, WorkingPaper 1084. April.
World Bank. 2005a. Global Development Finance 2005:Mobilizing Finance and Managing Vulnerability. WorldBank: Washington, DC.
———. 2005b. Global Economic Prospects 2006: EconomicImplications of Remittances and Migration. Washing-ton, DC.
World Health Organization. 2003. “Influenza.” Fact Sheet211, Geneva. http://www.who.int/mediacentre/factsheets/fs211/en/index.html.
———. 2004. “World Is Ill-Prepared for “Inevitable” FluPandemic.” Bulletin of the World Health Organization82 (4): 317–18.
———. 2006. “Avian Influenza (“bird flu”) Fact Sheet.”http://www.who.int/mediacentre/factsheets/avian_in-fluenza/en/index.html. February 2006.
41
012-041_GDF06_ch01.qxd 5/24/06 2:31 PM Page 41