011116 market; business plan
TRANSCRIPT

HIGHLY CONFIDENTIAL
Market Business PlanTurn Key Supply ChainProtected By Global IP

HIGHLY CONFIDENTIAL
SUBSTANTIAL INVESTOR RETURNS
95 vessels(0.6% of Global fleet)
180 vessels(1.1% of Global fleet)
360 vessels(2.1% of Global fleet)
585 vessels(3.4% of Global fleet)
41%
69%
95%
113%
Investor return in 2021Vessels fitted with rotors by 2021
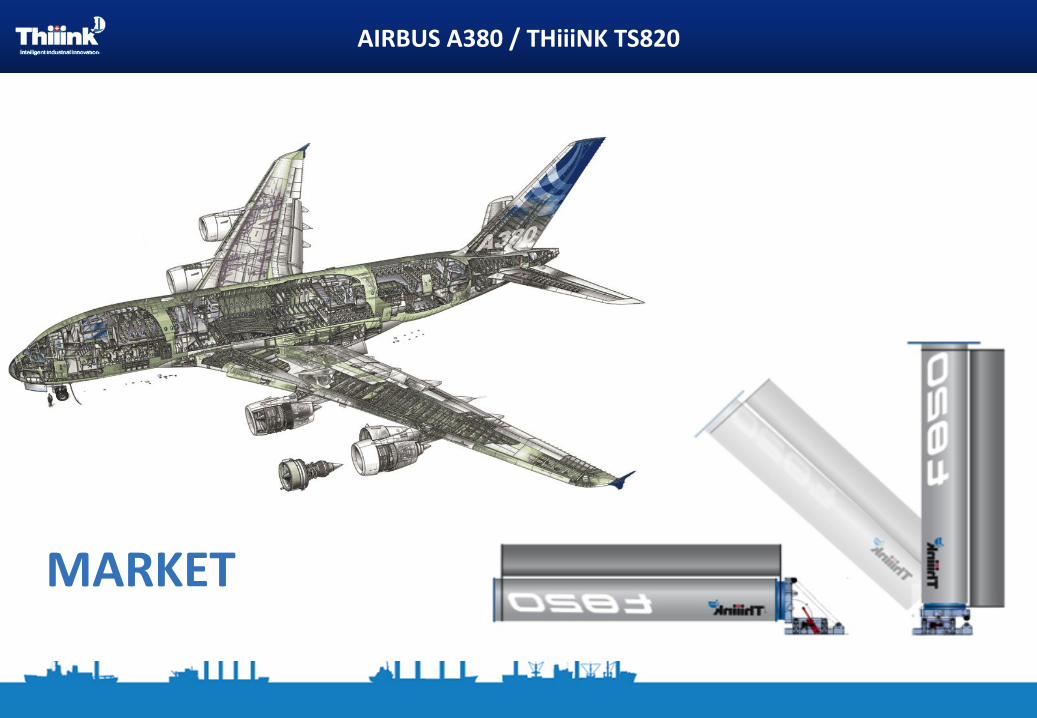
AIRBUSA380/THiiiNKTS820
MARKET

Prospective market & size
4
Current global shipping market§ 85% of world trade by volume is carried by sea§ Market is very conscious of fuel saving efficiencies§ Oil companies are looking to portray a green public image
§ Currently 90,000 commercial vessels in the world to potentially target§ Most major global oil / shipping companies part own fleets
§ An estimated total market of 17,000+ vessels above 50,000DWT
Initial target market§ Focus on oil and gas tankers to start used by oil majors:
‒ MR – 50,000 DWT – Global fleet = 1560 vessels‒ Panamax – 80,000 DWT – Global fleet = 415 vessels
‒ Aframax – 120,000 DWT – Global fleet = 890 vessels‒ Suezmax – 200,000 DWT – Global fleet = 474 vessels
‒ VLCC – 320,000 DWT – Global fleet = 627 vessels§ Total number of vessels – 3,966§ Addressable market =
Global addressable fleet of 17,000 vessels, c.£200bn potential rotor market
Aframax tanker (LR2) – c.100,000 tnCost: c.$50mLife fuel cost: >$160m ($8m pa)
Number of LR2 in world: 8901
Life fuel savings: >$50m ($2.6m pa)
Note:1 – Jakob Staushold, CFO of Moller Maerks (world’s largest shipping group)2 – Fearnleys report, March 2012
Initial target vessel
Ships X Rotors
3,966 X $10m = $40bn
890 vessels

Market drivers – why will ship owners buy them?
5
Fuel savingRising fuel prices
Fuel saving bonuses from charterHigher charter rates
34% ROCE for ship ownersCompetitive advantage
Regulation1.2bn tonnes of CO2 annually from shipsExpected to rise by >30% to 50% by 2020
Pressure to control bad emissionsPermitted emissions limit to be reduced by 2020
Control areas to be expanded to total OceanGlobal sulphur 0.5 limits just ratified by law October 26 2016
PULL
FA
CTO
RS
PUSH
FA
CTO
RS
SHIP OWNER
Analysts estimate the additional costs for the container shipping sector alone could be $35-$40 billion per year
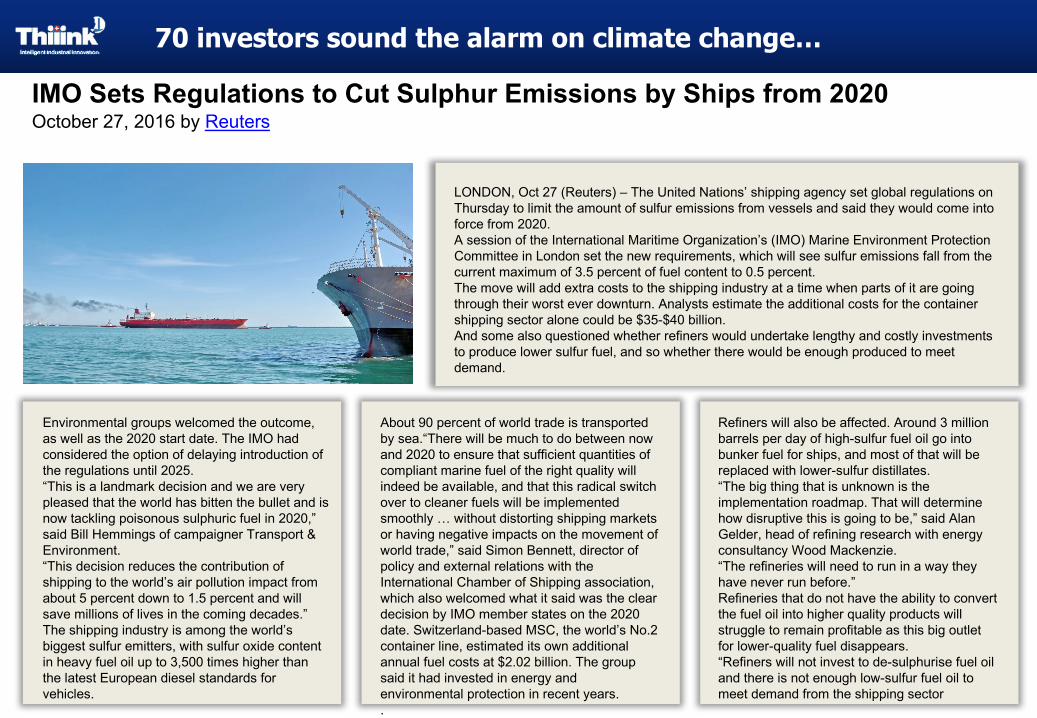
70 investors sound the alarm on climate change…
LONDON, Oct 27 (Reuters) – The United Nations’ shipping agency set global regulations on Thursday to limit the amount of sulfur emissions from vessels and said they would come into force from 2020.A session of the International Maritime Organization’s (IMO) Marine Environment Protection Committee in London set the new requirements, which will see sulfur emissions fall from the current maximum of 3.5 percent of fuel content to 0.5 percent.The move will add extra costs to the shipping industry at a time when parts of it are going through their worst ever downturn. Analysts estimate the additional costs for the container shipping sector alone could be $35-$40 billion.And some also questioned whether refiners would undertake lengthy and costly investments to produce lower sulfur fuel, and so whether there would be enough produced to meet demand.
Environmental groups welcomed the outcome, as well as the 2020 start date. The IMO had considered the option of delaying introduction of the regulations until 2025.“This is a landmark decision and we are very pleased that the world has bitten the bullet and is now tackling poisonous sulphuric fuel in 2020,” said Bill Hemmings of campaigner Transport & Environment.“This decision reduces the contribution of shipping to the world’s air pollution impact from about 5 percent down to 1.5 percent and will save millions of lives in the coming decades.”The shipping industry is among the world’s biggest sulfur emitters, with sulfur oxide content in heavy fuel oil up to 3,500 times higher than the latest European diesel standards for vehicles.
IMO Sets Regulations to Cut Sulphur Emissions by Ships from 2020October 27, 2016 by Reuters
About 90 percent of world trade is transported by sea.“There will be much to do between now and 2020 to ensure that sufficient quantities of compliant marine fuel of the right quality will indeed be available, and that this radical switch over to cleaner fuels will be implemented smoothly … without distorting shipping markets or having negative impacts on the movement of world trade,” said Simon Bennett, director of policy and external relations with the International Chamber of Shipping association, which also welcomed what it said was the clear decision by IMO member states on the 2020 date. Switzerland-based MSC, the world’s No.2 container line, estimated its own additional annual fuel costs at $2.02 billion. The group said it had invested in energy and environmental protection in recent years..
Refiners will also be affected. Around 3 million barrels per day of high-sulfur fuel oil go into bunker fuel for ships, and most of that will be replaced with lower-sulfur distillates.“The big thing that is unknown is the implementation roadmap. That will determine how disruptive this is going to be,” said Alan Gelder, head of refining research with energy consultancy Wood Mackenzie.“The refineries will need to run in a way they have never run before.”Refineries that do not have the ability to convert the fuel oil into higher quality products will struggle to remain profitable as this big outlet for lower-quality fuel disappears.“Refiners will not invest to de-sulphurise fuel oil and there is not enough low-sulfur fuel oil to meet demand from the shipping sector

Drivers overview
7
Rotor sales growth is expected to be driven by three key areas
Economics for purchasing a rotor§ Rotor savings per year are expected to provide payback for the rotor user after just 3-4 years of use,
generating substantial additional on-going savings for the owner in the long term
§ Rising fuel prices are also expected to create greater savings for rotor owners
Regulatory drivers§ Regulation on having to use cleaner and more expensive fuel is now set by law to be tightened over the
next 4 years with stricter limits on the allowed emissions
§ In the short term, additional regions along coast lines are possibly going to introduce restrictions on having to use the cleaner more expensive fuel similar to areas along the USA coast and in the North Sea
Yearly financial impact to LR2
owners
>$3.0mFrom having to use the more
expensive clean MGO fuel
Irrespective of regulation, rotors savings on annual fuel
consumption could be even higher as the MGO fuel price used in the current plan is todays price and
not based on the potential of clean fuel prices going as high as $1000
to $1200 per ton post 2020
LONDON, Oct 27 2016 Reuters
The United Nations’ shipping agency set global regulations on Thursday to limit the amount of sulfur emissions from vessels and said they would come into force from 2020.
A session of the International Maritime Organization’s (IMO) Marine Environment Protection Committee in London set the new requirements, which will see sulfur emissions fall from the current maximum of 3.5 percent of fuel content to 0.5 percent.
Analysts estimate the additional costs for the container shipping sector alone could be $35-$40 billion per year
Potentially c.$5m+ extra cost pa if 100% of journey is on MGO
>$1.5mIrrespective of regulation, rotors save on annual fuel consumption

1. Regulatory drivers
8
• International Maritime Organization (IMO) regulation states ships travelling to emission control areas (ECA) are required to burn a cleaner, 50% more expensive MGO fuel vs conventional fuel‒ equivalent to c.$1.2m extra cost pa if 25% of journey on MGO
• ECA emissions limit is to be reduced even further by 2015 further prompting vessel owners to increase their use of cleaner fuels
• ECA is expected to possibly increase in size over the next 4 years
• Global (ex-ECA) limits on total Ocean are now to come into effect as early as 2020‒ potentially c.$5m+ extra cost pa if 100% of journey on MGO
• Most vessel owners will be looking for ways to reduce the impact of having to use the more expensive fuel to comply with regulation
• Exhaust gas cleaning systems, or ‘scrubbers’, have been predicted to cost in excess of US$2 million per engine if fitted on board larger ships – though these are have not been proven technically, environmentally, or economically viable yet
IMO bunker sulphur content timetable2010 Emission Control Area ( ECA ) limit reduced to 1% (from 1.5%)
2012 Global limit reduced to 3.5% (from 4.5%)
2015 ECA limit reduced to 0.1%
2015 -2017 Global CO2 tax implemented to help reduced emissions ce by 30%
2020 Global limit to 0.5% sulphur TOTAL OCEAN now mandatory
2016 Global limit to 0.5% ratified by UN IMO November 26 0
200
400
600
800
1000
1200
1400
1600
1800
2000
2013 2014 2015 2016 2017 2018 2019 2020 2021 2022 2023 2024 2025 2026 2027 2028 2029 2030
$/mt
Forecast bunker prices
IFO 380 MGO premium CO2 surcharge
Current and future global ECAs

3. Economics for purchasing a rotor
9
Yearly fuel savings calculation ($m)
Rotor cost ($m)
Years for payback
$0.5m yearly interest on $7m debt @ 7%, assumption that debt is not paid down
Cash cost of rotor for owner
Does not take into consideration benefits from:
§Additional fuel saving performance from rotors – 30% saved using rotors is conservative estimate – 50%+ theoretically possible
§Higher savings due to greater % of time spent using more expensive low emission fuel – 25% estimate is conservative
§Increases in fuel prices that are widely expected due to incoming regulations
§Savings from future CO2 taxes expected to be introduced in coming years - $420,000 pa at $30/ton tax
§Transparent measurement of per KW cost of rotor power
§Extensive "green" branding potential
§Increased competitive advantage under rising fuel prices
Additional benefits
Days at sea / year:Annual fuel consumption (tons):% saved
Fuel saved (tons)Weighted average fuel priceYearly fuel savings
28016,429
30%4,929
7303.6
Lubrication oil savings per year: 0.1
Total yearly savings: 3.0
Less rotor running costs: (0.6)
10
3.3
Payback for rotor owner
§ Rotor owners will see yearly savings of c.$3m (dependent on exact charter terms)
§ Assuming $10m full rotor cost, payback estimated at 3.3 years in base case scenario§ Only 1.6 years payback with 70% rotor financing assumed
§ Yearly savings could potentially be substantially higher if vessel route is optimised for rotor use and if greater use of more expensive cleaner fuel is assumed (see next page)
+
-
=
% rotor financed2 vs fuel price % journey time on bunker fuel vs achieved fuel saving
Rotor 10 year IRR (for spot charterers1)
1 – Assumes ship owner receives all of fuel savings; 2 –Financing at 7% with 10 year payback
Years for payback (w/ 70% financing) 1.2
Fuel price per tonne (US$)
600 625 650 675 700
50% 39% 41% 44% 46% 49%
60% 45% 48% 51% 54% 57%
70% 55% 59% 63% 67% 71%
80% 75% 81% 86% 92% 98%
90% 131% 142% 154% 165% 177%
% o
f rot
or c
ost
finan
ced
Rotor % fuel saving
26% 28% 30% 32% 34%
65% 51% 59% 68% 76% 84%
70% 49% 57% 65% 74% 82%
75% 47% 55% 63% 71% 79%
80% 45% 53% 61% 69% 76%
85% 43% 51% 59% 66% 74%
% o
f jou
rney
on
bunk
er fu
el

3. Economics for purchasing a rotor: route assumptions
10
§ Rotor fuel savings are calculated through complex simulations of the THiiiNK rotors that take into account multiple different factors such as‒ Journey distance and time‒ Wind & weather conditions‒ Ship type‒ Main engine usage / vessel speed
§ For a typical journey assuming average wind conditions and normal engine usage, the THiiiNK Flap has been calculated to generate 27% and up to 47% optimised routing fuel savings‒ c.50% more fuel savings than a standard Flettner rotor
(assuming normal rotor provides 18% fuel savings‒ E-Ship 1 test vessel old 1924 rotor design reported 25%
fuel savings, with over 15% of these coming from the installed Flettner rotors
§ It is expected that THiiiNK rotor owners will attempt to maximise fuel savings achievable by choosing charter routes with optimum conditions
Rotor fuel savings§ Cleaner more expensive fuel is required to be used by law
when a ship is sailing within specific restricted zones (ECA)‒ ECA are typically along the coast lines such as the USA,
and also in regions like the North Sea‒ Greater fuel savings can be achieved if the ship’s
chartered route involves more time in ECA zones§ The amount of time spent in an ECA zone can vary
depending on the specific charter route the ship has to take or where they dock
§ The base payback model assumes a 75:25 split between non ECA and ECA journey time
• Global (ex-ECA) limits on total Ocean are now to come into effect as early as 2020
Potentially c.$5m+ extra cost pa if 100% of journey on MGO• Most vessel owners will be looking for ways to reduce the impact of
having to use the more expensive fuel to comply with regulation
-Wartsila assumed 65% of time was spent in non-ECA zones including docking time in their 2012 study1 of scrubbers being used on an Aframax tanker
Fuel consumption
Note: 1 – Efficient Aframax Design Providing Solutions For Emissions Legislation (Sox And Nox) – Wartsila, Oct 2012
NOTE: with routing optimization up to 37% to 47% avrage savings are possible
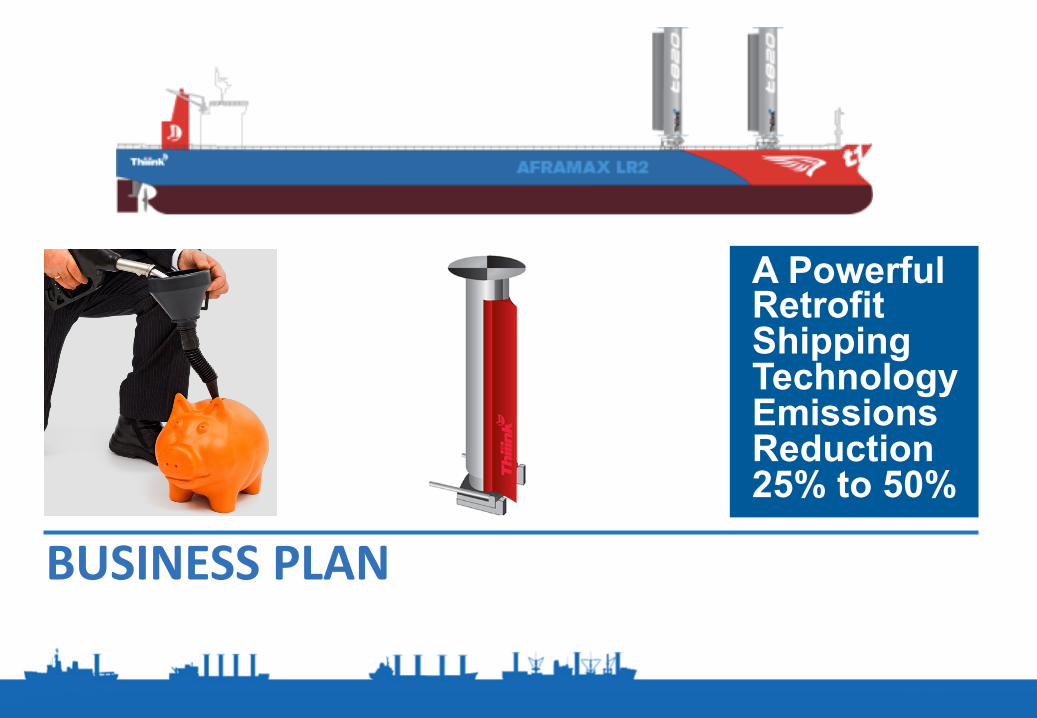
BUSINESSPLAN
A Powerful Retrofit Shipping TechnologyEmissions Reduction25% to 50%

Summary
12
Owns key IP to Flettner Rotor Sails – reduces shipping fuel costs by 25-30%
Proven, tested technology – E-Ship, Oil Major investigation, NASA validation
Commercialised with blue-chip partners – Constellium, Huisman, Hunger , Babcock
Substantial regulation driven market opportunity about to go through a major change– Focus on CO2 emissions– Ship owners having to react
Global Fleet 3rd party ship owner – provides vessels for charter for confirmatory project 1– funding used to produced initial trial rotors
Second phase target: application to5–10 Oil Major 3rd party vessels – conditional on confirmatory trial– discussions with other potential vessels
High value future application – targeted large scale deployment on worlds 3rd party charter fleet– other Oil Majors / large fleet owners targeted
What THiiiNK have… Next steps plan…
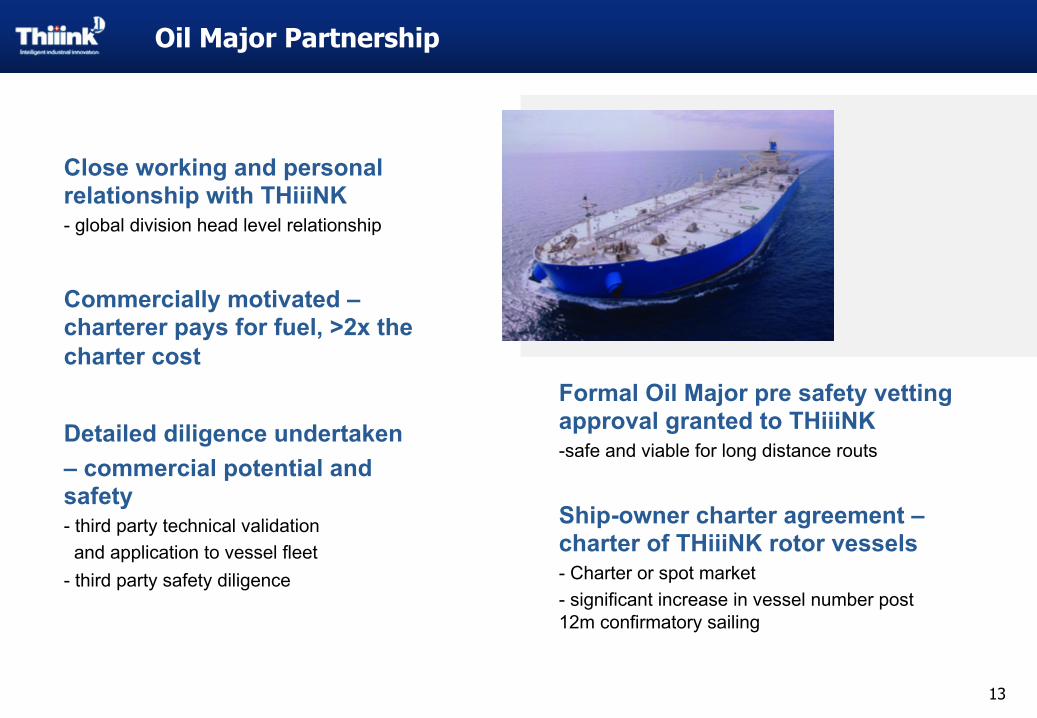
Oil Major Partnership
13
Formal Oil Major pre safety vetting approval granted to THiiiNK-safe and viable for long distance routs
Ship-owner charter agreement –charter of THiiiNK rotor vessels - Charter or spot market - significant increase in vessel number post 12m confirmatory sailing
Close working and personal relationship with THiiiNK- global division head level relationship
Commercially motivated –charterer pays for fuel, >2x the charter cost
Detailed diligence undertaken – commercial potential and safety - third party technical validation and application to vessel fleet
- third party safety diligence

Confirmatory sea trial
14
Oil Major compatibility / safety- long term functionality testing of rotors in real conditions- crew training and functionality optimisation- docking / loading unloading procedures
Proven technology full EIB Roll out credit support - EIB provides credit for rotors (potential to
retrieve c.50% of costs post trial)- Ship-owner pays improved charter rate / fuel
saving bonuses to ship owner
Optimisation of rotors- route optimisation based on real-time data- rotor parameter and design tweaks to further enhance efficiency- operational and maintenance process improvements- usage monitoring
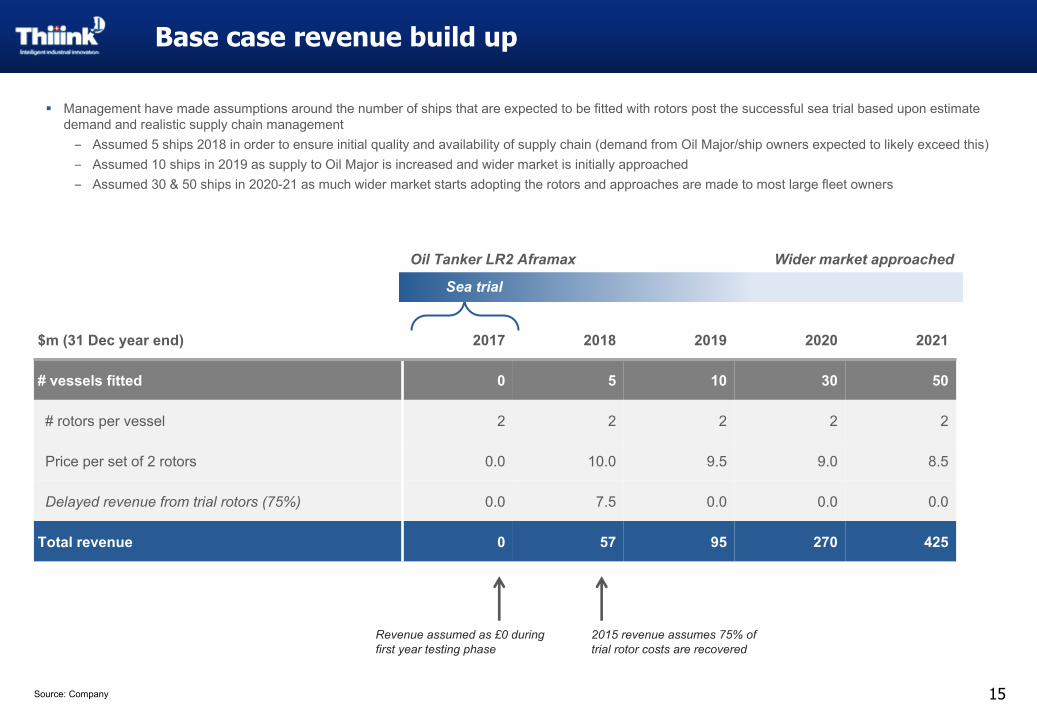
Base case revenue build up
15Source: Company
$m (31 Dec year end) 2017 2018 2019 2020 2021
# vessels fitted 0 5 10 30 50
# rotors per vessel 2 2 2 2 2
Price per set of 2 rotors 0.0 10.0 9.5 9.0 8.5
Delayed revenue from trial rotors (75%) 0.0 7.5 0.0 0.0 0.0
Total revenue 0 57 95 270 425
Revenue assumed as £0 during first year testing phase
§ Management have made assumptions around the number of ships that are expected to be fitted with rotors post the successful sea trial based upon estimate demand and realistic supply chain management‒ Assumed 5 ships 2018 in order to ensure initial quality and availability of supply chain (demand from Oil Major/ship owners expected to likely exceed this)‒ Assumed 10 ships in 2019 as supply to Oil Major is increased and wider market is initially approached‒ Assumed 30 & 50 ships in 2020-21 as much wider market starts adopting the rotors and approaches are made to most large fleet owners
Oil Tanker LR2 Aframax Wider market approached
Sea trial
2015 revenue assumes 75% of trial rotor costs are recovered

Base case financials
16Source: Company
$m (31 Dec year end) 2017 2018 2019 2020 2021
Revenue 0 57 95 255 425growth 65% 168% 67%
Cost to produce rotors (8) (40) (70) (184) (305)
Distribution and installation cost (0) (2) (3) (7) (9)
Total COGS (8) (42) (73) (191) (314)
Gross profit (8) 16 21 64 111 margin 27% 23% 25% 26%
Business overheads (4) (8) (11) (18) (26)
Operating Profit (12) 8 11 46 85margin 14% 11% 18% 20%
Depreciation 1.4 1.6 2.5 3.6 5.9
EBITDA (11) 10 13 49 91margin 17% 14% 19% 21%
Capex 6.8 1.5 4.5 5.9 11.4% of sales nm 3% 5% 2% 3%
% of EBITDA nm 15% 34% 12% 13%
Change in NWC (0.0) 1.2 0.8 3.3 3.5
5 vessels 10 vessels 30 vessels 50 vessels
Project 1
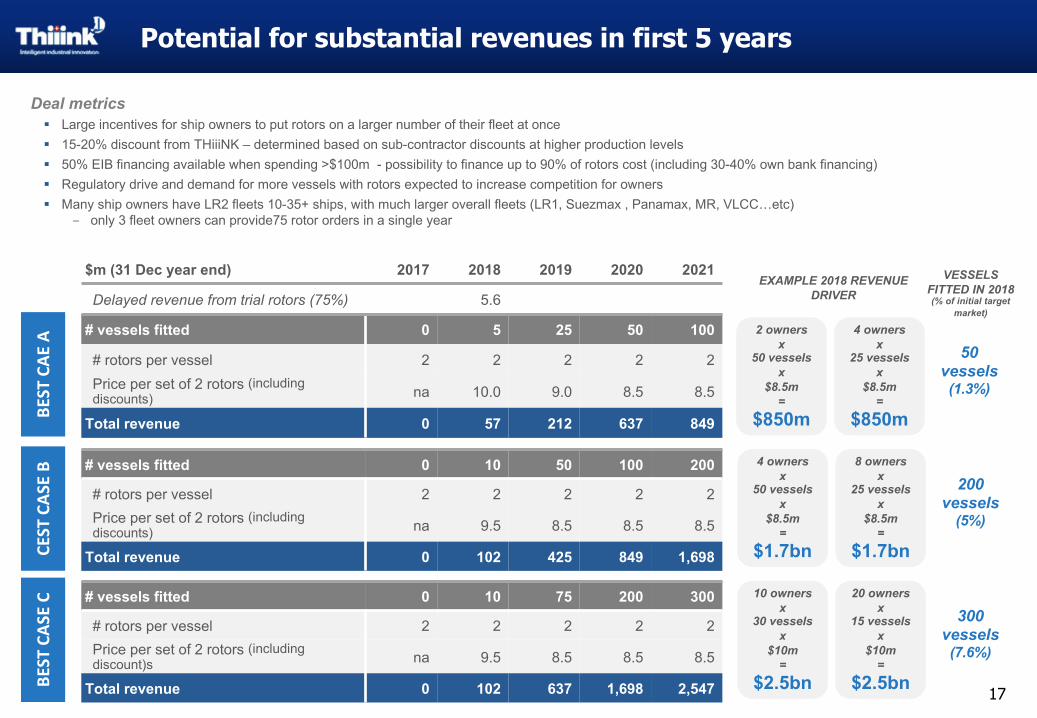
Potential for substantial revenues in first 5 years
17
§ Large incentives for ship owners to put rotors on a larger number of their fleet at once§ 15-20% discount from THiiiNK – determined based on sub-contractor discounts at higher production levels§ 50% EIB financing available when spending >$100m - possibility to finance up to 90% of rotors cost (including 30-40% own bank financing)§ Regulatory drive and demand for more vessels with rotors expected to increase competition for owners§ Many ship owners have LR2 fleets 10-35+ ships, with much larger overall fleets (LR1, Suezmax , Panamax, MR, VLCC…etc)
‒ only 3 fleet owners can provide75 rotor orders in a single year
Deal metrics
$m (31 Dec year end) 2017 2018 2019 2020 2021
Delayed revenue from trial rotors (75%) 5.6
# vessels fitted 0 5 25 50 100
# rotors per vessel 2 2 2 2 2 Price per set of 2 rotors (including discounts) na 10.0 9.0 8.5 8.5
Total revenue 0 57 212 637 849
# vessels fitted 0 10 50 100 200
# rotors per vessel 2 2 2 2 2 Price per set of 2 rotors (including discounts) na 9.5 8.5 8.5 8.5
Total revenue 0 102 425 849 1,698
# vessels fitted 0 10 75 200 300
# rotors per vessel 2 2 2 2 2 Price per set of 2 rotors (including discount)s na 9.5 8.5 8.5 8.5
Total revenue 0 102 637 1,698 2,547
4 ownersx
50 vesselsx
$8.5m=
$1.7bn
10 ownersx
30 vesselsx
$10m=
$2.5bn
2 ownersx
50 vesselsx
$8.5m=
$850m
8 ownersx
25 vesselsx
$8.5m=
$1.7bn
20 ownersx
15 vesselsx
$10m=
$2.5bn
4 ownersx
25 vesselsx
$8.5m=
$850m
EXAMPLE 2018 REVENUE DRIVER
200 vessels
(5%)
300 vessels(7.6%)
50 vessels(1.3%)
VESSELS FITTED IN 2018(% of initial target
market)
BESTCAE
ACESTCAS
EB
BESTCAS
EC

Scalable sub-contractor model able to adapt to rotor adoption
18
$m (31 Dec year end) 2017 2018 2019 2020 2021
Revenue 0 102 637 1,698 2,547growth 524% 167% 50%
Cost to produce rotors (8) (70) (457) (1,218) (1,827)
Distribution and installation cost (0) (3) (23) (49) (55)
Total COGS (8) (73) (480) (1,267) (1,882)
Gross profit (8) 29 157 431 665 margin 28% 25% 25% 26%
Business overheads (4) (7) (13) (24) (36)
Operating Profit (12) 22 144 407 629margin 21% 23% 24% 25%
Depreciation 1.4 1.6 2.5 3.6 5.9
EBITDA (11) 23 146 411 635margin 23% 23% 24% 25%
10 ships fitted in year after project
1
Quick rotor adoption by large fleet owners
§ Assumes trial is hugely successful and subsequently 10 vessels are fitted with rotors the following year§ Due to competitive advantages and regulatory pressure, many fleet owners are keen to install rotors on the majority of their fleets§ Sub-contractors able to scale production up to c.100 rotors per year without additional infrastructure in place (>100 rotors by yr 4)
Bull Case
10 vessels 75 vessels 200 vessels 300 vessels
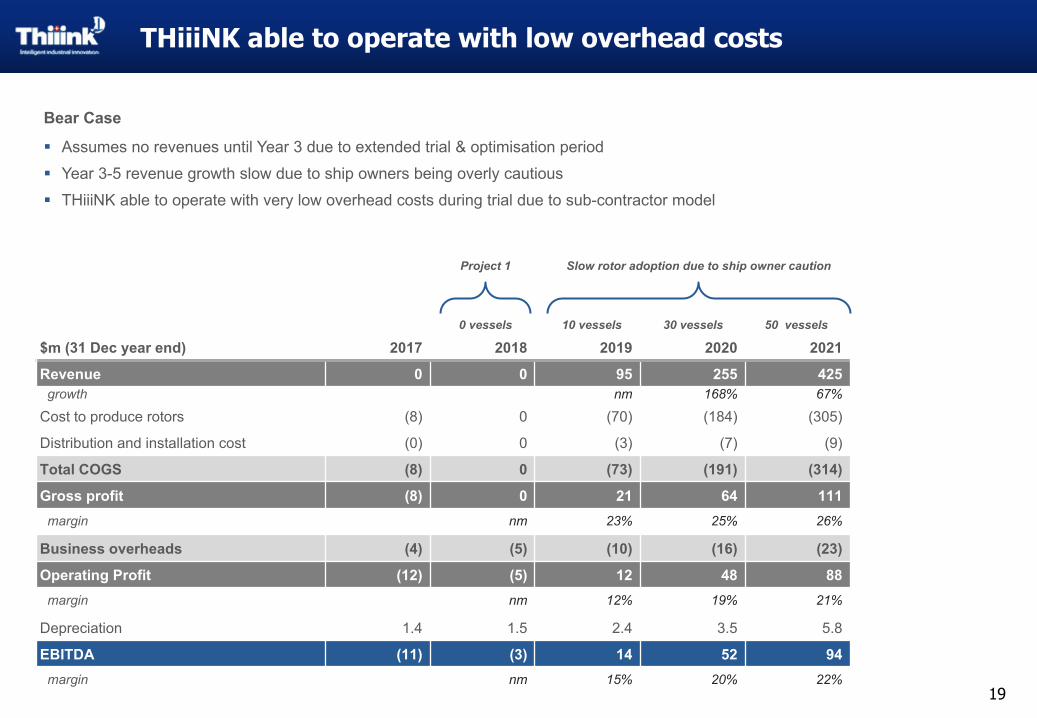
19
$m (31 Dec year end) 2017 2018 2019 2020 2021
Revenue 0 0 95 255 425growth nm 168% 67%
Cost to produce rotors (8) 0 (70) (184) (305)
Distribution and installation cost (0) 0 (3) (7) (9)
Total COGS (8) 0 (73) (191) (314)
Gross profit (8) 0 21 64 111 margin nm 23% 25% 26%
Business overheads (4) (5) (10) (16) (23)
Operating Profit (12) (5) 12 48 88margin nm 12% 19% 21%
Depreciation 1.4 1.5 2.4 3.5 5.8
EBITDA (11) (3) 14 52 94margin nm 15% 20% 22%
Project 1 Slow rotor adoption due to ship owner caution
§ Assumes no revenues until Year 3 due to extended trial & optimisation period§ Year 3-5 revenue growth slow due to ship owners being overly cautious§ THiiiNK able to operate with very low overhead costs during trial due to sub-contractor model
Bear Case
THiiiNK able to operate with low overhead costs
0 vessels 10 vessels 30 vessels 50 vessels
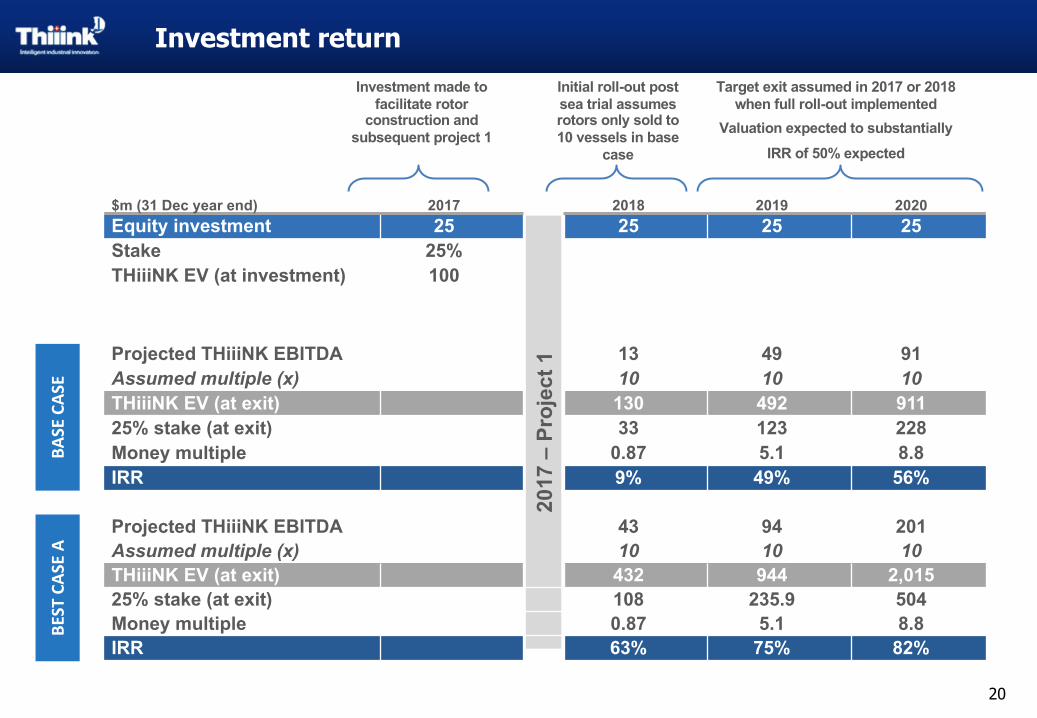
Investment return
20
$m (31 Dec year end) 2017 2018 2019 2020Equity investment 25 25 25 25Stake 25%THiiiNK EV (at investment) 100
Projected THiiiNK EBITDA 13 49 91Assumed multiple (x) 10 10 10THiiiNK EV (at exit) 130 492 91125% stake (at exit) 33 123 228Money multiple 0.87 5.1 8.8IRR 9% 49% 56%
Investment made to facilitate rotor
construction and subsequent project 1
2017
–Pr
ojec
t 1
Initial roll-out post sea trial assumes rotors only sold to 10 vessels in base
case
Target exit assumed in 2017 or 2018 when full roll-out implemented
Valuation expected to substantiallyIRR of 50% expected
Projected THiiiNK EBITDA 43 94 201Assumed multiple (x) 10 10 10THiiiNK EV (at exit) 432 944 2,01525% stake (at exit) 108 235.9 504Money multiple 0.87 5.1 8.8IRR 63% 75% 82%
BASECAS
EBE
STCAS
EA

HIGHLY CONFIDENTIAL
Turn Key Supply ChainWith Global Reach & Service
THiiiNK Flettner Rotor
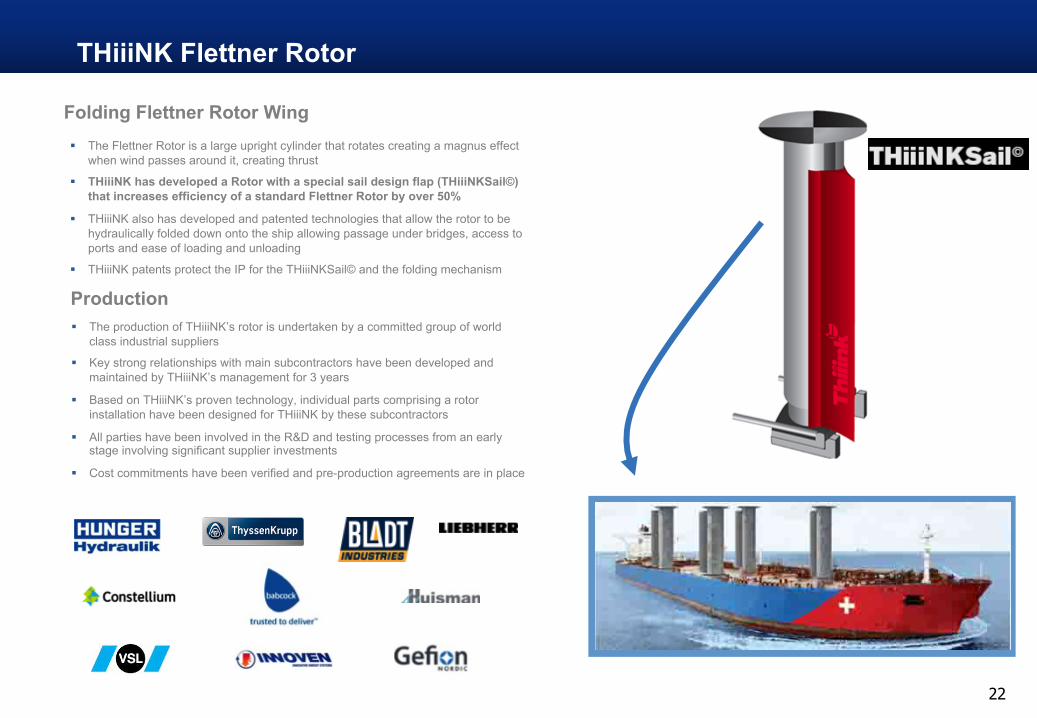
Folding Flettner Rotor Wing§ The Flettner Rotor is a large upright cylinder that rotates creating a magnus effect
when wind passes around it, creating thrust
§ THiiiNK has developed a Rotor with a special sail design flap (THiiiNKSail©) that increases efficiency of a standard Flettner Rotor by over 50%
§ THiiiNK also has developed and patented technologies that allow the rotor to be hydraulically folded down onto the ship allowing passage under bridges, access to ports and ease of loading and unloading
§ THiiiNK patents protect the IP for the THiiiNKSail© and the folding mechanism
Production
22
§ The production of THiiiNK’s rotor is undertaken by a committed group of world class industrial suppliers
§ Key strong relationships with main subcontractors have been developed and maintained by THiiiNK’s management for 3 years
§ Based on THiiiNK’s proven technology, individual parts comprising a rotor installation have been designed for THiiiNK by these subcontractors
§ All parties have been involved in the R&D and testing processes from an early stage involving significant supplier investments
§ Cost commitments have been verified and pre-production agreements are in place
THiiiNK Flettner Rotor
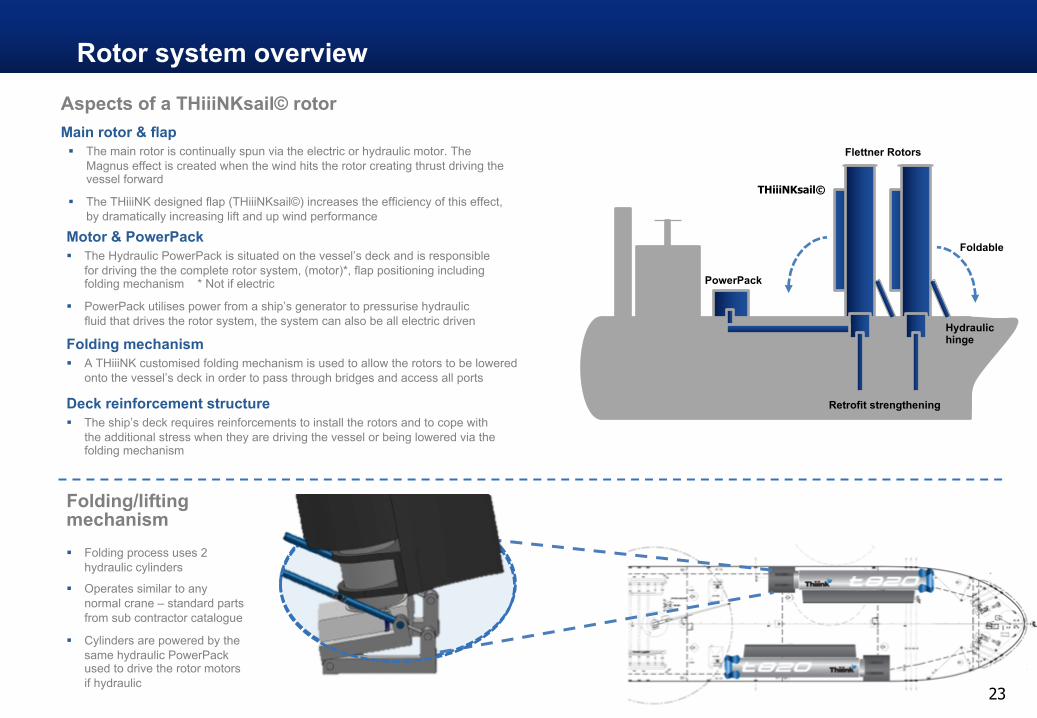
§ Folding process uses 2 hydraulic cylinders
§ Operates similar to any normal crane – standard parts from sub contractor catalogue
§ Cylinders are powered by the same hydraulic PowerPack used to drive the rotor motors if hydraulic
Folding/liftingmechanism
Aspects of a THiiiNKsail© rotor
Motor & PowerPack§ The Hydraulic PowerPack is situated on the vessel’s deck and is responsible
for driving the the complete rotor system, (motor)*, flap positioning including folding mechanism * Not if electric
§ PowerPack utilises power from a ship’s generator to pressurise hydraulic fluid that drives the rotor system, the system can also be all electric driven
Main rotor & flap§ The main rotor is continually spun via the electric or hydraulic motor. The
Magnus effect is created when the wind hits the rotor creating thrust driving the vessel forward
§ The THiiiNK designed flap (THiiiNKsail©) increases the efficiency of this effect, by dramatically increasing lift and up wind performance
Folding mechanism§ A THiiiNK customised folding mechanism is used to allow the rotors to be lowered
onto the vessel’s deck in order to pass through bridges and access all ports
Deck reinforcement structure§ The ship’s deck requires reinforcements to install the rotors and to cope with
the additional stress when they are driving the vessel or being lowered via the folding mechanism
THiiiNKsail©
Flettner Rotors
PowerPack
Foldable
23
Retrofit strengthening
Hydraulic hinge
Rotor system overviewRotor system overview

Deck fitting
Rotor fold actuator
THiiiNKSAIL©
24
Folding THiiiNKsail©
Folding/lifting mechanism
Foldable End cap
Mast
Rotor
Folding THiiiNKsail©

BLADT or Huisman are responsible for manufacturing the rotor mast and the FLAP hinge and will also perform the final assembly…
25
Key subcontractor parts
Example complex drilling vessel that Huisman & BLADT would typically manufacture all parts for in house
(except for hull and engine) and then assemble
Final assemblyRotor mast
FLAP hinge fabrication
Swiss-German-Danish AAA Supply chain with global reach & Service

Subcontractor
1
2
3
4
5
6
Parts supplied % of value1
26Note: 1 – Estimated contracted value of parts supplied, prices subject to vary with each contract; 2 – Each contractor is fully liable for their parts and any damaged caused as a result of failure or engineering faults. Similar to any structure (e.g. crane on ship), any incident would be covered by insurers and then subject to full investigation to determine cause and any liable parties
Assumption of product Liability2
RotorEnd cap
FLAP14% ü
Rotor bearings 10% ü
HydraulicCylinders
MotorPower-pack
30% ü
Lifting hinge 18% ü
Rotor mastFLAP hinge
Rotor system final assembly
20% ü
FLAP bearingsFLAP drive motor 8% ü
Contractor commitments
Sub-contractor volumes have been under pressure recently and they are therefore highly motivated to explore / develop to new growth business areas
Suppliers have provided significant R&D support and on going commitments to THiiiNK – estimated to have invested €5.5m between them or 68,000 hours of R&D
The complete rotor system has a very low parts count of only 36 parts mainly sourced from just 5 companies in Europe, making production supply chain simple and straightforward
Contractor commitments

SC
27
§ All subcontracts will deliver their individual components for final assembly by Huisman in the Netherlands or BLADT in Denmark
§ The vessel will simultaneously be prepared with deck strengthening and deployment of the rotor control systems
§ Note: The supply chain partners can assemble anywhere in the world USA or CHINA where Huisman as example has facilities
Process
FINAL ASSEMBLYGER
SWISWI
GER
GERGER
Swiss-German-Danish Supply chain overview
NED
FINAL ASSEMBLY DK
Swiss-German-Danish Supply chain overview

28
Approvals and safety
1 Class Approval§ The objective of ship classification is to verify the structural strength, reliability, and integrity of essential
parts of the vessel, such as the ship’s “propulsion system” in THiiiNK’s rotor case‒ THiiiNK has a safety factor of 2.0 vs the 1.4 required by the Lloyd’s Code for Lifting Appliances
(COLA)
§ International Class approval can be provided by 13 societies that meet the full definition of a “Classification Society” and these form the International Association of Classification Societies (IACS)
1. A technical review by a Classification Society of THiiiNK’s design plans and related documents for the new vessel equipment, including checks that individual parts comply with their Rules has been completed and approved by Lloyd’s
2. A Classification Society surveyor will visit relevant production facilities providing key components (including those of THiiiNK’s) to verify that they conform to the applicable Rule requirements
3. A Classification Society surveyor attends sea trials (2-3 days) / other related trials prior to delivery in order to verify conformance with the applicable Rule requirements
4. In service vessel must be subject to periodical class surveys, carried out on-board to verify that the ship continues to meet the relevant Rule requirements
Stages of Class Approval for THiiiNK:
THiiiNK have been working closely with Lloyd’s Register (the oldest of all the 13 IACS societies)
There will be no issues getting Classification approval from Lloyd’s on the THiiiNK rotor design to be used on vessels
A surveyor will still be required to verify that the installation process is undertaken according to the Class rules
The particular installation method and design of the deck strengthening is decided upon by the ship owners each time
§ Babcock, appointed by the Oil Major, has conducted an independent engineering report verifying that THiiiNK rotors could be installed and operated safely on vessels using the proposed hull strengthening support
2
3
Insurance company approval§ Leading shipping insurance specialist Lockton were consulted at the start of the development of THiiiNK’s
rotor and confirmed that the rotor would fall under their normal overall hull insurance that also covers almost all other typical structures on the deck (such as a ship’s crane) – no additional premium would therefore be incurred
Oil Major pre vetting performed
Approvals and safety
29
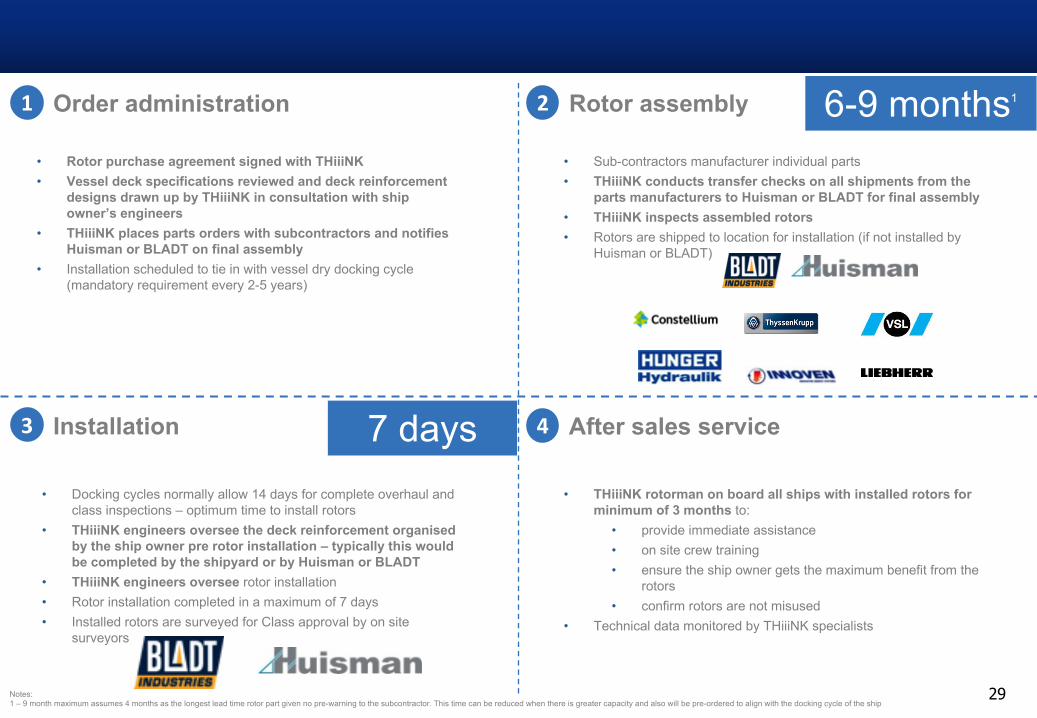
Customer rotor ordering process
1 Order administration
• Rotor purchase agreement signed with THiiiNK• Vessel deck specifications reviewed and deck reinforcement
designs drawn up by THiiiNK in consultation with ship owner’s engineers
• THiiiNK places parts orders with subcontractors and notifies Huisman or BLADT on final assembly
• Installation scheduled to tie in with vessel dry docking cycle (mandatory requirement every 2-5 years)
2 Rotor assembly
• Sub-contractors manufacturer individual parts• THiiiNK conducts transfer checks on all shipments from the
parts manufacturers to Huisman or BLADT for final assembly• THiiiNK inspects assembled rotors• Rotors are shipped to location for installation (if not installed by
Huisman or BLADT)
3 Installation
• Docking cycles normally allow 14 days for complete overhaul and class inspections – optimum time to install rotors
• THiiiNK engineers oversee the deck reinforcement organised by the ship owner pre rotor installation – typically this would be completed by the shipyard or by Huisman or BLADT
• THiiiNK engineers oversee rotor installation • Rotor installation completed in a maximum of 7 days• Installed rotors are surveyed for Class approval by on site
surveyors
4 After sales service
• THiiiNK rotorman on board all ships with installed rotors for minimum of 3 months to:
• provide immediate assistance• on site crew training• ensure the ship owner gets the maximum benefit from the
rotors• confirm rotors are not misused
• Technical data monitored by THiiiNK specialists
6-9 months1
7 days
Notes:1 – 9 month maximum assumes 4 months as the longest lead time rotor part given no pre-warning to the subcontractor. This time can be reduced when there is greater capacity and also will be pre-ordered to align with the docking cycle of the ship

How it works
§ The Magnus effect is something that has been observed in many different applications around the world
§ It is created by a spinning object accelerating the air passing over one side of it whilst decelerating the air on the other side
§ Due to pressure difference this creates a thrust or push from the slow to fast side, similar to an airplane wing
Tennis§ In tennis the Magnus effect is the reason behind the dip in the
ball's trajectory after being hit with “topspin”
Football§ When a football player curves the football by applying spin, this is
the Magnus effect working
§ The force is proportional to ball area, hence why it moves much more than a tennis ball
Rotor ship§ A ship that uses rotorssails which are powered by an engine, first
built by German engineer Anton Flettner in early 1900s
§ Vertical cylinders using the Magnus effect create propulsion to drive the ship
§ Back then the propulsion force generated was less than if the motor had been connected to a regular propeller
§ See history and validation pack for further details
Flettner airplane§ A flettner airplane or rotor airplane is an airplane that has no
wings but instead uses the Magnus effect to create lift.
§ Such airplanes were first built by Anton Flettner. Flettner airplane should not be confused with the cyclogyro, which uses a different aerodynamic effect, but has a similar configuration of rotors.
THiiiNK flap technology
With THiiiNK flapWithout flap
Wind Wind
Low pressure
High pressure
Increased force
Appendix – Magnus effectAppendix – Magnus effect

HIGHLY CONFIDENTIAL
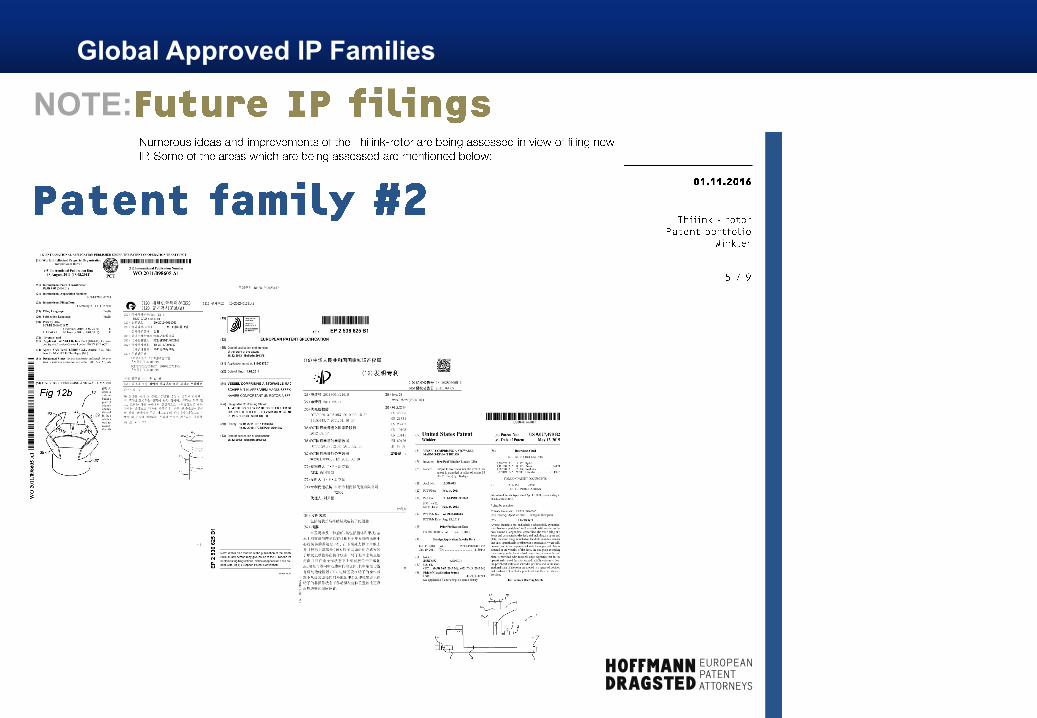
Global Approved IP
THiiiNK flap technology
Increased force
Appendix – Magnus effectGlobal Approved IP Families
NOTE:
THiiiNK flap technology
Increased force
Appendix – Magnus effectGlobal Approved IP Families
NOTE:

THiiiNK flap technology
Increased force
Appendix – Magnus effectGlobal Approved IP Families
NOTE:
35
Disclaimer and Confidentiality/Non-Disclosure Agreement
The Confidential Business Plan, supporting revenue and financial projections, (referred to in whole as the “Business Plan”) of THiiiNK Holding Switzerland AG (referred to as the “Company”) does not constitute an offer to sell, or a solicitation of an offer to buy securities.
2)Receipt and acceptance of the Business Plan shall constitute an agreement by the Recipient that, among other things, the Business Plan shall not in any manner whatsoever be copied, reproduced, modified, or distributed to any third party, either in whole or in part, without the prior written consent of the Company.
3)All information contained herein shall be kept confidential by the Recipient, and that the Recipient shall not reveal or disclose to any third party without written consent of the Company the information that has been made available to the Recipient.
4)The Recipient shall return all copies of the Business Plan immediately upon request of the Company.
5)This Business Plan contains proprietary and confidential information regarding the Company and is based on information deemed by the Company to be reliable.
6)In furnishing the Business Plan, the Company undertakes no obligation to provide Recipients of the Business Plan with access to any additional information or to update this Business Plan or to correct any inaccuracies that may be contained herein.
7)In addition, certain estimates and projections prepared by the Company are presented in this Business Plan. Such estimates and projections are subject to significant economic, business, and other uncertainties beyond the control of the Company. Although such projections are believed to be realistic, no representations can be made as to their attainability.
8)While the information set forth herein are deemed by the Company to be accurate, the Company shall not beheld liable for the accuracy of, or omissions from this Business Plan, and for any other written or oral communication transmitted to the Recipient and any other party in the course of its evaluation of transactions involving the Company.