01 - tui groupannualreport2015-16.tuigroup.com/sites/default/... · 01 management report * 28...
TRANSCRIPT


01 MANAGEMENT REPORT*
28 Principles underlying TUI Group
28 Goals and strategy
44 Structure and business model
46 Value-oriented Group management
49 Risk Report
66 Overall assessment by the Executive Board
and Report on expected development
70 Business Review
70 Macroeconomic industry and market
framework
74 Group earnings
78 Segmental performance
84 Net assets
86 Financial position of the Group
93 Sustainable development
97 Human resources
103 Annual financial statements of TUI AG
106 TUI share
109 Information required under takeover law
111 Report on subsequent events
* The present combined Management Report has been drawn up for both the TUI Group and TUI AG. It was prepared in accordance with sections 289, 315 and 315 (a) of the German Commercial Code (HGB) and German Accounting Standards (DRS) numbers 17 and 20. The combined Management Report also includes the Remuneration Report, the Corporate Governance Report and the Financial Highlights.
Winter in Canada means busy season for TUI ’s shareholding Sunwing. They need help to fly so many North American tourists to the Caribbean. Perfect! Some TUI aircraft in Europe would otherwise be hibernating on the ground.
READ MORE ABOUT A IRCRAFT LEASING IN THE MAGAZINE UNDER “HEAD FOR THE HEAT”
28 M A N A G E M E N T R E P O R T Principles underlying TUI Group
GOALS AND STRATEGY
Our Strategy
As the world’s leading integrated tourism group, we operate in all stages of our customers’ holiday experience, from marketing and sales to aviation, destination services and accommodation.
The core of our offering will be our own hotel and cruise brands.
Growth in our hotel and cruise brands is enabled and de-risked by our strength in direct distribution and our direct customer relationships, creating a virtuous circle for sustainable growth.
We have a resilient model, prepared for current and future changes.
The strength of our integrated model is the monitoring and selective control of all stages in the value chain. This allows us to mitigate capacity risks, respond quickly and flexibly to market changes and actively shape overall situations and markets.
We take advantage of global economies of scale resulting from our size and international scope to deliver competitive advantages and have defined six scaling platforms as a framework: TUI Brand, Aviation, Hotels, Cruises, Destination Services, IT.
We use our local strength at crucial points in the competitive arena, to be close to customers and their individual needs.
We believe a clear focus on sustainability differentiates us from the compe-tition and generates value.
We have a common vision and values to achieve our goals.

29Principles underlying TUI Group M A N A G E M E N T R E P O R T
M A R K E T I N G & S A L E S
• Scale – over 20 million* customers per annum, over 13 million customers flying on Group airlines
• Strength in direct distribution and direct customer relationships – over 70 % of holidays distributed directly to the customer through our websites, shops and call centres
• Flexibility – approx. 75 % of our source market accommo dation requirement sourced from third parties
D E S T I N AT I O N S E R V I C E S
• Scale – over 11 million customers per annum with operations in over 100 destinations
• Unique destination services bring the TUI brand alive and bring us even closer to our customers
AV I AT I O N
• Scale – approx. 150 aircraft, transporting our customers to their destination
• Flexibility – approx. 95 % of aircraft are leased, current average remaining lease life of approx. 4 years, with additional capacity from third party airlines
• Efficiency – OneAviation programme to develop one virtual airline, short haul fleet renewal commences 2018
ACCO M M O DAT I O N
• Scale – growing portfolio of Group hotels and cruise ships (currently over 7 million customers per annum) with a further 10 million customers staying in third party hotels, which are mostly exclusive to our source markets
• Wide distribution funnel – over 50 % of our hotel customers purchase via our source markets, with significant incremental volumes from other markets
• Flexibility – balanced ownership model, with around half of our hotels being managed or franchised, utilisation of joint venture partnerships to reduce investment risk, and a balanced destination portfolio
How we do it – our Business Model
We have a leading position as an integrated tourism company.
* Including Canada and Russia joint ventures

30 M A N A G E M E N T R E P O R T Principles underlying TUI Group
Integration benefits our customers and our performance, and gives us a
strong competitive advantage.
Growth in our hotel and cruise brands is enabled by our strength in direct distribution and
by our direct customer relationships, creating a virtuous circle for sustainable growth.
C U S TO M E R P E R S P E C T I V E
• Easy & convenient• Seamless customer experience• Unique & exclusive products• TUI as most trusted travel partner• Mobile service and inspiration
T U I P E R F O R M A N C E P E R S P E C T I V E
• Growth in differentiated hotels and cruises enabled and de-risked by direct customer relationship
• Superior occupancy rates, yield management & risk mitigation
• Local freedom to actively shape markets• Flexibility to respond to changing environment
UNIQUENESS
SCALE
DIRECT DISTRIBUTION & CUSTOMER RELATION- SHIPS• Marketing and Sales• CRM• Yield and Pricing• Aviation
UNIQUE HOTEL & CRUISE BRANDS• Hotels• Cruise Ships
Flexibility: Balanced ownership model Direct and complementary
distribution
Flexibility: Complementary products

31Principles underlying TUI Group M A N A G E M E N T R E P O R T
• Ability to remix flight and hotel capacity and adapt cruise itineraries
• Balanced source market & destination portfolio• Strong long-term supplier relationships• Risk assessed ownership / management model,
including joint venture partners
We have a flexible model with a balanced portfolio of businesses, which further enhances
our resilience.
We combine local relevance with global scale.
A global TUI brand enables higher brand impact & seamless
customer experience
Central control of configuration, purchasing, finance,
maintenance, ground handling
Customer platform, CRM, yield system, customer app
Shared international team to serve our guests in destinations
International hotel management and marketing of core brands
Joint decisions about invest-ments in new vessels
S O U RCE M A R K E T S
• Market insight• Marketing and Sales• Yield and Pricing• 3rd party product
N OR T HE RN
R EG ION
CE N T R A L
R EG ION
W E S T E RN
R EG ION
Global TUI Brand
IT & Customer Data
Hotel
Services
Cruise
Aviation

32 M A N A G E M E N T R E P O R T Principles underlying TUI Group
We believe a clear focus on sustainability differentiates us from the
competition and generates value.
The ambitious 2020 sustainability strategy “Better Holidays, Better World” is built around three core pillars to help shape the future of sustainable tourism.
See from page 93
STEP LIGHTLY
MAKE A DIFFERENCE
LEAD THE WAY
2015 – 2020“Better Holidays, Better World”
Reducing the environmental impact of holidays through our own operations
Creating positive change for people and communities through our value chain and customers
Pioneering sustainable tourism to influence the wider industry and beyond

33Principles underlying TUI Group M A N A G E M E N T R E P O R T
We have a common vision and values to achieve our goals.
Our vision, values and customer proposition form the basis of our action and our attitude – both inside and outside.
Discovering the world’s diversity, exploring new horizons, experiencing foreign countries and cultures: travel broadens people’s minds. At TUI we create unforgettable moments for customers across the world and make their dreams come true. We are mindful of the importance of travel and tourism for many countries in the world and people living there. We partner with these countries and help shape their future – in a committed and sustainable manner.
OUR PROMISE
Discover your smile
OUR VISION
THINK TRAVEL. THINK TUI.
OUR VALUES
E NG AG I NG CUS TOME R S
E NG AG I NG E MPLOY E E S A ND CU S TOME R S
E NG AG I NG E MPLOY E E S A ND CU S TOME R S
T RU S T E D
reliable, consistent
quality
U NIQU E
exclusive, designed
around you
I N SPIR I NG
fresh, effortless

34 M A N A G E M E N T R E P O R T Principles underlying TUI Group
1 GROWTH IN
HOTELS AND CRUISE BRANDS
2 DIRECT
CUSTOMER RELATIONSHIPS
3 BALANCE SHEET
STRENGTH & FLEXIBILITY
What we want to achieve – roadmap for growth
1. G R O W T H I N H O T E L A N D C R U I S E B R A N D S
Accommodation (hotels and cruise ships) is the key differentiator in the customer holiday experience and the key driver of satisfaction and retention rates. We will therefore deliver growth through scaling up our unique hotel and cruise brands.
Growth will be focused on our core, unique brands – these brands have been selected due to their strong resonance with their respective customer segments (and therefore competitive advantage) and their ability to be further scaled.
Following the merger with TUI Travel PLC in December 2014 we targeted circa 60 additional hotels by 2018 / 19. Having delivered 18 openings and two repositioned hotels to date (30 September 2016), we expect approximately 40 to 45 further openings by the end of 2018 / 19 plus further repositioned hotels. Taking into account the different ownership models and our current portfolio, we expect each new hotel on average to deliver an additional € 2 m underlying EBITA .

35Principles underlying TUI Group M A N A G E M E N T R E P O R T
RIU
3 to 5 star hotels at the best beach destinations in the world, offering holidays from family all inclusive fun to romance and luxury
C U R R E N T P O R T F O L I O ( 2 0 15 /16)
• 94 hotels delivering € 318 m underlying EBITA• Occupancy 90 %• ROIC 26 % (excl. goodwill)
O P E N I N G S / L AU N C H E S
• 2014 / 15: Aruba, Mauritius, Bulgaria, Berlin• 2015 / 16: Dominican Republic, Sri Lanka,
New York, Dublin• Winter 2016 / 17: Jamaica• 2017 / 18: Mexico (Costa Mujeres)
ROBINSON
Premium clubs in excellent beach or mountain locations
C U R R E N T P O R T F O L I O ( 2 0 15 /16)
• 24 clubs delivering € 39 m underlying EBITA• ROIC 13 %
O P E N I N G S / L AU N C H E S
• 2014 / 15: Tunisia• 2015 / 16: Greece, Turkey• Summer 2017: South East Asia
TUI SENSATORI
Modern luxury holidays designed to fuel the senses
C U R R E N T P O R T F O L I O ( 2 0 15 /16)
• 10 resorts with 5 in Group hotels
O P E N I N G S / L AU N C H E S I N G R O U P H O T E L S
• 2014 / 15: Cyprus, Turkey• 2015 / 16: Dominican Republic• Summer 2017: Rhodes
TUI BLUE
Premium hotels in first class locations with strong regional influences
C U R R E N T P O R T F O L I O ( 2 0 15 /16)
• TUI Blue launched with two repositioned hotels this year
O P E N I N G S / L AU N C H E S
• 2015 / 16: Turkey (repositioned)• Winter 2016 / 17: Tenerife (new),
Germany and Austria (repositioned)• Summer 2017: Croatia (new), Italy (new),
(repositioned), Germany (repositioned)
TUI MAGIC LIFE
All inclusive club holidays in top beachside locations
C U R R E N T P O R T F O L I O ( 2 0 15 /16)
• 13 clubs
O P E N I N G S / L AU N C H E S
• 2014 / 15: Ibiza, Rhodes
TUI SENSIMAR
Stylish 4 to 5 star hotels designed for adults with space and relaxation in mind
C U R R E N T P O R T F O L I O ( 2 0 15 /16)
• 48 resorts with 20 in Group hotels
O P E N I N G S / L AU N C H E S
• In Group hotels – 2014 / 15: Portugal, Croatia• In third party hotels – Winter 2016 / 17:
Lanzarote, Cape Verde, Mauritius• In third party hotels – Summer 2017:
Sardinia, Greece, Tunisia

36 M A N A G E M E N T R E P O R T Principles underlying TUI Group
Cruise growth will continue to focus on the underpenetrated European cruise market, with capacity expansion in TUI Cruises and modernisation of our UK and luxury / expedition cruise brands.
• The European cruise market remains underpenetrated relative to the US, but has the right demographics – age, wealth, leisure time available – for future growth
See from page 73
• TUI Cruises successfully launched Mein Schiff 5 in July 2016 and will add three further newbuilds over the next three years, delivering around € 25 m to € 30 m share of earnings after tax for each new ship.
TUI FAMILY LIFE
The ultimate environment for a family holiday to remember
C U R R E N T P O R T F O L I O ( 2 0 15 /16)
• 29 resorts with 17 in Group hotels
O P E N I N G S / L AU N C H E S I N
T H I R D PA R T Y H O T E L S
• Winter 2016 / 17: Thailand, Spain• Summer 2017: Sardinia, Croatia, Spain,
Bulgaria
THOMSON CRUISES
UK leader in all inclusive fly cruise
C U R R E N T P O R T F O L I O ( 2 0 15 /16)
• Five ships• Underlying EBITA € 61 m
O P E N I N G S / L AU N C H E S
• Summer 2016: TUI Discovery• Summer 2017: TUI Discovery 2• Summer 2018: additional ship from
TUI Cruises (Mein Schiff 1)• Summer 2019: additional ship from
TUI Cruises (Mein Schiff 2)
TUI CRUISES
German speaking, premium all inclusive cruises
C U R R E N T P O R T F O L I O ( 2 0 15 /16)
• Five ships• Share of underlying EAT € 100 m• ROIC 9 % / ROE 36 %
O P E N I N G S / L AU N C H E S
• Summer 2016: Mein Schiff 5• Three newbuild ships launched in each of
the next three years (2017 to 2019)
HAPAG LLOYD
Luxury and expedition cruises
C U R R E N T P O R T F O L I O ( 2 0 15 /16)
• Four ships• Underlying EBITA € 30 m
O P E N I N G S / L AU N C H E S
• Two new expedition ships launch in Spring and Autumn 2019
+ 3
Mein Schiff newbuilds over the next three years

37Principles underlying TUI Group M A N A G E M E N T R E P O R T
• Thomson Cruises is continuing its path of modernisation, with the launch of TUI Discovery in Summer 2016 and the delivery of TUI Discovery 2 in Summer 2017. In addition, Mein Schiff 1 and Mein Schiff 2 will move to the UK from the TUI Cruises fleet in 2018 and 2019. We expect each new ship to deliver around € 25 m of underlying EBITA per annum, at constant currency rates.
• Following the successful turnaround of Hapag-Lloyd Cruises to profitability this year, we have announced the modernisation and expansion of the expedition cruise fleet, with two newbuilds arriving in 2019, delivering around € 15 m additional EBITA per annum per ship.
Growth will focus on destinations with strong margin and ROIC character-istics, and where we deliver a competitive advantage.
• Year round destinations deliver higher occupancy, less seasonality in earnings and therefore higher returns.
• Year round destinations also add the opportunity to sell to other source markets outside TUI Group – for example, a significant proportion of Riu’s revenues in the Caribbean come from the US.
• We can leverage off our existing strong presence in long haul and other year round destinations – on a hotel basis, over 50 % of our current Hotels & Resorts portfolio is in year round destinations, and around 40 % of our source market customers travel to year round destinations (defined as Canaries, Cape Verde, North Africa and long haul).
• Our 787 fleet enables us to take more customers, more efficiently to long haul destinations. In our source markets in 2015 / 16, around 15 % of our accommodated customers stayed in long haul destinations. We expect our long haul package holiday customers to grow by over 500,000 over the next three years.
We will continue to build on our direct relationship with the customer in resort.
Our unique Destination Services bring the TUI brand alive, operating in more than 100 destinations with access to over 11 million customers, managing airport transfers, excursions and resort services. In 2015 / 16 we completed the separation of our Destination Services business from Hotelbeds Group (which has subsequently been sold) and have so far delivered synergies worth € 10 m as a result of service integration and cost efficiency measures. Growth
> 50 %
of our current Hotels & Resorts portfolio is in year round destinations

38 M A N A G E M E N T R E P O R T Principles underlying TUI Group
in Destination Services will be driven by an increase in the proportion of differentiated excursions (currently around 20 %) and in sales of excursions through online and mobile channels. In addition, we are continuing to expand our network, with the launch of a destination management company in the USA in November 2016, and exploring the potential for launches in other countries.
Balanced ownership model for new and existing hotels and cruise ships, with clear investment hurdle rates.
• We have a balanced ownership model for hotels, with just under 50 % of our hotels under management or franchise.
• Investments will be made in differentiating products where there are pockets of growth and scarcity of supply.
• Our strong joint venture relationships bring significant operational benefits for our hotels and cruises, as well as reducing levels of invested capital on a consolidated basis.
• We target ROIC (based on our Group definition) of at least 15 % on average for our new investments (compared with our Group weighted average cost of capital of 7.5 %).
See from page 46
• Our Hotels & Resorts and Cruises segments deliver ROIC significantly in excess of their cost of capital. In 2015 / 16 our Hotels & Resorts segment delivered ROIC of 12.3 % (versus segment weighted average cost of capital of 6.5 %) whilst Cruises delivered ROIC of 21.3 % (versus segment weighted average cost of capital of 7.5 %).
21.3 %
ROIC Cruises in 2015 / 16

39Principles underlying TUI Group M A N A G E M E N T R E P O R T
2 . D I R E C T C U S TO M E R R E L AT I O N S H I P S
Growth in our hotel and cruise brands is enabled and de-risked through the strength of our direct distribution and customer relationships, creating a virtuous circle for sustainable growth. This also gives us a competitive advantage compared with other hotel and cruise companies with lower levels of direct distribution.
Capitalising on the strength of the TUI brand on a global scale – One global distribution brand offers significant opportunities in terms of growth potential, consistency of customer experience, digital presence, operational efficiency and competitive strength. In the long run, it is our objective that there will be one distribution brand wherever it is reasonable, but we will still ensure that we maintain our local roots. We launched our brand migration successfully in the Netherlands in October 2015, achieving strong unaided awareness within weeks of the TUI brand in this source market. The TUI brand roll-out has also taken place in France, with Belgium and Nordics following in Autumn 2016 and the UK to follow in late 2017. Brand migration will be funded from ongoing operational efficiency and additional revenues.
More direct, more online sales – Having a direct relationship with the customer enables delivery of a more personalised experience and gives us a strong competitive advantage. In 2015 / 16, 72 % of our source market customers booked through our direct channels (up two percentage points on prior year), with 43 % booking online (up two percentage points on prior year). In Northern Region (UK and Nordics) we now sell over 60 % of our holidays online. Further progress has also been made in Central Region (47 % controlled, 15 % online) and Western Region (70 % controlled, 52 % online).
Leveraging our direct relationship with the customer using our global IT platforms – IT is at the heart of TUI, providing the technology solutions required to deliver the TUI Group strategy and help our customers create unforgettable moments. Internet and mobile use among our customers has increased rapidly, so at TUI we’re using technology to create ever-more innovative and engaging ways to showcase our great destinations and inspire people’s holiday choices, with best in class, more personal digital experiences.
Netherlands
Successfull brand migration in October 2015

40 M A N A G E M E N T R E P O R T Principles underlying TUI Group
• Customer App – The “MyTUI App” is at the heart of our mobile vision. Through this inspirational, effortless technology, we will drive customer behaviour change that will lead to the creation of our biggest digital sales channel of holidays, flights and ancillaries. It will be key to customer acquisition and retention, winning new customers and bringing back old customers time after time. In three years, we have moved from a standing start to multiple awards for our TUI App, which has been rolled out to ten European countries and has had over 3.5 million downloads. The App provides a rich, immersive experience and not only helps customers find and pay for the holiday they want, but allows them to explore their destination, discover places to visit and book unforgettable trips and excursions. We have built the App in such a way that it needs only minimal development to amend it to suit each new country as it is rolled out. This also makes it easier to enhance and update functionality as customers’ expectations develop. The roadmap is always evolving due to fast paced technology driving product innovation and business requirements. Currently in development we have inspirational video content, hotel check in, live travel information, social feed, transfer times, native ancillary sales, interactive maps, restaurant booking, and virtual reality, to mention just a few.
• Group Marketing Platform – We are investing in transformational capa-bilities that improve how we interact with our customers, by using what we know about them to provide more timely and personalised customer service and marketing. This is aimed at delivering a better customer expe-rience, driving higher levels of engagement and conversion, and creating business value from every customer interaction by encouraging up-selling, cross-selling and rebooking. We have made significant progress to date, and have rolled out a common marketing platform and programmes to a number of key source markets, aimed at supporting customers through their holiday search and their post-booking holiday countdown. In addition we are trialling other innovations such as a Concierge Service in the UK, providing an enhanced level of service for selected customer segments.
• Yield Management – We have developed our own bespoke yield solution to automate the management and pricing of holidays in response to changes in demand and costs throughout the day, seven days a week. This solution contains forecasting algorithms and business logic tailored for the dynamics of the tour operating industry, where flights and hotels are sold simulta-neously. It also includes a sophisticated user interface which provides high levels of transparency and control to support the yield process. Following success in the UK, where the first phase went live in 2013 with full rollout in 2014, the solution was rolled out to France in 2015 and to the Nordic market in 2016. We are now targeting a rollout in further markets including Germany over the next 24 months.
personalisedcustomer service and marketing
MyTUI App
has been rolled out to ten countries and has had over 3.5 m downloads.

41Principles underlying TUI Group M A N A G E M E N T R E P O R T
Driving operational efficiency improvements – We will continue to drive efficiency improvements across our source markets, including the following:
• In Germany, we remain focused on further increasing market share through a wider holiday offering, further increasing controlled and online distribution, and delivering operational efficiency improvements.
• In France we have completed the acquisition of Transat’s French tour operations for an enterprise value of € 55 m. The acquisition will enhance our existing turnaround plans for this source market, through market consolidation and significant margin potential. It is expected to bring underlying EBITA margin in France to around 2.5 %.
• In addition, we are continuing to deliver our efficiencies through our OneAviation programme, through the central control of configuration, purchasing, finance, maintenance and ground handling.
Enhancing top line growth by adding further flexibility for our customers – We utilise technology to deliver additional top line growth with minimal capacity commitment, such as third party flying and dynamic packaging.
Market leading positions which we will continue to grow – Based on the growth levers outlined above, we target profitable top line growth ahead of the market, or around 3 % CAGR Group turnover growth, at constant currency rates. In 2015 / 16 we delivered brand turnover growth (including turnover from our Canadian and TUI Cruises joint ventures) of 2.4 % and turnover growth of 1.4 % at constant currency rates, with underlying growth offset partly by the impact of the lower demand for Turkey within some of our source markets. Customer volumes from our source markets (excluding Canada and Russia) were broadly flat in the year at 19.2 million, with strong growth in the UK and Netherlands offset by volume declines in Germany and the Nordics, mainly as a result of lower demand for Turkey not being fully offset by increased demand to other destinations.
Market leading position which will continue to grow

42 M A N A G E M E N T R E P O R T Principles underlying TUI Group
3 . B A L A N C E S H E E T S T R E N G T H & F L E X I B I L I T Y
We have a strong and flexible balance sheet, which enables and supports further growth. We will maintain our rigorous focus on financial discipline, to deliver optimal allocation of capital.
Strong operating cash flow provides finance for investments and divi-dend – We generate a significant level of operating cash flow. Together with the proceeds from the Hotelbeds Group disposal, the high level of operating cash generation will help to finance future investments in growth as well as continuing to generate an attractive dividend yield.
Focus on meaningful investments aligned with our strategy – Our capital expenditure reflects the reinvestment of proceeds in transformational growth following the disposal of Hotelbeds Group. Our priorities for capital allocation are investments in unique hotel and cruise brands. We also continue to allocate capital to strengthen the core of our business – for example, through synergetic acquisitions such as Transat – as well as maintaining a strong and flexible balance sheet to support further growth. We have clear ROIC hurdle rates for new investments, as outlined above, and material investments are approved at Board level.
Deliver merger synergies – At the time of the merger with TUI Travel PLC we outlined € 100 m of merger synergies to be delivered by the end of 2016 / 17 from corporate streamlining (€ 50 m), occupancy improvement in Group hotels (€ 30 m) and the integration of Destination Services with our Tourism businesses (€ 20 m). By the end of 2015 / 16 we delivered € 80 m of these synergies, and we are on track to deliver the remaining € 20 m to be delivered by the end of 2016 / 17. In addition, we targeted a reduction in our underlying effective tax rate as a result of the more efficient tax grouping in Germany. This was achieved immediately after the merger, with the Group’s underlying effective rate now at 25 %.
€ 100 m
merger synergies to be delivered by the end of 2016 / 17

43Principles underlying TUI Group M A N A G E M E N T R E P O R T
Deliver against financial targets with a view to achieving re-rating – Our focus on rating will allow us to obtain advantageous financing conditions and continue to ensure access to debt capital markets. This has already delivered benefits. Moody’s upgraded TUI to Ba2 in April 2016, and Standard & Poor’s revised its outlook on TUI from Stable to Positive in February 2016. We have delivered against our financial targets for 2015 / 16 with a leverage ratio of 3.3 times (target 3.5 to 2.75 times), and an interest coverage ratio of 4.8 times (target 4.5 to 5.5 times interest). For 2016 / 17 our financial targets have been tightened – leverage ratio target is 3.25 to 2.5 times, and interest cover target is 4.75 to 5.75 times.
Committed to paying an attractive dividend – We are committed to delivering superior returns for our shareholders. Our growth strategy will enable this. We will propose a dividend to our shareholders of 63 cents in respect of 2015 / 16, reflecting 14.5 % growth in the base dividend (in line with underlying EBITA growth at constant currency) plus the additional 10 % outlined at the time of the merger in 2014. For 2016 / 17 we expect to pay a dividend based on growth in underlying EBITA at constant currency (calculated off the base dividend of 58 cents in 2015 / 16).
Continue to maximise value of non-core businesses – We successfully completed the disposal of Hotelbeds Group for a total cash consideration of € 1.2 bn in September 2016, realising significant value for this non-core business. We are in the process of disposing Travelopia and continue to hold our investment in Hapag-Lloyd AG for sale.
€ 1.2 bndisposal of Hotelbeds Group

44 M A N A G E M E N T R E P O R T Principles underlying TUI Group
P R I N C I P L E S U N D E R LY I N G T U I G R O U P
Structure and business model
T O U R I S M A L L O T H E R S E G M E N T S *
SOURCE MARKETS
• Northern Region• Central Region• Western Region
HOTELS & RESORTS
• Riu• Robinson• Other Hotels
CRUISES
• TUI Cruises• Hapag-Lloyd Cruises
OTHER TOURISM
• Central tourism functions• Corsair
• Corporate Center• Real Estate
* As at 30 September 2016 and the financial stake in Hapag-Lloyd AG (Container shipping) are held for sale
TUI Group is the world’s leading tourism business, consisting of a large portfolio of strong tour operators, 1,600 travel agencies and leading online portals, five tour operator airlines with around 150 aircraft, more than 300 hotels with around 214,000 beds, 14 cruise liners and incoming agencies in all major holiday destinations around the globe. This integrated offering enables us to provide our 20 million customers with an unparalleled holiday experience.
TUI AG parent company
TUI AG is TUI Group’s parent company with registered offices in Hanover and Berlin. It holds directly, via its affiliates, indirect interests in the principal Group companies conducting the Group’s operating business in individual countries. Overall, TUI AG’s group of consolidated companies comprised 417 direct and indirect subsidiaries at the balance sheet date. A further 13 affiliated companies and 27 joint ventures were included in TUI AG’s consolidated financial statements on the basis of at equity measurement.
O R G A N I S AT I O N A N D M A N AG E M E N T
TUI AG is a stock corporation under German law, whose basic principle is dual management by two boards, the Executive Board and the Super-visory Board. The Executive and Supervisory Boards cooperate closely in governing and monitoring the Company. The Executive Board is respon-sible for the overall management of the Company.
The appointment and removal of Board members is based on sections 84 et seq. of the German Stock Corporation Act in combination with section 31 of the German Co-Determination Act. Amendments to the Articles of Association are effected on the basis of the provisions of sections 179 et seq. of the German Stock Corporation Act in combination with section 24 of TUI AG’s Articles of Association.
E X E C U T I V E B OA R D A N D G R O U P E X E C U T I V E CO M M I T T E E
As at the balance sheet date, the Executive Board of TUI AG consisted of the CEO and four other Board members.
For details on Executive Board members see page 116
A Group Executive Committee was set up in order to manage TUI Group strategically and operationally. As at 30 September 2016, the Committee consisted of eleven members who meet under the chairmanship of CEO Friedrich Joussen.
TUI Group structure
TUI Group’s tour operating business is clustered into three regions, each with a source market alignment. The three regions make up the Tourism Division together with Hotels & Resorts, Cruises and Other Tourism.

45Principles underlying TUI Group M A N A G E M E N T R E P O R T
N O R T H E R N R E G I O N
The Northern Region segment comprises the tour operators, airlines and cruise business in the UK, Ireland and the Nordics. In addition, the Canadian strategic venture Sunwing and the joint venture TUI Russia have been included within this segment. In preparation for the disposal of a large part of Specialist Group, Ski has been reclassified from the segment to Northern Region. The prior year’s numbers have been restated accordingly.
C E N T R A L R E G I O N
The Central Region segment comprises the tour operators and airlines in Germany and the tour operator activities in Austria, Switzerland and Poland.
W E S T E R N R E G I O N
The tour operators and airlines in Belgium and the Netherlands and the tour operators in France are included within the segment Western Region.
H O T E L S & R E S O R T S
The Hotels & Resorts segment comprises all Group-owned hotels and hotel companies in TUI Group. The hotel activities of the former TUI Travel Sector have also been allocated to Hotels & Resorts. The segment comprises majority participations in hotels, joint ventures with local partners, stakes in companies giving TUI a significant influence, and hotels operated under management contracts.
In financial year 2015 / 16, Hotels & Resorts comprised a total of 303 hotels with 213,503 beds. 279 hotels, i.e. the majority, are in the four- or five-star category. 44 % were operated under management contracts, 38 % were owned by one of the hotel companies, 15 % were leased and 3 % of the hotels were managed under franchise agreements.
In brackets: previous year
C AT E G O R I E S O F H O T E L S & R E S O R T S
Hotel brand 3 stars 4 stars 5 stars Total hotels Beds Main sites
Riu 4 48 42 94 86,184 Spain, Mexico, Caribbean, Cape Verdes, Portugal, Morocco
Robinson – 20 4 24 15,342 Spain, Greece, Turkey, Switzerland, Austria
Other hotel companies 20 114 51 185 111,977 Spain, Greece, Turkey, Egypt
Total 24 182 97 303 213,503
As at 30 September 2016
R I U
Riu is the largest hotel company in the portfolio of Hotels & Resorts. The Majorca-based enterprise has a high proportion of repeat customers and stands for professionalism and excellent service. Most of the hotels are in the premium and comfort segments and they are predominantly located in Spain, Mexico and the Caribbean.
R O B I N S O N
Robinson, the leading provider in the premium club holiday segment, is characterised by its professional sport, entertainment and event port-folio. Moreover, the clubs offer high-quality hotel amenities, excellent service and spacious architecture. Most of the hotels are located in Spain, Greece and Turkey. The facilities also meet ambitious standards
F I N A N C I N G S T R U C T U R E T U I H O T E L S & R E S O R T S G R O U P H O T E L B E D S P E R R E G I O N
(46) 44Management
(26) 26Western
Mediterranean
3 (3) Franchise
15 (15)Lease
38 (36)Ownership
9 (9)
Other countries
20 (19)Caribbean
20 (23)North Africa / Egypt
(23) 25Eastern
Mediterranean
% %

46 M A N A G E M E N T R E P O R T Principles underlying TUI Group
in terms of promoting sustainable development and meeting specific environmental standards.
O T H E R H O T E L CO M PA N I E S
Other hotel companies include TUI Blue Hotels as well as the brands Grupotel, Iberotel, Magic Life and the other hotels previously managed in the former TUI Travel sector. Many of the hotels are operated as tour operator concepts, e. g. Sensatori, Sensimar and Family Life.
C R U I S E S
The Cruises segment consists of Hapag-Lloyd Cruises and the joint venture TUI Cruises.
H A PAG - L L OY D C R U I S E S
Hamburg-based Hapag-Lloyd Cruises holds a leading position in the German-speaking market with a fleet of four ships in the luxury and expedition cruise segments.
Its flagships are the five-star-plus vessels Europa and Europa 2. They were awarded this category by the Berlitz Cruise Guide and are the world’s only ships to be recognised in this way, in the case of Europa for the seventeenth time in succession, and in the case of Europa 2 for the fourth consecutive time. Europa primarily cruises on world tours, while her sister ship Europa 2 takes shorter but combinable routes. The Hanseatic is used, among other destinations, for expedition cruises to the Arctic and Antarctic. It is the world’s only five-star passenger vessel in the highest Polar class. The Bremen, a four-star vessel − also awarded the highest Polar class – is another expedition ship travelling to similar destinations. Three of the ships are owned and one is chartered.
T U I C R U I S E S
Hamburg-based TUI Cruises is a joint venture formed in 2008 between TUI AG and the US shipping company Royal Caribbean Cruises Ltd., in which each partner holds a 50 % stake. With five ships so far, TUI Cruises is top-ranked in the German-speaking premium market for cruises. The Berlitz Cruise Guide rated Mein Schiff 3, Mein Schiff 4 and Mein Schiff 5 among the world’s five best liners in the category “Large Ships”.
O T H E R TO U R I S M
Other Tourism comprises central functions such as destination services, IT, aviation control and the French airline Corsair.
A L L O T H E R S E G M E N T S
Apart from the segments described above, the accounts include the category All other segments. This includes, in particular, the corporate centre functions of TUI AG and the interim holdings, as well as the Group’s real estate companies.
The financial stake in Hapag-Lloyd Container Shipping has been carried since December 2014 under financial assets available for sale as defined by IFRS 5. The IPO of Hapag-Lloyd AG took place in November 2015. As TUI did not take part in the associated cash capital increase and Hapag- Lloyd shares were sold in the framework of the IPO, TUI’s stake in Hapag- Lloyd AG declined from 13.9 % to 12.3 % as at 30 September 2016.
D I S CO N T I N U E D O P E R AT I O N S
Following the divestments made in financial year 2015 / 16 – the sale of LateRooms Group in October 2015 and Hotelbeds Group in Septem-ber 2016 – TUI Group also intends to sell Specialist Group. The Specialist Group was reclassified as discontinued operation. The sector pools the activities of specialist tour operators and had been managed as a separate entity since the merger between TUI AG and TUI Travel PLC at the end of December 2014. The portfolio of Specialist Group is to be sold in one transaction from the autumn of 2016 with the exception of two tour operator brands. Crystal Ski and Thomson Lakes & Mountains will not be included in the sale as they have strong synergies and are closely associated with core business Tourism. They have been integrated into TUI UK’s business.
R E S E A R C H A N D D E V E L O P M E N T
As a tourism service provider, the TUI Group does not engage in research and development activities comparable with manufacturing companies. This sub-report is therefore not prepared.
Value-oriented Group management
Management system and Key Performance Indicators
As the world’s number one tourism group with one global brand, an attractive hotel portfolio, a growing cruise business, a modern and effi-cient aircraft fleet and direct access to more than 20 million customers, we aim to secure our vertically integrated business model by means of profitable growth and achieve a sustainable increase in the value of the TUI Group.
A standardised management system has been created to implement value- driven management across the Group as a whole and in its indi-
vidual business segments. The value-oriented management system is an integral part of consistent Group-wide planning and controlling processes.
Key management variables used for regular value analysis are Return On Invested Capital (ROIC) and absolute value added. ROIC is compared with the segment-specific cost of capital. ROIC is calculated as the ratio of underlying earnings before interest, taxes and amortisation of goodwill (underlying EBITA) to average invested interest-bearing invested capital (invested capital) for the segment.

47Principles underlying TUI Group M A N A G E M E N T R E P O R T
Our definition of EBITA is earnings before net interest result, income tax and impairment of goodwill excluding losses on container shipping and excluding the result from the measurement of interest hedges. While EBITA includes amortisation of intangible assets, it does not carry the result of our investment in container shipping as our stake in Hapag-Lloyd AG is a pure equity investment without an operating character.
In order to explain and measure TUI Group’s operating performance, we use underlying EBITA adjusted for gains on disposal of investments, restructuring expenses, primarily scheduled amortisation of intangible assets from purchase price allocations and other expenses for and income from one-off effects.
In the framework of our growth strategy, we aim to achieve an underlying EBITA CAGR of at least 10 % over the years to financial year 2018 / 19 (on a constant currency basis).
In order to follow the development of the business performance of our segments in the course of the year, we monitor the financial indicators turnover and EBITA, but also key non-financial performance indicators, such as customer numbers in our tour operators, and capacity or passen-ger days, occupancy and average prices in TUI Hotels & Resorts and Cruises. In the framework of our sustainability reporting, we have also defined a target indicator for specific CO2 emissions per passenger kilometre for our airlines. We measure achievement of that indicator on an annual basis.
Information on operating performance indicators is provided in the sections
on “Business performance by segment” and “Environment” and in the Report
on Expected Developments .
Cost of capital
C O S T O F C A P I TA L ( W A C C )
Tour operator Hotels Cruises TUI Group
% 2015 / 16 2015 / 16 2015 / 16 2015 / 16
Risk-free interest rate 0.50 0.50 0.50 0.50
Risk adjustment 9.40 6.03 6.35 8.42
Market risk premium 6.00 6.00 6.00 6.00 Beta factor1 1.5659 1.0042 1.0591 1.4025
Cost of equity after taxes 9.90 6.53 6.85 8.92
Cost of debt capital before taxes 4.18 2.20 2.72 3.63
Tax shield 1.00 0.55 0.85 0.89
Cost of debt capital after taxes 3.18 1.65 1.87 2.74
Share of equity 2 42.65 70.11 68.54 50.70
Share of debt capital 2 57.35 29.89 31.46 49.30
WACC after taxes3 6.00 5.00 5.25 5.75
Tax rate 24.00 25.00 31.00 24.62
Cost of equity before taxes 12.55 8.46 9.61 11.50
Cost of debt capital before taxes 4.18 2.20 2.72 3.63
Share of equity 2 42.65 70.11 68.54 50.70
Share of debt capital 2 57.35 29.89 31.46 49.30
WACC before taxes3 7.75 6.50 7.50 7.50
1 Segment beta based on peer group, group beta based on weighted segment betas2 Segment share based on peer group, group share based on weighted segment shares3 Rounded to 1/4 percentage points
The cost of capital is calculated as the weighted average cost of equity and debt capital (WACC). While the cost of equity reflects the return expected by investors from TUI shares, the cost of debt capital is based on the average borrowing costs of the TUI Group. The cost of capital
always shows pre-tax costs, i.e. costs before corporate and investor taxes. The expected return determined in this way corresponds to the same tax level as the underlying earnings included in ROIC.

48 M A N A G E M E N T R E P O R T Principles underlying TUI Group
ROIC and economic value added
ROIC is calculated as the ratio of underlying earnings before interest, taxes and amortisation of goodwill (underlying EBITA) to the average for invested interest-bearing capital (invested capital) for the relevant segment or sector. Given its definition, this performance indicator is not influenced by any tax or financial factors and has been adjusted for one-off effects. From a Group perspective, invested capital under the financing approach is derived from liabilities, comprising equity (including non-controlling interests) and the balance of interest-bearing liabilities and interest-bearing assets. The cumulative amortisations of purchase price allocations are then factored in to invested capital.
Apart from ROIC as a relative performance indicator, economic value added is used as an absolute value-oriented performance indicator. Eco-nomic value added is calculated as the product of ROIC less associated capital costs multiplied by interest-bearing invested capital.
R O I C A N D V A L U E A D D E D T U I G R O U P
€ million
2015 / 16 2014 / 15
restated
Equity 3,248.2 2,417.4
plus interest bearing financial liability
items 3,769.1 3,500.0
less financial assets 3,137.2 2,522.3
plus purchase price allocation 300.5 572.9
Invested Capital 4,180.6 3,968.1
Invested Capital Prior year 3,968.1 3,544.7
Seasonal adjustment1 500.0 500.0
Ø Invested capital 2 4,574.4 4,256.4
Underlying EBITA 1,000.5 953.3
ROIC % 21.87 22.40
Weighted average cost of capital
(WACC) % 7.50 10.00
Value added 657.4 527.7
1 Adjustment to net debt to reflect a seasonal average cash balance2 Average value based on balance at beginning and year-end
For TUI Group, ROIC was down by 0.5 percentage points on the previous year at 21.9 %. With the cost of capital at 7.5 %, this meant positive economic value added of € 657.4 m (previous year € 527.7 m).

49Risk Report M A N A G E M E N T R E P O R T
R I S K R E P O R T
Successful management of existing and emerging risks is critical to the long-term success of our business and to the achievement of our stra-tegic objectives. In order to seize market opportunities and leverage the potential for success, risk must be accepted to a reasonable degree. Risk management is therefore an integral component of the Group’s Corporate Governance.
The current financial year has seen the risk management framework which evolved last year after the merger become further embedded in the organisation and within the business planning cycle. The major enhance-ment in the current financial year was the upgrade of the risk and control software and unification of the two previous legacy systems into a single application, which has made reporting processes more efficient as a result. Our risk governance framework is set out below.
Risk governance framework
S T R AT E G I C D I R E C T I O N A N D R I S K A P P E T I T E
The Executive Board, with oversight by the Supervisory Board, deter-mines the strategic direction of the TUI Group and agrees the nature and extent of the risks it is willing to take to achieve its strategic objectives.
To ensure that the strategic direction chosen by the business represents the best of the strategic options open to it, the Executive Board is sup-ported by the Group Strategy function. This function exists to facilitate and inform the Executive Board’s assessment of the risk landscape and development of potential strategies by which it can drive long-term share-holder value. On an annual basis the Group Strategy function develops an in-depth fact base in a consistent format which outlines the market
attractiveness, competitive position and financial performance by division and source market. These are then used to facilitate debate as to the level and type of risk that the Executive Board finds appropriate in the pursuit of its strategic objectives. The strategy, once fully defined, con-sidered and approved by the Executive Board, is then incorporated into the Group’s three-year roadmap and helps to communicate the risk ap-petite and expectations of the organisation both internally and externally.
Ultimate responsibility for the Group’s risk management rests with the Executive Board. Having determined and communicated the appropriate level of risk for the business, the Executive Board has established and maintains a risk management system to identify, assess, manage and monitor risks which could threaten the existence of the company or have a significant impact on the achievement of its strategic objectives: these are referred to as the principal risks of the Group. This risk manage-ment system includes an internally-published risk management policy which helps to reinforce the tone set from the top on risk, by instilling an appropriate risk culture in the organisation whereby employees are expected to be risk aware, control minded and “do the right thing”. The policy provides a formal structure for risk management to embed it in the fabric of the business. Each principal risk has assigned to it a member of the Executive Committee as overall risk sponsor to ensure that there is clarity of responsibility and to ensure that each of the principal risks are understood fully and managed effectively.
The Executive Board regularly reports to the Audit Committee of the Supervisory Board on the overall risk position of the Group, on the indi-vidual principal risks and their management, and on the performance and effectiveness of the risk management system as a whole.

50 M A N A G E M E N T R E P O R T Risk Report
The Risk Oversight Committee (ROC) ensures on behalf of the Executive Board that business risks are identified, assessed, managed and moni-tored across the businesses and functions of the Group. Meeting on at least a quarterly basis, the ROC’s responsibilities include considering the principal risks to the Group’s strategy and the risk appetite for each of those risks, assessing the operational effectiveness of the controls in place to manage those risks and any action plans to further improve con-trols, and reviewing the bottom-up risk reporting from the businesses themselves to assess whether there are any heightened areas of concern. The ROC helps to ensure that risk management is embedded into the planning cycle of the Group and has oversight of the stress-testing of cash flow forecasts.
Senior executives from the Group’s major businesses are required to attend the ROC on a rotational basis and present on the risk and control framework in their business, so that the members of the ROC can ask questions on the processes in place, the risks present in each business and any new or evolving risks which may be on their horizon, and also to seek confirmation that the appropriate risk culture continues to be in place in each of the major businesses.
Chaired by the Chief Financial Officer, other members of the Committee include the Group Director Controlling and Finance Director Tourism, the directors of Compliance & Risk, Financial Accounting, Treasury & Insurance, Group Reporting & Analysis, Assurance, M&A, Investor Relations and representatives from the IT and Legal Compliance func-tions. The director of Group Audit attends without having voting rights
G R O U P R I S K T E A M
Support & Report
B U S I N E S S E S & F U N C T I O N S
Identify & Assess
R I S K O V E R S I G H T CO M M I T T E E ( R O C )
Review & Communicate
R I S K C H A M P I O N CO M M U N I T Y
• Understand key risks
• Review key risks and mitigation
• Manage and monitor risks
• Report on risk status
• Overall responsibility for risk management
• Determine strategic approach to risk
• Approve risk policy including risk appetite and set tone at the top
• Agree how principal risks are managed, mitigated & monitored
• Review the effectiveness of the risk management system
E X E C U T I V E B O A R D
Direct & Assure
• Formulate risk strategy and policy
• Discuss and propose risk appetite
• Embed risk within business planning• Summarise principal risks
• Ensure effective monitoring
R I S K M A N A G E M E N T S Y S T E M

51Risk Report M A N A G E M E N T R E P O R T
to maintain the independence of their function. The ROC reports quar-terly to the Executive Board to ensure that it is kept abreast of changes in the risk landscape and developments in the management of principal risks, and to facilitate regular quality discussions on risks and risk man-agement at the Executive Board.
The Executive Board has also established a Group Risk team to ensure that the risk management system functions effectively and that the risk management policy is implemented appropriately across the Group. The Group Risk team supports the risk management process by providing guidance, support and challenge to management whilst acting as the central point for co-ordinating, monitoring and reporting on risk across the Group. The Group Risk team is responsible for the administration and operation of the risk and control software which underpins the Group’s risk reporting and risk management process.
Each division and source market within the Group is required to adopt the Group Risk Management policy. In order to do this, each either has their own Risk Committee or includes risk as a regular agenda item at their Board meetings to ensure that it receives the appropriate senior management attention within their business. In addition, the divisions and source markets each appoint a Risk Champion, who promotes the risk management policy within their business and ensures its effective application. The Risk Champions are necessarily in close contact with the Group Risk team and they are critical both in ensuring that the risk management system functions effectively and in implementing a culture of continuous improvement in risk management and reporting.
R I S K M A N AG E M E N T P R O C E S S
The Group Risk team applies a consistent risk methodology across all key areas of the business. This is underpinned by risk and control software which reinforces clarity of language, visibility of risks, controls and actions and accountability of ownership. Although the process of risk identifica-tion, assessment and response is continuous and embedded within the day-to-day operations of the divisions and source markets, it is consoli-dated, reported and reviewed at varying levels throughout the Group on at least a quarterly basis.
Risk identification: On a quarterly basis, line management closest to the risks identify the risks relevant to the pursuit of the strategy within their business area in the context of four types of risk:
• longer-term strategic and emerging threats; • medium-term challenges associated with business change programmes; • short-term risks triggered by changes in the external and regulatory
environment; and• short-term risks in relation to internal operations and control.
A risk owner is assigned to each risk, who has the accountability and authority for ensuring that the risk is appropriately managed.
Risk descriptions: The nature of the risk is articulated, stating the under lying concern the risk gives arise to, identifying the possible causal factors that may result in the risk materialising and outlining the potential consequences should the risk crystallise. This allows the divisions / source markets and the Group to assess the interaction of risks and potential triggering events and / or aggregated impacts before developing appropriate mitigation strategies to target causes and / or consequences.
Risk assessment: The methodology used is to initially assess the gross risk. The gross risk is essentially the worst case scenario, being the product of the impact together with the likelihood of the risk material-ising if there were no controls in place to manage, mitigate or monitor the risk. The key benefit of assessing the gross risk is that it highlights the potential risk exposure if controls were to fail completely or not be in place at all. Both impact and likelihood are scored on a rating of 1 to 5 using the criteria outlined below.
The next step in the process is to assess the controls which are currently in place and which help to reduce the likelihood of the risk materialising and / or its impact if it does. The details of the controls including the control owners are documented. Consideration of the controls in place then enables the current or net risk score to be assessed, which is essen-tially the reasonably foreseeable scenario. This measures the impact and likelihood of the risk with the current controls identified in operation. The key benefit of assessing the current risk score is that it provides an understanding of the current level of risk faced today and the reliance placed on the controls currently in operation.

52 M A N A G E M E N T R E P O R T Risk Report
I M P A C T A S S E S S M E N T
INS IGNIF IC ANT MINOR MODERATE MAJOR C ATASTROPHIC
QUANTITATIVE < 3 % EBITA* (< € 30 m)
3 – < 5 % EBITA*( 30 – < € 50 m)
5 – < 10 % EBITA*(50 – < € 105 m)
10 – < 15 % EBITA*(105 – < € 160 m)
≥ 15 % EBITA*( ≥ € 160 m)
QUALITATIVE Minimal impact on Limited impact on Short term impact on Medium term impact on Detrimental impact on
• Global reputation• Programme delivery• Technology reliability• Health & Safety
standards
• Global reputation• Programme delivery• Technology reliability• Health & Safety
standards
• Global reputation• Programme delivery• Technology reliability• Health & Safety
standards
• Global reputation• Programme delivery• Technology reliability• Health & Safety
standards
• Global reputation• Programme delivery• Technology reliability• Health & Safety
standards
* Budgeted underlying EBITA for the financial year ended 30 September 2016
L I K E L I H O O D A S S E S S M E N T
RARE
< 10 % ChanceUNLIKELY
10 – < 30 % ChancePOSSIBLE
30 – < 60 % ChanceL IKELY
60 – < 80 % ChanceALMOST CERTAIN
≥ 80 % Chance
Risk response: If management are comfortable with the current risk score, then the risk is accepted and therefore no further action is required. The controls in place continue to be operated and management monitor the risk, the controls and the risk landscape to ensure that the risk score stays stable and in line with management’s tolerance of the risk.
If, however, management assesses that the current risk score is too high, then an action plan will be drawn up with the objective of introducing new or stronger controls which will reduce the impact and / or likelihood of the risk to an acceptable, tolerable and justifiable level. This is known as the target risk score and is the parameter by which management can ensure the risk is being managed in line with the Group’s overall risk appetite. The risk owner will normally be the individual tasked with en-suring that this action plan is implemented within an agreed timetable.
Each division / source market will continue to review their risk register on an ongoing basis through the mechanism appropriate for their business e. g. local Risk Committee. The risk owner will be held to account if action plans are not implemented within the agreed delivery timescales.
This bottom-up risk reporting is considered by the ROC alongside the Group’s principal risks. New risks are added to the Group’s principal risk register if deemed to be of a significant nature so that the ongoing status and the progression of key action plans can be managed in line with the Group’s targets and expectations.
A D H O C R I S K R E P O R T I N G
Whilst there is a formal process in place aligned to reporting on risks and risk management on a quarterly basis, the process of risk identifi-cation, assessment and response is continuous and therefore if required risks can be reported to the Executive Board outside of the quarterly process if events dictate that this is necessary and appropriate. Ideally such ad hoc reporting is performed by the business or function which is closest to the risk, but it can be performed by the Group Risk team if necessary. The best example of ad hoc risk reporting in the year was an early assessment ahead of the UK referendum of the possible risks posed by a vote in favour of the UK leaving the EU (“Brexit”). A Brexit Steering Committee has now been created to monitor developments in this area.
See “Overall risk assessment” on page 62 for further details

53Risk Report M A N A G E M E N T R E P O R T
R I S K M AT U R I T Y & C U LT U R E
During the current financial year, the Risk Champions and the Group Risk team have continued to work together on risk management actions plans for the businesses as part of the culture of continuous improve-ment. Periodically we ask the businesses to formally assess the risk maturity and culture of their business, primarily through the Risk Champions completing self-assessment questionnaires, validating this with their local boards and then discussing their responses with the Group Risk team.
E N T I T Y S CO P I N G
A robust exercise is conducted each year to determine the specific entities in the Group which need to be included within the risk and control soft-ware and therefore be subject to the full rigour of the risk management process. The scoping exercise starts with the entities included within the Group’s consolidation system, and applies materiality thresholds to a combination of revenue, profit and asset benchmarks. From the entities this identifies, the common business management level at which those entities are managed is identified to dictate the entities which need to be set in the risk and control software itself to facilitate completeness of bottom-up risk reporting across the Group. This ensures that the risks and controls are able to be captured appropriately at the level at which the risks are being managed.
E F F E C T I V E N E S S O F R I S K M A N AG E M E N T S Y S T E M
The Executive Board regularly reports to the Audit Committee of the Supervisory Board on the performance and effectiveness of the risk management system, supported by the ROC and the Group Risk team. Additionally, the Audit Committee receives assurance from Internal Audit through its programme of audits over a selection of principal risks and business transformation initiatives most critical to the Group’s continued success. Finally, the Group’s auditor assess the risk management system in accordance with section 317 (4) of the German Commercial Code.
The conclusion from all of the above assurance work is that the risk management system has functioned effectively throughout the year and there have been no significant failings or weaknesses identified. Of course there is always room for improvement and as noted earlier, the Risk Champions and the Group Risk team have continued to work together on
risk management actions plans for the businesses. Broadly this concerns ensuring consistency of approach in assessing risk scores, clearer identi-fication of controls currently in place as well as any action plans to intro-duce further controls, and ensuring that risk identification has considered the four risk categories.
Principal risks
There are some principal risks which are inherent to the tourism sector and necessarily face all businesses in the sector. For these inherent risks we have controls, processes and procedures in place as a matter of course which serve to mitigate each risk to either minimise the likelihood of the event occurring and / or minimise the impact if it does occur. These risks are on our risk radar and we regularly monitor the risk, the controls and the risk landscape to ensure that the risk score stays stable and in line with our risk appetite in each case.
Furthermore, the tourism industry is fast-paced and competitive, with the emergence of new market participants operating new business models, combined with consumer tastes and preferences evolving all the time. As a result as a business we always have to adapt to the changing environment, and it is this process of constant change which generally gives rise to a number of principal risks which we have to actively manage in order to bring the risk into line with our overall risk appetite. We have action plans in place to increase controls around each of these risks and reduce the current net risk score to the target level indicated in the heat map overleaf.
In the heat map the assessment criteria used are shown on page 52 below. Note that the quantitative impact assessment is based on the budgeted underlying EBITA for the financial year ended 30 Septem-ber 2016.
If the risk detail in the subsequent tables does not suggest otherwise, the risks shown below relate to all segments of the Group. The risks listed are the principal risks to which we are exposed and are not exhaus-tive. They will necessarily evolve over time due to the dynamic nature of our business.

54 M A N A G E M E N T R E P O R T Risk Report
R I S K P O S I T I O N S
IMP
AC
T
L IKELIHOOD
CURRENT RISK POSITION
CURRENT RISK POSITION
This shows the current level of risk faced today after taking in to account the controls that are in place and which are operating as intended.
TARGET RISK POSITION
TARGET RISK POSITION
This shows the target level of risk deemed to be an acceptable, tolerable and justifiable risk posi-tion after further actions have been implemented to mitigate the risk.
1 IT Development & Strategy2 Brand Change3 Growth Strategy4 Integration & Restructuring Opportunities5 Sustainable Development6 Information Security7 Talent Management8 Corporate Streamlining
1
4
3
7
8
65
21
3
5
6
4
2
High Risk Score
Low Risk Score
CURRENT RISK POSITION
ACTIVE RISKS
INHERENT RISKS
Macroeconomic RisksHealth & SafetySeasonal Cash Flow ProfileCompetition and Consumer PreferencesDestination DisruptionsInput Cost VolatilityLegal & Regulatory ComplianceJoint Venture PartnershipsSupply Chain Risk
Principal risks – Inherent to the sector
N AT U R E O F R I S K M I T I G AT I N G F A C T O R S
D E ST I N AT I O N D I S R U P T I O N R I S K
Providers of holiday and travel services are exposed to the inherent risk of incidents affecting some countries or destinations within their operations. This can include natural catastrophes such as hurricanes or tsunamis; outbreaks of disease such as Ebola; political volatility as has been seen in Egypt and Greece in recent years; the implications of war in countries close to our source markets and destinations; and terrorist events such as the tragic incident in Tunisia last year and in Turkey in January 2016.
There is the risk that if such an event occurs which impacts on one or more of our destinations that we could potentially suffer significant operational disruption and costs in our businesses. We may possibly be required to repatriate our customers and / or the event could lead to a significant de-cline in demand for holidays to the affected destinations over an extended period of time.
• Whilst we are unable to prevent such events from occurring, we have well defined crisis management procedures and emergency response plans which are implemented when an event of this nature occurs, with the focus being on the welfare of our customers.
• Where the appropriate course of action is to bring customers home immediately, our significant fleet of aircraft allows us to do this smooth-ly and efficiently.
• Our policy is to follow foreign office advice in each of our source markets with regards to non-essential travel. This serves to minimise the exposure of our customers to turbulent regions.
• Due to our presence in all key holiday regions, when a specific destina-tion has been impacted by an external event, we are able to offer alternative destinations to our customers and to remix our destination portfolio away from the affected area in future seasons if necessary.

55Risk Report M A N A G E M E N T R E P O R T
N AT U R E O F R I S K M I T I G AT I N G F A C T O R S
M A C R O E CO N O M I C R I S K S
Spending on travel and tourism is discretionary and price sensitive. The economic outlook remains uncertain with different source markets at different points in the economic cycle. Furthermore, terrorist incidents in source markets can influence the overall demand for overseas travel in those markets. Consumers are also waiting longer to book their trips in order to assess their financial situation.
There is the risk that fluctuations in macroeconomic conditions in our source markets will impact on the spending power of our customers which could impact on our short-term growth rates and lead to margin erosion.
Furthermore, changes in macroeconomic conditions can have an impact on exchange rates which, particularly for the £ / € rate, has a direct im-pact on the translation of non-euro source market results into euros, the reporting currency of our Group.
CO M P E T I T I O N & CO N S U M E R P R E F E R E N C E S
The tourism industry is fast-paced and competitive with the emergence of new market participants operating new business models, combined with consumer tastes and preferences evolving all the time.
In recent years there has been an emergence of successful substitute business models such as web-based travel and hotel portals which allow end users to combine the individual elements of a holiday trip on their own and book them separately.
Consumer tastes and preferences have evolved in recent years as well, with more consumers booking their holidays online and via mobiles and tablets, and booking closer to the time of travel.
There is the risk that if we do not respond adequately to such business model disruption or if our products and services fail to meet changing customer demands and preferences, that our turnover, market share and profitability will suffer as a result.
• We always assume some level of destination disruption each year when setting financial plans and targets, so that we are able to cope with a “normal” level of disruption without it jeopardising achievement of our targets.
• Many consumers prioritise their spending on holidays above other discretionary items.
• Creating unique and differentiated holiday products which match the needs of our customers.
• Leveraging our scale to keep costs down and prices competitive.• Having a range of source markets so that we are not over exposed to
one particular economic cycle.• Expressing our key profit growth target in constant currency terms
so that short term performance can be assessed without the distor-tion caused by exchange rate fluctuations.
• Promoting the benefits of travelling with a recognised and leading tour operator to increase consumer confidence and peace of mind.
• Our outstanding market position as a leading tourism group, the strength of our brands and our vertically integrated business model enables us to respond robustly to competitive threats.
• The TUI Group is characterised by the continuous development of unique and exclusive holidays, developing new concepts and services which match the needs and preferences of our customers.
• Our vertically integrated business model offers end-to-end customer services, from consultation and booking of holidays via flights with the Group’s own airlines through to Group-owned or operated hotels, resorts and cruise ships. Vertical integration thus facilitates the de-velopment and marketing of individual, tailored holiday offerings for customers which it is difficult for competitors to replicate.
• Building strong and lasting relationships with our key hotel partners, which further reinforces our ability to develop new concepts exclusive to the TUI Group which competitors struggle to match.
• Focusing on being online throughout the whole of the customer jour-ney – from inspiration, to booking, to the holiday itself, as well as returning and sharing experiences through social media.

56 M A N A G E M E N T R E P O R T Risk Report
N AT U R E O F R I S K M I T I G AT I N G F A C T O R S
S E A S O N A L C A S H F LO W P R O F I L E
Tourism is an inherently seasonal business with the majority of profits earned in the European summer months. Cash flows are similarly season-al with the cash high occurring in the summer as advance payments and final balances are received from customers, with the cash low occurring in the winter as liabilities have to be settled with many suppliers after the end of the summer season.
There is the risk that if we do not adequately manage cash balances through the winter low period this could impact on the Group’s liquidity and ability to settle liabilities as they fall due whilst ensuring that financial covenants are maintained.
L E G A L & R E G U L ATO RY CO M P L I A N C E
Most providers of holiday and travel services operate across a number of economies and jurisdictions which therefore exposes them to a range of legal, tax and other regulatory laws which must be complied with.
As the TUI Group is the world’s leading tourism business operating from 31 source markets and providing holidays in 180 destinations, we are exposed to a range of laws and regulations with which we must comply or else risk incurring fines or other sanctions from regulatory bodies.
• As our business is spread across a number of source markets within the Tourism division there are some counter-cyclical features e. g. winter is a more important season for the Nordic and Canadian source markets. Some brands, such as the UK ski brand Crystal Ski, have a different seasonality profile which helps to temper the overall profile.
• The business produces regularly both short term and long term cash forecasts during the year which the Treasury team use to manage cash resources effectively.
• Existing credit facilities are considered to be more than sufficient for our requirements and provide ample headroom.
• We continue to maintain high-quality relationships with the Group’s key financiers and monitor compliance with the covenants contained within our financing facilities.
• Raising additional finance from the Capital Markets, should it be required, remains an option.
• Communication and strong tone from the top concerning compliance with laws and regulations.
• Legal Compliance Committee established to ensure appropriate over-sight, monitoring and action plans and to further drive the compliance culture across the Group.
• Embedded legal and tax expertise in all major businesses responsible for maintaining high quality relationships with the relevant regulators and authorities.
• Ongoing review conducted by the Group Legal Compliance team to centrally monitor compliance with regulations and provide expert advice to local teams on specific areas.
I N P U T CO ST V O L AT I L I T Y
A significant proportion of operating expenses are in non-local currency and / or relate to aircraft fuel which therefore exposes the business to changes in both exchange rates and fuel prices.
There is the risk that if we do not manage adequately the volatility of exchange rates, fuel prices and other input costs, then this could result in increased costs and lead to margin erosion, impacting on our ability to achieve profit targets.
There is also the risk that if our hedging policy is too rigid, we may find ourselves unable to respond to competitive pricing pressures during the season without it having a direct detrimental impact on our market position and / or profitability.
• Ensuring that the appropriate derivative financial instruments are used to provide hedging cover for the underlying transactions involving fuel and foreign currency.
• Maintaining an appropriate hedging policy to ensure that this hedging cover is taken out ahead of source market customer booking profiles. This provides a degree of certainty over input costs when planning pricing and capacity, whilst also allowing some flexibility in prices so as to be able to respond to competitive pressures if necessary.
• Tracking the foreign exchange and fuel markets to ensure the most up-to-date market intelligence and the ongoing appropriateness of our hedging policies.
• Detailed information on currency and fuel hedges can be found in Note Financial Instruments of the consolidated financial statements.

57Risk Report M A N A G E M E N T R E P O R T
N AT U R E O F R I S K M I T I G AT I N G F A C T O R S
H E A LT H & S A F E T Y
For all providers of holiday and travel services, ensuring the health and safety of customers is of paramount importance. This is especially so for TUI as we are the world’s leading tourism business selling holidays to over 20 million customers per annum.
There is the risk of accidents or incidents occurring causing illness, injury or death to customers or colleagues whilst on a TUI holiday. This could result in reputational damage to the business and / or financial liabilities through legal action being taken by the affected parties.
• Health and safety functions are established in all businesses in order to ensure there is appropriate focus on health and safety processes as part of the normal course of business.
• Ongoing monitoring is conducted by the Group Health & Safety function to ensure compliance with minimum standards.
• Appropriate insurance policies are in place for when incidents do occur.
S U P P LY C H A I N R I S K
Providers of holiday and travel services are exposed to the inherent risk of failure in their key suppliers, particularly hotels. This is further height-ened by the industry convention of paying in advance (“prepayment”) to secure a level of room allocation for the season.
There is the risk that we do not adequately manage our financial exposure should demand drop either for individual hotels and / or for the destina-tion in which the hotels are located and to which the tour operator still has a level of prepayment outstanding which could result in financial losses.
J O I N T V E N T U R E PA R T N E R S H I P S
It is common for tourism groups to use joint venture partnerships in some of their operations in order to reduce the risk of new ventures or to gain access to additional expertise. TUI has four significant joint ventures – Riu; TUI Cruises; Sunwing; TUI Russia & Ukraine.
There is the risk that if we do not maintain good relations with our key partners that the ventures’ objectives may not remain consistent with that of the Group which could lead to operational difficulties and jeopardise the achievement of financial targets.
• Owned and joint venture partner hotels form a substantial part of our programme which reduces our inherent risk in this area.
• Established and embedded a robust prepayment authorisation process to both limit the level of prepayments made and ensure that they are only paid to trusted, credit-worthy counterparties.
• Where prepayments are made to external hoteliers this is to secure access to unique and differentiated product for which demand is inherently higher and more resilient to external events than for commodity product.
• Prepayments are monitored on a timely and sufficiently granular basis to manage our financial exposure to justifiable levels.
• Good working relationships exist with all of our main joint venture partners and they are fully aligned with and committed to the growth strategy of TUI Group.

58 M A N A G E M E N T R E P O R T Risk Report
N AT U R E O F R I S K M I T I G AT I N G F A C T O R S
B R A N D C H A N G E
Our long term strategy is to migrate our many local tour operating brands in to one global brand, with the aim of strengthening and enhancing our competitive position, particularly in the online world. We are aiming to capitalise on the strength of the TUI brand on a global scale whilst ensuring we maintain local roots.
There is an inherent risk when executing such a large scale global brand strategy that we may not be able to maintain the benefits of local brand equity throughout the process and we recognise that such a large programme should take place with respect for the interests of all our stakeholders and existing contractual obligations.
If we do not successfully deliver against our strategy this could result in a decline in brand awareness and loyalty with associated decline in customer demand or it could impact on our ability to maximise on the opportunities facilitated by having one brand on a global scale.
• Undertaken detailed market research in each source market to assess current brand positioning and likely impact of the brand change
• Approved incremental marketing spend to raise the profile of the TUI brand locally in order to promote the benefits and to manage the expectations of our customers in relation to the future of our enhanced products and services
• Established a ‘One Brand’ programme team responsible for coordi-nating and monitoring the brand change activity across all source markets, with KPIs identified and tracked on a regular basis by both local and group colleagues and prompt corrective action taken to address issues as they arise
• Taking a phased and focussed approach to the brand change by imple-menting in one source market at a time. This minimises the risk at a given point in time and allows us to gain learnings from the source markets undergoing transition and implement those learnings in the next source market. Our first brand transition successfully occurred in the Netherlands in the current financial year 2015 / 16, with Nordics and Belgium source markets due to transition in financial year 2016 / 17.
• Communicating both internally & externally across multiple media channels to drive brand awareness, with further plans to increase awareness through consistent marketing in key destination airports and changing of the livery on our aircraft in order to support greater awareness of the TUI Brand
Actively managed principal risks – Strategic & emerging and business change
I T D E V E LO P M E N T & ST R AT E GY
Our focus is on enhancing customer experience by providing engaging, intuitive, seamless and continuous customer service through delivery of leading digital solutions, core platform capabilities, underlying technical infrastructure and IT services required to support the Group’s overall strategy for driving profitable top-line growth.
There is a risk that we fail to keep up with or outpace the market and evolving consumer preferences, we do not concentrate our activities on the correct areas for overall business success, do not address legacy inefficiencies and complexities of our existing infrastructure, do not en-sure continuity of service for critical IT systems and / or do not execute our strategy and developments in line with expectations.
If we are ineffective in our strategy or technology development this could impact on our ability to provide leading technology solutions in our markets thereby impacting on our competitiveness, our ability to provide a superior customer experience and associated impact on quality and operational efficiency. This would ultimately impact on our customer numbers, revenue and profitability.
• Developed and communicated (in conjunction with Executives, Busi-ness & IT Leadership Teams) the Group’s IT Strategy which is clearly aligned to our overall business objectives and considers external factors such as the pace of technology change and internal factors such as the underlying quality required throughout IT
• Continuing to implement our online platform in order to enhance customer experience and drive higher conversion rates
• Implementing a SAP-based central customer platform to collate all information on our customers across their journey to provide a single view of the customer alongside an eCRM platform which will support strategic marketing
• Placing increased focus on ensuring continuity plans for critical IT systems are in place and regularly tested
• Defined and implemented a programme and project management framework and software delivery lifecycle management methodolo-gies, including associated training and coaching
• Cascaded clear technology standards and associated delivery road-maps which are linked to Group wide and source market objectives

59Risk Report M A N A G E M E N T R E P O R T
N AT U R E O F R I S K M I T I G AT I N G F A C T O R S
G R O W T H ST R AT E GY
We have set ourselves a short-term target of achieving underlying EBITA CAGR of at least 10 % (see page 66). The achievement of this target is likely to require us to achieve growth in revenues of c. 3 % pa. Our focus is on achieving growth in accommodation by:
• opening new hotels;• growing our powerful and exclusive international hotel concepts;• continuing to expand the Cruise fleet
Additionally, we are looking to broaden our offering to customers by introducing extra flexibility into our packages, and to expand our long-haul offering by taking advantage of the capabilities of the Boeing 787 Dreamliners which we have and are due to receive via our order book. Note that availability of aircraft finance is a key assumption of our business model.
Whilst managing this expansion, we must continue to adapt to changes in consumer tastes and booking profiles, and we must continue to match our capacity to consumer demand. Asset utilisation – of aircraft, cruise ships and hotels – is critical to our financial success particularly when in a growth phase.
There is a risk that we could be unsuccessful in maximising opportunities to execute our expansion strategy. This could mean that we fail to achieve some of the initiatives we have embarked upon, which could result in us falling short against the overall growth targets we have set for the business.
• The Executive Board is very focussed on the strategy and mindful of the risks, so there is strong direction and commitment from the top.
• The Group Tourism Board plays an important role in co-ordinating, executing and monitoring the various growth initiatives.
• There are a number of initiatives underway to achieve growth which reduces the risk through diversification.
• Each of the business teams tasked with achieving an element of the growth strategy are still required to maintain sound financial discipline. The Group’s investment criteria and authorisation processes must still be adhered to as we are not prepared to be reckless in the pursuit of growth.
• We continue to maintain strong relationships with the providers of aircraft finance.
• Monitoring of overall market conditions continues to occur so that plans can be adapted or contingency plans invoked if required.
I N T E G R AT I O N & R E S T R U C T U R I N G O P P O R T U N I T I E S
Our key rationale for the merger of TUI AG and TUI Travel PLC was growth and delivery of significant synergies and to act ‘as one’ wherever it makes sense to do so, maintaining local differences where the benefit of that differentiation is greater than that of harmonisation.
There are a number of restructuring projects underway across the Group as a result to enable us to achieve these opportunities. There is an inherent risk with any large restructuring programme that we face challenges in managing the complexities associated with further integrat-ing our business, and reducing overlapping activities in order to develop a more lean and streamlined operating model.
Furthermore, the strategic review of the Group has identified businesses which would be better positioned outside of the TUI Group. One disposal (Hotelbeds Group) was successfully completed in the year, one disposal is underway (Travelopia) and further restructuring opportunities may present themselves in the future.
If we are not successful in leveraging and optimising the identified op-portunities this could have a significant impact on our ability to deliver the identified benefits in line with expectations and enhance shareholder value.
• Strong project management structures exist for all of the major re-structuring and disposal programmes which are underway to ensure that they are managed effectively.
• Project reporting tool ensures enhanced visibility of the progress of major projects as a matter of routine.
• Regular reporting by the major projects to the Executive Board to ensure swift resolution of any issues or to enhance co-ordination across the Group where required.

60 M A N A G E M E N T R E P O R T Risk Report
N AT U R E O F R I S K M I T I G AT I N G F A C T O R S
S U STA I N A B L E D E V E LO P M E N T
• Developed and launched in 2015 the ‘Better Holidays, Better World’ 2020 sustainability strategy framework which includes specific targets for key sustainability indicators
• Established a dedicated sustainability team to work closely with the business and other stakeholders to implement the sustainability strategy
• Operating the most carbon efficient airlines in Europe with continued investment in new, more efficient aircraft (e. g. Boeing 787 Dreamliner) and cruise ships
• Implemented an environmental management system with 5 of our airlines having achieved ISO 14001 certification
• Increased measures to influence accommodation suppliers to achieve third party sustainability certification recognised by the Global Sustainable Tourism Council (GSTC)
• TUI Care Foundation expanded to focus on the achievement of 2020 target for charitable donations and sustainability projects, with par-ticular emphasis on sustainable tourism, environmental protection and the welfare of children
Our focus is to reduce the environmental impact of our holidays, creating positive change for people and communities and being a pioneer of sus-tainable tourism across the world.
There is a risk that we are not successful in driving forecast environ-mental improvements across our operations, that our suppliers do not uphold our sustainability standards and we fail to influence destinations to manage tourism more sustainably.
If we do not maximise our positive impact on destinations and minimise the negative impact on the environment to the extent that our stake-holders expect, this could result in a decline in stakeholder confidence, reputational damage, reduction in demand for our products and services and loss of competitive advantage.
Furthermore, if TUI Group falls short of achieving its sustainable develop-ment targets and at the same time the objectives of the UN Paris Climate Change Agreement (December 2015) are not met, this could lead to sustained long-term damage to certain of the TUI Group’s current and future destinations, which could also have a material adverse effect on demand for our products and services.
I N F O R M AT I O N S E C U R I T Y
Our responsibility is to protect the confidentiality, integrity and availabil-ity of the data we have and the services we provide to our customers, our employees, our suppliers and service delivery teams.
There is a risk that our increasing dependence on online sales and cus-tomer care channels (web / mobile) increases our exposure and suscepti-bility to cyber-attacks and hacks.
If we do not ensure we have the appropriate level of security controls in place across the Group, this could have a significant negative impact on our key stakeholders, associated reputational damage and potential for financial implications.
• Renewed commitment from the Executive Board in support of key initiatives to ensure all existing and future IT systems are secure by design, that exposure to vulnerability is managed effectively, user access is sufficiently controlled and colleagues are made aware of information security risks through appropriate training
• Continuous review and testing of all external devices and ongoing monitoring of logs in order to identify any potential threats as and when they arise

61Risk Report M A N A G E M E N T R E P O R T
N AT U R E O F R I S K M I T I G AT I N G F A C T O R S
TA L E N T M A N A G E M E N T
Our success depends on the ability to attract and retain key talent and it relies on having good relations with colleagues.
There is a risk that we are unable to attract and retain key talent, build future leadership capability and maintain the commitment and trust of our employees. This risk is enhanced in periods of uncertainty and in areas of the business impacted by restructuring programmes.
As we approach the second anniversary of the merger which created TUI Group, our view is that we have successfully navigated our way through the initial period of post-merger concern with regards to retain-ing key talent. The heightened risk we perceived in this area has now gone back to normal “business as usual” levels.
If we face challenges in managing and maintaining our talent pipeline in order to deliver against our strategy, drive competitiveness and maximise on our operating performance, this could impact on our ability to future proof the Group and the associated potential for negative impact on shareholder confidence.
• Continuing to extend and embed our established talent management framework across the Group in order to engage and empower people whilst delivering results and managing performance
• Assessing our current organisational competence and capability against that required to maximise current and future shareholder value
• Ensuring succession plans are in place for all identified business critical roles, in particular emergency successors for all senior management roles, and that these plans are reviewed every six months
• Developed a structured and standard approach to be applied where necessary to key individuals during periods of uncertainty and / or organisational change in order to retain top talent in business critical roles
• Implemented a process to identify and deliver programmes targeted at high potential talent in order to drive competiveness and maximise operating performance
• Building our pipeline of leadership talent through our International Graduate Leadership Programme which attracts, develops and retains high quality graduates to become our future senior Commercial Leaders
• Driving high performance and engagement through our performance review, development plans and career planning process
CO R P O R AT E ST R E A M L I N I N G
The merger of TUI AG and TUI Travel PLC has presented us with the opportunity to reduce Corporate overheads by eliminating duplicate costs.
If we do not deliver the targeted savings of € 50 m this may impact on our ability to achieve our overall underlying EBITA growth target.
• Close monitoring of the delivery of corporate streamlining cost savings to ensure that they have been achieved in line with expectations.
• To date 80 % of the target savings had been achieved by the end of the current financial year, with the remainder set to be achieved during financial year 2016 / 17. The Integration Committee which has overseen the achievement of these savings met for the last time in September 2016.

62 M A N A G E M E N T R E P O R T Risk Report
R I S K S W I T H N O I M PAC T O N U N D E R LY I N G E B I TA
Impairment risk related to the investment in container shipping (Hapag- Lloyd AG). TUI Group continues to hold a substantial investment in the container shipping company, Hapag-Lloyd AG. Significant deterioration in the market value of the investment will require an impairment to be booked in the income statement of the TUI Group – as has occurred in the finan-cial year ended 30th September 2016. Whilst this risk has been reduced by the impairment already taken in the current and prior years, the value of the investment on our balance sheet is still material and therefore the risk continues to exist. We are committed to our plan to fully exit this investment in the medium term.
German trade tax risk.As noted in prior years, the German tax authorities have issued guidance on how certain items of expenditure should be treated for the purposes of German trade tax. The Group continues to disagree with the German tax authorities’ interpretation of this matter and it is possible that the issue will have to be litigated through the German tax courts which could take a considerable amount of time to bring it to a resolution. However due to a judgement from the fiscal court Munster on 4 Febru-ary 2016, a reassessment of the trade tax risk for the purchase of hotel accommodation was undertaken in the current financial year, resulting in a separately recognised tax expense of € 37 m in the income statement.
OV E R A L L R I S K A S S E S S M E N T
Destination disruption is an inherent risk to which all providers of holiday and travel services are exposed. This disruption can take place in many forms such as natural catastrophes, outbreaks of diseases, social unrest, terrorist attacks and the implications of war in countries close to our source markets and destinations. Whilst thankfully we did not directly experience a tragic event like the Tunisia incident of June 2015, incidents in various destinations (e. g. Sharm el-Sheikh in October 2015) continue to keep the risk of disruption in some North African destinations at a high level. Furthermore, general customer concerns over safety and security in eastern Mediterranean destinations (particularly Turkey) has led to a general decline in demand across all our source markets for these destinations. Due to our geographic reach, we have been able to respond to this shift in demand by remixing capacity away from North Africa and the eastern Mediterranean towards destinations customers are currently favouring such as Spain, Canary Islands, Cape Verde etc. Despite this current shift in demand, Turkey remains an important destination for our Group. Our general policy in respect of destinations remains to follow foreign office advice in each of our source markets relating to non-essential travel to specific destinations. It is noted that in January 2017 there will be an inquest in the UK into the Tunisia incident of June 2015 and we await any industry recommendations that may arise as a result.
One of the biggest events in 2015 / 16 which has the potential to signifi-cantly alter the risk landscape of the Group is the UK referendum at the end of June which resulted in a vote for the UK to leave the EU (“Brexit”). The exchange rate volatility seen earlier in the year has continued as a result, which has an immediate impact on the translation of the sterling results from our UK business into euros, the reporting currency of the
Group. The depreciation of sterling against the euro means that each £ of profit translates into a smaller euro value. The outcome of the referen-dum has led to a greater degree of uncertainty over the future economic performance of the UK economy. Whilst we have not seen any apparent slow-down in bookings in our UK business to date, there is a greater potential for this to occur in the medium term. Therefore for both of these reasons we see our macroeconomic risk as having increased compared to this time last year, although the strength and differentiation of our customer offering means that we are well positioned to deal with the changing macroeconomic environment. The depreciation of sterling also has a cost impact through making foreign denominated input costs in the UK business more expensive in sterling terms. Whilst the standard hedging policy we follow means that for the 2015 / 16 financial year the UK business was largely immune to these cost pressures, the risk crystallises to a greater extent in 2016 / 17, as S17 was partially hedged (c. 40 %) at the time of the referendum, if sterling stays at current levels. Normal business practice is to increase holiday prices to offset these higher input costs and protect margins, however competitive pressures may prevent prices from rising to the full extent required. The other immediate impact of the Brexit vote has been the reduction in UK interest rates and therefore discount factors applied to UK pension liabilities, which has resulted in a significant increase in the pension liability at the year-end. Whilst this does not of itself present a risk at the moment, it may do so when the next actuarial valuation is performed on the UK pension scheme if it then leads to a requirement to make higher cash pension contributions over a sustained period of time. Please see note Pension provisions and similar obligations of the financial statements for further details on the pension deficit.
The Group has created a Brexit Steering Committee to monitor devel-opments as the political negotiations take place concerning the specifics of the terms of the UK exit from and future trading relationship with the EU and how this may affect the TUI Group’s business model. At this stage it is too early to assess whether there will be any impact on areas such as flying rights, customer visa requirements or employee contracts and therefore we view Brexit as being an emerging risk around which more clarity will be gained in the future once Article 50 is triggered by the UK government and exit negotiations begin.
The completion in December 2014 of the merger between TUI AG and TUI Travel PLC has had an impact on our risk landscape by opening up new business opportunities but also introducing new risks in the pursuit of those opportunities (e. g. brand change) and in the context of the delivery of specific merger synergies. We are pleased that the post- merger integration of the Group has progressed well and at a faster pace than originally anticipated. We are on track to deliver our specific merger synergy targets, integration-related restructuring programmes are ongoing as expected, and we have successfully navigated our way through the initial period of post-merger concern with regards to retain-ing key talent. We therefore perceive these risks to be at a lower level than they were 12 months ago.
In the course of the restructuring of our tourism activities, we have completed the disposal in September 2016 of Hotelbeds Group and commenced the marketing of Travelopia (formerly part of Specialist
63Risk Report M A N A G E M E N T R E P O R T
Group). Such large disposal transactions have inherent risks associated with them due to the amount of management time they require to bring them to a successful conclusion, combined with continuing obligations and customary representation and warranties.
Finally, the risk of a deterioration in the valuation of our container ship-ping investment crystallised again during the year and a further impair-ment has been taken. Whilst this has therefore reduced the risk for future periods, the value of the investment on our balance sheet is still material and therefore the risk continues to exist.
Other than the items noted above, the Executive Board is of the opinion that there has been no other significant change to the risk landscape of the Group.
V I A B I L I T Y S TAT E M E N T
In accordance with provision C2.2 of the 2014 revision of the UK Corporate Governance Code, the Executive Board has assessed the prospect of the Company over a longer period than the 12 months required by the ‘Going Concern’ provision. The Executive Board considers annually and on a rolling-basis a three year strategic plan for the business as outlined earlier in the “Strategic direction and risk appetite” section. The latest three year plan was approved in October 2016 and covers the period to 30th September 2019. A three year horizon is considered appropriate for a fast-moving competitive environment such as tourism, and it is noted that the Group’s current € 1,535.0 m revolving credit facility, which is used to manage the seasonality of the Group’s cash flows and liquidity, matures in December 2020 which is beyond the timeframe of the three year horizon. The three year plan considers cash flows as well as the financial covenants which the credit facility requires compliance with. A key assumption underpinning the three year plan and the associated cash flow forecast is that aircraft and cruise ship finance will continue to be readily available.
The Executive Board has conducted a robust assessment of the princi-pal risks facing the company, including those that would threaten its business model, future performance, solvency or liquidity. Sensitivity analysis is applied to the cash flow to model the potential effects should certain principal risks actually occur, individually or in unison. This in-cludes modelling the effects on the cash flow of significant disruption to a major destination in the summer season.
Taking account of the company’s current position, principal risks and the aforementioned sensitivity analysis, the Executive Board has a rea-sonable expectation that the company will be able to continue in oper-ation and meet its liabilities as they fall due over the three year period of the assessment.
Key features of the internal control and risk manage-ment system in relation to the Group accounting pro-cess (sections 289 (5) and 315 (2) no 5 of the German Commercial Code HGB)
1. D E F I N I T I O N A N D E L E M E N T S O F T H E I N T E R N A L CO N T R O L
A N D R I S K M A N AG E M E N T S Y S T E M I N T H E T U I G R O U P
The TUI Group’s internal control system comprises all the principles, processes and measures that are applied to secure effective, efficient and accurate accounting which is compliant with the necessary legal requirements.
In the completed financial year, the TUI Group’s existing internal control system was further developed, drawing on the internationally recognised framework of COSO (Committee of Sponsoring Organizations of the Treadway Commission), which forms the conceptual basis for the internal control system.
The TUI Group’s internal control system consists of internal controls and the internal monitoring system. The Executive Board of TUI AG, in exercising its function of managing business operations, has entrusted responsibility for the internal control system in the TUI Group to specific Group functions.
The elements of the internal monitoring system in the TUI Group com-prise both measures integrated into processes and measures per-formed independently. Besides manual process controls, e. g. the “four-eyes principle”, another key element of the process-related measures are automated IT process controls. Process-related monitoring is also secured by bodies such as the Risk Oversight Committee of TUI AG and by specific Group functions.
The Supervisory Board of TUI AG, in particular its Audit Committee, as well as the Group Auditing department at TUI AG and the decentralized audit departments within Group companies, are incorporated into the TUI Group’s internal monitoring system through their audit activities performed independently from business processes. On the basis of section 107 (3) of the German Stock Corporation Act, the Audit Com-mittee of TUI AG deals primarily with the auditing of the annual financial statements, monitoring the accounting process and the effectiveness of the internal control and risk management system.
The Group’s auditors have oversight of the TUI Group’s control environ-ment through their non-process-related activities. The audit of the con-solidated financial statements by the Group auditor and the audit of the individual financial statements of Group companies included in the con-solidated financial statements, in particular, constitute a key non-pro-cess-related monitoring measure with regard to Group accounting.

64 M A N A G E M E N T R E P O R T Risk Report
In relation to Group accounting, the risk management system, intro-duced as an Enterprise Risk Management System (ERM System) as a component of the internal control system, also addresses the risk of misstatements in Group bookkeeping and external reporting. Apart from operational risk management, which includes the transfer of risks to insurance companies by creating cover for damage and liability risks and also hedging transactions to limit foreign currency and fuel price risks, the TUI Group’s risk management system embraces the systemat-ic early detection, management and monitoring of risks across the Group. A more detailed explanation of the risk management system is provided in the section on the Risk Governance Framework in the Risk Report.
2 . U S E O F I T S Y S T E M S
Bookkeeping transactions are captured in the individual financial state-ments of the subsidiaries of TUI AG, through local accounting systems such as SAP or Oracle. As part of the process of preparing their individ-ual financial statements, subsidiaries complete standardized reporting packages in the Group’s Oracle Hyperion Financial Management 11.1.2.3 (HFM) reporting system. HFM is used as the uniform reporting and con-solidation system throughout the Group so that no additional interfaces exist for the preparation of the consolidated financial statements.
All consolidation processes used to prepare the consolidated financial statements of TUI AG, e. g. capital consolidation, assets and liabilities consolidation and expenses and income elimination including at equity measurement, are generated and fully documented in HFM. All elements of TUI AG’s consolidated financial statements, including the disclosures in the Notes, are developed from the HFM consolidation system. HFM also provides various modules for evaluation purposes in order to prepare complementary information to explain TUI AG’s consolidated financial statements.
The HFM reporting and consolidation system has an in-built workflow process whereby when businesses promote their data within the sys-tem, to signal that their reporting package is complete, they are then locked out from making any further changes to that data. This ensures data integrity within the system and also facilitates a strong audit trail enabling changes to a reporting package to be identified. This feature of the HFM system has been checked and validated by the TUI AG Group Audit department on several occasions since the system was intro-duced.
At their own discretion, TUI AG’s Group auditors select certain individual financial statements from the financial statements entered in the HFM reporting and consolidation system by the Group companies, which are then reviewed for the purposes of auditing the consolidated financial statements.
3 . S P E C I F I C R I S K S R E L AT E D TO G R O U P ACCO U N T I N G
Specific risks related to Group accounting may arise, for example, from unusual or complex business transactions, in particular at critical times towards the end of the financial year. Business transactions not routinely processed also entail special risks. The discretion necessarily granted to employees for the recognition and measurement of assets and liabilities may result in further Group accounting-related risks. The outsourcing and transfer of accounting-specific tasks to service companies may also give rise to specific risks. Accounting-related risks from derivative financial instruments are outlined in the Notes to the consolidated financial statements.
4 . K E Y R E G U L AT I O N A N D CO N T R O L AC T I V I T I E S TO E N S U R E
P R O P E R A N D R E L I A B L E G R O U P ACCO U N T I N G
The internal control measures aimed at securing proper and reliable Group accounting ensure that business transactions are fully recorded in a timely manner in accordance with legal requirements and the Articles of Association. This also ensures that assets and liabilities are properly recognised, measured and presented in the consolidated financial statements. The control operations also ensure that bookkeeping re-cords provide reliable and comprehensive information.
Controls implemented to secure proper and reliable accounting include, for instance, analysis of facts and developments on the basis of specific indicators. Separation of administrative, execution, settlement and authorisation functions and the implementation of these functions by different persons reduces the potential for fraudulent operations. Or-ganisational measures also aim to capture any corporate or Group-wide restructuring or changes in sector business operations rapidly and ap-propriately in Group accounting. They also ensure, for instance, that bookkeeping transactions are correctly recognised in the period in which they occur in the event of changes in the IT systems used by the accounting departments of Group companies. The internal control system likewise ensures that changes in the TUI Group’s economic or legal environment are mapped and that new or amended accounting standards are correctly applied.

65Risk Report M A N A G E M E N T R E P O R T
The TUI Group’s accounting policies together with the International Financial Reporting Standards (IFRS) in compliance with EU legislation, govern the uniform accounting and measurement principles for the German and foreign companies included in TUI’s consolidated financial statements. They include general accounting principles and methods, policies concerning the statement of financial position, income state-ment, notes, management report, cash flow statement and segment reporting.
The TUI Group’s accounting policies also govern specific formal require-ments for the consolidated financial statements. Besides defining the group of consolidated companies, they include detailed guidance on the reporting of financial information by those companies via the group re-porting system HFM on a monthly, quarterly and year end basis. TUI’s accounting policies also include, for instance, specific instructions on the initiating, reconciling, accounting for and settlement of transactions between group companies or determination of the fair value of certain assets, especially goodwill.
At Group level, specific controls to ensure proper and reliable Group accounting include the analysis and, where necessary, correction of the individual financial statements submitted by the Group companies, taking account of the reports prepared by the auditors and meetings to discuss the financial statements which involve both the auditors and local management. Any further content that requires adjusting can be isolated and processed downstream.
The control mechanisms already established in the HFM consolidation system minimize the risk of processing erroneous financial statements. Certain parameters are determined at Group level and have to be ap-plied by group companies. This includes parameters applicable to the measurement of pension provisions or other provisions and the interest rates to be applied when cash flow models are used to calculate the fair value of certain assets. The central implementation of impairment tests for goodwill recognized in the financial statements secures the applica-tion of uniform and standardized evaluation criteria.
5 . D I S C L A I M E R
With the organisational, control and monitoring structures established by the TUI Group, the internal control and risk management system enables company-specific facts to be captured, processed and recog-nised in full and properly presented in the Group’s accounts.
However, it lies in the very nature of the matter that discretionary decision- making, faulty checks, criminal acts and other circumstances, in particular, cannot be ruled out and will restrict the efficiency and reliability of the internal control and risk management systems, so that even Group-wide application of the systems cannot guarantee with absolute certainty the accurate, complete and timely recording of facts in the Group’s accounts.
Any statements made relate exclusively to subsidiaries according to IFRS 10 included in TUI AG’s consolidated financial statements.

66 M A N A G E M E N T R E P O R T Overall assessment by the Executive Board and Report on expected development
O V E R A L L A S S E S S M E N T B Y T H E E X E C U T I V E B O A R D A N D R E P O R T O N E X P E C T E D D E V E LO P M E N T
Comparison of actual business performance 2015 / 16 with the forecast
In the second post-merger financial year, TUI Group’s performance again exceeded our original forecast, despite a challenging geopolitical framework. TUI Group’s underlying EBITA rose by 5.0 % to € 1,000.5 m in financial year 2015 / 16. Excluding the negative foreign exchange effects in-cluded in these earnings due to the decline of sterling against the euro in the period under review, this corresponds to an improvement of 14.5 %. We have thus outperformed our guidance of achieving an increase in our operating result of at least 10 % on a constant currency basis.
Due to the sound operating performance and lower net one-off charges, the Group also achieved an increase in its reported EBITA, which grew by 13.0 % to € 898.1 m.
Brand turnover and TUI Group turnover grew less than expected, but delivered growth of 2.3 % and 1.4 % respectively on the prior year on a constant currency basis.
At € 691.0 m, the Group’s net capital expenditure on property, plant and equipment and financial investments fell slightly short of the target of € 750.0 m. These amounts include the investments and capital expend-iture of Hotelbeds Group and Specialist Group, which were sold in the period under review. The net debt of € 31.8 m carried at the end of financial year 2015 / 16 also reflected the broadly neutral net finance position for TUI Group we had expected after the agreement to sell Hotelbeds Group.
Expected changes in the economic framework
E X P E C T E D D E V E L O P M E N T O F G R O S S D O M E S T I C P R O D U C T
Var. % 2017 2016
World + 3.4 + 3.1
Eurozone + 1.5 + 1.7
Germany + 1.4 + 1.7
France + 1.3 + 1.3
UK + 1.1 + 1.8
US + 2.2 + 1.6
Russia + 1.1 – 0.8
Japan + 0.6 + 0.5
China + 6.2 + 6.6
India + 7.6 + 7.6
Source: International Monetary Fund (IMF), World Economic Outlook, October 2016
M AC R O E CO N O M I C S I T UAT I O N
The International Monetary Fund (IMF, World Economic Outlook, Octo-ber 2016) expects gross domestic product to grow 3.1 % in calendar year 2016, as economic momentum has declined in the developed econo-mies following the UK vote to exit the European Union and growth in the United States has been weaker than expected. For 2017, the IMF expects the global economy to grow by 3.4 %. The experts believe the economy will gain some momentum again due to several factors, including an in-crease in investments and a better outlook for the emerging markets.
M A R K E T T R E N D I N TO U R I S M
UNWTO expects international tourism to continue growing globally in this decade. For the next few years, average weighted growth of around 3 % per annum has been forecast (source: UNWTO, Tourism Highlights, 2016 edition). In the first six months of 2016, international arrivals grew by 4.0 %. UNWTO expects growth of 3.5 % to 4.5 % for calendar year 2016 (source: UNWTO, World Tourism Barometer, September 2016).
E F F E C T S O N T U I G R O U P
As a leading provider of tourism services, TUI Group depends on the development of consumer demand in the large source markets in which we operate with our tour operator and hotel brands. Our budget is based on the assumptions used as a basis by the IMF to predict the future development of the global economy.

67Overall assessment by the Executive Board and Report on expected development M A N A G E M E N T R E P O R T
Apart from the development of consumer sentiment, political stability in the destinations is a further crucial factor affecting demand for holiday products. In our view, our business model is sufficiently flexible to com-pensate for the currently identifiable challenges.
The expected turnover growth assumed for our tour operators in our budget for financial year 2016 / 17 is in line with UNWTO’s long-term forecast. Our strategic focus is to create unified branding in our source markets, broaden our portfolio of Group-owned hotels and expand our cruise business.
Expected development of Group turnover and earnings
T U I G R O U P
The translation of the income statements of foreign subsidiaries in our consolidated financial statements is based on average monthly exchange rates. TUI Group generates a considerable proportion of consolidated turnover and large earnings and cash flow contributions in non-euro currencies, in particular GBP, USD and SEK. Taking account of the sea-sonality in tourism, the development of these currencies against the euro in the course of the year therefore strongly impacts the financial indi-cators carried in TUI Group’s consolidated financial statements. The comments on the expected development of our Group in financial year 2016 / 17 provided below are based on the assumption of constant currencies for the completed financial year 2015 / 16.
E X P E C T E D D E V E L O P M E N T O F G R O U P T U R N O V E R , U N D E R LY I N G
E B I TA A N D A D J U S T M E N T S
Expected Development vs. PY
€ million 2015 / 16 2016 / 17*
Turnover 17,185 around 3 % growth
Underlying EBITA 1,001 at least 10 % growth
Adjustments 103 approx. € 80 m cost
* Variance year-on-year assuming constant foreign exchange rates are applied to the result in the current and prior period and based on the current group structure; guidance relates to continuing operations and excludes any disposal proceeds for Travelopia and Hapag-Lloyd AG.
T U R N OV E R
We expect turnover to grow by around 3 % in financial year 2016 / 17 on a constant currency basis, primarily due to an expected increase in customer numbers and higher average prices for our large tour operators, driven by the delivery of our growth roadmap.
U N D E R LY I N G E B I TA
TUI Group’s underlying EBITA in financial year 2016 / 17 is expected to grow by at least 10 % at constant currency as we deliver our growth roadmap. Risks relate to the development of customer numbers against the backdrop of continued volatility in the economic environment in our key source markets, demand for Group-owned hotels and cruise ships and the delivery of all merger synergies.
See Goals and Strategy section from page 28
See Risk Report from page 49
A DJ U S T M E N T S
For financial year 2016 / 17, we expect purchase price allocations and net one-off costs of around € 80 m, to be carried as adjustments.
R O I C A N D E CO N O M I C VA L U E A D D E D
Due to the enhanced operating result, we expect ROIC to improve slightly in financial year 2016 / 17; depending on the development of TUI Group’s capital costs, this is also expected to result in an increase in economic value added.
D E V E L O P M E N T I N T H E S E G M E N T S
The expected development outlined below is based on current trading, our growth roadmap and the relative performance of our segments during financial year 2015 / 16. Future development depends on demand in our source markets and customer segments and on input cost curves. In our view, the benefit of our diversified business model is that devel-opments in individual segments can be offset by opposite trends in other segments.
S O U R C E M A R K E T S
Based on current trading and assuming constant currency exchange rates, we would expect the source markets to deliver at least 10 % underlying earnings growth at constant currency. Besides a continuous good devel-opment in UK and a further improvement in Nordics we expect and in-crease of our tour operating result in France which should also benefit from the recent Transat acquisition. In addition, Germany should benefit from efficiency measures.
H O T E L S & R E S O R T S
We expect that the result improvement following the delivery of our growth strategy should more than offset the non-recurring gain on disposal of a Riu hotel in the past financial year. Taking into account the non-recurring gain on disposal of a Riu hotel in financial year 2015 / 16 we expect growth in Hotels & Resorts above our Group underlying EBITA guidance of at least 10 %.
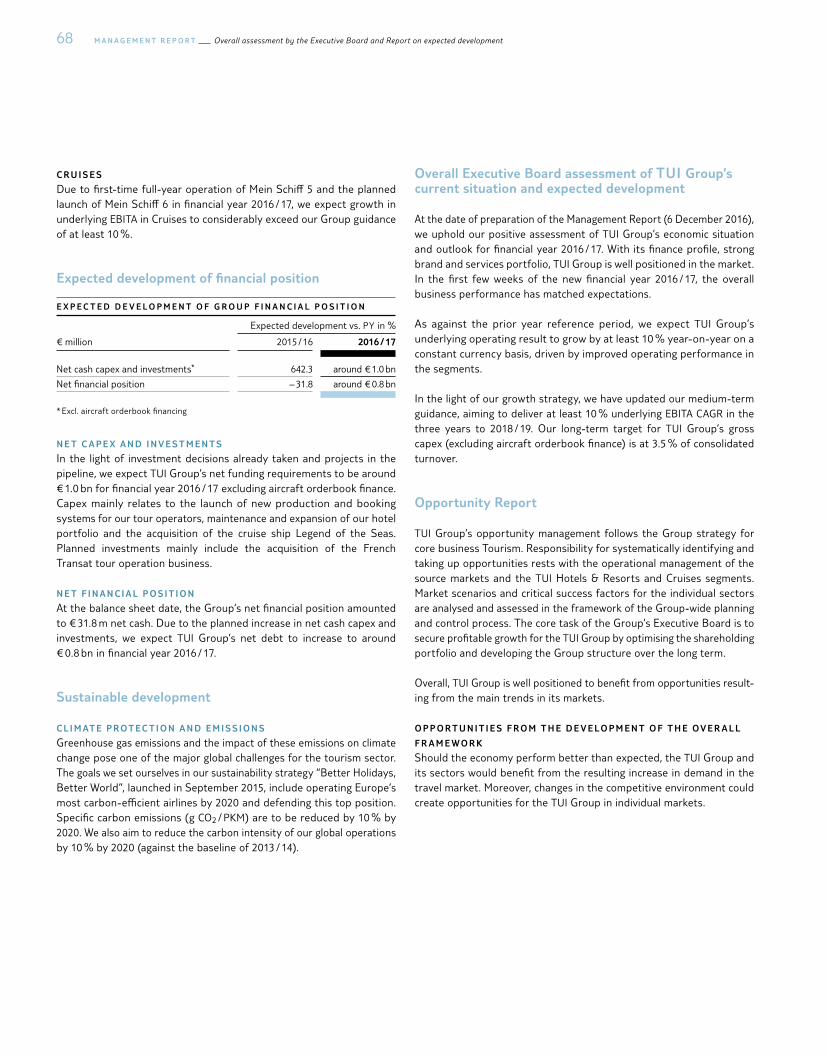
68 M A N A G E M E N T R E P O R T Overall assessment by the Executive Board and Report on expected development
C R U I S E S
Due to first-time full-year operation of Mein Schiff 5 and the planned launch of Mein Schiff 6 in financial year 2016 / 17, we expect growth in underlying EBITA in Cruises to considerably exceed our Group guidance of at least 10 %.
Expected development of financial position
E X P E C T E D D E V E L O P M E N T O F G R O U P F I N A N C I A L P O S I T I O N
Expected development vs. PY in %
€ million 2015 / 16 2016 / 17
Net cash capex and investments* 642.3 around € 1.0 bn
Net financial position – 31.8 around € 0.8 bn
* Excl. aircraft orderbook financing
N E T C A P E X A N D I N V E S T M E N T S
In the light of investment decisions already taken and projects in the pipeline, we expect TUI Group’s net funding requirements to be around € 1.0 bn for financial year 2016 / 17 excluding aircraft orderbook finance. Capex mainly relates to the launch of new production and booking systems for our tour operators, maintenance and expansion of our hotel portfolio and the acquisition of the cruise ship Legend of the Seas. Planned investments mainly include the acquisition of the French Transat tour operation business.
N E T F I N A N C I A L P O S I T I O N
At the balance sheet date, the Group’s net financial position amounted to € 31.8 m net cash. Due to the planned increase in net cash capex and investments, we expect TUI Group’s net debt to increase to around € 0.8 bn in financial year 2016 / 17.
Sustainable development
C L I M AT E P R O T E C T I O N A N D E M I S S I O N S
Greenhouse gas emissions and the impact of these emissions on climate change pose one of the major global challenges for the tourism sector. The goals we set ourselves in our sustainability strategy “Better Holidays, Better World”, launched in September 2015, include operating Europe’s most carbon-efficient airlines by 2020 and defending this top position. Specific carbon emissions (g CO2 / PKM) are to be reduced by 10 % by 2020. We also aim to reduce the carbon intensity of our global operations by 10 % by 2020 (against the baseline of 2013 / 14).
Overall Executive Board assessment of TUI Group’s current situation and expected development
At the date of preparation of the Management Report (6 December 2016), we uphold our positive assessment of TUI Group’s economic situation and outlook for financial year 2016 / 17. With its finance profile, strong brand and services portfolio, TUI Group is well positioned in the market. In the first few weeks of the new financial year 2016 / 17, the overall business performance has matched expectations.
As against the prior year reference period, we expect TUI Group’s underlying operating result to grow by at least 10 % year-on-year on a constant currency basis, driven by improved operating performance in the segments.
In the light of our growth strategy, we have updated our medium-term guidance, aiming to deliver at least 10 % underlying EBITA CAGR in the three years to 2018 / 19. Our long-term target for TUI Group’s gross capex (excluding aircraft orderbook finance) is at 3.5 % of consolidated turnover.
Opportunity Report
TUI Group’s opportunity management follows the Group strategy for core business Tourism. Responsibility for systematically identifying and taking up opportunities rests with the operational management of the source markets and the TUI Hotels & Resorts and Cruises segments. Market scenarios and critical success factors for the individual sectors are analysed and assessed in the framework of the Group-wide planning and control process. The core task of the Group’s Executive Board is to secure profitable growth for the TUI Group by optimising the shareholding portfolio and developing the Group structure over the long term.
Overall, TUI Group is well positioned to benefit from opportunities result-ing from the main trends in its markets.
O P P O R T U N I T I E S F R O M T H E D E V E L O P M E N T O F T H E OV E R A L L
F R A M E W O R K
Should the economy perform better than expected, the TUI Group and its sectors would benefit from the resulting increase in demand in the travel market. Moreover, changes in the competitive environment could create opportunities for the TUI Group in individual markets.
69Overall assessment by the Executive Board and Report on expected development M A N A G E M E N T R E P O R T
CO R P O R AT E S T R AT E G Y
We see opportunities for further organic growth in particular by ex-panding our hotel portfolio and cruise business. As market leader, we also intend to benefit in the long term from demographic change and the resulting expected increase in demand for high-quality travel at an attractive price / performance ratio.
O P E R AT I O N A L O P P O R T U N I T I E S
We intend to improve our competitive position further by offering unique product and further expanding controlled distribution in the source
markets, in particular online distribution. We also see operational opportunities arising from stronger integration of our content and tour operation business.
O T H E R O P P O R T U N I T I E S
We also regard a potential sale of Specialist Group and our remaining stake in container shipping as an opportunity to further improve TUI Group’s key financial ratios.

70 M A N A G E M E N T R E P O R T Business Review
B U S I N E S S R E V I E W
Macroeconomic industry and market framework
Macroeconomic development
D E V E L O P M E N T O F G R O S S D O M E S T I C P R O D U C T
Var. % 2016 2015
World + 3.1 + 3.2
Eurozone + 1.7 + 2.0
Germany + 1.7 + 1.5
France + 1.3 + 1.3
UK + 1.8 + 2.2
US + 1.6 + 2.6
Russia – 0.8 – 3.7
Japan + 0.5 + 0.5
China + 6.6 + 6.9
India + 7.6 + 7.6
Source: International Monetary Fund (IMF), World Economic Outlook, September 2016
In calendar year 2016, the global economy continued to grow moderately. In its most recent outlook (IMF, World Economic Outlook, October 2016), the International Monetary Fund forecasts growth of 3.1 % for 2016, which is less than the previous year. With Britain voting to leave the European Union and growth in the United States weaker than expected, the experts expect economic momentum in the advanced economies to decline overall.
Key exchange rates and commodity prices
The exchange rate charts are presented on the basis of the indirect quotation format customary in the foreign exchange market. If the exchange rate falls, the foreign currency is appreciating against the euro. By contrast, if the exchange rate rises, the foreign currency is depreciating against the euro.
TUI Group companies operate on a worldwide scale. This presents financial risks for TUI Group, arising from changes in exchange rates and commodity prices.
The essential financial transaction risks from operations relate to euros and US dollars. They mainly result from foreign exchange items in the individual Group companies, for instance aircraft fuel and bunker oil
E X C H A N G E R AT E U S D O L L A R
$ / €
2014/15 2015/16
1.40
1.30
1.20
1.10
E X C H A N G E R AT E S T E R L I N G
£ / €
2014/15 2015/16
0.90
0.80
0.70
O I L P R I C E
Brent ($ / Barrel)
2014/15 2015/16
100
80
60
40

71Business Review M A N A G E M E N T R E P O R T
invoices, ship handling costs or products and services sourced by hotels. The parity of sterling against the euro is of relevance for the translation of results generated in the UK market in TUI’s consolidated financial statements.
Following the UK referendum at the end of June 2016, which resulted in a vote for Brexit, the currency fluctuations already described in our Half-Year Financial Report 2015 / 16 continued. They impacted the translation of results from our UK business. Thanks to our consistent hedging policy, input costs in foreign currencies incurred for our UK business in financial year 2015 / 16 remained largely unaffected by the weakness of sterling. Although the Brexit vote has caused growing uncertainty about the future performance of the UK economy there is no apparent decline in bookings in our UK business to date.
In financial year 2015 / 16, the average exchange rate of the US dollar against the euro rose by around 3.5 % from 1.15 $ / € to 1.11 $ / €. The average exchange rate of sterling against the euro fell by around 16.2 % from 0.74 £ / € to 0.86 £ / € in the period under review. Sterling significantly depreciated against the euro, especially after the UK’s Brexit decision.
Changes in commodity prices affect TUI Group, in particular when pro-curing fuels such as aircraft fuel and bunker oil. Following relatively moderate fluctuations, the price of Brent oil stood at $ 49.06 per barrel as at 30 September 2016, which all in all reflects the low level recorded at the beginning of the financial year.
In Tourism, most risks relating to changes in exchange rates and price risks from fuel sourcing are hedged by derivatives. Information on hedging strategies and risk management as well as financial transactions and the scope of such transactions at the balance sheet date is provided in the sections Financial Position and Risk Report in the Management Report and the section Financial Instruments in the Notes to the consolidated financial statements.
Financial Position see page 87, Risk Report see page 56, Notes see page 170
Market environment and competition in tourism
Since the merger between TUI AG and TUI Travel PLC in December 2014, TUI Group has been the world’s number one leisure tourism business. The development of the international leisure tourism market impacts all businesses of TUI Group.
TO U R I S M CO N T I N U E S G L O B A L G R O W T H
According to the United Nations World Tourism Organization (UNWTO), tourism comprises the activities of persons travelling to and staying in places outside their usual environment for not more than one consecutive year for leisure, business and other purposes. The key tourism indicators to measure market size are the number of international tourist arrivals, and international tourism receipts. With international tourism receipts amounting to $ 1,260 bn and international arrivals amounting to 1.2 m in 2015, the tourism industry is one of the most important sectors in the world economy. International tourist arrivals worldwide are expected to increase by around 3 % a year between 2010 and 2030, reaching 1.8 bn per annum by 2030 (UNWTO Tourism Highlights 2016).
C H A N G E O F I N T E R N AT I O N A L T O U R I S T A R R I V A L S V S . P R I O R Y E A R
Var. % 2016* 2015
World + 4.0 + 4.6
Europe + 2.6 + 4.7
Asia and the Pacific + 8.8 + 5.6
Americas + 4.2 + 5.9
Africa + 5.4 – 3.1
Middle East – 8.6 + 1.7
Source: UNWTO World Tourism Barometer, September 2016 * Period January till June
In calendar year 2015, international tourist arrivals grew by 4.6 % world-wide to 1.19 bn. This trend continued in the first half of calendar year 2016 at a growth rate of 4.0 %. Travel for leisure, recreation and holidays accounted for 53 %, i.e. just over half of all international tourist arrivals (UNWTO, Tourism Highlights, 2016 Edition).
At minus 0.7 %, TUI Group customer numbers did not match this growth trend in financial year 2015 / 16; strong growth in customer numbers in the UK and the Netherlands was offset by the impact of lower demand for Turkey and as a result of other geopolitical events.
Business performance in the source markets see page 79
Europe remained the largest and most mature tourism market in the world, accounting for 51 % of international tourist arrivals and 36 % of receipts in 2015. Five European countries (France, Spain, Italy, Germany and the United Kingdom) figured in the top ten international tourism destinations in 2015. Our three main source markets UK, Germany and France were in the top five of all source markets worldwide measured by international tourism expenditure.

72 M A N A G E M E N T R E P O R T Business Review
Source: UNWTO, Tourism Highlights, 2016 Edition
Germany continues to be the third largest source market in the world with international tourism expenditure of approximately $ 77.5 bn in 2015, after China (approximately $ 292.2 bn) and the US (approximately $ 112.9 bn). In terms of expenditure per capita, Germany ranks second globally, with approximately $ 946 spent by the average German tourist in 2015 (Source: UNWTO, Tourism Highlights, 2016 Edition). Key opera-tors in the German tourism market are TUI Deutschland, Thomas Cook, DER Touristik, FTI and Alltours (FVW, Dossier, Deutsche Veranstalter, December 2015).
The United Kingdom is the fourth largest source market in the world, with approximately $ 63.3 bn spent on tourism activities in 2015 and on average $ 972 spent per capita over the same period (source: UNWTO, Tourism Highlights, 2016 Edition), the highest amount worldwide. The British tourism market is characterised by a high degree of concentration around two key operators TUI Group and Thomas Cook (Euromonitor, Intermediaries in the United Kingdom, August 2016).
France was the fifth largest source market in 2015, with international tourism expenditure of approximately $ 38.4 bn (source: UNWTO, Tourism Highlights, 2015 Edition). With its main tour operator brands Nouvelles Frontières and Marmara, TUI has a strong position in the French tourism market, which has been highly fragmented in the past but has under-gone consolidation in recent months. TUI France will continue to expand its market position with the purchase of the French tour operator in the tourism group Transat completed in October 2016. The merger is to enable TUI France to achieve robust profitability. In 2015, France was the largest destination market in the world with 84.5 million arrivals.
H O T E L M A R K E T
The total worldwide hotel market for business and leisure travel was worth € 440 bn in 2015. By 2020, average annual growth (CAGR) is expected to amount to 3.1 % (Euromonitor; September 2016). The hotel market is divided between business and leisure travel. A number of characteristics differentiate leisure travel hotels from business hotels, including longer average lengths of stay for guests in leisure hotels. Locations, amenities
451
608
418279
304193
33
53
5354
Europe
Asia and the Pacific
AmericasMiddle East
Africa
1,260
1,186World
I N T E R N AT I O N A L T O U R I S T A R R I V A L S A N D R E C E I P T S B Y S O U R C E
international tourism receipts (in bn $) international tourist arrivals (in million)

73Business Review M A N A G E M E N T R E P O R T
and service requirements also differ. From a demand perspective, the leisure hotel market in Europe is divided into several smaller submarkets which cater to the individual needs and demands of tourists. These sub-markets include premium, comfort, budget, family / apartment, and club- or resort-style hotels. Hotel companies may offer a variety of hotels for different submarkets, often defined by price range, star ratings, exclu-sivity, or available facilities.
Consumers in our three main source markets prefer the following des-tinations: the most popular leisure hotel destinations for consumers in source market Germany are Spain, Italy, Turkey, Austria, France, Croatia, Greece and the Netherlands. The most popular leisure hotel destinations for consumers in source market United Kingdom are Spain, France, Italy, the United States, Portugal, Greece and Turkey. The most popular leisure hotel destinations for consumers in source market France are Spain, Italy, the United Kingdom, Belgium and Luxembourg (Mintel, European Leisure Travel Industry, September 2015).
Hotel operations can generally be divided into the following models: asset owners whose primary business is to own real estate assets; brand owners and operators who typically manage hotel assets themselves or enter into franchising arrangements with independent operators who, in turn, manage the hotel property assets; and independent operators combining the roles of asset owners, brand owners and operators by managing diverse assets under different brands, often through franchise agreements.
The upper end of the leisure hotel market is characterised by a high degree of sophistication and specialisation, with the assets managed by large international companies and investors. There are also many small, often family-run businesses, particularly in Europe, not quite so upscale and with fewer financial resources. Most family-owned and -operated businesses are not branded and customers cannot typically access these hotels through global distribution systems. Given the variety of models for owning and operating leisure hotels and the fragmented competitive landscape which, at least in Europe, is not dominated by large hotel chains, conditions differ greatly between locations.
C R U I S E M A R K E T
The global cruise industry estimates that it generated approximately $ 39.6 bn of revenue in 2015 (Cruise Market Watch website, www.cruise-marketwatch.com/market-share, September 2016). The North American market is by far the largest and most mature cruise market in the world, with approximately 12.1 million guests in 2015 and a strong penetration rate of 3.8 % of the total population taking a cruise in 2015. By contrast, the European cruise markets recorded approximately 6.6 million European passengers, with penetration rates varying significantly from country to country, but considerably lower overall (Mintel, Cruises − International, June 2016; CLIA Statistics & Markets, March 2016). In 2015, the global cruise market grew by around 2.4 %.
Note: All total except North America (which included a share of river cruises now account-ing for about 4 % of passengers) are for ocean-cruises passengers onlySource: Mintel, Cruises − International, June 2016
Germany, the United Kingdom & Ireland and France are among the five largest cruise markets in Europe (CLIA Statistics & Markets, March 2016). Germany is Europe’s largest cruise market, with 1.8 million passengers in 2015. Germany has thus witnessed average passenger growth of 8.3 % over the past five years. At 2.2 %, its penetration rate was lower than in the United Kingdom & Ireland in 2015.
The United Kingdom & Ireland is the second largest cruise market in Europe, with approximately 1.8 million cruise passengers in 2015. The market has thus grown by 2.1 % on average over the past five years. It shows the strongest penetration rate in Europe: in 2015, 2.7 % of the total British population took a cruise. (Mintel, Cruises – International, June 2016).
The European cruise market is divided into submarkets that cater to a variety of customers: budget, discovery / expedition, premium and luxury. Cruise operators utilise different cruise formats to target these sub-markets and the specific demands of their customers. In addition to traditional formats, operators offer club ship cruises and also more contemporary-style cruises in the premium submarket. As a cruise ship is often perceived as a destination in itself, cruise companies, especially in the luxury and premium cruise submarkets, compete with other destina-tions such as leading hotels and resorts.
W O R L D W I D E C R U I S E S P A S S E N G E R S B Y S O U R C E R E G I O N
(12.2) 12.1North America
(1.1) 1.0Latin America
and others
1.1 (1.0)Australasia
1.8 (1.6)UK and Ireland
4.8 (4.7)Continental Europe
2.1 (1.7)Asia (including Japan)
M

74 M A N A G E M E N T R E P O R T Business Review
Brand
S T R O N G M A S T E R B R A N D T U I
Our brand with the “smile” – the smiling logo formed by the three letters of our brand name TUI – stands for a consistent customer experience, digital presence and competitive strength. In 2016, TUI (or the local power brand) was one of the best-known travel brands in core European countries with a brand awareness rate of almost 90 %. The red “TUI smile” is a clear recognition feature and plays in the “Champions League” of international brands in almost all markets.
We are aiming to create one global branding and a consistent brand experience in order to further leverage the appeal and strength of our core brands and tap the associated growth potential. To achieve that goal, our core brand TUI will be rolled out in our European source markets to replace the big local tour operator brands. At the beginning of financial year 2015 / 16, the TUI brand was introduced in the Netherlands, where
it has successfully replaced the previous world of Arke brands for tour operator, distribution and flight activities. TUI has rapidly become one of the strongest travel markets in the Netherlands in terms of brand awareness and preference. In October 2016 , our rebranding campaign was launched in Belgium, with the Nordics to follow in Winter 2016 / 17. Brand migration in the UK will follow at the end of 2017.
In Germany, travel products have been offered under the TUI brand for more than 45 years. In a survey carried out in 2016, TUI was again rated as Germany’s most trusted travel brand (Source: Reader’s Digest Trusted Brands 2016).
Changes in the legal framework
In financial year 2015 / 16, there were no changes in the legal framework with material impacts on TUI Group’s business performance.
Group earnings
Comments on the consolidated income statement
Financial year 2015 / 16 brought a markedly positive development in the TUI Group’s earnings position. The operating result (underlying EBITA) of TUI Group’s continuing operations improved by 5.0 % to € 1,000.5 m
in the period under review, or by 14.5 % year-on-year on a constant currency basis. This growth was driven in particular by the continued good performance of Northern Region and in the segments Hotels & Resorts and Cruises.
I N C O M E S TAT E M E N T O F T H E T U I G R O U P F O R T H E P E R I O D F R O M 1 O C T 2 0 15 T O 3 0 S E P 2 0 1 6
€ million
2015 / 16 2014 / 15
restated
Var. %
Turnover 17,184.6 17,515.5 – 1.9
Cost of sales 15,278.1 15,549.5 – 1.7
Gross profit 1,906.5 1,966.0 – 3.0
Administrative expenses 1,216.9 1,352.6 – 10.0
Other income 36.3 42.9 – 15.4
Other expenses 7.4 5.7 + 29.8
Financial income 58.5 35.8 + 63.4
Financial expenses 345.9 364.5 – 5.1
Share of result of joint ventures and associates 187.2 143.9 + 30.1
Earnings before income taxes 618.3 465.8 + 32.7
Income taxes 153.4 58.2 + 163.6
Result from continuing operations 464.9 407.6 + 14.1
Result from discontinued operations 687.3 – 28.0 n. a.
Group profit for the year 1,152.2 379.6 + 203.5
Group profit for the year attributable to shareholders of TUI AG 1,037.4 340.4 + 204.8
Group profit for the year attributable to non-controlling interest 114.8 39.2 + 192.9

75Business Review M A N A G E M E N T R E P O R T
Turnover and cost of sales
T U R N O V E R
€ million
2015 / 16 2014 / 15
restated
Var. %
Northern Region 7,001.5 7,348.4 – 4.7
Central Region 5,566.6 5,600.9 – 0.6
Western Region 2,869.9 2,847.0 + 0.8
Hotels & Resorts 618.6 574.8 + 7.6
Cruises 296.7 273.3 + 8.6
Other Tourism 665.5 704.8 – 5.6
Tourism 17,018.8 17,349.2 – 1.9
All other segments 165.8 166.3 – 0.3
TUI Group 17,184.6 17,515.5 – 1.9
Discontinued operations 2,321.6 2,565.8 – 9.5
Total 19,506.2 20,081.3 – 2.9
In financial year 2015 / 16, turnover by TUI Group declined by 1.9 % to € 17.2 bn due to foreign exchange effects. On a constant currency basis, turnover grew by 1.4 % despite the year-on-year decline in customer numbers of 0.7 %. Turnover is presented alongside the cost of sales, which was down 1.7 % in the period under review.
G R O S S P R O F I T
Gross profit, i.e. the difference between turnover and the cost of sales, decreased by € 59.5 m to around € 1.9 bn in financial year 2015 / 16.
A D M I N I S T R AT I V E E X P E N S E S
Administrative expenses declined by € 135.7 m year-on-year to € 1,216.9 m. The decrease was driven by the synergies delivered in the period under review and higher one-off expenses incurred in the previous year.
O T H E R I N CO M E /O T H E R E X P E N S E S
In financial year 2015 / 16, other income of € 36.3 m comprised gains from the sale of a Riu Group hotel, a joint venture, a cruise ship, commercial real estate and vehicles of incoming agencies. Other expenses in 2015 / 16 totalled € 7.4 m, primarily for the disposal of aircraft spare parts.
F I N A N C I A L R E S U LT
The financial result improved by € 41.3 m to € – 287.4 m. The increase was essentially due to the year-on-year decline in expenses resulting from the measurement of the stake in Hapag-Lloyd AG.
S H A R E O F R E S U LT S O F J O I N T V E N T U R E S A N D A S S O C I AT E S
The result from joint ventures and associates comprises the propor-tionate net profit for the year of these companies measured at equity and where appropriate impairments of goodwill for these companies. In the period under review, the at equity result totalled € 187.2 m. The significant increase of € 43.3 m partly resulted from the improvement in the operating performance of Riu hotels and a higher profit contribution by TUI Cruises.
I N CO M E TA X E S
The year-on-year increase in income taxes in financial year 2015 / 16 is mainly attributable to the one-off effect recognised in the previous year of the revaluation of deferred tax assets for loss carryforwards following the merger between TUI AG and TUI Travel PLC.
R E S U LT F R O M D I S CO N T I N U E D O P E R AT I O N
The result from discontinued operation shows the after-tax result of Specialist Group, classified as a discontinued operation, as well as LateRooms Group and Hotelbeds Group until these operations were sold.
G R O U P P R O F I T
Group profit increased by € 772.6 m year-on-year to € 1,152.2 m in finan-cial year 2015 / 16.
S H A R E I N G R O U P P R O F I T AT T R I B U TA B L E TO T U I AG
S H A R E H O L D E R S
The share in Group profit attributable to the TUI AG shareholders im-proved from € 340.4 m in the prior year to € 1,037.4 m in financial year 2015 / 16. Apart from the sound operating performance of the Group, the increase is attributable to the gain on disposal from the sale of Hotelbeds Group.
N O N - CO N T R O L L I N G I N T E R E S T S
Non-controlling interests in Group profit for the year totalled € 114.8 m. They related to companies in Hotels & Resorts and, in the prior year, the external shareholders of TUI Travel PLC until the completion of the merger with TUI AG. The share in Group results attributable to non- controlling interests in Hotels & Resorts mainly derives from the RIUSA II Group.

76 M A N A G E M E N T R E P O R T Business Review
E A R N I N G S P E R S H A R E
The interest in Group profit for the year attributable to TUI AG share-holders after deduction of non-controlling interests totalled € 1,037.4 m (previous year € 340.4 m) in 2015 / 16. Basic earnings per share therefore amounted to € 1.78 (previous year € 0.64) in financial year 2015 / 16.
EBITA, underlying EBITA und underlying earnings per share
Key indicators used to manage the TUI Group are EBITA and underlying EBITA. We consider EBITA to be the most suitable performance indicator for explaining the development of the TUI Group’s operating performance. EBITA comprises earnings before interest, taxes and goodwill impair-ments; it does not include the results from container shipping operations nor the results from the measurement of interest hedging instruments.
R E C O N C I L I AT I O N T O U N D E R LY I N G E A R N I N G S
€ million
2015 / 16 2014 / 15
restated
Var. %
Earnings before income taxes 618.3 465.8 + 32.7
less: Profit on Container Shipping measured at equity – – 0.9 n. a.
plus: Loss on measurement of financial investment in Container Shipping 100.3 147.1 – 31.8
plus: Net Interest expense and expense from the measurement of interest hedges 179.5 182.6 – 1.7
EBITA 898.1 794.6 + 13.0
Adjustments:
plus: Loss on disposals / less: Gain on disposals 0.8 – 3.3 n. a.
plus: Restructuring expense 12.0 59.4 – 79.8
plus: Expense from purchase price allocation 41.9 42.1 – 0.5
plus: Expense from other one-off items 47.7 60.5 – 21.2
Underlying EBITA 1,000.5 953.3 + 5.0
Reported earnings (EBITA) of TUI Group rose by € 103.5 m to € 898.1 m due to the very good operating performance in financial year 2015 / 16.
E B I TA
€ million 2015 / 16 2014 / 15 Var. %
Northern Region 440.4 513.4 – 14.2
Central Region 67.3 72.9 – 7.7
Western Region 72.1 57.7 + 25.0
Hotels & Resorts 285.1 195.7 + 45.7
Cruises 129.6 80.5 + 61.0
Other Tourism – 6.2 – 4.1 – 51.2
Tourism 988.3 916.1 + 7.9
All other segments – 90.2 – 121.5 + 25.8
TUI Group 898.1 794.6 + 13.0
Discontinued operations 14.7 2.6 + 465.4
Total 912.8 797.2 + 14.5
In order to explain and evaluate the operating performance of the segments, earnings adjusted for special one-off effects (underlying EBITA) are presented below. Underlying EBITA has been adjusted for gains on disposal of financial investments, restructuring expenses
according to IAS 37, all effects from purchase price allocations, ancillary acquisition costs and conditional purchase price payments and other expenses for and income from one-off items.

77Business Review M A N A G E M E N T R E P O R T
One-off items carried here include adjustments for income and expense items that reflect amounts and frequencies of occurrence rendering an evaluation of the operating profitability of the segments and the Group more difficult or causing distortions. These items include in particular major restructuring and integration expenses not meeting the criteria of IAS 37, material expenses for litigation, gains and losses from the
sale of aircraft and other material business transactions with a one-off character.
TUI Group’s underlying EBITA rose by € 47.2 m to € 1,000.5 m in financial year 2015 / 16.
U N D E R LY I N G E B I TA
€ million 2015 / 16 2014 / 15 Var. %
Northern Region 460.9 538.4 – 14.4
Central Region 88.5 103.5 – 14.5
Western Region 86.1 68.7 + 25.3
Hotels & Resorts 287.3 234.6 + 22.5
Cruises 129.6 80.5 + 61.0
Other Tourism 4.6 8.4 – 45.2
Tourism 1,057.0 1,034.1 + 2.2
All other segments – 56.5 – 80.9 + 30.2
TUI Group 1,000.5 953.3 + 5.0
Discontinued operations 92.9 107.3 – 13.4
Total 1,093.4 1,060.5 + 3.1
In financial year 2015 / 16, adjustments worth € 3.2 m were carried for income, compared with adjustments on underlying expenses amounting to € 63.8 m, without taking account of the expenses for purchase price alloca-tions. Overall, net one-off expenses worth € 11.1 m were incurred in con-nection with the merger between TUI AG and the former TUI Travel PLC. They included an amount of € 4.2 m for restructuring the corporate centre and € 6.9 m for integrating the incoming agencies into Tourism.
The adjustments primarily related to the following facts and circum-stances:
G A I N S O N D I S P O S A L
In financial year 2015 / 16, gains on disposal worth € 0.8 m had to be ad-justed for. They related in particular to capital reductions in subsidiaries.
R E S T R U C T U R I N G CO S T S
In financial year 2015 / 16 ,restructuring costs of € 12.0 m had to be ad-justed for. They related to smaller reorganisations in Northern, Central and Western Regions and the restructuring of the corporate centre as well as the transfer of incoming agencies to the source market organisations.
E X P E N S E S F O R P U R C H A S E P R I C E A L L O C AT I O N S
In financial year 2015 / 16, expenses for purchase price allocations worth € 41.9 m were adjusted for; they related in particular to scheduled amor-tisation of intangible assets from acquisitions made in previous years.
O N E - O F F I T E M S
Net expenses for one-off items of € 47.7 m included in particular an amount of € 17.9 m relating to reorganisation in Central and Western Regions and at Corsair, an amount of € 5.7 m for consultancy costs for planned corporate transactions, and € 4.7 m for the restructuring of the corporate centre and the transfer of incoming agencies to the source market organisations.
P R O F O R M A U N D E R LY I N G E A R N I N G S P E R S H A R E
In order to provide a comparable basis for TUI Group’s underlying earnings per share going forward, a pro forma calculation is included below. The calculation is based on the issued share capital at the balance sheet date and therefore adjusts for the impact of bond conversions in 2014 / 15.

78 M A N A G E M E N T R E P O R T Business Review
P R O F O R M A U N D E R LY I N G E A R N I N G S P E R S H A R E T U I G R O U P
€ million
2015 / 16 2014 / 15
restated
EBITA (underlying) 1,000.5 953.3
less: Net interest expense – 179.5 – 182.6
plus: Interest expense on convertible bonds – 19.0
Underlying profit before tax 821.1 789.7
Income taxes (underlying) 205.3 197.4
Underlying Group profit 615.8 592.3
Minority interest 111.5 90.0
Hybrid interest expense – 11.0
Underlying Group profit attributable to TUI shareholders of TUI AG 504.3 491.3
Number of shares (pro forma) No. million 587.0 587.0
Pro forma underlying earnings per share 0.86 0.84
Segmental performance
Current and future trading in Tourism
In Tourism, travel products are booked on a seasonal basis with different lead times. The release of bookings for individual seasons takes place at different points in time, depending on the design of the booking and reservation systems in each source market. Moreover, load factor man-
agement ensures that the tour operator capacity available for bookings is seasonally adjusted to actual and expected demand.
At the end of financial year 2015 / 16, current trading by source market for Winter 2016 / 17 compared as follows with the previous year:
C U R R E N T T R A D I N G 1
Winter season 2016 / 17
Var. %
Average
selling price2 Total sales2 Total customers 2
Northern Region + 3 + 14 + 11
UK + 6 + 26 + 18
Nordics – 3 – 6 – 3
Central Region + 7 + 4 – 3
Germany + 7 + 2 – 5
Western Region + 3 + 7 + 4
Benelux + 3 + 4 + 1
Total source markets + 5 + 9 + 4
1 As at 20 November 2016 (on a constant currency basis)2 These statistics relate to all customers whether risk or non-risk.

79Business Review M A N A G E M E N T R E P O R T
For the 2017 Summer season, already available for bookings in the UK, booked revenues were around 15 % ahead of the prior year in Novem-ber 2016.
Trading by the Hotels & Resorts segment largely mirrors customer volumes in the source markets, as a high proportion of the Group-owned hotel beds are taken up by TUI tour operators. In the Cruises segment, advance bookings were up year-on-year at the balance sheet
date with sound demand levels, primarily due to continued fleet expansion by TUI Cruises in the period under review.
Disclosures on current trading are regularly published on TUI’s website in the framework of TUI Group’s quarterly reporting.
See www.tuigroup.com/en-en/investors
Our key operating indicators developed as follows in our source markets:
Source markets
D I R E C T D I S T R I B U T I O N M I X 1 in % O N L I N E M I X 2 in % C U S T O M E R S 3 in ’000
Var. percentage points Var. percentage points Var. %
2015 / 16(2014 / 15)
2015 / 16(2014 / 15)
2015 / 16(2014 / 15)
S O U R C E M A R K E T S
+ 2 % points 72 (70) + 2 % points 43 (41) – 0.7 % 19,231 (19,361)
N O R T H E R N R E G I O N 4
+ 1 % point 92 (91) + 4 % points 62 (58) + 2.0 % 7,388 (7,240)
C E N T R A L R E G I O N
+ 3 % points 47 (44) – 15 (15) – 4.7 % 6,828 (7,168)
W E ST E R N R E G I O N
+ 2 % points 70 (68) + 4 % points 52 (48) + 1.3 % 5,016 (4,953)
1 Share of sales via own channels (retail and online)2 Share of online sales3 Previous year’s figures included Italy which has been transferred to All other Segments.4 Customer numbers of Northern Region now include Crystal Ski and Thomson Lakes & Mountains (formerly Specialist Group)
Northern Region
Northern Region comprises TUI’s tour operators and airlines and the cruise business in the UK, Ireland and the Nordics. In the run-up to the sale of large parts of Specialist Group, the skiing tour operators previous-
ly forming part of Specialist Group were allocated to source market UK. The segment also comprises the strategic stake held in Sunwing in Canada, and TUI Russia, which operates in the CIS countries.

80 M A N A G E M E N T R E P O R T Business Review
N O R T H E R N R E G I O N – K E Y F I G U R E S
€ million
2015 / 16 2014 / 15
restated
Var. %
Turnover 7,001.5 7,348.4 – 4.7
Underlying EBITA 460.9 538.4 – 14.4
EBITA 440.4 513.4 – 14.2
In financial year 2015 / 16, the Northern Region tour operators continued their positive development. In particular due to the increase in TUI UK customers, customer volumes rose by 2.0 % year-on-year in Northern Region. Due to the year-on-year weakening of the exchange rate for ster-ling during the key travel months, turnover by Northern Region declined by 4.7 % to € 7,001.5 m. By contrast, turnover rose by 2.6 % on a constant currency basis. Northern Region underlying EBITA declined by € 77.5 m year-on-year to € 460.9 m due to foreign exchange effects. By contrast, earnings by Northern Region improved by 3.3 % year-on-year on a constant currency basis.
In the UK, tour operators again delivered a sound business performance, driven in particular by the strength of customer demand for TUI’s unique holidays with growth across short-, medium- and long-haul desti-nations. The cruise business benefited from the launch of TUI Discovery in June 2016. Customer volumes, adjusted for the skiing tour operator customers during the reporting periods, rose by 4.0 % overall in 2015 / 16. We continued to drive growth in online bookings, with that channel accounting for 58 % of all holidays, up around 4 percentage points year-on-year.
In the Nordics, our performance in the financial year was impacted by growing price pressure in the lates market and lower demand for Turkey. This impact was not fully mitigated by the increase in the proportion of the programme remixed to alternative destinations and the inclusion of Riu hotels in the long-haul segment. Upfront costs were also incurred for the TUI brand migration in the Nordics. The online channel accounted for around 75 % of all bookings, up by around three percentage points.
Sunwing recorded an increase in direct costs driven by the small decline in the Canadian dollar against the US dollar. Despite a good Summer season, it therefore posted an overall decline year-on-year. On the other hand, there was a positive impact from the continued expansion of our differentiated hotel portfolio in the Caribbean and Mexico.
Central Region
Central Region comprises the TUI tour operators in Germany, Austria, Switzerland and Poland and the TUI fly airline.
C E N T R A L R E G I O N – K E Y F I G U R E S
€ million
2015 / 16 2014 / 15
restated
Var. %
Turnover 5,566.6 5,600.9 – 0.6
Underlying EBITA 88.5 103.5 – 14.5
EBITA 67.3 72.9 – 7.7
With customer volumes down by 4.7 % year-on-year, turnover by Central Region was almost flat on the prior year on a slight decline of 0.6 % in financial year 2015 / 16. Central Region underlying EBITA was also broadly stable. In the period under review, a major adverse effect was caused by the geopolitical events in Egypt and Turkey and the resulting subdued demand for these important destinations and an intensification of price competition for flights to Spain. In Germany, market conditions therefore remained challenging in a highly competitive environment. The result includes the impact of a court ruling in November regarding airport services and marketing agreements with an Austrian airport, and the partial impact on holidays commenced in September of unexpectedly high levels of sickness among TUI fly flight crew. However, TUI Deutschland continued to strengthen its core brand TUI through stronger marketing measures and managed to further grow its market share.
Western Region
Western Region combines TUI tour operators and Group-owned airlines in Belgium and the Netherlands as well as tour operators in France.
W E S T E R N R E G I O N – K E Y F I G U R E S
€ million
2015 / 16 2014 / 15
restated
Var. %
Turnover 2,869.9 2,847.0 + 0.8
Underlying EBITA 86.1 68.7 + 25.3
EBITA 72.1 57.7 + 25.0
With customer volumes up by 1.3 % in Western Region, turnover grew by 0.8 % in financial year 2015 / 16. Underlying EBITA grew by € 17.4 m to € 86.1 m. The French tour operating business improved year-on-year due to the expansion of its offering to EU destinations and positive effects from restructuring measures. Business in the Netherlands benefited from the TUI brand migration in Autumn 2015 and a 3.0 % increase in customer volumes. These positive effects were partly offset by the weaker performance of the Belgian market, which was adversely impacted by the aftermath of the terrorist attacks in Brussels in March 2016.

81Business Review M A N A G E M E N T R E P O R T
Hotels & Resorts
The Hotels & Resorts segment comprises all TUI Group hotels and hotel companies, including the hotel business of former TUI Travel. They include subsidiaries, joint ventures with local partners, associates over which significant influence is held, and hotels operated under management contracts.
H O T E L S & R E S O R T S – K E Y F I G U R E S
€ million 2015 / 16 2014 / 15 Var. %
Total turnover 1,278.4 1,252.2 + 2.1
Turnover 618.6 574.8 + 7.6
Underlying EBITA 287.3 234.6 + 22.5
EBITA 285.1 195.7 + 45.7
Total turnover by the Hotels & Resorts segment rose by 2.6 % to € 1,278.4 m year-on-year in 2015 / 16. Capacity declined overall; the expanded offering of our core brands Riu and Robinson was offset by cuts in hotel capacities in North Africa and Turkey driven by geopolitical events. Occupancy of TUI hotels was slightly down year-on-year, while average revenues per bed grew considerably in the period under review. Turnover with third parties grew to € 618.6 m in 2015 / 16, up by 7.6 % year-on-year. Under-lying EBITA amounted to € 287.3 m, up by € 52.7 m on the prior year. This significant increase was mainly driven by the sustained positive business development of hotel brand Riu, which benefited in particular from its strong market position in the western Mediterranean and in the long-haul segment.
H O T E L S & R E S O R T S
C A P A C I T Y 1 in ’000 O C C U P A N C Y R AT E 2 in % A V E R A G E R E V E N U E P E R B E D 3 in €
Var. % Var. percentage points Var. %
2015 / 16(2014 / 15)
2015 / 16(2014 / 15)
2015 / 16(2014 / 15)
H OT E L S TOTA L 4
– 1.9 % 35,031 (35,706) – 1.2 % points 77.5 (78.7) + 5.5 % 58.00 (55.00)
R I U
+ 0.7 % 17,396 (17,272) + 3.7 % points 89.6 (85.9) + 5.6 % 60.34 (57.13)
R O B I N S O N
+ 6.3 % 3,081 (2,898) – 5.5 % points 67.1 (72.6) – 0.6 % 90.10 (90.67)
1 Group owned or leased hotel beds multiplied by opening days per annum2 Occupied beds dividied by capacity3 Arrangement revenue divided by occupied beds4 Incl. former TUI Travel hotels
R I U
Riu, one of Spain’s leading hotel chains, operated a total of 94 hotels (prior year: 104) with 86,184 beds at the end of financial year 2015 / 16. The year-on-year decline was driven by the termination of management contracts in Tunisia following the terrorist attacks in Summer 2015. Capacity increased slightly by 0.7 % year-on-year. Average occupancy of
Riu hotels rose slightly by 3.7 percentage points to 89.6 %. This increase above all reflects strong demand for hotels in Spain and Portugal, and for the Cape Verde Islands, Mauritius and St Martin in the long-haul segment. Average revenues per bed rose by 5.6 %. The individual regions developed as follows in the period under review:

82 M A N A G E M E N T R E P O R T Business Review
Riu hotels in the Canaries recorded strong demand and benefited from the shift in demand driven by geopolitical events in the eastern Medi-terranean. Occupancy of hotel beds rose by 4.7 percentage points to 97.2 %. Moreover, average revenues per bed also increased by 9.3 %.
Riu hotels in the Balearics also recorded a very positive performance in the period under review. At 84.7 %, occupancy was 2.1 percentage points up year-on-year. Average revenues per bed rose by 8.3 % in the period under review.
At 90.5 %, average occupancy of Riu hotels in mainland Spain was 5.0 per-centage points up year-on-year, with average revenues per bed up by 7.8 %.
Riu hotels in long-haul destinations reported average occupancy of 84.7 %. This was an increase of 2.3 percentage points on the prior year, driven by higher occupancy in the hotels in St Martin, Mauritius and the Cape Verde Islands. Average revenues per bed posted for long-haul destinations grew by 5.4 % year-on-year, driven partly by exchange rate fluctuations.
R O B I N S O N
Robinson, market leader in the premium club holiday segment, operated a total of 24 club facilities with 15,342 beds in twelve countries at the end of the financial year under review, as in the prior year. Capacity rose by 6.3 % year-on-year. This growth was mainly driven by the additional club facility Kyllini Beach in Greece and the first-time full-year inclusion of the club resort in Tunisia. Occupancy of Robinson Group was 5.5 percent-age points down year-on-year in financial year 2015 / 16, with the club resorts in Turkey, Morocco and Tunisia, in particular, falling short of the prior year’s levels. Average revenues per bed were slightly down at 0.6 % under the prior year’s level.
O T H E R H O T E L S
Other hotels mainly comprise the hotel brands TUI Blue, Grupotel, Iberotel and Magic Life and the further hotel activities by former TUI Travel. The indicators for Other hotels were also impacted by the aftermath of the geopolitical situation.
The first two hotels to operate under our new hotel brand TUI Blue opened in Turkey in May 2016. The portfolio has been further expanded for the current financial year; a total of seven hotels are now available in six countries (Germany, Austria, Italy, Spain, Croatia and Turkey). They offer our customers a consistent TUI holiday experience with a premium all-inclusive concept.
Cruises
The Cruises segment comprises Hapag-Lloyd Cruises and the joint venture TUI Cruises.
C R U I S E S – K E Y F I G U R E S
€ million 2015 / 16 2014 / 15 Var. %
Turnover 296.7 273.3 + 8.6
Underlying EBITA 129.6 80.5 + 61.0
EBITA 129.6 80.5 + 61.0
At € 296.7 m, turnover by Hapag-Lloyd Cruises was 8.6 % up on the prior year in financial year 2015 / 16. No turnover is carried for TUI Cruises as the joint venture is measured at equity in the consolidated financial statements.
Cruises underlying EBITA increased to € 129.6 m in 2015 / 16, up by € 49.1 m year-on-year. On a persistently sound operating performance for the two companies, this was also driven by the expansion of the TUI Cruises fleet. With the successful market launch of Mein Schiff 4 in June 2015 and Mein Schiff 5 in July 2016, TUI Cruises continued to build on its competitive position. In the period under review, Hapag-Lloyd Cruises also benefited from lower financing costs due to the acquisition of Europa 2 in the prior year.

83Business Review M A N A G E M E N T R E P O R T
C R U I S E S
O C C U P A N C Y in % P A S S E N G E R D AY S in ’000 A V E R A G E D A I LY R AT E S * in €
Var. percentage points Var. % Var. %
2015 / 16(2014 / 15)
2015 / 16(2014 / 15)
2015 / 16(2014 / 15)
H A PA G - L LOY D C R U I S E S
+ 0.6 % points 76.8 (76.2) + 1.9 % 355 (348) + 8.0 % 579 (536)
T U I C R U I S E S
– 0.1 % point 102.6 (102.7) + 30.0 % 3,482 (2,679) + 1.2 % 171 (169)
* Per day and passenger
H A PAG - L L OY D C R U I S E S
In financial year 2015 / 16, the sound operating performance of Hapag- Lloyd Cruises benefited from the successful realignment of the brand, which had resulted in a turnaround in the previous year. Occupancy of its fleet was stable at 76.8 %, a slight increase of 0.6 percentage points versus the prior year. The average daily rate grew substantially by 8.0 % to € 579. In the period under review, passenger days grew by 1.9 % year-on-year to 354,611.
T U I C R U I S E S
In financial year 2015 / 16, occupancy of TUI Cruises’ ships was 102.6 % (based on the double occupancy calculation conventionally used in the sector), maintaining the very high level recorded in the prior year. Due to the successful expansion of the TUI Cruises fleet to include Mein Schiff 4 in June 2015 and Mein Schiff 5 in July 2016, capacity grew to 3.5 m passenger days in financial year 2015 / 16, considerably up year-on-year. The average daily rate rose by 1.2 % to € 171 year-on-year. In November 2015, cruises in South East Asian lanes were newly included in the programme served by TUI Cruises’ fleet.
At the end of financial year 2015 / 16, the fleet consisted of five ships. The maiden voyage of Mein Schiff 6 is expected for Summer 2017. In 2018 and 2019, two further newbuilds will be launched. They will then replace Mein Schiff 1 and Mein Schiff 2, currently still in service, as part of the fleet modernisation programme.
All other segments
The category “All other segments” refers, in particular, to the corporate centre functions of TUI AG and the intermediate holdings as well as the Group’s real estate companies.
A L L O T H E R S E G M E N T S – K E Y F I G U R E S
€ million
2015 / 16 2014 / 15
restated
Var. %
Turnover 165.8 166.3 – 0.3
Underlying EBITA – 56.5 – 80.9 + 30.2
EBITA – 90.2 – 121.5 + 25.8
All other segments underlying EBITA cost declined by 30.1 % year-on-year to € 56.5 m in the period under review. The improvement was driven by the delivery of corporate streamlining synergies worth € 30 m, higher proceeds from sales of land, and positive impacts of foreign exchange translation.

84 M A N A G E M E N T R E P O R T Business Review
Net assets
D E V E L O P M E N T O F T H E G R O U P ’ S A S S E T S T R U C T U R E
€ million 30 Sep 2016 30 Sep 2015 Var. %
Fixed assets 8,345.0 8,902.7 – 6.3
Non-current receivables 786.8 711.3 + 10.6
Non-current assets 9,131.8 9,614.0 – 5.0
Inventories 105.2 134.5 – 21.8
Current receivables 2,218.2 2,623.1 – 15.4
Cash and cash equivalents 2,072.9 1,672.7 + 23.9
Assets held for sale 929.8 42.2 n. a.
Current assets 5,326.1 4,472.5 + 19.1
Assets 14,457.9 14,086.5 + 2.6
Equity 3,248.2 2,417.3 + 34.4
Liabilities 11,209.7 11,669.2 – 3.9
Equity and liabilities 14,457.9 14,086.5 + 2.6
The Group’s balance sheet total increased by 2.6 % as against 30 Sep-tember 2015 to € 14.5 bn.
Vertical structural indicators
Non-current assets accounted for 63.2 % of total assets, compared with 68.2 % in the previous year. The capitalisation ratio (ratio of fixed assets to total assets) decreased from 63.2 % to 57.5 %.
Current assets accounted for 36.8 % of total assets, compared with 31.8 % in the previous year. The Group’s cash and cash equivalents
increased by € 400.2 m year-on-year to € 2,072.9. They thus accounted for 14.3 % of total assets, as against 11.9 % in the previous year.
Horizontal structural indicators
At the balance sheet date, the ratio of equity to non-current assets was 35.6 %, as against 25.1 % in the previous year. The ratio of equity to fixed assets was 38.9 % (previous year 27.2 %). The ratio of equity plus non-current financial liabilities to fixed assets was 56.9 %, compared with 48.3 % in the previous year.
S T R U C T U R E O F T H E G R O U P ’ S N O N - C U R R E N T A S S E T S
€ million 30 Sep 2016 30 Sep 2015 Var. %
Goodwill 2,853.5 3,220.4 – 11.4
Other intangible assets 545.8 911.5 – 40.1
Investment property – 7.2 n. a.
Property, plant and equipment 3,714.5 3,636.8 + 2.1
Companies measured at equity 1,180.8 1,077.8 + 9.6
Financial assets available for sale 50.4 56.2 – 10.3
Fixed assets 8,345.0 8,902.7 – 6.3
Receivables and assets 442.1 380.6 + 16.2
Deferred tax claims 344.7 330.7 + 4.2
Non-current receivables 786.8 711.3 + 10.6
Non-current assets 9,131.8 9,614.0 – 5.0

85Business Review M A N A G E M E N T R E P O R T
Development of the Group’s non-current assets
G O O D W I L L
Goodwill declined by € 366.9 m to € 2,853.5. The decrease in the carrying amount is essentially due to the translation of goodwill not managed in the TUI Group’s functional currency into euros. It was also driven by the disposal of Hotelbeds Group and recognition of Specialist Group as a discontinued operation. In the period under review, no adjustments were required as a result of impairment tests.
P R O P E R T Y, P L A N T A N D E Q U I P M E N T
Property, plant and equipment increased to € 3,714.5 m in the period under review, primarily driven by the acquisition of a cruise ship in Northern Region and the capitalisation of one aircraft as well as down payments on aircraft orders, partly offset by the reclassification of the segments Hotelbeds Group and Specialist Group to assets held for sale. Property, plant and equipment also comprised leased assets in which Group companies held economic ownership. At the balance sheet date, these finance leases had a carrying amount of € 1,230.0 m, up 21.8 % year-on-year.
D E V E L O P M E N T O F P R O P E R T Y, P L A N T A N D E Q U I P M E N T
€ million 30 Sep 2016 30 Sep 2015 Var. %
Real estate with hotels 978.9 971.2 + 0.8
Other land 155.4 170.2 – 8.7
Aircraft 1,202.0 1,166.0 + 3.1
Ships 674.3 706.7 – 4.6
Machinery and fixtures 335.5 391.9 – 14.4
Assets under construction, payments on accounts 368.4 230.8 + 59.6
Total 3,714.5 3,636.8 + 2.1
CO M PA N I E S M E A S U R E D AT E Q U I T Y
Thirteen associated companies and 27 joint ventures were measured at equity. At € 1,180.8 m, their value increased by 9.6 % year-on-year as at the balance sheet date.
S T R U C T U R E O F T H E G R O U P ’ S C U R R E N T A S S E T S
€ million 30 Sep 2016 30 Sep 2015 Var. %
Inventories 105.2 134.5 – 21.8
Financial assets available for sale 265.8 334.9 – 20.6
Trade accounts receivable and other assets* 1,864.7 2,229.7 – 16.4
Current tax assets 87.7 58.5 + 49.9
Current receivables 2,218.2 2,623.1 – 15.4
Cash and cash equivalents 2,072.9 1,672.7 + 23.9
Assets held for sale 929.8 42.2 n. a.
Current assets 5,326.1 4,472.5 + 19.1
* incl. receivables from derivative financial instruments
Development of the Group’s current assets
F I N A N C I A L A S S E T S AVA I L A B L E F O R S A L E
Financial assets available for sale comprised the remaining interests in Hapag-Lloyd AG as at 30 September 2016.
C U R R E N T R E C E I VA B L E S
Current receivables comprise trade accounts receivable and other re-ceivables, current income tax assets and claims from derivative financial instruments. At € 2,218.2 m, current receivables decreased by 15.4 % year-on-year.

86 M A N A G E M E N T R E P O R T Business Review
C A S H A N D C A S H E Q U I VA L E N T S
At € 2,072.9 m, cash and cash equivalents increased by 23.9 % year-on-year.
A S S E T S H E L D F O R S A L E
Assets held for sale increased by € 887.6 m to € 929.8 m. The increase is primarily attributable to the reclassification of Specialist Group to assets held for sale.
U N R E CO G N I S E D A S S E T S
In the course of their business operations, Group companies used assets of which they were not the economic owner according to the IASB rules. Most of these assets were aircraft, hotel complexes or ships for which operating leases, i.e. rental, lease or charter agreements, were concluded under the terms and conditions customary in the sector.
O P E R AT I N G R E N TA L , L E A S E A N D C H A R T E R C O N T R A C T S
€ million 30 Sep 2016 30 Sep 2015 Var. %
Aircraft 1,886.3 2,144.7 – 12.0
Hotel complexes 731.9 793.6 – 7.8
Travel agencies 229.1 263.7 – 13.1
Administrative buildings 271.2 327.5 – 17.2
Ships, Yachts and motor boats 204.6 195.0 + 4.9
Other 114.3 118.8 – 3.8
Total 3,437.4 3,843.3 – 10.6
Fair value 3,319.6 3,540.6 – 6.2
The fair value of financial liabilities from operating rental, lease and charter agreements declined by € 221.0 m to € 3,319.6 m. At 54.9 %, aircraft accounted for the largest portion, with hotel complexes ac-counting for 21.3 %.
Further explanations as well as the structure of the remaining terms of the financial liabilities from operating rental, lease and charter agree-ments are provided in the section Other financial liabilities in the Notes to the consolidated financial statements.
Information on other intangible, non-recognised assets in terms of brands, customer and supplier relationships and organisational and process benefits is provided in the section on TUI Group fundamentals; relationships with investors and capital markets are outlined in the section on TUI share performance.
TUI Group fundamentals see from page 28; TUI share performance from
page 106
Financial position of the Group
Principles and goals of financial management
P R I N C I P L E S
TUI Group’s financial management is centrally operated by TUI AG, which acts as the Group’s internal bank. Financial management covers all Group companies in which TUI AG directly or indirectly holds an in-terest of more than 50 %. It is based on policies covering all cash flow- oriented aspects of the Group’s business activities. In the framework of a cross-national division of tasks within the organisation, TUI AG has outsourced some of the operating finance operations to First Choice Holidays Finance Ltd, TUI Travel’s former financing company. However, the operating finance operations are carried out on a coordinated and centralised basis.
G OA L S
TUI’s financial management goals include ensuring sufficient liquidity for TUI AG and its subsidiaries and limiting financial risks from fluctuations in currencies, commodity prices and interest rates.
L I Q U I D I T Y S A F E G UA R D S
The Group’s liquidity safeguards consist of two components:
• In the course of the annual Group planning process, TUI draws up a multi-annual finance budget, which forms the basis to determine the long-term financing and refinancing requirements. Using this informa-tion and observing the financial markets in order to identify refinancing opportunities create a basis for decision-making to enable appropriate financing instruments for the long-term funding of the Company to be adopted early on.

87Business Review M A N A G E M E N T R E P O R T
• TUI uses syndicated credit facilities and bilateral bank loans as well as its liquid funds to secure sufficient short-term cash reserves. Through intra-Group cash pooling, the cash surpluses of individual Group companies are used to finance the cash requirements of other Group companies. Planning of bank transactions is based on a monthly rolling liquidity planning system.
L I M I T I N G F I N A N C I A L R I S K S
The Group companies operate on a worldwide scale. This gives rise to financial risks for the TUI Group, mainly from changes in exchange rates, commodity prices and interest rates.
The key operating financial transaction risks relate to the euro, US dollar and pound sterling and changing fuel prices. They mainly result from cost items in foreign currencies held by individual Group companies, e. g. hotel sourcing, aircraft fuel and bunker oil invoices or ship handling costs.
The Group has entered into derivative hedges in various foreign cur-rencies in order to limit its exposure to risks from changes in exchange rates for the hedged items. Changes in commodity prices affect the TUI Group, in particular in procuring fuels such as aircraft fuel and bunker
oil. These price risks related to fuel procurement are largely hedged with the aid of derivative instruments. Where price increases can be passed on to customers due to contractual agreements, this is also reflected in our hedging behaviour. In order to control risks related to changes in interest rates arising on liquidity procurement in the inter-national money and capital markets and investments of liquid funds, the Group uses derivative interest hedges on a case-by-case basis as part of its interest management system.
The use of derivative hedges is based on underlying transactions; the derivatives are not used for speculation purposes.
Risk report see from page 49
Financial instruments see from page 233
More detailed information on hedging strategies and risk management as well as financial transactions and the scope of such transactions at the balance sheet date is provided in the Risk Report within the Management Report and the section Financial instruments in the Notes to the consoli-dated financial statements.
Capital structure
C A P I TA L S T R U C T U R E O F T H E G R O U P
€ million 30 Sep 2016 30 Sep 2015 Var. %
Non-current assets 9,131.8 9,614.0 – 5.0
Current assets 5,326.1 4,472.5 + 19.1
Assets 14,457.9 14,086.5 + 2.6
Subscribed capital 1,500.7 1,499.6 + 0.1
Reserves including net profit available for distribution 1,174.4 413.8 + 183.8
Non-controlling interest 573.1 503.9 + 13.7
Equity 3,248.2 2,417.3 + 34.4
Non-current financial liabilities 2,213.3 1,860.8 + 18.9
Current provisions 415.4 495.8 – 16.2
Provisions 2,628.7 2,356.6 + 11.5
Non-current liabilities 1,503.4 1,653.3 – 9.1
Current financial liabilities 537.7 233.1 + 130.7
Financial liabilities 2,041.1 1,886.4 + 8.2
Other non-current financial liabilities 272.7 456.1 – 40.2
Other current financial liabilities 5,794.9 6,938.6 – 16.5
Other financial liabilities 6,067.6 7,394.7 – 17.9
Debt related to assets held for sale 472.3 31.5 n. a.
Liabilities 14,457.9 14,086.5 + 2.6

88 M A N A G E M E N T R E P O R T Business Review
C A P I TA L R AT I O S
€ million 30 Sep 2016 30 Sep 2015 Var. %
Non-current capital 7,237.6 6,387.5 + 13.3
Non-current capital in relation to balance sheet total 50.1 45.3 + 4.7*
Equity ratio 22.5 17.2 + 5.3*
Equity and non-current financial liabilities 4,751.6 4,070.6 + 16.7
Equity and non-current financial liabilities in relation to balance sheet total 32.9 28.9 + 4.0*
Gearing 41.9 48.7 – 6.8*
* percentage points
Overall, non-current capital increased by 13.3 % to € 7,237.6 m. As a proportion of the balance sheet total it amounted to 50.1 % (previous year 45.3 %).
The equity ratio was 22.5 % (previous year 17.2 %). Equity and non- current financial liabilities accounted for 32.9 % (previous year 28.9 %) of the balance sheet total at the reporting date.
The gearing, i.e. the ratio of average net debt to average equity, moved to 41.9 %, down from the previous year (48.7 %).
E Q U I T Y
C O M P O S I T I O N O F E Q U I T Y
€ million 30 Sep 2016 30 Sep 2015 Var. %
Subscribed capital 1,500.7 1,499.6 + 0.1
Capital reserves 4,192.2 4,187.7 + 0.1
Revenue reserves – 3,017.8 – 3,773.9 + 20.0
Non-controlling interest 573.1 503.9 + 13.7
Equity 3,248.2 2,417.3 + 34.4
Subscribed capital and the capital reserves rose slightly year-on-year. The increase of 0.1 % each was driven by the issue of employee shares. Revenue reserves rose by € 756.1 m to €– 3,017.8 m. Non-controlling in-terests accounted for € 573.1 m of equity.
P R OV I S I O N S
Provisions mainly comprise provisions for pension obligations, current and deferred tax provisions and provisions for typical operating risks classified as current or non-current, depending on expected occur-rence. At the balance sheet date, they accounted for a total of € 2,628.7 m, up by € 272.1 m or 11.5 % year-on-year.
F I N A N C I A L L I A B I L I T I E S
C O M P O S I T I O N O F L I A B I L I T I E S
€ million 30 Sep 2016 30 Sep 2015 Var. %
Bonds 306.5 293.7 + 4.4
Liabilities to banks 410.8 494.1 – 16.9
Liabilities from finance leases 1,231.7 982.0 + 25.4
Other financial liabilities 92.1 116.6 – 21.0
Financial liabilities 2,041.1 1,886.4 + 8.2

89Business Review M A N A G E M E N T R E P O R T
S T R U C T U R A L C H A N G E S I N F I N A N C I A L L I A B I L I T I E S
The Group’s financial liabilities rose by a total of € 154.7 m to € 2,041.1 m, in particular due to the increase in finance leases. The change was driv-en in particular by the acquisition of a new Boeing B787-9 aircraft, which was refinanced by means of a sale-and-lease-back arrangement via finance leases as well as a cruise ship financed by a finance lease arrangement. Apart from that, the structure of financial liabilities was basically retained.
OV E R V I E W O F T U I ’ S L I S T E D B O N D S
The tables below list the maturities, nominal volumes and annual inter-est coupon of listed bonds.
On 26 October 2016, TUI AG issued bonds with a nominal value of € 300.0 m with a 5-year team. On 18 November 2016, the proceeds from this bond issuance were used to repay the five-year bonds issued in September 2014 with a nominal value of € 300.0 m.
L I S T E D B O N D S
Capital measures Issuance Maturity
Nominal value
initial
€ million
Nominal value
outstanding
€ million
Interest rate
% p. a.
Senior Notes 2014 1 September 2014 October 2019 300.0 300.0 4.500
Senior Notes 2016 2 October 2016 October 2021 300.0 300.0 2.125
1 Early termination and repayment on 18 November 20162 Not included in the consolidated financial statements
B A N K L OA N S A N D O T H E R L I A B I L I T I E S F R O M F I N A N C E L E A S E S
Apart from the bonds worth € 300.0 m, used for general corporate financing, the Hotels & Resorts segment, in particular, incurred sepa-rate bank loans, primarily in order to finance investments by these companies. Most liabilities from finance lease contracts are attributable to aircraft leases.
More detailed information, in particular on the remaining terms, is provided under Financial liabilities in the Notes to the consolidated financial statements.
See Notes page 244
O T H E R F I N A N C I A L L I A B I L I T I E S
Other liabilities totalled € 6,067.6 m, down by € 1,327.1 m or 17.9 % year-on-year.
Off-balance sheet financial instruments and key credit facilities
O P E R AT I N G L E A S E S
The development of operating rental, leasing and charter contracts is presented in the section Net assets in the Management Report.
See page 86
More detailed explanations and information on the structure of the remaining terms of the associated financial liabilities are provided in the section Other financial liabilities in the Notes to the consolidated financial statements. There were no contingent liabilities related to special-purpose vehicles.
S Y N D I C AT E D C R E D I T FAC I L I T I E S O F T U I AG
TUI AG signed a syndicated credit facility worth € 1.75 bn in Septem-ber 2014. This syndicated credit facility is available for general corpo-rate financing purposes (in particular in the winter months). It carries a floating interest rate which depends on the short-term interest rate level (EURIBOR or LIBOR) and TUI’s credit rating plus a margin. This syndicated credit facility was originally to mature in June 2018, but in the financial year under review, its maturity was extended ahead of the due date to December 2020. At the balance sheet date, an amount of € 120.5 m from this credit facility had been utilised in the form of bank guarantees.
B I L AT E R A L G UA R A N T E E FAC I L I T I E S O F T U I AG W I T H
I N S U R A N C E CO M PA N I E S
In September 2015 and in the completed financial year, TUI AG concluded several bilateral guarantee facilities with various insurance companies with a total volume of £ 98.5 m and € 100.0 m. These guarantee facilities are required in the framework of the delivery of tourism services in order to ensure that Group companies are able to meet, in particular, the requirements of European oversight and regulatory authorities on the provision of guarantees and warranties. The guarantees granted usually have a term of 12 to 18 months. The guarantees granted give rise to a commission in the form of a fixed percentage of the maximum guarantee amount. At the balance sheet date, an amount of £ 48.6 m and € 43.0 m from these guarantee facilities had been utilised.
Commitments in financing instruments
The € 300.0 m bond from October 2016 (and the bond worth € 300.0 m from September 2014, repaid in November 2016) and the credit and guarantee facilities of TUI AG contain a number of obligations.
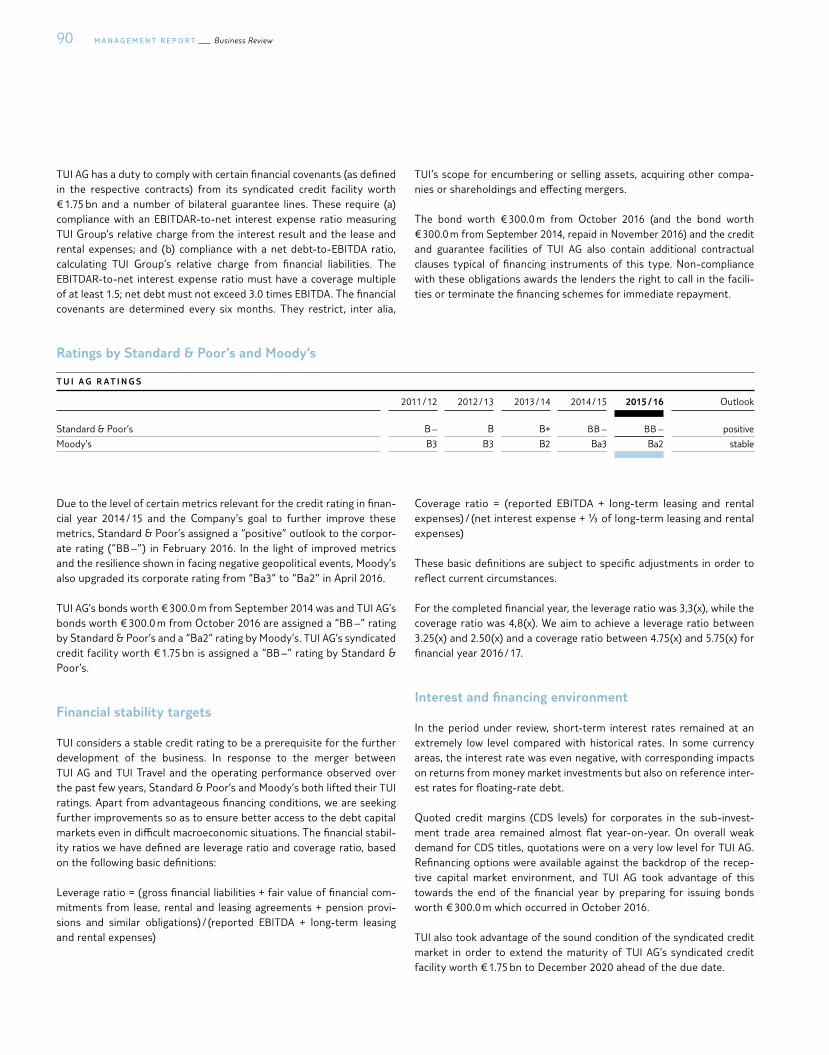
90 M A N A G E M E N T R E P O R T Business Review
TUI AG has a duty to comply with certain financial covenants (as defined in the respective contracts) from its syndicated credit facility worth € 1.75 bn and a number of bilateral guarantee lines. These require (a) compliance with an EBITDAR-to-net interest expense ratio measuring TUI Group’s relative charge from the interest result and the lease and rental expenses; and (b) compliance with a net debt-to-EBITDA ratio, calculating TUI Group’s relative charge from financial liabilities. The EBITDAR-to-net interest expense ratio must have a coverage multiple of at least 1.5; net debt must not exceed 3.0 times EBITDA. The financial covenants are determined every six months. They restrict, inter alia,
TUI’s scope for encumbering or selling assets, acquiring other compa-nies or shareholdings and effecting mergers.
The bond worth € 300.0 m from October 2016 (and the bond worth € 300.0 m from September 2014, repaid in November 2016) and the credit and guarantee facilities of TUI AG also contain additional contractual clauses typical of financing instruments of this type. Non-compliance with these obligations awards the lenders the right to call in the facili-ties or terminate the financing schemes for immediate repayment.
Ratings by Standard & Poor’s and Moody’s
T U I A G R AT I N G S
2011 / 12 2012 / 13 2013 / 14 2014 / 15 2015 / 16 Outlook
Standard & Poor’s B – B B+ BB – BB – positive
Moody’s B3 B3 B2 Ba3 Ba2 stable
Due to the level of certain metrics relevant for the credit rating in finan-cial year 2014 / 15 and the Company’s goal to further improve these metrics, Standard & Poor’s assigned a “positive” outlook to the corpor-ate rating (“BB –”) in February 2016. In the light of improved metrics and the resilience shown in facing negative geopolitical events, Moody’s also upgraded its corporate rating from “Ba3” to “Ba2” in April 2016.
TUI AG’s bonds worth € 300.0 m from September 2014 was and TUI AG’s bonds worth € 300.0 m from October 2016 are assigned a “BB –” rating by Standard & Poor’s and a “Ba2” rating by Moody’s. TUI AG’s syndicated credit facility worth € 1.75 bn is assigned a “BB –” rating by Standard & Poor’s.
Financial stability targets
TUI considers a stable credit rating to be a prerequisite for the further development of the business. In response to the merger between TUI AG and TUI Travel and the operating performance observed over the past few years, Standard & Poor’s and Moody’s both lifted their TUI ratings. Apart from advantageous financing conditions, we are seeking further improvements so as to ensure better access to the debt capital markets even in difficult macroeconomic situations. The financial stabil-ity ratios we have defined are leverage ratio and coverage ratio, based on the following basic definitions:
Leverage ratio = (gross financial liabilities + fair value of financial com-mitments from lease, rental and leasing agreements + pension provi-sions and similar obligations) / (reported EBITDA + long-term leasing and rental expenses)
Coverage ratio = (reported EBITDA + long-term leasing and rental expenses) / (net interest expense + ⅓ of long-term leasing and rental expenses)
These basic definitions are subject to specific adjustments in order to reflect current circumstances.
For the completed financial year, the leverage ratio was 3,3(x), while the coverage ratio was 4,8(x). We aim to achieve a leverage ratio between 3.25(x) and 2.50(x) and a coverage ratio between 4.75(x) and 5.75(x) for financial year 2016 / 17.
Interest and financing environment
In the period under review, short-term interest rates remained at an extremely low level compared with historical rates. In some currency areas, the interest rate was even negative, with corresponding impacts on returns from money market investments but also on reference inter-est rates for floating-rate debt.
Quoted credit margins (CDS levels) for corporates in the sub-invest-ment trade area remained almost flat year-on-year. On overall weak demand for CDS titles, quotations were on a very low level for TUI AG. Refinancing options were available against the backdrop of the recep-tive capital market environment, and TUI AG took advantage of this towards the end of the financial year by preparing for issuing bonds worth € 300.0 m which occurred in October 2016.
TUI also took advantage of the sound condition of the syndicated credit market in order to extend the maturity of TUI AG’s syndicated credit facility worth € 1.75 bn to December 2020 ahead of the due date.

91Business Review M A N A G E M E N T R E P O R T
In the completed financial year, no major new large-volume financing schemes were incurred apart from a refinancing of a collateralised air-craft financing scheme and finance lease contracts.
Liquidity analysis
L I Q U I D I T Y R E S E R V E
In the completed financial year, the TUI Group’s solvency was secured at all times by means of cash inflows from operating activities, liquid funds, and bilateral and syndicated credit agreements with banks.
At the balance sheet date, cash and cash equivalents of TUI AG, TUI Group’s parent company, totalled € 637.0 m.
R E S T R I C T I O N S O F T H E T R A N S F E R O F L I Q U I D F U N D S
At the balance sheet date, there were restrictions worth around € 0.1 bn on the transfer of liquid funds within the Group that might significantly impact the Group’s liquidity, such as restrictions on capital movements and restrictions due to credit agreements concluded.
C H A N G E O F CO N T R O L
Significant agreements taking effect in the event of a change of control due to a takeover bid are outlined in the chapter on Information re-quired under takeover law.
See chapter Information required under takeover law, from page 109
Cash flow statement
S U M M A R Y C A S H F L O W S TAT E M E N T
€ million 2015 / 16 2014 / 15
Net cash inflow from operating activities + 1,034.7 + 790.5
Net cash in- / outflow from investing
activities + 239.0 – 216.8
Net cash outflow from financing activities – 662.1 – 1,116.7
Change in cash and cash equivalents
with cash effects + 611.6 – 543.0
The cash flow statement shows the flow of cash and cash equivalents with cash inflows and outflows presented separately for operating, investing and financing activities. The effects of changes in the group of consolidated companies are eliminated.
N E T C A S H I N F L O W F R O M O P E R AT I N G AC T I V I T I E S
In the financial year under review, the cash inflow from operating activities amounted to € 1,034.7 m (previous year € 790.5 m). It included interest of € 21.1 m and dividends of € 84.7 m in the reporting period. A cash outflow of € 186.4 m resulted from income tax payments. Tax payments of € 94.9 m in connection with the sale of Hotelbeds Group were included in the cash inflow from investing activities.
N E T C A S H O U T F L O W/ I N F L O W F R O M I N V E S T I N G AC T I V I T I E S
In the financial year under review, the cash inflow from investing activities including the payments received for the sale of Hotelbeds Group totalled € 239.0 m (previous year cash outflow of € 216.8 m). The cash outflow of € 605.6 m for capital expenditure related to property, plant and equip-ment and intangible assets primarily included 243.1 m for tour operators and airlines and € 262.3 m for Hotels & Resorts. The cash inflow from the disposal of property, plant and equipment and intangible assets totalled € 72.2 m. The cash outflows for capital expenditure on property, plant and equipment and intangible assets and the corresponding cash inflows do not match the additions and disposals shown in the development of fixed assets, as these also include the non-cash investments and disposals.
N E T C A S H O U T F L O W F R O M F I N A N C I N G AC T I V I T I E S
In the period under review, the cash outflow from financing activities declined by € 454.6 m year-on-year to € 662.1 m.
Major cash outflows resulted from the repayment of finance lease obli-gations (€ 78.1 m) and other financial liabilities (197.3 m), interest pay-ments (€ 92.3 m) and dividend payments to TUI AG shareholders (€ 327.0 m).
C H A N G E I N C A S H A N D C A S H E Q U I V A L E N T S
€ million 2015 / 16 2014 / 15
Cash and cash equivalents at the
beginning of period + 1,682.2 + 2,258.0
Changes due to changes in exchange rates + 105.8 – 33.1
Change in cash and cash equivalents due
to changes in the group of consolidated
companies + 4.0 + 0.3
Cash changes + 611.6 – 543.0
Cash and cash equivalents at the
end of period + 2,403.6 + 1,682.2

92 M A N A G E M E N T R E P O R T Business Review
Cash and cash equivalents comprise all liquid funds, i. e. cash in hand, bank balances and cheques.
The detailed cash flow statement and additional explanations are pro-vided in the consolidated financial statements and in the section Notes to the cash flow statement in the Notes to the consolidated financial statements.
See Cash flow statement page 152, Notes to the cash flow statement see
page 248
Analysis of investments
The development of fixed assets, including property, plant and equip-ment, intangible assets and shareholdings and other investments is presented in the section on Net assets in the Management Report. Additional explanatory information is provided in the Notes to the con-solidated financial statement.
A D D I T I O N S TO P R O P E R T Y, P L A N T A N D E Q U I P M E N T
The table below lists the cash investments in intangible assets and prop-erty, plant and equipment. This indicator does not include financing processes such as the taking out of loans and finance leases.
N E T C A P E X A N D I N V E S T M E N T S
€ million
2015 / 16 2014 / 15
restated
Var. %
Northern Region 86.4 69.9 + 23.6
Central Region 20.6 23.6 – 12.7
Western Region 21.6 23.5 – 8.1
Hotels & Resorts 262.3 173.3 + 51.4
Cruises 10.7 88.5 – 87.9
Other Tourism 101.0 102.2 – 1.2
Tourism 502.6 481.0 + 4.5
All other segments 20.8 45.7 – 54.5
TUI Group 523.4 526.7 – 0.6
Discontinued operations 82.2 75.3 + 9.2
Sum of the segments 605.6 602.0 + 0.6
Net pre delivery payments on aircraft 48.7 – 11.9 n. a.
Financial investments 132.0 158.0 – 16.5
Divestments (without proceeds from Hotelbeds sale) – 95.3 – 89.1 – 7.0
Net capex and investments 691.0 659.0 + 4.9
Investments in other intangible assets and property, plant and equipment totalled € 605.6 m in the period under review, up 0.6 % year-on-year.
In the period under review, investments mainly related to the construction of hotels in the Caribbean, Mexico and the Mediterranean, the develop-ment and launch of new booking and reservation systems and down pay-ments on ordered aircraft. Investments were also effected for renovation and maintenance in all areas.
The table below shows a reconciliation of investments to additions to TUI Group’s other intangible assets and property, plant and equipment.
R E C O N C I L I AT I O N O F C A P I TA L E X P E N D I T U R E
€ million
2015 / 16 2014 / 15
restated
Capital expenditure 605.6 602.0
Debt financed investments – 211.0
Finance leases 315.5 477.4
Advance payments 91.8 224.4
Additions to the group of consolidated
companies 2.7 8.6
Additions to discontinued operations – 20.6 –
Additions to other intangible assets
and property, plant and equipment 995.0 1,523.4

93Business Review M A N A G E M E N T R E P O R T
A M O R T I S AT I O N (+) / W R I T E - B A C K S ( – ) O F O T H E R I N TA N G I B L E A S S E T S A N D D E P R E C I AT I O N (+) / W R I T E - B A C K S ( – )
O F P R O P E R T Y, P L A N T A N D E Q U I P M E N T
€ million 2015 / 16 2014 / 15 Var. %
Northern Region 94.2 105.9 – 11.0
Central Region 22.7 28.2 – 19.5
Western Region 25.8 20.3 + 27.1
Hotels & Resorts 95.0 113.0 – 15.9
Cruises 19.3 17.1 + 12.9
Other Tourism 60.7 64.7 – 6.2
Tourism 317.7 349.2 – 9.0
All other segments 89.3 71.0 + 25.8
TUI Group 407.0 420.2 – 3.1
Discontinued operations 70.9 132.5 – 46.5
Sum of the segments 477.9 552.7 – 13.5
Investment obligations
O R D E R CO M M I T M E N T S
Due to agreements concluded in financial year 2015 / 16 or in prior years, order commitments for investments totalled € 4,786.7 m; this total in-cludes an amount of € 657.1 m for scheduled deliveries in financial year 2016 / 17.
At the balance sheet date, order commitments for aircraft comprised 73 planes (3 B787s and 70 B737s), to be delivered by the end of financial year 2022 / 23. Delivery of one aircraft has been scheduled for financial year 2016 / 17.
More detailed information is provided in the section Other financial lia-bilities in the Notes to the consolidated financial statements.
Sustainable development
Commitment to sustainability: responsibility for the environment, society and our people
For TUI Group, economic, environmental and social sustainability is a fundamental management principle and a cornerstone of our strategy for continually enhancing the value of our Company. This is the way we create the conditions for long-term economic success and assume responsibility for sustainable development in the tourism sector.
Better Holidays, Better World
In 2015, TUI Group presented its sustainability strategy for the period until 2020. The strategy was devised with the involvement of managers from across the business operations and fine-tuned in cooperation with international stakeholders (e. g. non-governmental organisations, partners, customers and academics).
More on TUI ’s sustainability strategy at www.tui-sustainability.com
Under the title “Better Holidays, Better World”, TUI’s sustainability efforts comprise three major ambitions: “step lightly”, “make a difference” and “lead the way”.

94 M A N A G E M E N T R E P O R T Business Review
Our goal is to make positive contributions towards sustainable environ-mental and social development, both in the host countries and at our home markets. We also consistently work to prevent and minimise any negative impacts from our business activities on our natural and social environment. To play our part in shaping the future of sustainable tourism, TUI invests in young people, skills and tourism training pro-grammes, and works in partnership with the destination markets.
In the period under review, our strategy was implemented more broadly within our Group, and the first results were measured. In July 2016, TUI Group published its first status report on “Better Holidays, Better World”. The report is available for download on the Group’s website. It
offers comprehensive information about our goals, activities, progress and metrics in the field of sustainability.
Report online at
www.tuigroup.com/en-en/sustainability/reporting-downloads
TUI Care Foundation
A further key milestone was the Group-wide launch of TUI Care Foun-dation in the period under review. It pools and expands the social commit-ment expressed across TUI Group. TUI Care Foundation operates globally but always focuses on the local situation. It thus builds on strong partner-ships with regional and international organisations in order to create sustainable, positive change. The non-profit foundation has committed
We will operate Europe’s most carbon-efficient
airlines and reduce the carbon intensity of our
operations by 10 % by 2020.
We will deliver 10 m greener and fairer holidays
per year by 2020, enabling more local people to
share in the benefits of tourism.
We will invest € 10 m per year by 2020, to
support good causes and enhance the positive
impacts of tourism, using the TUI Care Foundation
to support this work.
Reducing the environmental impact of holidays
Pioneering sustainable tourism across the world
lead the way
make a difference
step lightly
T U I ’ S S U S TA I N A B I L I T Y S T R AT E G Y 2 0 15 – 2 0 2 0
A M B I T I O N S BY 2 0 2 0
CO M M I T M E N T S BY 2 0 2 0
betterholidaysbetterworld
Creating positive change for people and communities
1. We will drive environmental improvements
across our aviation operations.
2. We will drive environmental improvements
across our cruise operations.
3. We will drive environmental improvements
across our ground operations.
4. We will work with hotel suppliers to increase
their positive impact on the local community and
to protect the environment.
5. We will showcase world-class sustainability
standards across our own TUI hotels and concept
partner hotels.
6. We will help customers and colleagues to create
positive change.
7. We will innovate for a more sustainable future
for tourism, and share our findings with the
industry.
8. We will invest in youth, tourism skills and
education to create employment opportunities
in our source markets and destinations.
9. We will collaborate with destinations on the
sustainable management of tourism.

95Business Review M A N A G E M E N T R E P O R T
to transparency and an efficient use of funds. 100 % of the donations go to projects and project partnerships, with all overhead costs for the foundation covered by TUI.
More on TUI Care Foundation in the Magazine on page 58 and on the Internet
at www.tuicarefoundation.com
The TUI Care Foundation supports projects for children and young people, nature conservation and environmental protection, and development for destinations, e. g. through education and training.
Current projects and initiatives are regularly published on our website. In addition, many TUI Group companies describe their sustainability activities in detail on their local websites and integrate sustainability information into customer communication.
Current projects and initiatives at www.tui-sustainability.com
Sustainability indices
In September 2016, TUI AG was once again listed in the renowned Dow Jones Sustainability Index (DJSI) for the eleventh time in succession. TUI is the only tourism group admitted to the World and Europe indices. TUI is also listed as industry leader. At this year’s review of the composition of the index, TUI achieved particularly high scores in the categories Corporate Citizenship, Climate Strategy and Eco-Efficiency.
TUI AG is also represented in the sustainability indexes FTSE4Good, STOXX Global ESG Leaders Index, Ethibel Excellence Index and ECPI Ethical Index €uro. TUI is listed in the Climate Disclosure Leadership Index (CDLI) in the UK and in Germany.
The environment
Respecting the environment in our products, services and processes is an essential feature of our quality standards. Conserving natural resources and mitigating negative environmental impacts secure TUI’s success. We place priority on climate protection, resource efficiency and biodiversity.
G R O U P-W I D E E N V I R O N M E N TA L M O N I TO R I N G
Group-wide processes to monitor environmental performance and de-termine meaningful indicators were further pursued in financial year 2015 / 16. These are based on internationally acknowledged standards such as the Greenhouse Gas Protocol. Group-wide monitoring focuses on business activities impacting the environment and is used as a control parameter to improve environmental performance.
To establish the relevant indicators, our businesses use an internal system to report their consumption and activities on an annual basis. The quantitative data is then consolidated at Group level and aggregated into metrics. A web-based system is used to further enhance data quality and increase the efficiency of the data capture process for the companies concerned.
F O C U S O N C L I M AT E P R O T E C T I O N A N D E M I S S I O N S
Our special focus is on improving carbon emissions, in particular by the TUI Group’s airlines, which account for more than 80 % of our CO2 emissions.
Details about our carbon footprint can be found in TUI Group’s Sustainability
Report at www.tui-sustainability.com
C A R B O N D I O X I D E E M I S S I O N S ( C O 2 )
tons 2015 / 16 2014 / 15 Var. %
Airlines & Aviation 5,842,427 5,615,386 + 4.0
Hotels & Resorts 510,719 510,492 + 0.0
Cruises 686,791 639,119 + 7.5
Major Premises / Shops 32,617 38,115 – 14.4
Ground Transport 17,751 17,761 – 0.1
Scope 3 (Other) 71,713 68,403 + 4.8
Group 7,162,018 6,889,276 + 4.0
In financial year 2015 / 16, TUI Group’s total emissions rose year-on-year in absolute terms, primarily due to growth in its airlines and aviation segment. The increase in absolute carbon emissions in Cruises of 7.5 % is mainly driven by the launch of Mein Schiff 5, operated by TUI Cruises,
and the inclusion of Mein Schiff 4 for a full financial year. Emissions from offices and retail shops declined significantly, driven partly by more efficient energy use.

96 M A N A G E M E N T R E P O R T Business Review
C L I M AT E P R O T E C T I O N BY T U I A I R L I N E S
We already operate one of Europe’s most carbon-efficient airlines. CO2 emissions by TUI airlines are 30 % below the average for the entire sector. TUI Airlines have launched numerous measures to secure our top position and further enhance the efficiency of aircraft.
Apart from continuous renewal of our aircraft fleet, we have launched the following measures to support our efficiency goals:
• Fitting our aircraft with split scimitar winglets and blended winglets to save fuel
• Process optimisation, e. g. single-engine taxiing• Weight reduction, e. g. by means of lighter trolleys and seats, use of
iPads, introduction of carbon brakes and optimisation of on-board water and goods volumes
• Washing engines, using lighter paint and surface sealants to prevent soiling and further improving aircraft aerodynamics
• Replacing fluorescent lamps in aircraft cabins by LEDs
TUI’s airlines play a pioneering role in introducing environmental manage-ment systems based on the internationally recognised ISO 14001 stand-
ard. In the period under review, each of our five tour operator airlines and hence 95 % of our aircraft achieved ISO 14001 certification.
In the Atmosfair Airline Index 2015 TUI fly Germany was named “most climate-efficient airline in the world” for the third consecutive time. Thomson Airways took second place as the “most climate-efficient airline in the world in the medium- and long-haul segment”.
The ecoDemonstrator project carried out in collaboration with Boeing and NASA to test new technologies aimed at reducing CO2 and noise emissions was successfully completed in the period under review. The tests included special coatings for aircraft wings to protect the leading edge from insect soiling. This reduces the aerodynamic drag of the aircraft. After the end of the series of test flights, the aircraft was dis-mantled and 90 % of its parts recycled by means of new methods.
In our sustainability strategy “Better Holidays, Better World”, we set ourselves the goal to defend our position as Europe’s most emission- efficient airline fleet. We also aim to reduce the CO2 intensity of our global operations, including TUI’s airlines, by 10 % by 2020: We aim to reduce specific CO2 emissions (g CO2 / PKM) by 10 % (baseline 2013 / 14).
T U I A I R L I N E S – F U E L C O N S U M P T I O N A N D R E L AT E D E M I S S I O N S
2015 / 16 2014 / 15 2 Var. %
Specific fuel consumption l / 100 rpk1 2.65 2.62 + 1.2
Carbon dioxide (CO2) – total t 5,277,065 5,034,264 + 4.8
Carbon dioxide (CO2) – specific kg / 100 rpk1 6.68 6.60 + 1.2
Nitrogen oxide (NOX) – total t 29,417 30,754 – 4.3
Nitrogen oxide (NOX) – specific g / 100 rpk1 37.34 41.38 – 9.8
Carbon monoxide (CO) – total t 1,583 1,523 + 3.9
Carbon monoxide (CO) – specific g / 100 rpk1 2.00 2.05 – 2.4
Hydrocarbon (HC) – total t 142 130 + 9.2
Hydrocarbon (HC) – specific g / 100 rpk1 0.18 0.17 + 5.9
1 rpk = Revenue Passenger Kilometre2 Presentation of the nitrogen oxide, carbon monoxide and hydrocarbon emissions for financial year 2014 / 15 is based on total fuel burn.
Specific fuel consumption and specific emissions rose slightly in the period under review. This is attributable to changes in the fleet’s load factor and a higher frequency of short-haul flights.

97Business Review M A N A G E M E N T R E P O R T
T U I A I R L I N E S – C A R B O N I N T E N S I T Y
2015 / 16 2014 / 15 Var. % g CO2e / rpk*
TUI Airline fleet g CO2 / rpk* 66.8 66.0 + 1.2 67.5
Corsair International g CO2 / rpk* 82.4 79.8 + 3.3 83.2
Thomson Airways g CO2 / rpk* 63.8 63.7 + 0.2 64.4
TUI fly Belgium g CO2 / rpk* 71.4 69.6 + 2.6 72.1
TUI fly Germany g CO2 / rpk* 64.4 63.4 + 1.6 65.0
TUI fly Netherlands g CO2 / rpk* 64.1 63.8 + 0.5 64.7
TUI fly Nordic g CO2 / rpk* 61.4 60.6 + 1.3 62.0
* rpk = Revenue Passenger KilometreWe have requested PwC, TUI Group’s auditors, to provide assurance on the carbon intensity metrics displayed in the table “TUI Airlines – Carbon intensity” above. To read our airline carbon data methodology document and PwC’s Assurance Report in full, please visit www.tuigroup.com/en-en/sustainability/reporting-downloads
To enhance the information content, specific emissions are also shown in the form of CO2 equivalents (CO2e). Apart from carbon dioxide (CO2), they include the other five greenhouse gases impacting the climate as listed in the Kyoto Protocol: methane (CH4), nitrous oxide (N2O), hydro- fluorocarbons (HFCs), perfluorocarbons (PFCs) and sulphur hexafluoride (SF6).
C L I M AT E P R O T E C T I O N I N C R U I S E S
In 2016, TUI Cruises launched Mein Schiff 5. Like her sister ships Mein Schiff 3 and Mein Schiff 4, the newbuild is 30 % more energy efficient than comparable vessels. The ships save fuel through a combination of the latest technologies. A smart energy management system, efficient air conditioning, innovative lighting controls and the use of waste heat from the engines all contribute to a significantly reduced carbon foot-print. Sulphur emissions from the newbuilds in the fleet are also 90 % lower thanks to new systems that treat exhaust fumes before releasing
them. Moreover, the average sulphur content of fuel was considerably reduced year-on-year. In the period under review, it stood at 1.16 %.
More in the TUI Cruises Environment Report:
www.tuicruises.com/nachhaltigkeit/umweltbericht/
The ships are fitted with advanced emission purification systems, which operate around the clock worldwide – even outside Emission Control Areas, where use of scrubbers when using heavy fuel oil has been required since 2015.
At Hapag-Lloyd Cruises, the expedition ships Hanseatic and Bremen were fitted with new zodiacs in the period under review. These motor- driven rubber boats are equipped with Torqueedo electric motors in order to reduce air and noise emissions. Hapag-Lloyd Cruises is the first pro-vider of expedition cruises to use this environmentally friendly technology.
Human resources
We successfully operate in a dynamic, challenging environment with around 67,000 employees worldwide. In financial year 2015 / 16, the new Group HR Strategy was developed in conjunction with the global HR Leadership Team in order to ensure lasting achievement of our goal – long-term success. Apart from anchoring joint corporate values, the focus is on the five strategic key areas Engagement, Leadership, People Development, Organisational Effectiveness and HR Function Develop-ment. For each of these pillars, specific projects have been defined so that TUI Group’s cultural transformation can be experienced by managers and employees. The 15 projects are all in different implementation stages and will be the focus of our activities in the next few years.
One of the key cornerstones in the strategic HR process and towards cultural integration is our employee survey TUIgether. Our first survey was carried out in September 2015. We invited our employees in more than 100 countries with 18 languages to give us their feedback. The response rate was 66 %. In our first employee survey, we achieved an Engagement Index of 73. We followed up on the results in a well-defined process and agreed to implement around 5,000 measures across all levels. In the second employee survey, carried out in September 2016, the response rate rose by around 10 percentage points to 77 %, while the Engagement Index climbed to 77.
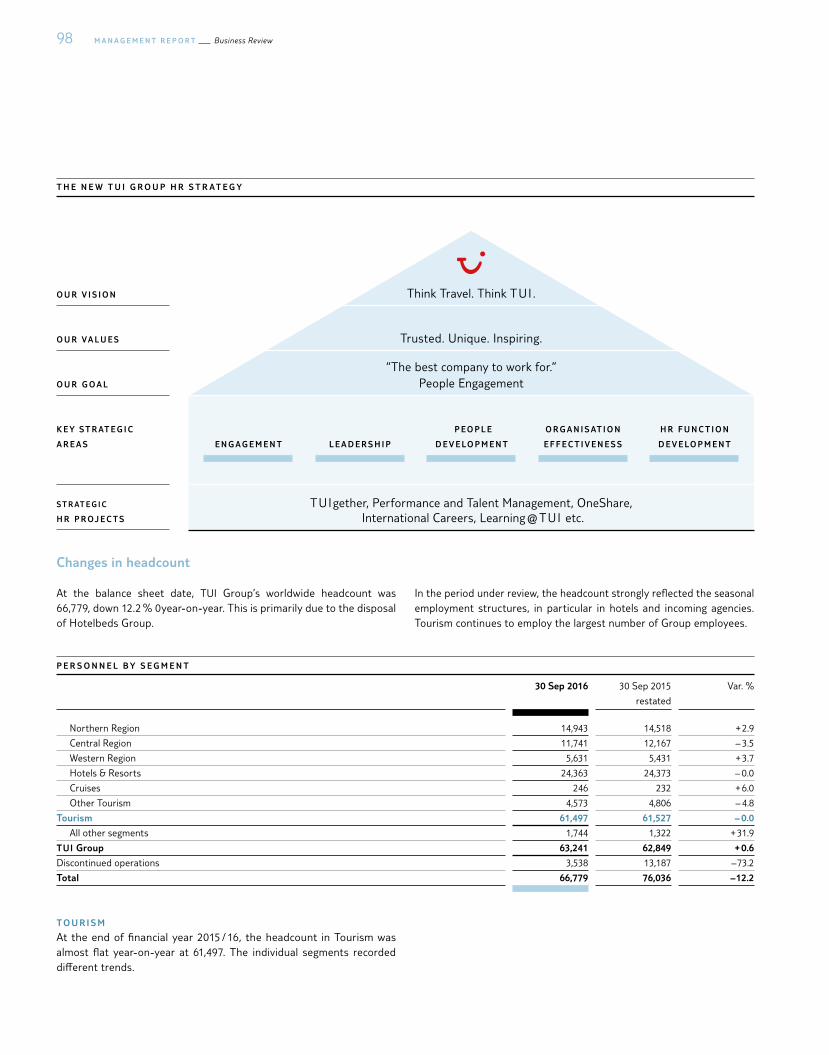
98 M A N A G E M E N T R E P O R T Business Review
Changes in headcount
At the balance sheet date, TUI Group’s worldwide headcount was 66,779, down 12.2 % 0year-on-year. This is primarily due to the disposal of Hotelbeds Group.
In the period under review, the headcount strongly reflected the seasonal employment structures, in particular in hotels and incoming agencies. Tourism continues to employ the largest number of Group employees.
P E R S O N N E L B Y S E G M E N T
30 Sep 2016 30 Sep 2015
restated
Var. %
Northern Region 14,943 14,518 + 2.9
Central Region 11,741 12,167 – 3.5
Western Region 5,631 5,431 + 3.7
Hotels & Resorts 24,363 24,373 – 0.0
Cruises 246 232 + 6.0
Other Tourism 4,573 4,806 – 4.8
Tourism 61,497 61,527 – 0.0
All other segments 1,744 1,322 + 31.9
TUI Group 63,241 62,849 + 0.6
Discontinued operations 3,538 13,187 – 73.2
Total 66,779 76,036 – 12.2
TO U R I S M
At the end of financial year 2015 / 16, the headcount in Tourism was almost flat year-on-year at 61,497. The individual segments recorded different trends.
T H E N E W T U I G R O U P H R S T R AT E G Y
K E Y ST R AT E G I C
A R E A S
S T R AT E G I C
H R P R OJ E C T S
O U R V I S I O N
O U R VA L U E S
O U R G O A L
Think Travel. Think TUI .
“The best company to work for.” People Engagement
Trusted. Unique. Inspiring.
E N G A G E M E N T
TUIgether, Performance and Talent Management, OneShare, International Careers, Learning @ TUI etc.
L E A D E R S H I P
P E O P L E
D E V E LO P M E N T
O R G A N I S AT I O N
E F F E C T I V E N E S S
H R F U N C T I O N
D E V E LO P M E N T

99Business Review M A N A G E M E N T R E P O R T
N O R T H E R N R E G I O N
Northern Region reported a year-on-year increase in headcount of 2.9 % to 14,943. This increase mainly resulted from recruitment in tour operation and the UK airline. On the other hand, Crystal Ski reported a slight reduction.
C E N T R A L R E G I O N
At the balance sheet date, Central Region recorded a headcount of 11,741, down 3.5 % year-on-year. The decline was driven by lower staffing numbers in Austria, Switzerland and Poland and in tour operation in Germany. In addition, 375 employees were transferred from TUI Customer Operations to TUI Business Services GmbH, a wholly owned subsidiary of TUI AG, in the period under review in order to further develop an international, source market-independent shared service platform. On the other hand, the headcount increased in the retail segment in Germany and at TUI Service AG.
W E S T E R N R E G I O N
Western Region saw an increase in headcount of 3.7 % to 5,631, primarily due to the increase in staffing numbers in tour operation in France, the Netherlands and Belgium.
H O T E L S & R E S O R T S
At the balance sheet date, Hotels & Resorts reported 24,363 employees, flat year-on-year. At 10,775, Riu Group, the largest hotel company in the portfolio, maintained its staffing number roughly at the prior year’s level. The increase in staff numbers driven by the opening of new hotel facilities was almost offset by the closure of hotels in Tunisia. Robinson
reported an increase in its headcount of 5.9 % to 3,586 due to new acquisitions.
C R U I S E S
The Cruises segment recorded a year-on-year increase in headcount of 6.0 % to 246, driven by the newbuild projects.
O T H E R TO U R I S M
Other Tourism reported a decline in headcount of 4.8 % to 4,573, essen-tially driven by the falling headcount for the TUI Destination Services platform in Turkey, Tunisia and Morocco. The headcount in IT was 434, up 12.7 % year-on-year.
A L L O T H E R S E G M E N T S
All other segments recorded an increase in headcount of 31.9 % to 1,744 year-on-year. In the Corporate Centre, the headcount rose by 86.5 % to 235, mainly due to the integration of Group functions and the creation of new functions. The headcount growth in All other segments was also driven by the first-time inclusion of TUI Business Services GmbH and growth in the longtail platform.
D I S CO N T I N U E D O P E R AT I O N
At the balance sheet date, the headcount in discontinued operations was 73.2 % down versus the prior year from 13,187 to 3,538. This was driven by the sale of Hotelbeds Group and LateRooms Group and the associated non-inclusion of around 9,000 employees. Specialist Group recorded a decline in its headcount of 8.1 % to 3,538, primarily due to the sale of companies such as the language tour operations, not forming part of the Specialist Group companies to be sold in one deal.
G L O B A L H E A D CO U N T
P E R S O N N E L B Y R E G I O N *
30 Sep 2016 30 Sep 2015
restated
Var. %
Germany 10,170 10,047 + 1.2
Great Britain 13,409 13,036 + 2.9
Spain 8,967 9,115 – 1.6
Other EU 19,895 19,301 + 3.1
North and South America 3,768 3,428 + 9.9
Other regions 7,032 7,922 – 11.2
TUI Group 63,241 62,849 + 0.6
Discontinued operations 3,538 13,187 – 73.2
Total 66,779 76,036 – 12.2
* By domicile of company

100 M A N A G E M E N T R E P O R T Business Review
* Excl. employees of the discontinued operationsIn brackets: previous year
As a global player, TUI Group operates in around 180 destinations worldwide with its employees. The number of employees working in Germany rose by 1.2 % to 10,170. The Group’s headcount in Europe in-creased by 1.8 % to 52,441, or 82.9 % of the Group’s overall headcount. Due to a reduction in the number of employees working in other re-gions, the headcount in non-European countries declined by 4.8 % to 10,800, or 17.1 % of the overall headcount. The year-on-year change is primarily driven by staff reductions in the destinations Tunisia, Morocco and Egypt.
Mixed leadership
As at 30 September 2016, the balance sheet date, the share of women as a proportion of the overall headcount was almost flat year-on-year at 56.0 %. The proportion of women in leadership positions decreased slightly from 31.3 % to 29.4 %.
The proportion of women on our German supervisory bodies continued to rise in the period under review. On 30 September 2016, women ac-counted overall for around 38 % of members, up 8 percentage points year-on-year. At TUI AG, the share of women on the Supervisory Board was already 35 %. The statutory requirements were therefore met.
In Germany, advantage was taken of the self-commitment mechanism provided for under the German Stock Corporation Act (AktG) and the Act on Limited Liability Companies (GmbHG) to fix specific targets for TUI AG, TUI Deutschland and TUI fly in financial year 2014 / 15. In finan-cial year 2015 / 16, implementation of these targets made good pro-gress. At the Executive Board and Management Board levels, the roles of Labour Director within TUI AG and TUI Deutschland were filled with female candidates. In the period under review, additional measures were initiated to promote female executives, in particular at the two management levels below the Executive Board, in the framework of the HR strategy.
P R O P O R T I O N O F W O M E N I N M A N A G E R I A L P O S I T I O N S 30 SEPTEMBER 2016
TUI AG TUI Deutschland TUI fly
% Actual Target Actual Target Actual Target
Executive Board one female
at least
one female 20 20 0 20
First management level below Executive Board 10 20 36 30 40 30
Second management level below Executive Board 22 30 40 40 44 40
P E R S O N N E L B Y R E G I O N * 30 SEPTEMBER 2016
(31) 32Rest of Europe
14 (14)Spain
16 (16)Germany
11 (13)Other regions
(5) 6North and
South America
(21) 21Great Britain
%

101Business Review M A N A G E M E N T R E P O R T
O T H E R S TA F F I N D I C AT O R S
TUI Group Germany
% 30 Sep 2016 30 Sep 2015 30 Sep 2016 30 Sep 2015
Employment structure
Number of employees 66,779 76,036 10,170 10,047
Employees – female 56.0 56.2 68.5 68.2
Females in managerial positions 29.4 31.3 32.8 32.6
Employees in part-time, total 18.8 19.7 36.4 35.8
Employees in part-time, female 28.8 28.7 46.1 44.7
Employees – fixed-term employment contract 33.1 30.8 15.5 16.0
Age structure
Employees up to 20 years 5.3 5.4 2.9 3.0
Employees 21 – 30 years 30.1 29.3 20.1 19.6
Employees 31 – 40 years 27.1 28.1 24.2 25.5
Employees 41 – 50 years 23.9 23.0 31.4 31.8
Employees more than 50 years 13.6 14.2 21.4 20.1
Average company affiliation
up to 5 years 54.3 56.9 33.2 33.0
6 – 10 years 15.8 17.0 13.3 14.5
11 – 20 years 20.2 17.8 31.8 32.5
21 – 30 years 7.6 6.6 16.9 15.2
more than 30 years 2.1 1.7 4.8 4.8
Vocational training in Germany
Number of trainees 569 576
Trainees – female 79.3 80.6
Training rate 5.7 5.8
Number of trainees gained certification in finanical year 183 171
Hiring rate 70.5 67.8
Personnel costs
The pay package offered by the TUI Group reflects the appropriateness of compensation and customary market rates. It varies in its composi-tion, as it is influenced by framework conditions in different countries and companies. Depending on the function concerned, a fixed basic sal-ary may go hand in hand with variable components. TUI Group uses these variable factors to honour individual performance and to enable employees to participate in the Company’s strategic and long-term suc-cess. Moreover, senior management have share options and are thus able to benefit directly when the Company grows in value.
In the period under review, the TUI Group’s personnel costs declined by 1.4 % to € 2,272.0 m. The year-on-year decrease in expenses for wages and salaries was mainly attributable to foreign exchange effects and higher expenses incurred in the prior year in connection with restruc-turing measures. Moreover, expenses for share-based payments carried in administrative expenses declined year-on-year due to changes in the structure of remuneration models and the development of the share price. An opposite trend was reported by the operating areas, in par-ticular airlines and hotels, some of which recorded a year-on-year in-crease in personnel costs. This trend is reflected in a slight overall in-crease in the cost of sales.
P E R S O N N E L C O S T S
€ million
2015 / 16 2014 / 15
restated
Var. %
Wages and salaries 1,846.7 1,869.7 – 1.2
Social security
contributions 425.3 435.7 – 2.4
Total 2,272.0 2,305.4 – 1.4
P E N S I O N S C H E M E S
The companies in the TUI Group offer their employees benefits from the company-based pension schemes funded by the employer. Options for the employees include pension schemes, direct insurance contracts and individual or direct commitments to build up a private pension. These schemes were devised so as to take advantage of fiscal and social security co-sponsorship opportunities. To enable their employees to convert their gross pay into pension contributions, TUI AG has conclud-ed advantageous collective contracts with an established insurance un-dertaking, and all our German employees can sign up to these.

102 M A N A G E M E N T R E P O R T Business Review
PA R T-T I M E E A R LY R E T I R E M E N T
In order to further increase the flexibility of their company HR and suc-cession planning, Group companies in Germany are able to make use of the opportunities provided under the German Part-Time Early Retire-ment Act to shift gradually from employment to retirement. At the bal-ance sheet date, € 9.6 m was provided through a capital investment model for the 180 employees working under part-time early retirement contracts in order to hedge their accrued assets against employer insol-vency.
S E C U R I T Y, H E A LT H & S A F E T Y
In the framework of the integration process, Security, Health & Safety has been integrated across all companies and further expanded. The goal of the new structure is to guarantee comprehensive Group-wide safety management based on common safety standards, and coordi-nated workflows ensuring networked, aligned action. The analyses per-formed under this Group-wide safety management system provide the
basis for the definition of prevention measures, framework concepts and guidelines for action in Security, Health & Safety, which are used across the Group. The effectiveness of these measures is continually evaluated.
In addition, well-coordinated event and crisis management ensures that rapid, structured and comprehensive support is provided to our cus-tomers and employees if needed, drawing on the resources and experi-ence of a globally operating tourism group. To this end, TUI has estab-lished a structure including crisis centres that coordinate all measures required in the event of an incident, emergency care teams to support our guests locally in emergency and crisis situations, and close contacts with the foreign offices in the source markets and foreign ministries worldwide. TUI benefits from the interdisciplinary networking of exper-tise in different areas. Our employees contribute the experience they have gained in tourism, crisis management and security agencies to TUI Group’s integrated Group-wide safety management concept.
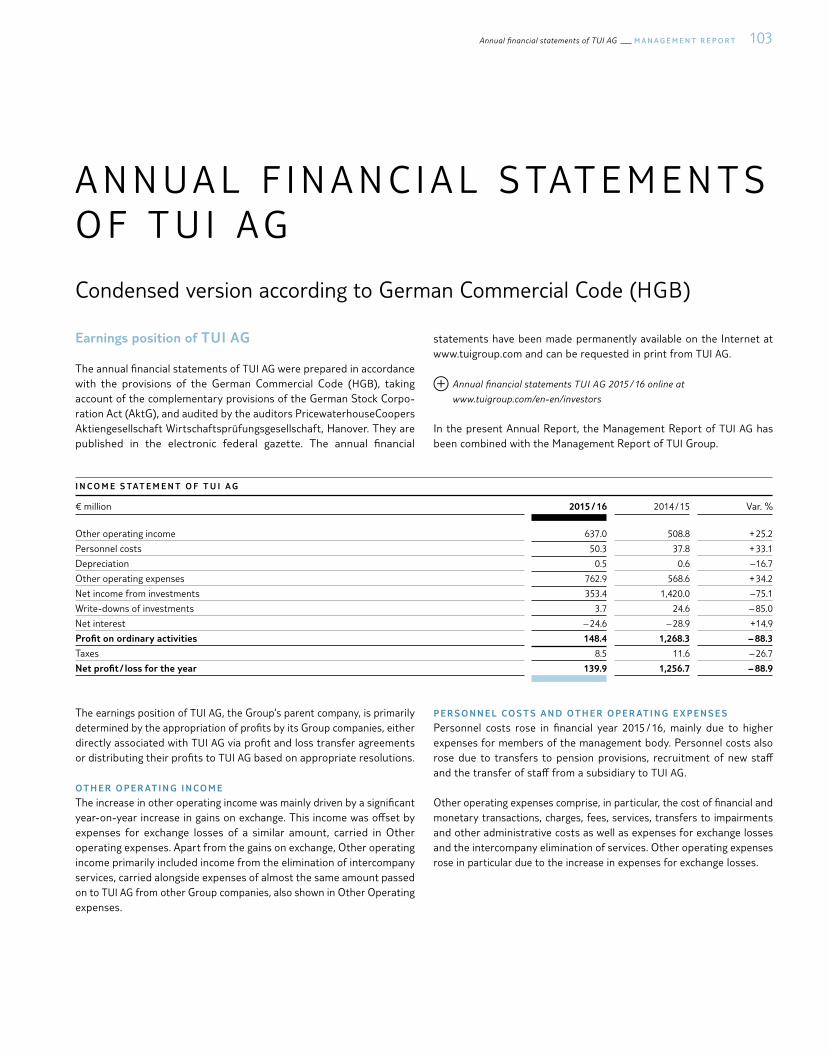
103Annual financial statements of TUI AG M A N A G E M E N T R E P O R T
A N N U A L F I N A N C I A L S TAT E M E N T S O F T U I A G
Condensed version according to German Commercial Code (HGB)
Earnings position of TUI AG
The annual financial statements of TUI AG were prepared in accordance with the provisions of the German Commercial Code (HGB), taking account of the complementary provisions of the German Stock Corpo-ration Act (AktG), and audited by the auditors PricewaterhouseCoopers Aktiengesellschaft Wirtschaftsprüfungsgesellschaft, Hanover. They are published in the electronic federal gazette. The annual financial
statements have been made permanently available on the Internet at www.tuigroup.com and can be requested in print from TUI AG.
Annual financial statements TUI AG 2015 / 16 online at
www.tuigroup.com/en-en/investors
In the present Annual Report, the Management Report of TUI AG has been combined with the Management Report of TUI Group.
I N C O M E S TAT E M E N T O F T U I A G
€ million 2015 / 16 2014 / 15 Var. %
Other operating income 637.0 508.8 + 25.2
Personnel costs 50.3 37.8 + 33.1
Depreciation 0.5 0.6 – 16.7
Other operating expenses 762.9 568.6 + 34.2
Net income from investments 353.4 1,420.0 – 75.1
Write-downs of investments 3.7 24.6 – 85.0
Net interest – 24.6 – 28.9 + 14.9
Profit on ordinary activities 148.4 1,268.3 – 88.3
Taxes 8.5 11.6 – 26.7
Net profit / loss for the year 139.9 1,256.7 – 88.9
The earnings position of TUI AG, the Group’s parent company, is primarily determined by the appropriation of profits by its Group companies, either directly associated with TUI AG via profit and loss transfer agreements or distributing their profits to TUI AG based on appropriate resolutions.
O T H E R O P E R AT I N G I N CO M E
The increase in other operating income was mainly driven by a significant year-on-year increase in gains on exchange. This income was offset by expenses for exchange losses of a similar amount, carried in Other operating expenses. Apart from the gains on exchange, Other operating income primarily included income from the elimination of intercompany services, carried alongside expenses of almost the same amount passed on to TUI AG from other Group companies, also shown in Other Operating expenses.
P E R S O N N E L CO S T S A N D O T H E R O P E R AT I N G E X P E N S E S
Personnel costs rose in financial year 2015 / 16, mainly due to higher expenses for members of the management body. Personnel costs also rose due to transfers to pension provisions, recruitment of new staff and the transfer of staff from a subsidiary to TUI AG.
Other operating expenses comprise, in particular, the cost of financial and monetary transactions, charges, fees, services, transfers to impairments and other administrative costs as well as expenses for exchange losses and the intercompany elimination of services. Other operating expenses rose in particular due to the increase in expenses for exchange losses.
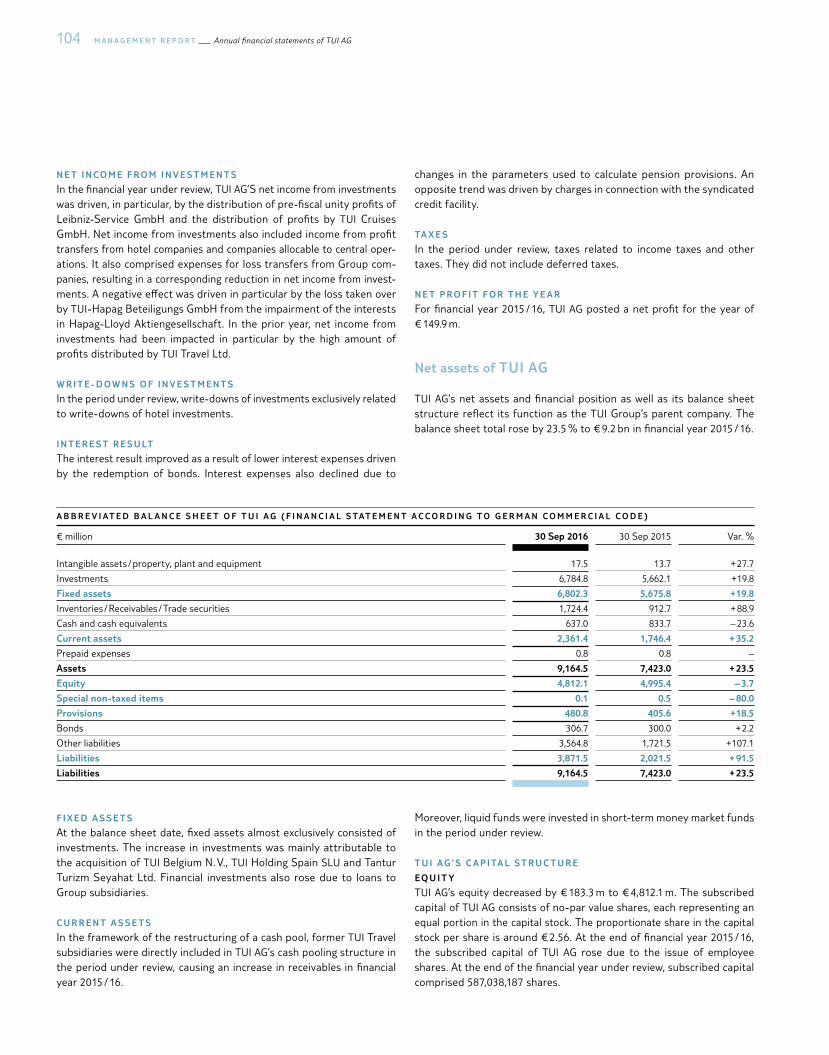
104 M A N A G E M E N T R E P O R T Annual financial statements of TUI AG
N E T I N CO M E F R O M I N V E S T M E N T S
In the financial year under review, TUI AG’S net income from investments was driven, in particular, by the distribution of pre-fiscal unity profits of Leibniz-Service GmbH and the distribution of profits by TUI Cruises GmbH. Net income from investments also included income from profit transfers from hotel companies and companies allocable to central oper-ations. It also comprised expenses for loss transfers from Group com-panies, resulting in a corresponding reduction in net income from invest-ments. A negative effect was driven in particular by the loss taken over by TUI-Hapag Beteiligungs GmbH from the impairment of the interests in Hapag-Lloyd Aktiengesellschaft. In the prior year, net income from investments had been impacted in particular by the high amount of profits distributed by TUI Travel Ltd.
W R I T E - D O W N S O F I N V E S T M E N T S
In the period under review, write-downs of investments exclusively related to write-downs of hotel investments.
I N T E R E S T R E S U LT
The interest result improved as a result of lower interest expenses driven by the redemption of bonds. Interest expenses also declined due to
changes in the parameters used to calculate pension provisions. An opposite trend was driven by charges in connection with the syndicated credit facility.
TA X E S
In the period under review, taxes related to income taxes and other taxes. They did not include deferred taxes.
N E T P R O F I T F O R T H E Y E A R
For financial year 2015 / 16, TUI AG posted a net profit for the year of € 149.9 m.
Net assets of TUI AG
TUI AG’s net assets and financial position as well as its balance sheet structure reflect its function as the TUI Group’s parent company. The balance sheet total rose by 23.5 % to € 9.2 bn in financial year 2015 / 16.
A B B R E V I AT E D B A L A N C E S H E E T O F T U I A G ( F I N A N C I A L S TAT E M E N T A C C O R D I N G T O G E R M A N C O M M E R C I A L C O D E )
€ million 30 Sep 2016 30 Sep 2015 Var. %
Intangible assets / property, plant and equipment 17.5 13.7 + 27.7
Investments 6,784.8 5,662.1 + 19.8
Fixed assets 6,802.3 5,675.8 + 19.8
Inventories / Receivables / Trade securities 1,724.4 912.7 + 88.9
Cash and cash equivalents 637.0 833.7 – 23.6
Current assets 2,361.4 1,746.4 + 35.2
Prepaid expenses 0.8 0.8 –
Assets 9,164.5 7,423.0 + 23.5
Equity 4,812.1 4,995.4 – 3.7
Special non-taxed items 0.1 0.5 – 80.0
Provisions 480.8 405.6 + 18.5
Bonds 306.7 300.0 + 2.2
Other liabilities 3,564.8 1,721.5 + 107.1
Liabilities 3,871.5 2,021.5 + 91.5
Liabilities 9,164.5 7,423.0 + 23.5
F I X E D A S S E T S
At the balance sheet date, fixed assets almost exclusively consisted of investments. The increase in investments was mainly attributable to the acquisition of TUI Belgium N. V., TUI Holding Spain SLU and Tantur Turizm Seyahat Ltd. Financial investments also rose due to loans to Group subsidiaries.
C U R R E N T A S S E T S
In the framework of the restructuring of a cash pool, former TUI Travel subsidiaries were directly included in TUI AG’s cash pooling structure in the period under review, causing an increase in receivables in financial year 2015 / 16.
Moreover, liquid funds were invested in short-term money market funds in the period under review.
T U I AG ’ S C A P I TA L S T R U C T U R E
E Q U I T Y
TUI AG’s equity decreased by € 183.3 m to € 4,812.1 m. The subscribed capital of TUI AG consists of no-par value shares, each representing an equal portion in the capital stock. The proportionate share in the capital stock per share is around € 2.56. At the end of financial year 2015 / 16, the subscribed capital of TUI AG rose due to the issue of employee shares. At the end of the financial year under review, subscribed capital comprised 587,038,187 shares.

105Annual financial statements of TUI AG M A N A G E M E N T R E P O R T
In financial year 2015 / 16, the capital reserve rose by a total of € 2.7 m due to the issue of employee shares. Revenue reserves exclusively consisted of other revenue reserves. The Articles of Association do not contain any provisions concerning the formation of reserves.
The profit for the year amounted to € 139.9 m. Taking account of the profit carried forward of € 682.4 m, net profit available for distribution totalled € 822.3 m. A proposal will be submitted to the Annual General Meeting to use the net profit available for distribution for the financial year under review to distribute a dividend of € 0.63 per no-par value share and to carry the amount of € 452.5 m, remaining after deduction of the dividend total of € 369.8 m, forward on new account. The equity ratio declined to 52.5 % (previous year 67.3 %) in financial year 2015 / 16.
P R OV I S I O N S
Provisions increased by € 75.2 m to € 480.8 m. They consisted of pension provisions worth € 134.8 m (previous year € 139.0 m) and other provisions worth € 346.0 m (previous year € 266.6 m).
Other provisions increased year-on-year, in particular due to the use of provisions formed for the assumptions of risks in the framework of the sale of Hotelbeds Group and an increase in provisions for invoices out-standing. An opposite effect arose from the decline in provisions for onerous losses from derivative financial instruments.
L I A B I L I T I E S
TUI AG’s liabilities totalled € 3,871.5 m, up by € 1,850.0 m or 91.5 %.
In September 2014, TUI AG issued an unsecured bond worth € 300.0 m maturing on 1 October 2019. Due to the issue of bonds with a lower interest coupon, TUI AG cancelled the bond on 18 November 2016 and repaid it ahead of its maturity date.
The increase in other liabilities was also associated with the restructuring of a cash pool of former TUI Travel subsidiaries, which were included in TUI AG’s cash pool. Moreover, Group companies fed their gains from the disposal of stakes in Hotelbeds Group into TUI AG’s cash pooling system, resulting in a considerable increase in liabilities to Group companies.
TUI’s net financial position (funds and marketable securities less bonds) improved year-on-year, amounting to a clearly positive position of € 630.2 m in the period under review.
C A P I TA L AU T H O R I S AT I O N R E S O L U T I O N S
Information on new or existing resolutions concerning capital author-isation, adopted by Annual General Meetings, is provided in the next chapter on Information Required under Takeover Law.

106 M A N A G E M E N T R E P O R T TUI share
T U I S H A R E
TUI share price performance reflects challenging market environment this year
The TUI share performed well at the start of the financial year, but was subsequently impacted by the challenging market environment. The terrorist attacks in Paris on 13 November 2015, in particular, resulted in a slump in equity prices on international stock exchanges.
Supported by the best business results in the history of the Company, the TUI share price climbed during December, before the attacks in Istanbul in early 2016 again impacted tourism shares. In February 2016, market participants were unsettled by the slump in oil prices, which drove international lead indices further into losses.
In the course of the financial year, the TUI share was caught, time and again, between sound operating results and macroeconomic as well as geopolitical turbulence. While the TUI share was supported by a strong overall trading performance and half-year results in March and May 2016, the terrorist attacks in Ankara, Brussels and Nice impacted the financial markets.
Major stock market distortions also followed the British decision on 23 June 2016 to leave the EU, and concerns about the consequences of
Brexit impacted share prices, in particular for shares exposed to the UK source market.
In August and September 2016, the TUI share recovered again, benefiting from sound interim results and a good trading performance. This once again demonstrated the strength of the integrated business model and the success of the Group’s content-centric strategy.
T U I S H A R E D ATA
30 September 2016
WKN TUAG00
ISIN DE000TUAG000
Stock exchange centres London, Xetra, Hannover
Reuters / Bloomberg TUIGn.DE/TUI1.GR (Frankfurt);
TUIT.L/TUI:LN (London)
Stock category Registered ordinary shares
Capital stock € 1,500,739,295
Number of shares 587,038,187
Market capitalisation bn € 7.4
Market capitalisation bn £ 6.4
20
in %
10
0
– 10
– 20
– 30
– 40
– 50
T U I S H A R E P R I C E (FINANCIAL YEAR 2015/16)
TUI Xetra TUI London FTSE 100 STOXX 600 Travel & Leisure
30 SEPTEMBER 2015 30 SEPTEMBER 2016

107TUI share M A N A G E M E N T R E P O R T
L O N G -T E R M D E V E L O P M E N T O F T H E T U I S H A R E ( X E T R A )
€ 2011 / 12 2012 / 13 2013 / 14 2014 / 15 2015 / 16
High 9.05 10.86 6.97 17.71 17.21
Low 4.69 3.68 3.14 9.84 10.17
Year-end share price 8.98 3.88 6.70 16.35 12.69
Quotations, indices and trading
The TUI share has its primary listing in the Premium segment of the Main Market of the London Stock Exchange and is listed in the FTSE UK Index series including FTSE 100, the UK’s major share index. It also has a secondary listing in the electronic trading system Xetra and at the Hanover Stock Exchange.
Among the sustainability indices, TUI was listed for the eleventh time running in the renowned Dow Jones Sustainability Index (DJSI) in Sep-tember 2016. TUI was, moreover, the only tourism group to feature in both the World and Europe indices. TUI Group is furthermore recog-nised as industry leader. At this year’s review of the composition of the index, the Company achieved top scores in the categories Corporate Citizenship, Climate Strategy and Eco-Efficiency. TUI is likewise listed in the sustainability indices FTSE4Good, STOXX Global ESG Leaders Index and ECPI Ethical Index €uro and is a member of the CDP Climate Dis-closure Leadership Index in the UK and Germany.
In financial year 2015 / 16, the average daily trading volume at the London Stock Exchange was around 1.1 million shares, while around 0.7 million shares were traded on Xetra. Both the sterling and the euro line therefore recorded strong liquidity in trading by institutional and private investors.
Analyst recommendations
For institutional and private investors, analyses and recommendations by financial analysts are a key decision-making factor. In the financial year under review, more than 20 analysts regularly published studies on TUI. In September 2016, 82 % of analysts issued a recommendation to “buy” the TUI share, with 18 % recommending “hold”. None of the analysts recommended “sell”.
Shareholder structure
82Buy
18Hold
A N A LY S T S ’ R E C O M M E N D AT I O N S
30 SEPTEMBER 2016
%
61EU
72Institutional
investors
15North America
6 Private investors
3 Riu Hotels S. A.
19Alexey Mordashov
23Other
S H A R E H O L D E R S T R U C T U R E
30 SEPTEMBER 2016
G E O G R A P H I C A L S H A R E H O L D E R S T R U C T U R E
30 SEPTEMBER 2016
%%

108 M A N A G E M E N T R E P O R T TUI share
At the end of financial year 2015 / 16, around 81 % of TUI shares were in free float. Around 6 % of all TUI shares were held by private shareholders, around 72 % by institutional investors and financial institutes and
around 22 % by strategic investors. Analysis of the share register shows that most shares were held by investors from EU countries.
The current shareholder structure and the voting right notifications pursuant
to section 26 of the German Securities Trading Act are available online at
www.tuigroup.com/en-en/investors
Dividend
D E V E L O P M E N T O F D I V I D E N D S A N D E A R N I N G S O F T H E T U I S H A R E
€ 2011 / 12 2012 / 13 2013 / 14 2014 / 15 2015 / 16
Earnings per share – 0.16 – 0.14 + 0.26 + 0.64 + 1.78
Dividend – 0.15 0.33 0.56 0.63
TUI AG’s profit for the year amounted to € 139.9 m. Taking account of the profit carried forward of € 682.4 m, net profit available for distribution totaled € 822.3 m. A proposal will be submitted to the Annual General Meeting to use the net profit available for distribution for the financial year under review to distribute a dividend of € 0.63 per no-par value share and to carry the amount of € 452.5 m, remaining after deduction of the dividendtotal of € 369.8 m, forward on new account.
Investor Relations
Open and continuous dialogue and transparent communication form the basis for confidence in our dealings with shareholders, institutional investors, equity and credit analysts and lenders. Many discussions were held with TUI shareholders and bondholders; they centred on Group strategy and the development of business in the various Sectors, enabling stakeholders to make a realistic assessment of TUI’s future development.
More details about Investor Relations online at
www.tuigroup.com/en-en/investors
Apart from the development of business operations in Tourism, Investor Relations activities in the period under review focused in particular on exogenous impacts on the business model and the growth strategies of the integrated tourism group. TUI’s management team commented on these central issues at roadshows in London, Frankfurt, Paris, Edinburgh, Stockholm, Copenhagen, Zurich, Milan, Amsterdam, Brussels, New York, Philadelphia and Boston.
Questions from analysts and investors were also discussed at the con-ference calls held upon publication of interim reports, during analysts’ meetings, at many investor conferences in Europe and the US and at numerous one-on-ones. Many of these meetings were personally attend-ed by management.
Investor Relations also makes every effort to engage in direct contact with private investors. The IR team sought dialogue with this target group on many occasions, such as events organised by shareholder associations. Another key platform for exchanges with private share-holders was the IR stall at TUI’s Annual General Meeting. TUI also uses a new website to address its private investors. Apart from the compre-hensive information that is made available, online, quarterly updates are hosted via conference cells and can be listened live through our Investor Relations website.

109Information required under takeover law M A N A G E M E N T R E P O R T
I N F O R M AT I O N R E Q U I R E D U N D E R TA K E O V E R L AW
pursuant to sections 289 (4) and 315 (4) of the German Commercial Code (HGB) and explanatory report
Composition of subscribed capital
The subscribed capital of TUI AG consists of no-par value shares, each representing an equal share of the capital stock. As a proportion of the capital stock, the value of each share is around € 2.56.
The subscribed capital of TUI AG, registered in the commercial registers of the district courts of Berlin-Charlottenburg and Hanover, consisted of 587,038,187 shares at the end of financial year 2015 / 16 (previous year 586,603,217 shares) and totalled € 1,500,739,294.83. Each share confers one vote at the Annual General Meeting.
R E S T R I C T I O N S O N VO T I N G R I G H T S A N D S H A R E T R A N S F E R S
The Executive Board of TUI AG is not aware of any restrictions on voting rights or the transfer of shares.
E Q U I T Y I N T E R E S T S E XC E E D I N G 10 % O F T H E VO T I N G R I G H T S
The Executive Board of TUI AG has been notified of the following direct or indirect equity interests reaching or exceeding 10 % of the voting rights:
Alexey Mordashov, Russia, notified us on 25 November 2015 pursuant to section 21 (1) of the German Securities Trading Act that the voting shares in TUI AG, Hanover, Germany, attributable to him exceeded the 15 % threshold on 20 November 2015. As per that date, voting shares totalling 15.02 % (or 88,146,961 voting rights) were attributable to Alexey Mordashov pursuant to section 22 sentence 1 no. 1 of the German Secur-ities Trading Act.
At the end of financial year 2015 / 16, around 81 % of TUI shares were in free float. Around 6 % of all TUI shares were held by private shareholders, around 72 % by institutional investors and financial institutions, and around 22 % by strategic investors. According to an analysis of the share register, most shares are held by investors in the European Union.
Shares with special control rights
There have not been any shares, nor are there any shares, with special control rights.
System of voting right control of any employee share scheme where the control rights are not exercised directly by the employees
Where TUI AG grants shares to employees under its employee share programme, the shares are directly transferred to the employees with a lock-up period. Beneficiaries are free to directly exercise the control rights to which employee shares entitle them, in just the same way as other shareholders, in line with legal requirements and the provisions of the Articles of Association.
Appointment and removal of Executive Board members and amendments to the Articles of Association
The appointment and removal of Executive Board members is based on sections 84 et seq. of the German Stock Corporation Act in combination with section 31 of the German Codetermination Act. Amendments to the Articles of Association are based on the provisions of sections 179 et seq. of the German Stock Corporation Act in combination with sec-tion 24 of the Articles of Association of TUI AG.
Powers of the Executive Board to issue or buy back shares
The Annual General Meeting of 9 February 2016 authorised TUI AG’s Executive Board to acquire own shares of up to 5 % of the capital stock. The authorisation will expire on 8 August 2017. To date, the option to acquire own shares has not been used.
Conditional capital of € 150.0 m was resolved by the Annual General Meeting of 9 February 2016. Bonds with conversion options or warrants as well as profit-sharing rights and income bonds (with or without fixed terms) of up to a nominal amount of € 2.0 bn may be issued up to 8 February 2021.

110 M A N A G E M E N T R E P O R T Information required under takeover law
The Annual General Meeting of 13 February 2013 adopted a resolution to create authorised capital for the issue of employee shares worth € 10.0 m. The Executive Board of TUI AG is authorised to use this ap-proved capital by 12 February 2018 in one or several transactions by issuing employee shares against cash contribution. In the completed financial year, 434,970 new employee shares were issued, resulting in authorised capital of around € 8.3 m at the balance sheet date.
The Annual General Meeting of 28 October 2014 adopted a resolution to create authorised capital for the issue of new shares against cash contribution worth € 18.0 m in order to be able to fulfil claims for shares in TUI Travel granted by TUI Travel to its employees in the form of new shares in TUI AG. The authorisation for this approved capital ends on 27 October 2019.
The Annual General Meeting of 9 February 2016 adopted a resolution to create authorised capital for the issue of new registered shares against cash contribution worth a maximum of € 150.0 m. The authorisation will expire on 8 February 2021.
The Annual General Meeting on 9 February 2016 also resolved to create conditional capital to issue new shares of € 570.0 m against cash contri-butions or contributions in kind. The issue of new shares against contri-butions in kind has been limited to € 300.0 m. The authorisation for this conditional capital will expire on 8 February 2021.
Significant agreements taking effect in the event of a change of control of the Company following a takeover bid, and the resulting effects
Some of TUI AG’s outstanding financing instruments contain change of control clauses. A change of control occurs in particular if a third partly directly or indirectly acquires control over at least 50 % or the majority of the voting shares in TUI AG.
In the event of a change of control, the holders of the fixed-interest bond worth € 300.0 m from October 2016 (and the bond worth € 300.0 m from September 2014 repaid in November 2016) must be offered a buyback.
For the syndicated credit line worth € 1.75 bn, of which € 120.5 m had been used via bank guarantees as at the balance sheet date, a right of termination by the lenders has been agreed in the event of a change of control. This also applies to several bilateral guarantee lines with a total volume of £ 98.5 m, concluded with various insurance companies. At the balance sheet date, an amount of 48.6 m pounds had been used.
Beyond this, there are no agreements in guarantee, leasing, option or other financial contracts that might cause material early redemption obligations that would be of significant relevance for the Group’s liquidity.
Apart from the financing instruments mentioned above, a framework agreement between the Riu family and TUI AG includes a change of con-trol clause. A change of control occurs if a shareholder group represents a predefined majority of AGM attendees or if one third of the share-holder representatives on the Supervisory Board are attributable to a shareholder group. In the event of a change of control, the Riu family is entitled to acquire at least 20 % and at most all shares held by TUI in RIUSA II S. A.
A similar agreement concerning a change of control at TUI AG has been concluded with the El Chiaty Group. Here, too, a change of control occurs if a shareholder group represents a predefined majority of AGM attendees or if one third of the shareholder representatives on the Supervisory Board are attributable to a shareholder group. In that case, the El Chiaty Group is entitled to acquire at least 15 % and at most all shares held by TUI in the joint hotel companies in Egypt and the United Arab Emirates.
A change of control agreement has also been concluded for the joint venture TUI Cruises between Royal Caribbean Cruises Ltd and TUI AG for the event that a change of control occurs in TUI AG. The agreement gives the partner the right to demand termination of the joint venture and to purchase the stake held by TUI AG at a price which is lower than the selling price of their own stake.
Compensation agreements between the Company and Executive Board members or employees in the event of a takeover bid have not been concluded.

111Report on subsequent events M A N A G E M E N T R E P O R T
R E P O R T O N S U B S E Q U E N T E V E N T S
On 26 October 2016, TUI AG issued a fixed-interest bond with a coupon of 2,125 % p.a. and a nominal volume of € 300.0 m. The bond was issued at a price of 99,415 % in denominations with nominal values of € 100,000. It will mature on 26 October 2021.
On 18 November 2016, TUI AG redeemed the fixed-interest bond issued on 26 September 2014, originally maturing on 1 October 2019, ahead of maturity. The bond was redeemed at a price of 102.25 % plus accrued interest. The cash inflow of € 298.2 m received by TUI AG from issuing the bond on 26 October 2016 was used to redeem the bond.
On 21 June 2016, TUI had concluded an agreement with Transat A.T. Inc. to acquire tour operator Transat France S. A., France, and its subsidiaries for a purchase price of € 64.9 m. Following regulatory approvals, the ac-
quisition was completed on 31 October 2016. For further details on the acquisition, reference is made to the section on Acquisitions – Divestments – Discontinued Operations.
On 23 November 2016, the supervisory board of TUI AG approved the agreement of a term sheet with Etihad Aviation Group. This agreement is the basis for the acquisition of a minority share in a company through the contribution of the shares in TUIfly GmbH. The Etihad Group will also invest in this company. The minority share is likely to be accounted for at equity. It is expected that the contractual negotiations will be finalised within the next few weeks. The transaction is subject to approval of the relevant aviation and competition authorities.