01 fr mp sulawesi regional-1 engopen_jicareport.jica.go.jp/pdf/11881372_02.pdf · and industries....
TRANSCRIPT
NATIONAL DEVELOPMENT PLANNING AGENCY and MINISTRY OF PUBLIC WORKS Study associated with Arterial Road Network Development Plan for Sulawesi Island
SULAWESI ISLAND
DEVELOPMENT FRAMEWORK AND STRATEGY
March 2008
JAPAN INTERNATIONAL COOPERATION AGENCY MAKASSAR FIELD OFFICE

Currency Equivalents
US Dollar 1 = Indonesian Rupiah 9,322 (As of 16 May 2007)

General Map of Sulawesi Island

PREFACE
In collaboration with the National Development Planning Agency (BAPPENAS) and the Ministry of Public Works, Japan International Cooperation Agency (JICA) has carried out the Study on Arterial Road Network Development Plan for Sulawesi Island during the period from November 2006 to March 2008. In the course of this study, various analyses has been made on the settings and prospects for development of Sulawesi Island and several workshops have been held to exchange views on the development framework and strategy. These studies and views have formed a basis of the formulation of a master plan on the arterial road network over the island.
This report summarizes the results of studies on the development framework and strategy of Sulawesi Island towards the year 2024, in line with the “National Long-term Development Plan for 2005-2025” (Law No.17 of 2007). It is expected that the development framework and strategy would be referred to in various studies and plans aimed at social and economic development of Sulawesi Island, as well as plans for provincial and other sub-regional development, and that the framework and strategy would be refined through such studies and plans in the future.


Sulawesi Island Development Framework and Strategy
SUMMARY
01 Sulawesi Island, with an area of about 174,600 ㎢, is the major focus for the development of Eastern and Northeastern Indonesia. Administratively, Sulawesi is composed of six provinces, i.e., North Sulawesi, Gorontalo, Central Sulawesi, West Sulawesi, South Sulawesi and Southeast Sulawesi. The terrain is mostly mountainous, and flat lands (below 50 m above mean sea level) account only for 10.3% of the total land area. Due to tropical climates and complex geological history, Sulawesi has unique fauna and flora, called “Wallacea” Most endemic and essential species of plants, mammals, birds, reptiles and amphibians inhabit in the conservation areas that extend for about 35,000 ㎢ (about 20% of the island). The forest area covers about 53% of Sulawesi Island. The unique environments of the island should be preserved to the utmost extent.
02 The development vision of Sulawesi is set to create a comfortable environment for the Sulawesi people and their descendents to live in for centuries to come. More specifically, two objectives are proposed for the development direction; i.e., (i) to sustain harmony among the natural, social and economic environments, and (ii) to shift a paradigm to more actively tackle social injustice on their own initiative, eradicating poverty, conflicts, pollution and other negative factors for social and economic development.
03 The National Spatial Plan (RTRWN), renewed in 2007, defines that Sulawesi would be developed as an area of national granary, horticulture, plantations, ranchers, natural resources, tourism, oil-gas industry, mining and processing industry. The RTRWN also specifies 26 prioritized areas (PAs) and five national activity centers (PKNs), in addition to four integrated economic development zones (KAPETs). Through view of the existing plans, as well as on the basis of studies on constraints and potentials for development, a spatial structure of Sulawesi is newly proposed so that Makassar (or Mamminasata metropolitan area), Manado (or Bimido area) and Palu would be developed as international/inter-regional centers. These centers and five other inter-regional centers (Gorontalo, Luwuk, Mamuju, Parepare and Kendari) would be strategically developed as “growth poles” for integrated regional development. The growth poles would promote linkages and networks with the surrounding areas in order to attain balanced and harmonized development over the island. They would also serve to preserve micro echo-system in each region and mitigate the environmental impacts as a whole. A land development pattern for Sulawesi is proposed to promote linkages over the island.
04 Social framework for development of Sulawesi Island has been discussed and defined in terms of population and work force at the province and regency (Kabupaten) levels. After review of the trends of population growth and projection by BAPPENAS, as well as based on the 2005 inter-census and estimate of inter-provincial migratory movements, the regency-based population has been estimated together with the urban/rural population and agriculture/non-agriculture labor force. The demographic framework proposed under this study could be referred to in the formulation of province and regency development plans.
Sulawesi Island Development Framework and Strategy
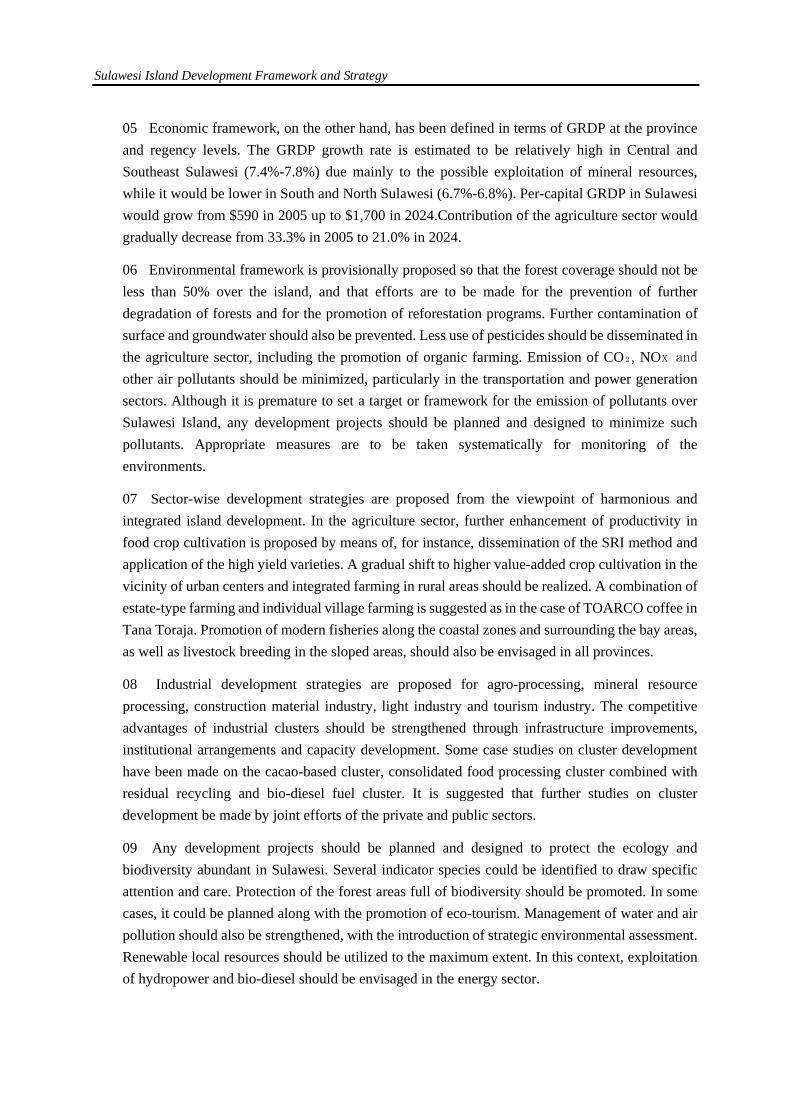
05 Economic framework, on the other hand, has been defined in terms of GRDP at the province and regency levels. The GRDP growth rate is estimated to be relatively high in Central and Southeast Sulawesi (7.4%-7.8%) due mainly to the possible exploitation of mineral resources, while it would be lower in South and North Sulawesi (6.7%-6.8%). Per-capital GRDP in Sulawesi would grow from $590 in 2005 up to $1,700 in 2024.Contribution of the agriculture sector would gradually decrease from 33.3% in 2005 to 21.0% in 2024.
06 Environmental framework is provisionally proposed so that the forest coverage should not be less than 50% over the island, and that efforts are to be made for the prevention of further degradation of forests and for the promotion of reforestation programs. Further contamination of surface and groundwater should also be prevented. Less use of pesticides should be disseminated in the agriculture sector, including the promotion of organic farming. Emission of CO₂, NOx and
other air pollutants should be minimized, particularly in the transportation and power generation sectors. Although it is premature to set a target or framework for the emission of pollutants over Sulawesi Island, any development projects should be planned and designed to minimize such pollutants. Appropriate measures are to be taken systematically for monitoring of the environments.
07 Sector-wise development strategies are proposed from the viewpoint of harmonious and integrated island development. In the agriculture sector, further enhancement of productivity in food crop cultivation is proposed by means of, for instance, dissemination of the SRI method and application of the high yield varieties. A gradual shift to higher value-added crop cultivation in the vicinity of urban centers and integrated farming in rural areas should be realized. A combination of estate-type farming and individual village farming is suggested as in the case of TOARCO coffee in Tana Toraja. Promotion of modern fisheries along the coastal zones and surrounding the bay areas, as well as livestock breeding in the sloped areas, should also be envisaged in all provinces.
08 Industrial development strategies are proposed for agro-processing, mineral resource processing, construction material industry, light industry and tourism industry. The competitive advantages of industrial clusters should be strengthened through infrastructure improvements, institutional arrangements and capacity development. Some case studies on cluster development have been made on the cacao-based cluster, consolidated food processing cluster combined with residual recycling and bio-diesel fuel cluster. It is suggested that further studies on cluster development be made by joint efforts of the private and public sectors.
09 Any development projects should be planned and designed to protect the ecology and biodiversity abundant in Sulawesi. Several indicator species could be identified to draw specific attention and care. Protection of the forest areas full of biodiversity should be promoted. In some cases, it could be planned along with the promotion of eco-tourism. Management of water and air pollution should also be strengthened, with the introduction of strategic environmental assessment. Renewable local resources should be utilized to the maximum extent. In this context, exploitation of hydropower and bio-diesel should be envisaged in the energy sector.

Sulawesi Island Development Framework and Strategy
10 Stable electric power supply is a minimum requirement for development of social livelihood and industries. In view of the current status of household electrification ratio (53.2% in Sulawesi) and the isolated electric power grids (over 25 small grids), integration of power generation and transmission systems should be realized over the island. Utilization of local energy resources (hydropower, geothermal and natural gas) should be strategically promoted. Innovative hybrid-type PPP scheme should be seriously taken into account in hydropower development. At the same time, demand-side management should be disseminated, particularly in households, offices and industries. In this context, recommendations to be presented in the JICA study on the optimum power development plan in Sulawesi should be followed by the authorities concerned.
11 A master plan for arterial road network development in Sulawesi has been formulated in line with the regional development framework and the assessment of needs for capacity expansion of arterial and collector roads, as well as to meet the requirements for pavement improvement and bridge improvement. The master plan proposes to improve national arterial road to have sufficient capacity and standards (2 lanes with pavement width of 7.0 m). National collector roads are to be improved in accordance with the traffic volume (7.0 m in pavement width for traffic over 8,000 p.c.u/day, 6.0 m road for 3,000-8,000 p.c.u/day and 4.5 m for less than 3,000 p.c.u/day). Utilization of locally available asphalt (Bauban on Buton Island in Southeast Sulawesi) is also recommended for provincial road improvements. It is expected that the projects proposed under the master plan would be implemented and the transportation network over Sulawesi Island would eventually be improved for the enhancement of livelihood and the regional economy.
12 The economic framework (with a target of per-capital GRDP set at US$1,700 by 2024) is attainable, but it would require a paradigm shift of the Sulawesi people and all the public/private entities. More active attitudes are needed individually and collectively. It is expected that the development framework and strategy presented in this report would serve to motivate the paradigm shift and elaboration of the provincial development plans and sector-wise development plans of Sulawesi Island.


Sulawesi Island Development Framework and Strategy
i
SULAWESI ISLAND DEVELOPMENT FRAMEORK AND STRATEGY
Table of Contents
CHAPTER 1 OVERVIEW OF SULAWESI ISLAND................................................................. 1-1 1.1 Eastern Indonesia and Sulawesi ............................................................................................ 1-1 1.2 Nature and the Environment ................................................................................................. 1-2 1.3 Social Settings..................................................................................................................... 1-10 1.4 Regional Economy.............................................................................................................. 1-17
CHAPTER 2 DEVELOPMENT DIRECTION ............................................................................ 2-1 2.1 Development Vision.............................................................................................................. 2-1 2.2 Planning Structure................................................................................................................. 2-2 2.3 National Spatial Structure and Sulawesi ............................................................................... 2-3 2.4 Regional Spatial Structure..................................................................................................... 2-5 2.5 Proposed Spatial Structure of Sulawesi ................................................................................ 2-8 2.6 Inter-Regional Linkages...................................................................................................... 2-12
CHAPTER 3 DEVELOPMENT FRAMEWORK ....................................................................... 3-1 3.1 Social Framework ................................................................................................................. 3-1 3.2 Economic Framework ......................................................................................................... 3-13 3.3 Land Development Framework........................................................................................... 3-19 3.4 Environmental Framework.................................................................................................. 3-24
CHAPTER 4 SECTOR DEVELOPMENT STRATEGY ............................................................ 4-1 4.1 Agricultural Development..................................................................................................... 4-1 4.2 Industrial Development ....................................................................................................... 4-14 4.3 Trade Promotion.................................................................................................................. 4-39 4.4 Cluster Development........................................................................................................... 4-47 4.5 Environmental Protection.................................................................................................... 4-54 4.6 Electric Power Development............................................................................................... 4-67 4.7 Transportation Development............................................................................................... 4-76

Sulawesi Island Development Framework and Strategy
ii
Abbreviations
BAPPENAS National Development Planning Agency BDF Bio-diesel Fuel BINDO Bitung-Mihahasa-Manado BKPRS Regional Development Cooperation Board of Sulawesi BPS Bureau of Statistics BRIC Brazil, Russia, India and China CDM Clean Development Mechanism DDI Domestic Direct Investment FDI Foreign Direct Investment GDP Gross Domestic Product GRDP Gross Regional Domestic Product JICA Japan International Cooperation Agency KAPET Integrated Economic Development Zone LNG Liquefied Natural Gas Mamminasata Area designated by Makassar City, Maros, Gowa and Takalar regencies NAFED National Agency for Export Development PA Priority Area PKN National Activity Center PKW Regional Activity Center RPJM Mid-term National Development Plan RTRWN National Spatial Plan of Indonesia SWOT Strength, Weakness, Opportunity and Threat TFR Total Fertility Rate

Overview of Sulawesi Island
1-1
CHAPTER 1 OVERVIEW OF SULAWESI ISLAND
1.1 Eastern Indonesia and Sulawesi
Eastern Indonesia has been a focal region under the national social and economic development plans for the last decades. It encompasses a wide region ranging from Kalimantan Island, Nusa Tengan Island, Sulawesi Island, Maluku Islands to Papua along the Malay archipelago. Since this region is too wide to formulate a regional development plan, JICA has classified Sulawesi Island and Maluku Islands into “Northeastern Indonesia”.
Java
Sulawesi PapuaMaluku
Figure 1.1.1 Sulawesi as Spearhead of Eastern Indonesia Development
Northeastern Indonesia covers an area of about 281,000 km2 (about 15.1% of the national land), with a population of about 18 million (2005). Sulawesi Island is the major focus for the development of Northeastern Indonesia, with an area of about 193,846 km2 and a population of approximately 16 million (about 7.3% of the national population). Sulawesi Island is the fourth-largest island of Indonesia and the eleventh-largest island in the world.
Table 1.1.1 Area and Population of Northeastern Indonesia
(1,000 km2) (%) (million) (%)Indonesia 1,860.4 100.0% 219.0 100.0%Northeastern Indonesia 281.2 15.1% 18.2 8.3%
Sulawesi 193.8 10.4% 16.0 7.3%Maluku 47.4 2.5% 1.3 0.6%Maluku North 40.0 2.2% 0.9 0.4%
Area Population (2005)
Source: BPS
The contribution of Sulawesi Island to the national economy is about 4.2% in terms of GRDP. While the agricultural sector accounts for 9.7% of the national sector GDP, the manufacturing sector accounts for only 1.6%, showing the salient agricultural contribution of Sulawesi to the national economy.
Overview of Sulawesi Island
1-2
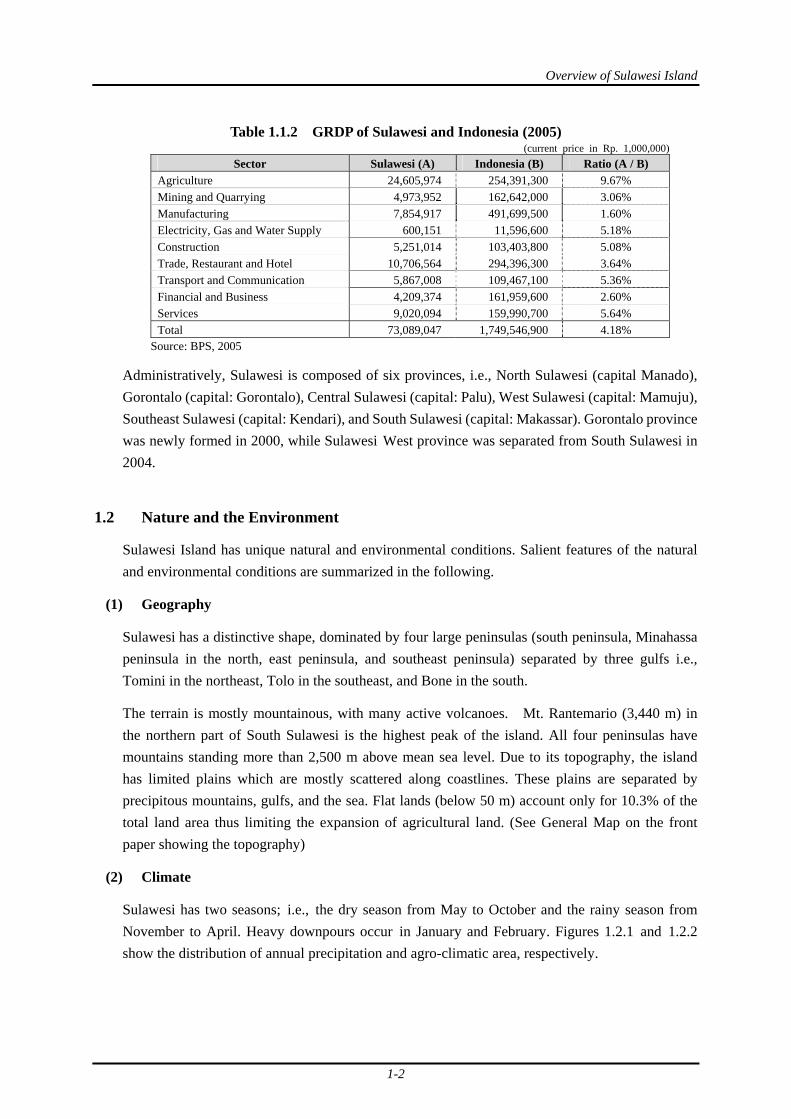
Table 1.1.2 GRDP of Sulawesi and Indonesia (2005) (current price in Rp. 1,000,000)
Sector Sulawesi (A) Indonesia (B) Ratio (A / B) Agriculture 24,605,974 254,391,300 9.67% Mining and Quarrying 4,973,952 162,642,000 3.06% Manufacturing 7,854,917 491,699,500 1.60% Electricity, Gas and Water Supply 600,151 11,596,600 5.18% Construction 5,251,014 103,403,800 5.08% Trade, Restaurant and Hotel 10,706,564 294,396,300 3.64% Transport and Communication 5,867,008 109,467,100 5.36% Financial and Business 4,209,374 161,959,600 2.60% Services 9,020,094 159,990,700 5.64% Total 73,089,047 1,749,546,900 4.18%
Source: BPS, 2005
Administratively, Sulawesi is composed of six provinces, i.e., North Sulawesi (capital Manado), Gorontalo (capital: Gorontalo), Central Sulawesi (capital: Palu), West Sulawesi (capital: Mamuju), Southeast Sulawesi (capital: Kendari), and South Sulawesi (capital: Makassar). Gorontalo province was newly formed in 2000, while Sulawesi West province was separated from South Sulawesi in 2004.
1.2 Nature and the Environment
Sulawesi Island has unique natural and environmental conditions. Salient features of the natural and environmental conditions are summarized in the following.
(1) Geography
Sulawesi has a distinctive shape, dominated by four large peninsulas (south peninsula, Minahassa peninsula in the north, east peninsula, and southeast peninsula) separated by three gulfs i.e., Tomini in the northeast, Tolo in the southeast, and Bone in the south.
The terrain is mostly mountainous, with many active volcanoes. Mt. Rantemario (3,440 m) in the northern part of South Sulawesi is the highest peak of the island. All four peninsulas have mountains standing more than 2,500 m above mean sea level. Due to its topography, the island has limited plains which are mostly scattered along coastlines. These plains are separated by precipitous mountains, gulfs, and the sea. Flat lands (below 50 m) account only for 10.3% of the total land area thus limiting the expansion of agricultural land. (See General Map on the front paper showing the topography)
(2) Climate
Sulawesi has two seasons; i.e., the dry season from May to October and the rainy season from November to April. Heavy downpours occur in January and February. Figures 1.2.1 and 1.2.2 show the distribution of annual precipitation and agro-climatic area, respectively.

Overview of Sulawesi Island
1-3
Figure 1.2.1 Distribution of Annual Rainfall Figure 1.2.2 Agro-climate
Precipitation varies across the region. The dynamics of precipitation are driven by changes in the prevailing air masses, coming from northeast during the rainy season and from southeast in the dry season. Due to interactions of the air masses with mountains ridges, zonal climate is diversified. Generally, Sulawesi has sufficient rainfall for agricultural practices. Particularly, the Maminasata areas in South Sulawesi, Manado in North Sulawesi, as well as the mountainous region in Central Sulawesi have ample rainfall of more than 2,500 mm per annum.
On the other hand, Gorontalo, Palu, Kendari, Majene, Luwuk, and their surrounding areas receive less rainfall (annual rainfall is less than 1,600 mm). Particularly, the coastal region around Palu (precipitation of only 600 mm) is one of the driest regions in Sulawesi.
Since the island is located on and near the equator, seasonal temperature has variations. Temperature in the lowlands ranges from 21ºC to 35ºC, and it varies from 15ºC to 30ºC in the highlands. The average annual temperature in the lowlands is around 27ºC.

Overview of Sulawesi Island
1-4
(3) Water Bodies and Forests
Rainfalls are drained to hundreds of rivers and streams running down to the coastal lands. Most coastal zones are swampy lands with mangrove and other swampy forests. The mangrove and swampy forests cover about 450,000 ha or 1.7% of Sulawesi Island. Heavy rainfalls are apt to cause inundations in the low-lying flat lands along the coastal zones.
Forests, (primary and secondary dry forests) of Sulawesi Island, account for 53.4% of total land area, including the mangrove and swampy forests. Primary dry land forest extends 5.15 million ha while secondary dry land forest extends 8.60 million ha. The dry land forests are mostly located in Central and West provinces.
Figure 1.2.3 Swamps, Mangroves, and Water Bodies
Figure 1.2.4 Dry Land Forests

Overview of Sulawesi Island
1-5
(4) Biodiversity
Due to tropical climates and complex geological history, Sulawesi Island and Northeastern Indonesia have unique fauna and flora. It is called “Wallacea” located between the Wallace’s line to the west of Sulawesi and the Weber’s line to the east, both of which are essential in terms of zoology, botany and biology. In the Wallacea bio-geographic realm, it is reported that over than 11,400 species are found and more species are unconfirmed, as summarized in the following table.
Table 1.2.1 Diversity and Endemism in Wallacea Taxonomic
Group Species EndemicSpecies
PercentEndemism Endemic Species (samples)
Plants 10,000 1,500 15.0%
Mammals 222 127 57.2%babirusa, anoa, tarsiers,kuskus, sulawesi palm civet,celebes black macaque etc.
Birds 647 262 40.5%
maleo, matinan flycatcher,white-tipped monarch, taliabumasked-owl, sulawesi red-knobbed hornbill etc.
Reptiles 222 99 44.6% calamorhabdium, rabdion,cyclotyphlops etc.
Amphibians 48 33 68.8% sulawesi toad, green flog,
common green turtle etc.FreshwaterFishes 250 50 20.0% halfbeak, goby, oryzia etc.
11,389 2,071 18.2%
Endemism: Single = endemic to one hotspot; Multiple = not endemic toany one hotspot, but to the combined area of two or more hotspots
Threat Categories: CR = Critically Endangered; EN = Endangered; VU =Vulnerable; EW = Extinct in the Wild
Figure 1.2.5 Location of Wallacea
Most endemic and essential species inhabit in the conservation areas such as national parks, nature reserve areas and so on. Some endangered species are reported (e.g., Maleo in the Red Data Book), and they should be duly preserved in the development of Sulawesi Island.
(5) Conservation Area
The Indonesian government ratified the UN Convention on Biological Diversity, the Convention on International Trade in Endangered Species and the Ramsar Convention on Wetlands. The government categorizes the conservation areas into i) nature reserve, ii) wildlife reserves, iii) national parks, iv) nature recreational parks, v) hunting game reserve, and vi) grand forest parks. These conservation areas in Sulawesi Island are listed in the following table and figure.

Overview of Sulawesi Island
1-6
Table 1.2.2 Conservation Areas in Sulawesi Classification No. Conservation Area Name Area (ha) Province Name
1 Tnagkoko Batu Angus 3,196 North Sulawesi Province2 Gunung Dua Saudara 4,299 North Sulawesi Province3 Gunung Lokon 100 North Sulawesi Province4 Gunung Ambang 8,638 North Sulawesi Province5 Tangale 113 Gorontalo Province6 Mas Popaya Raja 160 Gorontalo Province7 Panua 45,000 Gorontalo Province8 Tanung Api 4,246 Central Sulawesi Province9 Morowali 225,000 Central Sulawesi Province10 Pangi Binanga 6,000 Central Sulawesi Province11 Pegunungan Faruhumpenai 90,000 South Sulawesi Province12 Kalaena 110 South Sulawesi Province13 Ponda-Ponda 80 South Sulawesi Province14 Bulu Saraung 5,690 South Sulawesi Province15 Bantimurung 1,000 South Sulawesi Province16 Karaenta 1,000 South Sulawesi Province17 Lamedae 500 Southeast Sulawesi Province18 Napabalano 9 Southeast Sulawesi Province
Sub-Total 395,1411 Nantu 31,215 North Sulawesi Province2 Gunung Manebbu-Nembu 6,500 North Sulawesi Province3 Karangkelang Utara dan Selatan 21,400 Gorontalo Province4 Pinjam/Tanjung Mantop 1,613 Central Sulawesi Province5 Dolangan 463 Central Sulawesi Province6 Pati-Patai 198 Central Sulawesi Province7 Lombuyan 1 & 2 3,665 Central Sulawesi Province8 Bangkiriang 12,500 Central Sulawesi Province9 Lampoko Mampie 2,000 West Sulawesi Province10 Komara 3,390 South Sulawesi Province11 Bonto Bahari 4,000 South Sulawesi Province12 Tanjung Peropa 38,000 Southeast Sulawesi Province13 Tanjung Amelengo 850 Southeast Sulawesi Province14 Tanjung Batikolo 5,500 Southeast Sulawesi Province15 Buton Utara 82,000 Southeast Sulawesi Province
Sub-Total 213,2931 Bunaken (Marine) 89,065 North Sulawesi Province2 Bogani Nani Wartabone 287,115 North Sulawesi/Gorontalo Province3 Lore Lindu 229,000 Central Sulawesi Province4 Taka Bonerate (Marine) 530,765 South Sulawesi Province5 Rawa Aopa Watumohai 105,194 Southeast Sulawesi Province6 Kepulauan Wkatobi (Marine) 1,390,000 Southeast Sulawesi Province
Sub-Total 2,631,1391 Batu Angus 635 North Sulawesi Province2 Batu Putih 615 North Sulawesi Province3 Air Terjun Wera 250 Central Sulawesi Province4 Danau Matano 30,000 South Sulawesi Province5 Danau Towuti 65,000 South Sulawesi Province6 Nanggala 3 500 South Sulawesi Province7 Sidrap 500 South Sulawesi Province8 Lejja 1,265 South Sulawesi Province9 Cani Sirenrang 3,125 South Sulawesi Province10 Kepulauan Kapoposang 50,000 South Sulawesi Province11 Bantimurung 18 South Sulawesi Province12 Goa Patunuang 1,500 South Sulawesi Province13 Malino 3,500 South Sulawesi Province14 Mangolo 5,200 Southeast Sulawesi Province15 Tirita Rimba 500 Southeast Sulawesi Province16 Teluk Lasolo 81,800 Southeast Sulawesi Province
Sub-Total 244,4081 Landusa Tomata 5,000 Central Sulawesi Province2 Komara 4,610 South Sulawesi Province
Sub-Total 9,6101 Palu 8,100 Central Sulawesi Province2 Murhum 8,146 South Sulawesi Province
Sub-Total 16,246Total 3,509,837
Hunting Game Reserve(Taman Buru)
Grand Forest Park(Taman Hutan Raya)
Nat
ure R
eser
ve (C
agar
Ala
m)
Wild
life
Rese
rve (Suak
aM
arga
satw
a)
Nat
ional
Par
k(T
aman
Nas
iona
l)
Nat
ure
Recre
atio
nal
Par
k (T
aman
Wis
ata
Ala
m)

Overview of Sulawesi Island
1-7
Figure 1.2.6 Location of Conservation Areas in Sulawesi
Activities in the conservation areas are limited. The permission and prohibition in such conservation areas are defined by the Indonesian government as summarized in the following.

Overview of Sulawesi Island
1-8
Table 1.2.3 Permission and Prohibition of Conservation Areas Conservation Area
Activities
NatureReserve
WildlifeReserve
NationalPark
NatureRecreational
Park
HuntingGame
Reserve
Grand ForestPark
Cultivation of edible cropps × × × × × ×
Cultivation of fruite trees × × × ○ ○ ○
Migration × × × × × ×
Commercial cutting × × × × × ×
Gathering of useful plants andfirewoods
× ○ × × × ○
Hunting × × × × ○ ○
Fishery × × ○ × ○ ○
Camping × ○ ○ ○ ○ ○
Gathering for research × △ △ △ △ △
Management and preservationfor ecosystem
× ○ ○ ○ ○ ○
Transfusion and replantation ofinternal species
× ○ ○ ○ ○ ○
Gathering of wisteria andbamboo
× × × △ × ×
Development for mineralrsources
× △ △ △ △ △
Management and preservationfor wild animals and plants
× ○ ○ ○ ○ ○
Entry of tourists × ○ ○ ○ ○ ○
Migration and replantation ofextraneous species
× × × × × ○
Resource : Field Report of UNDP/FAO National Park Development Project INS/78/061
Remarks ○: Permission △: Particular Privilege ×: Prohibition
(6) Present Land Use
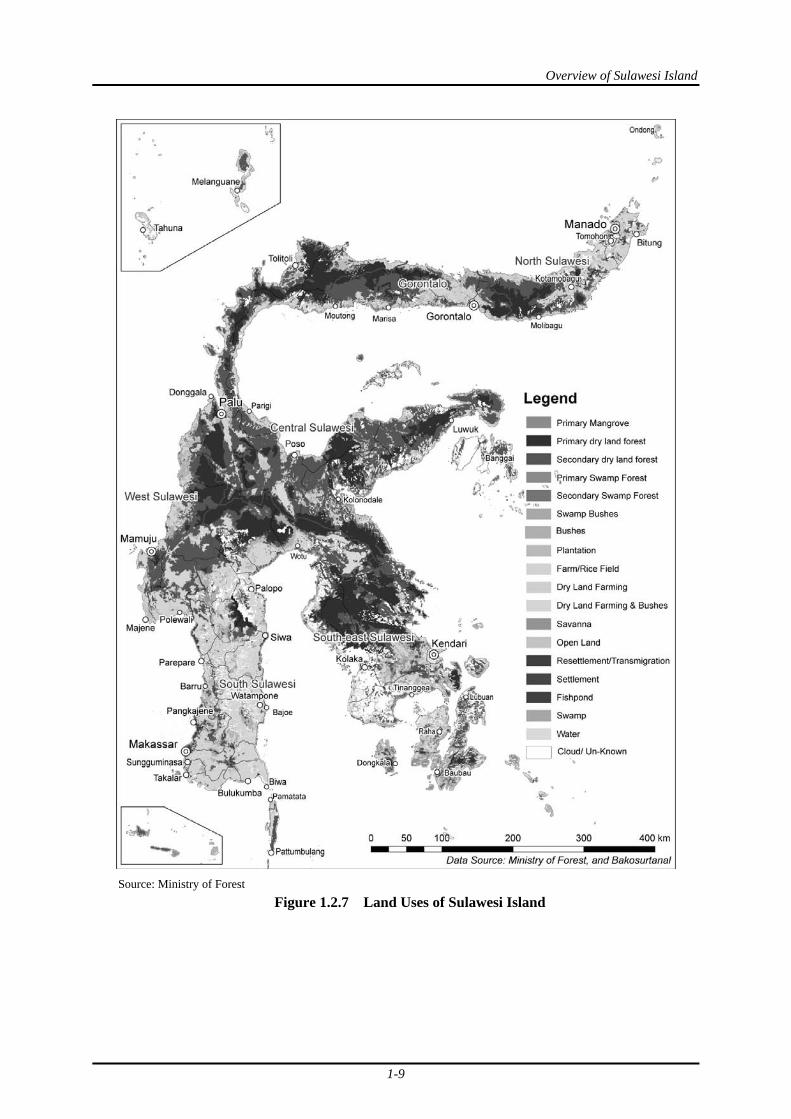
Besides the forest coverage (53.4% of the island), the agricultural land (i.e., paddy fields, plantations and upland farming) covers 26.1% of Sulawesi Island and the settlement lands covers 0.4%. Since most land areas in Sulawesi have already been developed, except for steep slopes, further exploitation of farmlands and plantations is less expectable.
Overview of Sulawesi Island
1-9
Source: Ministry of Forest
Figure 1.2.7 Land Uses of Sulawesi Island

Overview of Sulawesi Island
1-10
Table 1.2.4 Land Area by Land Use Land Use Area (1,000 ha) Percentage (%) Forest 10,341,340 53.35
Primary Mangrove 96,178 0.50 Primary Dry Land Forest 3,751,328 19.35 Secondary Dry Land Forest 6,262,217 32.30 Primary & Secondary Swamp Forest 231,617 1.19
Cultivated/ Developed Area 5,129,949 26.46 Plantation 184,548 0.95 Rice Field 531,776 2.74 Dry Land Farming & Bush 3,165,761 16.33 Dry Land Farming 1,039,466 5.36 Settlement 70,141 0.36 Settlement (Transmigration) 8,381 0.04 Fish Pond 129,876 0.67
Others 3,913,420 13.26 Savanna 259,709 1.34 Open Land 137,494 0.71 Swamp Bushes 56,638 0.29 Bushes 1,785,202 9.21 Swamp, and Swamp Bush 73,664 0.38 Water 258,388 1.33 Cloud/Unknown 1,342,325 6.92
Total 19,384,709 100.00 Source: Calculated by JICA Study Team based on the GIS Data of Ministry of Forest
1.3 Social Settings
Social conditions in Sulawesi are also diversified and dynamic. Salient features of demographic, ethnic and religious conditions are outlined together with the labor force and employment situations.
(1) Demography
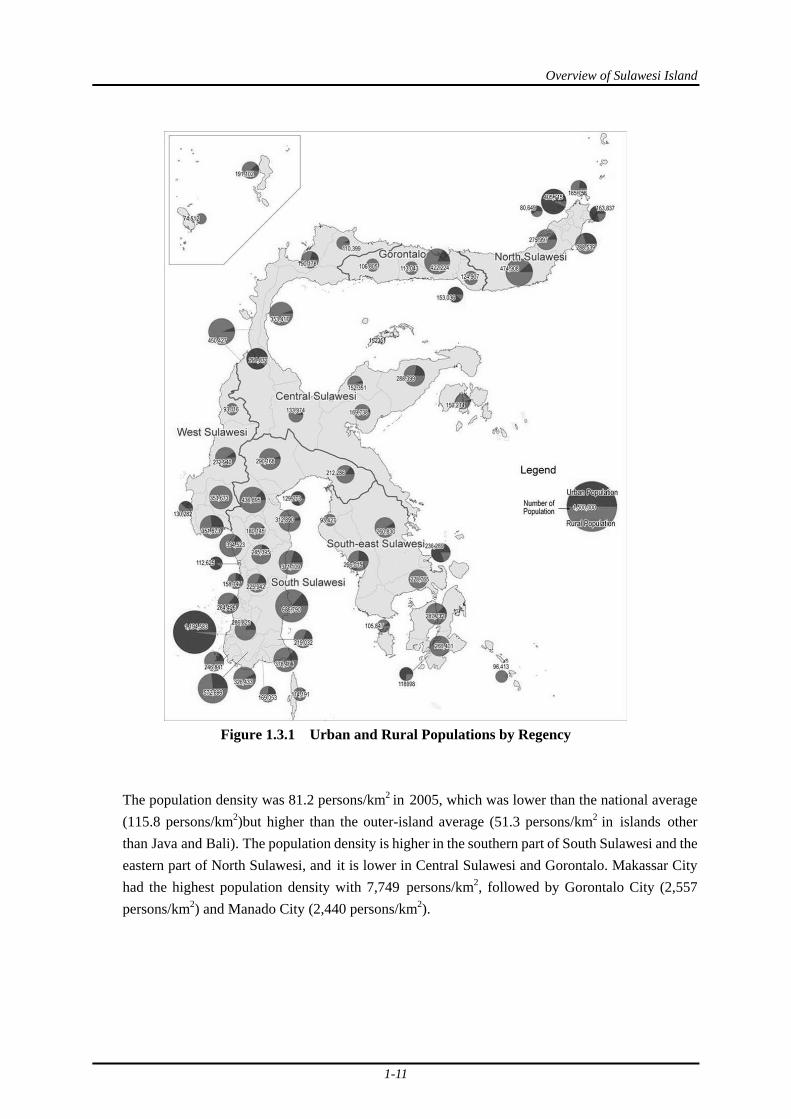
The population of Sulawsi in 2005 was 15,997,700, accounting for 7.3% of the total population of Indonesia. Makassar is the biggest city in Sulawesi with a population of 1,195,000, followed by Manado with 406,000, Palu with 291,000, Kendari with 236,000, Gorontalo with 153,000, and Palopo with 129,000. Since there are limited plains on the island, the aggregate urbanization ratio (27.5%) is lower than the national average (42.1%)
Overview of Sulawesi Island
1-11
Figure 1.3.1 Urban and Rural Populations by Regency
The population density was 81.2 persons/km2 in 2005, which was lower than the national average (115.8 persons/km2)but higher than the outer-island average (51.3 persons/km2 in islands other than Java and Bali). The population density is higher in the southern part of South Sulawesi and the eastern part of North Sulawesi, and it is lower in Central Sulawesi and Gorontalo. Makassar City had the highest population density with 7,749 persons/km2, followed by Gorontalo City (2,557 persons/km2) and Manado City (2,440 persons/km2).

Overview of Sulawesi Island
1-12
Figure 1.3.2 Population Densities by Regency
The annual average population growth ratio of Sulawesi progressively decreased from 2.24% (1971-80), 1.86% (1980-90), 1.86% (1990-1995), 1.62% (1995-00), and to 1.19% (2000-05). Its annual average growth ratio in 2000-05 was slightly lower than the national average of 1.30%. However, during this period, the annual growth ratio of Gorontalo (2.04%), Southeast Sulawesi (1.69%), and West Sulawesi (1.52%) was higher, while the ratio of South (0.96%), Central (1.07%), and North Sulawesi (1.25%) was lower than the national average.

Overview of Sulawesi Island
1-13
(2) Ethnicity
Most inhabitants of the island are Malayan, except for ethnic groups in the interior areas. The largest ethnic groups are the Bugis, Makasarese, and Mandarese who live in the south and are renowned seafaring traders. They have mostly converted to Islam. The northern part of South Sulawesi is inhabited by the Torajas whose unique culture is mainly based on animistic beliefs. Minahassans, who are dominant in the northern peninsula, are mostly Christians.
According to the available statistical data, there are about 6,000 households (or about 31,000 people) associated with 15 ethnic groups in Central Sulawesi. They are categorized as the “isolated people” under the Social Minister’s Decree, No.5 of 1994, living in geographically remote areas with socially and culturally alienated status. The following figure illustrates the distribution of the minority ethnic groups, inclusive of the isolated people, in Central Sulawesi.
Figure 1.3.3 Ethnic Minorities in Central Sulawesi
In planning any development programs, attention should be paid to the positive and negative impacts on the ethnic groups and isolated people in Sulawesi.
(3) Religions
Islam is the major religion in Sulawesi, practiced by approximately 80% of its population. The conversion of the most island people to Islam occurred during the 15th to 17th centuries. South Sulawesi around the city of Makassar was the first major area to accept Islam. The Gorontalo and Mongondow peoples largely converted to Islam in the 19th century. Most Muslims are Sunnis and live in all parts of Sulawesi.

Overview of Sulawesi Island
1-14
Christians form a substantial minority (about 17%). Most of them are Protestants and Roman Catholics. Christians are concentrated on the tip of the northern peninsula around Manado, which is mostly inhabited by the Minahasa, a predominantly Protestant people, and the northernmost Sangihe and Talaud Islands. The famous Toraja people in Central Sulawesi have largely converted to Christianity since the independence of Indonesian. There are also substantial numbers of Christians around Lake Poso and among the Pamona-speaking people in Central Sulawesi.
(4) Labor Force
The agriculture sector absorbed more than half of the local labor force, except for North Sulawesi. The ratio of employment in the primary sector is high in West Sulawesi (75.1% of economically active population in 2005), Central Sulawesi (65.4%) and Southeast Sulawesi (62.8%). Employment in the secondary sector is relatively low or 11.5% of the labor force in Sulawesi. In North Sulawesi, the tertiary sector absorbs 44.2% of provincial employments.
Figure 1.3.4 Sectoral Composition of Labor Force by Province
As of February 2006, unemployment ratios in North Sulawesi (13.7%) and South Sulawesi (12.3%) were higher than the national average (10.5%). On the other hand, Gorontalo (9.8%), Central Sulawesi (8.9%), Southeast Sulawesi (7.4%), and West Sulawesi (4.6%) had lower unemployment ratios. Generally, the provinces with a higher percentage of labor engaged in the primary sector have a lower unemployment ratio. Secondary and tertiary sectors in urban areas are not sufficient enough yet to absorb population inflows from the rural areas.
(5) Household Expenditure
The monthly household expenditures in Sulawesi by province are illustrated in the following figure, together with the Indonesian average. The horizontal axis indicates the monthly expenditure per household, while the vertical axis indicates the percentage of household population. South, West, and Central Sulawesi show a similar trend to the national average. However, while the percentage of households with higher monthly expenditures is slightly lower than the national average, the percentage of those with lower monthly expenditures is higher. Such tendency is more apparent in Gorontalo. North Sulawesi is the wealthiest province with the highest percentage of households in

Overview of Sulawesi Island
1-15
the higher expenditure strata and the lowest percentage of households in the lower expenditure strata.
Figure 1.3.5 Distribution of Monthly Household Expenditure by Province
(6) Poverty Level
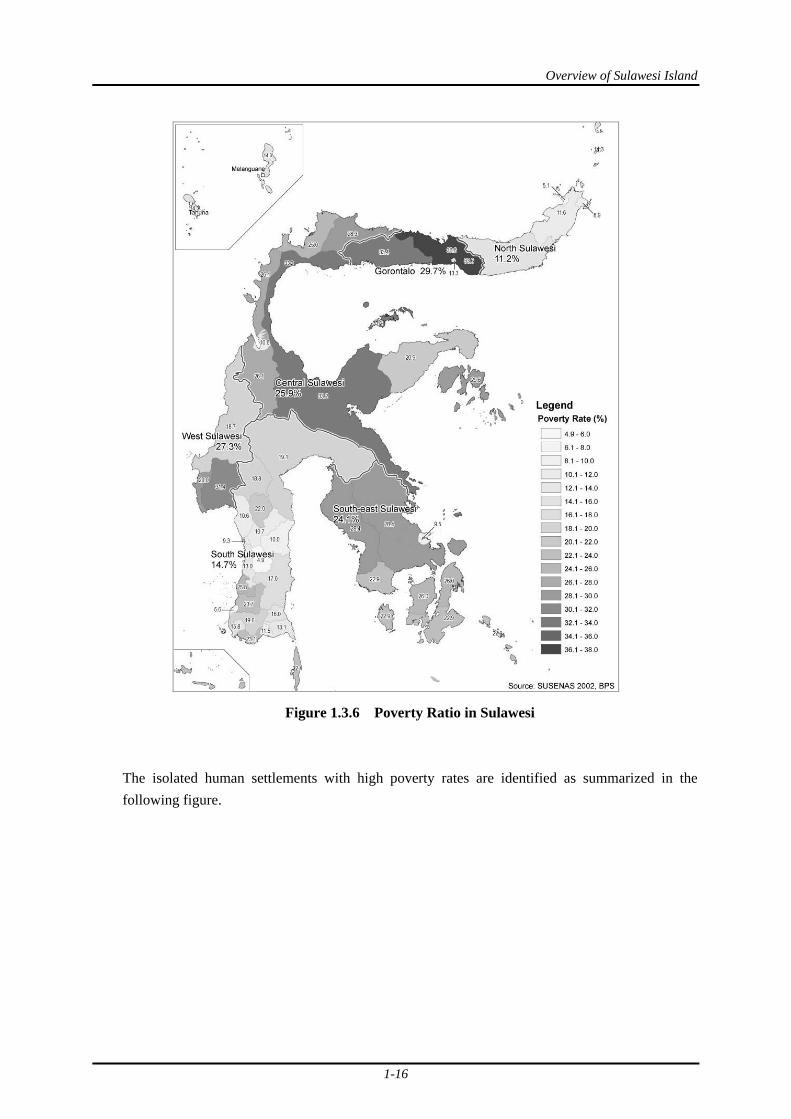
According to the National Socio-economic Survey compiled by the Bureau of Central Statistics (BPS), the poverty ratio in Sulawesi was 18.9% in 2002, or relatively close to the national average (18.2%).
The poverty ratios in Central Sulawesi, Gorontalo, Western Sulawesi, and Southeast Sulawesi are higher than other provinces. Particularly, the poverty ratio in Gorontalo (29.7%) was the highest. On the other hand, the poverty ratios in North Sulawesi (11.2%) and South Sulawesi (14.7%) were lower than the national average.
The degree of inequality in income distribution was generally smaller than the national average, with the GINI coefficient in Sulawesi (North: 0.270, Central: 0.283, Western: 0.301, Southeast: 0.270, and Gorontalo: 0.241) smaller than the national average of 0.329.
Overview of Sulawesi Island
1-16
Figure 1.3.6 Poverty Ratio in Sulawesi
The isolated human settlements with high poverty rates are identified as summarized in the following figure.

Overview of Sulawesi Island
1-17
Isolated area with high poverty rate
Source: JST
Source: JICA Study Team Figure 1.3.7 Isolated Human Settlements with High Poverty Ratios
1.4 Regional Economy
An overview of the Sulawesi economy is presented to grasp the general economic situation by province.
(1) GRDP
The following figure illustrates the magnitude of GRDP and industrial structure. The GRDP of South Sulawesi is outstanding. In 2005, the GRDP of South Sulawesi solely accounted for more than half (57.8%) of the total GRDP of Sulawesi. North Sulawesi had 16.8%, Central Sulawesi 14.36%, and Southeast Sulawesi 10.3%. On the other hand, West Sulawesi and Gorontalo shared only 4.2% and 2.6% of the island’s GRDP, respectively.

Overview of Sulawesi Island
1-18
Figure 1.4.1 GRDP of Sulawesi by Province (2005 Current Prices)
(2) Per-capital GRDP
In 2005, the per-capita GRDP of the island (US$ 593.6) was about 60% of the national average (US$ 1,026.9). North Sulawesi had the highest per-capita GRDP (US$ 718.9), followed by South Sulawesi (US$ 631.7) and Central Sulawesi (US$ 625.5). On the other hand, Gorontalo had the lowest at US$ 298.1 or less than a third of the national average.
Table 1.4.1 Per-Capita GRDP of Sulawesi by Province (2005 Current Prices) Per-capita GRDP Area GRDP Population (Rupiah) (US Dollar)1
Sumatra Island 488,949,677 45,318,403 10,789,208 1,039.69 Java Island 1,314,077,338 127,035,178 10,344,200 996.81 Bali Island 28,986,596 3,336,869 8,686,765 837.09 Kalimantan Island2 205,265,514 11,939,978 17,191,448 1,656.64 Sulawesi Island 96,136,842 15,606,670 6,159,984 593.60 Lainnya 73,588,312 12,884,426 5,711,416 550.38 Indonesia Total 2,303,031,449 216,121,524 10,656,187 1,026.87 North Sulawesi 15,690,192 2,103,198 7,460,158 718.89 Gorontalo 2,797,406 904,440 3,092,970 298.05 Central Sulawesi 14,742,578 2,271,071 6,491,464 625.54 West Sulawesi 3,869,686 953,867 4,056,841 390.93 South Sulawesi 48,765,946 7,439,597 6,554,918 631.66 Southeast Sulawesi 10,271,034 1,934,496 5,309,411 511.64
1 Exchange rate used: US$ 1= Rp. 10,377.3 (Source: IMF, 2005 average exchange rate) 2 Per-capita GRDP of Kalimantan and Sumatra is higher than that of other islands with major oil and gas production. Source: BPS Indonesia

Overview of Sulawesi Island
1-19
Figure 1.4.2 Per-capita GRDP, 2005
(3) GRDP by Industrial Origin
As noted in the employment characteristics of Sulawesi, the contribution of the agriculture sector to the regional economy is quite high, particularly in West Sulawesi (55.9% of the provincial GDP), Central Sulawesi (47.9%) and Southeast Sulawesi (37.4%). Sulawesi’s primary agricultural products include coconuts, clove, nutmeg, soybean, coffee, rice, cocoa, and cattle. Fishery products are also abundant and Sulawesi is beginning to expand its coastal shrimp and fish ponds.
The secondary sector contributed only 25.6% to the GRDP. While the manufacturing sector has been expected to support agriculture in terms of agro-industrial inputs, this sector accounted for only 10.8% of the GRDP of Sulawesi, which is quite lower than the national figure (28.1%). The manufacturing sector played a significant role in South Sulawesi (14.0% of the provincial GRDP), while its contribution in the other 5 provinces remained at lower levels (7.0 - 9.5%.)
(4) GRDP Growth Rate and Labor Productivity
The economic performance by province has been reviewed in terms of the GRDP growth rate in 2001-2005 and the labor productivity in 2005, and it has been compared with the national average, as shown in the following figure. Generally, the growth rate in Sulawesi has been higher than the national average. However, the labor productivity in the secondary and tertiary sectors has remained much lower than the national average.
While the GRDP of Southeast Sulawesi is smaller than that of South, North, and Central Sulawesi, labor productivity and GRDP growth ratio are superior to those of other provinces. The size of economy and labor productivity in Gorontalo is much smaller than other provinces.
Primary Sector
The primary sector plays a vital role in the Sulawesi economy. The labor productivity (Rp. 6.9 million) and growth ratio (4.03%) has been higher than the national average (Rp. 6.1 million and 3.0%). Generally, Sulawesi’s labor productivity in the primary sector is higher than the national average. Except for South Sulawesi,
Figure 1.4.3 Economic Performance
(Primary Industry)

Overview of Sulawesi Island
1-20
the growth rate of Sulawesi shows higher rates than the national average.
Secondary Sector
The growth rate of the secondary sector in Sulawesi (5.35%) is higher than the national average (4.12%), with the exception of North Sulawesi (2.91%).
However, the labor productivity of the sector in all provinces is still lower than the national average, particularly those of Western Sulawesi and Gorontalo.
Tertiary Sector
The growth rate of the tertiary sector in Sulawesi (7.4%) is higher than that of the primary (4.0%) and secondary sectors (5.4%).
The labor productivity of the sector in all provinces in Sulawesi is lower than the national average of Rp. 20.1 million. The productivity in Gorontalo (Rp. 8.0 million) is less than half of the national average.
Figure 1.4.4 Economic Performance (Secondary Industry)
Figure 1.4.5 Economic Performance (Tertiary Industry)
Development Direction
2-1
CHAPTER 2 DEVELOPMENT DIRECTION
2.1 Development Vision
Although it has been generally said that Sulawesi Island is abundant in natural resources, the overview in the foregoing chapter implies that such resources as lands and minerals are relatively limited if compared to Kalimantan and Sumatra. Human resources are also limited if compared to Java. Development of Sulawesi, therefore, is dependent on how to make use of resources available in the island as well as in other parts of Indonesia, particularly in Eastern Indonesia.
The Sulawesi economy has been enhanced to satisfy the basic human needs. Per capita GRDP has reached the level of about US$600 and self-sufficiency in production of staple foods has been attained. Although a gap of per capita GRDP with the national average (around US$1,030 in 2005) is to be improved in short and medium terms, future development of Sulawesi will not be designed only in terms of per capita GRDP or in economic terms. It is partly because the economy has been developed in exchange for the environmental degradation in most parts of the world. Since the Sulawesi people are fond of fauna and flora in and around the island and has lived under the respective environments, the future of Sulawesi would be more dependent on how the people, society, economy and environments would co-exist in a harmonious and sustainable manner.
Although natural resources are relatively limited as pointed above, the nature has wide varieties; e.g., topography, climates, vegetation, ecosystems, fauna and flora. The varieties of ethnicity and human resources are also notable in Sulawesi. For centuries, harmony has been maintained in the natural and social environments with least conflicts among them. Such a harmony should be sustained in the future economic and social development of Sulawesi.
From the viewpoint of economic development, it appears that the Sulawesi people have been rather passive. They have received various support from the central and provincial governments, as well as supports from various donors, and they have been rather dependent on such external supports. Reaching the level to satisfy the basic needs, the Sulawesi people are now expected to shift a paradigm to tackle social and economic development more actively and stand on their own feet.
With the above points in view, the development vision of Sulawesi Island towards 2024 is set to attain the following objectives.
(1) Sustain harmony among the natural, social and economic environments so that the Sulawesi people and their descendants will live in a harmonious manner; and
(2) Shift a paradigm to more actively tackle social injustice on their own initiative, eradicating poverty, conflicts, pollution and other negative factors for social and economic development.

Development Direction
2-2
In other words, the development vision of Sulawesi Island is set to create a comfortable environment for the Sulawesi people and their descendants to live in for centuries to come. The framework and strategy proposed herein are initial steps for the attainment of such a development vision.
2.2 Planning Structure
The Indonesian government issued the National Development Planning System Act. The Act allows the division of development plans into 3 types by target period (long-term: 20 years, mid-term: 5 years, and short-term: 1 year), and also into 3 types by level of the target areas (national, provincial, and regency/ municipality).
Major development plans consist of the following types: development plan, sectoral plan, and spatial plan, mainly through a hierarchical order (RPJMN: National Mid-Term Development Plan, RPJMD: Regional Mid-Term Development Plan),
Spatial plans are prepared with reference to the concerned development plan. Spatial plans are made at the national, island, provincial and municipality levels. National and island spatial plans are prepared by the National Planning Coordination Board and the BAPENAS. Provincial and municipality spatial plans are prepared by the Department of Spatial Public Work and the BAPPEDA.
Table 2.2.1 Planning System of Indonesia Level National → Provincial → Regional
Approval President Governor Regency Governor/ City Mayor Development Plan (RP)
↓
National Long-term DP: 20 years (RPJP National)
↓ National Mid-term DP: 5 years
(RPJM) ↓
National Annual DP: 1 year (RKP)
Regional Long-term DP: 20 years↓
Regional Mid-term DP: 5 years ↓
Regional Annual DP: 1 year
Local Long-term DP: 20 years ↓
Local Mid-term DP: 5 years ↓
Local Annual DP: 1 year
Sectoral Development Plan
National Long-term DP: 20 years ↓
National Mid-term DP: 5 years ↓
National Annual DP: 1 year
Regional Long-term DP: 20 years↓
Regional Mid-term DP: 5 years ↓
Regional Annual DP: 1 year
Local Long-term DP: 20 years ↓
Local Mid-term DP: 5 years ↓
Local Annual DP: 1 year
Spatial Plan (RTR)
National Spatial Plan (RTRWN)
Island Spatial Plan (RTR Pulau)
Provincial Spatial Plan
Regency/ Municipality Spatial Plan
Source: National Development Planning System Act 2004 and other sources

Development Direction
2-3
2.3 National Spatial Structure and Sulawesi
The National Social and Economic Development Plans in the last decade, where the development of Eastern Indonesia has been focused, envisage that Sulawesi would spearhead the development of Eastern Indonesia as illustrated in the following figure.
Java
Sulawesi PapuaMaluku
Figure 2.3.1 Sulawesi as Spearhead of Eastern Indonesia Development
The National Spatial Plan (RTRWN), renewed in April 2007, implicitly shows that Indonesia would be integrated by North Belt, Middle Belt and South Belt, as illustrated in the following figure.
Source: JICA Study Team based on RTRWN Figure 2.3.2 Proposal on the Linkage of Indonesia’s Development Belts Through Sulawesi
The RTRWN emphasizes the well balanced development between Western and Eastern Indonesia. The roles that Sulawesi should play under the Plan is defined under the Article 10d, i.e., “Development of Sulawesi as an area of national granary, horticulture, plantations, ranchers, natural resources, tourism, oil-gas industry, mining and processing industry.”
In line with the spatial structure at the national level, Sulawesi would be positioned to link the three belts as shown in the following figure.

Development Direction
2-4
Northern Belt
Middle Belt
Southern Belt
Sulawesi
Cross BoarderTransport to Mindanao
Source: JICA Study Team Figure 2.3.3 Proposal on the Linkage of Indonesia’s Development Belts Through Sulawesi
On the other hand, Sulawesi could be positioned in the middle of a resource-based development belt in Eastern Indonesia, between Kalimantan and Papua, as illustrated in the following figure. Sulawesi is expected to play the role of a supply center for resources such as foodstuff, construction materials and various commodities. At the same time, Sulawesi is expected to function as a processing and trade center for such resource-based industries.
SulawesiKalimantan
Papua
Resource Supply Center ofFood, MaterialsEnergy Center of Oil, NaturalGas Production
Resourceof Food,
Materials,Manpower
Support
Support
Source: JICA Study Team
Figure 2.3.4 Resource Development Belt in Eastern Indonesia and Role of Sulawesi
The link between the west coast of Sulawesi and Kalimantan has been strengthened in recent years. The Kalimantan energy-based industry is supported by Sulawesi by means of the supply of agricultural products, construction materials and other commodities. Palu, Mamuju and Parepare would function as distribution centers in this context. Energy development in the Luwuk area would also be integrated as well. On the other hand, Maluku and Maluku North islands would be linked to Sulawesi, supplying such raw materials for coconuts and other products while importing processed products from Sulawesi.

Development Direction
2-5
Ka
Kalimantan
Balikpapan
Samarinda
Linkage of Western Coast with Eastern Area and KalimantanEnergy Center of Oil, Natural Gas P roduct ion
Resource Center of Food, Material
Poso
T oliT oli
Luwuk
Palu
M amuju
ParePare
Maluku
Resource Based Linkage Energy Center of Oil, Natural Gas Production
Reserved Forest Agricultural Land
Source: JICA Study Team
Figure 2.3.5 Resource-based Linkage
2.4 Regional Spatial Structure
The National Spatial Plan also specifies prioritized areas (PA) for development nationwide, totaling 112 PAs over the country. Prioritization has been based on four criteria; i.e., i) GRDP should exceed 0.25% of the national GDP, ii) population should exceed 3% of the national population, iii) infrastructure should be well developed, and iv) natural resources are abundant. In Sulawesi, PAs are designated as listed in the following table and figure.
Table 2.4.1 Prioritized Areas under the National Spatial Plan 2007 Province/ Prioritized Area Superior Sector
North Sulawesi Manado Area and it’s surroundings - Manufacturing (II) - Fishery (I) - Tourism (I) - Mining (II) Dumonga-Kotamabangu Area and it’s surroundings (Bolaang Mogondow)
- Agriculture (II) - Plantation (II)
Sea prioritized area, Bunaken and it’s surroundings - Fishery (II) - Tourism (I) Sea prioritized area, Batutoli and it’s surroundings - Fishery (III) - Mining (II) - Tourism (III) Gorontalo Gorontalo Area - Agriculture (I) - Fishery (II) - Plantation (I) - Mining (III) Marisa Area - Agriculture (III) - Plantation (II) Tomini Ocean and it’s surroundings - Fishery (I) - Tourism (III) Central Sulawesi Poso Area and it’s surroundings - Agriculture (IV)
- Fishery (III) - Tourism (II)
- Plantation (II) - Industry (III)
Toli-toli Area and it’s surroundings - Agriculture (III) - Plantation (II)
- Fishery (III)
- Mining (II) - Tourism (III)
Kolonedale Area and it’s surroundings - Agriculture (III)- Agro industry (II)
- Tourism (III)- Mining (III)
- Plantation (II) - Fishery (II)
Palu Area and it’s surroundings - Mining (I) - Fishery (I)
- Industry (II)- Tourism (II)
- Agriculture (I) - Plantation (III)
Sea prioritized area of Tolo Bay-Kepulauan Banggai and it’s surroundings
- Fishery (II) - Tourism (III)

Development Direction
2-6
Province/ Prioritized Area Superior Sector West Sulawesi Mamuju Area and it’s surroundings - Agro industry (II)
- Agriculture (II) - Fishery (II)
- Plantation (I)
- Forestry (II)
Sea prioritized area of Makassar Strait and it’s surroundings
- Fishery (II) - Tourism (II)
South Sulawesi Mamminasata Area and it’s surroundings (Makassar, Maros, Sungguminasa, Gowa, Takalar)
- Agro industry (I) - Industry (I) - Agriculture (II)
- Tourism (I)
Palopo Area and it’s surroundings - Tourism (I) - Plantation (II) - Agriculture (II) Bulukumba-Watampone Area - Agro industry (II)
- Plantation (II) - Agriculture (II)- Fishery (I)
- Tourism (IV) -
- Trade (II)
Pare-pare Area and it’s surroundings - Agro industry (II) - Agriculture (III)
- Fishery (II) - Plantation (III)
Sea prioritized area of Bone and it’s surroundings - Fishery (II) - Mining (IV) - Tourism (II) - Sea prioritized area of Singkarang- Takabonerate and it’s surroundings
- Fishery (IV) - Mining (IV) - Tourism (III) -
Sea prioritized area of Kapontiri-Lasalimu and it’s surroundings
- Fishery (III) - Mining (III) - Tourism (III)
Southeast Sulawesi Aselolo/Kendari Area - Agro industry (III)
- Agriculture (III) - Fishery (I) - Plantation (I)
- Tourism (III) - Mining (III)
- Industry (III)
Kapolimu-Patikala Muna-Buton Area - Agro industry (II)- Mining (I)
- Fishery (II) - Agriculture (III)
- Forestry (IV) - Plantation (III)
- Tourism (III)
Mowedong/Kolaka Area - Agro industry (III)- Agriculture (III)
- Fishery (III) -
- Plantation (II) - Mining (II)
Sea prioritized area of Asera/ Lasolo - Fishery (III) - Tourism (III) Sea prioritized area of Tiworo and it’s surroundings
- Fishery (III) - Mining (III) - Tourism (IV)
Source: National Spatial Plan 2007 Note: I – IV in the parentheses indicates development stage
Source: National Spatial Plan 2007
Figure 2.4.1 Priority Areas under National Spatial Plan 2007

Development Direction
2-7
Furthermore, the National Spatial Plan specifies 5 national activity centers (PKNs), 24 regional activity centers (PKWs) and 2 national strategic activity centers (PKSNs) in Sulawesi in terms of urban settlement areas, as shown in the following table.
Table 2.4.2 Activity Centers in Sulawesi under National Spatial Plan PROVINCE PKN PKW PKSN
North Sulawesi -Urban Area of Manado Bitung (I/C/1)
-Tomohon (I/C/1) -Tondano (III/C/1)
-Kotamobagu (II/C/1) -Melonguane (I/A/2)-Tahuna (I/A/2)
Gorontalo - Gorontalo (I/C/1) -Isimu (III/C/2) -Kuandang (III/C/2)
-Tilamuta (II/C/2)
Central Sulawesi
-Palu (I/C/1) -Poso (II/C/3) -Luwuk (II/C/1) -Buol (III/C/1)
-Kolonedale (II/C/1) -Tolitoli (III/C/1) -Donggala (II/C/1)
West Sulawesi -Mamuju (I/C/1) South Sulawesi Mamminisata
Metropolitan Area (Makassa- Sungguminasa- Takalar- Maros) (I/C/3)
-Pangkajene (II/C/1)-Jeneponto (I/C/1) -Palopo (I/C/1) -Watampone (II/C/1)
-Bulukumba (I/C/1) -Barru (III/C/1) -Pare-pare (II/C/1)
Southeast Sulawesi
-Kendari (I/C/1) -Unaaha (IV/C/1) -Lasolo (III/C/1)
-Bau-bau (I/C/1) -Raha (II/C/1)
Source: National Spatial Plan 2007 Note I ~ IV in the in parentheses shows stage of development A: Primary cities on Border areas (A/1: Improvement, A/2: New Development, A/3: Revitalization) C: Growth Center Cities for National Growth (C/1: Improvement, C/2: New Development, C/3: Revitalization)
On the other hand, the Sulawesi Island Spatial Plan (RTR Pulau Sulawesi) has been prepared in line with the National Spatial Plan in 2004. For instance, future service centers to be developed in Sulawesi and a road network system have been planned as shown in the following figures.
Tahuna
Kotamobagi
IsimuGolontaloTilamuta
Marisa
Kwandang
Kotamobagu
Luwuk
Parepare
Kolonodale
Watampone
BulukumbaJeneponto
Barru
Lasoro
Laha
Baubau
Kolaka
Lasusua
Palu
Mamuju
PosoDonggala
Toli-toliBitung
Buol
Una-ahaKendari
Makassar
Palopo
Center of National Activities
Primary Service Center
Secondary Service Center
Tertiary Service Center
Center of Regional Activities
Primary Service CenterSecondary Service Center
Manado
Majene
Tomhon
Melanguane
Figure 2.4.2 Activity Centers under National Spatial Plan
Figure 2.4.3 Road Development under National Spatial Plan

Development Direction
2-8
On the other hand, the Regional Development Cooperation Board of Sulawesi (BKPRS) was formed by six provincial governments in October 2000. BKPRS intends to promote the integrated Sulawesi development by common vision and mission throughout six provinces. BKPRS also intends to revise the existing Sulawesi Spatial Plan to take with various issues, including the following, though such activities are still quite limited due to constraints on financial and human resources.
(1) Formulation of the Vision of Healthy Indonesia; (2) Development of regional information system; (3) Establishment of 10 Sulawesi Boards by sector; (4) Formulation of a Gulf Master Plan (Tolo, Tomini & Bone), Strait Master Plan
(Makassar and Buton), and Sea Master Plan (Sulawesi, Flores & Banda); (5) Establishment of Sulawesi Parliament Forum and Sulawesi KAPET Forum; (6) Development of bio-diesel fuel; (7) Establishment of trade centers in each province; (8) Promotion of domestic and international cooperation; (9) Promotion of inter-regional trade and investment; and (10) Empowerment of Builder Board and Consultative Board.
Figure 2.4.4 BKPRS Spatial Plan
2.5 Proposed Spatial Structure of Sulawesi
Through review of the resources available in Sulawesi, prospective resources and industries are summarized as illustrated in the following figure.
Development Direction
2-9
Figure 2.5.1 Prospective Resources/Industries in Sulawesi
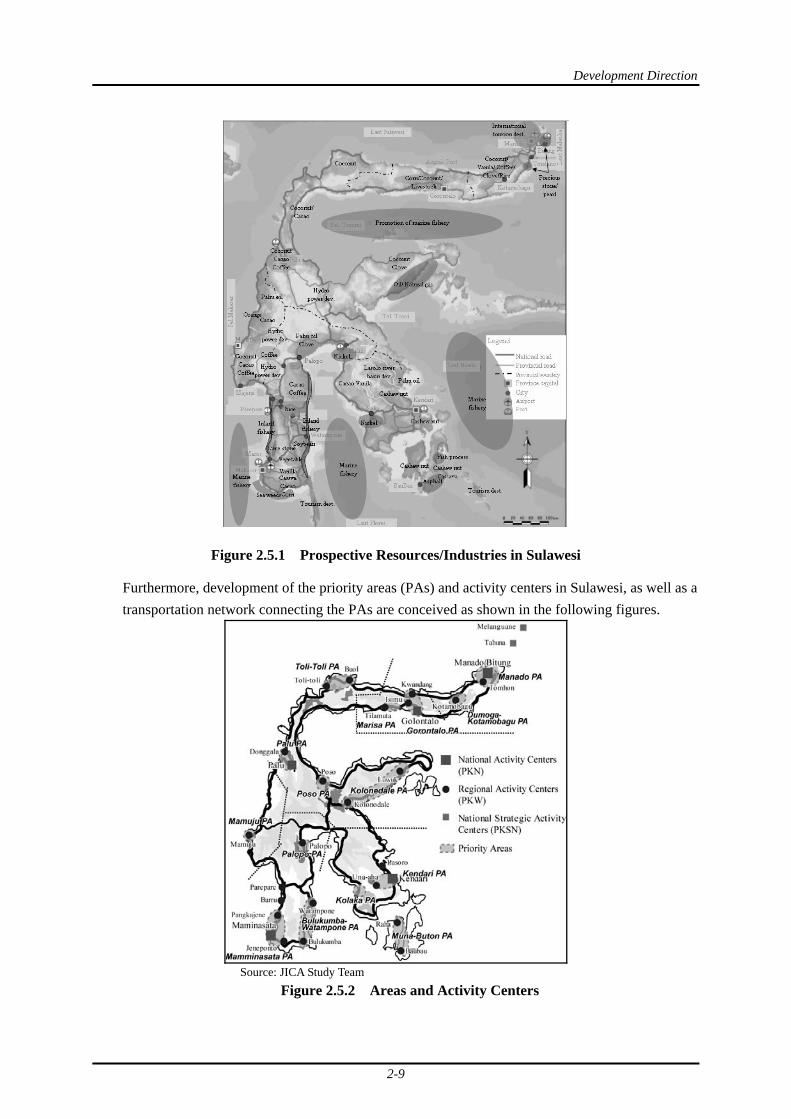
Furthermore, development of the priority areas (PAs) and activity centers in Sulawesi, as well as a transportation network connecting the PAs are conceived as shown in the following figures.
Source: JICA Study Team
Figure 2.5.2 Areas and Activity Centers

Development Direction
2-10
Tahuna
KotamobaguIsimu
GorontaloTilamutaMarisa
Kwandang
Parepare
BulukumbaJeneponto
Barru
Laha
Bauba
Palu
Mamuj
PosoD l
Toli-toliTomhon
Buol
Kendari
Makassar Watampon
BitungManado
Kolonodale
Luwuk
Una-aha
Kolaka
Palopo
Spinal HighwayNauticalHighway
Tahuna
KotamobagiIsimu
GorontaloTilamutaMarisa
Kwandang
Parepare
BulukumbaJeneponto
Barru
Laha
Bauba
Palu
Mamuj
PosoD l
Toli-toliTomhon
Buol
Kendari
Makassar Watampon
BitungManado
Kolonodale
Luwuk
Una-aha
Kolaka
Palopo
2010 2025 Source: JST Source: JICA Study Team
Figure 2.5.3 Conceivable Transportation Network connecting Priority Areas
In view of the existing spatial plans and the achievements by regional authorities, as well as the resources and socio-economic conditions, it is proposed that a spatial structure of Sulawesi would resemble the following.
Makassar (Mamminasata), Manado (Bimido) and Palu would be developed as international/inter-regional centers, while Gorontalo, Luwuk, Mamuju, Kendari and Parepare would serve as inter-regional centers. These centers would be developed as “Growth Poles” for integrated regional development of Sulawesi. While these centers or growth poles are strategically developed in combination with the surrounding areas, they would promote linkages or networks among them to attain balanced and harmonized development over the island. It would also serve to preserve the micro echo-system in each region and mitigate the environmental impacts as a whole.

Development Direction
2-11
Source: JICA Study Team
Figure 2.5.4 Proposed Spatial Structure of Sulawesi

Development Direction
2-12
2.6 Inter-Regional Linkages
In the event that the growth poles or regional centers are developed rather independently and that the priority areas (PAs) are promoted for development as envisaged under the existing national and island spatial plans, certain inefficiencies are predictable in promoting industrial clusters in view of the existing resources for development. Likewise, it would be less efficient to confine economic activities and improvement in infrastructure within the boundaries of growth poles and PAs, as well as within each province. Therefore, it is proposed that linkages between the growth poles would be strategically promoted in order to facilitate the formulation of industrial clusters with less distance in communication and transportation, thus mitigating the environmental loads.
Promotion of four linkages are conceived and proposed; i.e.,
(1) Linkage between Makassar (South) and Kendari (Southeast)
(2) Linkage between Mamuju (West), Palu and Luwuk (Central)
(3) Linkage between Manado (North) and Gorontalo (Gorontalo)
(4) Linkage between Pare-Pare (South), Mamuju (West), Palu (Central) and Kalimantan
Makassar-Kendari Linkage
Makassar and the surrounding Mamminasata area will serve as a gateway to international and inter-island trades not only for South Sulawesi but also for Southeast Sulawesi. While products in Southeast Sulawesi are processed first in the Kendari and Kolaka areas, they would later be forwarded to a consolidated processing center for exports or stored at warehouses in the Makassar area, thus promoting industrial clusters across the provincial boundary. To save the distance for inland transportation, development of a nautical highway across the Bone Bay is proposed.
Reserved forestAgricultural Land
CementNickelAsphaltOil Refinery
BDFFishery and Marine Product ProcessingCocoaMeat Processing (Livestock) and AnimalFeedLight Industry (wood process such asplywood, furniture, garment, shoes, etc.)Other Food Manufacture (Coffee, Cashew,Vegetable, Sugar, Palm oil, Vanilla, etc.)Tourism
Consolidated FoodProcessing Center
Mamminasata
Kendari
ParePareKolaka
International/Inter-RegionalTrade/Distribution CenterIntra-RegionalTrade/Distribution Center
Wakatobi
Plau
Toraja
Source: JICA Study Team Figure 2.6.1 Linkage between Makassar and Kendari

Development Direction
2-13
Mamuju-Palu-Luwuk Linkage
The Luwuk area in the eastern peninsula of Central Sulawesi has been lagged so far, but it has sizable potential for energy development. This area would be linked to the Palu area to support development of energy industry as well as to find marketing channels for various products in the Poso, Pagimana and Luwuk areas. The Mamuju area in West Sulawesi may also be linked to Palu in addition to the existing linkage with Makassar. It is envisaged that clusters based in Palu would be strategically promoted in the central part of Sulawesi island.
Manado-Gorontalo Linkage
Up to 2000, Gorontalo has been part of North Sulawesi and historically has industrial linkages with the Manado and Bitung areas. Most products in Gorontalo are exported through Bitung port. Although Manado and Gorontalo have been administratively segregated, it is expected that their economic linkages would be strengthened to promote clusters in the northern perninsula.
Ka
ToliToli
Palu Luwuk
Kolonodale
Poso
Pagimana
Banggai
Manado
Mamuju
Oil/Natural Gas FieldLPG DepositIntra-RegionalTrade/Distribution CenterConsolidated FoodProcessing Center
BDFCocoaLight Industry (wood process, etc.)Construction Material(Sand, Stone)Other Food Manufacture (Coffee,Vegetable, Ornage,etc.)Eco-tourismReserved ForestAgricultural Land
Mamasa
Kamara OilField
Gorontalo
Source: JICA Study Team Figure 2.6.2 Linkage between Palu, Mamuju andLuwuk
ManadoToliTol
PaluLuwukPoso
Pagimana
Gorontalo
Banggai
Bitung
BDFFisher and Marine Product ProcessingMeat Processing and Animal FeedLight Industry (wood process such asplywood, furniture, etc.)GoldOther Food Manufacture (Coffee, Clove,Vegetable, Vanilla, etc.)Tourism
Reserved forestAgriculturalLandInternational/Inter-RegionalTrade/Distribution CenterIntra-Regional Trade/DistributionCenter
Consolidated FoodProcessing Center
Tahuna
Melonguane
Maluku
Source: JICA Study Team Figure 2.6.3 Linkage between Manado and Gorontalo

Development Direction
2-14
Parepare-Mamuju-Palu-Kalimantan Linkage
Clusters based in Parepare, Mamuju and Palu could be strategically developed for promotion of linkages with major development centers in Kalimantan. For instance, some consolidated food processing centers would be located in Parepare, Mamuju and Palu to process and supply products to Kalimantan where the demands for such agro-based products have been increasing.
Kalimantan
Palu
Mamuju
ParePare
ToliToli
→Fuel←Rice, vegetable,construction material
→Fuel←Rock, Stone
←Livestock,meat, vegetableBalikpapan
Samarinda
SabbanTana Toraja
BDFCocoaLight Industry (wood process such asplywood, furniture, garment, shoes, etc.)Construction Material(Sand, Stone)Other Food Manufacture (Coffee,Vegetable, Orange,etc.)Oil Refinery
Reserved ForestAgricultural LandWest Coast Trans SulawsiHighwayIntra-RegionalTrade/Distribution Center
Consolidated FoodProcessing Center
Source: JST
Source: JICA Study Team Figure 2.6.4 Linkage between Parepare-Mamuju-Palu and Kalimantan
The linkages proposed above would promote the formation of industrial clusters beyond the administrative boundary of provinces, as well as the balanced and harmonized development with less burden on the environment over Sulawesi Island.