001 e-book - predictive modeling techniques
DESCRIPTION
hTRANSCRIPT
Copyright 2014, Simplilearn, All rights reserved.
Copyright 2014, Simplilearn, All rights reserved.
Lesson 4 – Predictive Modeling Techniques
Business Analytics Foundation with SAS tools and Excel
Copyright 2014, Simplilearn, All rights reserved.
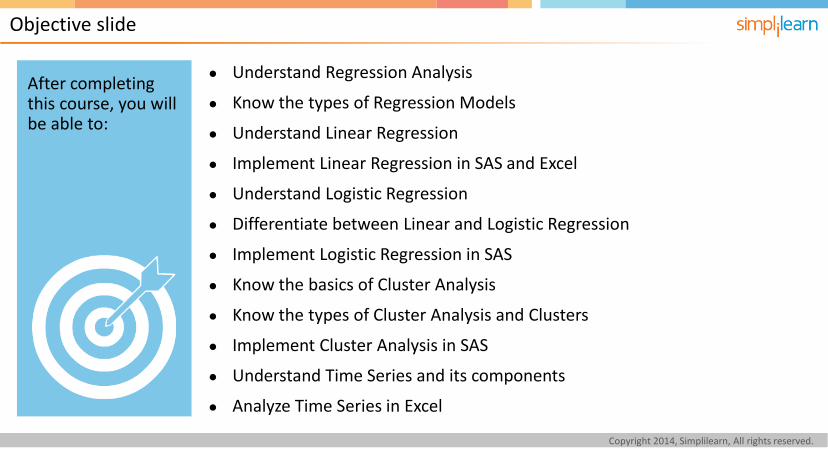
● Understand Regression Analysis
● Know the types of Regression Models
● Understand Linear Regression
● Implement Linear Regression in SAS and Excel
● Understand Logistic Regression
● Differentiate between Linear and Logistic Regression
● Implement Logistic Regression in SAS
● Know the basics of Cluster Analysis
● Know the types of Cluster Analysis and Clusters
● Implement Cluster Analysis in SAS
● Understand Time Series and its components
● Analyze Time Series in Excel
After completing this course, you will be able to:
Objective slide
Copyright 2014, Simplilearn, All rights reserved.
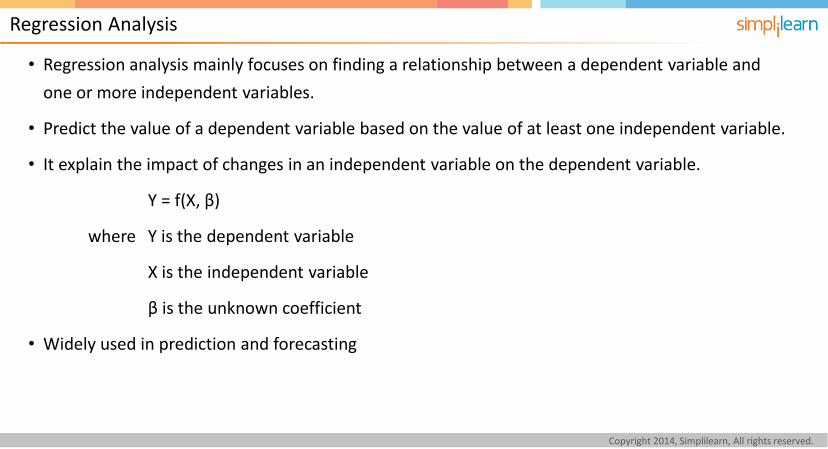
• Regression analysis mainly focuses on finding a relationship between a dependent variable and
one or more independent variables.
• Predict the value of a dependent variable based on the value of at least one independent variable.
• It explain the impact of changes in an independent variable on the dependent variable.
Y = f(X, β)
where Y is the dependent variable
X is the independent variable
β is the unknown coefficient
• Widely used in prediction and forecasting
Regression Analysis
Copyright 2014, Simplilearn, All rights reserved.
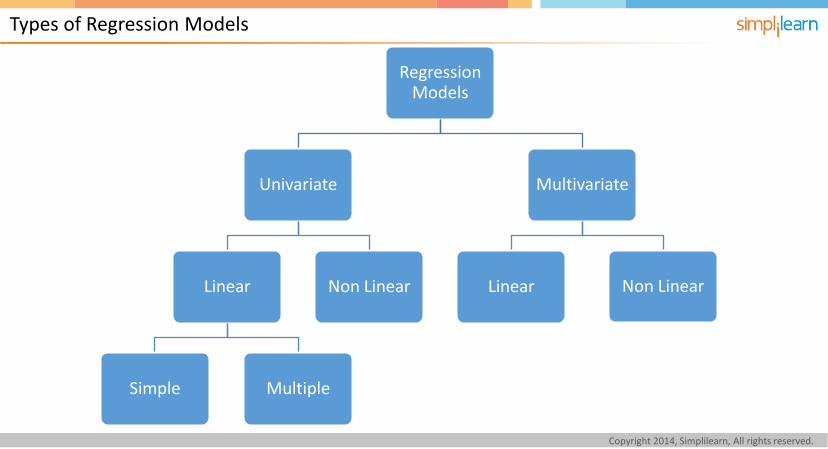
Types of Regression Models
Regression Models
Univariate
Linear
Simple Multiple
Non Linear
Multivariate
Linear Non Linear
Copyright 2014, Simplilearn, All rights reserved.
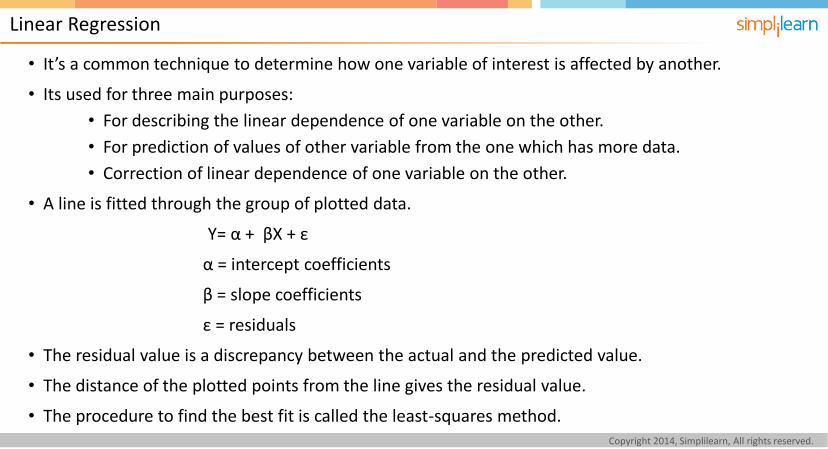
• It’s a common technique to determine how one variable of interest is affected by another.
• Its used for three main purposes:
• For describing the linear dependence of one variable on the other.
• For prediction of values of other variable from the one which has more data.
• Correction of linear dependence of one variable on the other.
• A line is fitted through the group of plotted data.
Y= α + βX + ε
α = intercept coefficients
β = slope coefficients
ε = residuals
• The residual value is a discrepancy between the actual and the predicted value.
• The distance of the plotted points from the line gives the residual value.
• The procedure to find the best fit is called the least-squares method.
Linear Regression
Copyright 2014, Simplilearn, All rights reserved.
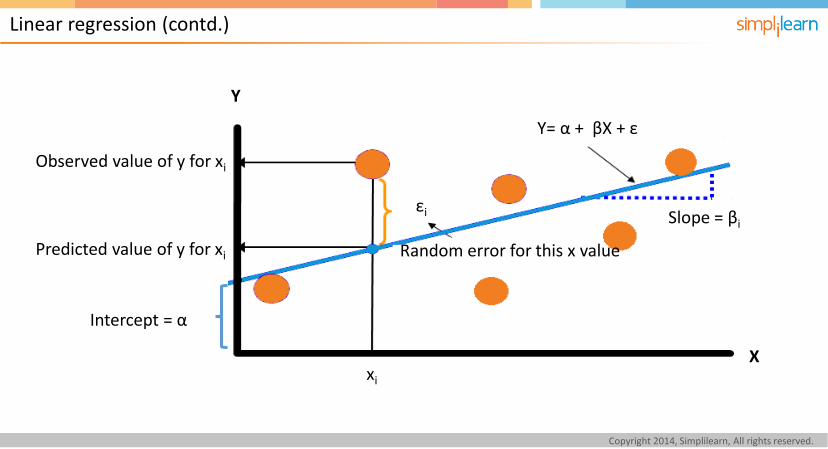
Linear regression (contd.)
Observed value of y for xi
Predicted value of y for xi
Intercept = α
Random error for this x value
Slope = βi
Y
X xi
Y= α + βX + ε
εi
Copyright 2014, Simplilearn, All rights reserved.
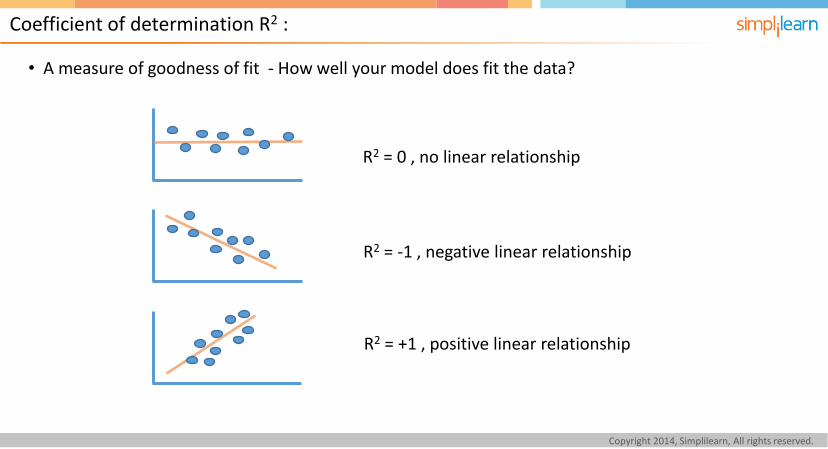
• A measure of goodness of fit - How well your model does fit the data?
Coefficient of determination R2 :
R2 = 0 , no linear relationship
R2 = -1 , negative linear relationship
R2 = +1 , positive linear relationship

Copyright 2014, Simplilearn, All rights reserved.
• Based on R2 value , we can explain how well the model explains the data and the percentage of
differences that are explained by this model.
• The differences between observations that are not explained by the model is the error term or
residual .
• Suppose we have a case in which R2 value is 0.74. This means that 74% of variance in the values of
the dependent variable is explained by the model and the remaining 26 % which is not explained is
its residual or error term.
How good is the model ?
Copyright 2014, Simplilearn, All rights reserved.
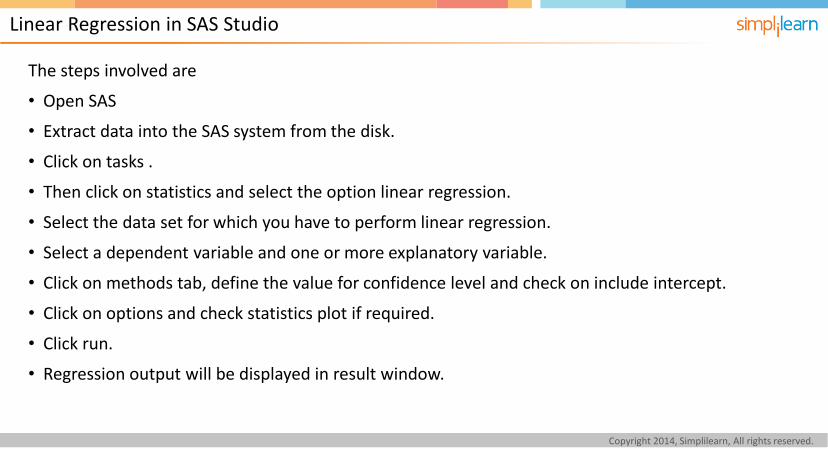
The steps involved are
• Open SAS
• Extract data into the SAS system from the disk.
• Click on tasks .
• Then click on statistics and select the option linear regression.
• Select the data set for which you have to perform linear regression.
• Select a dependent variable and one or more explanatory variable.
• Click on methods tab, define the value for confidence level and check on include intercept.
• Click on options and check statistics plot if required.
• Click run.
• Regression output will be displayed in result window.
Linear Regression in SAS Studio
Copyright 2014, Simplilearn, All rights reserved.
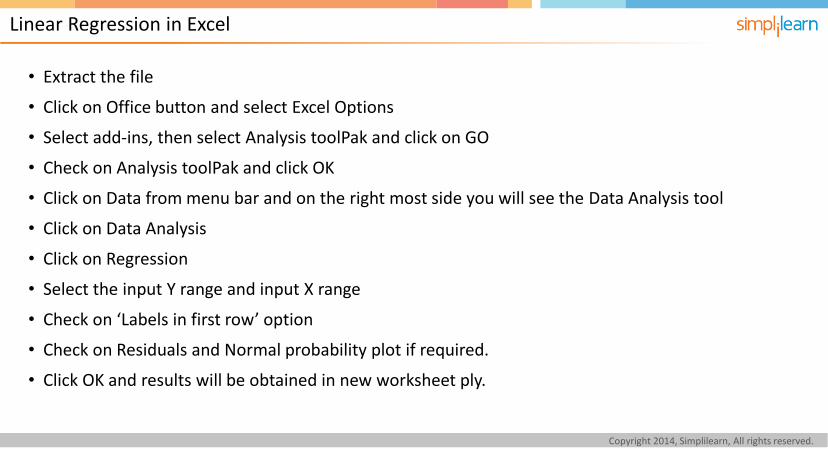
• Extract the file
• Click on Office button and select Excel Options
• Select add-ins, then select Analysis toolPak and click on GO
• Check on Analysis toolPak and click OK
• Click on Data from menu bar and on the right most side you will see the Data Analysis tool
• Click on Data Analysis
• Click on Regression
• Select the input Y range and input X range
• Check on ‘Labels in first row’ option
• Check on Residuals and Normal probability plot if required.
• Click OK and results will be obtained in new worksheet ply.
Linear Regression in Excel
Copyright 2014, Simplilearn, All rights reserved.
• Case study slide.
• SAS Video
• Excel Video
Case Study
Copyright 2014, Simplilearn, All rights reserved.
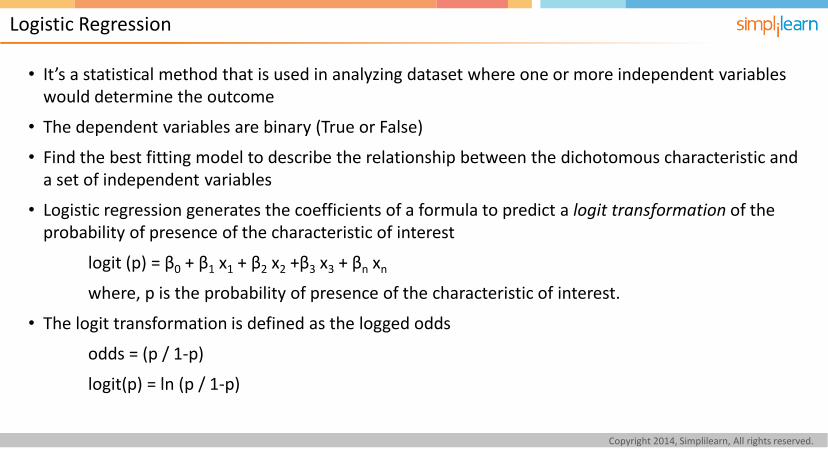
• It’s a statistical method that is used in analyzing dataset where one or more independent variables would determine the outcome
• The dependent variables are binary (True or False)
• Find the best fitting model to describe the relationship between the dichotomous characteristic and a set of independent variables
• Logistic regression generates the coefficients of a formula to predict a logit transformation of the probability of presence of the characteristic of interest
logit (p) = β0 + β1 x1 + β2 x2 +β3 x3 + βn xn
where, p is the probability of presence of the characteristic of interest.
• The logit transformation is defined as the logged odds
odds = (p / 1-p)
logit(p) = ln (p / 1-p)
Logistic Regression
Copyright 2014, Simplilearn, All rights reserved.
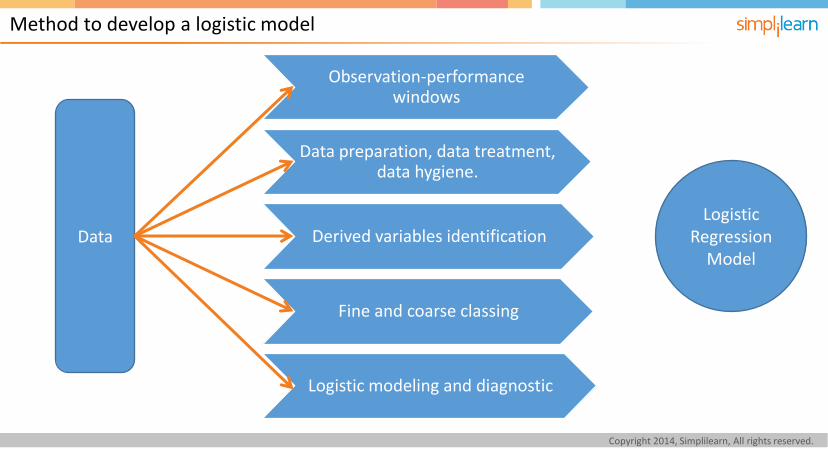
Method to develop a logistic model
Observation-performance windows
Data preparation, data treatment, data hygiene.
Derived variables identification
Fine and coarse classing
Logistic modeling and diagnostic
Data Logistic
Regression Model
Copyright 2014, Simplilearn, All rights reserved.
• Linear regression is mainly used to establish a relationship between dependent and independent variable. It helps in estimating the impact of independent variable over a dependent variable.
• Example – using a linear regression, the relationship between temperature (T) and ice cream sales (I) is found to be
I = 2T + 4000
• This equation says that for every 1 degree raise in temperature , there is a demand of 4002 ice creams.
• Logistic regression helps in finding out the probability of an event and this event is captured in binary format i.e. 0 or 1.
• Example – In order to know whether customers will buy a product or not, run a Logistic Regression on the data. The dependent variable would be a binary variable .
• In terms of graphical representation, Linear Regression gives a linear line as an output, once the values are plotted on the graph. Whereas, the logistic regression gives an S-shaped line
Linear Regression vs Logistic Regression

Copyright 2014, Simplilearn, All rights reserved.
Cluster Analysis
• Cluster Analysis is the process of forming groups of related variable for the purpose of drawing important conclusions based on the similarities within the group.
• The greater the similarity within a group and greater the difference between the groups, more distinct is the clustering.
• Often there are no assumptions about the underlying distribution of the data
• The reason for taking such an approach is that the objects in a group are similar to one another and are different from the objects in other groups. Therefore it is very easy to find pattern here.
Copyright 2014, Simplilearn, All rights reserved.
• Hierarchical Clustering : Also known as nesting clusters as it also clusters to exist within bigger
clusters to form a tree. It can be either agglomerative or divisive.
• Partitioned clustering : Division of the set of data objects into non-overlapping clusters such that
each object is in exactly one subset.
• Overlapping clustering : Used to reflect the fact that an object can simultaneously belong to more
than one group.
• Exclusive clustering: They assign each object to a single cluster.
• Complete clustering : It assigns every object to a cluster
Types of Cluster analysis
Copyright 2014, Simplilearn, All rights reserved.
• Well – separated : The distance between any two points in different groups is greater than the
distance between any two points within a group. They need not be globular.
• Prototype – based : The prototype of a cluster is often a centroid for data with continuous
attributes. Such clusters tend to be globular.
• Graph – based : When data is represented as a graph where nodes are the objects and links
represent connection among the objects. They tend to be globular.
• Density – based : This method is employed when the clusters are irregular and when noise and
outliers are present.
• Shared – property : Also known as conceptual clustering its the process of identifying the pattern in
the clusters to successfully segregate into groups of clusters.
Types of Clusters
Copyright 2014, Simplilearn, All rights reserved.
• K – means : It’s a prototype based clustering technique that attempts to define the number of
clusters (K). They are represented as centroids.
• Agglomerative Hierarchical Clustering : It refers to a collection of closely related clustering
techniques that produce a hierarchical clustering by starting with each point as singleton cluster
and repeatedly merging the closest clusters until a single, all encompassing cluster remains.
• DBSCAN : It’s a density based clustering algorithm that produces a partitioned clustering, in which
number of clusters is automatically determined by the algorithm.
Methods to form clusters.
Copyright 2014, Simplilearn, All rights reserved.
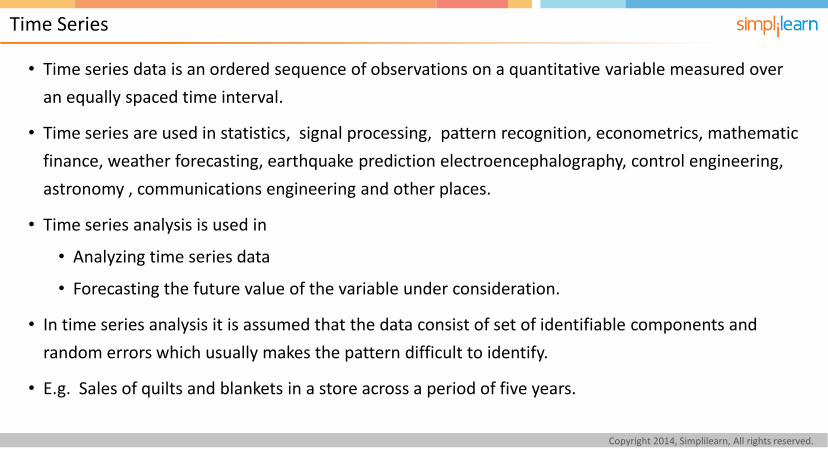
• Time series data is an ordered sequence of observations on a quantitative variable measured over
an equally spaced time interval.
• Time series are used in statistics, signal processing, pattern recognition, econometrics, mathematic
finance, weather forecasting, earthquake prediction electroencephalography, control engineering,
astronomy , communications engineering and other places.
• Time series analysis is used in
• Analyzing time series data
• Forecasting the future value of the variable under consideration.
• In time series analysis it is assumed that the data consist of set of identifiable components and
random errors which usually makes the pattern difficult to identify.
• E.g. Sales of quilts and blankets in a store across a period of five years.
Time Series
Copyright 2014, Simplilearn, All rights reserved.
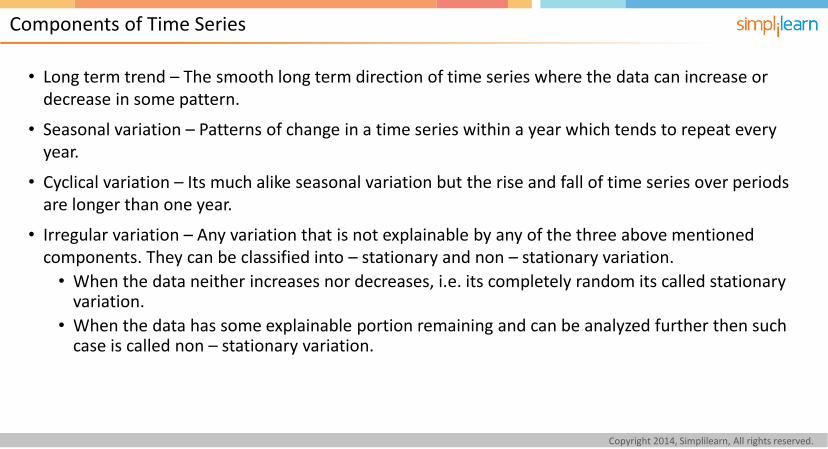
• Long term trend – The smooth long term direction of time series where the data can increase or decrease in some pattern.
• Seasonal variation – Patterns of change in a time series within a year which tends to repeat every year.
• Cyclical variation – Its much alike seasonal variation but the rise and fall of time series over periods are longer than one year.
• Irregular variation – Any variation that is not explainable by any of the three above mentioned components. They can be classified into – stationary and non – stationary variation.
• When the data neither increases nor decreases, i.e. its completely random its called stationary variation.
• When the data has some explainable portion remaining and can be analyzed further then such case is called non – stationary variation.
Components of Time Series
Copyright 2014, Simplilearn, All rights reserved.
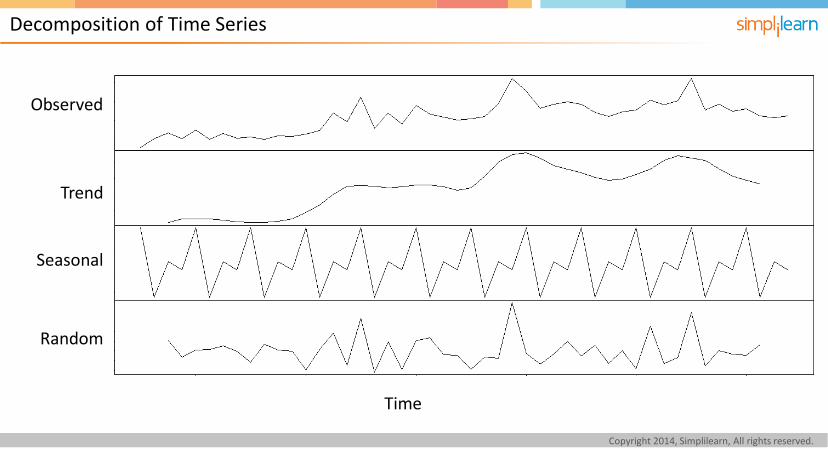
Decomposition of Time Series
Time
Random
Seasonal
Trend
Observed

Copyright 2014, Simplilearn, All rights reserved.
• Moving average is a widely used indicator in technical analysis that helps in smoothing out actions
by filtering out the noise i.e. the residuals from random fluctuations.
• Moving average is also otherwise called as trend follower or lagging indicator because it always
depend on historical data.
• Commonly used moving averages are
• Simple moving average (SMA)
• Exponential moving average (EMA)
• A simple moving average is calculated by adding the value for a number of time periods and then
dividing this total by the same number of time periods.
• Exponential moving average gives a higher weighting to recent prices but in case of simple moving
average it assigns equal weighting to all values.
Moving Average
Copyright 2014, Simplilearn, All rights reserved.
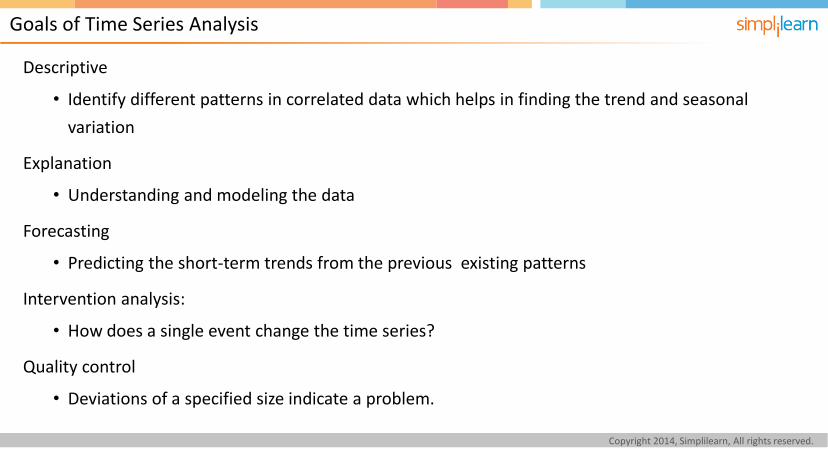
Goals of Time Series Analysis
Descriptive
• Identify different patterns in correlated data which helps in finding the trend and seasonal
variation
Explanation
• Understanding and modeling the data
Forecasting
• Predicting the short-term trends from the previous existing patterns
Intervention analysis:
• How does a single event change the time series?
Quality control
• Deviations of a specified size indicate a problem.
Copyright 2014, Simplilearn, All rights reserved.
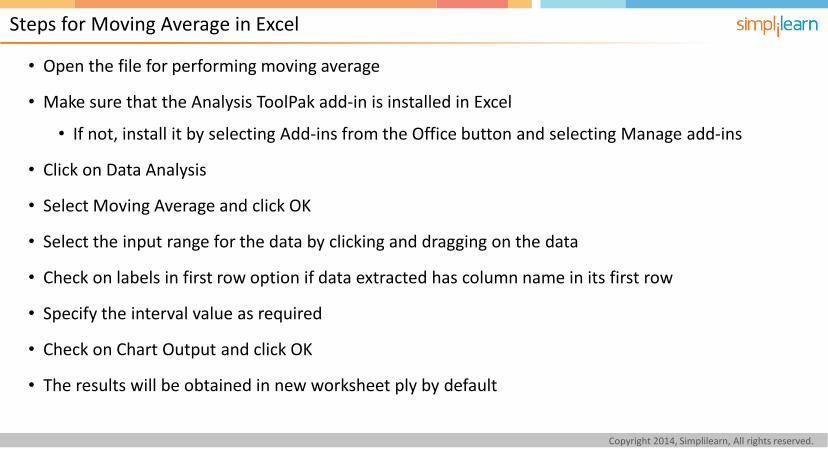
• Open the file for performing moving average
• Make sure that the Analysis ToolPak add-in is installed in Excel
• If not, install it by selecting Add-ins from the Office button and selecting Manage add-ins
• Click on Data Analysis
• Select Moving Average and click OK
• Select the input range for the data by clicking and dragging on the data
• Check on labels in first row option if data extracted has column name in its first row
• Specify the interval value as required
• Check on Chart Output and click OK
• The results will be obtained in new worksheet ply by default
Steps for Moving Average in Excel
Copyright 2014, Simplilearn, All rights reserved.
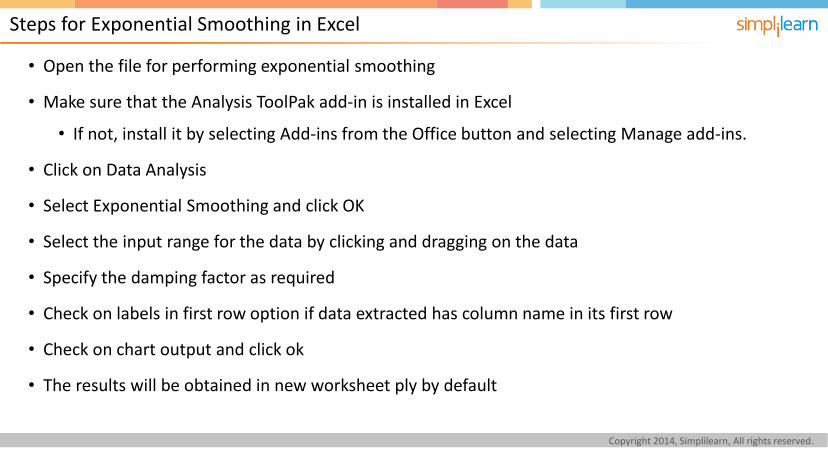
• Open the file for performing exponential smoothing
• Make sure that the Analysis ToolPak add-in is installed in Excel
• If not, install it by selecting Add-ins from the Office button and selecting Manage add-ins.
• Click on Data Analysis
• Select Exponential Smoothing and click OK
• Select the input range for the data by clicking and dragging on the data
• Specify the damping factor as required
• Check on labels in first row option if data extracted has column name in its first row
• Check on chart output and click ok
• The results will be obtained in new worksheet ply by default
Steps for Exponential Smoothing in Excel
Copyright 2014, Simplilearn, All rights reserved.
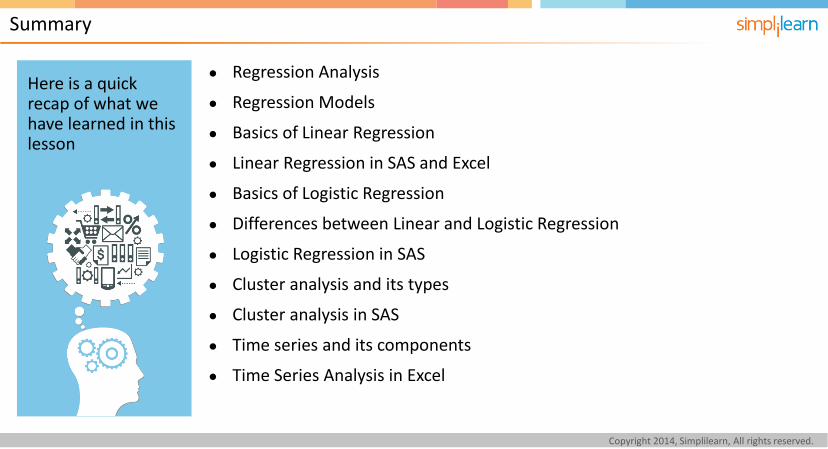
Summary
Here is a quick recap of what we have learned in this lesson
● Regression Analysis
● Regression Models
● Basics of Linear Regression
● Linear Regression in SAS and Excel
● Basics of Logistic Regression
● Differences between Linear and Logistic Regression
● Logistic Regression in SAS
● Cluster analysis and its types
● Cluster analysis in SAS
● Time series and its components
● Time Series Analysis in Excel

Copyright 2014, Simplilearn, All rights reserved.
Quiz
Copyright 2014, Simplilearn, All rights reserved.
QUIZ
a.
b.
c.
d.
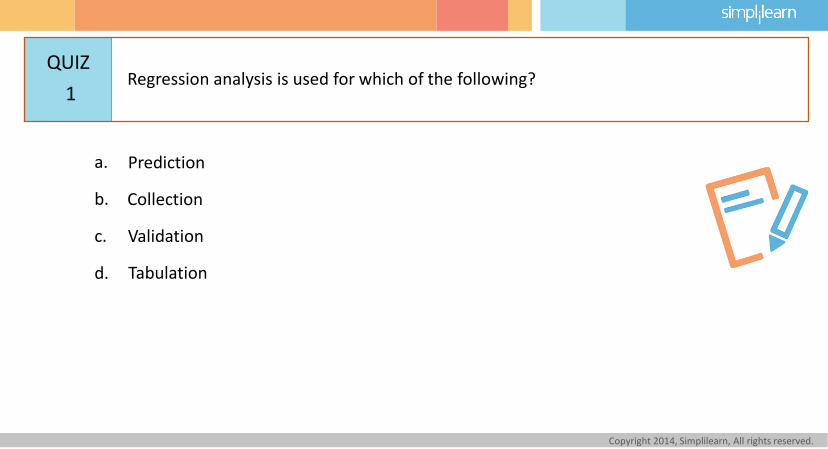
Regression analysis is used for which of the following?
Collection
Validation
Tabulation
Prediction
1
Copyright 2014, Simplilearn, All rights reserved.
QUIZ
a.
b.
c.
d.
Answer: a.
Explanation: Prediction is the used for regression analysis.
Collection
Validation
Tabulation
Prediction
Regression analysis is used for which of the following?
1
Copyright 2014, Simplilearn, All rights reserved.
QUIZ
a.
b.
c.
d.
Simple linear regression is not used for which of the following purse?
For prediction of values of other variable from the one which has more data.
Finding the distance between two variables.
Correction of linear dependence of one variable on the other.
For describing the linear dependence of one variable on the other.
2

Copyright 2014, Simplilearn, All rights reserved.
QUIZ
a.
b.
c.
d.
Answer: c.
Explanation: Simple linear regression doesn’t determine the distance between two variables.
For prediction of values of other variable from the one which has more data.
Finding the distance between two variables
Correction of linear dependence of one variable on the other
For describing the linear dependence of one variable on the other.
Simple linear regression is not used for which of the following purse? 2

Copyright 2014, Simplilearn, All rights reserved.
QUIZ
a.
b.
c.
d.
What is a residual value?
It’s a discrepancy between the actual and the predicted value.
It’s the residing value.
It’s the redundant value.
It’s the left out value.
3
Copyright 2014, Simplilearn, All rights reserved.
QUIZ
a.
b.
c.
d.
Answer: b.
Explanation: Residual value is the discrepancy between the actual and the predicted value.
What is a residual value?
3
It’s a discrepancy between the actual and the predicted value.
It’s the residing value.
It’s the redundant value.
It’s the left out value.
Copyright 2014, Simplilearn, All rights reserved.
QUIZ
a.
b.
c.
d.
The procedure to find the best fit for linear regression is?
Text square method.
External square method.
Least square method.
Mean square method.
4
Copyright 2014, Simplilearn, All rights reserved.
QUIZ
a.
b.
c.
d.
Answer: d.
Explanation: The procedure to find the best fit for linear regression is least square method.
Text square method.
External square method.
Least square method.
Mean square method.
The procedure to find the best fit for linear regression is?
4

Copyright 2014, Simplilearn, All rights reserved.
QUIZ
a.
b.
c.
d.
Which of the following is not a method for clustering?
DBSCAN
Agglomerative hierarchical clustering
Collective clustering
K-means
5

Copyright 2014, Simplilearn, All rights reserved.
QUIZ
a.
b.
c.
d.
Answers: d.
Explanation: Collective clustering is not a method for clustering.
DBSCAN
Agglomerative hierarchical clustering.
Collective clustering.
K-means
Which of the following is not a method for clustering? 5

Copyright 2014, Simplilearn, All rights reserved.
QUIZ
a.
b.
c.
d.
Which one of the following is a type of cluster?
Fuzzy.
Complete.
Graph.
Hierarchical.
6

Copyright 2014, Simplilearn, All rights reserved.
QUIZ
a.
b.
c.
d.
Answer: d.
Explanation: Graph is a type of cluster.
Fuzzy.
Complete.
Graph.
Hierarchical.
Which one of the following is a type of cluster? 6
Copyright 2014, Simplilearn, All rights reserved.
QUIZ
a.
b.
c.
d.
What are predictors?
They tell what is about to happen.
They tell about what is upcoming.
They are variables assumed to be cause for the respondent variable.
They are the future values.
7
Copyright 2014, Simplilearn, All rights reserved.
QUIZ
a.
b.
c.
d.
Answer: d.
Explanation: The variables that are assumed to be the cause are called predictor and the variables that are assumed to be effect are called the response or target variables.
They tell what is about to happen.
They tell about what is upcoming.
They are variables assumed to be cause for the respondent variable.
They are the future values.
What are predictors?
7
Copyright 2014, Simplilearn, All rights reserved.
QUIZ
a.
b.
c.
d.
The error term in regression model is given by?
β - beta
α - alpha
ε - epsilon
Θ - theta
8
Copyright 2014, Simplilearn, All rights reserved.
QUIZ
a.
b.
c.
d.
Answer: d.
Explanation: The error term is represented as ε – epsilon.
β - beta
α - alpha
ε - epsilon
Θ - theta
The error term in regression model is given by?
8
Copyright 2014, Simplilearn, All rights reserved.
QUIZ
a.
b.
c.
d.
What happens in exclusive clustering?
They assign each object to a single cluster.
They assign many objects to a single cluster.
They assign many objects to many clusters.
They assign each object to many clusters.
9
Copyright 2014, Simplilearn, All rights reserved.
QUIZ
a.
b.
c.
d.
Answer: b.
Explanation: They assign each object to a single cluster.
They assign each object to a single cluster.
They assign many objects to a single cluster.
They assign many objects to many clusters.
They assign each object to many clusters.
What happens in exclusive clustering?
9
Copyright 2014, Simplilearn, All rights reserved.
QUIZ
a.
b.
c.
d.
Which moving average assigns equal weights to all values ?
Exponential moving average.
Quadratic moving average.
Modified moving average.
Simple moving average.
10
Copyright 2014, Simplilearn, All rights reserved.
QUIZ
a.
b.
c.
d.
Answer: a.
Explanation: simple moving average assigns equal weights to all values for smoothening.
Exponential moving average.
Quadratic moving average.
Modified moving average.
Simple moving average.
10 Which moving average assigns equal weights to all values ?
Copyright 2014, Simplilearn, All rights reserved.
QUIZ
a.
b.
c.
d.
Which moving average assigns more weights to recent values ?
Exponential moving average.
Quadratic moving average.
Modified moving average.
Simple moving average.
11
Copyright 2014, Simplilearn, All rights reserved.
QUIZ
a.
b.
c.
d.
Answer: b.
Explanation: exponential moving average assigns more weights to recent values and for older values it decreases exponentially.
Exponential moving average.
Quadratic moving average.
Modified moving average.
Simple moving average.
11 Which moving average assigns more weights to recent values ?

Copyright 2014, Simplilearn, All rights reserved.
QUIZ
a.
b.
c.
d.
Which regression to use when the dependent variable is binary?
Clustered regression.
Logistic regression.
Multi linear regression.
Linear regression.
12
Copyright 2014, Simplilearn, All rights reserved.
QUIZ
a.
b.
c.
d.
Answer: c.
Explanation: in logistic regression the dependent variable is binary and the independent variable may be continuous or dichotomous.
Clustered regression.
Logistic regression.
Multi linear regression.
Linear regression.
12 Which regression to use when the dependent variable is binary?
Copyright 2014, Simplilearn, All rights reserved.
QUIZ
a.
b.
c.
d.
Which of the following statement is used in displaying graphical output in SAS?
ODS plot.
MSN graphics.
ODS diagram.
ODS graphics .
13
Copyright 2014, Simplilearn, All rights reserved.
QUIZ
a.
b.
c.
d.
Answer: a.
Explanation: ODS graphics helps in displaying the graphical output
ODS plot.
MSN graphics.
ODS diagram.
ODS graphics .
13 Which of the following statement is used in displaying graphical output in SAS?
Copyright 2014, Simplilearn, All rights reserved.
QUIZ
a.
b.
c.
d.
Which among the following is not true of simple moving average?
It gives equal weightage to the window of previous data
It gives exponential weights to the previous data
The historic values are not taken into account
It smoothens the time series
14
Copyright 2014, Simplilearn, All rights reserved.
QUIZ
a.
b.
c.
d.
Answer: c.
Explanation: Simple moving average gives equal weight to window of previous data, not exponential.
Which among the following is not true of simple moving average?
It gives equal weightage to the window of previous data
It gives exponential weights to the previous data
The historic values are not taken into account
It smoothens the time series
14
Copyright 2014, Simplilearn, All rights reserved.
QUIZ
a.
b.
c.
d.
Which of the following time series forecasting can be done in Excel?
HoltWinters
ARIMA
Holt’s method
Simple Moving Average
15
Copyright 2014, Simplilearn, All rights reserved.
QUIZ
a.
b.
c.
d.
Answer: a.
Explanation: Simple Moving Average forecasting can be done in Excel
Which of the following time series forecasting can be done in Excel?
HoltWinters
ARIMA
Holt’s method
Simple Moving Average
15

Copyright 2014, Simplilearn, All rights reserved.
Thank You
Copyright 2014, Simplilearn, All rights reserved.