0,0$%(.)(0,)(.1&+&2$.*+, .1*2(3,(#$0(.(,4%&',)1(,!5%&-(
TRANSCRIPT
!"#$%&"'(")*+,-&+$./,*"0,0$%(.)(0,)(.1"&+&2$.*+,
.1*"2(3,(#$0(".(,4%&',)1(,!5%&-(*",.*%6&",
'*%7()
!"#$"%&'("&%&'")*'+),-.)%'/%0$%1&%#23,2%
4"20$'5675
(%),2%'8-2'(&.9",%'($"):%';0-)-9.0<'")*'=-&.0>'?-2@.):'
="#%2'A-B'CD
E2"),$"9'!%<%"20$'F)<,.,G,%'-)'(&.9",%'($"):%'")*',$%'
;)H.2-)9%),
?-2@.):'="#%2'A-B'DI

81(,9(")%(,4&%,9+$'*)(,91*"2(,!.&"&'$.:,*"0,;&+$./,<999!;=!"#$!%$&#'()$*%+!', ! &*% !-.)/%0$)&, ! 12 ! 3%%+$ ! #.+ ! &*% ! 31.+1. !45*11( ! 12 ! 651.17)5$ ! #.+ !81()&)5#(!45)%.5%! ).!9::;! &1!#+/#.5%!<='()5!#.+!<0)/#&%!#5&)1.!1.!5()7#&%!5*#.>%!&*01=>*!)..1/#&)/%?!0)>101=$!0%$%#05*@!A*%!B%.&0%!)$!2=.+%+!',!&*%!-C!651.17)5!#.+!415)#(!D%$%#05*!B1=.5)(!#.+!*#$!2)/%!).&%0E().F%+!0%$%#05*!<01>0#77%$G
H@ I%/%(1<).>!5()7#&%!$5)%.5%!#.+!%51.17)5$9@ B()7#&%!5*#.>%!>1/%0.#.5%!210!#!.%"!>(1'#(!+%#(J@ K+#<&#&)1.!&1!5()7#&%!5*#.>%!#.+!*=7#.!+%/%(1<7%.&L@ M1/%0.7%.&$?!7#0F%&$!#.+!5()7#&%!5*#.>%!7)&)>#&)1.N@ A*%!O=.)5*!D%!801>0#77%!E!6/#(=#&).>!&*%!%51.17)5$!12!5()7#&%!0)$F$!#.+!
1<<10&=.)&)%$!).!&*%!).$=0#.5%!$%5&10
O10%!).2107#&)1.!#'1=&!&*%!B%.&0%!210!B()7#&%!B*#.>%!651.17)5$!#.+!81()5,!5#.!'%!21=.+!#&G!*&&<GPP"""@555%<@#5@=F@
81(,>%*")1*',?(:(*%.1,@":)$)5)(,&",9+$'*)(,91*"2(,*"0,)1(,!"#$%&"'("),"#$!%$&#'()$*%+!',!&*%!31.+1.!45*11( !12 !651.17)5$!#.+!81()&)5#( !45)%.5%! ).!9::;!&1!'0).> ! &1>%&*%0 ! ).&%0.#&)1.#( ! %Q<%0&)$% ! 1. ! %51.17)5$? ! 2).#.5%? ! >%1>0#<*,? ! &*%!%./)01.7%.&? ! ).&%0.#&)1.#( !+%/%(1<7%.& ! #.+ !<1()&)5#( ! %51.17, ! &1 ! 50%#&% ! # !"10(+E(%#+).>!5%.&0%!210!<1()5,E0%(%/#.&!0%$%#05*!#.+!&0#).).>! ).!5()7#&%!5*#.>%!#.+!&*%!%./)01.7%.&@!A*%!R.$&)&=&%!)$!2=.+%+!',!&*%!M0#.&*#7!S1=.+#&)1.!210!&*%!801&%5&)1.!12!&*%!6./)01.7%.&?!#.+!*#$!2)/%!0%$%#05*!<01>0#77%$G
H@ -$%!12!5()7#&%!$5)%.5%!).!+%5)$)1.E7#F).>9@ O)&)>#&)1.!12!5()7#&%!5*#.>%!T).5(=+).>!&*%!01(%$!12!5#0'1.!7#0F%&$!#.+!(1"E
5#0'1.!&%5*.1(1>)%$UJ@ R7<#5&$!12?!#.+!#+#<&#&)1.!&1?!5()7#&%!5*#.>%?!#.+!)&$!%22%5&$!1.!+%/%(1<7%.&L@ M1/%0.#.5%!12!5()7#&%!5*#.>%N@ O#.#>%7%.&!12!210%$&$!#.+!%51$,$&%7$
O10%!).2107#&)1.!#'1=&!&*%!M0#.&*#7!D%$%#05*!R.$&)&=&%!1.!B()7#&%!B*#.>%!#.+!&*%!6./)01.7%.&!5#.!'%!21=.+!#&G!*&&<GPP"""@($%@#5@=FP>0#.&*#7@
A*)$!"10F).>!<#<%0!)$!).&%.+%+!&1!$&)7=(#&%!+)$5=$$)1.!")&*).!&*%!0%$%#05*!5177=.)&,!#.+ ! #71.> ! =$%0$ ! 12 ! 0%$%#05*? ! #.+ ! )&$ ! 51.&%.& ! 7#, ! *#/% ! '%%. ! $='7)&&%+ ! 210!<='()5#&)1.!).!#5#+%7)5!V1=0.#($@!R&!*#$!'%%.!0%/)%"%+!',!#&!(%#$&!1.%!).&%0.#(!0%2%0%%!'%210% ! <='()5#&)1.@ ! A*% ! /)%"$ ! %Q<0%$$%+ ! ). ! &*)$ ! <#<%0 ! 0%<0%$%.& ! &*1$% ! 12 ! &*%!#=&*10T$U!#.+!+1!.1&!.%5%$$#0)(,!0%<0%$%.&!&*1$%!12!&*%!*1$&!).$&)&=&)1.$!10!2=.+%0$@
Environmental Policy and Directed Technological Change:
Evidence from the European carbon market∗
Raphael Calel1 and Antoine Dechezlepretre1,2
1Grantham Research Institute on Climate Change and the Environment, London School of Economics2Centre for Economic Performance, London School of Economics
First version: March 2012
This version: February 2013
Abstract
This paper investigates the impact of the EU Emissions Trading Scheme (EU ETS)on technological change. We exploit installations-level inclusion criteria to estimatethe impact of the EU ETS on firms patenting. We find that the EU ETS has in-creased low-carbon innovation among regulated firms by as much as 10%, while notcrowding out patenting for other technologies. We also find evidence that the EUETS has not impacted patenting beyond the set of regulated companies. Theseresults imply that the EU ETS accounts for nearly a 1% increase in European low-carbon patenting compared to a counterfactual scenario.
JEL: O3, Q55, Q58, C14Keywords: Directed technological change, EU Emissions Trading Scheme, Policyevaluation.
1 Introduction
Emissions trading programs have assumed an ever more prominent role in environmen-tal policy over the last few decades. In the US, the Acid Rain Program, the Regional
∗E-mail: [email protected] and [email protected]. For their insightful comments andgenerous advice, we owe a great thanks to Devin Caughey, Sam Fankhauser, Matthieu Glachant, Bron-wyn Hall, Ivan Hascic, Nick Johnstone, Carmen Marchiori, David Popp, and Paul Rosenbaum. Partici-pants of seminars and conferences in Asheville, Cambridge, London, Madrid, Mannheim, Milan, Paris,Rome, Toulouse, Toxa and Venice have all improved the paper. Raphael Calel is grateful for fundingprovided by the ESRC and the Jan Wallander and Tom Hedelius Foundation. Antoine Dechezlepretregratefully acknowledges the support of ADEME and of the ESRC under the ESRC Postdoctoral Fellow-ship Scheme (award no: PTA-026-27-2756). The authors would also like to thank Xavier Vollenweiderfor excellent research assistance.
1
Greenhouse Gas Initiative (RGGI), and California’s cap-and-trade program are all ex-amples of this trend. Australia, New Zealand, and the Canadian province of Quebechave all recently created their own cap-and-trade programs to regulate greenhouse gasemissions, and China, Japan, South Korea, and Brazil are individually making movestoward launching their own. Global carbon markets are today worth over $175 billiona year (Kossoy and Guigon, 2012), and with so many new initiatives in the works, thisnumber will likely grow much larger in years to come.
At present, most of the $175 billion a year is accounted for by the European UnionEmissions Trading Scheme (EU ETS). It launched in 2005, allocating tradable emissionspermits to over 12’000 power stations and industrial plants in 24 countries, accountingfor over 40% of the EU’s total greenhouse gas emissions.1 It is today the world’s largestcap-and-trade program. Like all of the new emissions trading initiatives around theglobe, the primary aim of the EU ETS is to reduce carbon emissions, but to do sothrough innovation rather than output reduction. When regulated firms expect to facea higher price on emissions relative to other costs of production, this provides them withan incentive to make operational changes and investments that reduce the emissionsintensity of their output. The “induced innovation” hypothesis, dating back to Sir JohnHicks (1932) and restated in the context of environmental policy by Porter (1991) andAcemoglu et al. (2012), suggests that part of this new investment will be directed towarddeveloping and commercializing new emissions-reducing technologies. According to thistheory, the EU ETS can be expected to spur development of new low-carbon technologies.This vision has been articulated many times by EU policy makers, who envisage the EUETS to be a driving force of low-carbon economic growth.
In this paper we conduct the first comprehensive investigation of the impact of the EUETS on low-carbon technological change in the first 5 years of the Scheme’s existence.The EU ETS offers a unique opportunity to investigate the impact of environmentalpolicy on technological change. It is the first and largest environmental policy initiative ofits kind anywhere in the world, which by itself would make it an interesting case to study.But more important is the fact that, in order to control administrative costs, the EUETS was designed to cover only large installations. Firms operating smaller installationsare not covered by EU ETS regulations, although the firms themselves might be just aslarge as those affected by the regulations.2 Because innovation takes place at the levelof the firm, we can exploit these installation-level inclusion criteria to compare firms
124 countries were included from the beginning. 6 countries have joined since then.2Although the EU ETS regulations are applied at the level of the installation, we will often use
‘EU ETS firms’ or ‘regulated firms’ as shorthand for firms operating at least one EU ETS regulatedinstallation.
2
with similar resources available for research and similar patenting histories, but whichhave fallen under different regulatory regimes since 2005. This provides an opportunityto apply the sort of quasi-experimental techniques most suited to assessing the causalimpacts of environmental policies (List et al., 2003; Greenstone and Gayer, 2009). Studiesemploying these methods have found that environmental regulations inhibit new-plantformation (List et al., 2003), but stimulate capital investment in existing plants (Fowlie,2010). To the authors’ knowledge, though, this is the first time these methods have beenemployed to study the impact of environmental policy on directed technological change.
We use a newly constructed data set that records patenting activities, key firm char-acteristics, and regulatory status with respect to the EU ETS. Our data set includesinformation on over 30 million firms across 23 countries, 18 of which took part in the2005 launch of the EU ETS. We identify over 5’500 firms operating more than 9’000 in-stallations regulated under the EU ETS, accounting for over 80% of EU ETS-wide emis-sions. Using this data set, we are able to compare unregulated and would-be regulatedfirms both before and after the EU ETS launched. The low-carbon patent classificationrecently developed by the European Patent Office (EPO) allows us to identify emissionsreduction technologies. A matched difference-in-differences study design enables us tocontrol for confounding factors that affect both regulated and unregulated firms (in-put prices, sector- and country-specific policies, etc.), as well as firm-level heterogeneity(Heckman et al., 1998b,a; Smith and Todd, 2005; Abadie, 2005). Our estimates providethe first comprehensive empirical assessment of the impact of the EU ETS on directedtechnological change.
A casual look at aggregate patent data reveals a surge in low-carbon patenting since2005. The increase appears larger among EU ETS regulated companies, and our matcheddifference-in-differences estimate of the treatment effect implies that the EU ETS isresponsible for a 36.2% increase in low-carbon patenting among our matched sample of3’428 EU ETS firms, or an increase of 8.1% across all of the 5’500 EU ETS firms. Thiswould account for less than a 1% increase of low-carbon patenting at the EPO. Putanother way, only 2% of the post-2005 surge in low-carbon patenting can be attributedto the EU ETS.
With respect to concerns that low-carbon innovation would crowd out developmentof other technologies (Popp and Newell, 2012), we find evidence that the EU ETS hasin fact encouraged patenting for other technologies, but by a very small amount. Weinvestigate several challenges to the internal and external validity of our results—e.g.omitted variable bias and a failure of ‘selection on observables’—but our conclusionsappear to be remarkably robust.
3
For fear that a focus on EU ETS firms would have blinkered us to a broader indirectimpact of the EU ETS, we identify 12’000 of likely third-party technology providers andpurchasers and test whether these firms have also responded to the EU ETS. The esti-mates are only indicative, but we find no compelling evidence that the EU ETS has hadeither a net positive or net negative impact on the patenting activities of third parties.Taken together, our findings suggest that, while EU ETS regulated firms have respondedstrongly, the Scheme so far has had at best a very limited impact on the overall pace anddirection of technological change. The EU ETS is expected to remain an integral partof the EU’s strategy for building a low-carbon Europe (European Commission, 2011),but in its current form the EU ETS may not be providing incentives for low-carbontechnological change on a large scale.
Technological change may be the single most important determinant of the long-runcost of emissions abatement. Consequently, the ability of an environmental policy toinfluence technological change is perhaps one of the most important criteria on whichto judge its success (Kneese and Schultze, 1975; Pizer and Popp, 2008). In light of this,it is not surprising that there are ongoing efforts from both theoretical and empiricaleconomists to better understand the capacity of environmental policies to induce cleaninnovation. On the theoretical side, the past few decades have seen the emergence of aconsiderable literature further developing the induced innovation hypothesis, especiallyin the context of climate change mitigation (Popp, 2004; Acemoglu et al., 2012).
On the empirical side, a large and growing research enterprise is trying to understandand quantify the link between environmental policies and directed technological change,often with innovation measured at the level of economic sectors or countries (Newellet al., 1999; Brunnermeier and Cohen, 2003; Popp, 2002; Aghion et al., 2012 and manyothers. See Popp et al., 2009, Popp, 2010, and Ambec et al., 2010, for recent surveys).Our study contributes to this literature, and analyzes the policy impacts at the firm-level. The handful of studies that have begun to investigate the innovation impact of theEU ETS rely on interview-based methodologies and most analyze small unrepresentativesamples (Hoffmann, 2007; Tomas et al., 2010; Anderson et al., 2011). Martin et al. (2011)take extra precautions to ensure consistency across interviews with different firms, andthey conduct the largest study to date covering 450 EU ETS firms in 6 countries. Weuse patent portfolios as an objective measure of technological change, and our studyconsiders over 5’500 EU ETS firms in 18 countries, accounting for roughly 80% of theprogram as a whole. With this, we provide the first comprehensive empirical estimatesof the Scheme’s impact on directed technological change.
The paper proceeds as follows. Section 2 surveys the evidence on environmental
4
policy and directed technological change, especially in the context of emissions trading.Evidence from the US Acid Rain Program and early studies of the EU ETS informus about how the EU ETS is likely to have impacted technological change. In section3 we familiarize ourselves with our newly constructed data set, and use it to beginunpacking the characteristics of low-carbon technological change. In section 4 we turnour eye to estimating the impact of the EU ETS on regulated firms, and in section 5 weexamine its indirect impact on third-party technology providers and purchasers. Section6 summarizes and discusses the evidence in light of the broader empirical literature. Weconclude by considering some of the potential policy implications of our findings, anddirections for future research.
2 Emissions trading and directed technological change
2.1 Empirical background
Several studies have found evidence that environmental policy does impact the direc-tion of technological change (Lanjouw and Mody, 1996; Brunnermeier and Cohen, 2003;Popp, 2002, 2003, 2006; Arimura et al., 2007; Lanoie et al., 2007). Popp (2006) findsan almost immediate patenting response to domestic clean air regulations in the US,Germany, and Japan. Johnstone et al. (2010) find that renewable energy patents haveincreased dramatically as national and international climate change policies have mul-tiplied. But while policy makers continue making this argument, and though there isempirical evidence to support a general link between environmental policy and directedtechnological change, a more careful reading of the literature yields two cautionary ob-servations that seem particularly relevant for the EU ETS.
Firstly, when examining the impact of emissions trading programs specifically, ratherthan environmental policies more broadly construed, the conclusions about its impactsare more modest. Most earlier studies consider the US Clean Air Act’s Acid Rain Pro-gram, launched in 1995. Early estimates suggested nearly half of the emissions reductionswere achieved by installing scrubber technology, and the remainder by switching to coalwith a lower sulphur content (Schmalensee et al., 1998). The scrubber technology existedbefore 1995, but had in many instances not been economically viable. The innovationresulting from the Acid Rain Program thus appears to have been focused on operationalrather than technological change (Burtraw, 2000). Yet there is some evidence of verynarrowly directed technological change. Popp (2003) detects an increase in patents that
5
improved the efficiency of scrubbers.3 This effect was confined to early years under thenew regime though, and the Program has not provided ongoing incentives for technolog-ical advancement (Lange and Bellas, 2005). This squares with findings that the use ofscrubber technology as an emissions abatement strategy has actually declined over time(Burtraw and Szambelan, 2009). To put it simply, past emissions trading programs likethe Acid Rain Program do not provide a precedent for the kind of induced technologicalchange EU policy makers are hoping the EU ETS will provide.
Secondly, if we expected the incentives for technological development to be mediatedprimarily by augmenting energy prices, we can use historical estimates of the energyprice elasticity of energy-saving technology patents to give us a very rough idea of thepotential effect the EU ETS might be having. Popp (2002) suggests that, even at theheight of the energy crisis of the late 1970s, energy prices only boosted patenting by3.14%. The carbon price in the EU ETS, having ranged from a peak of near e30 toa low of near e0 (and spending more time in the lower part of that range), does notimply anything close to the energy price hikes of the late 1970s. One might thereforeexpect the patenting response, if any, to be barely perceptible. This back-of-the-envelopecomparison comes with serious health warnings, of course, not the least of which is thatinnovation may be driven more by expectations than currently prevailing prices (Martinet al., 2011). Nevertheless, it can help aid our expectations about the likely impact ofthe EU ETS.
So while policy makers envisage the EU ETS as the engine of low-carbon innovation,and though there is empirical evidence that supports a positive link between environmen-tal policy and directed technological change generally, the two observations above—theweak patenting response in previous emissions trading programs, and the meager patent-ing response to be expected from the diluted price signal—invite a degree of skepticismabout strong claims for the ability of the EU ETS to promote innovation. These twoobservations, moreover, motivate a special interest in providing policy makers with di-rect empirical evidence on whether or not the EU ETS is encouraging firms to developnew low-carbon technologies.
2.2 The EU ETS and directed technological change
In 2005, the EU ETS launched in 24 countries across Europe, covering roughly 40%of the EU’s total greenhouse gas emissions. First, power stations and industrial plants
3It is worth noting that Title IV of the Clean Air Act, which establishes the Acid Rain Program, alsoincludes special provisions that reward firms specifically for the use of scrubbers. It is not entirely clear,therefore, how much was ‘the market’s doing’.
6
across Europe were classified according to their main activity: “combustion”, “cement”,“paper and pulp”, etc. For each category, installations had to meet certain criteria to beincluded in the EU ETS. For instance, only combustion installations historically consum-ing more than 20 MWh a year were covered. The Scheme would then be implemented in3 trading phases, with successively more stringent emissions caps for each phase. Phase1, which ran from 2005–2007, was insulated from later phases by prohibiting bankingand borrowing of permits across the phase boundary. Phase 2 (2008–2011) and Phase 3(2012–2020) allow firms to bank unused permits for later use, as well as a limited form ofborrowing against future emissions reductions. For each year in Phase 1, over 2 billiontons-worth of tradable emissions permits were allocated to the more than 12’000 qualify-ing power stations and industrial plants, and a legal requirement was instituted that eachinstallation surrender enough permits at the end of each year to cover their emissions.Prior to the compliance date, however, installation operators could freely trade permitswith each other (as well as with financial intermediaries and private citizens).4 The priceof emitting one ton of CO2 would be set in this newly created marketplace. Since 2005,the spot price has varied between e0 and e30, spending more time in the lower part ofthat range. The price of forward contracts has remained steadily above the spot price,though, suggesting firms are taking the progressive stringency of the cap into account.With the price of carbon revealed in the market, installations (or rather the firms thatoperate them) can then make abatement and investment decisions accordingly.
Since it launched in 2005, there has been vigorous debate about whether the EU ETSwould induce firms to develop new emissions-reducing technologies, many arguing thatan overly generous allocation of emissions permits would largely undermine the incentivesto innovate (Schleich and Betz, 2005; Gagelmann and Frondel, 2005; Grubb et al., 2005).Indeed, a few early case studies summarized by Petsonk and Cozijnsen (2007) indicatethat rather than developing new technologies, firms have been introducing well-knowntechnological solutions that had simply not been economically viable before the EUETS imposed a carbon price on regulated firms. A growing literature of case-studiesand expert interviews now provides further support for this conclusion. Tomas et al.(2010) study four large EU ETS regulated Portuguese chemical companies, suggestingthat the EU ETS may have encouraged some energy efficiency improvements. Martinet al. (2011) conduct interviews with nearly 800 European manufacturing firms, of whichalmost 450 operated some EU ETS regulated installations. Using their interview-basedmeasure of innovation, they find a positive effect of the expected future stringency of EU
4See Ellerman et al. (2010) for a more comprehensive review of the design and implementation of theEU ETS.
7
ETS. Few studies have inquired directly about R&D or patenting, however. A surveyof Irish EU ETS firms tentatively suggests that almost no resources were available forlow-carbon R&D in Phase 1 of the trading program (2005–2007), while many of the firmshad pursued more operational innovations like installing new machinery or equipment,making process or behavioral changes, and employing fuel switching to some degree(Anderson et al., 2011). Hoffmann (2007), reporting on the German electricity sector,find that the EU ETS has had an effect on decisions about small-scale investments withshort amortization times, but not on R&D efforts. Neither study, however, provides asufficiently large or representative sample of EU ETS firms to provide a reliable picture ofthe innovation response to the EU ETS, especially since innovation tends to be relativelyconcentrated to a small group of firms. Moreover, neither study offers for comparison agroup of non-EU ETS firms.
What evidence there is suggests that the practice of fuel switching appears to havebeen very important so far. Fuel switching requires neither capital investment nor R&D,only that power providers bring less polluting gas-fired plants online before coal-firedones as demand ramps up. This changes the average fuel mix in favor of natural gas,and therefore reduces the carbon intensity of output. Fuel switching is a purely organi-zational innovation. Macroeconomic estimates suggest that the EU ETS reduced totalemissions by roughly 50–100 million tons of CO2 annually in Phase 1, or roughly 3–6%,compared with a “business-as-usual” scenario (Ellerman and Buchner, 2008; Andersonand Di Maria, 2011). Meanwhile, model-based estimates of power sector emissions abate-ment from fuel switching alone range from 26–88 million tons per year (Delarue et al.,2008, 2010). These estimates suggest that fuel switching very likely accounts for the lionshare of emissions reductions in the EU ETS so far. This is not a problem in and ofitself, of course. As mentioned earlier, the US Acid Rain Program achieved its emissionstargets in large part by analogous fuel switching strategies, and with little technologicalchange. However, one should be conscious that in the case of the EU ETS, the capac-ity for emissions reductions through fuel switching is far more limited compared to theEU’s longer term targets. Delarue et al. (2008) estimate that fuel switching has thepotential to reduce emission by up to 300 million tons per year, which is no more than atenth of what is needed to meet the EU target to cut emissions by 80% by 2050 against1990-levels.5
All of this provides only fragmentary or indirect evidence on directed technologicalchange, however. Our purpose, next, is to obtain more direct empirical evidence on
5The EU target amounts to reducing annual emissions by roughly 4’500 million tons compared to1990, or roughly 3’500 million tons compared to current emission levels.
8
whether or not the EU ETS is encouraging firms to develop new low-carbon technologies.
3 Unpacking low-carbon technological change
While EU ETS regulations apply at the level of the installation, innovation takes placeat the level of the firm, and recent advances in linking patent data with company datamakes it possible to construct firm-level patent portfolios. This paper exploits a newlyconstructed patent data set—linking patent portfolios to key firm characteristics, includ-ing whether or not the firm operates any installations covered by EU ETS regulations.
Patents have been used extensively as a measure of technological change in the recentinduced innovation literature (Popp, 2002, 2006; Johnstone et al., 2010; Aghion et al.,2012), and the advantages and drawbacks of patents are well understood (see OECD,2009, for a survey). Patents provide a useful measure of the output of innovative activityand are available at a highly disaggregated technological level. Having said that, it isalso worth noting that a number of studies have found that patent counts (output) arehighly correlated with R&D expenditures (input) in cross section (Griliches, 1984), andshift concurrently over time and in response to shocks (Kaufer, 1989). Our main measureof technological change uses patents filed with the European Patent Office (EPO). EPOpatents provide a common measure of innovation for all of Europe, unlike self-reportedinnovation measures or patents filed with national patent offices, for which the standardsvary from firm-to-firm or country-to-country. In addition, EPO patents provide a usefulquality threshold as only high value inventions typically get patented at the EPO.6
Nevertheless, as a robustness test we also repeat our analysis to using quality-weightedpatent counts.7
6Evidence shows that the highest value technologies are patented in several countries (Harhoff et al.,2003), and indeed, one of the methods used to measure the value of patents is to count the number ofcountries is which they are filed (van Zeebroeck, 2011). Patents filed at the EPO get patented in 6 EPOmember countries on average.
7Although the EPO provides a common measure of minimum patent quality, the value of patentsis still known to be heterogeneous. We use two ways to account for the quality of patents: forwardcitations and family size. Citation data have been widely used in the literature to control for the qualityof patents. With this method, patents are weighted by the number of times each of them is cited insubsequent patents (see Trajtenberg, 1990; Harhoff et al., 1999; Hall et al., 2005). The family of a patentis the set of patents protecting the same invention in various countries (patent family information comesfrom the DOCDB family table in PATSTAT). Counting the number of countries in which a patent is filedis another common measure of patent quality (Harhoff et al., 2003; van Zeebroeck, 2011). Family dataalso presents the advantage of being more rapidly available than citations (patents are typically mostlycited two years after their publication, hence four years after they are first filed), which is especiallyvaluable when dealing with very recent patents as we do. Finally, in some of our robustness tests wealso consider on patents filed with national patent offices to gauge whether our findings depend on hownarrowly we define the patents of interest.
9
All patents filed at the EPO are categorized using the European patent classification(ECLA), which includes a recently developed class pertaining to “technologies or applica-tions for mitigation or adaptation against climate change”, or “low-carbon technologies”for short. This new category (the “Y02” class) is the result of an unprecedented effortby the European Patent Office, whereby patent examiners specialized in each technol-ogy, with the help of external experts, developed a tagging system of patents related toclimate change mitigation technologies. The Y02 category provides the most accuratetagging of climate change mitigation patents available today and is becoming the inter-national standard for clean innovation studies8. These low-carbon technologies include,to name a few, efficient combustion technologies (e.g. combined heat and power genera-tion), carbon capture and storage, efficient electricity distribution (e.g., smart grids) andenergy storage (e.g. fuel cells). This class helps us measure the direction of technologicalchange.9 A complete description of the various sub-classes for low-carbon patents usedin the paper can be found in appendix C.
The EPO was set up in 1978. Since then, over 2.5 million patents have been filed withthe EPO, of which just over 50’000 (or 2%) have been classified as low-carbon inventions.Our newly constructed data set includes the patent portfolios of over 30 million firmslocated in 23 countries (22 EU countries, plus the US). 18 of these countries launchedthe EU ETS in 2005. The other 5 (Norway, Switzerland, Romania, Bulgaria, and theUS) have either joined later or have remained outside of the EU ETS altogether. Whileour data is somewhat more geographically restricted than the EPO, the firms in ourdata set account for just over 95% of all patents filed at the EPO, so we are confidentthat we have managed to include the patent history of the vast majority of companies.10
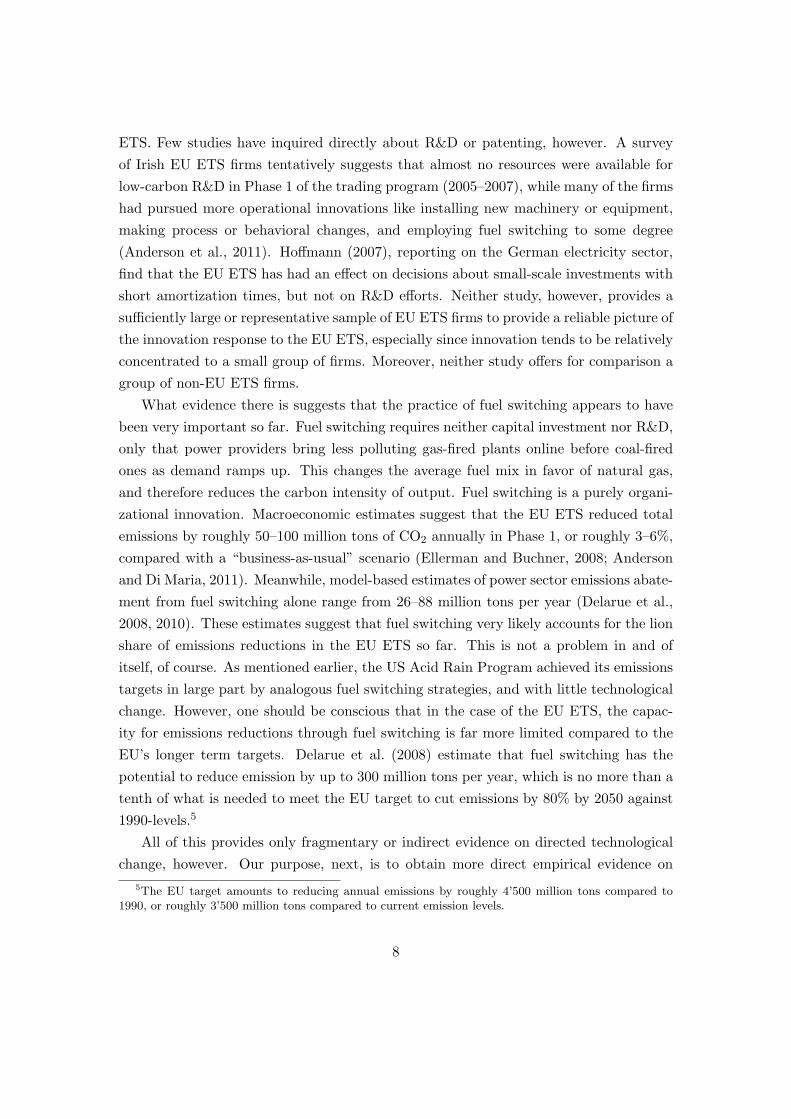
The share of patents protecting low-carbon technologies shows a distinct pattern overtime (figure 1). There was a surge in patenting for these technologies in the early 1980s,often attributed to the second oil price shock in the late 1970s (Dechezlepretre et al.,2011). The share of low-carbon patents filed each year then stayed roughly level untilthe mid-1990s, after which it began to rise again. The share of low-carbon patents hasincreased rapidly in recent years, as is particularly evident after 2005, with the share
8See (Veefkind et al., 2012) for more details on how this category was constructed.9Because the EPO low-carbon classification is not comprehensive, we also test the robustness of
our results to the inclusion of additional patents that other authors have considered low-carbon, inparticular patents pertaining to energy-efficient industrial processes. An updated list of environment-related patent classification codes is available from the OECD’s Environmental Policy and TechnologicalInnovation (EPTI) website: www.oecd.org/environment/innovation.
10We have also conducted extensive manual double-checking, so we can reasonably assume that com-panies for which we were unable to find any patent data have actually not filed any patent at the EPO.It is well documented that only a fraction of companies ever file patents, and this is likely to be especiallytrue of the EPO that has high administrative costs.
10
doubling from 2% to 4% in just a few years. A simple Chow test strongly rejects thehypothesis that there is no structural break in 2005 (P < 0.001).
Figure 1: Share of low-carbon patents (1978–2009)
1980 1985 1990 1995 2000 2005 2010
01
23
45
Year
Sha
re o
f pat
ents
(in
%)
EU ETS
Low-carbon
Pollution control
While this pattern is robust to using an expanded definition of “low-carbon technolo-gies”, it is not present for any set of environmentally friendly technologies. To see this,figure 1 also plots the share of patents protecting non-greenhouse gas “pollution controltechnologies”, as defined by Popp (2006),11 which does not display the same structuralbreak (one cannot reject the hypothesis of no structural break in 2005 at conventionalsignificance levels). The sudden surge in patenting activity, therefore, appears to be spe-cific to low-carbon technologies and to coincide with the launch of the EU ETS. Couldthe structural break in low-carbon patenting, then, be a consequence of the EU ETS?
Just like the increase in low-carbon patenting in the early 1980s has been attributedto the oil price shock, the recent surge might be due to rising oil prices. When comparingthe share of low-carbon patenting with the evolution of oil prices (see figure 2), onenotices that the present upsurge in patenting follows immediately on the heels of rapidoil price increases in the early 2000s. Patenting for pollution control, on the otherhand, was not responsive to the oil price in the 1980s, and so it is not surprising it hasstayed flat recently. Looking at the aggregate trends over time, clearly, is not enough todetermine whether the increase in low-carbon patenting since 2005 is the result of theEU ETS, oil prices, or some other factor. In order to isolate the impact of the EU ETSwe must compare the experience of firms regulated under the EU ETS with those notcovered by the regulation. Both groups will have faced the same oil prices and othermacroeconomic conditions, but starting in 2005 they were subject to different regulatory
11These technologies pertain to reduction of local pollutants including SO2 and NOX .
11
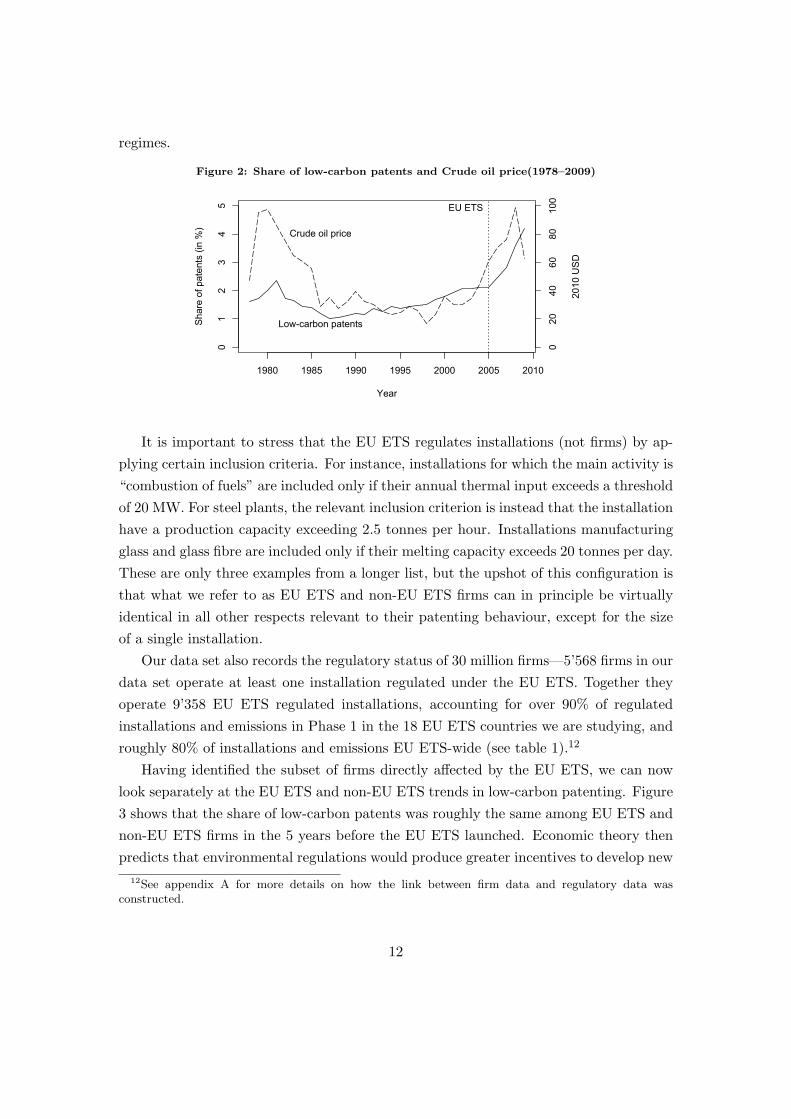
regimes.
Figure 2: Share of low-carbon patents and Crude oil price(1978–2009)
1980 1985 1990 1995 2000 2005 2010
01
23
45
Sha
re o
f pat
ents
(in
%)
Low-carbon patents
Crude oil price
EU ETS
Year
020
4060
80100
2010
US
D
It is important to stress that the EU ETS regulates installations (not firms) by ap-plying certain inclusion criteria. For instance, installations for which the main activity is“combustion of fuels” are included only if their annual thermal input exceeds a thresholdof 20 MW. For steel plants, the relevant inclusion criterion is instead that the installationhave a production capacity exceeding 2.5 tonnes per hour. Installations manufacturingglass and glass fibre are included only if their melting capacity exceeds 20 tonnes per day.These are only three examples from a longer list, but the upshot of this configuration isthat what we refer to as EU ETS and non-EU ETS firms can in principle be virtuallyidentical in all other respects relevant to their patenting behaviour, except for the sizeof a single installation.
Our data set also records the regulatory status of 30 million firms—5’568 firms in ourdata set operate at least one installation regulated under the EU ETS. Together theyoperate 9’358 EU ETS regulated installations, accounting for over 90% of regulatedinstallations and emissions in Phase 1 in the 18 EU ETS countries we are studying, androughly 80% of installations and emissions EU ETS-wide (see table 1).12
Having identified the subset of firms directly affected by the EU ETS, we can nowlook separately at the EU ETS and non-EU ETS trends in low-carbon patenting. Figure3 shows that the share of low-carbon patents was roughly the same among EU ETS andnon-EU ETS firms in the 5 years before the EU ETS launched. Economic theory thenpredicts that environmental regulations would produce greater incentives to develop new
12See appendix A for more details on how the link between firm data and regulatory data wasconstructed.
12
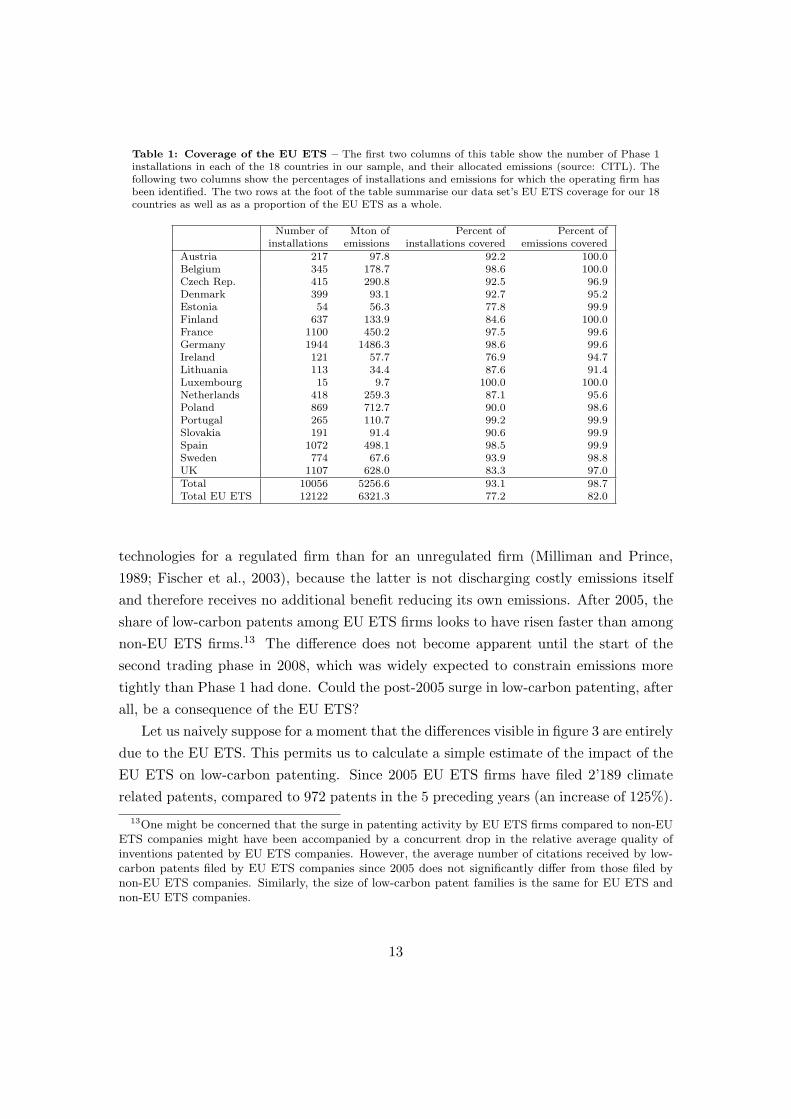
Table 1: Coverage of the EU ETS – The first two columns of this table show the number of Phase 1installations in each of the 18 countries in our sample, and their allocated emissions (source: CITL). Thefollowing two columns show the percentages of installations and emissions for which the operating firm hasbeen identified. The two rows at the foot of the table summarise our data set’s EU ETS coverage for our 18countries as well as as a proportion of the EU ETS as a whole.
Number of Mton of Percent of Percent ofinstallations emissions installations covered emissions covered
Austria 217 97.8 92.2 100.0Belgium 345 178.7 98.6 100.0Czech Rep. 415 290.8 92.5 96.9Denmark 399 93.1 92.7 95.2Estonia 54 56.3 77.8 99.9Finland 637 133.9 84.6 100.0France 1100 450.2 97.5 99.6Germany 1944 1486.3 98.6 99.6Ireland 121 57.7 76.9 94.7Lithuania 113 34.4 87.6 91.4Luxembourg 15 9.7 100.0 100.0Netherlands 418 259.3 87.1 95.6Poland 869 712.7 90.0 98.6Portugal 265 110.7 99.2 99.9Slovakia 191 91.4 90.6 99.9Spain 1072 498.1 98.5 99.9Sweden 774 67.6 93.9 98.8UK 1107 628.0 83.3 97.0Total 10056 5256.6 93.1 98.7Total EU ETS 12122 6321.3 77.2 82.0
technologies for a regulated firm than for an unregulated firm (Milliman and Prince,1989; Fischer et al., 2003), because the latter is not discharging costly emissions itselfand therefore receives no additional benefit reducing its own emissions. After 2005, theshare of low-carbon patents among EU ETS firms looks to have risen faster than amongnon-EU ETS firms.13 The difference does not become apparent until the start of thesecond trading phase in 2008, which was widely expected to constrain emissions moretightly than Phase 1 had done. Could the post-2005 surge in low-carbon patenting, afterall, be a consequence of the EU ETS?
Let us naively suppose for a moment that the differences visible in figure 3 are entirelydue to the EU ETS. This permits us to calculate a simple estimate of the impact of theEU ETS on low-carbon patenting. Since 2005 EU ETS firms have filed 2’189 climaterelated patents, compared to 972 patents in the 5 preceding years (an increase of 125%).
13One might be concerned that the surge in patenting activity by EU ETS firms compared to non-EUETS companies might have been accompanied by a concurrent drop in the relative average quality ofinventions patented by EU ETS companies. However, the average number of citations received by low-carbon patents filed by EU ETS companies since 2005 does not significantly differ from those filed bynon-EU ETS companies. Similarly, the size of low-carbon patent families is the same for EU ETS andnon-EU ETS companies.
13
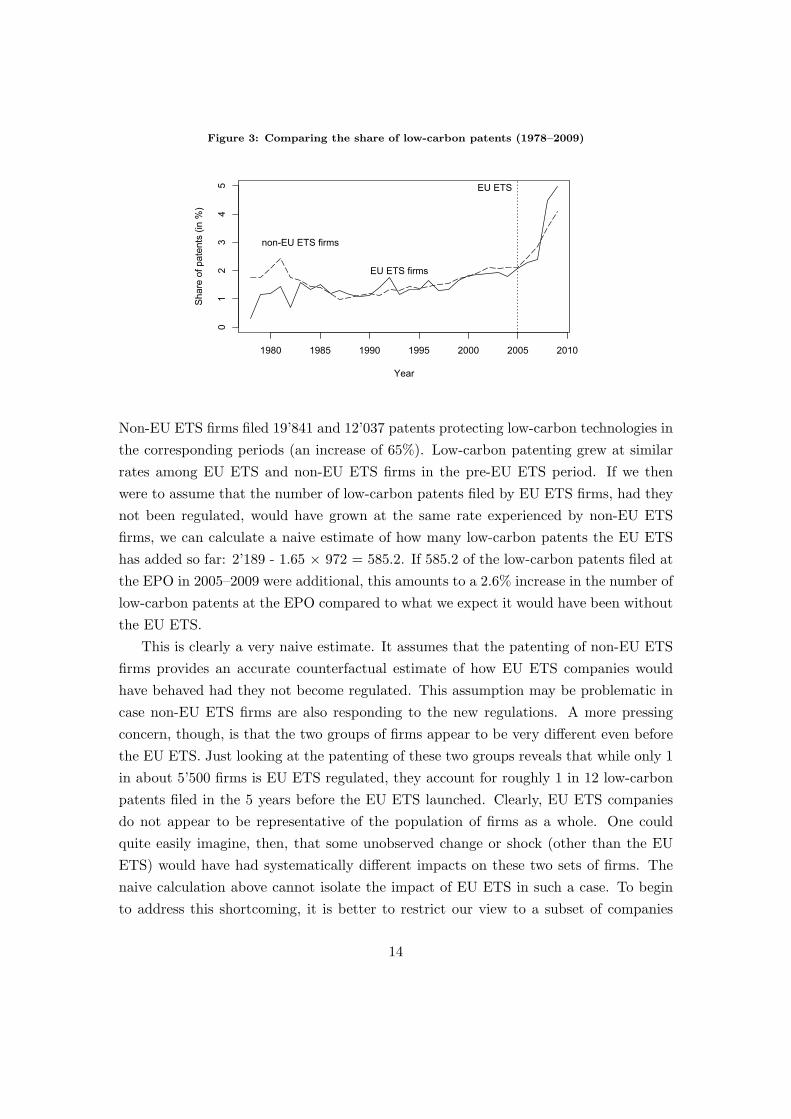
Figure 3: Comparing the share of low-carbon patents (1978–2009)
1980 1985 1990 1995 2000 2005 2010
01
23
45
Year
Sha
re o
f pat
ents
(in
%)
EU ETS firms
non-EU ETS firms
EU ETS
Non-EU ETS firms filed 19’841 and 12’037 patents protecting low-carbon technologies inthe corresponding periods (an increase of 65%). Low-carbon patenting grew at similarrates among EU ETS and non-EU ETS firms in the pre-EU ETS period. If we thenwere to assume that the number of low-carbon patents filed by EU ETS firms, had theynot been regulated, would have grown at the same rate experienced by non-EU ETSfirms, we can calculate a naive estimate of how many low-carbon patents the EU ETShas added so far: 2’189 - 1.65 × 972 = 585.2. If 585.2 of the low-carbon patents filed atthe EPO in 2005–2009 were additional, this amounts to a 2.6% increase in the number oflow-carbon patents at the EPO compared to what we expect it would have been withoutthe EU ETS.
This is clearly a very naive estimate. It assumes that the patenting of non-EU ETSfirms provides an accurate counterfactual estimate of how EU ETS companies wouldhave behaved had they not become regulated. This assumption may be problematic incase non-EU ETS firms are also responding to the new regulations. A more pressingconcern, though, is that the two groups of firms appear to be very different even beforethe EU ETS. Just looking at the patenting of these two groups reveals that while only 1in about 5’500 firms is EU ETS regulated, they account for roughly 1 in 12 low-carbonpatents filed in the 5 years before the EU ETS launched. Clearly, EU ETS companiesdo not appear to be representative of the population of firms as a whole. One couldquite easily imagine, then, that some unobserved change or shock (other than the EUETS) would have had systematically different impacts on these two sets of firms. Thenaive calculation above cannot isolate the impact of EU ETS in such a case. To beginto address this shortcoming, it is better to restrict our view to a subset of companies
14
that are more similar on pre-2005 characteristics. For such a group of firms, it would bemore difficult to imagine post-2005 changes (apart from the EU ETS) that would havesystematically different impacts on the patenting activities of EU ETS and non-EU ETSfirms. Rather than comparing all EU ETS firms with all unregulated firms, this morerestricted comparison is likely to yield a better estimate of the impact of the EU ETS.Let us now turn, therefore, to the task of constructing such a comparison.
4 The direct impact of the EU ETS
4.1 Matching
We face a difficult identification problem. Looking at changes over time is not sufficientto identify the impact of the EU ETS because it is not possible to adequately control forthings like oil price fluctuations and changes in macroeconomic conditions. ComparingEU ETS firms with non-EU ETS firms at a given time allows us to better control forthese time-variant factors. On the other hand, as we have discovered, the typical EUETS firm appears very different from the typical unregulated firm even before the EUETS launched in 2005. This comparison may therefore wrongly attribute some low-carbon patents to the EU ETS that are really the result of other systematic differencesbetween EU ETS and non-EU ETS firms.
Comparing the changes over time for two groups of firms that are more similar priorto 2005 would make it more difficult to explain away any difference in outcomes byfactors other than the EU ETS. Ideally one would like to match each EU ETS firm witha group of non-EU ETS firms with similar resources available and facing similar demandconditions, regulations (other than the EU ETS), input prices, etc. In this section weperform just such a matching exercise. As we restrict ourselves to more closely matchedfirms there will inevitably be a number of EU ETS companies for which no good matchcan be found. What is lost in sample size, however, is regained in terms of accuracy androbustness (see, for instance, Dehejia and Wahba, 1999).
Along with patent portfolios, our data set contains information on the country andeconomic sector in which firms operate,14 as well as other firm-level information such asturnover and employment. Using this data, we have tried to assign to each of the 5’568EU ETS firms a group of similar but unregulated firms (setting aside all companies with
14Economic sectors are defined at the 3-digit level for the NACE Rev. 2 industry classification. Afew examples of these sector definitions will illustrate how narrowly sectors are defined: “electric powergeneration, transmission, and distribution”, “steam and air conditioning supply”, “manufacture of glassand glass products”, “manufacture of plastic products”, “manufacture of rubber products”.
15
ownership ties to EU ETS firms, see appendix A). Though, this has not always beenpossible, for two main reasons. Firstly, the records of turnover become less and lesscomplete further back in time. In fact, we only have pre-2005 records on the turnoverfor 3’564 out of the 5’568 EU ETS firms. Secondly, though EU ETS regulations wereapplied at the installation level rather than directly to the firm, one might expect twovery similar firms to receive the same regulatory treatment more than occasionally.Different regulatory fates are possible if, say, an EU ETS firm operates an installationjust large enough to be covered by EU ETS regulations, while the matched controloperates one or more installations just below the threshold. But even though we havea very large pool of firms to start with, sometimes there will be no such comparatorsavailable within the same country and sector. Due to lack of suitable comparators, thesample of EU ETS firms is further reduced to 3’428. We return to the omitted firmsbelow in section 4.3, to consider the possible consequences of dropping them from oursample.
For each of the 3’428 matched EU ETS firms we have found at least one unregulatedfirm that operates in the same country and economic sector. This means that theyare likely exposed to much the same business and regulatory environment, input prices,country and sector specific shocks and trends. The firms are also matched to havesimilar pre-2005 turnover, patenting records, and age, since their available resources andcapacity for R&D and patenting are likely important determinants of a firm’s responseto the EU ETS.15 The resulting matched sample consists of 3’428 EU ETS firms and4’373 non-EU ETS firms.
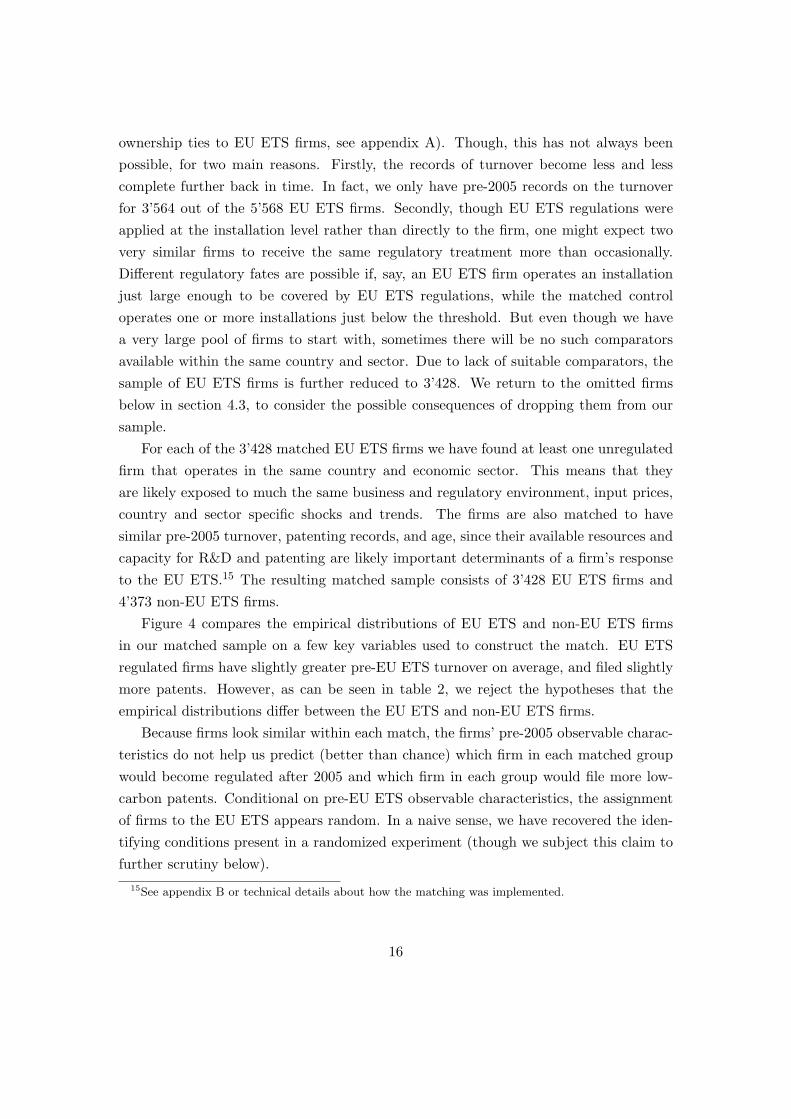
Figure 4 compares the empirical distributions of EU ETS and non-EU ETS firmsin our matched sample on a few key variables used to construct the match. EU ETSregulated firms have slightly greater pre-EU ETS turnover on average, and filed slightlymore patents. However, as can be seen in table 2, we reject the hypotheses that theempirical distributions differ between the EU ETS and non-EU ETS firms.
Because firms look similar within each match, the firms’ pre-2005 observable charac-teristics do not help us predict (better than chance) which firm in each matched groupwould become regulated after 2005 and which firm in each group would file more low-carbon patents. Conditional on pre-EU ETS observable characteristics, the assignmentof firms to the EU ETS appears random. In a naive sense, we have recovered the iden-tifying conditions present in a randomized experiment (though we subject this claim tofurther scrutiny below).
15See appendix B or technical details about how the matching was implemented.
16
Figure 4: Comparison of matched EU ETS and non-EU ETS firms
(a)
Turnover of non−EU ETS firms (Mil. Euro)
Turn
over
of E
U E
TS fi
rms
(Mil.
Eur
o)
0 0.1 10 1’000 100’000
00.
110
1’00
010
0’00
0
(b)
Patents by non−EU ETS firms
Pate
nts
by E
U E
TS fi
rms
0 10 100 1’000
010
100
1’00
0
(c)
Low−carbon patents by non−EU ETS firms
Low−c
arbo
n pa
tent
s by
EU
ETS
firm
s
0 10 100
010
100
Panel (a) displays the empirical quantile-quantile (e-QQ) plot for average turnover in the 4 years before the EUETS (2001–2004). Each dot gives the value for one EU ETS firm and the average for a group of matched non-EUETS firms, shown on logarithmic scales. 2001 is the first year for which turnover is recorded in our data set forany firm. Panels (b) and (c) show the e-QQ plots for the total number of patents and the number low-carbonpatents filed 2000–2004, respectively, once again shown on logarithmic scales.
4.2 Results
For each firm we measure the change in the number of low-carbon patents from 2000–2004to 2005–2009. This means that, even after matching, we take account of any additionaltime invariant firm-level heterogeneity. The outcomes of the matched control firms arethen subtracted from the outcomes of the EU ETS firms to obtain the difference-in-differences. A striking feature of the patent counts used to calculate these difference-in-differences is the large number of zeros. It is a very common feature of patent datathat most firms do not file any patents at all, and this arises from a similar censoringproblem that usually motivates the use of the Tobit estimator. We can imagine therebeing a latent variable that can take any value, but we can only observe numbers of zeroor greater.
To implement Tobit estimator in our case, though, we would have to explicitly modelthe propensity of firms to file at least one patent. This is by no means a straightforwardexercise, and getting the model wrong carries with it the risk of introducing new biases.The analogous maximum likelihood estimator will likewise generally be inconsistent, es-pecially when applied to panel data (Chay and Powell, 2001). Instead, we can accountfor the censoring at zero using a Tobit-modified empirical-likelihood estimator, as out-
17
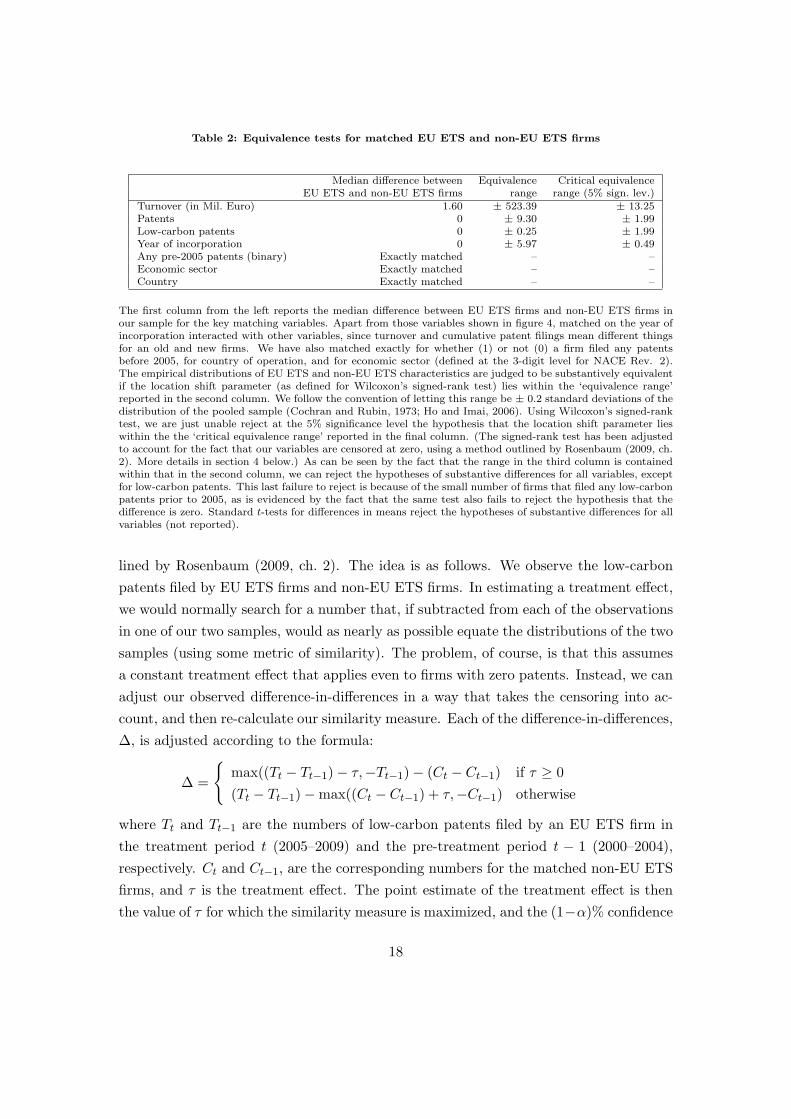
Table 2: Equivalence tests for matched EU ETS and non-EU ETS firms
Median difference between Equivalence Critical equivalenceEU ETS and non-EU ETS firms range range (5% sign. lev.)
Turnover (in Mil. Euro) 1.60 ± 523.39 ± 13.25Patents 0 ± 9.30 ± 1.99Low-carbon patents 0 ± 0.25 ± 1.99Year of incorporation 0 ± 5.97 ± 0.49Any pre-2005 patents (binary) Exactly matched – –Economic sector Exactly matched – –Country Exactly matched – –
The first column from the left reports the median difference between EU ETS firms and non-EU ETS firms inour sample for the key matching variables. Apart from those variables shown in figure 4, matched on the year ofincorporation interacted with other variables, since turnover and cumulative patent filings mean different thingsfor an old and new firms. We have also matched exactly for whether (1) or not (0) a firm filed any patentsbefore 2005, for country of operation, and for economic sector (defined at the 3-digit level for NACE Rev. 2).The empirical distributions of EU ETS and non-EU ETS characteristics are judged to be substantively equivalentif the location shift parameter (as defined for Wilcoxon’s signed-rank test) lies within the ‘equivalence range’reported in the second column. We follow the convention of letting this range be ± 0.2 standard deviations of thedistribution of the pooled sample (Cochran and Rubin, 1973; Ho and Imai, 2006). Using Wilcoxon’s signed-ranktest, we are just unable reject at the 5% significance level the hypothesis that the location shift parameter lieswithin the the ‘critical equivalence range’ reported in the final column. (The signed-rank test has been adjustedto account for the fact that our variables are censored at zero, using a method outlined by Rosenbaum (2009, ch.2). More details in section 4 below.) As can be seen by the fact that the range in the third column is containedwithin that in the second column, we can reject the hypotheses of substantive differences for all variables, exceptfor low-carbon patents. This last failure to reject is because of the small number of firms that filed any low-carbonpatents prior to 2005, as is evidenced by the fact that the same test also fails to reject the hypothesis that thedifference is zero. Standard t-tests for differences in means reject the hypotheses of substantive differences for allvariables (not reported).
lined by Rosenbaum (2009, ch. 2). The idea is as follows. We observe the low-carbonpatents filed by EU ETS firms and non-EU ETS firms. In estimating a treatment effect,we would normally search for a number that, if subtracted from each of the observationsin one of our two samples, would as nearly as possible equate the distributions of the twosamples (using some metric of similarity). The problem, of course, is that this assumesa constant treatment effect that applies even to firms with zero patents. Instead, we canadjust our observed difference-in-differences in a way that takes the censoring into ac-count, and then re-calculate our similarity measure. Each of the difference-in-differences,∆, is adjusted according to the formula:
∆ =
{max((Tt − Tt−1) − τ,−Tt−1) − (Ct − Ct−1) if τ ≥ 0(Tt − Tt−1) − max((Ct − Ct−1) + τ,−Ct−1) otherwise
where Tt and Tt−1 are the numbers of low-carbon patents filed by an EU ETS firm inthe treatment period t (2005–2009) and the pre-treatment period t − 1 (2000–2004),respectively. Ct and Ct−1, are the corresponding numbers for the matched non-EU ETSfirms, and τ is the treatment effect. The point estimate of the treatment effect is thenthe value of τ for which the similarity measure is maximized, and the (1−α)% confidence
18
interval is the set of values of τ for which we cannot reject the alternative of differenceat the α% level of significance. We implement this estimator using as our similaritymeasure the p-value calculated from the Wilcoxon signed-rank test. This provides anon-parametric alternative to the Tobit estimator.
We estimate a treatment effect of τ = 2 additional low-carbon patents for our EUETS firms, with a 95% confidence interval of (1, 5). The matched EU ETS firms fileda total of 316 low-carbon patents in the period 2005-2009. Subtracting 2 low-carbonpatents from each of our matched EU ETS firms (and accounting for censoring at zero)tells us that these firms together would have filed 232 low-carbon patents in the absenceof EU ETS regulations. Our estimated treatment effect therefore implies that EU ETShas prompted 84 (53, 129) additional low-carbon patents amongst our sample of EU ETSfirms, or an increase of 36.2% (20.2%, 69.0%) compared to what we expect would havehappened in the absence of the EU ETS. Because these firms only account for a smallportion of all patents, however, this remarkable impact translates into an increase of low-carbon patenting at the EPO of only 0.38% (0.24%, 0.58%) compared to what we expectit would have been in the absence of the EU ETS. If we think our estimate applies to allof the 5’568 EU ETS firms, we can use their patenting records to calculate that, once weaccount for censoring at zero, the EU ETS is responsible for 188 (114, 319) additionallow-carbon patents. This amounts to a 8.1% (4.7%, 14.5%) increase in their low-carbonpatenting, or a 0.85% (0.51%, 1.45%) increase in the total number of low-carbon patentsfiled at the EPO in 2005–2009 compared to the counterfactual. The first thing to noteabout these numbers is that they are substantially smaller than what was suggested byour naive calculations above (585.2 additional low-carbon patents, or a 2.6% increasein low-carbon patents at the EPO, see table 3). Second, because these numbers are sosmall relative to the totals, it is likely we would not have recognized the impact to beanything different from zero, had we been studying patent counts at a more aggregatedlevel.
To address the issue of the direction of technological change, we must compare thiswith the impact on patenting for other technologies. Environmental regulations like theEU ETS increase the cost of production and can in principle encourage patenting for anytechnology that reduces it, be it a low-carbon technology or not. The induced innovationhypothesis holds that a policy like the EU ETS would have a disproportionate impact onlow-carbon technologies, but this is an essentially empirical matter. There is a relatedconcern, also, that the increase in low-carbon innovation will actually displace, or crowdout, development of other technologies (Popp and Newell, 2012). We can address thesequestions using the same matched sample and estimator described above. We estimate
19
that the EU ETS has added on average 1 other patent (1, 1.99). This translates into305 (305, 512.9) additional patents for other technologies, which represents an increaseof 1.9% (1.9%, 3.2%) in their patent filings for non-low-carbon technologies, or a 0.041%(0.041%, 0.068%) increase in patenting for other technologies at the EPO. Comparingthese numbers with the estimates from the previous paragraph, we see that the EU ETShas had a disproportionate impact on patenting for low-carbon technologies: 36.2% vs.1.9% (difference is significant at 5% level). Put another way, the Scheme has nearlyhad a 20 times greater impact on low-carbon patenting, but it has not crowded outpatenting for other technologies. If we think our estimate applies to all of the 5’568EU ETS firms, the EU ETS would be responsible for 554 (554, 963.86) additional otherpatents, which amounts to a 0.77% (0.77%, 1.34%) increase in their other patenting, ora 0.074% (0.074%, 0.13%) increase in the total number of other patents filed at the EPOin 2005–2009.
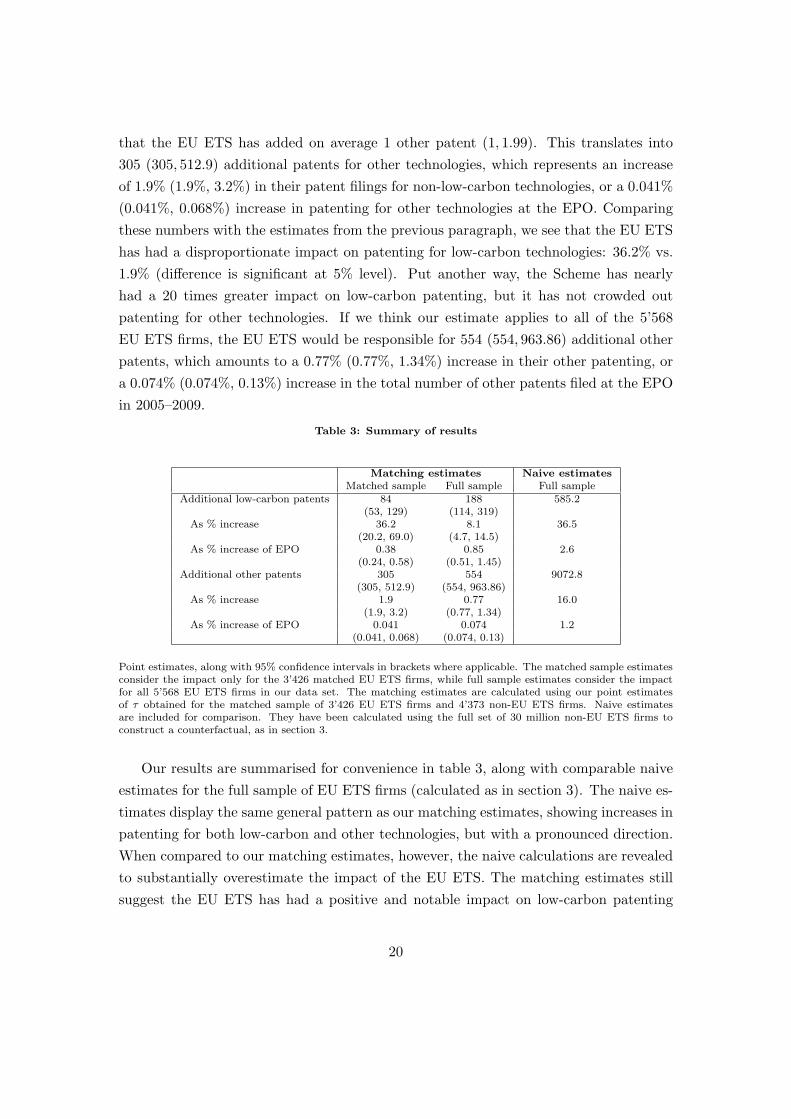
Table 3: Summary of results
Matching estimates Naive estimatesMatched sample Full sample Full sample
Additional low-carbon patents 84 188 585.2(53, 129) (114, 319)
As % increase 36.2 8.1 36.5(20.2, 69.0) (4.7, 14.5)
As % increase of EPO 0.38 0.85 2.6(0.24, 0.58) (0.51, 1.45)
Additional other patents 305 554 9072.8(305, 512.9) (554, 963.86)
As % increase 1.9 0.77 16.0(1.9, 3.2) (0.77, 1.34)
As % increase of EPO 0.041 0.074 1.2(0.041, 0.068) (0.074, 0.13)
Point estimates, along with 95% confidence intervals in brackets where applicable. The matched sample estimatesconsider the impact only for the 3’426 matched EU ETS firms, while full sample estimates consider the impactfor all 5’568 EU ETS firms in our data set. The matching estimates are calculated using our point estimatesof τ obtained for the matched sample of 3’426 EU ETS firms and 4’373 non-EU ETS firms. Naive estimatesare included for comparison. They have been calculated using the full set of 30 million non-EU ETS firms toconstruct a counterfactual, as in section 3.
Our results are summarised for convenience in table 3, along with comparable naiveestimates for the full sample of EU ETS firms (calculated as in section 3). The naive es-timates display the same general pattern as our matching estimates, showing increases inpatenting for both low-carbon and other technologies, but with a pronounced direction.When compared to our matching estimates, however, the naive calculations are revealedto substantially overestimate the impact of the EU ETS. The matching estimates stillsuggest the EU ETS has had a positive and notable impact on low-carbon patenting
20
among EU ETS firms, though relative to the overall pace of low-carbon technologi-cal development, the impact appears to have been much smaller, boosting low-carbonpatenting by only a fraction of a percent. On the one hand, our findings contradictearly prognostications that over-allocation of emissions permits in the EU ETS wouldcompletely undermine the incentives for low-carbon innovation. On the other hand, evena quite remarkable response among EU ETS firms—whether 36.2% among matched EUETS firms or 8.1% among the full sample—translates into rather small impact from aneconomy-wide perspective, less than a 1% increase at the EPO. Putting it another way,of the post-2005 surge in low-carbon patenting seen in figure 1, roughly 2% can be at-tributed to the EU ETS.16 It is worth noting that this apparently small impact relativeto the overall pace of technological change is not simply an arithmetical artifact of thesmall number of EU ETS firms, however, as is demonstrated by the fact that the naiveestimator is more than three times higher.
Before settling on an interpretation of our estimates, however, we must ask whetherthey are really best explained by the EU ETS having had a very small impact? Perhapsthese small numbers should instead caution us that we may have underestimated theimpact? Let us therefore investigate challenges to the internal and external validity ofour results.
4.3 Robustness tests
Is our conclusion driven by an omitted variable? The primary challenge for anymatching study is to justify the assumption that firms that appear similar are similar inunmeasured dimensions as well—often called ‘selection on observables’. In a randomizedexperiment one can rely on the law of large numbers to achieve similarity between atreated and control group on both observed and unobserved characteristics. Matching,on the other hand, achieves an observed similarity by construction, so similarity onmatched characteristics cannot be read to as evidence that the treated and control firmsare also similar on unobserved characteristics.
A simple test of whether matching has achieved balance on unobserved variables isto look at a variable that was not used to construct the matches. We have one suchvariable in our data set: the number of employees. As figure 5 and table 4 show, theempirical distributions of number of employees of the EU ETS and non-EU ETS firms
16The number of low-carbon patents filed at the EPO increased by 9054 from the period 2000-2004to 2005-2009. The 188 additional low-carbon patents we have attributed to the EU ETS correspondto 2% of this increase. Even under the more generous framing that the upward trend from 2000-2004would have continued unabated in 2005-2009, the post-2005 ‘surge’ was only 4725.5 low-carbon patents,of which the 188 additional low-carbon patents would amount to barely 4%.
21
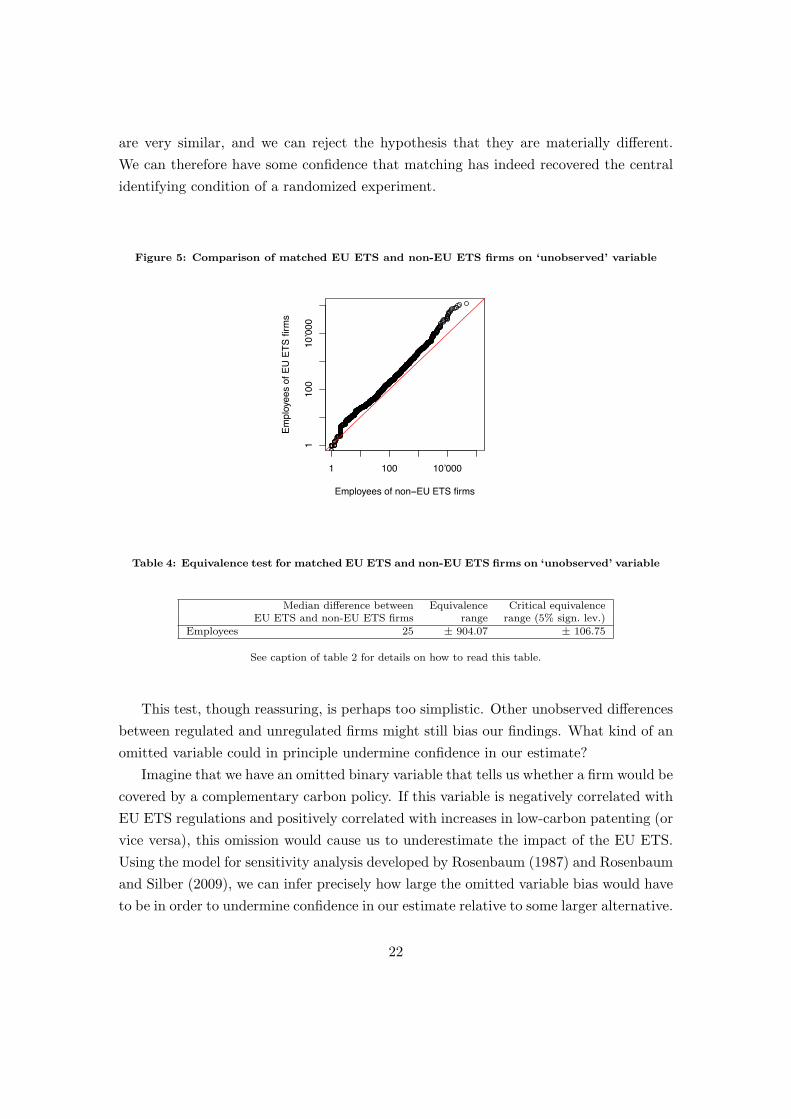
are very similar, and we can reject the hypothesis that they are materially different.We can therefore have some confidence that matching has indeed recovered the centralidentifying condition of a randomized experiment.
Figure 5: Comparison of matched EU ETS and non-EU ETS firms on ‘unobserved’ variable
Employees of non−EU ETS firms
Empl
oyee
s of
EU
ETS
firm
s
1 100 10’000
110
010
’000
Table 4: Equivalence test for matched EU ETS and non-EU ETS firms on ‘unobserved’ variable
Median difference between Equivalence Critical equivalenceEU ETS and non-EU ETS firms range range (5% sign. lev.)
Employees 25 ± 904.07 ± 106.75
See caption of table 2 for details on how to read this table.
This test, though reassuring, is perhaps too simplistic. Other unobserved differencesbetween regulated and unregulated firms might still bias our findings. What kind of anomitted variable could in principle undermine confidence in our estimate?
Imagine that we have an omitted binary variable that tells us whether a firm would becovered by a complementary carbon policy. If this variable is negatively correlated withEU ETS regulations and positively correlated with increases in low-carbon patenting (orvice versa), this omission would cause us to underestimate the impact of the EU ETS.Using the model for sensitivity analysis developed by Rosenbaum (1987) and Rosenbaumand Silber (2009), we can infer precisely how large the omitted variable bias would haveto be in order to undermine confidence in our estimate relative to some larger alternative.
22
In order for our 3’428 matched EU ETS firms to have boosted the number of low-carbon patents filed at the EPO by 5%, say, they would have to have filed 1062 additionallow-carbon patents. Since they did not file this many low-carbon patents in 2005–2009in total, we can comfortably rule out that the EU ETS would have had such a largetreatment effect even if all of the patents were additional. To have boosted low-carbonpatents by just 1%, 223 of their low-carbon patents would have to have been additional.This translates back into a treatment effect of τ = 20.4—more than 10 times higher thanour original estimate. In order to increase our point estimate beyond this level, we wouldhave to postulate an omitted variable that, if observed before 2005, would successfullypredict more than 83 times out of a 100 (a) which firm in our matched pairs escapesEU ETS regulations and (b) which firm in our matched pairs would most increase theirlow-carbon patenting. Even if the omitted variable predicted (a) almost perfectly, itwould still have to predict (b) 73 times out of 100. For the milder threshold of justbeing unable to reject the hypothesis that the the treatment effect is 20.4, we wouldstill have to postulate an omitted variable that makes these prediction successfully morethan 70 times out of 100.17 We have estimated above that our sample of matched EUETS firms account for only a 0.38% increase in low-carbon patenting at the EPO. If onefinds an example of a complementary policy that was implemented in such a systematicfashion across the EU and caused such a predictable boost in the low-carbon patenting,we would have to concede that they may have boosted low-carbon patenting by as muchas 1%. Even then, it is not obvious that this would seriously challenge the conclusionthat the EU ETS has had but a limited direct impact on low-carbon patenting overall.
Another omitted variable candidate—whether a firm had high or low carbon emis-sions prior to 2005—is generally expected to be positively correlated with both a firm’schances of becoming regulated and with their chances of increasing their low-carbonpatenting. The omission of a variable with these properties would imply we have over-estimated the impact of the EU ETS above. To reduce our point estimate to zero, wewould need to postulate an omitted variable that predicts more than 81 times out of 100(a) which firm in our matched pairs became EU ETS regulated and (b) which firm in ourmatched pairs would most increase their low-carbon patenting. It would need to makethese predictions successfully more than 71 times out of 100 to make us just unable toreject at the 5% level the hypothesis that the treatment effect is really zero.18
17In Rosenbaum’s notation, it is just possible that the estimated treatment effect is 20.4 for a sensitivityparameter of Γ = 2.65, and we are just unable to reject this treatment effect at the 5% significance levelfor Γ = 1.4. This can be decomposed into the biases present in treatment assignment and outcomesusing propositions in Rosenbaum and Silber (2009).
18In Rosenbaum’s notation, it is just possible that the estimated treatment effect is 0 for a sensitivity
23
In sum, matching has achieved balance on at least one ‘unobserved’ characteristic,which might suggest it has balanced other unobserved variables as well, like a trulyrandomized experiment would have. Even if this is not the case, though, it appears ourestimate of the low-carbon treatment effect is reasonably robust to both negative andpositive omitted variable biases. If anything, the fact that the estimate is ever-so-slightlymore sensitive to a positive bias would tend to reinforce our earlier conclusion that theEU ETS has had but a small direct impact on low-carbon patenting.
Are the estimates valid beyond our sample? A more serious challenge to ourconclusion, perhaps, is to justify extrapolating from our sample of 3’428 EU ETS firmsto all EU ETS firms. This type of calculation might lead us to underestimate the impactof the EU ETS if the firms omitted from estimation have had a systematically strongerreaction compared to those firms in our sample. This is a question of selection bias.
We can address this concern in three ways: (1) increasing the sample size, (2) cal-culating an upper bound for our estimates, and (3) calculating a lower bound for theout-of-sample response necessary to qualitatively affect our conclusions. Firstly, becauseturnover figures become more widely available in 2005, we are able to increase samplesize if we allow ourselves to use 2005 turnover figures to construct the matches. This isnot generally desirable, because the EU ETS might have affected 2005 turnover, which inturn had some effect on low-carbon patenting. If this is the case, the matching estimateusing 2005 turnover would be biased because it omits this channel. However, becauseusing 2005 turnover gives us access to a greater number of EU ETS and non-EU ETSfirms, it may still provide a reasonable test of whether our findings apply to the EU ETSmore broadly.
Matching using 2005 turnover figures allows us to successfully match an additional427 EU ETS firms, producing 3’855 matched groups in total. The point estimates for thissample are 2.75 (1, 5.99) for low-carbon patents and 1 (1, 1.99) for other patents. Thepoint estimate for the impact on low-carbon patents is slightly larger than before (butnot significantly different), but the same for other patents. These estimates translate into92.25 (49, 133.89) additional low-carbon patents and 318 (318, 530.85) additional otherpatents across our 3’855 EU ETS firms. In percentage terms they imply a somewhatsmaller patenting response than before: increases of 18.9 (9.2, 30.0) and 2.4 (2.4, 4.2)respectively. This amounts to a 0.42% (0.22, 0.60) increase in low-carbon patentingat the EPO and a 0.042 (0.042, 0.071) increase in patent filings for other technologies,
parameter of Γ = 2.34, and we are just unable to reject this treatment effect at the 5% significance levelfor Γ = 1.45.
24
which is virtually identical to our original estimates. The typical matched firm still looksmuch the same, which is what one would expect if we were simply finding more firmsaround the same EU ETS thresholds. The EU ETS firms in our original matched sampletherefore appear to be representative of a larger portion of the EU ETS. On the otherhand, it also means that this re-match does not so much help address concerns thatthe EU ETS is affecting low-carbon patenting among the atypical companies for whichsuitable unregulated matches could not be found the first time around.
It is, nevertheless, possible to bound the effect that these atypical firms can have onthe impact estimates. Suppose we were able to perfectly match every one of the 2’140 EUETS firms we were forced to omit. Suppose further that the hypothetically matched non-EU ETS firms have not filed any patents since 2005, a strict lower bound. Because weobserve the low-carbon patenting of the EU ETS firms, these two assumptions allow us tocalculate the upper bound difference-in-differences for each of these 2’140 EU ETS firms.Pooling them with the 3’428 previously difference-in-differences, we can then estimatethe upper bound of the treatment effect.19 This procedure produces point estimates of 13(4, 43.99) for low-carbon and 6 (4, 10.99) for other patents. These high point estimatesare driven in large part by a small number of prolific patenters that were previouslyomitted, but are now matched to hypothetical non-EU ETS firms with zero patentsafter 2005. Subtracting a large number of patents from each firm and accounting forcensoring at zero, therefore, does not add as many patents as the higher point estimatesperhaps might suggest. The new estimates translate into 524 (275, 952.9) additional low-carbon patents and 2093 (1582, 3176.95) additional other patents, or increases of 26.7%(12.4%, 62.2%) and 3% (2.3%, 4.7%) respectively. While there is still a clear directionto induced technological change, it is less pronounced than for our original estimates. Incomparison with the total numbers of patents that would otherwise have been filed atthe EPO in each category in this period, the additional patents represent a 2.4% (1.2%,4.5%) increase in low-carbon patenting and a 0.28% (0.21%, 0.42%) increase in patentingfor other technologies. In economic terms, the upper bounds are perhaps slightly morenoteworthy than our original estimates, though we are now very aware of the kind ofextremely favourable and unrealistic assumptions needed to generate results that evenbegin to demand attention. And even then, the results are perhaps not so impressive asto seriously challenge the conclusion that the EU ETS has had a limited direct impacton low-carbon patenting.
19This bound is analogous to the sharp bounds derived by Manski (2007, ch. 2) for situations withmissing data. The bound is sharp in the sense that it does not impose any restrictions on the processthat leads to ‘missingness’.
25
Our third strategy to address concerns about external validity is to calculate whatout-of-sample response would be necessary in order to qualitatively affect our conclusion.Our sample covers 9’358 out of the 12’122 installations that fell under EU ETS regulationin 2005 (see table 1). In order for the EU ETS to have boosted low-carbon patentingby 5%, say, EU ETS firms would together have to have filed 1062 additional low-carbonpatents in 2005–2009. Subtracting our best estimate of 188 additional low-carbon patentsfor the 5’568 firms operating 9’358 EU ETS installations, this leaves the operators of theremaining 2’764 installations to have filed 874 additional low-carbon patents. To putit another way, we estimate that the average EU ETS firm in our sample filed roughly0.03 extra low-carbon patents, but even if the remaining 2’764 were operated by as manyfirms (another charitable assumption), the EU ETS firms outside our sample would haveto have filed 0.32 additional low-carbon patents in the same period. The out-of-sampleresponse would have to be 10 times greater than the in-sample response. Even if we usethe upper bound estimate (in-sample firms filed 524 additional low-carbon patents), theout-of-sample firms would have to have filed 538 extra low-carbon patents, or at least0.19 per firm, which is still more than twice the upper bound for our in-sample firms(0.09). These strong responses appear especially unlikely in light of the fact that most ofthe out-of-sample firms operate in countries with lower patenting propensities (Cyprus,Greece, Hungary, Italy, Latvia, and Slovenia).
It seems, therefore, that none of the strategies to address concerns about externalvalidity—increasing sample size, computing upper bounds, and calculating necessaryout-of-sample responses—seriously challenge our earlier conclusion. The EU ETS ap-pears to have had a very limited direct impact on low-carbon technological change.
Other robustness tests. Above we have tried to address the most pertinent chal-lenges to our interpretation of the results, but one can imagine still other explanationsfor why the direct impact of the EU ETS appears to have been so small. We have triedto test several of these:
• Are matched non-EU ETS firms also responding to EU ETS? If so, firms lessexposed to the EU ETS and to direct competition with EU ETS firms wouldperhaps be expected to respond less. We re-match our EU ETS firms to similarfirms in Norway, Switzerland, Bulgaria, and Romania (4 countries that did notlaunch the EU ETS in 2005, and two of which have remained outside). We alsore-matched our EU ETS firms to similar US firms. Neither comparison returnsan estimate of the treatment effect significantly different from that reported above(see appendix D for further details).
26
• Did the main patenting response occur after the Directive was adopted in 2003,but before the EU ETS launched in 2005? Some authors have highlighted thepossibility that firms patent in anticipation of new regulations (Dekker et al.,2012). To address this concern, we re-matched our EU ETS firms using 2003 asthe treatment year instead of 2005. The treatment effect for the period 2003–2004 actually indicates that prospective EU ETS firms would actually have filed1.75 additional low-carbon patents if not for the EU ETS (again, zero adjusted),though the number is not significantly different from zero. In other words, thereis no significant difference in the patenting activities of EU ETS and non-EU ETSfirms in this period.
• Is the result an artifact of how we measure low-carbon patents? To address this,we looked at using an expanded definition of low-carbon patents. This does notmaterially affect our conclusions, however. Moreover, it seems that our resultscannot be accounted for by a failure to adjust for the quality of patents either.The number of citations for patents held by EU ETS firms do not increase morethan for non-EU ETS firms (see appendix D for more details).
• Is there some other hidden bias? Perhaps we are only picking up the low-carbontechnology component of a broader trend toward environmental technologies goingon among our EU ETS firms. We look at the number of patents filed by matchedEU ETS and non-EU ETS firms protecting other ‘pollution control technologies’,as defined by Popp (2006). Since these technologies do not help mitigate emissionscovered under the EU ETS, we would not expect the EU ETS to have had any im-pact. A hidden bias in our study design, perhaps some unknown omitted variable,would manifest itself as finding a treatment effect here that is significantly differentfrom zero. Our estimated treatment effect is τ = 0.75, but it is not significantlydifferent from zero.20
It appears, then, that EU ETS has had a positive and notable impact on low-carbonpatenting among EU ETS firms. It has spurred development of low-carbon technologieswithout crowding out innovation for other technologies. Since EU ETS firms accountfor only a small proportion of low-carbon patents, however, the impact on EU ETSregulated firms is negligible on a European scale. None of the above challenges seems to
20Roughly 20% of EPO patents classified as one of Popp’s pollution control technologies also fall intothe low-carbon category. Excluding these, however, does not substantively affect the outcome.
27
offer a compelling alternative explanation to this interpretation of the results.21
If we accept, then, that the impact of the EU ETS on regulated firms does notaccount for the post-2005 surge in low-carbon patenting seen in figure 1, might the EUETS still be indirectly responsible? Has it encouraged third parties to develop low-carbon technologies in the hope of selling or licensing them to newly regulated EU ETSfirms? We investigate this question next.
5 The indirect impact of the EU ETS
The preceding analysis strongly suggests that the direct impact of the EU ETS has notbeen sufficient to account for the apparent surge in low-carbon patenting since 2005.Could the impact of the EU ETS instead have been largely indirect, spurring thirdparties to develop new low-carbon technologies?
There are three major reasons why we would expect the indirect impact to be com-paratively small. Firstly, economic theory predicts that environmental regulations wouldproduce greater incentives to develop new technologies for directly regulated firm thanfor third parties (Milliman and Prince, 1989; Fischer et al., 2003). The asymmetry arisesbecause the latter group is not discharging costly emissions themselves and receive noadditional benefit reducing its own emissions. To the extent that the EU ETS is encour-aging low-carbon technological change, therefore, economic theory predicts this responseto be strongest among EU ETS firms.
Secondly, EU ETS firms have filed over 120’000 patents with the EPO since 2000,circa 2.5% of which protect low-carbon technologies. These are clearly firms with aboveaverage innovation capabilities. To argue that the bulk of the response to the EU ETScomes from third-party technology providers amounts to saying that these EU ETSfirms with well-developed low-carbon innovation capabilities are responding mostly bypurchasing technologies from others, rather than developing the technologies in-house tosuit their own specific needs.
Thirdly, the EU ETS firms in our sample are very likely technology providers them-selves. As highlighted in the previous paragraph, EU ETS firms do develop new tech-nologies themselves, including low-carbon technologies. While some firms may innovate
21One must be careful also because some of the tests we have used to investigate these alternativeexplanations, though addressing one potential source of bias, may introduce new biases of their own(e.g. using 2005 turnover figures). The point here, however, is that to replicate our results each time,the new bias would have to be of the same sign and magnitude as the hypothesized bias in the originalmatch. This explanation becomes increasingly unlikely with each new test, and the explanation that ourestimate is unbiased appears more likely by comparison.
28
in the hope of meeting new demand from EU ETS firms, others might expect greateropportunities to purchase the technologies developed by EU ETS firms. The indirectimpact of the EU ETS is the net of these two responses.
These three reasons suggest that the indirect impact of the EU ETS would be com-paratively small, but all claims about the indirect effect need to be met with the samelevel of skepticism as any other empirical hypothesis. It is a very difficult task to cleanlyestimate the indirect impact of the EU ETS, not least because of the difficulty involvedin identifying firms more likely to either provide new technologies to EU ETS firms or towhich EU ETS firms are more likely to provide new technologies. We can, nevertheless,make a start.
Consider the set of firms that had filed at least one patent jointly with an EU ETSfirm prior to 2005. A joint patent filing records a technological partnership with anEU ETS firm. One might then expect these firms to be more likely than an averagenon-EU ETS to either provide technologies to EU ETS firms once the regulations cameinto force, or to demand new technologies from EU ETS firms. They are likely to begood candidates for studying the indirect impact of the EU ETS. By comparing thisset of firms with other non-EU ETS firms, therefore, we might hope to gain at leastsome partial insight as to the net indirect impact of the EU ETS. It is worth noting,though, that while technology provision is an asymmetric relationship, co-patenting isof course symmetric. Hence, we cannot separate co-patenters into technology providersand demanders even if each co-patenter could in principle be classified as one or theother. Nevertheless, we can provide an indicative estimate of the net indirect impact ofthe EU ETS.
From patent records we can identify 11’603 non-EU ETS firms that each filed atleast one patent jointly with an EU ETS firm in 1978–2004. Many of these firms are nolonger active or operate in countries not in our data set, which prevents us from matchingthem. Additionally, as before there are many firms for which historical data are missing,and a few for which we simply cannot find suitable comparators. Our matched sampletherefore contains 2’784 co-patenters and 19’361 similar firms that had not filed a jointpatent with an EU ETS firm prior to 2005.22 Figure 6 and table 5 show the propertiesof our matched sample.23
22Compared to when EU ETS firms were matched earlier, finding a single good comparator here was agood indicator that there were many good comparators available. We have kept all of these comparatorsin our matched sample to reduce the variance of our estimates.
23On average, co-patenters have historically filed more patents than EU ETS firms. It is no mysterywhy—to be a co-patenters a firm must have filed at least one patent prior to 2005, while EU ETS firmshad no such requirement to meet.
29
Figure 6: Comparison of matched co-patenters and non-co-patenting firms
(a)
Turnover of non−EU ETS firms (Mil. Euro)
Turn
over
of E
U E
TS fi
rms
(Mil.
Eur
o)
0 0.1 10 1’000
00.
110
1’00
010
0’00
0
(b)
Patents by non−EU ETS firms
Pate
nts
by E
U E
TS fi
rms
0 10 100 1’000
010
100
1’00
0
(c)
Low−carbon patents by non−EU ETS firms
Low−c
arbo
n pa
tent
s by
EU
ETS
firm
s
0 10 100
010
100
Table 5: Equivalence tests for matched co-patenters and non-co-patenting firms
Median difference between Equivalence Critical equivalenceEU ETS and non-EU ETS firms range range (5% sign. lev.)
Turnover (in th. Euro) 14.90 ± 304’382.80 ± 1’421.00Patents 0 ± 7.07 ± < 0.01Low-carbon patents 0 ± 0.17 ± 0.99Year of incorporation 0 ± 5.48 ± 0.50Any pre-2005 patents (binary) Exactly matched – –Economic sector Exactly matched – –Country Exactly matched – –Employees 1.66 ± 1’613.82 ± 20.66
See caption of table 2 for details on how to read this table. Again, the failure to reject the hypothesis of differencefor low-carbon patents is a consequence of the small number of firms that filed any low-carbon patents prior to2005. The same test also fails to reject the hypothesis that the difference is zero. Standard t-tests for differencesin means reject the hypotheses of substantive differences for all variables (not reported). For completeness, theresults from the robustness test of checking balance on employees is also included at the bottom of this table.
We estimate a treatment effect of τ = 0.99 additional low-carbon patents amongour co-patenters, with a 95% confidence interval of (−0.99, 1.99). We cannot say withconfidence, therefore, that the EU ETS has had any net impact on the low-carbonpatenting of co-patenters. Even taking the point estimate at face value, it translatesinto a mere 47.52 additional low-carbon patents. Although it would represent a quitedramatic response, on the order of a 32.4% increase compared to what it would havebeen without the EU ETS, it would still translate into a negligible increase relative tothe number of low-carbon patents filed at the EPO (0.2%). Extrapolating the numberto all 11’603 co-patenters would naturally make it look as if the EU ETS has had a
30
more impressive indirect impact, but since the estimate does not even stand up to aconventional significance test, such an exercise is not likely to be informative.
The picture is not much more encouraging for other technologies either. We estimatethat the EU ETS has on average subtracted 0.745 other patents (−0.99,−0.01) for co-patenters. We are just barely able to reject the hypothesis that the effect is actuallyzero, but this rejection does not withstand even the slightest challenge to robustness.Moreover, even if the point estimate were true, it would suggest that the EU ETS hascrowded out patenting for non-low-carbon technologies among co-patenters.
These numbers offer no compelling evidence that the EU ETS has had an indirectimpact on patenting. A patent filed jointly with an EU ETS firm is a record of atechnological partnership, be it the case that the co-patenter has provided technologiesto EU ETS firms or vice versa. In either case, one would expect that co-patenters aremore likely than an average non-EU ETS firm to supply new technologies to EU ETSfirms once the EU ETS launched, or to demand new technologies from EU ETS firms.Yet, taken together, co-patenters appear to behave no different to other non-EU ETSfirms. It is of course incredibly difficult to identify potential technology providers anddemanders for the purposes of estimation, so our results should not be over-interpreted.Nevertheless, our findings can perhaps be read as a reasonable indication that the EUETS has had no net indirect impact on directed technological change. At the very least,it poses an empirical challenge for those wishing to argue otherwise.
6 Discussion
The EU ETS launched in 2005, amid both promises and pessimism. It has aimed toencourage the development of low-carbon technologies by putting a price on carbonemissions. In this paper we have investigated the Scheme’s success in this regard duringthe 5 years subsequent to its launch.
A casual look at aggregate patenting suggests there has been an increase in low-carbon patenting since 2005, but there are several obstacles to isolating the impact ofthe EU ETS. Comparing patenting behaviour prior to and after 2005 risks conflatingthe impact of the EU ETS with other changes, like rapidly rising oil prices. Yet, lookingonly at the period after 2005 and comparing EU ETS regulated firms with those thatescaped regulation risks conflating the impact of the EU ETS with other systematicdifferences in firm characteristics that might also drive patenting. Employing a matcheddifference-in-differences study design has permitted us to account for firm-level time-invariant heterogeneity, and to isolate that part of the change that does not depend on
31
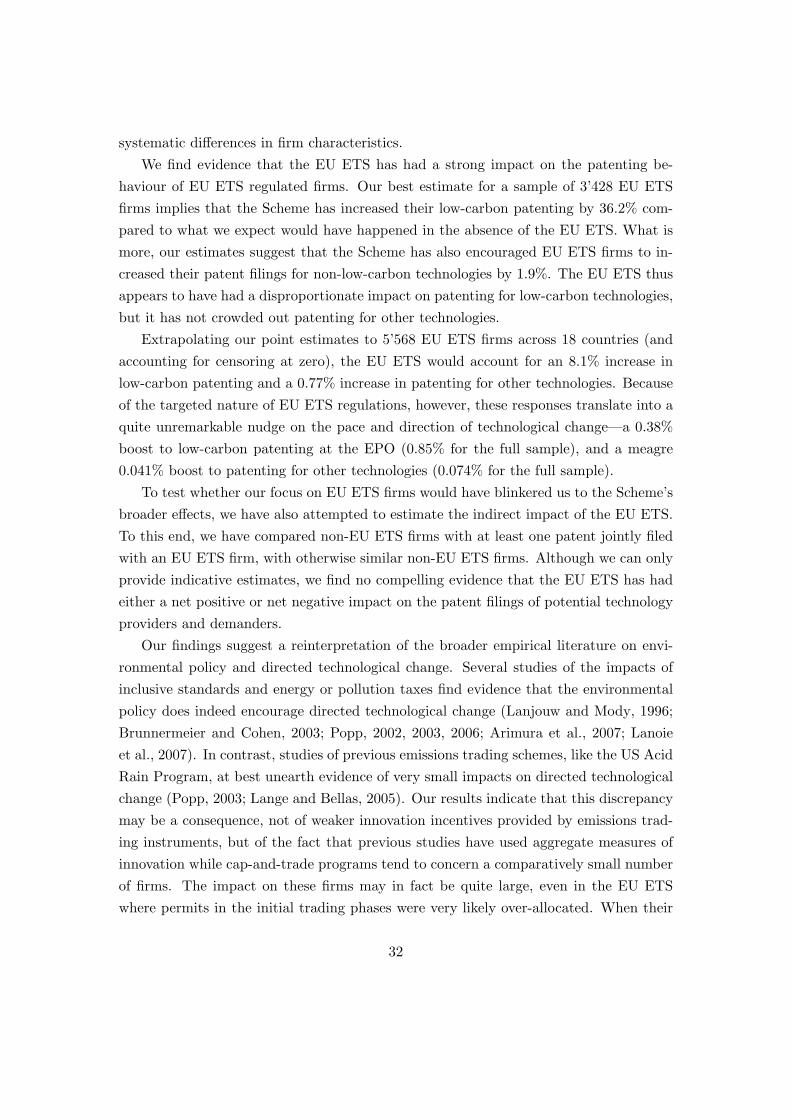
systematic differences in firm characteristics.We find evidence that the EU ETS has had a strong impact on the patenting be-
haviour of EU ETS regulated firms. Our best estimate for a sample of 3’428 EU ETSfirms implies that the Scheme has increased their low-carbon patenting by 36.2% com-pared to what we expect would have happened in the absence of the EU ETS. What ismore, our estimates suggest that the Scheme has also encouraged EU ETS firms to in-creased their patent filings for non-low-carbon technologies by 1.9%. The EU ETS thusappears to have had a disproportionate impact on patenting for low-carbon technologies,but it has not crowded out patenting for other technologies.
Extrapolating our point estimates to 5’568 EU ETS firms across 18 countries (andaccounting for censoring at zero), the EU ETS would account for an 8.1% increase inlow-carbon patenting and a 0.77% increase in patenting for other technologies. Becauseof the targeted nature of EU ETS regulations, however, these responses translate into aquite unremarkable nudge on the pace and direction of technological change—a 0.38%boost to low-carbon patenting at the EPO (0.85% for the full sample), and a meagre0.041% boost to patenting for other technologies (0.074% for the full sample).
To test whether our focus on EU ETS firms would have blinkered us to the Scheme’sbroader effects, we have also attempted to estimate the indirect impact of the EU ETS.To this end, we have compared non-EU ETS firms with at least one patent jointly filedwith an EU ETS firm, with otherwise similar non-EU ETS firms. Although we can onlyprovide indicative estimates, we find no compelling evidence that the EU ETS has hadeither a net positive or net negative impact on the patent filings of potential technologyproviders and demanders.
Our findings suggest a reinterpretation of the broader empirical literature on envi-ronmental policy and directed technological change. Several studies of the impacts ofinclusive standards and energy or pollution taxes find evidence that the environmentalpolicy does indeed encourage directed technological change (Lanjouw and Mody, 1996;Brunnermeier and Cohen, 2003; Popp, 2002, 2003, 2006; Arimura et al., 2007; Lanoieet al., 2007). In contrast, studies of previous emissions trading schemes, like the US AcidRain Program, at best unearth evidence of very small impacts on directed technologicalchange (Popp, 2003; Lange and Bellas, 2005). Our results indicate that this discrepancymay be a consequence, not of weaker innovation incentives provided by emissions trad-ing instruments, but of the fact that previous studies have used aggregate measures ofinnovation while cap-and-trade programs tend to concern a comparatively small numberof firms. The impact on these firms may in fact be quite large, even in the EU ETSwhere permits in the initial trading phases were very likely over-allocated. When their
32
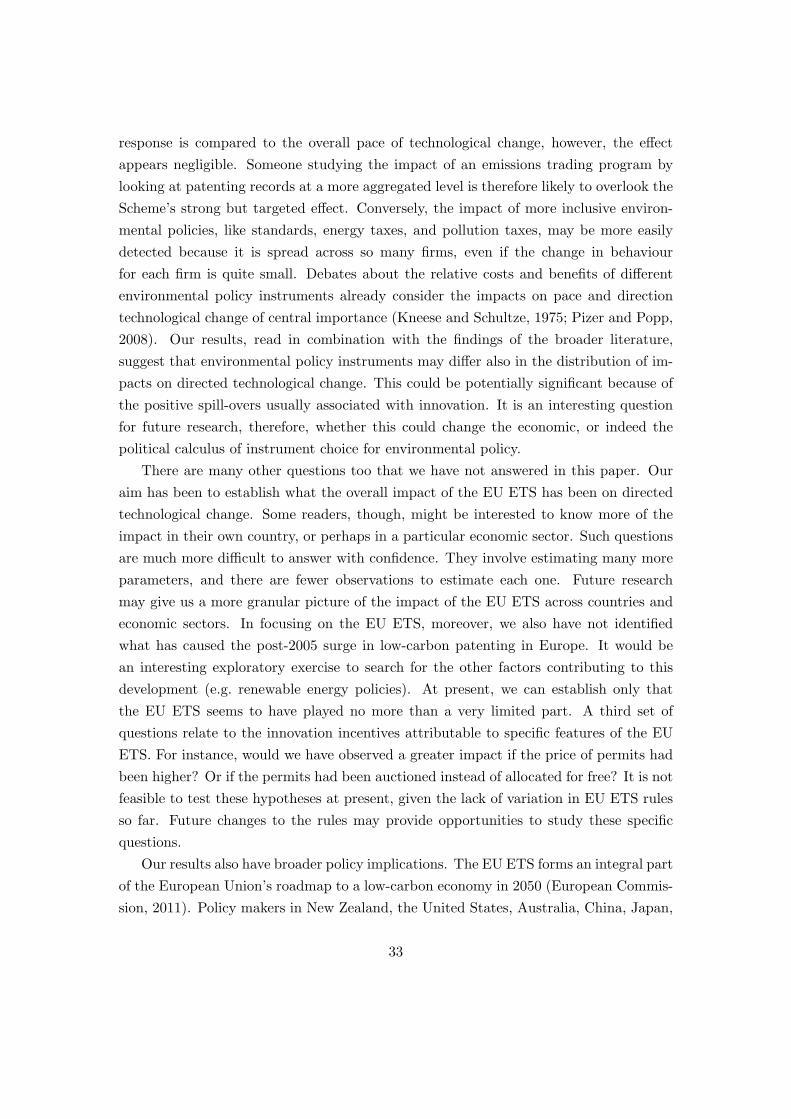
response is compared to the overall pace of technological change, however, the effectappears negligible. Someone studying the impact of an emissions trading program bylooking at patenting records at a more aggregated level is therefore likely to overlook theScheme’s strong but targeted effect. Conversely, the impact of more inclusive environ-mental policies, like standards, energy taxes, and pollution taxes, may be more easilydetected because it is spread across so many firms, even if the change in behaviourfor each firm is quite small. Debates about the relative costs and benefits of differentenvironmental policy instruments already consider the impacts on pace and directiontechnological change of central importance (Kneese and Schultze, 1975; Pizer and Popp,2008). Our results, read in combination with the findings of the broader literature,suggest that environmental policy instruments may differ also in the distribution of im-pacts on directed technological change. This could be potentially significant because ofthe positive spill-overs usually associated with innovation. It is an interesting questionfor future research, therefore, whether this could change the economic, or indeed thepolitical calculus of instrument choice for environmental policy.
There are many other questions too that we have not answered in this paper. Ouraim has been to establish what the overall impact of the EU ETS has been on directedtechnological change. Some readers, though, might be interested to know more of theimpact in their own country, or perhaps in a particular economic sector. Such questionsare much more difficult to answer with confidence. They involve estimating many moreparameters, and there are fewer observations to estimate each one. Future researchmay give us a more granular picture of the impact of the EU ETS across countries andeconomic sectors. In focusing on the EU ETS, moreover, we also have not identifiedwhat has caused the post-2005 surge in low-carbon patenting in Europe. It would bean interesting exploratory exercise to search for the other factors contributing to thisdevelopment (e.g. renewable energy policies). At present, we can establish only thatthe EU ETS seems to have played no more than a very limited part. A third set ofquestions relate to the innovation incentives attributable to specific features of the EUETS. For instance, would we have observed a greater impact if the price of permits hadbeen higher? Or if the permits had been auctioned instead of allocated for free? It is notfeasible to test these hypotheses at present, given the lack of variation in EU ETS rulesso far. Future changes to the rules may provide opportunities to study these specificquestions.
Our results also have broader policy implications. The EU ETS forms an integral partof the European Union’s roadmap to a low-carbon economy in 2050 (European Commis-sion, 2011). Policy makers in New Zealand, the United States, Australia, China, Japan,
33
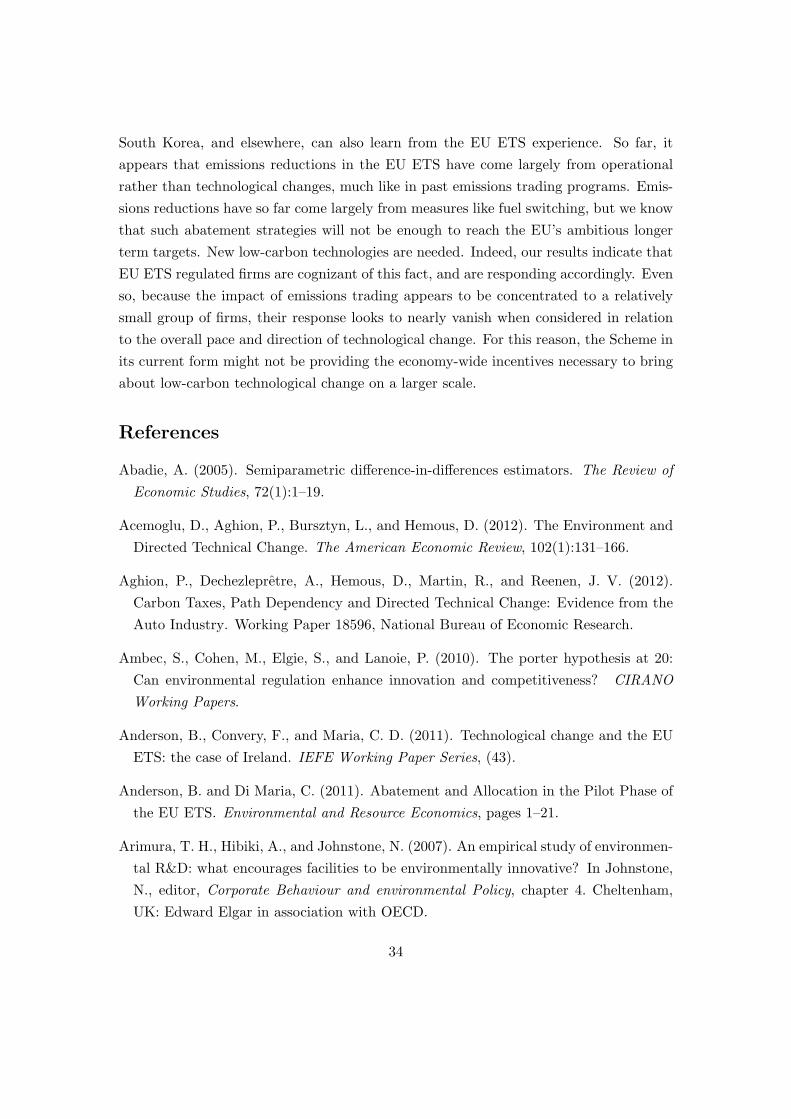
South Korea, and elsewhere, can also learn from the EU ETS experience. So far, itappears that emissions reductions in the EU ETS have come largely from operationalrather than technological changes, much like in past emissions trading programs. Emis-sions reductions have so far come largely from measures like fuel switching, but we knowthat such abatement strategies will not be enough to reach the EU’s ambitious longerterm targets. New low-carbon technologies are needed. Indeed, our results indicate thatEU ETS regulated firms are cognizant of this fact, and are responding accordingly. Evenso, because the impact of emissions trading appears to be concentrated to a relativelysmall group of firms, their response looks to nearly vanish when considered in relationto the overall pace and direction of technological change. For this reason, the Scheme inits current form might not be providing the economy-wide incentives necessary to bringabout low-carbon technological change on a larger scale.
References
Abadie, A. (2005). Semiparametric difference-in-differences estimators. The Review ofEconomic Studies, 72(1):1–19.
Acemoglu, D., Aghion, P., Bursztyn, L., and Hemous, D. (2012). The Environment andDirected Technical Change. The American Economic Review, 102(1):131–166.
Aghion, P., Dechezlepretre, A., Hemous, D., Martin, R., and Reenen, J. V. (2012).Carbon Taxes, Path Dependency and Directed Technical Change: Evidence from theAuto Industry. Working Paper 18596, National Bureau of Economic Research.
Ambec, S., Cohen, M., Elgie, S., and Lanoie, P. (2010). The porter hypothesis at 20:Can environmental regulation enhance innovation and competitiveness? CIRANOWorking Papers.
Anderson, B., Convery, F., and Maria, C. D. (2011). Technological change and the EUETS: the case of Ireland. IEFE Working Paper Series, (43).
Anderson, B. and Di Maria, C. (2011). Abatement and Allocation in the Pilot Phase ofthe EU ETS. Environmental and Resource Economics, pages 1–21.
Arimura, T. H., Hibiki, A., and Johnstone, N. (2007). An empirical study of environmen-tal R&D: what encourages facilities to be environmentally innovative? In Johnstone,N., editor, Corporate Behaviour and environmental Policy, chapter 4. Cheltenham,UK: Edward Elgar in association with OECD.
34
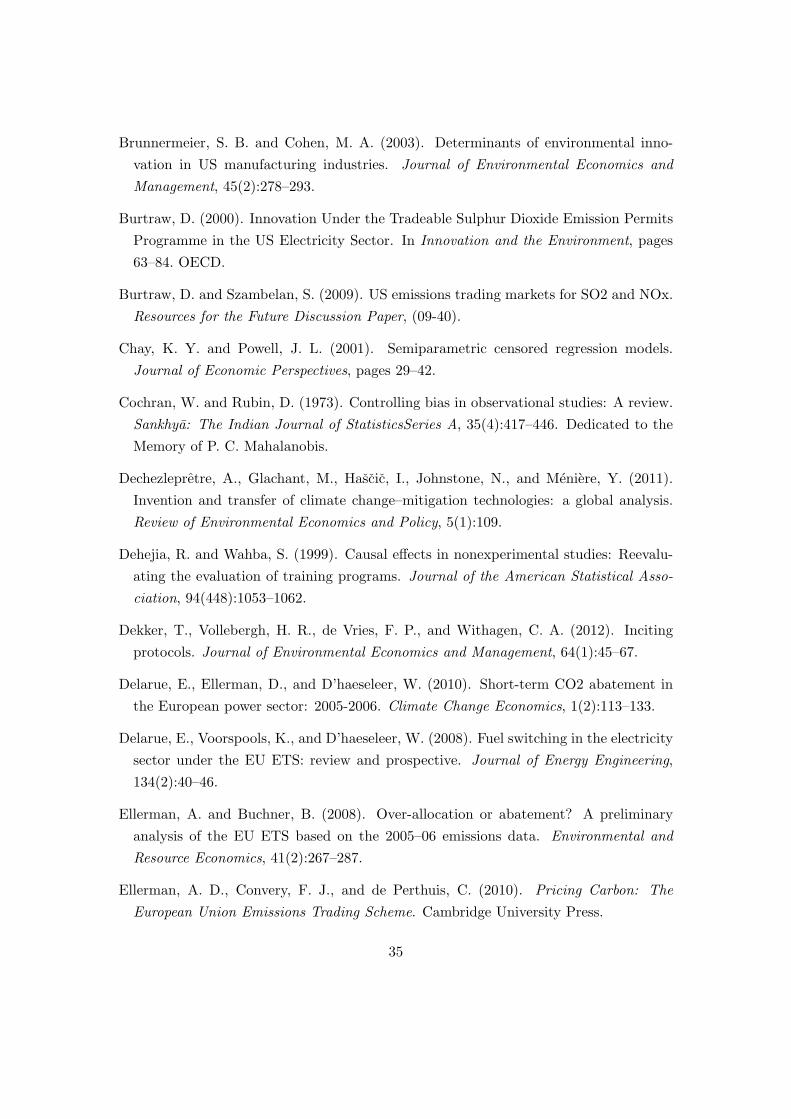
Brunnermeier, S. B. and Cohen, M. A. (2003). Determinants of environmental inno-vation in US manufacturing industries. Journal of Environmental Economics andManagement, 45(2):278–293.
Burtraw, D. (2000). Innovation Under the Tradeable Sulphur Dioxide Emission PermitsProgramme in the US Electricity Sector. In Innovation and the Environment, pages63–84. OECD.
Burtraw, D. and Szambelan, S. (2009). US emissions trading markets for SO2 and NOx.Resources for the Future Discussion Paper, (09-40).
Chay, K. Y. and Powell, J. L. (2001). Semiparametric censored regression models.Journal of Economic Perspectives, pages 29–42.
Cochran, W. and Rubin, D. (1973). Controlling bias in observational studies: A review.Sankhya: The Indian Journal of StatisticsSeries A, 35(4):417–446. Dedicated to theMemory of P. C. Mahalanobis.
Dechezlepretre, A., Glachant, M., Hascic, I., Johnstone, N., and Meniere, Y. (2011).Invention and transfer of climate change–mitigation technologies: a global analysis.Review of Environmental Economics and Policy, 5(1):109.
Dehejia, R. and Wahba, S. (1999). Causal effects in nonexperimental studies: Reevalu-ating the evaluation of training programs. Journal of the American Statistical Asso-ciation, 94(448):1053–1062.
Dekker, T., Vollebergh, H. R., de Vries, F. P., and Withagen, C. A. (2012). Incitingprotocols. Journal of Environmental Economics and Management, 64(1):45–67.
Delarue, E., Ellerman, D., and D’haeseleer, W. (2010). Short-term CO2 abatement inthe European power sector: 2005-2006. Climate Change Economics, 1(2):113–133.
Delarue, E., Voorspools, K., and D’haeseleer, W. (2008). Fuel switching in the electricitysector under the EU ETS: review and prospective. Journal of Energy Engineering,134(2):40–46.
Ellerman, A. and Buchner, B. (2008). Over-allocation or abatement? A preliminaryanalysis of the EU ETS based on the 2005–06 emissions data. Environmental andResource Economics, 41(2):267–287.
Ellerman, A. D., Convery, F. J., and de Perthuis, C. (2010). Pricing Carbon: TheEuropean Union Emissions Trading Scheme. Cambridge University Press.
35
European Commission (2011). A Roadmap for moving to a competitive low carboneconomy in 2050. Technical Report COM(2011) 112, European Union.
Fischer, C., Parry, I., and Pizer, W. (2003). Instrument choice for environmental pro-tection when technological innovation is endogenous. Journal of Environmental Eco-nomics and Management, 45(3):523–545.
Fowlie, M. (2010). Emissions Trading, Electricity Restructuring, and Investment inPollution Abatement. American Economic Review, 100(3):837–869.
Gagelmann, F. and Frondel, M. (2005). The impact of emission trading on innovation-science fiction or reality? European Environment, 15(4):203–211.
Greenstone, M. and Gayer, T. (2009). Quasi-experimental and experimental approachesto environmental economics. Journal of Environmental Economics and Management,57(1):21–44.
Griliches, Z. (1984). R & D, patents, and productivity. University Of Chicago Press.
Grubb, M., Azar, C., and Persson, U. (2005). Allowance allocation in the Europeanemissions trading system: a commentary. Climate Policy, 5(1):127–136.
Hall, B., Jaffe, A., and Trajtenberg, M. (2005). Market value and patent citations. TheRAND Journal of Economics, 36(1):16–38.
Harhoff, D., Narin, F., Scherer, F., and Vopel, K. (1999). Citation frequency and thevalue of patented inventions. Review of Economics and statistics, 81(3):511–515.
Harhoff, D., Scherer, F., and Vopel, K. (2003). Citations, family size, opposition andthe value of patent rights. Research Policy, 32(8):1343–1363.
Heckman, J., Ichimura, H., Smith, J., and Todd, P. (1998a). Characterizing Selec-tion Bias Using Experimental Data. Econometrica, 66(5):1017–1098. ArticleType:research-article / Full publication date: Sep., 1998 / Copyright c© 1998 The Econo-metric Society.
Heckman, J. J., Ichimura, H., and Todd, P. (1998b). Matching as an econometricevaluation estimator. The Review of Economic Studies, 65(2):261–294.
Hicks, J. R. (1932). The Theory of Wages. MacMillan.
Ho, D. E. and Imai, K. (2006). Randomization Inference With Natural Experiments.Journal of the American Statistical Association, 101:888–900.
36
Hoffmann, V. H. (2007). EU ETS and Investment Decisions: The Case of the GermanElectricity Industry. European Management Journal, 25(6):464–474.
Johnstone, N., Hascic, I., and Popp, D. (2010). Renewable energy policies and tech-nological innovation: Evidence based on patent counts. Environmental and ResourceEconomics, 45(1):133–155.
Kaufer, E. (1989). The economics of the patent system. Routledge.
Kneese, A. V. and Schultze, C. (1975). Pollution, Prices, and Public Policy. (BrookingsInstitution, Washington, DC).
Kossoy, A. and Guigon, P. (2012). State and trends of the carbon market 2012. Annualreport, World Bank.
Lange, I. and Bellas, A. (2005). Technological change for sulfur dioxide scrubbers undermarket-based regulation. Land Economics, 81(4):546–556.
Lanjouw, J. and Mody, A. (1996). Innovation and the international diffusion of environ-mentally responsive technology. Research Policy, 25(4):549–571.
Lanoie, P., Laurent-Lucchetti, J., Johnstone, N., and Ambec, S. (2007). Environmentalpolicy, innovation and performance: new insights on the Porter hypothesis. CIRANOWorking Papers.
List, J. A., Millimet, D. L., Fredriksson, P. G., and McHone, W. W. (2003). Effects ofEnvironmental Regulations on Manufacturing Plant Births: Evidence from a Propen-sity Score Matching Estimator. Review of Economics and Statistics, 85(4):944–952.
Manski, C. F. (2007). Identification for Prediction and Decision. Harvard UniversityPress.
Martin, R., Muuls, M., and Wagner, U. (2011). Climate change, investment and carbonmarkets and prices – evidence from manager interviews. Climate Strategies, CarbonPricing for Low-Carbon Investment Project.
Milliman, S. and Prince, R. (1989). Firm incentives to promote technological change inpollution control. Journal of Environmental Economics and Management, 17(3):247–265.
Newell, R., Jaffe, A., and Stavins, R. (1999). The induced innovation hypothesis andenergy-saving technological change*. Quarterly Journal of Economics, 114(3):941–975.
37
OECD (2009). OECD Patent Statistics Manual. Technical report, OECD.
Petsonk, A. and Cozijnsen, J. (2007). Harvesting the Low-Carbon Cornucopia: Howthe European Union Emissions Trading System (EU-ETS) is spurring innovation andscoring results. Environmental Defense, pages 1–23.
Pizer, W. A. and Popp, D. (2008). Endogenizing technological change: Matching em-pirical evidence to modeling needs. Energy Economics, 30(6):2754–2770.
Popp, D. (2002). Induced innovation and energy prices. The American Economic Review,92(1):160–180.
Popp, D. (2003). Pollution control innovations and the Clean Air Act of 1990. Journalof Policy Analysis and Management, 22(4):641–660.
Popp, D. (2004). ENTICE: Endogenouse Technological Change in the DICE Model ofGlobal Warming. Journal of Environmental Economics and Management, 24(1):742–768.
Popp, D. (2006). International innovation and diffusion of air pollution control technolo-gies: the effects of NOX and SO2 regulation in the US, Japan, and Germany. Journalof Environmental Economics and Management, 51(1):46–71.
Popp, D. (2010). Innovation and climate policy. NBER Working Paper.
Popp, D. and Newell, R. (2012). Where does energy R&D come from? Examiningcrowding out from energy R&D. Energy Economics, 34(4):980–991.
Popp, D., Newell, R., and Jaffe, A. (2009). Energy, the environment, and technologicalchange. NBER Working Paper.
Porter, M. E. (1991). Essay: America’s green strategy. Scientific American, 264(3).
Rosenbaum, P. (1987). Sensitivity analysis for certain permutation inferences in matchedobservational studies. Biometrika, 74(1):13–26.
Rosenbaum, P. and Silber, J. (2009). Amplification of sensitivity analysis in matchedobservational studies. Journal of the American Statistical Association, 104(488):1398–1405.
Rosenbaum, P. R. (2009). Design of observational studies. page 384.
38
Schleich, J. and Betz, R. (2005). Incentives for energy efficiency and innovation in theEuropean Emission Trading System. In Proceedings of the 2005 ECEEE SummerStudy—What Works and Who Delivers? Mandelie, pages 1495–1506.
Schmalensee, R., Joskow, P., Ellerman, A., Montero, J., and Bailey, E. (1998). Aninterim evaluation of sulfur dioxide emissions trading. The Journal of Economic Per-spectives, 12(3):53–68.
Sekhon, J. (2007). Multivariate and propensity score matching software with automatedbalance optimization: The matching package for r. Journal of Statistical Software,10(2):1–51.
Smith, J. and Todd, P. (2005). Does matching overcome LaLonde’s critique of nonex-perimental estimators? Journal of econometrics, 125(1):305–353.
Tomas, R., Ribeiro, F. R., Santos, V., Gomes, J., and Bordado, J. (2010). Assessment ofthe impact of the European CO2 emissions trading scheme on the Portuguese chemicalindustry. Energy Policy, 38(1):626–632.
Trajtenberg, M. (1990). A penny for your quotes: patent citations and the value ofinnovations. The Rand Journal of Economics, pages 172–187.
van Zeebroeck, N. (2011). The puzzle of patent value indicators. Economics of Innovationand New Technology, 20(1):33–62.
Veefkind, V., Hurtado-Albir, J., Angelucci, S., Karachalios, K., and Thumm, N. (2012).A new EPO classification scheme for climate change mitigation technologies. WorldPatent Information, 34(2):106–111.
39
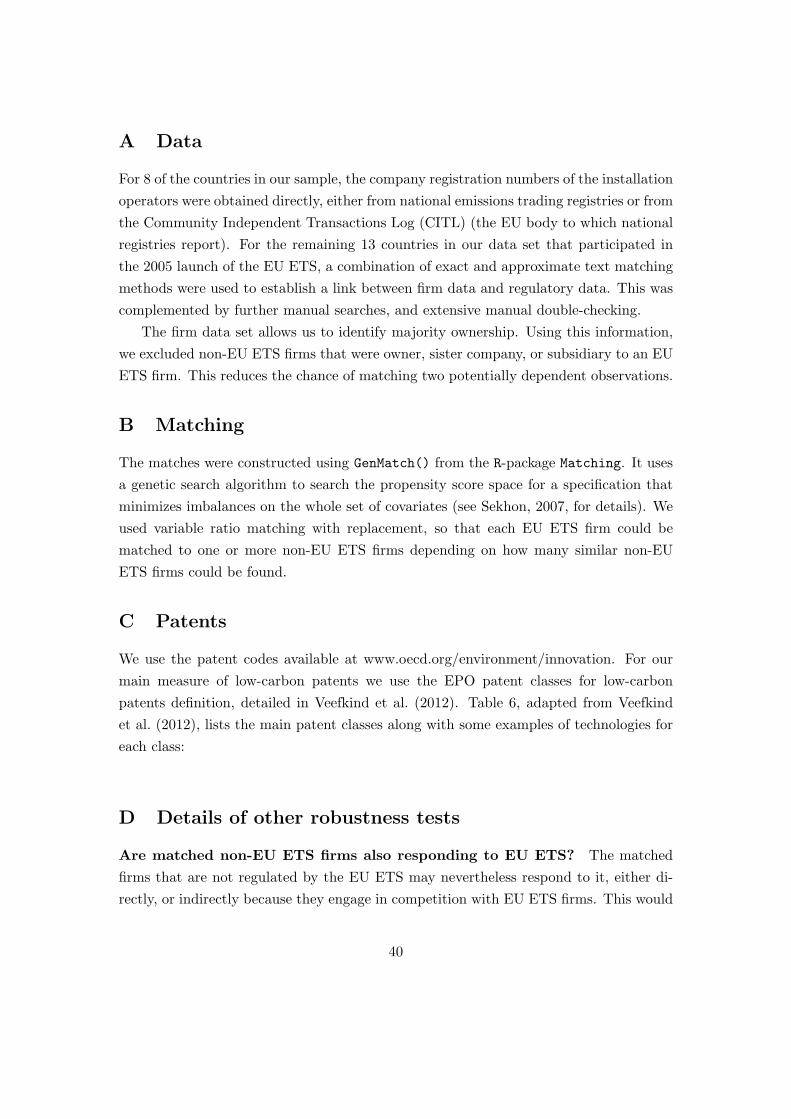
A Data
For 8 of the countries in our sample, the company registration numbers of the installationoperators were obtained directly, either from national emissions trading registries or fromthe Community Independent Transactions Log (CITL) (the EU body to which nationalregistries report). For the remaining 13 countries in our data set that participated inthe 2005 launch of the EU ETS, a combination of exact and approximate text matchingmethods were used to establish a link between firm data and regulatory data. This wascomplemented by further manual searches, and extensive manual double-checking.
The firm data set allows us to identify majority ownership. Using this information,we excluded non-EU ETS firms that were owner, sister company, or subsidiary to an EUETS firm. This reduces the chance of matching two potentially dependent observations.
B Matching
The matches were constructed using GenMatch() from the R-package Matching. It usesa genetic search algorithm to search the propensity score space for a specification thatminimizes imbalances on the whole set of covariates (see Sekhon, 2007, for details). Weused variable ratio matching with replacement, so that each EU ETS firm could bematched to one or more non-EU ETS firms depending on how many similar non-EUETS firms could be found.
C Patents
We use the patent codes available at www.oecd.org/environment/innovation. For ourmain measure of low-carbon patents we use the EPO patent classes for low-carbonpatents definition, detailed in Veefkind et al. (2012). Table 6, adapted from Veefkindet al. (2012), lists the main patent classes along with some examples of technologies foreach class:
D Details of other robustness tests
Are matched non-EU ETS firms also responding to EU ETS? The matchedfirms that are not regulated by the EU ETS may nevertheless respond to it, either di-rectly, or indirectly because they engage in competition with EU ETS firms. This would
40
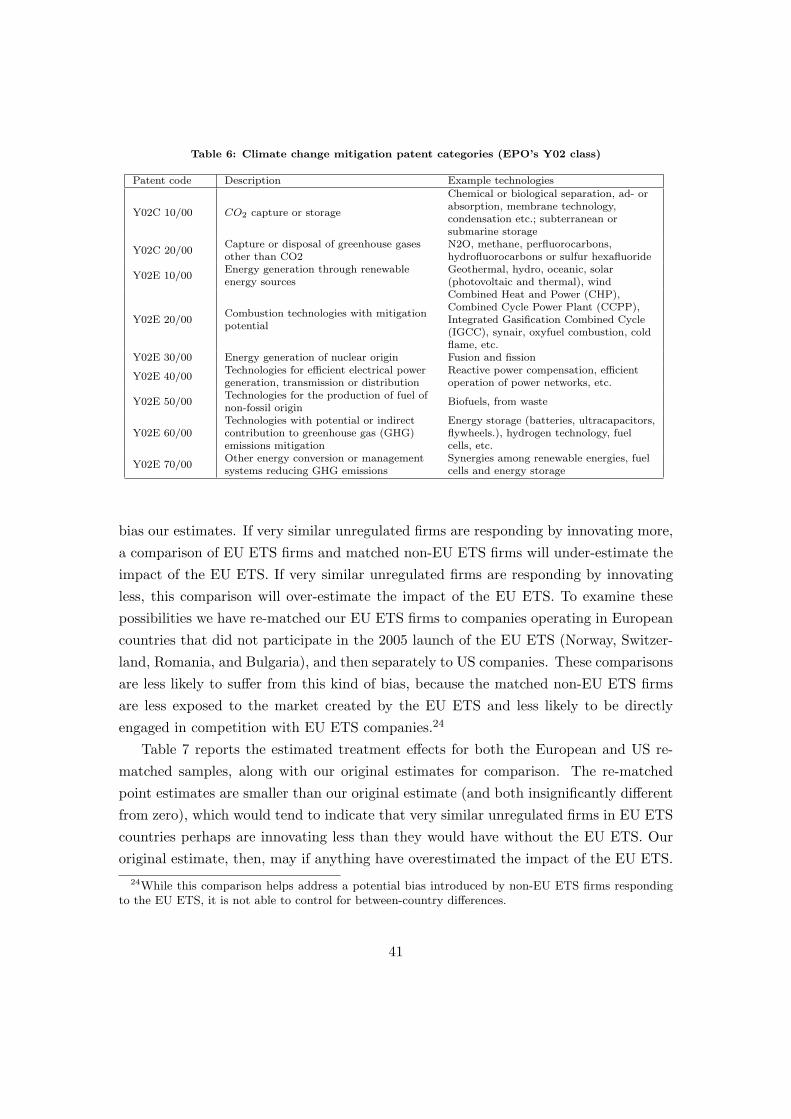
Table 6: Climate change mitigation patent categories (EPO’s Y02 class)
Patent code Description Example technologies
Y02C 10/00 CO2 capture or storage
Chemical or biological separation, ad- orabsorption, membrane technology,condensation etc.; subterranean orsubmarine storage
Y02C 20/00Capture or disposal of greenhouse gasesother than CO2
N2O, methane, perfluorocarbons,hydrofluorocarbons or sulfur hexafluoride
Y02E 10/00Energy generation through renewableenergy sources
Geothermal, hydro, oceanic, solar(photovoltaic and thermal), wind
Y02E 20/00Combustion technologies with mitigationpotential
Combined Heat and Power (CHP),Combined Cycle Power Plant (CCPP),Integrated Gasification Combined Cycle(IGCC), synair, oxyfuel combustion, coldflame, etc.
Y02E 30/00 Energy generation of nuclear origin Fusion and fission
Y02E 40/00Technologies for efficient electrical powergeneration, transmission or distribution
Reactive power compensation, efficientoperation of power networks, etc.
Y02E 50/00Technologies for the production of fuel ofnon-fossil origin
Biofuels, from waste
Y02E 60/00Technologies with potential or indirectcontribution to greenhouse gas (GHG)emissions mitigation
Energy storage (batteries, ultracapacitors,flywheels.), hydrogen technology, fuelcells, etc.
Y02E 70/00Other energy conversion or managementsystems reducing GHG emissions
Synergies among renewable energies, fuelcells and energy storage
bias our estimates. If very similar unregulated firms are responding by innovating more,a comparison of EU ETS firms and matched non-EU ETS firms will under-estimate theimpact of the EU ETS. If very similar unregulated firms are responding by innovatingless, this comparison will over-estimate the impact of the EU ETS. To examine thesepossibilities we have re-matched our EU ETS firms to companies operating in Europeancountries that did not participate in the 2005 launch of the EU ETS (Norway, Switzer-land, Romania, and Bulgaria), and then separately to US companies. These comparisonsare less likely to suffer from this kind of bias, because the matched non-EU ETS firmsare less exposed to the market created by the EU ETS and less likely to be directlyengaged in competition with EU ETS companies.24
Table 7 reports the estimated treatment effects for both the European and US re-matched samples, along with our original estimates for comparison. The re-matchedpoint estimates are smaller than our original estimate (and both insignificantly differentfrom zero), which would tend to indicate that very similar unregulated firms in EU ETScountries perhaps are innovating less than they would have without the EU ETS. Ouroriginal estimate, then, may if anything have overestimated the impact of the EU ETS.
24While this comparison helps address a potential bias introduced by non-EU ETS firms respondingto the EU ETS, it is not able to control for between-country differences.
41
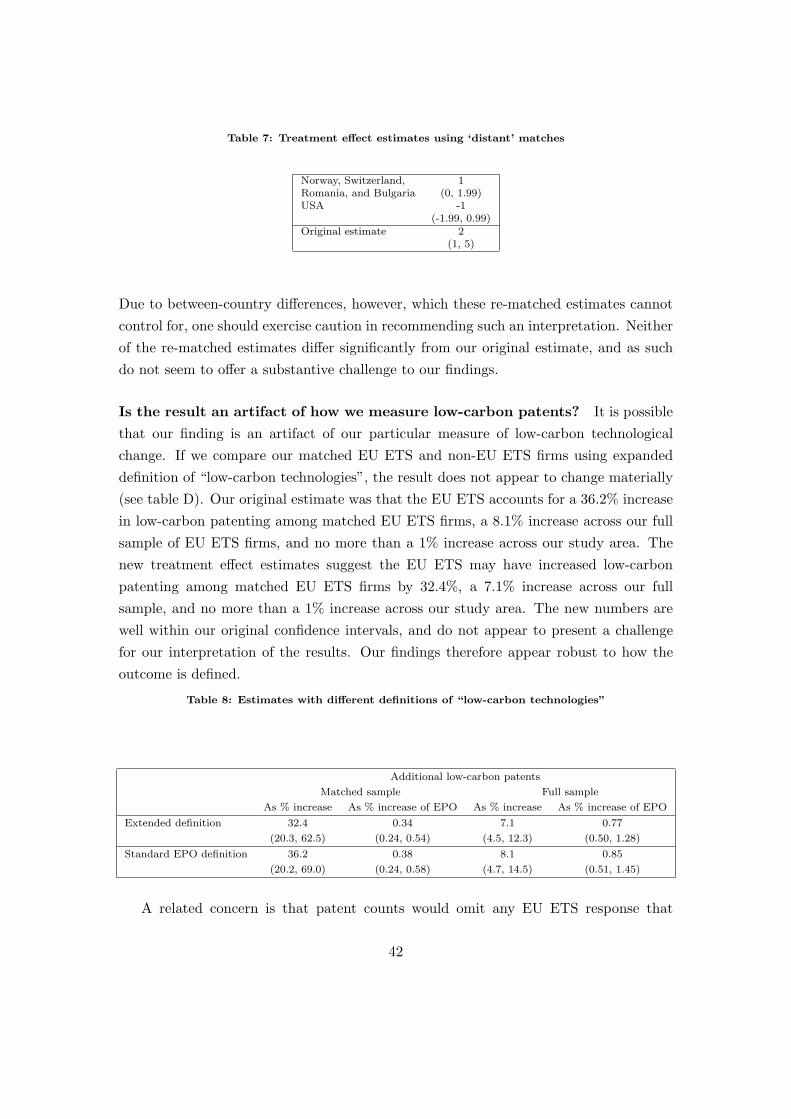
Table 7: Treatment effect estimates using ‘distant’ matches
Norway, Switzerland, 1Romania, and Bulgaria (0, 1.99)USA -1
(-1.99, 0.99)Original estimate 2
(1, 5)
Due to between-country differences, however, which these re-matched estimates cannotcontrol for, one should exercise caution in recommending such an interpretation. Neitherof the re-matched estimates differ significantly from our original estimate, and as suchdo not seem to offer a substantive challenge to our findings.
Is the result an artifact of how we measure low-carbon patents? It is possiblethat our finding is an artifact of our particular measure of low-carbon technologicalchange. If we compare our matched EU ETS and non-EU ETS firms using expandeddefinition of “low-carbon technologies”, the result does not appear to change materially(see table D). Our original estimate was that the EU ETS accounts for a 36.2% increasein low-carbon patenting among matched EU ETS firms, a 8.1% increase across our fullsample of EU ETS firms, and no more than a 1% increase across our study area. Thenew treatment effect estimates suggest the EU ETS may have increased low-carbonpatenting among matched EU ETS firms by 32.4%, a 7.1% increase across our fullsample, and no more than a 1% increase across our study area. The new numbers arewell within our original confidence intervals, and do not appear to present a challengefor our interpretation of the results. Our findings therefore appear robust to how theoutcome is defined.
Table 8: Estimates with different definitions of “low-carbon technologies”
Additional low-carbon patents
Matched sample Full sample
As % increase As % increase of EPO As % increase As % increase of EPO
Extended definition 32.4 0.34 7.1 0.77
(20.3, 62.5) (0.24, 0.54) (4.5, 12.3) (0.50, 1.28)
Standard EPO definition 36.2 0.38 8.1 0.85
(20.2, 69.0) (0.24, 0.58) (4.7, 14.5) (0.51, 1.45)
A related concern is that patent counts would omit any EU ETS response that
42

appears in the form of a change in the quality of patents. To address this concern, wetest whether the EU ETS has systematically changed the number of citations received bylow-carbon patents held by EU ETS relative to non-EU ETS firms. Our results, reportedin table 9, indicate that the EU ETS has not had a significant impact on patent quality.
Table 9: Changes in quality of low-carbon patents
Additional citations per firm 2.25(-0.99, 17.99)
43