0 supp fig 1 cardiacpulm pre - centers for disease control
TRANSCRIPT
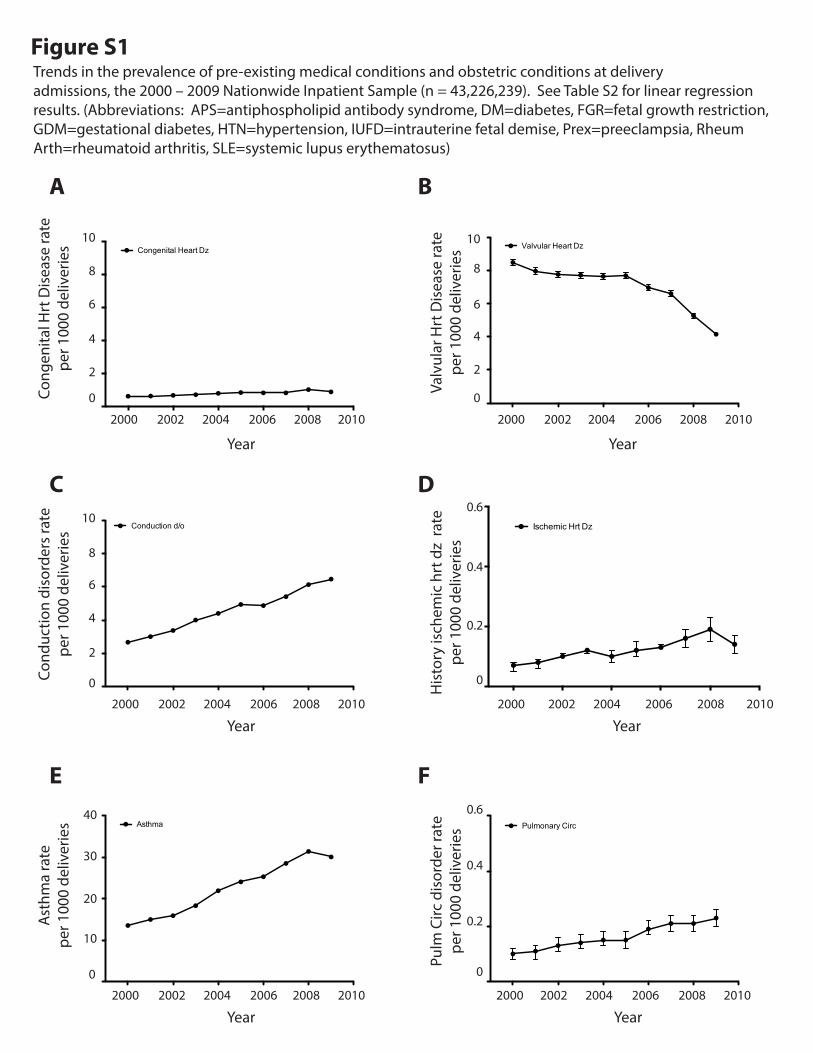
Figure S1
A B
C D
2000 20102008200620042002 2000 20102008200620042002
2000 20102008200620042002 2000 20102008200620042002
Year Year
Year Year
Valvular Heart Dz
Valv
ular
Hrt
Dis
ease
rate
per 1
000
deliv
erie
s
2
8
6
4
10
Cong
enita
l Hrt
Dis
ease
rate
per 1
000
deliv
erie
s
2
8
6
4
10
Conduction d/o
Cond
uctio
n di
sord
ers
rate
per 1
000
deliv
erie
s
2
8
6
4
10
His
tory
isch
emic
hrt
dz
rate
per 1
000
deliv
erie
s
E F
2000 20102008200620042002 2000 20102008200620042002
Year Year
Ast
hma
rate
per 1
000
deliv
erie
s
10
40
30
20
Pulm
Circ
dis
orde
r rat
epe
r 100
0 de
liver
iesAsthma Pulmonary Circ
0.2
0.6
0.4
0
00
0
0
Congenital Heart Dz
Ischemic Hrt Dz
0.2
0.6
0.4
0
Trends in the prevalence of pre-existing medical conditions and obstetric conditions at deliveryadmissions, the 2000 – 2009 Nationwide Inpatient Sample (n = 43,226,239). See Table S2 for linear regressionresults. (Abbreviations: APS=antiphospholipid antibody syndrome, DM=diabetes, FGR=fetal growth restriction, GDM=gestational diabetes, HTN=hypertension, IUFD=intrauterine fetal demise, Prex=preeclampsia, Rheum Arth=rheumatoid arthritis, SLE=systemic lupus erythematosus)

Figure S1 continued
G H
I J
2000 20102008200620042002 2000 20102008200620042002
2000 20102008200620042002 2000 20102008200620042002
Year Year
YearYear
Dia
bete
s ra
tepe
r 100
0 de
liver
ies
10
5
0
15
Thyr
oid
diso
rder
rate
per 1
000
deliv
erie
s
SLE
rate
per 1
000
deliv
erie
s
0
1.5
1.0
0.5
2.0Rh
eum
atoi
d ar
thrit
is ra
tepe
r 100
0 de
liver
ies
DM (non-gestational) Thyroid d/o
20
15
10
25
SLE Rheum Arth
0
1.5
1.0
0.5
2.0
K
2000 20102008200620042002
Year
Thro
mbo
phili
a ra
tepe
r 100
0 de
liver
ies
2
0
10Thrombophilia/APS
4
6
8
L
2000 20102008200620042002
Year
Thro
mbo
cyto
peni
a ra
tepe
r 100
0 de
liver
ies
Thrombocytopenia
2
0
10
4
6
8
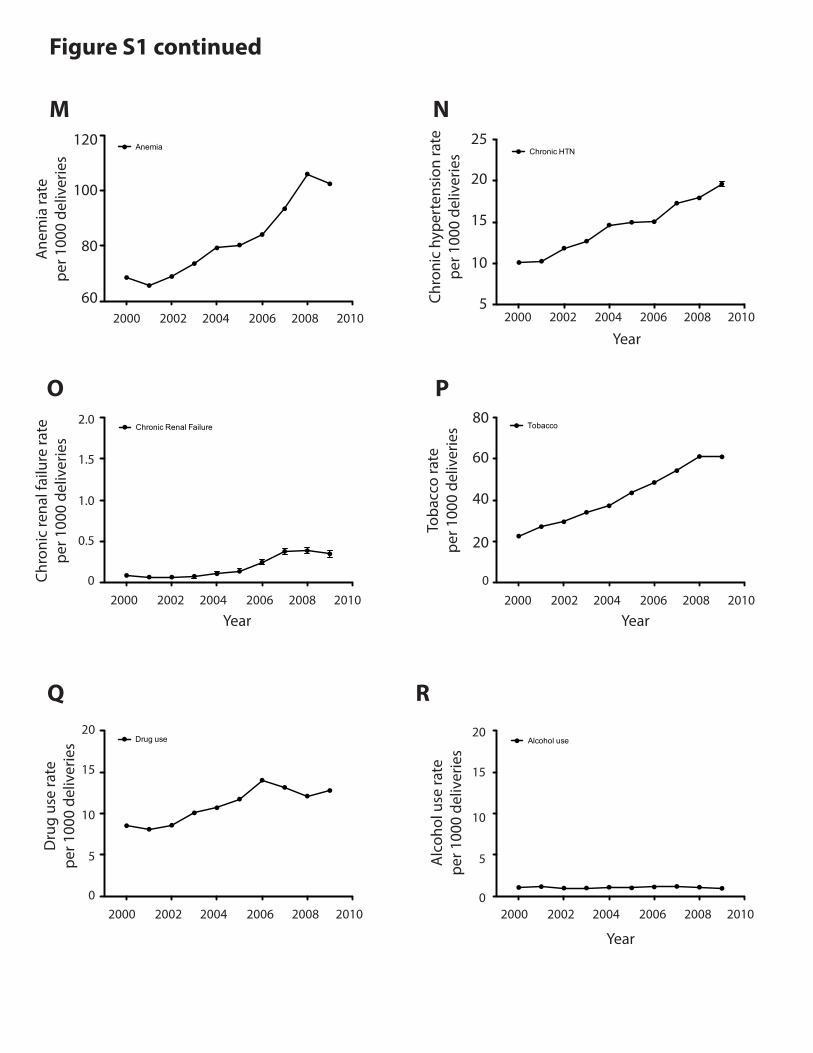
Figure S1 continued
M N
2000 20102008200620042002 2000 20102008200620042002
Year
Ane
mia
rate
per 1
000
deliv
erie
s
Chro
nic
hype
rten
sion
rate
per 1
000
deliv
erie
s
Anemia Chronic HTN
60
120
100
80
5
20
15
10
O
2000 20102008200620042002
Year
Chro
nic
rena
l fai
lure
rate
per 1
000
deliv
erie
s
0
1.5
1.0
0.5
2.0Chronic Renal Failure
P
2000 20102008200620042002
Year
Toba
cco
rate
per 1
000
deliv
erie
s
20
80
60
40
Tobacco
Q R
2000 20102008200620042002 2000 20102008200620042002
Year
Dru
g us
e ra
tepe
r 100
0 de
liver
ies
5
0
20
Alc
ohol
use
rate
per 1
000
deliv
erie
s
10
15
Drug use Alcohol use
5
0
20
10
15
0
25

Figure S1 continued
S T
U
2000 20102008200620042002 2000 20102008200620042002
2000 20102008200620042002
Year Year
Ges
tatio
nal d
iabe
tes
rate
per 1
000
deliv
erie
s
Pree
clam
psia
rate
per 1
000
deliv
erie
s
Mul
tiple
ges
tatio
n ra
tepe
r 100
0 de
liver
ies
GDM
30
60
70
50
40
Prex
50
70
80
90
60
Multiple gestation
0
10
20
30
40
V
2000 20102008200620042002
Feta
l gro
wth
rest
rictio
n ra
tepe
r 100
0 de
liver
ies
0
10
20
30
40 FGR
W
2000 20102008200620042002
Abr
uptio
n ra
tepe
r 100
0 de
liver
ies
0
10
20
30
40
X
2000 20102008200620042002
Feta
l dea
th ra
tepe
r 100
0 de
liver
ies
2
3
4
5
6
Abruption IUFD7
Year Year
Year Year
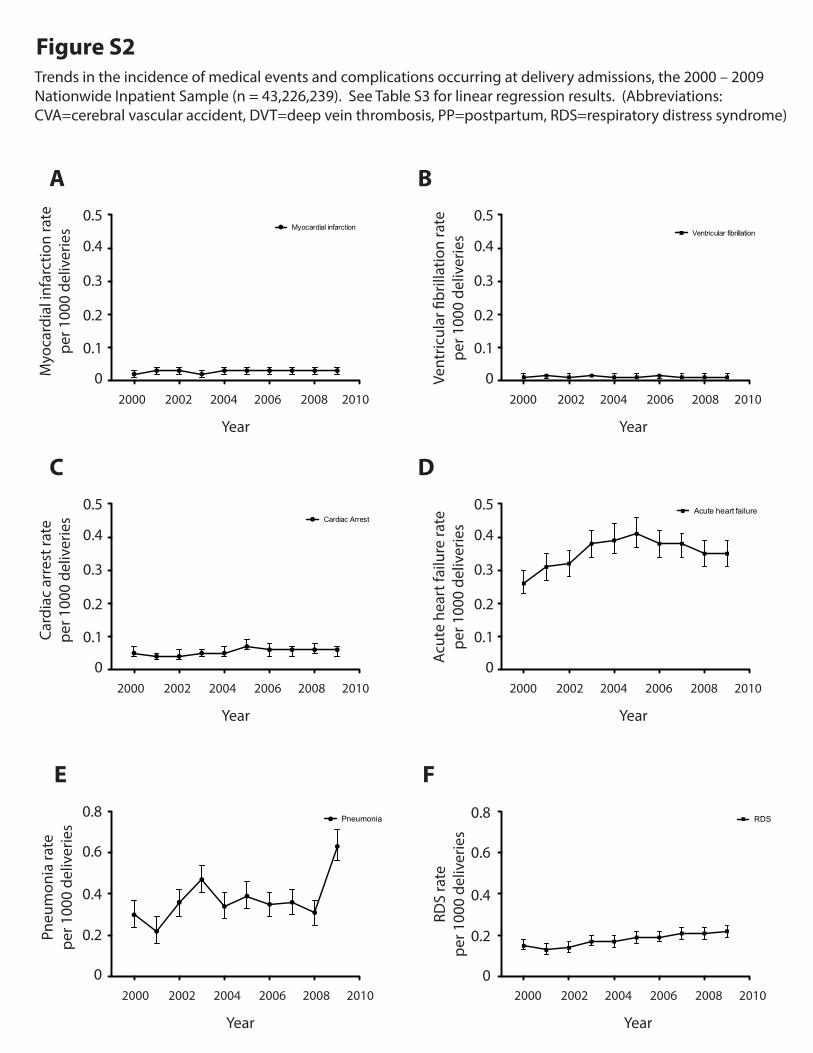
Figure S2
A B
2000 20102008200620042002 2000 20102008200620042002
Myo
card
ial i
nfar
ctio
n ra
tepe
r 100
0 de
liver
ies
Vent
ricul
ar �
brill
atio
n ra
tepe
r 100
0 de
liver
ies
0
0.3
0.4
0.2
0.1
Myocardial infarction
Year
Ventricular fibrillation
Year
0.5
0
0.3
0.4
0.2
0.1
0.5
C D
2000 20102008200620042002 2000 20102008200620042002
Card
iac
arre
st ra
tepe
r 100
0 de
liver
ies
Acut
e he
art f
ailu
re ra
tepe
r 100
0 de
liver
ies
0
0.3
0.4
0.2
0.1
Year Year
0.5
0
0.3
0.4
0.2
0.1
0.5Cardiac Arrest
Acute heart failure
E F
2000 20102008200620042002 2000 20102008200620042002
Pneu
mon
ia ra
tepe
r 100
0 de
liver
ies
RDS
rate
per 1
000
deliv
erie
s
0
0.4
0.6
0.2
Year Year
0.8 Pneumonia
0
0.4
0.6
0.2
0.8 RDS
Trends in the incidence of medical events and complications occurring at delivery admissions, the 2000 – 2009Nationwide Inpatient Sample (n = 43,226,239). See Table S3 for linear regression results. (Abbreviations:CVA=cerebral vascular accident, DVT=deep vein thrombosis, PP=postpartum, RDS=respiratory distress syndrome)
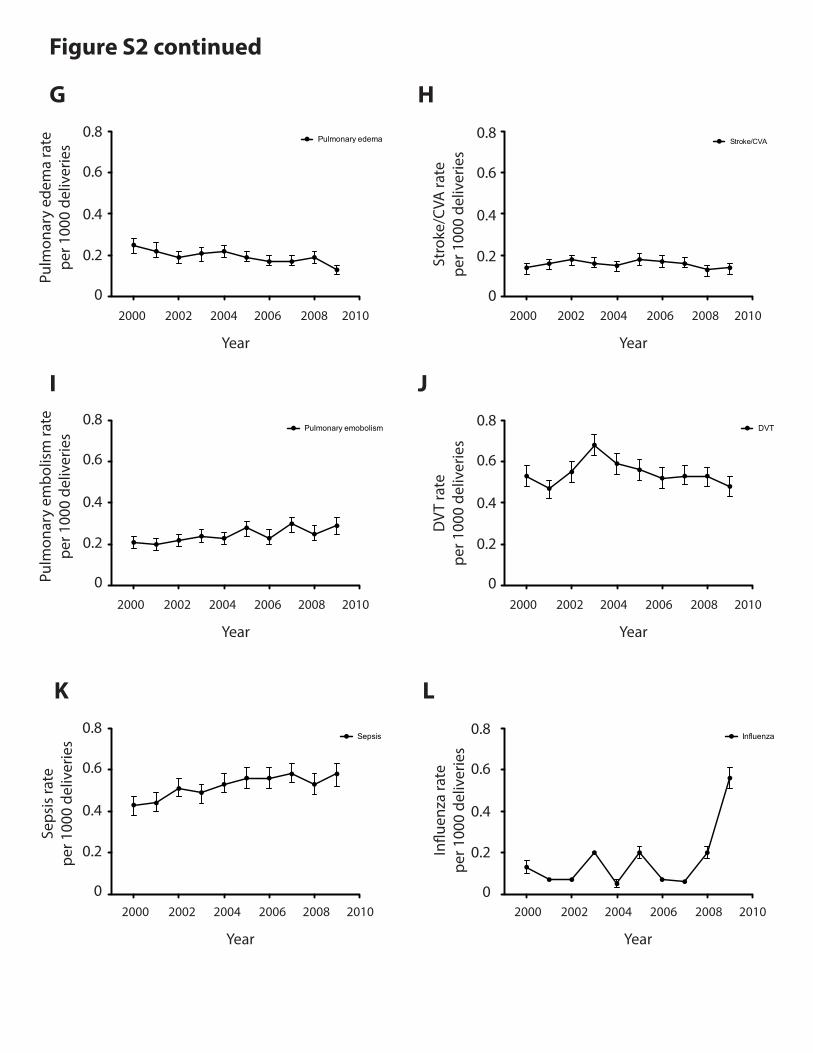
Figure S2 continued
G H
2000 20102008200620042002 2000 20102008200620042002
Pulm
onar
y ed
ema
rate
per 1
000
deliv
erie
s
Stro
ke/C
VA ra
tepe
r 100
0 de
liver
ies
Year Year
I J
2000 20102008200620042002 2000 20102008200620042002
Pulm
onar
y em
bolis
m ra
tepe
r 100
0 de
liver
ies
DVT
rate
per 1
000
deliv
erie
s
Year Year
K L
2000 20102008200620042002 2000 20102008200620042002
Seps
is ra
tepe
r 100
0 de
liver
ies
In�u
enza
rate
per 1
000
deliv
erie
s
0
0.4
0.6
0.2
Year Year
0.8
0
0.4
0.6
0.2
0.8
Pulmonary edema
0
0.4
0.6
0.2
0.8Stroke/CVA
0
0.4
0.6
0.2
0.8
Pulmonary emobolism
0
0.4
0.6
0.2
0.8DVT
0
0.4
0.6
0.2
0.8
Sepsis Influenza
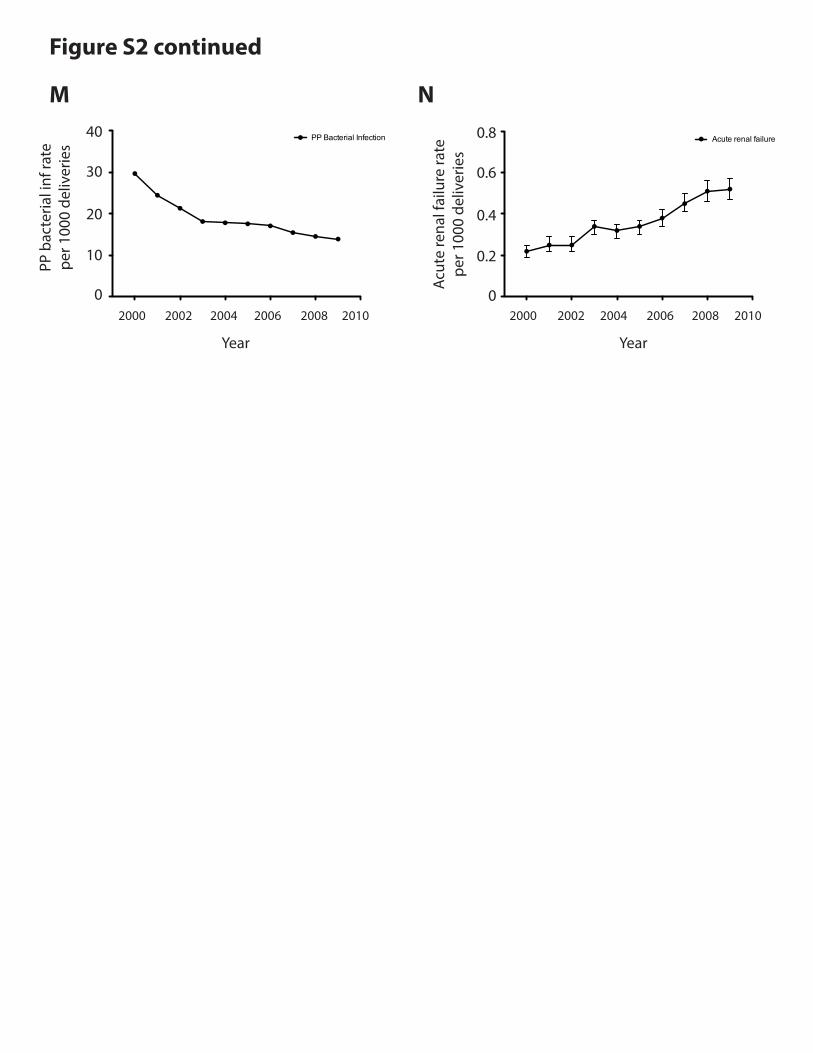
Figure S2 continued
M N
2000 20102008200620042002 2000 20102008200620042002
PP b
acte
rial i
nf ra
tepe
r 100
0 de
liver
ies
Acut
e re
nal f
ailu
re ra
tepe
r 100
0 de
liver
ies
Year Year
0
20
30
10
40
0
0.4
0.6
0.2
0.8PP Bacterial Infection Acute renal failure
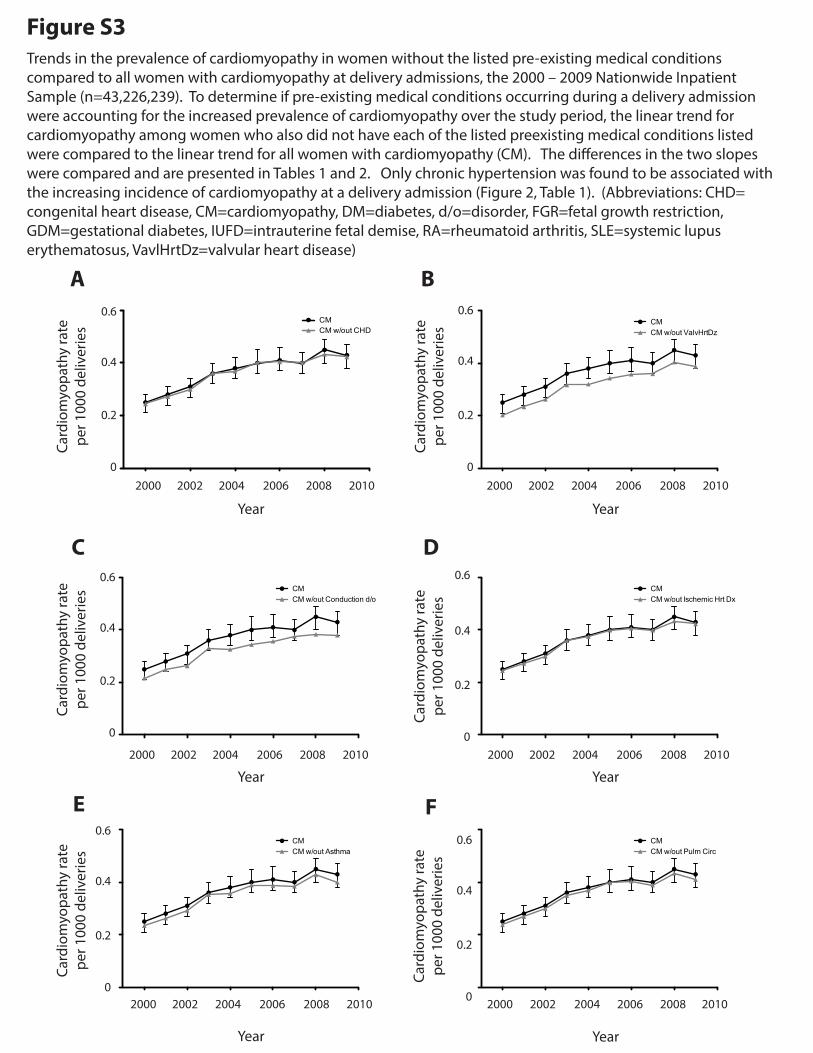
Figure S3
A B
D
E
2000 20102008200620042002 2000 20102008200620042002
2000 20102008200620042002
2000 20102008200620042002
Year Year
Year
Year
0
0.6
0.4
0.2
Card
iom
yopa
thy
rate
per 1
000
deliv
erie
s
0
0.6
0.4
0.2Ca
rdio
myo
path
y ra
tepe
r 100
0 de
liver
ies
0
0.6
0.4
0.2
Card
iom
yopa
thy
rate
per 1
000
deliv
erie
s
0
0.6
0.4
0.2
Card
iom
yopa
thy
rate
per 1
000
deliv
erie
s
F
2000 20102008200620042002
Year
0
0.6
0.4
0.2
Card
iom
yopa
thy
rate
per 1
000
deliv
erie
s
CMCM w/out ValvHrtDz
CMCM w/out Conduction d/o
CMCM w/out Asthma
C
CMCM w/out Ischemic Hrt Dx
2000 20102008200620042002
Year
0
0.6
0.4
0.2
Card
iom
yopa
thy
rate
per 1
000
deliv
erie
s
CM w/out CHDCM
CMCM w/out Pulm Circ
Trends in the prevalence of cardiomyopathy in women without the listed pre-existing medical conditionscompared to all women with cardiomyopathy at delivery admissions, the 2000 – 2009 Nationwide InpatientSample (n=43,226,239). To determine if pre-existing medical conditions occurring during a delivery admissionwere accounting for the increased prevalence of cardiomyopathy over the study period, the linear trend forcardiomyopathy among women who also did not have each of the listed preexisting medical conditions listedwere compared to the linear trend for all women with cardiomyopathy (CM). The di�erences in the two slopeswere compared and are presented in Tables 1 and 2. Only chronic hypertension was found to be associated withthe increasing incidence of cardiomyopathy at a delivery admission (Figure 2, Table 1). (Abbreviations: CHD=congenital heart disease, CM=cardiomyopathy, DM=diabetes, d/o=disorder, FGR=fetal growth restriction, GDM=gestational diabetes, IUFD=intrauterine fetal demise, RA=rheumatoid arthritis, SLE=systemic lupus erythematosus, VavlHrtDz=valvular heart disease)
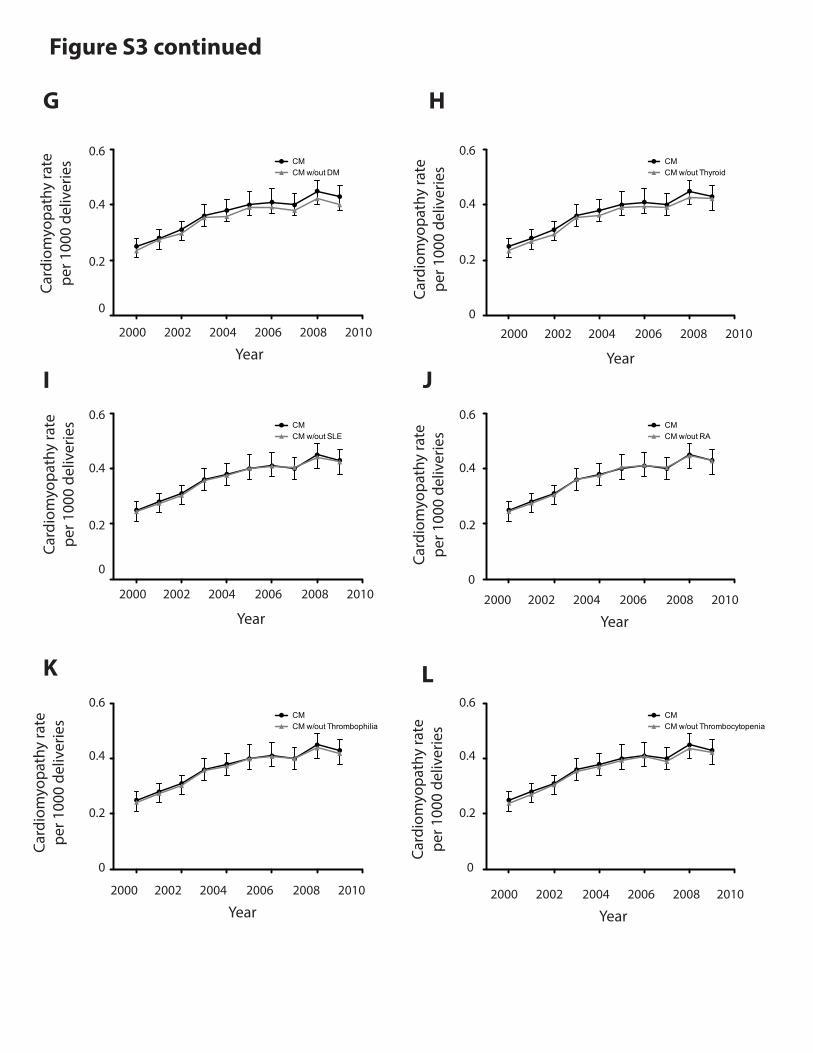
Figure S3 continued
H
I J
K
2000 20102008200620042002
2000 20102008200620042002 2000 20102008200620042002
2000 20102008200620042002
Year
Year Year
Year
0
0.6
0.4
0.2
Card
iom
yopa
thy
rate
per 1
000
deliv
erie
s
0
0.6
0.4
0.2
Card
iom
yopa
thy
rate
per 1
000
deliv
erie
s
0
0.6
0.4
0.2
Card
iom
yopa
thy
rate
per 1
000
deliv
erie
s
0
0.6
0.4
0.2
Card
iom
yopa
thy
rate
per 1
000
deliv
erie
s
L
2000 20102008200620042002
Year
0
0.6
0.4
0.2
Card
iom
yopa
thy
rate
per 1
000
deliv
erie
sCMCM w/out SLE
CMCM w/out RA
CMCM w/out Thrombophilia
CMCM w/out Thrombocytopenia
2000 20102008200620042002
Year
0
0.6
0.4
0.2
Card
iom
yopa
thy
rate
per 1
000
deliv
erie
s CMCM w/out Thyroid
G
CMCM w/out DM
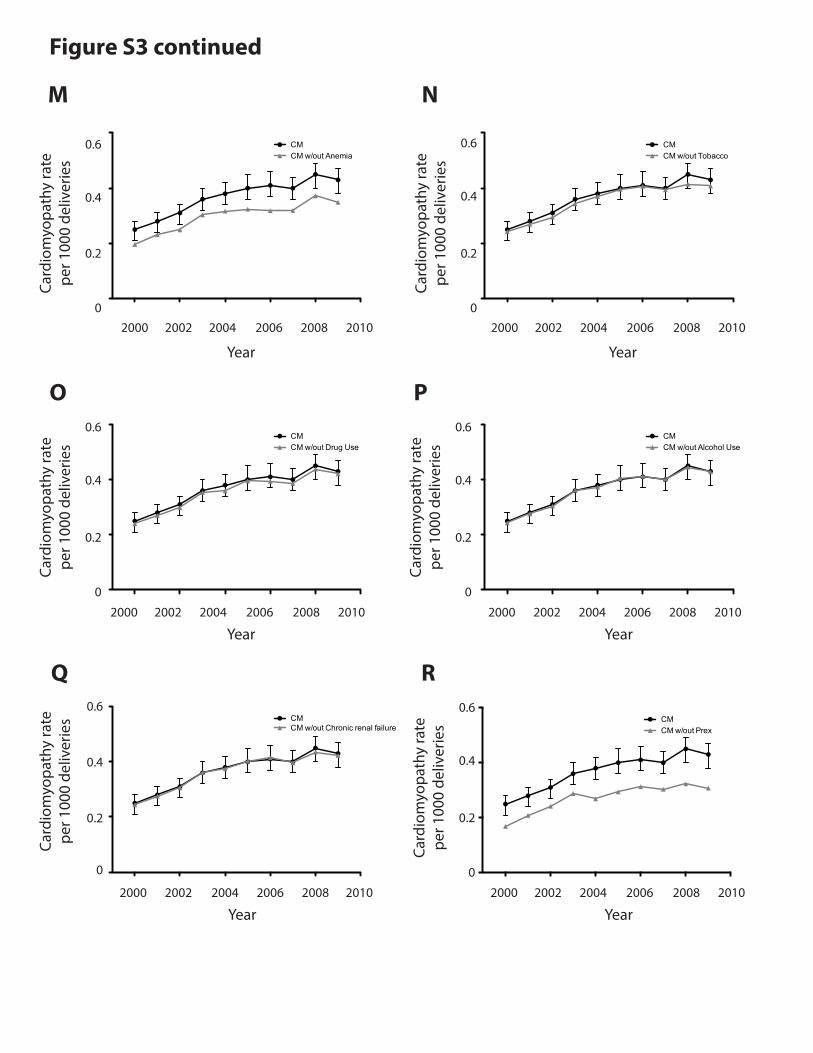
Figure S3 continued
M N
O
R
2000 20102008200620042002 2000 20102008200620042002
2000 20102008200620042002
2000 20102008200620042002
Year Year
Year
0
0.6
0.4
0.2
Card
iom
yopa
thy
rate
per 1
000
deliv
erie
s
0
0.6
0.4
0.2
Card
iom
yopa
thy
rate
per 1
000
deliv
erie
s
0
0.6
0.4
0.2
Card
iom
yopa
thy
rate
per 1
000
deliv
erie
s
0
0.6
0.4
0.2
Card
iom
yopa
thy
rate
per 1
000
deliv
erie
s
CMCM w/out Tobacco
CMCM w/out Drug Use
CMCM w/out Alcohol Use
Q
CMCM w/out Prex
2000 20102008200620042002
Year
0
0.6
0.4
0.2
Card
iom
yopa
thy
rate
per 1
000
deliv
erie
s
P
2000 20102008200620042002
Year
0
0.6
0.4
0.2
Card
iom
yopa
thy
rate
per 1
000
deliv
erie
s
CM w/out Chronic renal failureCM
Year
CMCM w/out Anemia

Figure S3 continued
U V
2000 20102008200620042002 2000 20102008200620042002
Year Year
0
0.6
0.4
0.2
Card
iom
yopa
thy
rate
per 1
000
deliv
erie
s
0
0.6
0.4
0.2
Card
iom
yopa
thy
rate
per 1
000
deliv
erie
s CMCM w/out Abruption
T
2000 20102008200620042002
Year
0
0.6
0.4
0.2
Card
iom
yopa
thy
rate
per 1
000
deliv
erie
sCMCM w/out FGR
S
2000 20102008200620042002
Year
0
0.6
0.4
0.2
Card
iom
yopa
thy
rate
per 1
000
deliv
erie
s CMCM w/out Multiple Gest
CMCM w/out GDM
W
2000 20102008200620042002
Year
0
0.6
0.4
0.2
Card
iom
yopa
thy
rate
per 1
000
deliv
erie
s CMCM w/out IUFD
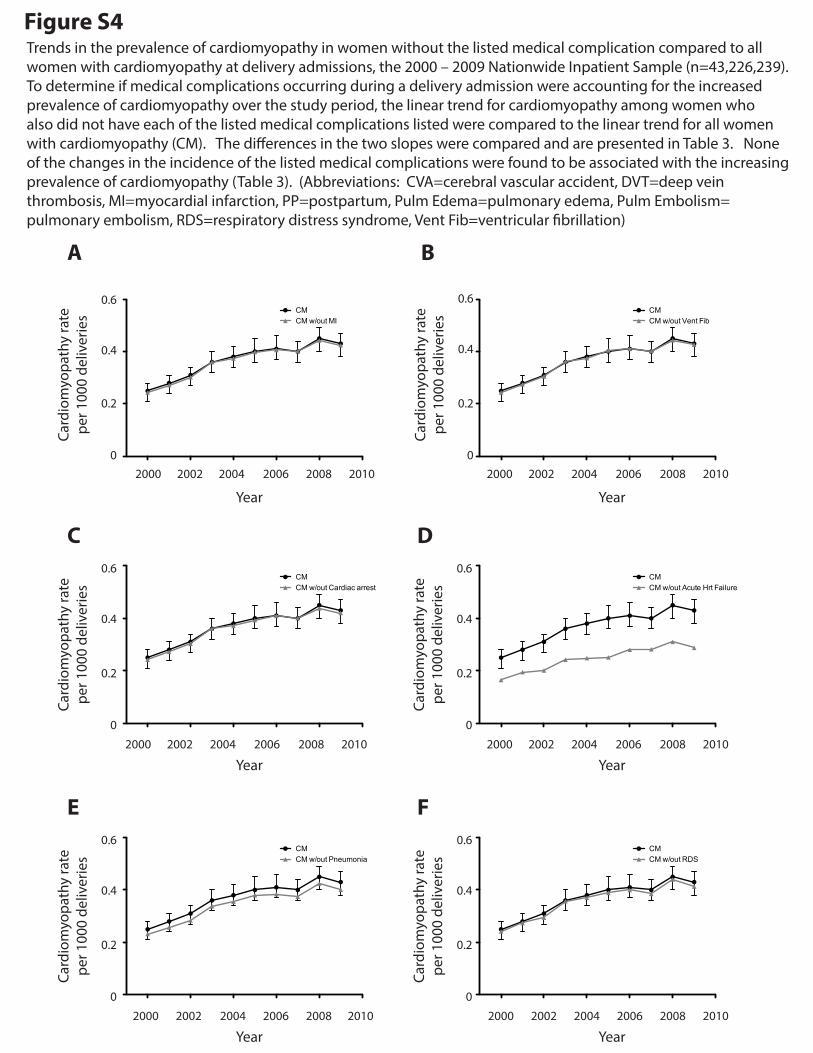
Figure S4
A B
C D
2000 20102008200620042002 2000 20102008200620042002
2000 20102008200620042002 2000 20102008200620042002
Year Year
Year Year
0
0.6
0.4
0.2
Card
iom
yopa
thy
rate
per 1
000
deliv
erie
s
0
0.6
0.4
0.2Ca
rdio
myo
path
y ra
tepe
r 100
0 de
liver
ies
0
0.6
0.4
0.2
Card
iom
yopa
thy
rate
per 1
000
deliv
erie
s
0
0.6
0.4
0.2
Card
iom
yopa
thy
rate
per 1
000
deliv
erie
s
E F
2000 20102008200620042002 2000 20102008200620042002
Year Year
0
0.6
0.4
0.2
Card
iom
yopa
thy
rate
per 1
000
deliv
erie
s
0
0.6
0.4
0.2
Card
iom
yopa
thy
rate
per 1
000
deliv
erie
s
CMCM w/out MI
CMCM w/out Vent Fib
CMCM w/out Cardiac arrest
CMCM w/out Acute Hrt Failure
CMCM w/out Pneumonia
CMCM w/out RDS
Trends in the prevalence of cardiomyopathy in women without the listed medical complication compared to allwomen with cardiomyopathy at delivery admissions, the 2000 – 2009 Nationwide Inpatient Sample (n=43,226,239).To determine if medical complications occurring during a delivery admission were accounting for the increasedprevalence of cardiomyopathy over the study period, the linear trend for cardiomyopathy among women whoalso did not have each of the listed medical complications listed were compared to the linear trend for all womenwith cardiomyopathy (CM). The di�erences in the two slopes were compared and are presented in Table 3. Noneof the changes in the incidence of the listed medical complications were found to be associated with the increasingprevalence of cardiomyopathy (Table 3). (Abbreviations: CVA=cerebral vascular accident, DVT=deep veinthrombosis, MI=myocardial infarction, PP=postpartum, Pulm Edema=pulmonary edema, Pulm Embolism=pulmonary embolism, RDS=respiratory distress syndrome, Vent Fib=ventricular �brillation)

Figure S4 continued
G H
I J
2000 20102008200620042002 2000 20102008200620042002
2000 20102008200620042002 2000 20102008200620042002
Year Year
Year Year
0
0.6
0.4
0.2
Card
iom
yopa
thy
rate
per 1
000
deliv
erie
s
0
0.6
0.4
0.2
Card
iom
yopa
thy
rate
per 1
000
deliv
erie
s
0
0.6
0.4
0.2
Card
iom
yopa
thy
rate
per 1
000
deliv
erie
s
0
0.6
0.4
0.2
Card
iom
yopa
thy
rate
per 1
000
deliv
erie
s
K L
2000 20102008200620042002 2000 20102008200620042002
Year Year
0
0.6
0.4
0.2
Card
iom
yopa
thy
rate
per 1
000
deliv
erie
s
0
0.6
0.4
0.2
Card
iom
yopa
thy
rate
per 1
000
deliv
erie
s
CMCM w/out Pulm Edema
CMCM w/out CVA/Stroke
CMCM w/out Pulm Embolism
CMCM w/out DVT
CMCM w/out Sepsis
CMCM w/out Influenza
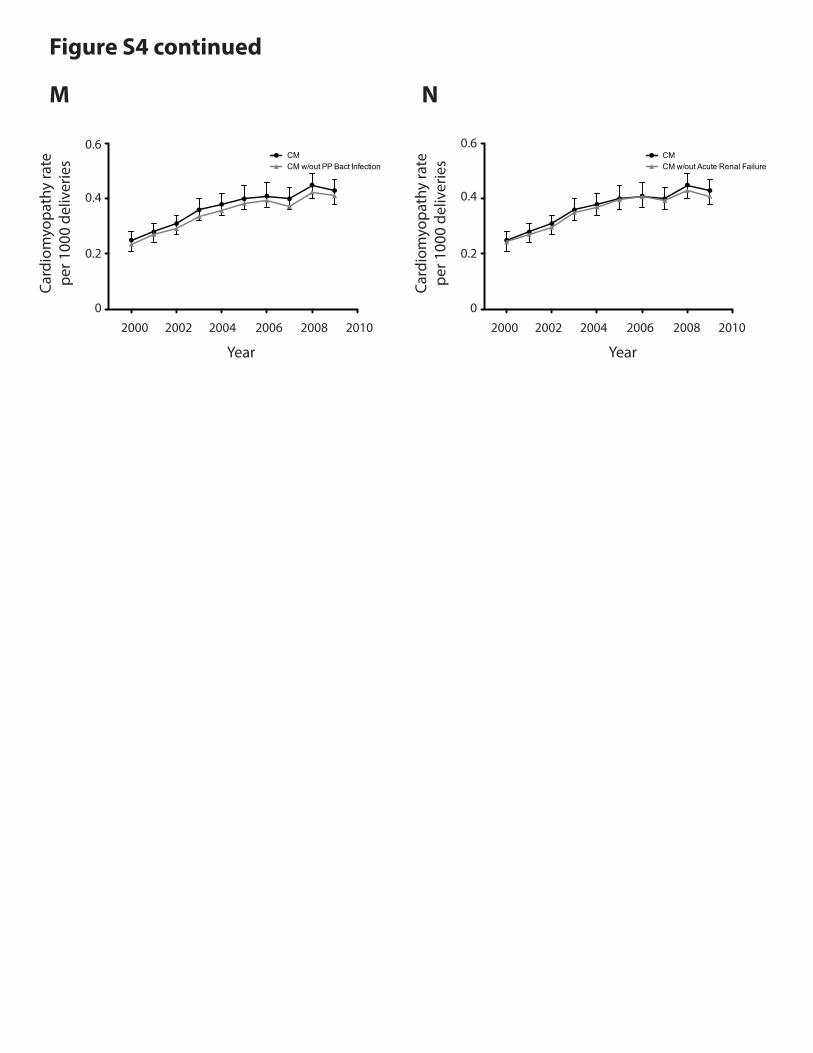
Figure S4 continued
M N
2000 20102008200620042002 2000 20102008200620042002
Year Year
0
0.6
0.4
0.2
Card
iom
yopa
thy
rate
per 1
000
deliv
erie
s
0
0.6
0.4
0.2
Card
iom
yopa
thy
rate
per 1
000
deliv
erie
sCMCM w/out PP Bact Infection
CMCM w/out Acute Renal Failure