0-5873 final report-first draft - texas tech university · considered essential to the object of...
TRANSCRIPT


NOTICE
The United States Government and the State of Texas do not endorse products or manufacturers. Trade or manufacturers’ names appear herein solely because they are considered essential to the object of this report

0-5873 i
Technical Report Documentation Page
1. Report No.: FHWA/TX – 08-0-5873-1
2. Government Accession No.:
3. Recipient’s Catalog No.:
4. Title and Subtitle: Develop a New Testing and Evaluation Protocol to Assess Flexbase Performance Using Strength of Soil Binder
5. Report Date:
6. Performing Organization Code: TechMRT
7. Author(s): Priyantha W. Jayawickrama, Michael E. Merrick and Sanjaya P. Senadheera
8. Performing Organization Report No. 0-5873-1
9. Performing Organization Name and Address: Texas Tech University College of Engineering
10. Work Unit No. (TRAIS):
Box 41023 Lubbock, Texas 79409-1023
11. Contract or Grant No. : Project 0-5873
12. Sponsoring Agency Name and Address Texas Department of Transportation Research and Technology Implementation Office P. O. Box 5080 Austin, TX 78763-5080
13. Type of Report and Period Cover: Technical Report April 2007 - August 2008
14. Sponsoring Agency Code:
15. Supplementary Notes: This study was conducted in cooperation with the Texas Department of Transportation and the Federal Highway Administration
15. Abstract This research involved a detailed laboratory study of a new test method for evaluating road base materials based on the strength of the soil binder. In this test method, small test specimens (5.0in length and 0.75in square cross section) of binder material are load tested to obtain a flexural strength value. The laboratory study conducted in this research included material collected from 19 different sources. The results from the study demonstrated that good correlation can be established between the binder strength and 0-psi Texas Triaxial strength for certain types of base materials such as crushed limestone and materials treated with cement or flyash. However, the test method could not be used to measure the flexural strengths of many sand and gravel materials because these materials did not produce consistent data. The data obtained from repeatability analyses provided an average Coefficient of Variation (COV) of 12.6% for the base binder flexometer test and a COV of 23.2% for the 0-psi Texas Triaxial Test. The research effort also included the design and fabrication of a low cost, easy-to-operate prototype test device for the measurement of binder flexural strength. The reliability of the test equipment was verified by running parallel tests using another commercially available loading device. 17. Key Words
Flexible base, Flexural strength, Texas Triaxial test, Base binder
18. Distribution Statement: No restrictions. This document is available to the public through the National Technical Information Service, Springfield, VA www.ntis.gov
19. Security Classif. (of this report) Unclassified
20. Security Classif. (of this page) Unclassified
21. No. of Pages 122
22. Price
Form DOT F 1700.7 (8-72)

0-5873 ii
Develop a New Testing and Evaluation Protocol to Assess Flexbase Performance Using Strength of Soil Binder
By
Priyantha W. Jayawickrama, Ph.D.
Associate Professor of Civil and Environmental Engineering, Texas Tech University
Michael Merrick, P.E.
Assistant Area Engineer, Snyder Area Office, Abilene Texas Department of Transportation
and
Sanjaya P. Senadheera, Ph.D.
Associate Professor of Civil and Environmental Engineering, Texas Tech University
Texas Tech University Project Report 0-5873-1 Project Number 0-5873
Performed in Cooperation with the
Texas Department of Transportation and the
Federal Highway Administration
Center for Multidisciplinary Research in Transportation Department of Civil and Environmental Engineering
Texas Tech University Box 41023
Lubbock, TX 79409-1023
February 2009

0-5873 iii
AUTHOR’S DISCLAIMER The contents of this report reflect the views of the authors who are responsible for the facts
and the accuracy of the data presented herein. The contents do not necessarily reflect the official view of policies of the Texas Department of Transportation or the Federal Highway Administration. This report does not constitute a standard, specification, or regulation.
PATENT DISCLAIMER There was no invention or discovery conceived or first actually reduced to practice in the
course of or under this contract, including any art, method, process, machine, manufacture, design or composition of matter, or any new useful improvement thereof, or any variety of plant which is or may be patentable under the patent laws of the United States of America or any foreign country.
ENGINEERING DISCLAIMER Not intended for construction, bidding, or permit purposes. TRADE NAMES AND MANUFACTURERS’ NAMES The United States Government and the State of Texas do not endorse products or
manufacturers. Trade or manufacturers’ names appear herein solely because they are considered essential to the object of this report.

0-5873 iv
ACKNOWLEDGEMENTS
The authors wish to thank the project director, Ms. Stacey Young, P.E. and project monitoring committee member, Mr. Benito Sanchez, P.E. for their guidance and assistance throughout the project. They would also like to extend their appreciation to Dr. German Claros, P.E. for his service as the project coordinator, and for his valuable suggestions for improvement of the prototype test device. We also wish to thank all TxDOT District laboratory personnel for their active participation in the project.


0-5873 v
TABLE OF CONTENTS
Technical Documentation Page .............................................................................. i Title Page ................................................................................................................ ii Disclaimers ............................................................................................................. iii Acknowledgements ................................................................................................. iv Table of Contents .................................................................................................... v 1. INTRODUCTION General .................................................................................................................... 1 Research Objectives ................................................................................................ 3 Report Organization ................................................................................................ 4
2. LITERATURE REVIEW Current TxDOT Practice ......................................................................................... 5 Flexible Base Material Test Methods ..................................................................... 7 Texas Triaxial Test .................................................................................... 7 Wet Ball Mill Test ..................................................................................... 11 Tube Suction Test ....................................................................................... 12 Flexural Strength Test ................................................................................. 14 3. DEVELOPMENT OF THE CONCEPTUAL TEST PROCEDURE AND PROTOTYPE TEST DEVICE Development of the Conceptual Test Procedure .................................................... 18 Choice of Suitable Test Specimen Dimensions .......................................... 19 Determination of the Optimum Mixing Moisture Content ......................... 21 Sample Consolidation Procedure ................................................................ 22 Curing of the Test Specimens ..................................................................... 24 Flexural Testing of the Specimens .............................................................. 26 Development of the Prototype Loading Device ...................................................... 28 Loading Method .......................................................................................... 29 Cam/Spring Loading Mechanism ............................................................... 30 Specimen Size and Loading System ........................................................... 31 Power Supply .............................................................................................. 32 4. MATERIAL SAMPLING AND TESTING Overview ................................................................................................................. 36 Material Sampling ................................................................................................... 36 Source Selection.......................................................................................... 36 Sampling Procedures .................................................................................. 37 Laboratory Testing .................................................................................................. 41 Phase I Lab Test Program ........................................................................... 41 Phase II Lab Test Program .......................................................................... 41 5. DATA REVIEW AND ANALYSIS Overview ................................................................................................................. 48 Review of Data Collected in Phase I – Lab Test Program ..................................... 48

0-5873 vi
Flexural Strength versus Texas Triaxial Strength Correlation ................... 53 Repeatability of the Flexometer Test .......................................................... 57 Review of Data Collected in Phase II – Lab Test Program .................................... 60 Phase II-A Test Program: Effect of Test Specimen Size ............................ 60 Phase II-B Test Program: Flexometer Testing with Accelerated Curing ... 63 Phase II-C Test Program: Validation of the Flexometer Test Device ........ 65 6. CONCLUSIONS AND RECOMMENDATIONS Conclusions ............................................................................................................. 69 Recommendations ................................................................................................... 71 REFERENCES ...................................................................................................... 73 APPENDIX A: Standard Test Procedure for Strength of Soil Binder by Flexural Testing .......................................................................................... A-1 APPENDIX B: Laboratory Test Data ..................................................................... B-1

0-5873 vii
List of Tables
2.1 Specification ITEM 247 Requirements for Flexible Base Materials ............................... 6 3.1 Details of the Curing Procedure ...................................................................................... 26 3.2 Comparison between Texas Triaxial and Base Binder Flexometer Test
Procedures ........................................................................................................................ 27 4.1 Properties of Flexible Base Material Sources Selected; Gradation and Atterberg
Limits ................................................................................................................................ 39 4.2 Properties of Flexible Base Material Sources Selected; Wet Ball Mill, Texas
Triaxial, and Compaction Test Data ................................................................................ 40 4.4 Test Parameters Corresponding Intermediate and Large Size Specimen Testing ......... 43 5.1 Flexural and Texas Triaxial Strength Data for the Base Materials Tested .................... 52 5.2 Correlation Coefficient, n for the Base Material Tested ................................................. 54 5.3 Regression Models for Type I, Type II and Modified Materials ................................... 57 5.4 Standard Deviation and Coefficient of Variation of Binder Flexural Strength for
the Selected 5 Sources ..................................................................................................... 58 5.5 Standard Deviation and Coefficient of Variation of Texas Triaxial Strength at 0-psi .............................................................................................................................. 59
List of Figures
2.1 Triaxial Test Device Developed by Casagrande at WES ............................................... 8 2.2 Triaxial Test Device Proposed by Seiffert ....................................................................... 8 2.3 TxDOT Triaxial Apparatus .............................................................................................. 10 2.4 Material Classification Chart for Texas Triaxial Test Result .......................................... 11 2.5 Adek Percometer Test Device .......................................................................................... 14 2.6 Third-Point Loading Configuration Used in ASTM D 1635 .......................................... 16 3.1 Bending Diagram for 3-Point Loading of the Beam Specimen ...................................... 20 3.2 A Sample of Oven-Dried Crushed Limestone Material .................................................. 21 3.3 Mixing Moisture Model .................................................................................................... 23 3.4 Sample Consolidation by Lifting One Side of the Tray and Dropping it on Hard
Surface ............................................................................................................................... 23 3.5 Moist Interface Created by Over-Consolidation of Bottom Lift ..................................... 24 3.6 Flexural Strength versus Test Moisture Content Relationship ........................................ 27 3.7 Original Plan for Testing the Proposed Concept ............................................................. 28 3.8 Loading Device with Cam and Spring Mechanism ......................................................... 29 3.9 Loading System Used in the Current Prototype .............................................................. 31 3.10 Relationship between Applied Load and Flexural Strength for Selected Lengths of Test Specimens ............................................................................................................. 33 3.11 Final Prototype Loading Device ....................................................................................... 34 3.12 Schematic Views of the Finished Prototype Test Device ................................................ 35 4.1 Participating TxDOT Districts and Base Material Sources Sampled ............................. 38 4.2 Small, Intermediate and Large Sized Test Specimens Used for Flexural Strength
Testing: (a) Cured Test Specimens, (b) Molds Used for Making Intermediate Size Test Specimens, (c) Mold Used for Making Large Size Test Specimen ........................ 42

0-5873 viii
4.3 Compaction Hammers Used in the Preparation of (a) Intermediate and (b) Large Size Test Specimens ......................................................................................................... 44
4.4 Flexural Testing of Intermediate Size Specimens Using Snapshot Loading Device ..... 44 4.5 Flexural Testing of Large Size Specimens: (a) Accessories Fabricated and Used for
3-Pint Loading, (b) Triaxial Loading Frame .................................................................... 45 5.1 Flexural Strength versus Test Moisture Content Relationship San Antonio/Hunter Pit ..................................................................................................... 49 5.2 Flexural Strength versus Test Moisture Content Relationship El Paso/Jobe Pit ................................................................................................................. 49 5.3 Determination of the Binder Flexural Strength for Material Recovered from
Tabasco Pit, Pharr District ................................................................................................ 51 5.4 0-psi Triaxial Strength versus Binder Flexural Strength ................................................. 53 5.5 Coefficient, n versus Binder Flexural Strength ................................................................ 55 5.6 Coefficient, n versus Binder Flexural Strength for Type I, Type II and Modified
Materials ............................................................................................................................ 56 5.7 Flexural Strength versus Test Moisture Content Data for Intermediate Size
Specimens ......................................................................................................................... 61 5.8 Flexural Strength versus Test Moisture Content Data for Large Size Specimens .......... 62 5.9 Comparison of Data Obtained from Standard, 4-Day Flexometer and Accelerated
Flexometer Tests; Brownwood-Prater Source ................................................................. 64 5.10 Comparison of Data Obtained from Standard, 4-Day Flexometer and Accelerated
Flexometer Tests; San Angelo-CSA/Turner Source........................................................ 64 5.11 Comparison of Data Obtained from Standard, 4-Day Flexometer and Accelerated
Flexometer Tests, Waco-Frost Source ............................................................................. 65 5.12 Anomalous Trend in Flexural Strength Data Measured by the Base Binder
Flexometer ......................................................................................................................... 66 5.13 Comparison of Data Obtained from Base Binder Flexometer and Snapshot Loading
Device; Brownwood-Prater Source .................................................................................. 67 5.14 Comparison of Data Obtained from Base Binder Flexometer and Snapshot Loading
Device; San Angelo-CSA/Turner Source ........................................................................ 67 5.15 Comparison of Data Obtained from Base Binder Flexometer and Snapshot Loading
Device; Waco-Frost Source .............................................................................................. 68

0-5873 1
CHAPTER 1
INTRODUCTION
GENERAL
The base and the subbase layers of a pavement system play an important role in
determining the overall structural capacity of the pavement. These layers contribute to
improved pavement performance by reducing pavement stresses, strains and deflections
under applied traffic loads. In addition, they provide necessary protection to the natural
subgrade from numerous climate-induced damage mechanisms. Thus, the properties of base
and subbase materials have important bearing on the performance of the pavement structure
during its service life. Therefore, it is important that the quality of base and subbase
materials used in pavement construction is carefully controlled through a properly designed
material screening and selection program. Among the essential elements in a successful
material selection program is a material specification that is capable of identifying material
with good field performance based on its laboratory-determined properties.
With thousands of lane miles in the Texas Transportation System and a high volume
of construction, it is important that the above material testing procedures can be performed in
a reliable but also an expedient manner. The characterization of base and subbase materials
is typically done based on material properties that include gradation, soil plasticity, resistance
to degradation, strength, and moisture susceptibility. It is generally agreed that strength and
moisture susceptibility have the most significant impact on the base material performance in
the field. Strength is also related to the stiffness and permanent deformation characteristics
of these materials that control the development of major pavement distresses.
Texas Department of Transportation (TxDOT) currently classifies base and subgrade
materials based on their strength as determined by the Texas Triaxial Test. In this test
protocol, a base or subgrade material is classified according to a graduated scale between
Classes 1 and 6 with Class 1 representing the highest quality. This Texas Triaxial Class for a
soil is determined by superimposing the failure envelope from the triaxial test on a standard
chart that plots shear strength and normal strength of the material.

0-5873 2
There are a number of shortcomings in the above material qualification procedure
based on the Texas Triaxial Test that limits its effectiveness:
(a) First, there are a number of pre-requisite steps (such as moisture-density testing
and moisture conditioning) that must be completed before the triaxial test can
begin and therefore the entire test procedure takes approximately 3 weeks to
complete. The long testing time is a major shortcoming of triaxial test
procedure because such testing is required not only for initial qualification of the
material, but also for subsequent quality assurance.
(b) Many flexible base materials have difficulty meeting the 0-psi Triaxial strength
requirement. When this happens, the contractor may be directed to enhance the
strength of the material by mixing it with a suitable modifier such as flyash or
cement. Instead, some TxDOT districts and area offices are now beginning to
waive the 0-psi Triaxial test requirement and not perform the test at all.
(c) Triaxial test results tend to show high degree of variability. Therefore, it is not
uncommon for TxDOT to get results that do not agree with contractor’s test data.
This leads to a dispute that may be resolved by repeating the tests, but such
repetitive testing generally takes a long time and often causes significant
construction delays.
(d) As mentioned above, when the material fails the specified strength requirement,
one common strategy used is to incorporate a modifier such as cement or flyash.
However, to determine the appropriate modifier content, material must be
blended with various percentages of modifier (say 2%, 4%, 6% and 7%),
perform necessary moisture-density testing for each mixture and then perform
triaxial tests. Such a design requires large quantities of material (more than half-
a-ton) and demands a lot of manpower.
Many of these difficulties may be overcome if a repeatable and reliable strength test
method that could be performed in a short time and with small amounts of material was
available. Base binder flexometer test was developed by Michael Merrick, P.E., Assistant
Area Engineer, Snyder of TxDOT Abilene District with this objective in mind. Preliminary
test results from the base binder flexometer suggest that flexometer test data correlate
reasonably well with results from the Texas Triaxial Test. The new test procedure makes it

0-5873 3
possible to key the pay equation more directly to performance while substantially reducing
the complexity of the acceptance procedure as a whole. The potential benefits include a
quick and reliable method of predicting the base and subgrade layer performance with regard
to strength, deformation and moisture susceptibility, small quantity of material needed for
testing, quick turn-around time (a total of 5 days for sampling, testing and reporting).
RESEARCH OBJECTIVES
The general objective of this research study is to examine the applicability and
potential implementation of base binder flexometer test procedure developed by Michael
Merrick, P.E. to characterize flexible and treated base materials. The specific objectives of
this research study include the following:
a) Validate the test method through cross correlation of flexometer test results with
data obtained from other, more established test methods (i.e. Texas Triaxial
Test).
b) Determine the repeatability and limits of applicability of the test.
c) Further develop the flexometer to determine the strength of base and subbase
material that overcomes shortcomings of existing test equipment in terms of
equipment size, thereby enabling it to be used in mobile/field laboratories
and using smaller quantities of material.
d) Provide a material testing machine which can be manufactured at low cost
and easy to operate.
In this research, a flexural strength test using the flexometer will be conducted on
materials sampled from various TxDOT projects for which conventional test properties such
as Texas Triaxial Class, wet ball mill values and soil index properties have been determined
at corresponding TxDOT laboratories.
This research study included a thorough and systematic evaluation of the new
flexometer test method with the eventual goal of developing a reliable and repeatable test
protocol that could be used as a quality control tool for flexible and treated base materials.
The finding from this research study could be adopted for future implementation of the
pavement design in Texas, resulting in lower construction costs and time savings for TxDOT.

0-5873 4
REPORT ORGANIZATION
The next chapter of this report, Chapter 2, presents findings from a comprehensive literature
review on test methods available for the characterization of flexible base materials. The special
emphasis of this literature review, however, is on the Texas Triaxial Test. A description of the
Department’s specified method of triaxial testing is provided. The Department’s Specification and
the classification system are also included. Chapter 3 provides a detailed description of the
development of the prototype test device and the test procedure. This includes goals and constraints
that influenced the design process. The loading system is discussed and how it was optimized for the
size of specimen and range of strength. The development and refinement of the test procedure as well
as the changes made and problems resolved are included in the discussion. Chapter 4 is devoted to
material sampling and laboratory testing. The laboratory test program conducted in this research
included two separate Phases, Phase I and Phase II. In Phase I laboratory testing, all material sources
sampled were tested using the standard test procedure. Meanwhile, Phase II lab testing was
designed to address specific issues or concerns related to the original binder flexural strength
test procedure. Chapter 5 describes the data review and analysis processes. The conclusions and
recommendations from the research are presented in the final chapter, Chapter 6.

0-5873 5
CHAPTER 2
REVIEW OF LITERATURE
CURRENT TxDOT PRACTICE
The flexible base course is an integral component of the pavement structure that
works in conjunction with the asphaltic surface layer to support traffic. Directly below the
base layer is the subgrade. A subgrade layer is generally a layer of indigenous material that
has been reworked for consistency; consistency in material composition as well as moisture
distribution. The subgrade serves as a foundation layer carrying the load distributed from
the vehicles at the pavement surface. Therefore, the strengths and material characteristics of
both the flexible base and the subgrade must be considered in the design of the pavement
system. The useful service life of a pavement structure is highly dependent on the quality of
the base course and the foundation soil that supports the structure. It is therefore very
important that these foundation materials receive due consideration when making decisions
related to pavement design and construction.
Flexible base and subbase materials accepted for TxDOT projects must meet the
requirements stipulated in the Standard Specification Item 247 [1]. These requirements and
the corresponding standard test methods are shown in Table 2.1. The flexible base and
subbase materials are designated as Grades 1 through 4 with Grade 1 representing the best
quality material. Materials with Grade designations 1 and 2 are used for structural layers
while Grade 3 materials are recommended for use in non-structural subbases. A Grade 4
designation is provided to give districts the flexibility to develop specification requirements
that are uniquely suited for local conditions and/or a specific project. The acceptance criteria
used in Item 247 include gradation, soil index properties (liquid limit and plasticity index),
degradation potential (determined using the wet-ball mill test) and triaxial class which is
determined using results of the Texas Triaxial Test. Even though the standard specification
stipulates the tests to be conducted for each material, it does not provide specific guidelines
with respect to material sampling and testing frequencies. Such guidelines are found in the
Guide Schedule of Sampling and Testing which is included in the Department’s Construction
Contract Administration Manual [2]. The Material Inspection Guide summarizes the
responsibilities of TxDOT employees for various aspects of material testing and sampling.

0-5873 6
Table 2.1 Specification ITEM 247 Requirements for Flexible Base Materials
Property Test Method
Grade 1 Grade 2 Grade 3 Grade 4
Master gradation sieve size (% retained)
Tex-110-E
As shown on the plans
2½ in. - 0 0 1¾ in. 0 0-10 0-10 7/8 in. 10-35 - - 3/8 in. 30-50 - - No.4 45-65 45-75 45-75 No.40 70-85 60-85 50-85
Liquid Limit, % max.1 Tex-104-E 35 40 40 As shown on the plans
Plasticity Index, max1
Tex-106-E 10 12 12 As shown on
the plans Plasticity Index, min1 As shown on the plans Wet ball mill, % max2
Tex-116-E
40 45 - As shown on the plans
Wet ball mill, % max. increase passing the No.40 sieve
20 20 -
Classification3 1.0 1.1-2.3 - As shown on the plans
Min. compressive strength3, psi
Tex-117-E
As shown on the plans lateral pressure 0psi 45 35 -
lateral pressure 15psi 175 175 -
1. Determine plastic index in accordance with Tex-107-E (linear shrinkage) when liquid limit is unattainable as defined in Tex-104-E.
2. When soundness value is required by the plans, test material in accordance with Tex-411-A. 3. Meet both the classification and the minimum compressive strength unless otherwise shown on the
plans.
In addition to the above-mentioned specifications, guides and manuals, TxDOT
personnel rely on General Notes (also known as Plan Notes) that are project-based
supplements to the TxDOT Standard Specifications. These general notes are attached to the
plans provided to the bidders, and are used for clarification and added information in
conjunction with specifications and special provisions. According to the Department PS&E
Preparation Manual, these general notes are used “to provide, in one section of the plans, the
various supplemental data required by the specifications.”
In a typical roadway construction or reconstruction project, there are two instances in
which evaluation of base/subbase/subgrade materials may be undertaken. The first is the

0-5873 7
beginning stage of assembling a set of plans for the highway improvement project (i.e. during
PS&E Development stage). During initial plan preparation, roadway cores are taken at pre-
determined intervals and material gathered from each core is tested for Atterberg limits, and
if sufficient quantities available, for unit weight. Strength testing is generally not undertaken
at this stage. The second is the construction stage. Upon awarding a highway contract, the
contractor is responsible for identifying a material source that meets project specification
requirements. He will then generate material stockpiles needed for the construction project.
This involves a significant investment on the part of the contractor, for activities such as
lease agreement, blasting, crushing and stockpiling of the material.
These operations are typical of sources that produce crushed limestone- the type of
flexible base material that is most widely used in TxDOT roadway construction projects.
When the base has been crushed for a project, TxDOT is notified by the contractor that
sampling can be performed. Generally, the sample collected by the Department is split with
the contractor. Fairly large quantities of material must be sampled so that moisture-density
(Tex-113-E) and triaxial (Tex-117-E) tests can be performed.
FLEXIBLE BASE MATERIAL TEST METHODS
Texas Triaxial Test
The credit for the development of the first triaxial test device for soil testing is usually
given to Arthur Casagrande. The development of the triaxial test apparatus by Casagrande
occurred during the period 1930 -1941 while working at the Franklin Falls Dam site for the
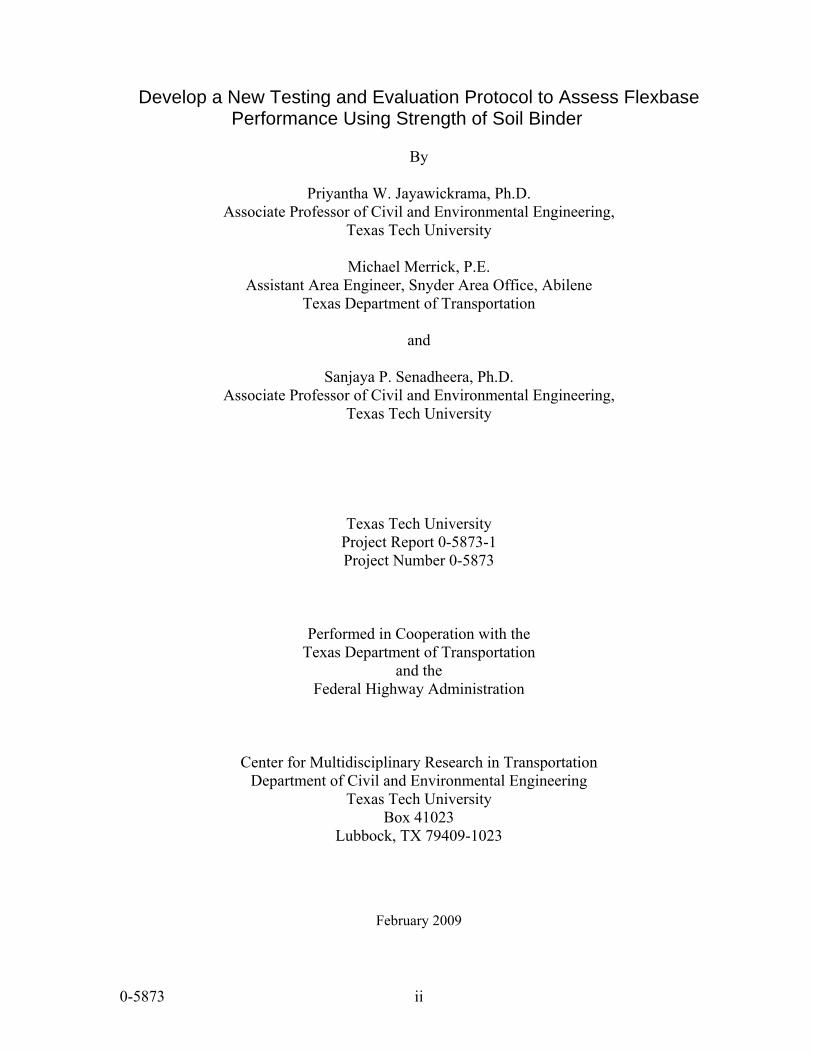
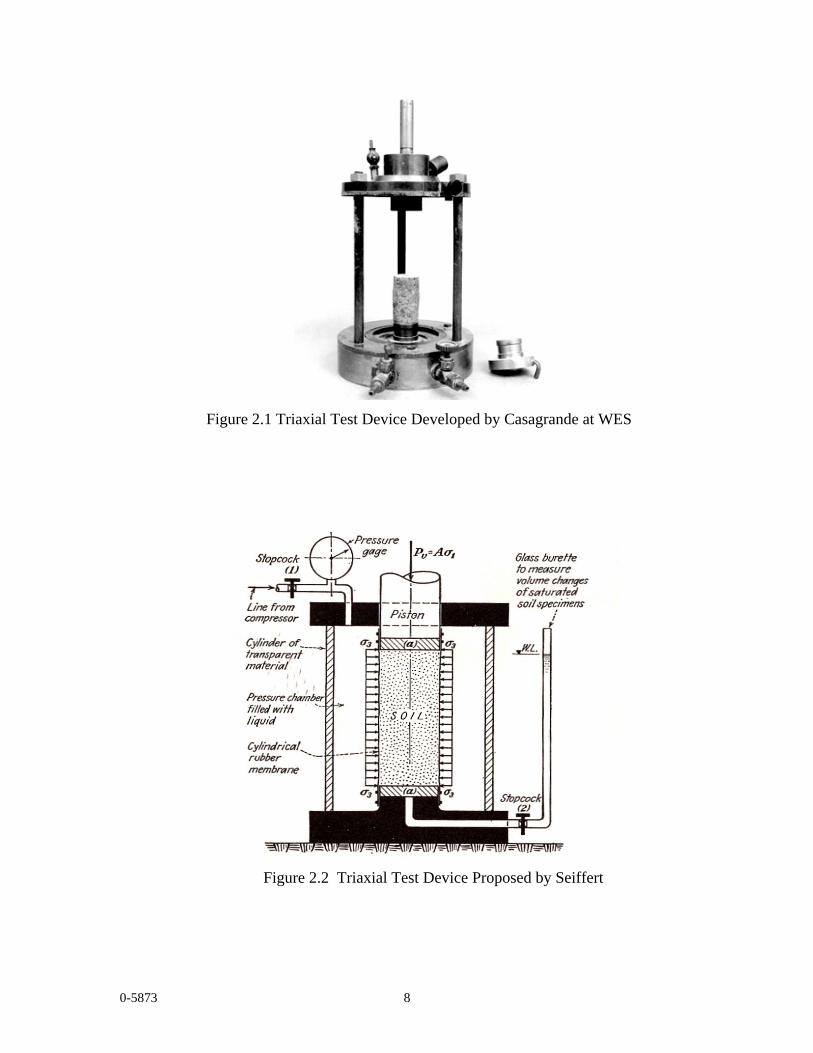
Waterways Experiment Station (WES), U.S. Army Corps of Engineers. Figure 2.1 shows the
triaxial test apparatus developed by Casagrande [3]. Another researcher who has been
credited with early work on triaxial test device is Seiffert. Seiffert developed a system device
that can be used to apply and measure a confining pressure on a test specimen (Figure 2.2).
This was a significant development because the device developed at the WES did not provide
good control or measurement of confining pressure [4].
0-5873 8
Figure 2.1 Triaxial Test Device Developed by Casagrande at WES
Figure 2.2 Triaxial Test Device Proposed by Seiffert
0-5873 9
The triaxial test has retained its preeminence to the present day, not only because of
its versatility, but also for its ability to control drainage, loading rate and degree of saturation
so that the effects of these test conditions on soil behavior can be studied. Various agencies
have made modifications to the triaxial test method and the test apparatus to meet their
specific needs. TxDOT developed the Texas Triaxial Test (formerly AASHTO T 212) to
characterize soil and soil-aggregate combinations according to a classification system based
on six classes. The Texas Triaxial Test (Tex-117-E) differs from the standard triaxial
compression test in that, in Tex-117-E, the confining pressure on the specimen is induced
through compressed air between a metal triaxial cell and a thick rubber lining which is in
contact with the specimen. This solves some of the problems inherent in the standard
geotechnical cell. Specifically, it eliminates the need for a sophisticated system to apply
confining stress on the test specimen. In contrast to the standard geotechnical cell, the
membrane is part of the cell, not a consumable part of the specimen.
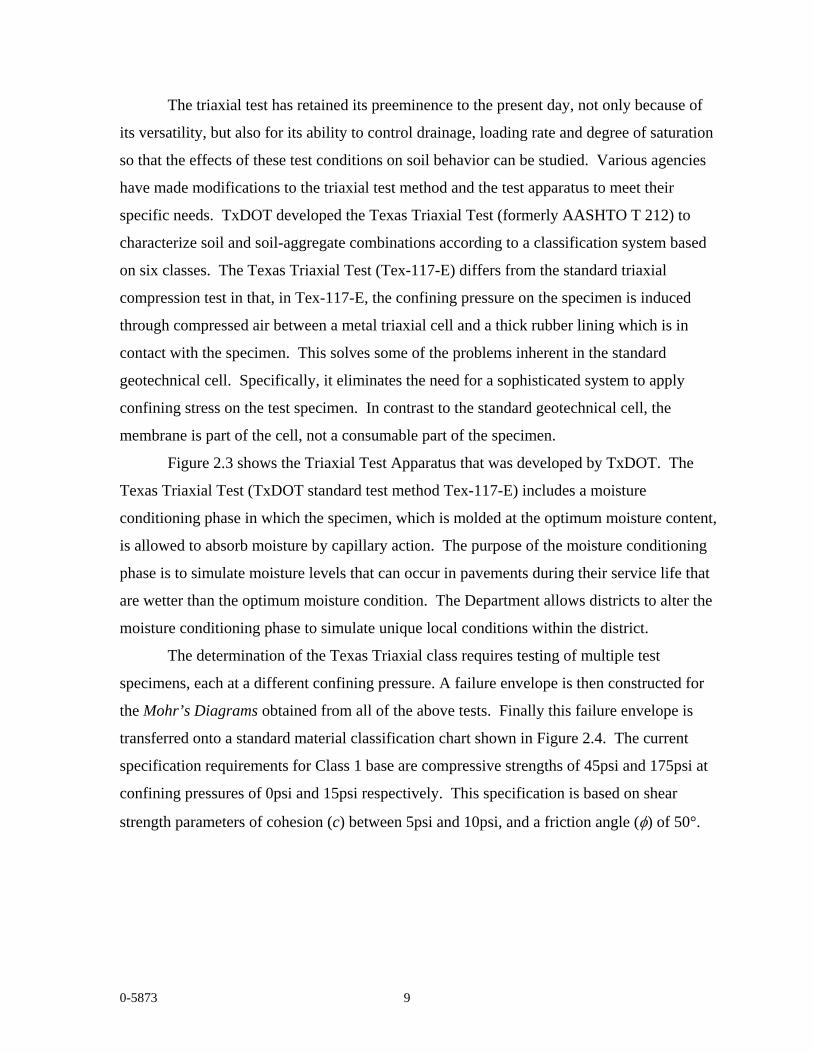
Figure 2.3 shows the Triaxial Test Apparatus that was developed by TxDOT. The
Texas Triaxial Test (TxDOT standard test method Tex-117-E) includes a moisture
conditioning phase in which the specimen, which is molded at the optimum moisture content,
is allowed to absorb moisture by capillary action. The purpose of the moisture conditioning
phase is to simulate moisture levels that can occur in pavements during their service life that
are wetter than the optimum moisture condition. The Department allows districts to alter the
moisture conditioning phase to simulate unique local conditions within the district.
The determination of the Texas Triaxial class requires testing of multiple test
specimens, each at a different confining pressure. A failure envelope is then constructed for
the Mohr’s Diagrams obtained from all of the above tests. Finally this failure envelope is
transferred onto a standard material classification chart shown in Figure 2.4. The current
specification requirements for Class 1 base are compressive strengths of 45psi and 175psi at
confining pressures of 0psi and 15psi respectively. This specification is based on shear
strength parameters of cohesion (c) between 5psi and 10psi, and a friction angle (φ) of 50°.

0-5873 10
Figure 2.3 TxDOT Triaxial Apparatus
The TxDOT test device has now been replaced with a more modern triaxial system in
which control of the hydraulics and sensory is accomplished through the use of the software,
MTRX, that was developed at the Texas Transportation Institute (TTI) for TxDOT.
As mentioned in Chapter1, two of the major shortcomings in the Texas Triaxial Test
procedure are (a) longer time required to perform the test and the necessary pre-requisite
steps (such as moisture-density, moisture conditioning etc), and (b) the high degree of
variability associated with test results. In addition, Yoder and Witzcak (1975) pointed out
that a disadvantage of the Texas Triaxial procedure is the amount of friction that exists
between rubber membrane and the chamber wall. This friction could lead to inflated axial
stress value at failure. The Texas Triaxial Test was replaced in the 1986 AASHTO design
guide by repeated load triaxial test.

0-5873 11
Figure 2.4 Material Classification Chart for Texas Triaxial Test Result
Wet Ball Mill Test
The Wet Ball Mill test (Tex-116-E) is a standard procedure used by TxDOT to
determine the resistance of aggregate particles in flexible base material to disintegration in
the presence of water. The test provides a measure of the ability of the material to withstand
degradation in the road base and detects undesirably soft aggregate. This test furnishes
valuable supplementary data pertaining to the quality of the aggregate in flexible base
material. According to Tex-116-E, this test is more reliable than the Los Angeles abrasion
test in evaluating the resistance to degradation of aggregate in base materials.
In Tex-116-E, aggregate samples are placed in a stainless steel jar with steel charge
(balls) and water, and subjected to a defined rate of revolutions for a period of time. The
abrasive conditions in the steel jar mimic the harsh conditions that the aggregates face in
0-5873 12
pavements. The properties of the aggregates are measured before and after the test, which
reflects the potential of the aggregate for successful performance in the field.
It may be used either to assess source rock type or the ripped rock product from the
softer source rock type. Caution must be exercised when using this test to compare the
qualities of different rocks because the test results can be greatly influenced by the sizing of
grains which form the rock. In other words, some coarse-grained sandstone may degrade
completely during the test cycles but the particles so formed may not pass the nominated test
sieve upon which degradation is assessed. In the specification, different test values are
therefore specified for arenaceous (sandstone) and argillaceous (mudstone) rock types which
are to be crushed and used for Class 3 subbase.
Tube Suction Test
It is quite common to assign a strength rating to a soil material without giving due
consideration to its sensitivity to in-situ moisture content. Moisture ingress into a pavement
is a primary cause of pavement damage. The degree to which moisture ingress degrades the
performance of flexible base plays a key role in the performance of the pavement. Research
has demonstrated that moisture susceptibility is related to both matric and osmotic suction of
granular aggregates. Matric suction is mainly responsible for the capillary phenomenon in
the aggregate base layers, and osmotic suction represents the potential to develop suction due
to differences in salt concentrations within the aggregate matrix. It is the amount of unbound
water in the base that influences its engineering properties that include load carrying capacity
and resistance to freeze-thaw cycling. The amount of unbound water that exists within an
aggregate base has a direct bearing on its dielectric constant. In the tube suction test, the
asymptotic value of the dielectric constant is measured at the end of 10-day capillary wetting
period and is used to assess the resistance of that material to moisture-induced degradation.
Based on the results of the test, the flexible base materials are ranked as excellent, good,
marginal, poor etc.
Pavement base layers constructed with moisture susceptible aggregate are prone to
rapid development of permanent deformation during wet weather and during periods of
freeze-thaw. Texas began using the tube suction test (TST) in a trial capacity in 2001, and it
is now included in the standard TxDOT specifications. The TST was developed by

0-5873 13
Saarenketo and Scullion (1996) at the Texas Transportation Institute (TTI) to investigate the
suction properties of various base course aggregates, and the test method has been further
refined during the period from 1996 to 2000 in a cooperative effort between the Finnish
National Road Administration and TTI [5]. In this test compacted specimens are soaked by
capillary action in the laboratory for a period of 10 days. The surface dielectric value (DEV)
is measured on a regular basis to assess the rate at which certain milestones relating to
moisture infiltration are reached. A lower DEV is likely to result in better performance of
the aggregate base material. Findings from the above research suggest that aggregate base
material with dielectric values less than 10 may be ranked as neither moisture nor frost
susceptible [6]. As this test is an indicator of the behavior of a material in a certain
environmental setting, the generalization of such a specification is not recommended.
NCHRP (2000) adopted the DEV criteria of less than 10 for good material, 10 to 16 for fair
material, and more than 16 for poor material. It was found that the classification of TST
correlates well with field performance of known aggregate bases. Adek PercometerTM is
used in this test procedure to measure the dielectric values of specimens.
During TST, aggregate base material samples are compacted at optimum moisture
using a gyratory compactor and extruded into a 12-inches high and 6-inches diameter plastic
tube. The height of the sample should be 180 to 200 mm. After compaction, a perforated
cover is placed at the bottom of each tube, and the samples are dried in an oven at 45 °C until
no significant changes are observed in their weight. After oven drying, the samples are
allowed to cool to room temperature for at least two days. When the specimen temperature is
stabilized, the samples are placed on a dish containing de-ionized water to a height of
approximately 20 mm. The first measurements of the dielectric constant and electrical
conductivity values are taken before placing the tube samples into the water. Once in the
water, measurements are taken at two-hour intervals during the first day, in addition to an
initial reading which should be taken a half-hour after placing the tube samples in the water.
From the second day on, only one measurement is required (in the morning) per day until the
weight of the samples and the dielectric values become constant. The weight of the tube
sample is measured in connection with every dielectric value measurement. Grain size,
surface water content (2 inches deep), specific density and other required parameters are
measured from the samples after the test.
0-5873 14
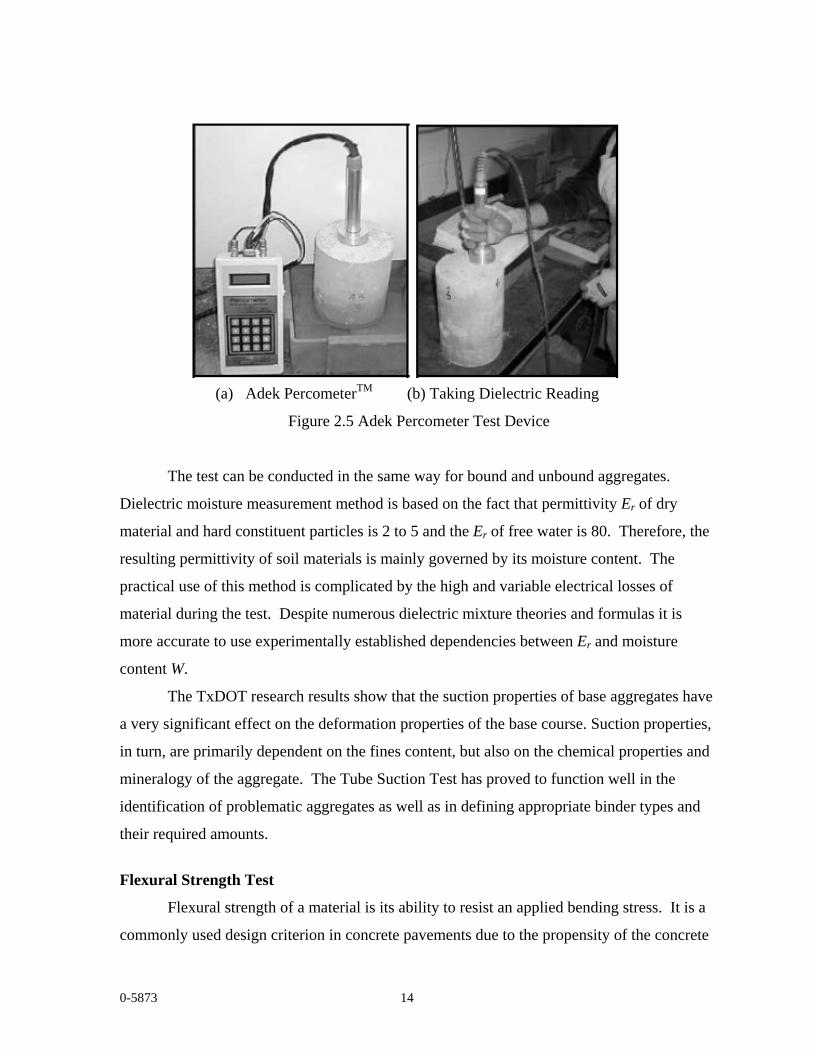
(a) Adek PercometerTM (b) Taking Dielectric Reading
Figure 2.5 Adek Percometer Test Device
The test can be conducted in the same way for bound and unbound aggregates.
Dielectric moisture measurement method is based on the fact that permittivity Er of dry
material and hard constituent particles is 2 to 5 and the Er of free water is 80. Therefore, the
resulting permittivity of soil materials is mainly governed by its moisture content. The
practical use of this method is complicated by the high and variable electrical losses of
material during the test. Despite numerous dielectric mixture theories and formulas it is
more accurate to use experimentally established dependencies between Er and moisture
content W.
The TxDOT research results show that the suction properties of base aggregates have
a very significant effect on the deformation properties of the base course. Suction properties,
in turn, are primarily dependent on the fines content, but also on the chemical properties and
mineralogy of the aggregate. The Tube Suction Test has proved to function well in the
identification of problematic aggregates as well as in defining appropriate binder types and
their required amounts.
Flexural Strength Test
Flexural strength of a material is its ability to resist an applied bending stress. It is a
commonly used design criterion in concrete pavements due to the propensity of the concrete

0-5873 15
slab to bend, or ‘flex’ under load. Bending is a phenomenon that is not limited to concrete
pavements. Anytime a stiffer pavement layer is supported on a weaker layer, which is
typically the case with pavement structures, the material above is subjected to flexure. The
extent of this flexure depends on the ratio between the moduli of the two layers. Therefore,
determination of flexural strength is frequently necessary as part of the design of pavements.
TxDOT and other highway agencies have long recognized the need to determine the
strength of soils through a flexural method. A mechanistic-empirical method that had been
proposed by the National Lime Association for lime stabilized materials emphasizes the
value of flexural test results in pavement design. However, they have concluded that
generating such data is difficult, too time consuming and not cost effective [7]. The Federal
Highway Administration has published documents that relate to the benefit of stabilization of
flexible base layers with a variety of pozzolanic agents such as cement, lime, and fly ash. It
is stated that, due to the nature of a stabilized layer in a flexible pavement structure, a semi-
rigid course within a structure might be better quantified by flexural testing [8].
The test methods that are currently in use for determining flexural strength of
pavement materials primarily target those materials that are considered rigid or semi-rigid.
Examples of such test procedures are AASHTO T 97-97 (or ASTM C 78-94) for flexural
testing of concrete beams under third-point loading, AASHTO T 177-97 (or ASTM C 293-
94) for flexural testing of concrete beams under center-point loading and ASTM D 1632 for
testing soil-cement mixtures under third point loading [9, 10, 11].
The procedure for making and curing test specimens to be used in ASTM D 1635 is
outlined in ASTM D 1632 [12]. This ASTM standard for making soil-cement specimens for
flexural strength tests is used primarily with soils having no more than 35 percent retained on
the No. 4 sieve and no more than 85 percent retained on the No.40 sieve. The specimen size
of 3in x 3in x 11.5in is used to obtain an appropriate failure pattern. Figure 2.6 shows the
loading configuration used in testing soil-cement beams for flexural strength according to
ASTM D 1635.
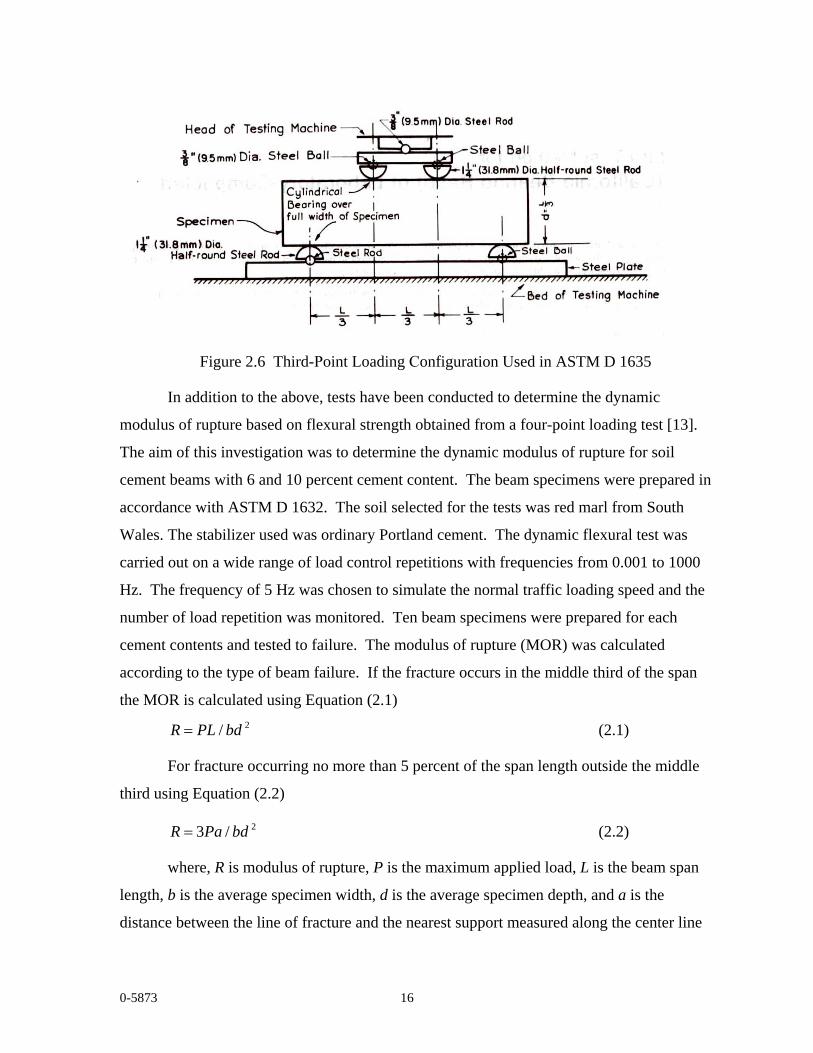
0-5873 16
Figure 2.6 Third-Point Loading Configuration Used in ASTM D 1635
In addition to the above, tests have been conducted to determine the dynamic
modulus of rupture based on flexural strength obtained from a four-point loading test [13].
The aim of this investigation was to determine the dynamic modulus of rupture for soil
cement beams with 6 and 10 percent cement content. The beam specimens were prepared in
accordance with ASTM D 1632. The soil selected for the tests was red marl from South
Wales. The stabilizer used was ordinary Portland cement. The dynamic flexural test was
carried out on a wide range of load control repetitions with frequencies from 0.001 to 1000
Hz. The frequency of 5 Hz was chosen to simulate the normal traffic loading speed and the
number of load repetition was monitored. Ten beam specimens were prepared for each
cement contents and tested to failure. The modulus of rupture (MOR) was calculated
according to the type of beam failure. If the fracture occurs in the middle third of the span
the MOR is calculated using Equation (2.1) 2/ bdPLR = (2.1)
For fracture occurring no more than 5 percent of the span length outside the middle
third using Equation (2.2)
2/3 bdPaR = (2.2)
where, R is modulus of rupture, P is the maximum applied load, L is the beam span
length, b is the average specimen width, d is the average specimen depth, and a is the
distance between the line of fracture and the nearest support measured along the center line
0-5873 17
of the bottom surface of the beam. Flexural fatigue test is easier to carry out but involves
uncertainty regarding the stress induced in the extreme fibers during the test.
The base binder flexometer developed by Michael Merrick works on the same
principles as described above. It can be used to conduct flexural strength of beams made
using the base, subbase or subgrade material that passes the #40 sieve (i.e. binder portion).
In the case of flexible base material, this material is referred to as the binder. In the above
flexural-strength test, the load is applied to the top of a test beam that is the same size as the
bar linear shrinkage specimen (0.75″×0.75″x5”). The test is conducted under center point
loading. The failure load for the beam is recorded and the flexural strength is calculated as
follows.
2bdPaR = (2.3)
In Equation (2.3), R is the modulus of rupture, P is the maximum applied load, a is the
distance between the line of fracture and the nearest support measured along the center line
of the bottom surface of the beam, b is the average width of the specimen and d is the
average depth of specimen.
Values of modulus of rupture vary widely, depending on the base and subgrade
material used for testing. An approximate relationship between modulus of rupture and
compressive strength can be represented by the following formula:
100
'2Rf c = (2.4)
where, 'f is the compressive strength (in psi) and R is the modulus of rupture (in psi).


0-5873 18
CHAPTER 3
DEVELOPMENT OF THE CONCEPTUAL TEST PROCEDURE AND PROTOTYPE TEST DEVICE
DEVELOPMENT OF THE CONCEPTUAL TEST PROCEDURE
This chapter describes the work performed under two major tasks in research
project 0-5873. They are: (a) development of the conceptual test procedure, and (b)
development of the prototype test device. The first of these two research tasks
specifically dealt with the development of standardized methods for preparing test
specimens of base binder material, proper curing of test specimens and testing them
under flexural loading. Special emphasis was placed on the development of a test
procedure that overcomes the limitations encountered in the field implementation of the
existing Texas Triaxial Test procedure. Therefore, it is important that the new test
method meets the following requirements: (a) the test method should have a much
quicker turn around time than the triaxial test, (b) the test method must require less
material and involve less labor and, (c) the test method must produce results that are
repeatable and reproducible or, in other words, the variability associated with test results
must be low. Ideally, the test method must also produce results that correlate well with
those from the existing Texas Triaxial Test.
The base material may be considered as a composite material that consists of two
separate components, the aggregate matrix and the binder. The binder includes the
material that passes the #40 sieve while the aggregate matrix represents the material
component that is retained on the #40 sieve. The strength of the composite base material
is likely to be governed by many factors. Such factors may include particle gradation,
aggregate shape and form, mineralogy, binder-matrix interaction, binder-binder
interaction and the moisture level. The ultimate goal of this research is to examine the
correlation between the strength of the composite material (matrix and binder) tested in a
compressive manner and the strength of the binder tested under flexural loading
conditions. At the quarry where the base material is produced, the material is crushed to
generate a gradation that is suitable for roadway base applications. The fines generated
during the crushing process are of the same mineralogy as that of the coarse aggregate

0-5873 19
portion of the base material. Thus, it is reasonable to expect that some correlation
between the strength of the composite and that of the binder would exist.
The test device that was developed in this research for flexural testing of base and
subbase materials is referred to as the Base Binder Flexometer. The test specimen used
in this test procedure consists of a beam that can be prepared using the widely available
Bar Linear Shrinkage mold. Subsequent sections in this chapter describe various phases
of test procedure development in detail. The specific aspects that are discussed include
the following:
a) Choice of suitable test specimen dimensions
b) Determination of the optimum mixing moisture content
c) Procedure for sample consolidation
d) Sample curing procedures
e) Procedure for flexural testing of specimen
Choice of Suitable Test Specimen Dimensions
Factors that were considered in the selection of test specimen size included:
(a) stability of the test specimen during handling and loading, (b) ability to produce data
with good resolution and (c) the quantity of material needed for test specimen
preparation.
Figure 3.1 is a typical bending moment diagram for a beam specimen that is
supported at either end and subjected to a point load in the middle of the specimen. The
equation for moment shows that the length of the specimen has a large impact of the
magnitude and distribution of stresses near the center of the specimen. Shortening the
bar increases the rate at which stresses increase as one moves towards the center of the
test specimen while lengthening it provides a more gradual change. A gradual change in
the bending moment and bottom fiber tensile stresses are more desirable. Moreover, a
shorter test specimen would require a higher point load to bring the bottom fiber tensile
stresses to its limiting (i.e. failure) value. This, in turn, will require a test apparatus that
can apply larger force. This can be achieved but usually, the higher load capacity comes
at the expense of sensitivity.

0-5873 20
Figure 3.1. Bending Diagram for 3-Point Loading of the Beam Specimen
On the other hand, a test specimen that is too long and slender will have its own
limitations. Such a test specimen will be less stable during handling. More importantly,
it will not allow the rupture load to be determined with good resolution. Ideally, the test
should be capable of measuring small changes in strength between “strong” and “weak”
materials. This is especially important in this application because the strength range
between a strong and weak material may not be very large. If the load range of the test
device varies from 0-5.0lb, then the test must be designed so that the entire load range of
the equipment is utilized. A beam specimen that is too long, i.e. longer than 6-in, would
not allow this to be accomplished. A specimen length of 5-in was selected based on all
of the above requirements. A specimen of 5in in length and ¾” square cross section can
be prepared easily using the bar linear shrinkage mold. The specimen length-loading
characteristics relationship is discussed in greater detail later in this chapter under the
heading “development of the prototype test apparatus.”
Secondly, it must be recalled that one of the objectives of this research was to
develop a test method that can be performed using a small quantity of material so that the
time and labor required for material sampling, processing and testing can be greatly
reduced. A larger test specimen could potentially nullify this benefit. The currently used
Texas Triaxial Test requires seven to ten 50-lb sacks of material. The mass of a 5in (L)
x ¾-in (H) x ¾-in (W) test specimen will be approximately 80-100 grams. A typical test

0-5873 21
set consists of 24 to 48 specimens, or 2000 to 5000 grams of material passing the No. 40
sieve. Texas Standard Specification Item 247 specifies that base material consist of a
composite material with possible 30 to 50 percent passing the 40 sieve. If the material
consisted of 30% passing and a sack of 50 lb collected, that would be approximately 15
lb of binder, or 7000 grams. This quantity is more than sufficient.
Figure 3.2. A Sample of Oven Dried Crushed Limestone Material
Determination of the Optimum Mixing Moisture Content
Sample preparation at the proper mixing moisture content is very important in
order to obtain test specimens that maintain their integrity during testing and yield
reliable flexural strength data. If the moisture content is too low, the workability of the
mix will be poor and the material would not get compacted into the mold as a
homogeneous mass that is free of voids and other defects. On other hand, if the water
content is too high, the excess moisture will rise to the surface during sample placement
in the mold. Such a sample will be very weak and will likely develop shrinkage cracks
upon drying.
In this research, the optimum mixing moisture content was determined by mixing
each material at a range of water contents slightly above and below the apparent optimum
value. For each material tested three specimens were prepared. The first specimen was
0-5873 22
mixed with water until the material workability seems slightly less than desirable. The
second specimen was mixed at higher water content to achieve somewhat better
workability. The third specimen in the set was mixed such that the material is more
workable than needed. This procedure provides a range of moisture contents that are
from the driest to wettest possible conditions for mixing. The observations made during
sample preparation and testing was used to determine the optimum value for mixing
water content.
The mixing water contents obtained in the above manner were then correlated
with other soil parameters such as LL, PI, minus #40, OMC, Maximum dry density. The
objective of this exercise was to develop a “Mixing Moisture Content Model” that would
eliminate the need for a trial-and-error approach in future testing. The mixing moisture
model that has been established with data collected is shown in Figure 3.3.
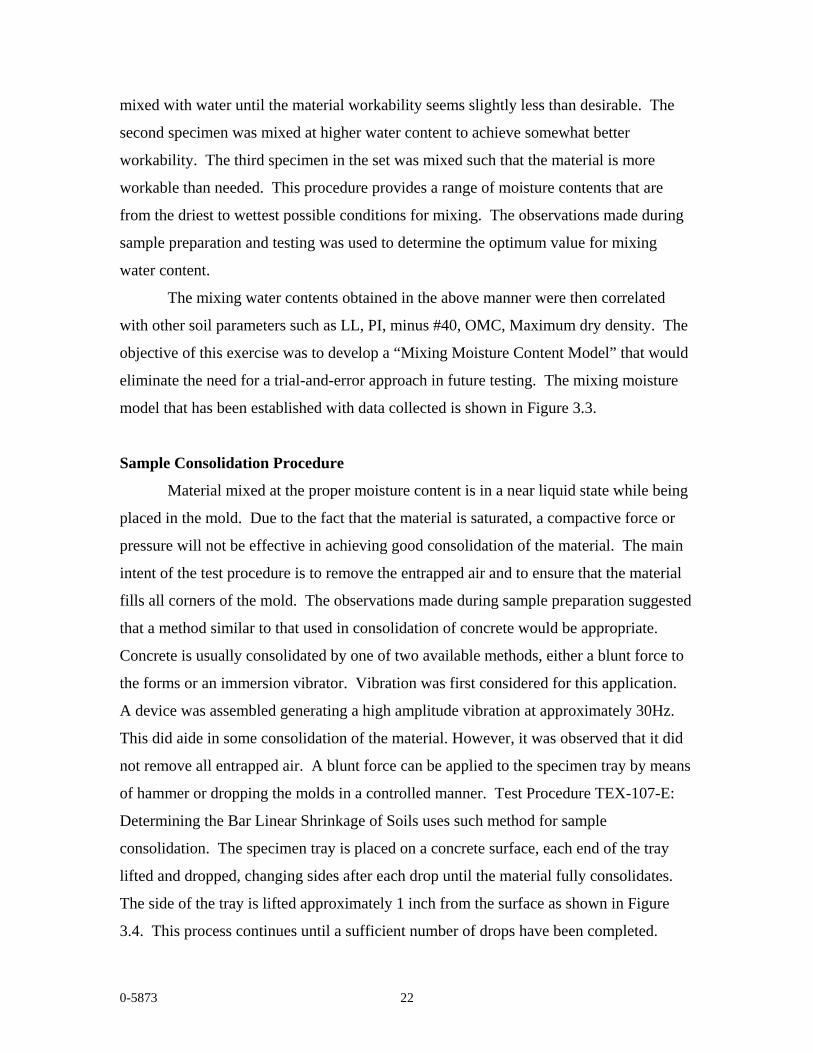
Sample Consolidation Procedure
Material mixed at the proper moisture content is in a near liquid state while being
placed in the mold. Due to the fact that the material is saturated, a compactive force or
pressure will not be effective in achieving good consolidation of the material. The main
intent of the test procedure is to remove the entrapped air and to ensure that the material
fills all corners of the mold. The observations made during sample preparation suggested
that a method similar to that used in consolidation of concrete would be appropriate.
Concrete is usually consolidated by one of two available methods, either a blunt force to
the forms or an immersion vibrator. Vibration was first considered for this application.
A device was assembled generating a high amplitude vibration at approximately 30Hz.
This did aide in some consolidation of the material. However, it was observed that it did
not remove all entrapped air. A blunt force can be applied to the specimen tray by means
of hammer or dropping the molds in a controlled manner. Test Procedure TEX-107-E:
Determining the Bar Linear Shrinkage of Soils uses such method for sample
consolidation. The specimen tray is placed on a concrete surface, each end of the tray
lifted and dropped, changing sides after each drop until the material fully consolidates.
The side of the tray is lifted approximately 1 inch from the surface as shown in Figure
3.4. This process continues until a sufficient number of drops have been completed.

0-5873 23
15
20
25
30
35
40
45
50
55
0.10 0.15 0.20 0.25 0.30 0.35
Mix
ing
Mo
istu
re (
% )
Ratio ~ LL/ODD
Mixing Moister Determined in Lab
Trend Line of Relationship
Upper Limit (+2%)
Lower Limit (-2%)
Prater, 33%
Caddell Pit, 44.2%
Beaumont, 20%
Cedar Creek Stone, 26.1%
Tabasco Pit, 26%
Higgembothem, 27%
Ediminston, 19%Beckmann, 22.6%
Bean, 24%Hunter, 21%
Corpus, 24%
Figure 3.3 Mixing Moisture Model
Figure 3.4 Sample Consolidation by Lifting One Side of the Tray and Dropping it on Hard Surface
0-5873 24
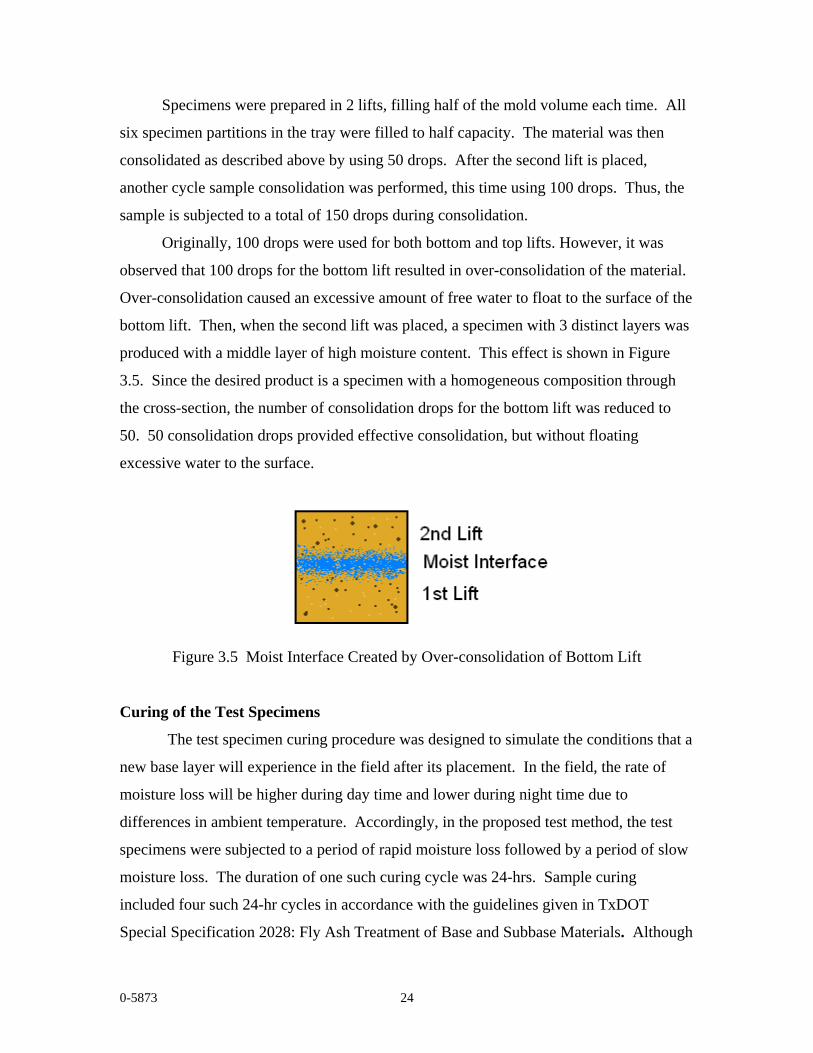
Specimens were prepared in 2 lifts, filling half of the mold volume each time. All
six specimen partitions in the tray were filled to half capacity. The material was then
consolidated as described above by using 50 drops. After the second lift is placed,
another cycle sample consolidation was performed, this time using 100 drops. Thus, the
sample is subjected to a total of 150 drops during consolidation.
Originally, 100 drops were used for both bottom and top lifts. However, it was
observed that 100 drops for the bottom lift resulted in over-consolidation of the material.
Over-consolidation caused an excessive amount of free water to float to the surface of the
bottom lift. Then, when the second lift was placed, a specimen with 3 distinct layers was
produced with a middle layer of high moisture content. This effect is shown in Figure
3.5. Since the desired product is a specimen with a homogeneous composition through
the cross-section, the number of consolidation drops for the bottom lift was reduced to
50. 50 consolidation drops provided effective consolidation, but without floating
excessive water to the surface.
Figure 3.5 Moist Interface Created by Over-consolidation of Bottom Lift
Curing of the Test Specimens
The test specimen curing procedure was designed to simulate the conditions that a
new base layer will experience in the field after its placement. In the field, the rate of
moisture loss will be higher during day time and lower during night time due to
differences in ambient temperature. Accordingly, in the proposed test method, the test
specimens were subjected to a period of rapid moisture loss followed by a period of slow
moisture loss. The duration of one such curing cycle was 24-hrs. Sample curing
included four such 24-hr cycles in accordance with the guidelines given in TxDOT
Special Specification 2028: Fly Ash Treatment of Base and Subbase Materials. Although

0-5873 25
the material used in test procedure development did not include any modifiers, the
expectation was that the same test procedure will be used for modified base materials as
well. Therefore, a 4-day curing process was initially adopted so that a uniform test
procedure could be used for all material categories. This chapter describes the initial test
procedure involving 4-day curing of the test specimens. However, it must be noted that,
this research also examined a shorter version of the test, called the accelerated flexometer
test. A comparison of the data collected from the two versions of the flexometer can be
found in Chapter 5.
The curing method implemented utilizes a small oven as a curing chamber with
scheduled oven cycles every 12 hours. Specimens created for flexural testing will need
to be able to survive the 4 day curing process without premature cracking. The oven
temperatures proposed allow moisture release at a controlled rate thus avoiding cracking
of the test specimens. Similarly, the moisture loss should not be too slow because that
would greatly reduce the measured flexural strength.
During the 4 day curing, specimens are subjected to 4 oven cycles, each cycle
lasting 24 hours. The first cycle begins immediately after placing new specimens in the
curing oven. The first cycle is designed to cause a rapid decrease in the moisture content
of the specimen and accordingly, the test specimens are kept at 100ºF for 1 hour.
Subsequently, the heating element is turned off. The second, third, and fourth cycles
have been established to provide a peak temperature of 90ºF in 30 minutes. At the peak,
the oven heating element is turned off but air flow continues for 15 more minutes. The
intent of this process is to reduce the moisture content in a pattern that is similar to daily
heating and cooling due to the rise and fall of the sun in the natural environment. The
oven air flow and heating was introduced to reduce the moisture content prior to load
testing the specimens. The recommended curing procedure is summarized in Table 3.1.

0-5873 26
Table 3.1 Details of the Curing Procedure
Day Oven Cycle Duration
Temp. (F) Description
1 1 hour 100 100 degrees entire duration
2 45 minutes 90 90 degrees @ 30 minutes, 45 minutes air flow
3 45 minutes 90 degrees @ 30 minutes, 45 minutes air flow
4 45 minutes 90 degrees @ 30 minutes, 45 minutes air flow
End of day 4 Until Testing Completed
100 degrees continuous air flow until testing completed
Flexural Testing of Specimens
Specimen testing begins at the end of 4 days of curing. At the end of the curing
period, the moisture contents of the specimens are found to be several percentage points
above the optimum moisture contents (OMCs) of the material as determined by TEX-
113-E Laboratory Compaction Characteristics and Moisture-Density Relationship of
Base Materials. Usually, specimens are found to be about 8% above OMC. This is
desired because, in the next step, test specimens are load tested at various moisture
contents as the specimens continue to dry out in the oven at 100ºF. By doing so, a
relationship between the flexural strength and the test moisture content can be
established. Figure 3.6 shows an example of such flexural strength-test moisture content
relationship. The strength of the material at Optimum Moisture Content (OMC) is
determined from the chart and reported as the flexometer strength.
In this plot, each line represents test specimens obtained from one tray. The six
test specimens contained in the tray are tested at different times as the materials dry out in
the oven. The moisture contents of each specimen at the time of testing cannot be
predetermined. Instead, they must be determined from the remnants of the ruptured beam
after it had been tested for flexometer strength Multiple trays serve as replicates of the
test and the Merrick Flexometer strength values obtained for all 3 or 4 trays are averaged
to get a more reliable estimate.

0-5873 27
Figure 3.6. Flexural Strength versus Test Moisture Content Relationship
The following is a comparison between the Texas Triaxial Test and the base
binder flexometer test in terms of quantity of material, labor and time required for the two
tests. Also shown are the initial estimates for the test result variance. A standardized
Merrick flexometer test procedure that has been developed according to the format used
in TxDOT’s Manual of Test Procedures is found in Appendix A of this report.
Table 3.2. Comparison between Texas Triaxial and Base Binder Flexometer Test Procedures
Test Method Duration Material (lb) Labor Variance
Texas Triaxial 3 week minimum 400 minimum High +/- 10 psi Avg
Merrick Flexometer
5 days (with 4-day curing)
100 maximum Low +/- 5 psi Max

0-5873 28
DEVELOPMENT OF THE PROTOTYPE LOADING DEVICE
This section of Chapter 3 describes the work performed under Task No.3 of the
research project 0-5873; Development of the Prototype Flexometer Device. The loading
device developed for the proposed test procedure was designed to be inexpensive yet
sufficiently accurate and reliable for use in the proposed material testing application.
Cost effectiveness is an important consideration because the objective is to develop a test
device that can be made available to all engineering offices and field labs.
The first device developed was a simple frame to support a 5-in test specimen.
Loading of the specimens was accomplished by adding weight to a bucket hanging from
the center of the specimen (See Figure 1 below). When failure of the specimen occurred,
the mass added to the bucket was measured and then the flexural strength was calculated.
Although test results typically displayed a high variance, the testing results showed that
the proposed concept has merit and deserved further evaluation. The initial testing also
provided pertinent data such as typical flexural strengths and the general range of the load
that needs to be applied.
Figure 3.7 Original Plan for Testing the Proposed Concept
The device developed in the next phase is shown in Figure 3.8. This system was
much more sophisticated. It provided stable loading through the use of a rotating cam
that in turn caused direct displacement of a compression spring. The exact cam profile
and spring stiffness were known. The displacement provided by the cam multiplied by
the spring stiffness is the load applied to the specimen. The device was computer

0-5873 29
controlled to ensure a steady, repeatable loading rate. This device provided the
framework for the development of the project prototype described in this chapter. The
next section describes the general guidelines and conditions used to developed the project
prototype.
Figure 3.8 Loading Device with Cam and Spring Mechanism
Loading Method
Loading methods considered in the development of the prototype included:
counter-weight systems, hydraulic systems, linear worm gears, and cams. These options
were evaluated based on the following factors:
a) Resolution
b) Ability to control the loading rate
c) Amenability for computer automation
d) Cost

0-5873 30
Hydraulic systems were ruled out in very early stages due to the complexity and
instrumentation involved. Currently approved laboratory equipment that utilizes such
systems are very expensive. Examples of such equipment are the PG Asphalt Bending
Beam Rheometer, concrete cylinder testing equipment, and new generation triaxial test
equipment. Although loading systems that utilize counter-weights or worm gears can be
automated by logic circuitry, these systems are not ideally suited for applications that
require slow loading rates or high resolution.
Stepper motors are a special class of DC motors that move in a precise quantum
manner. They are used in printers, disk drives, and computer hard drives because of their
precise tolerances. As the name implies, stepper motors move one step at a time with
cycles of current applied to the motor coils. The motor type used in this prototype uses a
bipolar stepper motor. With each pulse of current delivered in sequence, the motor
rotates exactly 1.8 degrees. Thus, the motor employed requires 200 steps for 1 complete
rotation. Due to these small movements, a cam designed specifically for this situation in
combination with the correct compression spring could produce small variations in load
yielding a high resolution. The stepping speed is dependent of the microprocessor
system, not a rotational speed of the motor. These types of DC motors are generally
inexpensive and come in a wide range of torque capacities.
Cam/Spring Loading Mechanism
Figure 3.9 illustrates the loading method utilized in the project prototype. The
cam reaches full deflection at 180 degrees or 100 steps. By rotating the cam at 1 step per
second, a semi-static loading condition is achieved. No benefit was observed by
increasing the time delay to decrease the loading rate. Increasing the loading rate faster
than 1 step/second increased test resulted in higher levels of variability that was beyond
acceptable levels. The change in spring height results in a net change in strength of
approximately .05 lbs per step. The position of the stepper motor and thus the load is
controlled precisely by computer controller through an interface board built between the
TTL voltage levels of the IBM PC Parallel Port and the voltage and current drain of the
motor.

0-5873 31
The cam loading system proved to be a very effective system to apply load to the
specimens. Yet it can be built quite inexpensively. The system of a DC motor directly
connected to a cam designed for the system provided good resolution and repeatable test
results. Both prototypes using the loading method used a LV231 motor. The peak static
torque is between 60 and 80 in-lb depending upon the voltage/current relationship. The
LV231 is a fairly inexpensive and readily available motor size.
Figure 3.9 Loading System Used in the Current Prototype
Testing of flexible base binder material in this manner indicated that the material
flexural strength would be at least 10 psi but not greater than 80 psi. Although 80 psi is
very unusual, it is possible. A symbiotic relationship exists between the specimen length
and the design of the cam/spring combination.
Specimen Size and Loading System
The loading system built into the flexometer is symbiotic with the size selected
for the test specimen. The size of the specimen has a direct impact on the design of the
loading system. Specimen size proportionately affects the motor strength, cam size, and
spring stiffness. Therefore, if the specimen size were to change, the loading system
needs to adapt accordingly. In order to keep the device cost at a minimum, the
Flexometer has been designed for a specific size specimen. The following requirements
must be met by any loading system used.

0-5873 32
1) The test device must be capable of providing a load that meets or exceeds
the maximum anticipated material strength
2) The test device should be designed so that it would utilize it full load
spectrum of the machine (0 to 5 lb)
3) The test device should have high enough resolution so that even small
changes in strength can be detected (0.05 lb)
Figure 3.10 illustrates the relationship between specimen length and the above
design criteria for a test specimen with ¾ square cross-section. A 6-in long specimen
would reach 80 psi at 3 lbs. This would cause a reduction in the resolution of the load
measured. A 2-in specimen would require a load of at least 9 lb to produce a strength of
80 psi. This would require a larger motor producing more torque. By viewing the graph,
a specimen 4-in to 5-in long would be optimum in terms of meeting the specified design
criteria. When this specimen length is used, the load capacity of the machine is fully
utilized. At the same time, there would be adequate tolerance so that there is no risk in
sample strength exceeding load capacity of the machine. The minimum strength
expected will be reached at small loads and an average strength of 45 psi is obtained at
approximately half of the available load force. Since most of the TxDOT area offices do
have linear shrinkage molds of 5-in length, a specimen length of 5-in was chosen.
However the end supports are 4 ½-in apart. This is due to the fact that most materials
experience some shrinkage during specimen curing. In order to ensure that all materials
would rest on the supports despite the amount of shrinkage, the distance of 4 ½-in is
chosen for the supports.
Power Supply
Due to the current drawn by the DC motor, 2 different power supplies are used in
the operation of the flexometer. One power supply provides 12 volts at 500 milliamps for
the circuitry of the interface. The other power supply provides a maximum of 24 volts up
to 2 amps for the motor. The stepper motor has the capacity to function up to 75 volts
which provides more torque. But the relays that control the current flow to the motor

0-5873 33
coils have contacts rated at 24 volts 2 amps maximum. This could be increased but the
design of the control circuit would then be significantly more complicated.
Figure 3.10 Relationship between Applied Load and Flexural Strength
for Selected Lengths of Test Specimens
The current relay coils trigger at 5 volts. Increasing the contact voltage to 50 or
75 volts would have 12 to 20 coil voltages respectively. Since adequate torque is
obtained by operating at a voltage at or less than 24 volts, the interface circuit continues
to use the 24 volt relays. Operating the system at 24 volts and 2 amps, the motor has not
exceeded the manufacturer’s recommended maximum temperature of 175 degrees °F.
Under continuous use, the motor runs at a temperature of 125 degrees. The final
prototype loading device developed in Task 3 is shown in Figure 3.11. Figure 3.12
shows schematic views of the front and end elevations of the new test device.

0-5873 34
Figure 3.11 Final Prototype Loading Device

0-5873 35
Figure 3.12. Schematic Views of the Finished Prototype Test Device
End Elevation Front Elevation

0-5873 36
CHAPTER 4
MATERIAL SAMPLING AND TESTING OVERVIEW
The primary goal of this research study was to determine the suitability of the
proposed base binder flexometer strength test as a future quality control test for base and
subbase materials used in TxDOT construction projects. The suitability of the test method
would depend on following important factors: (a) ability to produce reliable and repeatable
results, (b) quantity of material needed and testing time, and (c) strength of the correlation
that exists between flexometer strength and the currently used Texas triaxial strength. To
evaluate the new test method with respect to the above, it was necessary to sample and test a
fairly broad range of base and subbase materials. This chapter describes the material source
selection and sampling process as well as the laboratory test program.
MATERIAL SAMPLING
Source Selection
As a first step, all 25 TxDOT districts were contacted and then, with the assistance
from district laboratory engineers and supervisors, material sources that met the project
requirements were identified. The primary criteria used in the selection of candidate sources
of material were as follows:
(a) The selected materials were should represent the broad range of materials that are
commonly encountered in flexible base, treated base/subgrade in TxDOT roadway
construction projects. This is an important consideration because the proposed
research is expected to establish limits of applicability of flexometer test procedure
based on results from lab testing. The candidate materials have been sorted
according to mineralogical/lithological make up (crushed limestone, caliche, gravel,
sandstone etc), according to engineering properties (e.g. high/medium/low wet ball
mill values), sound materials (that easily meet flex base material specs) versus

0-5873 37
marginal materials (that require mixing with modifiers to meet spec requirements)
before making the final decisions with respect to their selection.
(b) Only those material sources designated as “active” were selected for this research
study. Those sources that did not have Texas Triaxial data could not be used for the
development of cross correlations between base binder flexural strength and Texas
triaxial strength but were used for the development of mixing moisture model during
the development of the flexometer test procedure as described in Chapter 3.
(c) Whenever possible, material was sampled from stockpiles that are designated for use
in specific roadway construction projects. This will allow comparison of materials’
laboratory performance against their field performance at a future time. However, it
should be noted that such laboratory versus field performance comparison was not
attempted as a part of this research study.
Sampling Procedure
All of the selected base materials were sampled from material stockpiles. Sampling
of the materials and making arrangements for their shipment was accomplished by TxDOT
district personnel. A total of 12 different TxDOT Districts participated in this process. They
provided samples from 19 different base materials sources. The participating districts and
base material sources included in this research study are shown in Figure 4.1.
All the district offices under TxDOT were contacted for material samples. Samples of
seventeen different materials were received from eleven districts. A majority of these
materials consisted of crushed limestone which is the most common flexible base and
subgrade material used in Texas. Some of the samples consisted of gravel and sand, and
some were pit run bases. Atterberg Limits, gradation, 0psi and 15psi triaxial test data and
compaction data was provided for most of the samples.
Each of the seventeen materials was tested for flexural strength using the prototype
base binder flexometer. Four sources that were available in sufficiently large quantity were
selected for testing using the intermediate and large size beams. Triaxial test data for 0psi

0-5873 38
Figure 4.1. Participating TxDOT Districts and Base Material Sources Sampled
confining pressure, as low as 25 was reported or some of the materials. These materials do
not meet the 0 psi triaxial strength requirement as stated in Tex-117-E. Such materials were
identified and subsequently be used for testing with modifiers like flyash or cement added to
them. Tables 4.1 and 4.2 list all 17 sources and the standard laboratory properties for each
source.

0-5873 39
Table 4.1 Properties of Flexible Base Material Sources Selected; Gradation and Atterberg Limits
Retained Retained Retained Retained Retained Retained Retained RetainedDistrict Pit Name CSJ Material Description PL LL PI 1 3/4'' 1 1/4'' 7/8'' 5/8'' 3/8'' # 4 # 10 # 40
Abilene Bean 157-9-1 Crushed Limestone 12 22 10 - - - - - - - -Abilene Vulcan/Blacklease Crushed Limestone 12 14 2 0.0 - - - - 47.0 - 80.7San Angelo Edminston C148-3-23 Crushed Limestone 18 26 8 0.0 9.0 21.0 31.0 57.0 57.0 68.0 80.0San Angelo CSJ/Turner 0555-05-018 Crushed Limestone 13 16 3 0.0 - - - - 60.7 - 79.8Brownwood Prater 1039-01-029 Crushed Limestone 21 28 7 2.3 - 21.9 29.6 40.4 51.6 - 73.7Brownwood Vulcan QC Crushed Limestone 12 14 2 0.0 - - - - 47.0 - 80.7Pharr * Tabasco Pit * 1802-01-031 Pit Run Base 18 24 6 - - - - 55.4 - 72.7San Antonio Beckmann Quarry QC Aggregate/sand mix 14 17 3 0.0 2.7 12.3 24.3 36.1 49.8 - 71.0Tyler * Cedar Creek Stone * 0197-06-028 Sand & Igneous Rock 22 27 5 0.0 - - - - 68.1 - 77.6San Antonio Hunter Pit various Crushed Limestone 17 13 4 0.0 - 20.8 - 49.1 61.4 - 78.2San Antonio Cemex, New Braun. various Crushed Limestone 12 16 4 0.0 - 18.5 - 47.4 - - 78.2Beaumont Vulcan/Sactun Mex Crushed Limestone 15 23 8 - - - - - - - -Corpus Christi Vulan/Yucatan Mexico 101-8-1 Crushed Igeneous BLS Method ** 5 0.0 - 18.9 - 53.8 67.2 - 81.9Waco Frost Pit Crushed Limestone 15 21 6 - - 59.7 - 77.1Dallas TXI Bridgeport 196-2-78 Crushed Limestone 14 21 7 0.0 - 15.1 - 43.6 60.2 - 81.4Tyler Broken Bow S&G 10-76-7 Sand & Gravel BLS Method ** 3 0.0 - 22.4 - 49.4 59.2 - 76.2El Paso Holman 75-1-20 Sand & Gravel BLS Method ** 5 0.0 - 14.0 - 36.0 49.0 - 78.0El Paso Jobe District Wide Crushed Limestone BLS Method ** 5 0.0 - - - - 49.0 - 79.0El Paso Wyert 0075-01-020 Sand & Gravel BLS Method ** 3 0.0 - 15.0 - 36.0 50.0 - 79.0Lubbock Reworked Base US 62/Floyd Reworked Base
* The binder portion of these materials is not of the same parent material as the aggregate portion. Therefore, the binder and matrix are composed of different minerology and origin.
** Bar Linear Shrinkage Method used to determine Plasticity Index
Atterberg Limits Gradation %

0-5873 40
Table 4.2 Properties of Flexible Base Material Sources Selected; Wet Ball Mill, Texas Triaxial, and Compaction Test Data
Optimum Maximum District Pit Name CSJ Material Description Value % Loss 0 psi 15 psi Moisture % Density(pcf)
Abilene Bean 157-9-1 Crushed Limestone 46.7 206.0 8 134.1Abilene Vulcan/Blacklease Crushed Limestone 33.0 12.0 28.6 191.9 5.7 145.1San Angelo Edminston C148-3-23 Crushed Limestone 34.0 14.0 45.0 177.0 7.1 138.6San Angelo CSJ/Turner 0555-05-018 Crushed Limestone 31.0 11.0Brownwood Prater 1039-01-029 Crushed Limestone 48.0 19.0 24.7 123.2 10.5 127.0Brownwood Vulcan QC Crushed Limestone 33.0 12.0 53.0 193.9 5.7 145.1Pharr * Tabasco Pit * 1802-01-031 Pit Run Base 35.0 N.R. 41.0 N.R. 8.7 128.7San Antonio Beckmann Quarry QC Aggregate/sand mix 39.0 10.0 47.2 176.2 6.3 134.7Tyler * Cedar Creek Stone * 0197-06-028 Sand & Igneous Rock 38.0 15.0 50.9 194.8 7.5 136.4San Antonio Hunter Pit various Crushed Limestone 35.0 15.0 50.3 244.4 6.1 141.8San Antonio Cemex, New Braun. various Crushed Limestone 32.0 11.0 70.3 253.8 6.0 140.3Beaumont Vulcan/Sactun Mexico Crushed Limestone 38.0 7.0 64.2 N.R. 8.7 129.2Corpus Christi Vulan/Yucatan Mexico 101-8-1 Crushed Igeneous 28.0 5.0 59.0 222.0 9.4 127.9Waco Frost Pit Crushed Limestone 33.0 6.0 27.5 198.3 7.6 134.0Dallas TXI Bridgeport 196-2-78 Crushed Limestone 21.0 5.0 43.3 190.1 5.8 138.2Tyler Broken Bow S&G 10-76-7 Sand & Gravel 32.0 7.0 24.7 205.0 5.4 141.1El Paso Holman 75-1-20 Sand & Gravel 39.0 18.0 46.1 147.6 7.7 136.5El Paso Jobe District Wide Crushed Limestone 27.0 5.0 50.2 142.9 7.4 135.0El Paso Wyert 0075-01-020 Sand & Gravel 37.0 17.0 46.2 137.9 6.9 135.7Lubbock Reworked Base US 62/Floyd Reworked Base
Wet Ball Mill Triaxial Compaction

0-5873 41
LABORATORY TESTING
Laboratory testing conducted in this research can be divided into two separate phases;
Phase I laboratory testing and Phase II laboratory testing.
Phase I Lab Test Program
In Phase I laboratory testing, all material sources sampled were tested using the
standard test procedure described in Chapter 3. This procedure, which is also outlined in
detail in Appendix A, used a 4-day curing period for all test specimens. The data collected
from Phase I testing were used to develop flexometer strength-Texas triaxial strength
correlations and to examine the repeatability of the flexometer test data.
Phase II Lab Test Program
Meanwhile, Phase II lab testing was designed to address specific issues or concerns
related to the current binder flexural strength test procedure. This test program can be
further divided into Phase II-A, II-B and II-C test programs based on the specific issue that
each test program was designed to investigate. The following sections describe each of these
lab test programs in detail.
Phase II-A Test Program: Effect of Test Specimen Size
The current base binder flexometer strength test utilizes small test specimens (length
5 inches and ¾ in square cross section) that are prepared with the standard bar linear
shrinkage molds. The material that is used in the preparation of these test specimens
consisted of the binder component (i.e. the minus No.40 component) of the base material.
The use of the small test specimen size significantly reduces the quantity of material needed
for testing as well as the labor involved. However, it has a major shortcoming in not being
able to test material that is representative of the material that is used in the field. Therefore,
Phase II-A lab test program investigated the possibility of developing a flexural strength test
method for larger test specimens. For this purpose, two other test specimen sizes were
considered. They were: (a) intermediate size specimens (length 8 inches and 1.5in square
cross section) and (b) large size specimens (length 12 inches and 3in square cross section).

0-5873 42
Figure 4.2 (a) below compares the 3 test specimens. The test specimen molds used for
intermediate and large size test specimens are shown in Figures 4.2 (b) and (c) respectively.
(a)
(b) (c)
Figure 4.2 Small, Intermediate and Large Sized Test Specimens used for Flexural Strength Testing; (a) Cured Test Specimens, (b) Molds Used for Making Intermediate Size Test
Specimens, (c) Mold Used for Making Large Size Test Specimens
As the size of the test specimen increased, the maximum particle size that could be
accommodated in the preparation of the sample could also be increased. Accordingly, the
intermediate size specimens were prepared using material passing No.4 sieve and large size

0-5873 43
specimens were made using material passing ½-in sieve. In addition, the test specimen
preparation procedures were adjusted as well. The most notable among the differences in
sample preparation procedures was the compaction energy used. Each test specimen size
used a specially designed compaction hammer. The hammer weight, drop height, number of
blows per lift and number of lifts were adjusted to suit particular gradation of material used
in each test specimen. Table 4.4 compares these test parameters. Figure 4.3 shows the
hammers used in the preparation of intermediate and large size specimens.
Table 4.4 Test Parameters Corresponding Intermediate and Large Size Specimen Testing
Intermediate Size Test Specimens
Large Size Test Specimens
Mold Size 1.5″x1.5″x8″ 3″x3″x12″ Max Particle Size No.4 Sieve ½-in sieve Weight of Hammer (lb) 4.0 10.0 Drop Height (in) 12 18 No of Lifts 2 2 Blows/Lift 25 50 Compaction Energy (ft-lb/in3) 11.1 13.9
Another significant observation that was made during the preparation of intermediate
and large size specimens was that these large samples could not be tested at moisture
contents near optimum values. At these moisture contents, the samples were found to be too
weak to remain intact during handling and to produce meaningful flexural strength values
from testing. Curing conditions for the samples were varied to determine the impact of the
curing temperature and the relative humidity on the flexural strength of the test specimens.
Based on the findings the decision was made to perform flexural strengths tests 3hrs, 5hrs
and 8hrs after sample molding.
The loading systems used in the flexural strength testing of the small, intermediate
and large size specimens were also different. The small size specimens were tested for their
flexural strength using the Base Binder Flexometer, a test apparatus that was specially
designed and built for this purpose. The intermediate size test specimens were tested using a
loading system called the Snapshot Testing Device (See Figure 4.4). Similar to the testing
performed on small size test specimens, center-point loading was used for intermediate size

0-5873 44
(a) (b)
Figure 4.3 Compaction Hammers Used in the Preparation of (a) Intermediate and (b) Large Size Test Specimens
Figure 4.4 Flexural Testing of Intermediate Size Specimens Using Snapshot Loading Device

0-5873 45
specimens as well. However, knife edge loading - rather than point loading - was used in the
case of intermediate size specimens. The loading rate used was 0.5 in/min and the load
applied was measured to ±0.02-lb accuracy. For large size test specimens were tested for
their flexural strength using a standard triaxial test load frame. Instead of the center point
loading used for small and intermediate size specimens, third point loading was used for
large size specimens. Figure 4.5 shows the above test set up.
(a)
(b)
Figure 4.5 Flexural Testing of Large Size Specimens: (a) Accessories Fabricated and Used for 3-Pint Loading, (b) Triaxial Loading Frame
0-5873 46
Phase II-B Test Program: Flexometer Testing with Accelerated Curing
As explained in Chapter 3, the standard flexometer test procedure used a 4-day curing
of the test specimen. The rationale behind the use of the 4-day curing time was that this
would allow the same test procedure to be used for both unmodified flexible base material
and marginal quality materials that are blended with lime, cement or flyash for strength
enhancement. Even though the 4-day curing is necessary when a material is blended with
additives to allow the pozzolonic reactions to take place, this long curing period is
unnecessary for unmodified materials. In fact, there is significant advantage in using a
shorter curing time because it significantly cuts down the turn around time for the test. The
focus of Phase II-B test program was investigate the feasibility of using a shorter curing time.
This test program included a series of tests in which samples were prepared and tested in
accordance with the standard flexometer test with the only exception that the curing was
reduced to a few hours. In this modified test procedure the test specimens, after being
molded, were placed in the curing chambers at 100ºF as before. Then they were taken out
periodically and weighed to monitor reduction in sample moisture content. By weighing the
sample trays, it was possible to determine when the specimens have reached the same range
of moisture contents that they had been tested in the original procedure. Flexural strength
testing was performed using the same identical procedure as before with the Base Binder
Flexometer.
Phase II-C Test Program: Validation of Flexometer Test Device
The prototype flexometer test device described in Chapter 3 does not make a direct
measurement of the load being applied on the test specimen. Instead, it uses a calibrated
loading spring for which the load-displacement relationship is known. Accordingly, the load
is determined in the following manner. The loading cam controls the compression of the
spring. The cam profile is known and therefore, as a first step, the compression of the spring
can be determined for a particular loading step. Then using the load-displacement
relationship and the known spring compression the load can be calculated. However, this
load calculation procedure is based one major assumption. It assumes that the deflection of
the beam at the loading point is negligibly small. In this research, Phase II-C Test Program
checked the validity of this assumption. For this purpose, a series of parallel tests were run

0-5873 47
on the same material using the flexometer test device and the Snapshot device describe in
Phase II-A. Then the results were compared to determine whether a significant error may
result from the assumption that beam deflection can be neglected.

0-5873 48
CHAPTER 5
DATA REVIEW AND ANALYSIS OVERVIEW
The data collected in Phase I and Phase II laboratory test programs are presented in
Appendix B of this report. In this chapter, the above data are reviewed and analyzed to reach
useful conclusions regarding the new base binder flexometer test procedure and flexural
strength data produced. The review begins with general trends observed in the flexural
strength data. Subsequent analyses examine the strength of the correlation that exists
between flexometer flexural strength and the Texas Triaxial strength as well as the
repeatability of the base binder flexometer test. The following sections describe the data
review and analysis procedures and the conclusions derived from such review.
REVIEW OF DATA COLLECTED IN PHASE I – LAB TEST PROGRAM
As described in Chapter 4, Phase I lab test program consisted of the base binder
flexometer testing of all 21 sources of base materials selected for this research study. These
tests used the original test procedure outlined in Appendix A. This test procedure uses 4-day
curing of test specimens. According to this procedure, typically 3 or 4 trays of test specimens
are prepared and cured from each material source. Each tray would consist of 6 test
specimens. Then 1 sample from each tray is taken out of the curing chamber and tested to
determine the flexural strength. After the flexural strength has been determined, the remnant
pieces of the ruptured test specimen are used to determine the moisture content of the
material at the time of testing. After some time has elapsed, the next set of specimens are
removed from the curing chamber and tested to determine flexural strength. Since these test
specimens have been subjected to a slightly longer curing time, the test moisture contents for
these are lower and the strengths measured are generally higher. Then these steps are
repeated for all the remaining test specimens with a short time interval between different sets.
When all test specimens have been tested for flexural strength, the data is plotted as shown in
Figure 5.1 to produce a flexural strength versus test moisture content plot.

0-5873 49
Figure 5.1 Flexural Strength versus Test Moisture Content Relationship San Antonio/Hunter Pit
Figure 5.2 Flexural Strength versus Test Moisture Content Relationship
El Paso/Jobe Pit

0-5873 50
The observed variation of the flexural strength with the sample moisture content
represents a trend that can be expected. As the moisture content decreases, the negative pore
water pressure (or suction) within the interstitial spaces of a fine grained soil increases. The
higher suction values lead to larger effective stresses within the material which, in turn, cause
the increase in material strength. The observed trend in flexural strength versus moisture
content, however, has important implications on the interpretation of test results. In other
words, the measured flexural strength value must be all reported at a pre-defined moisture
content. This research examined a number of different choices for defining the moisture
status of the specimen at which the flexural strength is reported. Among them were the
plastic limit, the optimum moisture content, and selected moisture contents on the wet side of
optimum. It was noticed that the choice of the test moisture content did not have any
significant impact on the final outcomes that were of interest, i.e. the strength of the
correlation between flexural strength and triaxial strength and the repeatability of the test
method. Consequently, all flexural strengths were reported at the optimum water content.
The following example illustrates the procedure used to obtain flexural strength from the test
data. Figure 5.3 shows the data obtained for material recovered from the Tabasco Pit in
Pharr District.
The general data trend in Figures 5.1, 5.2 and 5.3 can be represented by the following
equation:
⎟⎠⎞
⎜⎝⎛−+=
ccmbaf ..exp (5.1)
Where: f = flexural strength (psi)
m.c. = moisture content (%)
a, b, and c = constants determined through curve fit to data
Using the software, TableCurve the parameters corresponding to the best fit curve can
be obtained. For the data shown in Figure 5.3, the best fit parameters are as follows: a = -
16.7, b= 138.5, c= 13.89 and R2 = 0.89. The best fit curve is also shown in Figure 5.3. Now,
using the equation, the flexural strength corresponding to the optimum moisture content
(8.7%) can be determined.

0-5873 51
Figure 5.3 Determination of the Binder Flexural Strength for Material Recovered from
Tabasco Pit, Pharr District
The flexural strength values were obtained for all material sources using the
procedure described above. These values are listed in Table 5.1 below. Also, shown in this
table are the Texas Triaxial strength data for the material obtained from the same source and
same stockpile.
Data presented in Appendix B show that, in the case of some base materials, the
flexural strength data did not follow any consistent trend. Instead, the flexural strength
versus moisture content data showed a shotgun pattern. The 3 sources that belonged to this
category are: Tyler Cedar creek stone, Dallas TXI and El Paso Wyert sources. Interestingly
2 of these sources are identified as “pit run gravel” and “sand & gravel” sources. The third,
Dallas TXI is identified as a crushed limestone – but the material received consisted of very
hard large particles and had a very small percentage of minus No.40 component. For these 3
sources, flexural strength estimate could not be determined reliably.
o.m.c.=8.7%
f.=57psi

0-5873 52
Table 5.1 Flexural and Texas Triaxial Strength Data for the Base Materials Tested
District Pit Name Binder Flexural Strength (psi)
Texas Triaxial Strength (psi) 0 psi 15 psi
Abilene Vulcan/BlackleaseUntreated
36.8 28.8 191.9
Abilene Vulcan/Blacklease2% Flyash
58.0 72.7 240.5
Abilene Vulcan/Blacklease4% Flyash
59.0 94.3 257.8
San Angelo Edminston 62.4 45.0 177.0 San Angelo CSJ/Turner 15.0 N.A. N.A. Brownwood Prater 17.2 24.7 123.2 Brownwood Vulcan 61.3 53.0 193.9 Pharr Tabasco 57.3 41.0 N.A. San Antonio Beckmann 25.5 47.2 176.2 Tyler Cedar Creek
Stone N.R. 50.9 194.8
San Antonio Hunter 22.6 50.3 244.4 San Antonio Cemex 61.1 70.3 253.8 Beaumont Vulcan/Sactun 39.2 64.2 -- Corpus Christi Vulcan/Yucatan 29.2 59.0 222.0 Waco Frost 23.6 27.5 198.3 Dallas TXI Bridgeport N.R. 43.3 190.1 Tyler Broken Bow 47.3 24.7 205.0 El Paso Holman 41.0 46.1 147.6 El Paso Jobe 26.0 50.2 142.9 El Paso Wyert N.R. 46.2 137.9 Lubbock Reworked Base
Untreated 8.6 22.6 N.A.
Lubbock Reworked Base with 1% cement
25.8 35.2 N.A.
Lubbock Reworked Base with 3% cement
49.8 62.5 N.A.
Notes: N.R. = No Result; Flexometer test did not produce data with any consistent trend N.A. = Not Available; Triaxial strength data could not be obtained from district labs

0-5873 53
Flexural Strength versus Texas Triaxial Strength Correlation
In the next step in the data review process, the binder flexural strength data and the
Texas Triaxial strength determined for the composite material were plotted against each other
to determine whether there was any correlation between the two test parameters. For this
purpose, triaxial strength values at 0 psi confining pressure were chosen because the binder
strength will have a greater influence on the unconfined triaxial compression strength.
Figure 5.4 shows the 0psi triaxial strength versus flexural strength plot.
Figure 5.4 0psi Triaxial Strength versus Binder Flexural Strength
Figure 5.4 does not show a strong correlation between the two test parameters.
However, it does show that the triaxial strength generally increases with increasing flexural
strength. Furthermore, as indicated by the dotted line, an upper bound can be defined for the
triaxial strength when the binder flexural strength is known.
An alternative approach to relate compressive strength to flexural strength can be
found in the following empirical equation [13]:
Cnf = (5.2)

0-5873 54
where: f = flexural strength
C = compressive strength
n = correlation coefficient
Table 5.2 below lists the values of coefficient, n that were calculated for those base
materials for which both flexural strength and 0-psi triaxial strength data were available.
Table 5.2 Correlation Coefficient, n for the Base Materials Tested
District Pit Name Binder Flexural Strength (psi)
0 psi Triaxial Strength (psi)
Coefficient, n
Abilene Vulcan/BlackleaseUntreated
36.8 28.8 6.86
Abilene Vulcan/Blacklease2% Flyash
58.0 72.7 6.80
Abilene Vulcan/Blacklease4% Flyash
59.0 94.3 6.07
San Angelo Edminston 62.4 45.0 9.30 Brownwood Prater 17.2 24.7 3.46 Brownwood Vulcan 61.3 53.0 8.42 Pharr Tabasco 57.3 41.0 8.95 San Antonio Beckmann 25.5 47.2 3.71 San Antonio Hunter 22.6 50.3 3.19 San Antonio Cemex 61.1 70.3 7.29 Beaumont Vulcan/Sactun 39.2 64.2 4.89 Corpus Christi Vulcan/Yucatan 29.2 59.0 3.80 Waco Frost 23.6 27.5 4.50 Tyler Broken Bow 47.3 24.7 9.52 El Paso Holman 41.0 46.1 6.04 El Paso Jobe 26.0 50.2 3.67 Lubbock Reworked Base
Untreated 8.6 22.6 1.81
Lubbock Reworked Base with 1% cement
25.8 35.2 4.35
Lubbock Reworked Base with 3% cement
49.8 62.5 6.30

0-5873 55
Figure 5.5 Coefficient, n versus Binder Flexural Strength
Figure 5.5 above shows the relationship between the coefficient, n calculated using
Equation (5.2) for the base material tested. This represents a much better correlation than
seen earlier in Figure 5.4. A linear regression performed between the two parameters yielded
the following regression equation.
)(116.0142.1 fn += (5.3)
R2 = 0.88
A closer review of the flexural strength data shows reveals that the shape of the
flexural strength versus test moisture content characteristic curve varies from one material to
another. In some materials the flexural strength remains fairly constant as the material dries
out to but then begins to increase rapidly once the moisture content reaches a certain
threshold value. This threshold value is typically several percentage points below the
optimum moisture content of the material. Figure 5.1 is representative of the group of
material with such flexural strength-moisture content characteristic. Figure 5.2 shows a

0-5873 56
flexural strength versus moisture content plot that shows a more gradual change in strength
with varying moisture content. Nevertheless, the flexural strength reached a constant value at
higher moisture contents.
Other materials, such as that represented by Figure 5.3, flexural strength versus test
moisture content curve never reached a constant terminal value. In Figure 5.6 material
categories are separated. In this figure, Type I refers to those materials that show a constant
terminal value for the flexural strength, Type II refers to those that do not. In addition, this
figure separates the materials which were tested with cement and flyash additives/modifiers.
The figure suggests that if correlations were to be established for each category of material,
the R2-values are likely to be higher. Table 5.3 provides the correlations established when
each material category was considered separately.
Figure 5.6 Coefficient, n versus Binder Flexural Strength for Type I, Type II and Modified
Materials

0-5873 57
Table 5.3 Regression Models for Type I, Type II and Modified Materials
Material Category Regression Model R2
Type I n = 0.746+0.124· f 0.91
Type II n = 1.399+0.146· f 0.85
Modified Base n = 2.784+0.064· f 0.87
Repeatability of the Flexometer Test
During the initial planning of this research project, the flexometer test was conceived
as one that consists of one tray - or six test specimens - of binder material. To evaluate the
test method for repeatability, multiple trays of specimens were to be prepared from each
material and tested for flexural strength. According to the above original plan, each tray of
material would have produced a separate flexural strength measurement. This would have
allowed the standard deviations of the flexural strengths to be calculated from multiple
measurements available. However, during the course of the research, the data interpretation
procedure was modified so that each test would combine data from 3-4 trays of test
specimens. Thus, the evaluation of the test method for repeatability could not be
accomplished without significant expansion of the original research plan. As an alternative
plan, it was decided that the repeatability analyses would be performed on a subset of the
material samples. Accordingly, 5 sources were selected for replicate flexometer testing.
The flexural strength measurements made on these 5 material sources, the corresponding
standard deviations and coefficients of variation are found in Table 5.4.
Next for comparison purposes, similar analysis was conducted on Triaxial strength
data. These data, which were obtained from TxDOT district laboratories represented Triaxial
strength measurements made on material samples collected from the same stockpile
delivered to a project site. The results from the above analysis are summarized in Table 5.5.
This analysis suggests that the binder flexural strength test is significantly more consistent
(i.e. lower standard deviation and the coefficient of variation) than the Texas Triaxial Test.

0-5873 58
Table 5.4 Standard Deviation and Coeff. of Variation of Binder Flexural Strength for the Selected 5 Sources
District/Source Name Flexural Strength (psi)
Std. Deviation
(psi)
Mean (psi)
C.O.V %
Pharr Tabasco 54.9 60.0 53.1 59.4 3.38 56.9 5.9
San Antonio Beckmann 27.3 21.6 26.7 26.3 2.62 25.4 10.3
San Angelo CSA/Turner 14.5 14.8 13.6 11.1 1.67 13.5 12.4
Lubbock Reworked Base 10.8 8.5 7.8 7.0 1.59 8.6 18.6
Abilene Vulcan/Blacklease 48.2 33.9 37.5 37.4 6.2 39.3 15.8
Average 3.1 12.6

0-5873 59
Table 5.5 Standard Deviation and Coefficient of Variation of Texas Triaxial Strength at 0-psi
Blacklease Boothe Fiester Higgins McCullum Oatman Oatman South Parmelly Phillips Riddle Tubbs Yates Average
48 54 21 36 45.3 35.1 32.2 32 35 17 29 3931 29 19.6 30.7 33 27.1 32.2 37 47.7 40 24 3048 12.5 17.4 39.2 28.7 17 29.8 40 3245 48 20.4 40 1625 40.2 39.3 1255 48.4 1924 17336348433230362645
Mean 39.50 41.50 17.70 28.03 39.15 39.67 30.56 31.50 37.50 23.00 26.50 33.67Std. Dev 11.15 12.50 3.72 7.82 6.15 7.36 6.14 8.85 7.52 10.93 2.50 3.86 7.37COV % 28.22 30.12 21.02 27.91 15.71 18.55 20.09 28.08 20.05 47.51 9.43 11.46 23.18

0-5873 60
REVIEW OF DATA COLLECTED IN PHASE II – LAB TEST PROGRAM
As explained in Chapter 4, the Phase II lab test program had 3 distinct components:
Test Program II-A which examined the effects of sample size, Test Program II-B which
investigated the feasibility of using a shorter time of curing for the test specimens, and Test
Program II-C which involved tests to validate the flexometer test device. The following
sections present the findings from each of these test programs.
Phase II-A Test Program: Effect of Test Specimen Size
Phase II-A test program included a limited scope laboratory study that involved
flexural testing of large size test specimens. Two sizes of test specimens were included in
this study; Intermediate size specimens: 8in long x 1.5in square section and large size
specimens: 12 in long x 3in square section. Details with regard to material gradation used,
procedures for sample preparation, curing and flexural testing were described in Chapter 4.
The data obtained from Phase II-A test program are presented in this chapter.
4 material sources were included in the flexural strength test program for intermediate
size specimens. They are: Abilene-Vulcan/Blacklease, Brownwood-Prater, Waco-Frost and
Beaumont Vulcan-Sactun. In the meantime, only one material source was included in the
flexural testing of large size specimens. This material was San Angelo-CSA/Turner. Choice
of material sources for these test programs were largely based on the availability of material
in the quantities needed for each test series. The flexural strength versus test moisture
content plots obtained for intermediate size test specimens are shown in Figure 5.7 along
with the best-fit curves. Figure 5.8 summarizes the test data obtained from the testing of large
size specimens.
Phase II-A Test Program lead to following conclusions. First of all, maintaining
integrity of the large size test specimens during handling and load testing was difficult when
compared to the small, shrinkage mold sized test specimens. Large size specimens required
longer curing (or drying) in the oven before they could be safely removed from the mold.
Also, it was evident that the moisture content was not uniform within the sample cross-
section. Therefore, the test moisture contents for these specimens were lower than those for
the shrinkage mold sized specimens.
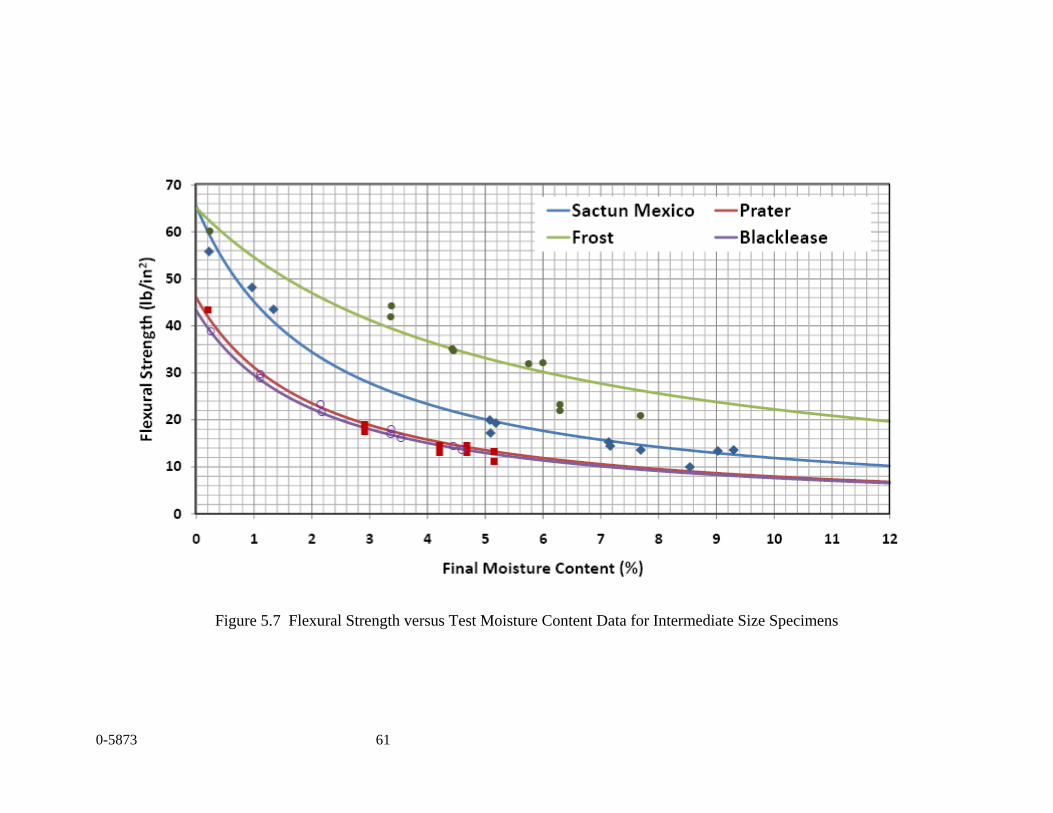
0-5873 61
Figure 5.7 Flexural Strength versus Test Moisture Content Data for Intermediate Size Specimens

0-5873 62
a) Loading Rate of 0.05 in/min
Soil Sample Cured for 3 Hours
Cured for 5 Hours
Cured for 8 Hours
Flexural Strength (psi) 4.0 7.2 9.8 Moisture Content (%) 3.3 2.1 1.1
b) Loading Rate of 0.005 in/min
Soil Sample Cured for 3 Hours Cured for 5 Hours
Cured for 8 Hours
Flexural Strength (psi) 4.40 4.50 7.77 7.63 10.47 10.27 Moisture Content (%) 3.3 3.4 2.0 2.1 1.2 1.2 Average Flexural Strength (psi)
4.4.5 7.7 10.37
Figure 5.8 Flexural Strength versus Test Moisture Content Data for Large Size Specimens

0-5873 63
Intermediate and large size specimens show the same flexural strength versus
moisture content trend seen in shrinkage mold sized specimens. However, the flexural
strengths measured at the same test moisture contents tend to be smaller for larger test
specimens. The larger loading frame used for testing large sized specimens allowed the
strain rate to be varied over a wide range. Therefore, testing was conducted at two different
loading rates 0.05in/min and 0.005in/min. The results obtained confirmed that strain rates
did not have any significant impact on the measured flexural strengths.
Phase II-B Test Program: Flexometer Testing with Accelerated Curing
Phase II-B Test Program investigated the feasibility of using a shorter curing time
than that used in the standard procedure. In the standard procedure described in Appendix A,
the rate of drying of all test specimens is controlled so that a fixed, 4-day curing time can be
used for all materials regardless of whether the material has been treated with additives such
as flyash and cement or not. Controlled drying is achieved by sealing the test specimens in
polyethylene plastic bags. In this test program, flexural strength tests were repeated for 3
selected materials using an accelerated curing process. The primary difference in the curing
process used in the accelerated test is that test specimens remain in the curing chamber which
is maintained at 100ºF and are never removed and sealed in plastic bags to slow down drying.
The 3 material sources that were used in Phase II-B Test Program are: Brownwood-Prater,
San Angelo-CSA/Turner and flexural and Waco-Frost. Once again, material availability was
the primary factor considered in the selection of base materials to be included in this test
program. The flexural strength versus moisture content characteristics obtained for the 3
materials using the accelerated test and the standard test are shown in Figures 5.9 through
5.11.
The comparison in figures 5.9 through 5.11 shows that the flexural strength-moisture
content relationships obtained from both the standard and accelerated tests are similar.
However, at the same time, it can be noticed that longer curing period provides a more
gradual change in flexural strength versus moisture content. In other words, the accelerated
test provides a graph with sharper curvature. As a result, the two test procedures will not
yield the same flexural strength at the optimum water content.

0-5873 64
Figure 5.9 Comparison of Data Obtained from Standard, 4-Day Flexometer and Accelerated
Flexometer Tests; Brownwood-Prater Source
Figure 5.10 Comparison of Data Obtained from Standard, 4-Day Flexometer and Accelerated Flexometer Tests; San Angelo-CSA/Turner Source

0-5873 65
Figure 5.11 Comparison of Data Obtained from Standard, 4-Day Flexometer and Accelerated Flexometer Tests; Waco-Frost Source
Phase II-C Test Program: Validation of the Flexometer Test Device
Phase II-C Test Program was conducted with the primary objective of investigating
the accuracy of the flexural strength measurements made using the prototype flexometer
device developed in this research. This investigation was prompted by some anomalies
observed in the flexural strength data measured using this test device. Figure 5.12 shows an
example of the anomalous data trend mentioned above. As it can be noted, the flexural
strength values measured for this material are higher at very high moisture contents than
those measured at intermediate moisture contents.
Therefore, to investigate the above, a set of parallel tests were conducted using
another loading device. The loading device used for this purpose was the Snapshot
equipment used for testing intermediate size specimens. The materials used for this test
series are the same as those used in Phase II-B test program, namely Brownwood-Prater, San
Angelo-CSA/Turner and flexural and Waco-Frost.

0-5873 66
Figure 5.12 Anomalous Trend in Flexural Strength Data Measured by the Base Binder
Flexometer
The comparison of data obtained from parallel testing revealed that the above data
anomaly is a result of an assumption made in the calculation of the applied force. As
explained in Chapter 3, the base binder flexometer does not make a direct measurement of
the applied load. Instead, it calculates the force from the cam displacement which is known.
When calculating the load, the cam displacement is assumed to be equal to the compression
of the loading spring. However, this assumption is valid only when the beam deflection is
zero or negligibly small. At higher moisture contents, the beam deflection is not negligible.
Therefore, the compression of the spring should be calculated as: compression of the spring
= cam displacement – beam deflection. When this correction is applied the actual load
applied will be smaller. Figures 5.13 through 5.15 show the comparison of flexural strength
versus moisture content plots obtained from parallel tests. In these plots, flexural strength
measurements made with base binder flexometer at very high water contents have been
disregarded. The data plots show fairly good comparison between data obtained from the
two loading devices.
0
5
10
15
20
25
30
35
40
0 2 4 6 8 10 12 14 16 18 20
Mois ture C ontent (%)
Flexu
ral Stren
gth (psi)
F 1 F 2 F 3 F 4

0-5873 67
0.0
10.0
20.0
30.0
40.0
50.0
60.0
0 2 4 6 8 10 12 14 16 18 20 22
Mois ture C ontent (%)
Flexural S
trength (psi)
Accelerated F lexometer
Accelerated S napshot
Figure 5.13 Comparison of Data Obtained from Base Binder Flexometer and Snapshot
Loading Device; Brownwood-Prater Source
0.0
10.0
20.0
30.0
40.0
0.0 2.0 4.0 6.0 8.0 10.0 12.0 14.0 16.0Mois ture c ontent (%)
Flexural stren
gth (psi)
Accelerated S napshot
Accelerated F lexometer
Figure 5.14 Comparison of Data Obtained from Base Binder Flexometer and Snapshot Loading Device; San Angelo-CSA/Turner Source

0-5873 68
0.0
10.0
20.0
30.0
40.0
50.0
60.0
0 2 4 6 8 10 12 14 16Mois ture c ontent (%)
Flexu
ral S
tren
gth (psi)
Accelerated S napshot
Accelerated F lexometer
Figure 5.15 Comparison of Data Obtained from Base Binder Flexometer and Snapshot
Loading Device; Waco-Frost Source


0-5873 69
CHAPTER 6
CONCLUSIONS AND RECOMMENDATIONS
This research was initiated with the primary objective of evaluating a new test
procedure proposed by Michael Merrick, P.E., Assistant Area Engineer, Snyder of TxDOT
Abilene District for testing road base materials. This test procedure, called the base binder
flexometer test, was developed by Mr. Merrick to fulfill the need for a repeatable and reliable
strength test that can also be performed in a short time and with small amounts of material.
The test procedure involves testing of a shrinkage mold size beam specimen under flexural
loading. The test specimens are prepared using the minus #40 component, or the binder
component, of a base material. The rationale behind the proposed test procedure is that the
flexural strength of the binder will correlate well with the 0-psi Texas Triaxial Test strength.
Limited amount of preliminary test data available suggested that such a correlation may exist.
The specific objectives of this research study included: (a) Detailed review of the test
procedure so that specific shortcomings and limitations can be identified, (b) Examination of
the correlation between strength data obtained from the flexometer and Texas triaxial tests,
(c) Evaluation of the repeatability of the proposed flexometer test method, (d) Design a low
cost, easy-to-operate base binder flexometer and build a prototype test device.
To accomplish these research objectives, a total of 19 base materials from 12 TxDOT
districts were sampled and tested. The following are the conclusions that were drawn from
the research study.
CONCLUSIONS
The data collected and analyzed in this research study support the view that the
strength of binder component of roadway base materials has significant influence on the
strength of the composite material. The data showed that a reasonably good correlation can
be established between the binder strength and 0-psi Texas Triaxial strength. The strength
of the correlation could be further improved when materials are categorized into sub-groups
viz. Type I and II materials. This categorization of material as Type I and Type II is based
on the shape of the flexural strength-moisture content characteristic curve. Type I materials
are those characterized by a flexural strength-moisture content curve that flattens out at high

0-5873 70
moisture contents. All crushed limestone materials with the exception one source, i.e.
Dallas, Bridgeport/TXI, belonged to this category. In Type II materials, the flexural
strength-moisture content curve never reaches such a terminal value. Only 3 material sources
were identified as Type II. 2 out of the 3 were sand and gravel sources. The remaining sand
and gravel sources did not produce any consistent trend in data and therefore could not be
included in correlation studies. Therefore, it is reasonable to conclude that estimation of
composite strength based on binder strength is not viable for sand and gravel materials.
The data collected using the proposed flexural strength test method showed that this
test procedure, which utilizes shrinkage mold size test specimens, is capable of producing
reliable estimates of the binder strength. However, in many cases, it was found that single
tray of specimens (i.e. six test specimens) was not sufficient to provide a good data spread.
Use of 3-4 trays (or 18-24 test specimens) greatly enhanced the reliability of the flexural
strength measurement. Increasing the number of test specimens has very little impact on the
time, effort and material needed to run the test.
Testing larger sized specimens for flexural strength proved to be a lot more difficult.
The intermediate and large size specimens could not be tested at near optimum moisture
conditions. The test specimens needed to be much drier in order to ensure that the specimens
would maintain their integrity during handling and load testing. Other concerns related to
testing of large size specimens were: influence of self weight on the measured flexural
strength and non-uniformity in moisture content over the cross section of the sample.
The repeatability of the test procedure was examined in a limited scope laboratory
study that included a sub set of only 5-materials. The data showed that the average
Coefficient of Variation (COV) for the base binder flexometer test was 12.6%. This
estimate of COV is significantly better than the COV of 23.2% calculated for the 0-psi Texas
Triaxial Test. Better repeatability should be expected for the flexural strength test because it
uses only a small quantity of material to prepare test specimens. The Texas Triaxial test, by
comparison, uses a much larger quantity of material and degree of variability that exists
between larger samples should be greater.
The data obtained from the prototype test device developed in this research compared
well with data collected from a more sophisticated and expensive test equipment. However,

0-5873 71
this comparison revealed that the prototype test device had the tendency to over-predict the
flexural strengths whenever there was measurable deflection of the test specimen at the point
of loading. Significant deflection of the test specimen occurred only under extremely wet
conditions. This did not introduce an error into the flexural strength measurement because
such measurement is taken at much drier water contents. Nevertheless, this limitation of the
test device should be addressed before implementation of the test device.
The standardized test procedure used in this research utilizes a 4-day curing period
for all materials tested. The 4-day curing period was selected because base materials
modified with additives such as lime, flyash and cement require long curing time to allow
stabilization reactions to take place. For unmodified materials, the 4-day curing is not
necessary but was used only because a uniform test procedure was desired. Data collected
from an accelerated test with shortened curing time produced data trends that were very
similar to those obtained from the standard test. This observation suggests that the
accelerated flexometer test is a viable test procedure which deserves consideration candidate
during final implementation.
RECOMMENDATIONS
Based on the findings from this research study, we recommend that the base binder
flexometer test be implemented as a supplementary test procedure in selected TxDOT road
construction projects. Accordingly, the new test procedure should be run in addition to the
test methods that are performed currently according to the existing specifications. The lab
technicians who perform the binder flexural test for these projects should have prior
experience with the new test method or should have received adequate training.
Outlined below are some recommended guidelines that should be used when
sampling and testing material for the above trial implementation projects.
(a) Use a sub-sample of material collected for triaxial testing to perform the binder
flexometer test
(b) Sample sufficient quantity of material so that 4-trays of test specimens can be
prepared and tested for flexural strength

0-5873 72
(c) Perform both accelerated and standard versions of the flexural strength test.
(d) Take extra precaution when testing test specimens at high water contents.
Preferably use an independent and direct measurement of load applied to calculate
flexural strength.
It is also recommended that the following aspects of the test procedure be further
investigated through future research.
One of the areas where the new test procedure may be found to be most useful is in
the evaluation of lime, flyash and cement modified base materials. The test method may be
used as a tool for preliminary evaluation to determine which type of modifier is best suited.
Once a particular type of modifier has been selected, the test could also be used to determine
the optimum modifier content. The limited number of tests performed in this research on
flyash and cement modified base materials showed that the test procedure requires further
evaluation and refinement. The areas that deserve special attention are: (a) determination of
modifier content to be used in sample preparation, (b) determination of molding water
content, and (c) flexural strength-moisture content relationships.
Another aspect that deserves further study involves the single-lab and multi-lab
variability in the test procedure. To establish the single and multi-lab variability for the test
method, it is recommended that a comprehensive and systematic study be conducted with
involvement from several TxDOT district laboratories.

0-5873 73
REFERENCES
1. Standard Specifications for Construction and Maintenance of Highways, Streets, and Bridges, Texas Department of Transportation, June 2004.
2. Construction Contract Administration Manual, Texas Department of Transportation, October 2007.
3. Fatherree, Ben H., Dr. (2000), “Birth of Soil Mechanics at the Waterways
Experiment Station, 1930-1941.” The History of Geotechnical Engineering at the Waterways Experiment Station 1932-2000, US Army Corps of Engineers, Chapter 2, Research and Development Center, Vicksburg, MS. < http://gsl.erdc.usace.army.mil/gl-history/Chap2.htm>, Accessed: March 15, 2008.
4. Tschiebotarioff, Gregory P. (1951), “The Shearing Strength and the Shearing Deformation of Soils.” Soil Mechanics, Foundations, and Earth Structures, An Introduction to the Theory and Practice of Design and Construction, McGraw-Hill Book Company, Inc., New York, pp.128-131.
5. Saarenketo, T., and T. Scullion, (1996), Using Electrical Properties to Classify the
Strength Properties of Base Course Aggregates. Research Report 1341-2. Texas Transportation Institute, Texas A&M University System, College Station, Texas.
6. Guthrie, W. Spencer and Scullion, Tom (2003), “Interlaboratory Study of the Tube Suction Test,” Research Report 0-4114-2, Texas Transportation Institute, Texas A&M University System, College Station, Texas.
7. Mallela, Jagannath, Quintus, Harold Von, P.E., and Smith, Kelly L., (2004). “Consideration of Lime-Stabilized Layers in Mechanistic-Empirical Pavement Design.” The National Lime Association, Arlington, Virginia, pp.28-30.
8. Federal Highway Administration (FHWA) (1995), “Recycled Materials in the Highway Environment.” Coal Fly Ash , Turner-Fairbank Highway Research Center, < http://www.tfhrc.gov/hnr20/recycle/waste/cfa55.htm>, Accessed: March 27, 2008.
9. AASHTO Designation T 97-97: Standard Test Method for Flexural Strength of Concrete Using Simple Beam with Third-Point Loading, Standard Specifications for Transportation Materials and Methods Sampling and Testing, 22nd Edition, Part 2A, American Association of State Highway and Transportation Officials,2002.
10. AASHTO Designation T 177-97: Standard Test Method for Flexural Strength of Concrete Using Simple Beam with Center-Point Loading, Standard Specifications for Transportation Materials and Methods Sampling and Testing, 22nd Edition, Part 2A, American Association of State Highway and Transportation, 2002.
11. ASTM D 1635: Standard Test Method for Flexural Strength of Soil-Cement Using Simple Beam with Third-Point Loading, Annual Book of ASTM Standards, Volume 04.08, American Society for Testing and Materials, 2008.
0-5873 74
12. ASTM D 1632: Standard Practice for Making and Curing Soil-Cement Compression and Flexure Specimens in the Laboratory, Annual Book of ASTM Standards, Volume 04.08, American Society for Testing and Materials, 2008.
13. Design and Control of Concrete Mixtures, 12th Edition, Portland Cement Association (PCA), Skokie, Illinois, 1979, pp. 11-60.
Appendix A Standard Test Procedure for Strength of Soil Binder by Flexural Testing

0-5873 A-1
1xx-A, Soils Test Procedures Manual
Chapter XX: Tex-1xx-A, Strength of Soil Binder by Flexural Testing
Section 1. Overview
Effective date: xxxx
This test method covers the determination of flexural strength of flexible base binders and subgrade materials Results are to be used to evaluate relative increase in strength and/or triaxial correlation for modification with a cementatious product or QM monitoring of stockpile production.
Units of Measurement
Material weights are done in grams. Lengths and dimensions are represented in inches, load as pound-force, strength in pounds per square inch (psi).
Section 2. Apparatus
The following apparatus is required:
♦ 3 point flexural testing device (Merrick Flexometer)
• load specimens ¾” square, 5” in length.
• Produce a loading rate at not more than 0.01 lbf/second, loaded at specimen center.
♦ Linear shrinkage bar molds.
♦ Forced air flow oven at range of temperature from room to 200 degrees F with a volume of 1.5 CF.
♦ Oven at 140 degrees F.
♦ Scale capable of measurement to 0.01 grams.
♦ Tools such as trowel, spatula, mixing boles, and sample container capable of preventing sample moisture loss.
♦ Caliper

0-5873 A-2
Section 3. Sampling Requirements
The sampling requirements for subgrade and flexible bases used for this test are:
♦ Obtain the sample of subgrade according to "Tex-100-E, “Surveying andSampling Soils for Highways."
♦ Prepare linear shrinkage molds by cleaning with a brass bristle brush and penetrating oil. Never use water.
Section 4. Procedures Part IA
Sample Preparation for Obtaining Flexural Strength for Subgrade.
The following table describes the steps used in obtaining flexural strength using the Merrick Flexometer.
Subgrade Sample Preperation Step Action
1 ♦ Shake the sample over a #40 sieve to obtain a consistent sample. Do not allow the sample to dry out completely.
♦ Place the -40 material in an air tight container.
2 ♦ Take approximately 10grams of material and place in oven and dry to constant weight to obtain sample moisture content.
♦ Obtain a sample large enough to fill all 6 slots of a linear shrinkage bar mold. Depending on the material, approximately 475 to 525 grams.
3 ♦ Specimens are to be prepared at a moisture content determined by optimum moisture and material PI. The correct moisture content will be determined by spreadsheet ‘Weighup.xls’
♦ Use spreadsheet ‘Weighup.xls’ to determine the amount of water to add to obtain water needed to mix in to sample.
4 ♦ When the sample material has been uniformly mixed, using a small spatula, place
sample material in all 6 molds (1 linear shrinkage tray) in ½ lifts. After the first lift, rock the mold on a hard surface 50 times to consolidate sample and release trapped air bubbles. Rock the mold 100 times after the second lift.
♦ After both lifts have been placed, strike off the specimens to a smooth surface and place in oven at 72 deg. F +/- 2 deg. with NO airflow.
5 ♦ If samples are modified with cement or fly ash, used spreadsheet ‘Weighup.xls’ to determine the amount of paste and additional water. The spreadsheet calculates paste based upon desired percentage multiplied by dry soil weight. Add water is determined by 1.2 x percent modifier x percent dry soil.
♦ Repeat steps 2 through 4 for each mold tray. Each tray should represent only 1 point of interest such as a control tray, 1% cement tray, and a 3% cement tray.

0-5873 A-3
Section 4. Procedures Part 1B
Sample Preparation for Obtaining Flexural Strength for Flexible Base.
The following table describes the steps used in obtaining flexural strength using the Merrick Flexometer.
Flexible Base Sample Preperation Step Action
1 ♦ Perform a washed gradation according to TEX-200-F to obtain -40 material. Do not allow the sample to dry out completely.
♦ Place the -40 material in an air tight container.
2 ♦ Take approximately 40grams of material and place in oven and dry to constant weight to obtain sample moisture content.
♦ Obtain a sample large enough to fill all 6 slots of a linear shrinkage bar mold. Depending on the material, the amount needed will be 500 grams to 600 grams
3 ♦ Specimens are to be prepared at a moisture content determined by material Liquid Limit and Optimum Dry Density. The correct moisture content will be determined by spreadsheet ‘Weighup.xls’
♦ Use spreadsheet ‘Weighup.xls’ to determine the amount of water to add to obtain water needed to mix in to sample.
4 ♦ When the sample material has been uniformly mixed, using a small spatula, place sample material in all 6 molds (1 linear shrinkage tray) in ½ lifts. After the first lift, rock the mold on a hard surface 50 times to consolidate sample and release trapped air bubbles. Rock the mold 100 times after the second lift.
♦ After both lifts have been placed, strike off the specimens to a smooth surface and place in oven at 72 deg. F +/- 2 deg. with NO airflow.
5 ♦ If samples are modified with cement or fly ash, used spreadsheet ‘Weighup.xls’ to determine the amount of paste and additional water. The spreadsheet calculates paste based upon desired percentage multiplied by dry soil weight. Add water is determined by 1.2 x percent modifier x percent dry soil.
♦ Repeat steps 2 through 4 for each mold tray. Each tray should represent only 1 point of interest such as a control tray, 1% cement tray, and a 3% cement tray.

0-5873 A-4
Section 4. Procedures Part 2
Specimen Curing and Breaking Subgrades and Flexible Base.
The following table describes the steps used in obtaining flexural strength using the Merrick Flexometer.
Sample Curing and Breaking Step Action
1 ♦ Begin the curing process by placing the specimen trays in the curing oven for 1 hour at 130 degrees for 1 hour. At the end of the initial hour turn the oven heat and airflow off. Do not disturb the samples for the remaining of the first day. The beginning of the second day is the beginning of the second curing cycle. On the beginning of the 2nd day, turn the curing oven air flow on with the heat set to 100 degrees. After 30 minutes has lapsed, turn the oven heat off. Allow the oven air flow to continue for 30 additional minutes then turn the oven off.
♦ At the end of this cycle, remove the specimen trays from the oven. Place each tray in an individual plastic bag. Seal the bag to prevent airflow. Place the specimen trays back in the oven until 4 days have lapsed.
3 ♦ After 4 days have lapsed, remove the trays from the plastic bags.
♦ While holding the specimen tray in one hand, invert the specimen tray over the other hand to allow the specimens to fall on the empty hand. Lay the bottom side of the tray on the specimens. Carefully invert again leaving the specimens on the bottom of the specimen tray as shown in Figure A. Place the tray with specimens in the oven.
The remaining portion of this procedure involves use of the Merrick Flexometer. Insure that Flexometer is calibrated, cam settings correct and the software running.
4 The intent of specimen testing is to provide a strength result at a moisture content at optimum moisture as determined by TEX 113-E. Specimens should be tested at moisture contents wetter than optimum and drier than optimum to produce a relational graph of strength vs. moisture. Begin this procedure by inspecting the specimens and identify the specimens that contain more moisture than others. The specimens with the least moisture should be broken first. Then test a specimen that appears to have the most moisture but will still fail by rupture not by slow strain failure. This will help insure that a specimen test result will be reported on both sides of the OMC content. ♦ At the end of 4 days, turn the oven airflow on and dial the heat to 100 degrees.
Specimens should remain in the oven until they are tested. After selecting a specimen, remove it from the oven and place in the Flexometer orientated as shown in Figure B. In this orientation, the specimen will be loaded on it’s side with the top facing the back and bottom facing the front.
♦ Initiate the software and begin loading. Continue loading until failure of the specimen occurs. Using a caliper, measure the specimen width and height and record in the worksheet beamsheet.xls. While measuring the height measure in the center of the specimen as shown in Figure C. Also record the stepping information shown on the computer screen.
5
6 ♦ Determine the moisture of the specimen tested by taking ½ of tested specimen and breaking it down with a mortar. Place the sample in the oven and determine the moisture
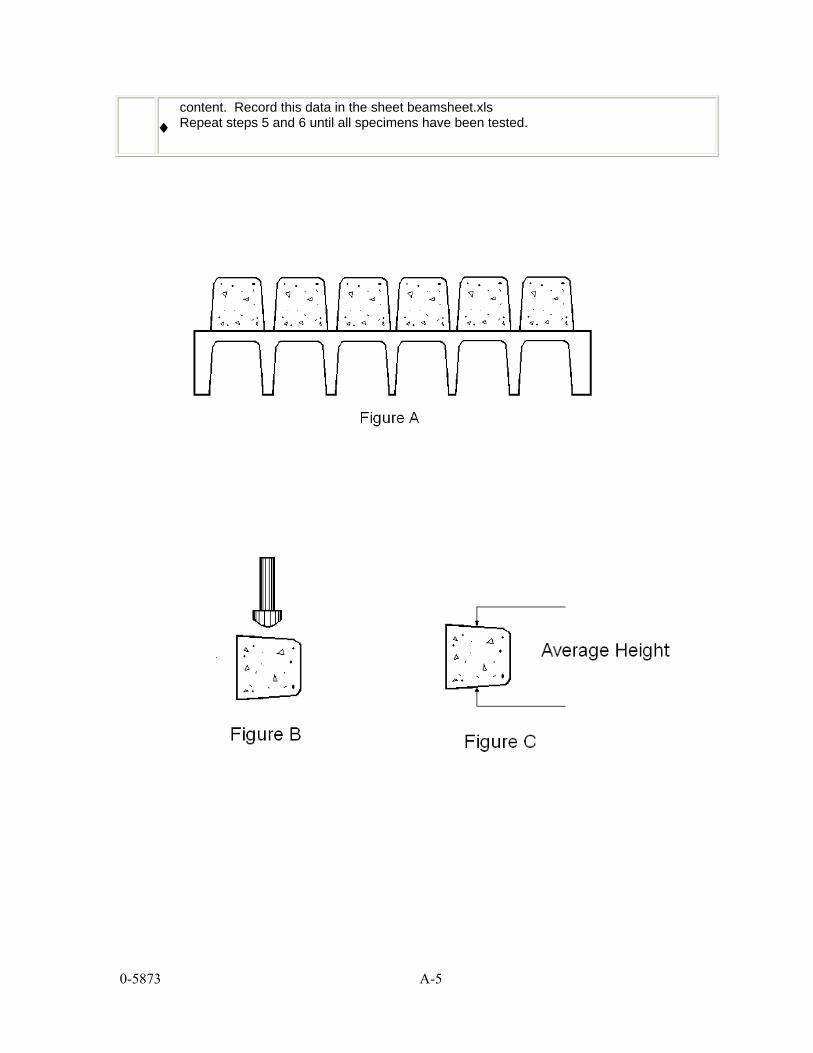
0-5873 A-5
content. Record this data in the sheet beamsheet.xls ♦ Repeat steps 5 and 6 until all specimens have been tested.

0-5873 A-6
Section 5. Calculation Calculations are performed in the sheet beamsheet.xls

Appendix B Laboratory Test Data

Retained Retained Retained Retained Retained Retained Retained RetainedDistrict Pit Name CSJ Material Description PL LL PI 1 3/4'' 1 1/4'' 7/8'' 5/8'' 3/8'' # 4 # 10 # 40
Abilene Bean 157-9-1 Crushed Limestone 12 22 10 - - - - - - - -Abilene Vulcan/Blacklease Crushed Limestone 12 14 2 0.0 - - - - 47.0 - 80.7San Angelo Edminston C148-3-23 Crushed Limestone 18 26 8 0.0 9.0 21.0 31.0 57.0 57.0 68.0 80.0San Angelo CSJ/Turner 0555-05-018 Crushed Limestone 13 16 3 0.0 - - - - 60.7 - 79.8Brownwood Prater 1039-01-029 Crushed Limestone 21 28 7 2.3 - 21.9 29.6 40.4 51.6 - 73.7Brownwood Vulcan QC Crushed Limestone 12 14 2 0.0 - - - - 47.0 - 80.7Pharr * Tabasco Pit * 1802-01-031 Pit Run Base 18 24 6 - - - - 55.4 - 72.7San Antonio Beckmann Quarry QC Aggregate/sand mix 14 17 3 0.0 2.7 12.3 24.3 36.1 49.8 - 71.0Tyler * Cedar Creek Stone * 0197-06-028 Sand & Igneous Rock 22 27 5 0.0 - - - - 68.1 - 77.6San Antonio Hunter Pit various Crushed Limestone 17 13 4 0.0 - 20.8 - 49.1 61.4 - 78.2San Antonio Cemex, New Braun. various Crushed Limestone 12 16 4 0.0 - 18.5 - 47.4 - - 78.2Beaumont Vulcan/Sactun Mex Crushed Limestone 15 23 8 - - - - - - - -Corpus Christi Vulan/Yucatan Mexico 101-8-1 Crushed Igeneous BLS Method ** 5 0.0 - 18.9 - 53.8 67.2 - 81.9Waco Frost Pit Crushed Limestone 15 21 6 - - 59.7 - 77.1Dallas TXI Bridgeport 196-2-78 Crushed Limestone 14 21 7 0.0 - 15.1 - 43.6 60.2 - 81.4Tyler Broken Bow S&G 10-76-7 Sand & Gravel BLS Method ** 3 0.0 - 22.4 - 49.4 59.2 - 76.2El Paso Holman 75-1-20 Sand & Gravel BLS Method ** 5 0.0 - 14.0 - 36.0 49.0 - 78.0El Paso Jobe District Wide Crushed Limestone BLS Method ** 5 0.0 - - - - 49.0 - 79.0El Paso Wyert 0075-01-020 Sand & Gravel BLS Method ** 3 0.0 - 15.0 - 36.0 50.0 - 79.0Lubbock Reworked Base US 62/Floyd Reworked Base
* The binder portion of these materials is not of the same parent material as the aggregate portion. Therefore, the binder and matrix are composed of different minerology and origin.
** Bar Linear Shrinkage Method used to determine Plasticity Index
Atterberg Limits Gradation %
0-5873 Page B - 1

Optimum Maximum District Pit Name CSJ Material Description Value % Loss 0 psi 15 psi Moisture % Density(pcf)
Abilene Bean 157-9-1 Crushed Limestone 46.7 206.0 8 134.1Abilene Vulcan/Blacklease Crushed Limestone 33.0 12.0 28.6 191.9 5.7 145.1San Angelo Edminston C148-3-23 Crushed Limestone 34.0 14.0 45.0 177.0 7.1 138.6San Angelo CSJ/Turner 0555-05-018 Crushed Limestone 31.0 11.0Brownwood Prater 1039-01-029 Crushed Limestone 48.0 19.0 24.7 123.2 10.5 127.0Brownwood Vulcan QC Crushed Limestone 33.0 12.0 53.0 193.9 5.7 145.1Pharr * Tabasco Pit * 1802-01-031 Pit Run Base 35.0 N.R. 41.0 N.R. 8.7 128.7San Antonio Beckmann Quarry QC Aggregate/sand mix 39.0 10.0 47.2 176.2 6.3 134.7Tyler * Cedar Creek Stone * 0197-06-028 Sand & Igneous Rock 38.0 15.0 50.9 194.8 7.5 136.4San Antonio Hunter Pit various Crushed Limestone 35.0 15.0 50.3 244.4 6.1 141.8San Antonio Cemex, New Braun. various Crushed Limestone 32.0 11.0 70.3 253.8 6.0 140.3Beaumont Vulcan/Sactun Mexico Crushed Limestone 38.0 7.0 64.2 N.R. 8.7 129.2Corpus Christi Vulan/Yucatan Mexico 101-8-1 Crushed Igeneous 28.0 5.0 59.0 222.0 9.4 127.9Waco Frost Pit Crushed Limestone 33.0 6.0 27.5 198.3 7.6 134.0Dallas TXI Bridgeport 196-2-78 Crushed Limestone 21.0 5.0 43.3 190.1 5.8 138.2Tyler Broken Bow S&G 10-76-7 Sand & Gravel 32.0 7.0 24.7 205.0 5.4 141.1El Paso Holman 75-1-20 Sand & Gravel 39.0 18.0 46.1 147.6 7.7 136.5El Paso Jobe District Wide Crushed Limestone 27.0 5.0 50.2 142.9 7.4 135.0El Paso Wyert 0075-01-020 Sand & Gravel 37.0 17.0 46.2 137.9 6.9 135.7Lubbock Reworked Base US 62/Floyd Reworked Base
Wet Ball Mill Triaxial Compaction
0-5873 Page B - 2

MERRICK FLEXOMETER SAMPLE IDENTIFICATION
Triaxial Sieve Percent145.1 0 psi 28.6 1 3/45.7 15 psi 191.9 1 1/414 7/812 5/82 3/8
Wet Ball 33 #4 47.0% Increase 12 #10
#40 80.7
Initial Total Beam Width Height Load M max FlexuralTray Beam Steps Steps % Moisture (inches) (inches) (lb) in-lb (psi)
1 1 17 38 10.16 0.687 0.700 1.449 1.630 29.111 2 17 42 8.82 0.676 0.691 1.790 2.014 37.411 3 15 59 2.46 0.673 0.695 3.341 3.759 69.481 4 19 44 6.85 0.670 0.697 1.862 2.095 38.631 5 18 46 4.89 0.679 0.692 2.089 2.350 43.251 6 19 45 4.21 0.681 0.694 1.950 2.194 40.1 2 1 21 38 11.21 0.687 0.689 1.238 1.393 25.7 2 2 20 42 8.20 0.676 0.687 1.635 1.839 34.5 2 3 22 44 7.34 0.67 0.68 1.693 1.905 36.8 2 4 21 44 4.11 0.679 0.682 1.752 1.971 37.6 2 5 23 45 4.69 0.681 0.68 1.72 1.935 37.0 2 6 19 57 2.19 0.673 0.679 2.986 3.359 64.8 3 1 24 37 12 06 0 689 0 705 0 972 1 094 19 19
SampleWeight lb
Specimen
OptimumDensity (pcf)Moisture(%)
LLPLPI
DISTRICT: Abilene SAMPLE NUMBERCOUNTY: various PRODUCER: Vulcan/Blacklease
0-5873 Page B - 3
3 1 24 37 12.06 0.689 0.705 0.972 1.094 19.193 2 21 40 9.90 0.690 0.704 1.407 1.583 27.723 3 23 55 3.21 0.692 0.705 2.587 2.910 50.783 4 20 40 6.99 0.690 0.708 1.463 1.646 28.563 5 20 48 5.02 0.697 0.705 2.158 2.428 41.953 6 21 46 5.89 0.689 0.707 1.926 2.167 37.744 1 17 38 10.16 0.687 0.700 1.449 1.630 29.114 2 17 42 8.82 0.676 0.691 1.790 2.014 37.414 3 15 59 2.46 0.673 0.695 3.341 3.759 69.484 4 19 44 6.85 0.670 0.697 1.862 2.095 38.634 5 18 46 4.89 0.679 0.692 2.089 2.350 43.254 6 19 45 4.21 0.681 0.694 1.950 2.194 40.07
0-5873 Page B - 3

FLEXOMETER SAMPLE IDENTIFICATION
Triaxial Sieve Percent138.6 0 psi 45.0 1 3/4 0.07.1 15 psi 177.0 1 1/4 9.026 7/8 21.018 5/8 31.08 3/8 57.0
Wet Ball 34 #4 57.0% Increase 14 #10 68.0
#40 80.0
Initial Total Beam Width Height Load M max FlexuralTray Beam Steps Steps % Moisture (inches) (inches) (lb) in-lb (psi)
1 1 9 59 9.65 0.686 0.712 3.394 3.818 66.01 2 1 40 12.27 0.704 0.718 1.898 2.135 35.31 3 1 54 9.65 0.724 0.71 3.071 3.455 56.81 4 1 49 14.78 0.725 0.719 2.648 2.979 47.61 5 6 62 6.23 0.725 0.708 3.697 4.159 68.81 6 10 71 4.46 0.735 0.71 4.291 4.827 78.32 1 8 54 12.74 0.728 0.721 2.999 3.374 53.62 2 1 53 11.08 0.718 0.720 2.987 3.360 54.22 3 5 57 6.23 0.719 0.708 3.301 3.714 61.72 4 1 51 7.73 0.710 0.716 2.817 3.169 52.3233
COUNTY: various PRODUCER: EdminstonDISTRICT: San Angelo SAMPLE NUMBER
SampleWeight lb
Specimen
OptimumDensity (pcf)Moisture(%)
LLPLPI
0-5873 Page B - 4
33333444444
0-5873 Page B - 4

MERRICK FLEXOMETER SAMPLE IDENTIFICATION
Triaxial Sieve Percent0 psi 1 3/4
15 psi 1 1/413 7/816 5/83 3/8
Wet Ball 31 #4% Increase 11 #10
#40
Initial Total Beam Width Height Load M max FlexuralTray Beam Steps Steps % Moisture (inches) (inches) (lb) in-lb (psi)
1 1 15 29 7.68 0.710 0.693 0.828 0.932 16.391 2 16 24 11.27 0.713 0.701 0.440 0.495 8.461 3 12 24 3.81 0.711 0.701 0.598 0.673 11.561 4 17 25 11.54 0.714 0.700 0.459 0.516 8.851 5 9 25 4.29 0.709 0.702 0.749 0.843 14.501 6 15 30 5.96 0.705 0.698 0.901 1.014 17.7 2 1 7 31 5.09 0.735 0.712 1.218 1.37 22.1 2 2 12 28 8.37 0.723 0.705 0.869 0.978 16.3 2 3 11 24 10.37 0.723 0.692 0.63 0.709 12.3 2 4 11 27 6.68 0.720 0.708 0.830 0.934 15.5 2 5 12 27 5.69 0.72 0.703 0.799 0.899 15.2 2 6 13 28 6.11 0.716 0.696 0.834 0.938 16.2 3 1 13 27 8 36 0 707 0 699 0 764 0 860 14 95
SampleWeight lb
Specimen
OptimumDensity (pcf)Moisture(%)
LLPLPI
DISTRICT: San Angelo SAMPLE NUMBERCOUNTY: various PRODUCER: CSA/Turner
0-5873 Page B - 5
3 1 13 27 8.36 0.707 0.699 0.764 0.860 14.953 2 9 30 5.00 0.714 0.706 1.101 1.239 20.933 3 16 29 12.10 0.713 0.680 0.784 0.882 16.043 4 10 26 2.95 0.714 0.700 0.790 0.889 15.253 5 16 26 8.51 0.717 0.694 0.572 0.644 11.173 6 1 13 6.90 0.720 0.718 0.198 0.223 3.614 1 11 25 10.79 0.728 0.716 0.695 0.782 12.554 2 11 24 10.33 0.730 0.702 0.630 0.709 11.854 3 12 28 12.95 0.725 0.710 0.869 0.978 16.074 4 11 24 8.87 0.730 0.698 0.630 0.709 11.954 5 15 25 9.47 0.723 0.690 0.549 0.618 10.774 6
0-5873 Page B - 5

MERRICK FLEXOMETER SAMPLE IDENTIFICATION
Triaxial Sieve Percent127.0 0 psi 24.7 1 3/4 2.310.5 15 psi 123.2 1 1/428 7/8 21.921 5/8 29.67 3/8 40.4
Wet Ball 48 #4 51.6% Increase 19 #10
#40 73.6
Initial Total Beam Width Height Load M max FlexuralTray Beam Steps Steps % Moisture (inches) (inches) (lb) in-lb (psi)
1 1 1 20 21.24 0.681 0.709 0.522 0.587 10.31 2 16 31 20.71 0.695 0.697 0.877 0.987 17.61 3 10 28 16.65 0.71 0.71 0.881 0.991 16.61 4 8 30 13.8 0.687 0.705 1.066 1.199 21.01 5 8 28 8.7 0.693 0.702 0.929 1.045 18.31 6 6 36 3.88 0.691 0.705 1.546 1.739 30.42 1 6 32 21.39 0.688 0.711 1.246 1.402 24.22 2 8 28 20.45 0.686 0.709 0.929 1.045 18.22 3 11 26 21.73 0.667 0.697 0.722 0.812 15.12 4 12 26 17.98 0.678 0.680 0.690 0.776 14.82 5 9 27 12.74 0.681 0.712 0.841 0.946 16.42 6 13 31 5.73 0.687 0.706 0.995 1.119 19.73
COUNTY: various PRODUCER: PraterDISTRICT: Brownwood SAMPLE NUMBER
SampleWeight lb
Specimen
OptimumDensity (pcf)Moisture(%)
LLPLPI
0-5873 Page B - 6
333333444444
0-5873 Page B - 6

MERRICK FLEXOMETER SAMPLE IDENTIFICATION
Vulcan (Eastland)
Triaxial Sieve Percent145.1 0 psi 53.0 1 3/4 0.0
5.7 15 psi 193.9 1 1/414 7/812 5/82 3/8
Wet Ball 33 #4 47.0% Increase 12 #10
#40 80.7
Initial Total Beam Width Height Load M max FlexuralTray Beam Steps Steps % Moisture (inches) (inches) (lb) in-lb (psi)
1 1 22 87 2.08 0.737 0.683 4.668 5.252 91.51 2 18 70 2.19 0.713 0.688 3.919 4.409 78.61 3 9 55 4.92 0.723 0.682 3.061 3.444 61.51 4 14 49 4.94 0.7 0.683 2.397 2.697 49.51 5 14 52 8.11 0.718 0.689 2.651 2.982 52.41 6 19 48 9.25 0.721 0.679 2.092 2.354 42.52 1 1 72 3.24 0.710 0.710 4.481 5.041 84.42 2 1 64 5.02 0.722 0.710 3.890 4.376 72.32 3 8 55 6.32 0.725 0.711 3.084 3.470 56.92 4 9 59 7.02 0.724 0.705 3.394 3.818 63.82 5 10 56 7.47 0.709 0.710 3.119 3.509 59.023 1 15 67 2 61 0 720 0 694 3 831 4 310 74 4
Brownwoodvarious
Specimen
OptimumDensity (pcf)Moisture(%)
LLPLPI
SAMPLE NUMBERPRODUCER:
SampleWeight lb
DISTRICT:COUNTY:
0-5873 Page B - 7
3 1 15 67 2.61 0.720 0.694 3.831 4.310 74.43 2 7 57 7.17 0.710 0.701 3.271 3.680 63.23 3 1 51 7.68 0.717 0.693 2.817 3.169 55.183 4 11 56 9.57 0.720 0.689 3.090 3.476 61.13 5 16 50 9.59 0.700 0.681 2.401 2.701 49.983444444
0-5873 Page B - 7

MERRICK FLEXOMETER SAMPLE IDENTIFICATION
Triaxial Sieve Percent128.7 0 psi 41.0 1 3/4
8.7 15 psi 1 1/424 7/818 5/86 3/8
Wet Ball 25 #4 55.4% Increase 16 #10
#40 72.7
Initial Total Beam Width Height Load M max FlexuralTray Beam Steps Steps % Moisture (inches) (inches) (lb) in-lb (psi)
1 2 5 28 15.48 0.698 0.71 0.979 1.101 18.81 1 13 41 13.63 0.7 0.702 1.766 1.987 34.51 3 3 43 12.51 0.717 0.722 2.14 2.408 38.61 4 6 42 12.14 0.719 0.708 2.026 2.279 37.91 5 7 45 11.9 0.73 0.71 2.259 2.541 41.41 6 8 57 7.77 0.728 0.721 3.251 3.657 58.12 1 15 65 5.77 0.701 0.679 3.678 4.138 76.82 2 12 55 9.26 0.715 0.693 2.975 3.347 58.62 3 16 46 11.73 0.718 0.674 2.063 2.321 42.72 4 10 47 12.26 0.735 0.693 2.359 2.654 45.12 5 20 47 12.89 0.713 0.667 1.957 2.202 41.72 6 14 44 13.68 0.720 0.690 1.976 2.223 38.93 1 24 58 8 27 0 694 0 680 2 659 2 991 55 9
COUNTY: various PRODUCER: TabascoDISTRICT: Pharr SAMPLE NUMBER
SampleWeight lb
Specimen
OptimumDensity (pcf)Moisture(%)
LLPLPI
0-5873 Page B - 8
3 1 24 58 8.27 0.694 0.680 2.659 2.991 55.93 2 17 45 10.91 0.695 0.675 1.935 2.177 41.33 3 18 48 10.95 0.700 0.685 2.141 2.409 44.123 4 17 44 13.89 0.695 0.680 1.851 2.082 38.893 5 15 37 15.96 0.683 0.674 1.370 1.541 29.853 64 1 11 58 7.40 0.698 0.675 3.257 3.664 69.084 2 18 50 9.54 0.702 0.673 2.310 2.599 49.134 3 13 44 12.92 0.696 0.678 2.013 2.265 42.424 4 20 48 13.53 0.697 0.676 2.041 2.296 43.354 5 16 39 13.78 0.699 0.677 1.486 1.672 31.274 6 21 39 15.29 0.698 0.677 1.243 1.398 26.29
0-5873 Page B - 8
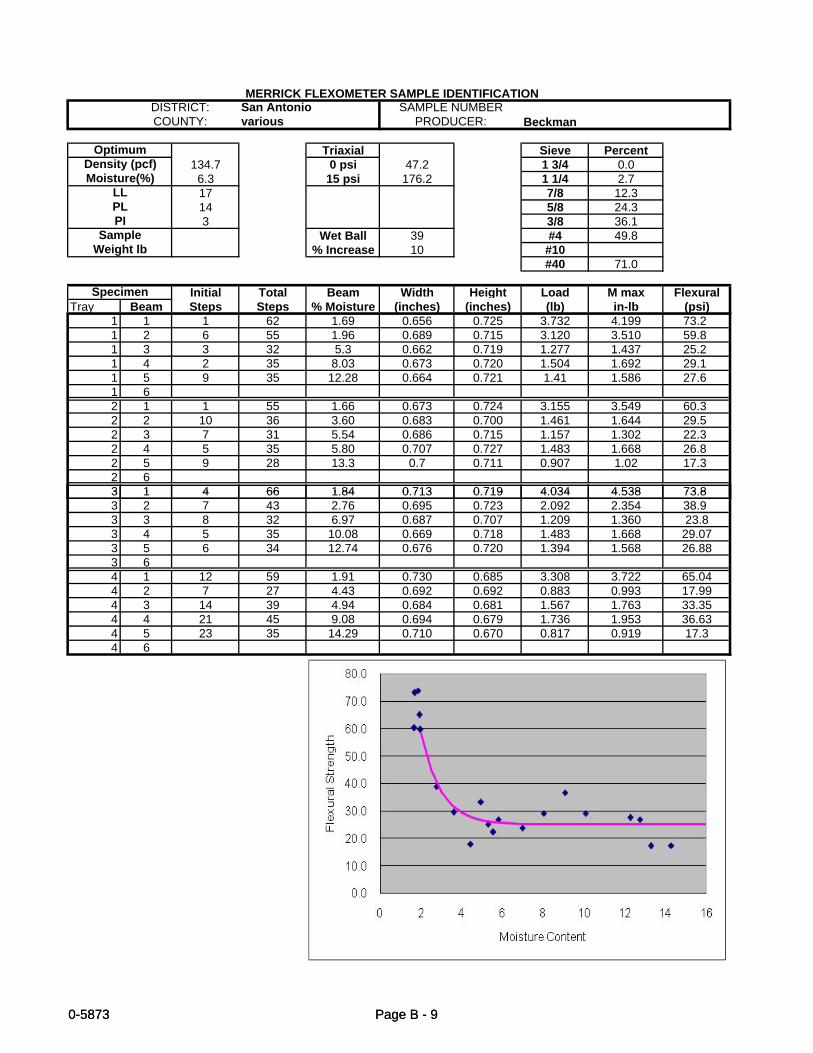
MERRICK FLEXOMETER SAMPLE IDENTIFICATION
Beckman
Triaxial Sieve Percent134.7 0 psi 47.2 1 3/4 0.0
6.3 15 psi 176.2 1 1/4 2.717 7/8 12.314 5/8 24.33 3/8 36.1
Wet Ball 39 #4 49.8% Increase 10 #10
#40 71.0
Initial Total Beam Width Height Load M max FlexuralTray Beam Steps Steps % Moisture (inches) (inches) (lb) in-lb (psi)
1 1 1 62 1.69 0.656 0.725 3.732 4.199 73.21 2 6 55 1.96 0.689 0.715 3.120 3.510 59.81 3 3 32 5.3 0.662 0.719 1.277 1.437 25.21 4 2 35 8.03 0.673 0.720 1.504 1.692 29.11 5 9 35 12.28 0.664 0.721 1.41 1.586 27.61 62 1 1 55 1.66 0.673 0.724 3.155 3.549 60.32 2 10 36 3.60 0.683 0.700 1.461 1.644 29.52 3 7 31 5.54 0.686 0.715 1.157 1.302 22.32 4 5 35 5.80 0.707 0.727 1.483 1.668 26.82 5 9 28 13.3 0.7 0.711 0.907 1.02 17.32 63 1 4 66 1 84 0 713 0 719 4 034 4 538 73 8
COUNTY: various PRODUCER:
Sample
DISTRICT: San Antonio SAMPLE NUMBER
Weight lb
Specimen
OptimumDensity (pcf)Moisture(%)
LLPLPI
0-5873 Page B - 9
3 1 4 66 1.84 0.713 0.719 4.034 4.538 73.83 2 7 43 2.76 0.695 0.723 2.092 2.354 38.93 3 8 32 6.97 0.687 0.707 1.209 1.360 23.83 4 5 35 10.08 0.669 0.718 1.483 1.668 29.073 5 6 34 12.74 0.676 0.720 1.394 1.568 26.883 64 1 12 59 1.91 0.730 0.685 3.308 3.722 65.044 2 7 27 4.43 0.692 0.692 0.883 0.993 17.994 3 14 39 4.94 0.684 0.681 1.567 1.763 33.354 4 21 45 9.08 0.694 0.679 1.736 1.953 36.634 5 23 35 14.29 0.710 0.670 0.817 0.919 17.34 6
0-5873 Page B - 9

MERRICK FLEXOMETER SAMPLE IDENTIFICATION
Triaxial Sieve Percent136.4 0 psi 50.9 1 3/4 0.07.5 15 psi 194.8 1 1/4N/A 7/8N/A 5/8
5 3/8Wet Ball 38 #4 68.1
% Increase 15 #10#40 77.6
Initial Total Beam Width Height Load M max FlexuralTray Beam Steps Steps % Moisture (inches) (inches) (lb) in-lb (psi)
1 1 19 30 13.76 0.699 0.71 0.667 0.75 12.8 1 4 16 28 12.25 0.710 0.723 0.670 0.754 12.2 1 2 19 29 9.80 0.719 0.724 0.598 0.673 10.7 1 3 20 29 9.27 0.715 0.715 0.547 0.615 10.1 1 5 16 28 8.6 0.705 0.714 0.67 0.754 12.6 1 6 21 34 7.08 0.702 0.718 0.854 0.961 15.9 2 1 19 40 16.06 0.711 0.675 1.427 1.605 29.8 2 2 22 38 15.33 0.705 0.700 1.108 1.247 21.6 2 3 15 32 15.1 0.704 0.708 0.991 1.115 19.0 2 4 21 30 9.97 0.714 0.707 0.563 0.633 10.7 2 5 20 32 6.64 0.715 0.724 0.759 0.854 13.7 2 63 1 29 41 16 96 0 674 0 665 0 911 1 025 20 7
PISample
Weight lb
Specimen
Ceder Creek Stone
OptimumDensity (pcf)Moisture(%)
LLPL
COUNTY: various PRODUCER:DISTRICT: Tyler SAMPLE NUMBER
0-5873 B - 10
3 1 29 41 16.96 0.674 0.665 0.911 1.025 20.7 3 3 21 34 14.06 0.694 0.671 0.854 0.961 18.423 2 20 34 13.07 0.707 0.675 0.907 1.020 19.0 3 5 26 33 6.17 0.710 0.680 0.484 0.545 9.963 4 27 34 5.95 0.700 0.668 0.494 0.556 10.673 6444444
0-5873 B - 10

MERRICK FLEXOMETER SAMPLE IDENTIFICATION
Triaxial Sieve Percent141.8 0 psi 50.3 1 3/4 0.06.1 15 psi 244.4 1 1/417 7/8 20.813 5/84 3/8 49.1
Wet Ball 35 #4 61.4400.00 % Increase 15 #10
#40 78.2
Initial Total Beam Width Height Load M max FlexuralTray Beam Steps Steps % Moisture (inches) (inches) (lb) in-lb (psi)
1 1 7 25 12.44 0.702 0.713 0.756 0.851 14.3 1 2 11 33 13.59 0.710 0.710 1.206 1.357 22.7 1 3 10 22 7.01 0.701 0.705 0.51 0.574 9.9 1 4 4 35 4.20 0.725 0.710 1.493 1.680 27.6 1 5 6 94 1.26 0.729 0.722 5.461 6.144 96.9 12 1 8 30 9.79 0.71 0.71 1.066 1.199 20.1 2 2 8 28 12.64 0.708 0.700 0.929 1.045 18.1 2 3 6 28 7.36 0.718 0.709 0.966 1.087 18.1 2 4 1 36 3.76 0.712 0.718 1.582 1.780 29.1 2 52 63 1 7 30 11 86 0 703 0 705 1 086 1 222 21 0
SampleWeight lb
Specimen
OptimumDensity (pcf)Moisture(%)
LLPLPI
COUNTY: various PRODUCER: HunterDISTRICT: San Antonio SAMPLE NUMBER
0-5873 Page B - 11
3 1 7 30 11.86 0.703 0.705 1.086 1.222 21.0 3 2 1 27 10.78 0.711 0.713 0.935 1.052 17.4 3 3 6 38 5.75 0.705 0.718 1.703 1.916 31.73 4 7 94 1.33 0.718 0.707 5.445 6.126 102.633 53 64 1 11 34 8.75 0.712 0.695 1.280 1.440 25.154 2 9 32 11.92 0.729 0.693 1.186 1.334 22.884 3 9 31 8.64 0.715 0.692 1.114 1.253 22.014 4 12 43 4.14 0.714 0.694 1.964 2.210 38.544 54 6
0-5873 Page B - 11

MERRICK FLEXOMETER SAMPLE IDENTIFICATION
Triaxial Sieve Percent140.3 0 psi 70.3 1 3/4 100.06.0 15 psi 253.8 1 1/416 7/8 81.512 5/84 3/8 52.6
Approx. Wet Ball 32 #4400.00 % Increase 11 #10
#40 21.8
Initial Total Beam Width Height Load M max FlexuralTray Beam Steps Steps % Moisture (inches) (inches) (lb) in-lb (psi)
1 1 18 59 8.39 0.712 0.670 3.066 3.449 64.911 2 20 43 13.30 0.703 0.680 1.622 1.825 33.721 3 11 55 7.57 0.725 0.688 3.007 3.383 59.071 4 14 58 5.14 0.724 0.685 3.155 3.549 62.661 5 14 90 1.98 0.718 0.692 5.150 5.794 101.251 62 1 3 46 10.57 0.72 0.718 2.39 2.689 43.5 2 2 1 51 7.28 0.722 0.713 2.817 3.169 51.8 2 3 5 54 7.99 0.714 0.716 3.049 3.43 56.3 2 4 1 95 2.77 0.725 0.720 5.513 6.202 98.8 2 5 7 61 3.23 0.724 0.722 3.599 4.049 64.4 2 63 1 16 46 11 28 0 710 0 705 2 063 2 321 39 52
COUNTY: various PRODUCER: CemexDISTRICT: San Antonio SAMPLE NUMBER
SampleWeight lb
Specimen
OptimumDensity (pcf)Moisture(%)
LLPLPI
0-5873 Page B - 12
3 1 16 46 11.28 0.710 0.705 2.063 2.321 39.523 2 7 54 6.27 0.709 0.720 3.019 3.396 55.323 3 1 77 3.26 0.735 0.718 4.803 5.403 85.453 4 10 70 4.77 0.728 0.711 4.221 4.749 77.44334 1 10 49 10.32 0.694 0.720 2.528 2.844 47.44 2 8 46 9.39 0.693 0.717 2.323 2.613 43.984 3 4 45 5.86 0.690 0.724 2.299 2.586 42.944 4 13 93 4.05 0.700 0.724 5.263 5.921 96.994 5 5 57 5.81 0.719 0.724 3.301 3.714 59.234
0-5873 Page B - 12
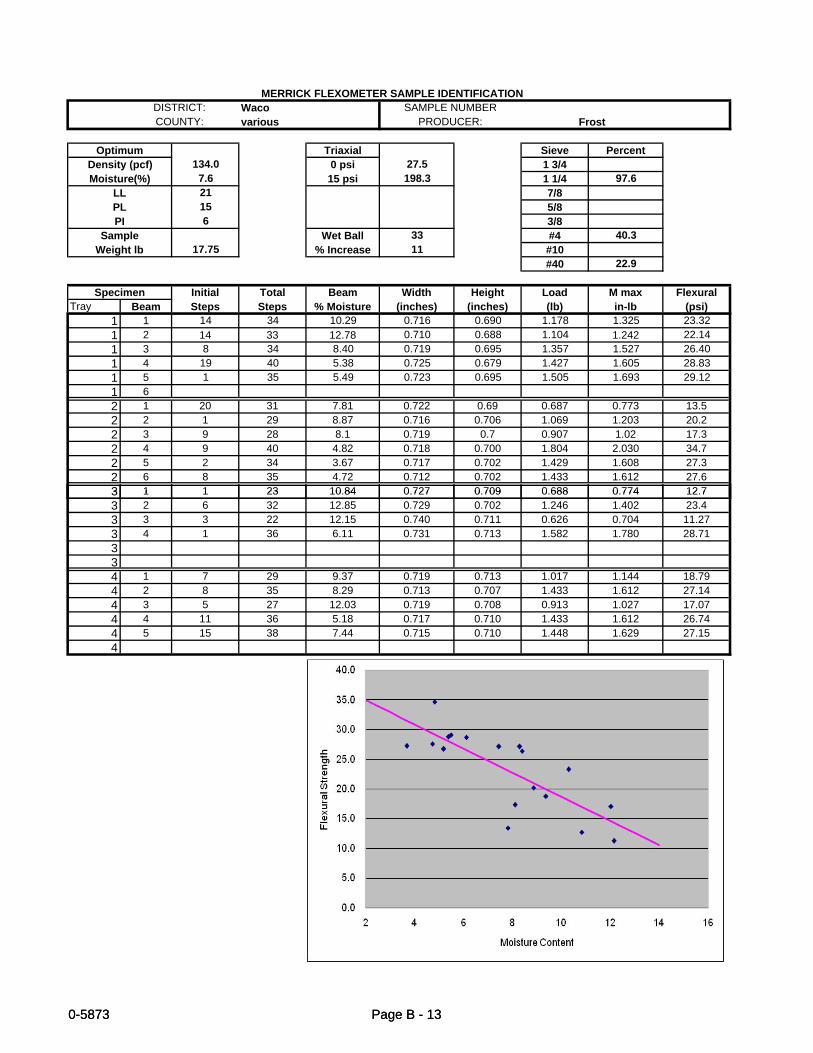
MERRICK FLEXOMETER SAMPLE IDENTIFICATION
Triaxial Sieve Percent134.0 0 psi 27.5 1 3/47.6 15 psi 198.3 1 1/4 97.621 7/815 5/86 3/8
Wet Ball 33 #4 40.317.75 % Increase 11 #10
#40 22.9
Initial Total Beam Width Height Load M max FlexuralTray Beam Steps Steps % Moisture (inches) (inches) (lb) in-lb (psi)
1 1 14 34 10.29 0.716 0.690 1.178 1.325 23.321 2 14 33 12.78 0.710 0.688 1.104 1.242 22.141 3 8 34 8.40 0.719 0.695 1.357 1.527 26.401 4 19 40 5.38 0.725 0.679 1.427 1.605 28.831 5 1 35 5.49 0.723 0.695 1.505 1.693 29.121 62 1 20 31 7.81 0.722 0.69 0.687 0.773 13.5 2 2 1 29 8.87 0.716 0.706 1.069 1.203 20.2 2 3 9 28 8.1 0.719 0.7 0.907 1.02 17.3 2 4 9 40 4.82 0.718 0.700 1.804 2.030 34.7 2 5 2 34 3.67 0.717 0.702 1.429 1.608 27.3 2 6 8 35 4.72 0.712 0.702 1.433 1.612 27.6 3 1 1 23 10 84 0 727 0 709 0 688 0 774 12 7
COUNTY: various PRODUCER: FrostDISTRICT: Waco SAMPLE NUMBER
SampleWeight lb
Specimen
OptimumDensity (pcf)Moisture(%)
LLPLPI
0-5873 Page B - 13
3 1 1 23 10.84 0.727 0.709 0.688 0.774 12.7 3 2 6 32 12.85 0.729 0.702 1.246 1.402 23.4 3 3 3 22 12.15 0.740 0.711 0.626 0.704 11.273 4 1 36 6.11 0.731 0.713 1.582 1.780 28.71334 1 7 29 9.37 0.719 0.713 1.017 1.144 18.794 2 8 35 8.29 0.713 0.707 1.433 1.612 27.144 3 5 27 12.03 0.719 0.708 0.913 1.027 17.074 4 11 36 5.18 0.717 0.710 1.433 1.612 26.744 5 15 38 7.44 0.715 0.710 1.448 1.629 27.154
0-5873 Page B - 13

MERRICK FLEXOMETER SAMPLE IDENTIFICATION
Triaxial Sieve Percent138.2 0 psi 43.3 1 3/45.8 15 psi 190.1 1 1/421 7/8 15.114 5/87 3/8 43.6
Wet Ball 21 #4 60.2% Increase 5 #10
#40 81.4
Initial Total Beam Width Height Load M max FlexuralTray Beam Steps Steps % Moisture (inches) (inches) (lb) in-lb (psi)
1 1 15 23 4.58 0.696 0.694 0.398 0.448 8.011 2 15 21 0.93 0.700 0.686 0.285 0.321 5.861 3 15 20 3.70 0.697 0.693 0.232 0.261 4.691 4 13 19 4.71 0.715 0.695 0.257 0.289 5.021 5 14 25 2.94 0.705 0.689 0.227 0.289 0.9412 1 2 21 5.93 0.692 0.701 0.575 0.647 11.4 2 2 15 20 4.98 0.683 0.700 0.232 0.261 4.7 2 3 11 19 5.07 0.68 0.7 0.322 0.362 6.5 2 4 19 27 8.53 0.688 0.690 0.464 0.522 9.6 2 5 19 23 0.68 0.682 0.658 0.217 0.244 5.0 23 1 13 20 5 87 0 690 0 698 0 308 0 347 6 18
SampleWeight lb
Specimen
OptimumDensity (pcf)Moisture(%)
LLPLPI
DISTRICT: Dallas SAMPLE NUMBERCOUNTY: various PRODUCER: TXI
0-5873 Page B - 14
3 1 13 20 5.87 0.690 0.698 0.308 0.347 6.183 2 18 24 9.63 0.702 0.701 0.324 0.365 6.333 3 16 23 7.61 0.705 0.677 0.356 0.401 7.463 4 16 20 7.21 0.676 0.704 0.190 0.214 3.823 5 11 20 6.42 0.685 0.705 0.373 0.420 7.43 64 1 1 31 6.14 0.671 0.721 1.209 1.360 23.354 2 15 34 10.42 0.690 0.705 1.139 1.281 22.474 3 1 23 5.88 0.661 0.722 0.688 0.774 13.54 4 1 28 3.13 0.683 0.721 1.001 1.126 19.064 54 6
0-5873 Page B - 14
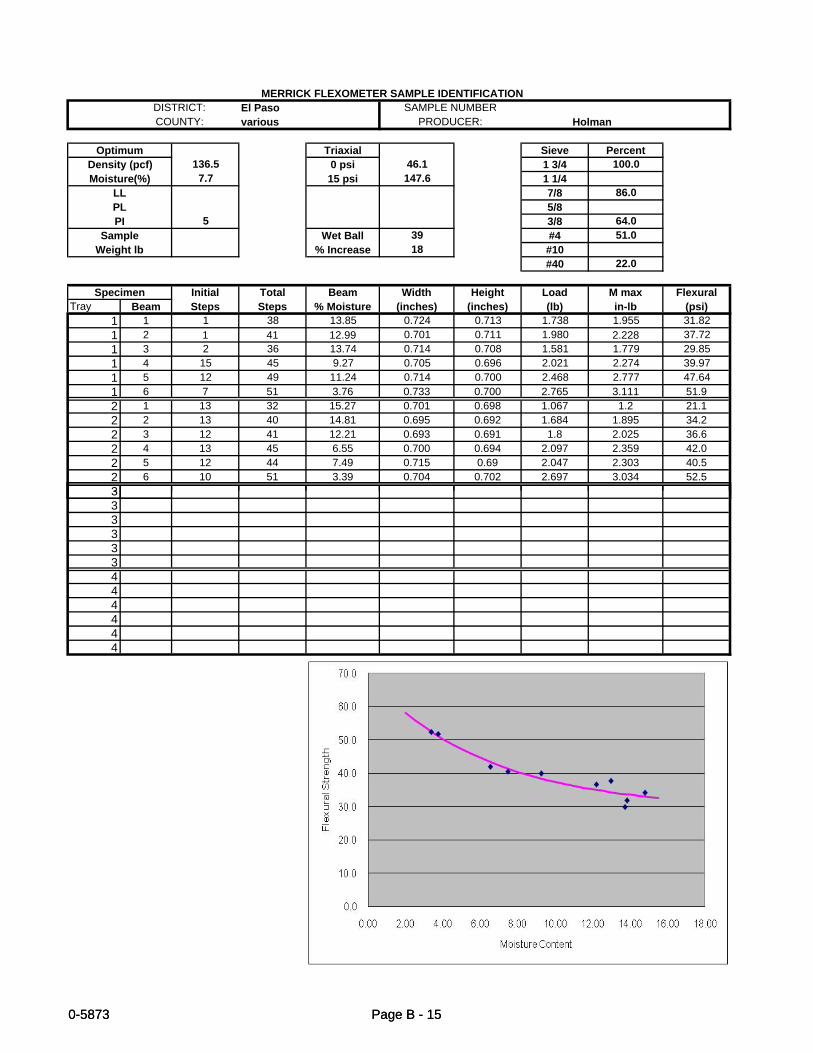
MERRICK FLEXOMETER SAMPLE IDENTIFICATION
Triaxial Sieve Percent136.5 0 psi 46.1 1 3/4 100.07.7 15 psi 147.6 1 1/4
7/8 86.05/8
5 3/8 64.0Wet Ball 39 #4 51.0
% Increase 18 #10#40 22.0
Initial Total Beam Width Height Load M max FlexuralTray Beam Steps Steps % Moisture (inches) (inches) (lb) in-lb (psi)
1 1 1 38 13.85 0.724 0.713 1.738 1.955 31.821 2 1 41 12.99 0.701 0.711 1.980 2.228 37.721 3 2 36 13.74 0.714 0.708 1.581 1.779 29.851 4 15 45 9.27 0.705 0.696 2.021 2.274 39.971 5 12 49 11.24 0.714 0.700 2.468 2.777 47.641 6 7 51 3.76 0.733 0.700 2.765 3.111 51.9 2 1 13 32 15.27 0.701 0.698 1.067 1.2 21.1 2 2 13 40 14.81 0.695 0.692 1.684 1.895 34.2 2 3 12 41 12.21 0.693 0.691 1.8 2.025 36.6 2 4 13 45 6.55 0.700 0.694 2.097 2.359 42.0 2 5 12 44 7.49 0.715 0.69 2.047 2.303 40.5 2 6 10 51 3.39 0.704 0.702 2.697 3.034 52.5 3
COUNTY: various PRODUCER: HolmanDISTRICT: El Paso SAMPLE NUMBER
SampleWeight lb
Specimen
OptimumDensity (pcf)Moisture(%)
LLPLPI
0-5873 Page B - 15
333333444444
0-5873 Page B - 15

MERRICK FLEXOMETER SAMPLE IDENTIFICATION
5Triaxial Sieve Percent
135.0 0 psi 50.2 1 3/4 0.07.4 15 psi 142.9 1 1/4
7/85/8
5 3/8Wet Ball 27 #4 49.0
% Increase 5 #10#40 79.0
Initial Total Beam Width Height Load M max FlexuralTray Beam Steps Steps % Moisture (inches) (inches) (lb) in-lb (psi)
1 1 17 35 10.16 0.687 0.700 1.201 1.351 24.131 2 17 38 8.82 0.676 0.691 1.449 1.630 30.281 3 15 50 2.46 0.673 0.695 2.577 2.899 53.591 4 19 40 6.85 0.670 0.697 1.517 1.707 31.481 5 18 42 4.89 0.679 0.692 1.741 1.959 36.051 6 19 36 14.56 0.681 0.694 1.182 1.330 24.3 2 1 20 36 15.12 0.67 0.707 1.128 1.269 22.8 2 2 22 38 11.45 0.674 0.704 1.179 1.326 23.8 2 3 18 34 8.36 0.673 0.7 1.072 1.206 22.0 2 4 26 46 6.12 0.670 0.709 1.612 1.814 32.3 2 5 24 46 5.65 0.68 0.71 1.744 1.962 34.3 2 6 23 54 3.24 0.672 0.705 2.502 2.815 50.6 3 1 12 30 15 21 0 698 0 710 1 015 1 142 19 49
SampleWeight lb
Specimen
OptimumDensity (pcf)Moisture(%)
LLPLPI
DISTRICT: El Paso SAMPLE NUMBERCOUNTY: various PRODUCER: Jobe
0-5873 Page B - 16
3 1 12 30 15.21 0.698 0.710 1.015 1.142 19.493 2 15 35 13.42 0.692 0.709 1.291 1.452 24.993 3 14 31 9.47 0.689 0.705 1.018 1.145 20.083 4 12 40 8.46 0.694 0.708 1.822 2.050 35.403 5 18 46 6.48 0.697 0.712 2.089 2.350 39.843 6 17 55 2.87 0.696 0.709 2.918 3.283 56.22444444
0-5873 Page B - 16

MERRICK FLEXOMETER SAMPLE IDENTIFICATION
Triaxial Sieve Percent135.7 0 psi 46.2 1 3/4 100.06.9 15 psi 137.9 1 1/4
7/8 85.05/8
3 3/8 64.0Wet Ball 37 #4 50.0
% Increase 17 #10#40 21.0
Initial Total Beam Width Height Load M max FlexuralTray Beam Steps Steps % Moisture (inches) (inches) (lb) in-lb (psi)
1 1 10 31 12.16 0.704 0.704 1.089 1.225 21.031 2 9 32 12.38 0.711 0.712 1.186 1.334 22.191 3 1 31 8.91 0.700 0.718 1.209 1.360 22.601 4 4 31 6.31 0.700 0.717 1.198 1.348 22.481 5 1 32 4.53 0.712 0.722 1.281 1.441 23.331 62 1 16 36 0.679 0.698 1.25 1.406 25.6 2 2 15 34 11.20 0.681 0.693 1.139 1.281 23.5 2 3 11 35 7.67 0.683 0.705 1.356 1.526 27.0 2 4 8 31 2.54 0.673 0.704 1.137 1.279 23.0 2 5 16 31 1.85 0.68 0.691 0.877 0.987 18.2 2 63 1 3 31 11 37 0 692 0 721 1 205 1 356 22 63
COUNTY: various PRODUCER: WyertsDISTRICT: El Paso SAMPLE NUMBER
SampleWeight lb
Specimen
OptimumDensity (pcf)Moisture(%)
LLPLPI
0-5873 Page B - 17
3 1 3 31 11.37 0.692 0.721 1.205 1.356 22.633 2 1 30 13.08 0.690 0.718 1.138 1.280 21.573 3 1 31 9.34 0.692 0.722 1.209 1.360 22.623 4 1 28 6.88 0.688 0.709 1.001 1.126 19.573 53 64 1 1 31 6.14 0.671 0.721 1.209 1.360 23.354 2 15 34 10.42 0.690 0.705 1.139 1.281 22.474 3 1 23 5.88 0.661 0.722 0.688 0.774 13.54 4 1 28 3.13 0.683 0.721 1.001 1.126 19.064 54 6
0-5873 Page B - 17

MERRICK FLEXOMETER SAMPLE IDENTIFICATION
Triaxial Sieve Percent0 psi 1 3/4
15 psi 1 1/47/85/83/8
Wet Ball #4% Increase #10
#40
Initial Total Beam Width Height Load M max FlexuralTray Beam Steps Steps % Moisture (inches) (inches) (lb) in-lb (psi)
1 1 22 27 14.18 0.656 0.703 0.325 0.366 6.771 2 14 21 13.65 0.642 0.716 0.342 0.385 7.031 3 11 20 12.97 0.660 0.715 0.391 0.440 7.831 4 10 23 5.69 0.650 0.710 0.595 0.669 12.241 5 12 21 8.02 0.655 0.710 0.415 0.467 8.501 62 1 13 20 12.95 0.658 0.715 0.324 0.365 6.5 2 2 18 25 11.12 0.639 0.698 0.410 0.461 8.9 2 3 19 25 6.96 0.658 0.689 0.358 0.403 7.8 2 4 20 27 5.36 0.645 0.700 0.440 0.495 9.4 2 5 14 25 3.83 0.658 0.708 0.59 0.664 12.1 2 63 1 21 25 15 08 0 656 0 703 0 248 0 279 5 16
Weight lb
Specimen
OptimumDensity (pcf)Moisture(%)
LLPLPI
DISTRICT: Lubbock SAMPLE NUMBERCOUNTY: various PRODUCER: Reworked Base
Sample
0-5873 Page B - 18
3 1 21 25 15.08 0.656 0.703 0.248 0.279 5.163 2 19 24 12.97 0.642 0.716 0.293 0.330 6.033 3 16 22 12.65 0.660 0.715 0.316 0.356 6.333 4 18 26 4.75 0.650 0.710 0.477 0.537 9.833 5 16 28 2.87 0.655 0.710 0.712 0.801 14.583 64 1 18 23 11.50 0.661 0.704 0.282 0.317 5.814 2 14 20 9.35 0.669 0.700 0.286 0.322 5.94 3 19 24 7.46 0.670 0.698 0.293 0.330 6.064 4 19 26 4.35 0.659 0.694 0.425 0.478 9.014 5 15 24 3.14 0.663 0.700 0.484 0.545 10.044 6
Untreated Material
0-5873 Page B - 18

MERRICK FLEXOMETER SAMPLE IDENTIFICATION
Triaxial Sieve Percent0 psi 1 3/4
15 psi 1 1/47/85/83/8
Wet Ball #4% Increase #10
#40
Initial Total Beam Width Height Load M max FlexuralTray Beam Steps Steps % Moisture (inches) (inches) (lb) in-lb (psi)
1 1 19 27 11.00 0.710 0.691 0.494 0.556 9.851 2 15 24 10.80 0.693 0.697 0.484 0.545 9.691 3 12 20 9.30 0.695 0.690 0.359 0.404 7.341 4 9 24 6.70 0.709 0.697 0.684 0.770 13.421 5 15 29 6.10 0.716 0.692 0.828 0.932 16.291 6 11 32 4.00 0.707 0.700 1.199 1.349 23.4 2 1 18 25 11.63 0.703 0.689 0.41 0.461 8.3 2 2 17 26 10.04 0.697 0.690 0.526 0.592 10.7 2 3 18 27 8.14 0.697 0.688 0.546 0.614 11.2 2 4 13 23 3.31 0.713 0.698 0.500 0.563 9.7 2 5 16 28 5.18 0.703 0.694 0.712 0.801 14.2 2 6 14 28 6.81 0.702 0.689 0.796 0.896 16.2 3 1 9 21 10 08 0 721 0 710 0 501 0 564 9 31
Weight lb
Specimen
OptimumDensity (pcf)Moisture(%)
LLPLPI
DISTRICT: San Angelo SAMPLE NUMBERCOUNTY: various PRODUCER: CSA/Turner
Sample
0-5873 Page B - 19
3 1 9 21 10.08 0.721 0.710 0.501 0.564 9.313 2 11 25 8.33 0.723 0.708 0.695 0.782 12.943 3 9 17 6.67 0.722 0.708 0.290 0.326 5.393 4 10 26 5.73 0.703 0.702 0.790 0.889 15.373 5 9 29 4.47 0.713 0.707 1.028 1.157 19.483 6 10 27 2.99 0.718 0.704 0.859 0.966 16.274 1 11 21 10.74 0.715 0.710 0.447 0.503 8.384 2 10 27 9.68 0.723 0.722 0.859 0.966 15.364 3 6 29 6.30 0.723 0.716 1.084 1.220 19.764 4 10 15 4.77 0.715 0.705 0.175 0.197 3.324 5 2 28 2.93 0.715 0.708 1.036 1.166 19.564
Same Day Flexometer Test
0-5873 Page B - 19

MERRICK FLEXOMETER SAMPLE IDENTIFICATION
Triaxial Sieve Percent0 psi 1 3/4
15 psi 1 1/47/85/83/8
Wet Ball #4% Increase #10
#40
Specimen Beam Width Height Length Flexural FlexuralTray Beam % Moisture (inches) (inches) (inches) (psi) (psi)
1 1 12.02 0.710 0.690 4 0.65 11.541 2 7.52 0.700 0.697 4 0.94 16.591 3 5.34 0.704 0.690 4 1.12 20.051 4 5.80 0.698 0.695 4 1.12 19.931 512 1 12.51 0.731 0.694 4 0.70 11.932 2 11.22 0.731 0.688 4 0.70 12.142 3 8.06 0.733 0.7 4 0.96 16.042 4 7.93 0.723 0.694 4 1.02 17.572 5 5.40 0.723 0.694 4 1.14 19.6423 1 12 49 0 720 0 720 4 0 78 12 54
Weight lb
OptimumDensity (pcf)Moisture(%)
LLPLPI
DISTRICT: San Angelo SAMPLE NUMBERCOUNTY: various PRODUCER: CSA/Turner
Sample
0-5873 Page B - 20
3 1 12.49 0.720 0.720 4 0.78 12.543 2 11.65 0.728 0.725 4 0.78 12.233 3 9.21 0.725 0.725 4 1.10 17.323 4 6.06 0.716 0.724 4 1.10 17.593 5 4.31 0.726 0.726 4 1.32 20.703 6 3.78 0.714 0.729 4 1.34 21.194 1 14.34 0.725 0.710 4 0.62 10.184 2 13.52 0.723 0.710 4 0.72 11.854 3 11.14 0.725 0.716 4 0.86 13.884 4 8.34 0.721 0.717 4 1.08 17.484 5 3.45 0.720 0.718 4 1.40 22.634 6 4.23 0.725 0.718 4 1.28 20.55
Same Day Snapshot Test
0-5873 Page B - 20

MERRICK FLEXOMETER SAMPLE IDENTIFICATION
Triaxial Sieve Percent127.0 0 psi 45.0 1 3/4 2.310.5 15 psi 177.0 1 1/428 7/8 21.921 5/8 29.67 3/8 40.4
Wet Ball 48 #4 51.6% Increase 19 #10
#40 73.6
Initial Total Beam Width Height Load M max FlexuralTray Beam Steps Steps % Moisture (inches) (inches) (lb) in-lb (psi)
1 1 19 31 2.27 0.681 0.686 0.786 0.884 16.571 2 19 26 4.06 0.665 0.685 0.425 0.478 9.201 3 19 38 1.75 0.667 0.681 1.348 1.517 29.351 4 20 27 15.05 0.672 0.677 0.440 0.495 9.631 5 15 33 19.05 0.678 0.703 1.132 1.274 22.851 6 13 19 8.08 0.692 0.697 0.270 0.304 5.4 2 1 16 23 15.7 0.677 0.682 0.377 0.424 8.1 2 2 8 32 2.10 0.677 0.692 1.276 1.436 26.6 2 3 15 22 12 0.687 0.697 0.36 0.405 7.3 2 4 11 25 18.30 0.682 0.702 0.695 0.782 13.9 2 5 20 23 3.5 0.687 0.681 0.176 0.198 3.7 2 63 1 17 30 18 00 0 682 0 703 0 811 0 912 16 27
Weight lb
Specimen
OptimumDensity (pcf)Moisture(%)
LLPLPI
DISTRICT: Brownwood SAMPLE NUMBERCOUNTY: various PRODUCER: Prater
Sample
0-5873 Page B - 21
3 1 17 30 18.00 0.682 0.703 0.811 0.912 16.273 2 15 21 11.00 0.686 0.700 0.301 0.339 6.053 3 11 21 3.40 0.697 0.708 0.447 0.503 8.643 4 5 20 5.70 0.700 0.728 0.513 0.577 9.333 5 14 21 6.40 0.690 0.696 0.342 0.385 6.913 6 14 22 14.60 0.689 0.700 0.401 0.451 8.014 1 13 17 8.80 0.682 0.705 0.169 0.190 3.374 2 16 27 2.10 0.695 0.680 0.641 0.721 13.474 3 14 21 11.60 0.682 0.697 0.342 0.385 6.994 4 11 19 14.50 0.677 0.705 0.336 0.378 6.734 5 23 31 16.50 0.685 0.682 0.556 0.626 11.794 6
Same Day Flexometer Test
0-5873 Page B - 21

MERRICK FLEXOMETER SAMPLE IDENTIFICATION
Triaxial Sieve Percent127.0 0 psi 45.0 1 3/4 2.310.5 15 psi 177.0 1 1/428 7/8 21.921 5/8 29.67 3/8 40.4
Wet Ball 48 #4 51.6% Increase 19 #10
#40 73.6
Beam Width Height Length Flexural FlexuralTray Beam % Moisture (inches) (inches) (inches) (psi) (psi)
1 1 2.75 0.681 0.678 4 1.12 21.471 2 6.70 0.698 0.678 4 0.78 14.591 3 18.07 0.698 0.679 4 0.58 10.811 4 13.51 0.702 0.683 4 0.62 11.361 5 1.47 0.714 0.695 4 1.92 33.4012 1 5.67 0.685 0.707 4 0.92 16.122 2 3.02 0.679 0.710 4 0.92 16.132 3 19.02 0.683 0.708 4 0.66 11.572 4 15.36 0.696 0.710 4 0.68 11.632 5 8.25 0.687 0.706 4 0.96 16.822 4.04 0.687 0.708 4 0.90 15.683 1 2 70 0 694 0 685 4 1 52 28 01
Weight lb
Specimen
OptimumDensity (pcf)Moisture(%)
LLPLPI
DISTRICT: Brownwood SAMPLE NUMBERCOUNTY: various PRODUCER: Prater
Sample
0-5873 Page B - 22
3 1 2.70 0.694 0.685 4 1.52 28.013 2 7.12 0.695 0.690 4 0.78 14.143 3 20.00 0.675 0.675 4 0.50 9.753 4 15.16 0.727 0.695 4 0.58 9.913 5 9.58 0.698 0.687 4 0.76 13.843 6 1.97 0.691 0.737 4 1.12 17.904 1 -538.12 0.682 0.709 4 1.24 21.704 2 5.83 0.685 0.704 4 0.80 14.144 3 19.35 0.690 0.687 4 0.62 11.424 4 15.26 0.679 0.704 4 0.60 10.704 5 10.59 0.692 0.706 4 0.76 13.224 6 2.67 0.698 0.708 4 0.96 16.46
Same Day Snapshot Test
0-5873 Page B - 22
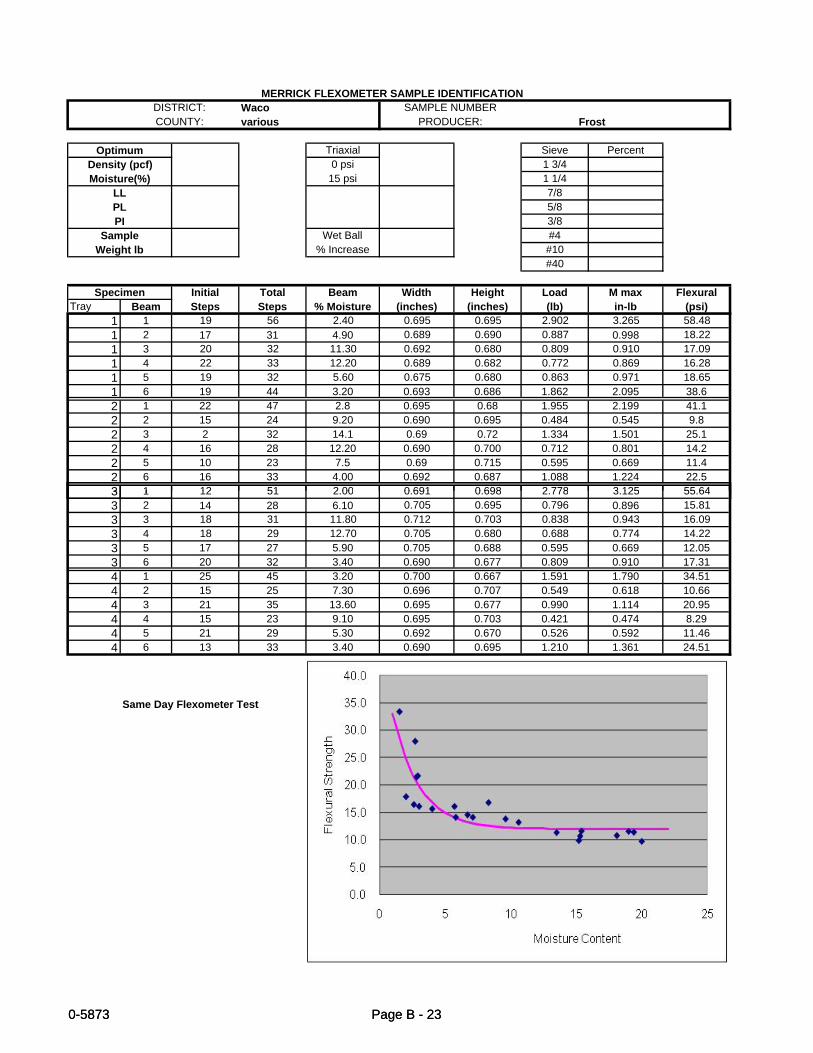
MERRICK FLEXOMETER SAMPLE IDENTIFICATION
Triaxial Sieve Percent0 psi 1 3/4
15 psi 1 1/47/85/83/8
Wet Ball #4% Increase #10
#40
Initial Total Beam Width Height Load M max FlexuralTray Beam Steps Steps % Moisture (inches) (inches) (lb) in-lb (psi)
1 1 19 56 2.40 0.695 0.695 2.902 3.265 58.481 2 17 31 4.90 0.689 0.690 0.887 0.998 18.221 3 20 32 11.30 0.692 0.680 0.809 0.910 17.091 4 22 33 12.20 0.689 0.682 0.772 0.869 16.281 5 19 32 5.60 0.675 0.680 0.863 0.971 18.651 6 19 44 3.20 0.693 0.686 1.862 2.095 38.6 2 1 22 47 2.8 0.695 0.68 1.955 2.199 41.1 2 2 15 24 9.20 0.690 0.695 0.484 0.545 9.8 2 3 2 32 14.1 0.69 0.72 1.334 1.501 25.1 2 4 16 28 12.20 0.690 0.700 0.712 0.801 14.2 2 5 10 23 7.5 0.69 0.715 0.595 0.669 11.4 2 6 16 33 4.00 0.692 0.687 1.088 1.224 22.5 3 1 12 51 2 00 0 691 0 698 2 778 3 125 55 64
Weight lb
Specimen
OptimumDensity (pcf)Moisture(%)
LLPLPI
DISTRICT: Waco SAMPLE NUMBERCOUNTY: various PRODUCER: Frost
Sample
0-5873 Page B - 23
3 1 12 51 2.00 0.691 0.698 2.778 3.125 55.643 2 14 28 6.10 0.705 0.695 0.796 0.896 15.813 3 18 31 11.80 0.712 0.703 0.838 0.943 16.093 4 18 29 12.70 0.705 0.680 0.688 0.774 14.223 5 17 27 5.90 0.705 0.688 0.595 0.669 12.053 6 20 32 3.40 0.690 0.677 0.809 0.910 17.314 1 25 45 3.20 0.700 0.667 1.591 1.790 34.514 2 15 25 7.30 0.696 0.707 0.549 0.618 10.664 3 21 35 13.60 0.695 0.677 0.990 1.114 20.954 4 15 23 9.10 0.695 0.703 0.421 0.474 8.294 5 21 29 5.30 0.692 0.670 0.526 0.592 11.464 6 13 33 3.40 0.690 0.695 1.210 1.361 24.51
Same Day Flexometer Test
0-5873 Page B - 23
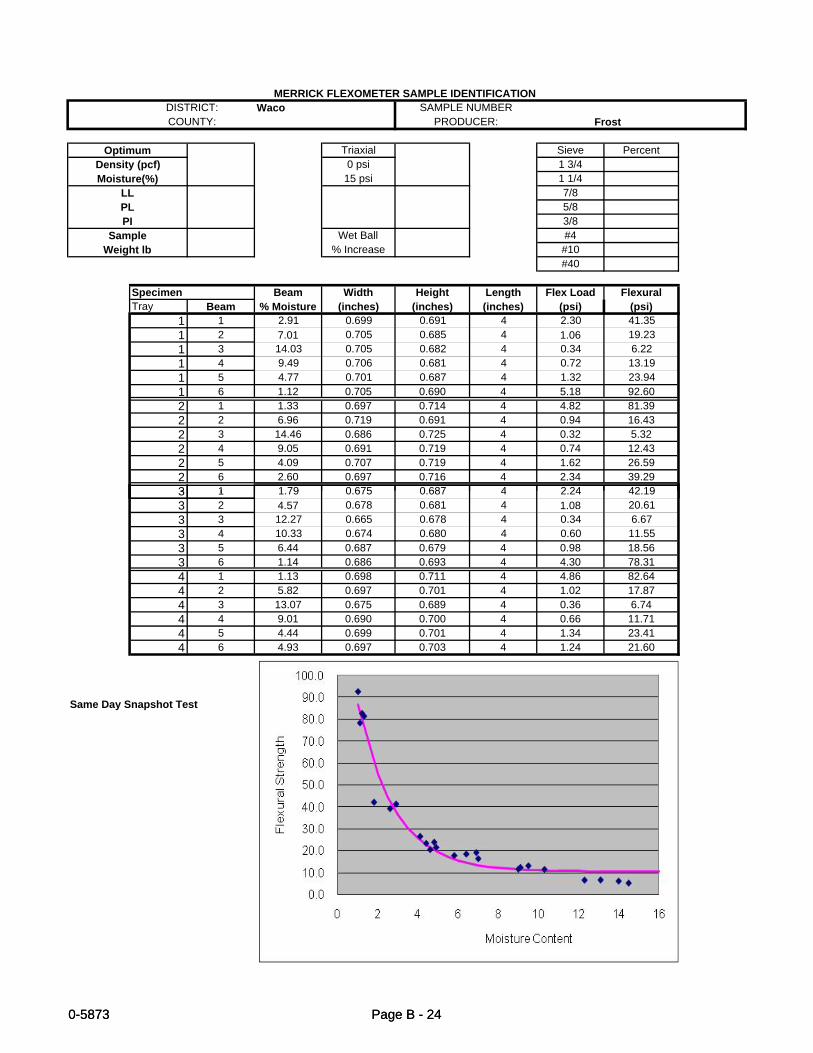
MERRICK FLEXOMETER SAMPLE IDENTIFICATION
Triaxial Sieve Percent0 psi 1 3/4
15 psi 1 1/47/85/83/8
Wet Ball #4% Increase #10
#40
Specimen Beam Width Height Length Flex Load FlexuralTray Beam % Moisture (inches) (inches) (inches) (psi) (psi)
1 1 2.91 0.699 0.691 4 2.30 41.351 2 7.01 0.705 0.685 4 1.06 19.231 3 14.03 0.705 0.682 4 0.34 6.221 4 9.49 0.706 0.681 4 0.72 13.191 5 4.77 0.701 0.687 4 1.32 23.941 6 1.12 0.705 0.690 4 5.18 92.602 1 1.33 0.697 0.714 4 4.82 81.392 2 6.96 0.719 0.691 4 0.94 16.432 3 14.46 0.686 0.725 4 0.32 5.322 4 9.05 0.691 0.719 4 0.74 12.432 5 4.09 0.707 0.719 4 1.62 26.592 6 2.60 0.697 0.716 4 2.34 39.293 1 1 79 0 675 0 687 4 2 24 42 19
Weight lb
OptimumDensity (pcf)Moisture(%)
LLPLPI
DISTRICT: Waco SAMPLE NUMBERCOUNTY: PRODUCER: Frost
Sample
0-5873 Page B - 24
3 1 1.79 0.675 0.687 4 2.24 42.193 2 4.57 0.678 0.681 4 1.08 20.613 3 12.27 0.665 0.678 4 0.34 6.673 4 10.33 0.674 0.680 4 0.60 11.553 5 6.44 0.687 0.679 4 0.98 18.563 6 1.14 0.686 0.693 4 4.30 78.314 1 1.13 0.698 0.711 4 4.86 82.644 2 5.82 0.697 0.701 4 1.02 17.874 3 13.07 0.675 0.689 4 0.36 6.744 4 9.01 0.690 0.700 4 0.66 11.714 5 4.44 0.699 0.701 4 1.34 23.414 6 4.93 0.697 0.703 4 1.24 21.60
Same Day Snapshot Test
0-5873 Page B - 24

MERRICK FLEXOMETER SAMPLE IDENTIFICATION
Triaxial Sieve Percent0 psi 1 3/4
15 psi 1 1/47/85/83/8
Wet Ball #4% Increase #10
#40
Specimen Beam Width Height Length Flex Load FlexuralTray Beam % Moisture (inches) (inches) (inches) (psi) (psi)
1 1 13.89 0.675 0.714 4 1.09 19.011 2 11.89 0.672 0.709 4 1.04 18.471 3 8.25 0.670 0.717 4 1.38 24.041 4 6.47 0.681 0.707 4 1.39 24.501 5 3.45 0.674 0.710 4 1.74 30.731 62 1 15.04 0.682 0.711 4 1.05 18.272 2 12.78 0.679 0.705 4 1.18 20.982 3 9.45 0.676 0.709 4 1.22 21.542 4 4.12 0.685 0.707 4 1.78 31.192 52 63 1 11 59 0 691 0 709 4 1 24 21 42
Weight lb
OptimumDensity (pcf)Moisture(%)
LLPLPI
DISTRICT: Lubbock SAMPLE NUMBERCOUNTY: PRODUCER: Reworked Material
Sample
0-5873 Page B - 25
3 1 11.59 0.691 0.709 4 1.24 21.423 2 8.45 0.696 0.714 4 1.28 21.643 3 5.74 0.692 0.711 4 1.46 25.043 4 3.75 0.697 0.709 4 1.86 31.853 53 64 1 10.45 0.699 0.711 4 1.22 20.724 2 6.78 0.696 0.705 4 1.55 26.884 3 5.24 0.704 0.710 4 1.51 25.534 4 3.78 0.700 0.709 4 1.72 29.334 5 2.45 0.702 0.714 4 2.24 37.554 6 4.93 1.24 21.60
with 1% Cement
0-5873 Page B - 25

MERRICK FLEXOMETER SAMPLE IDENTIFICATION
Triaxial Sieve Percent0 psi 1 3/4
15 psi 1 1/47/85/83/8
Wet Ball #4% Increase #10
#40
Specimen Beam Width Height Length Flex Load FlexuralTray Beam % Moisture (inches) (inches) (inches) (psi) (psi)
1 14.89 2.91 0.698 0.715 4 2.30 38.671 12 7.01 0.702 0.709 4 2.50 42.511 7.42 14.03 0.690 0.712 4 2.78 47.691 5 9.49 0.694 0.717 4 3.08 51.801 2.89 4.77 0.700 0.714 4 4.43 74.4812 15.3 1.33 0.689 0.709 4 2.04 35.342 12 6.96 0.685 0.705 4 2.40 42.302 10.45 14.46 0.692 0.708 4 2.70 46.702 8 9.05 0.680 0.702 4 2.86 51.212 4.35 4.09 0.683 0.709 4 3.02 52.7823 11 1 79 0 701 0 714 4 2 40 40 29
Weight lb
OptimumDensity (pcf)Moisture(%)
LLPLPI
DISTRICT: Lubbock SAMPLE NUMBERCOUNTY: PRODUCER: Reworked Base
Sample
0-5873 Page B - 26
3 11 1.79 0.701 0.714 4 2.40 40.293 10 4.57 0.700 0.715 4 2.64 44.263 5 12.27 0.705 0.710 4 3.40 57.403 3 10.33 0.701 0.712 4 3.98 67.20334 8 1.13 0.710 0.709 4 2.70 45.394 5 5.82 0.713 0.702 4 2.90 49.524 4 13.07 0.708 0.700 4 3.40 58.804 3 9.01 0.708 0.704 4 4.20 71.8244
With 3% Cement
0-5873 Page B - 26
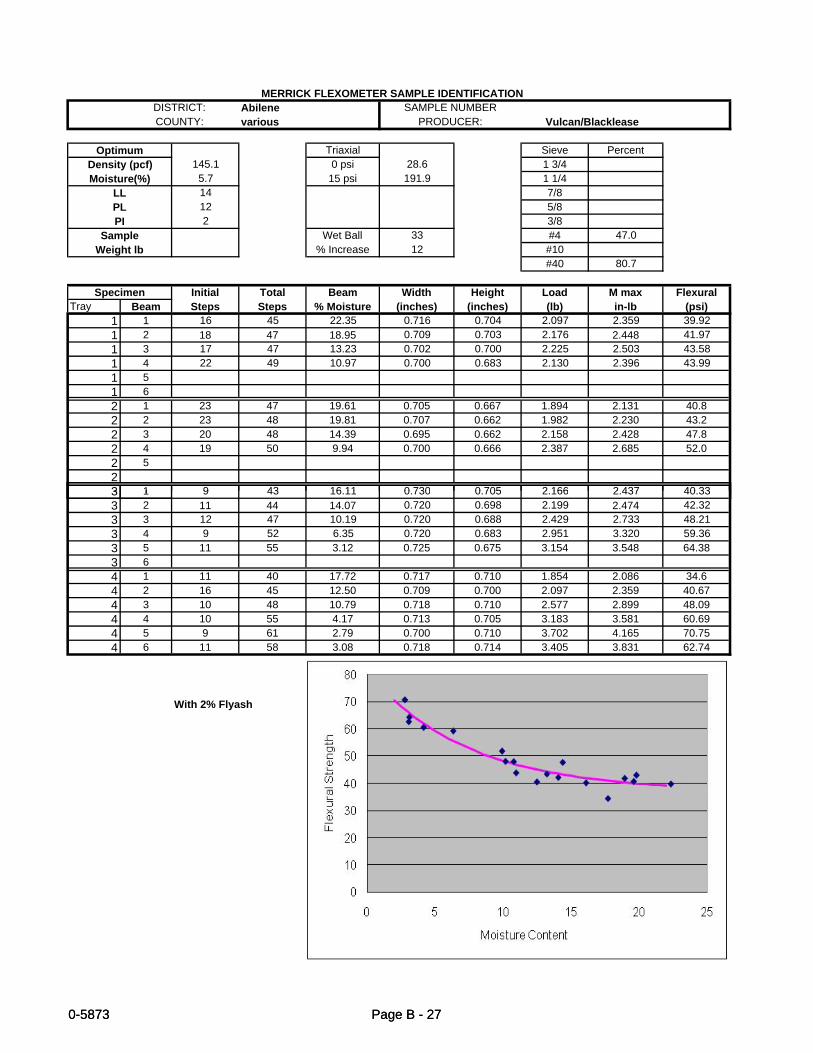
MERRICK FLEXOMETER SAMPLE IDENTIFICATION
Triaxial Sieve Percent145.1 0 psi 28.6 1 3/45.7 15 psi 191.9 1 1/414 7/812 5/82 3/8
Wet Ball 33 #4 47.0% Increase 12 #10
#40 80.7
Initial Total Beam Width Height Load M max FlexuralTray Beam Steps Steps % Moisture (inches) (inches) (lb) in-lb (psi)
1 1 16 45 22.35 0.716 0.704 2.097 2.359 39.921 2 18 47 18.95 0.709 0.703 2.176 2.448 41.971 3 17 47 13.23 0.702 0.700 2.225 2.503 43.581 4 22 49 10.97 0.700 0.683 2.130 2.396 43.991 51 62 1 23 47 19.61 0.705 0.667 1.894 2.131 40.8 2 2 23 48 19.81 0.707 0.662 1.982 2.230 43.2 2 3 20 48 14.39 0.695 0.662 2.158 2.428 47.8 2 4 19 50 9.94 0.700 0.666 2.387 2.685 52.0 2 523 1 9 43 16 11 0 730 0 705 2 166 2 437 40 33
Weight lb
Specimen
OptimumDensity (pcf)Moisture(%)
LLPLPI
DISTRICT: Abilene SAMPLE NUMBERCOUNTY: various PRODUCER: Vulcan/Blacklease
Sample
0-5873 Page B - 27
3 1 9 43 16.11 0.730 0.705 2.166 2.437 40.333 2 11 44 14.07 0.720 0.698 2.199 2.474 42.323 3 12 47 10.19 0.720 0.688 2.429 2.733 48.213 4 9 52 6.35 0.720 0.683 2.951 3.320 59.363 5 11 55 3.12 0.725 0.675 3.154 3.548 64.383 64 1 11 40 17.72 0.717 0.710 1.854 2.086 34.64 2 16 45 12.50 0.709 0.700 2.097 2.359 40.674 3 10 48 10.79 0.718 0.710 2.577 2.899 48.094 4 10 55 4.17 0.713 0.705 3.183 3.581 60.694 5 9 61 2.79 0.700 0.710 3.702 4.165 70.754 6 11 58 3.08 0.718 0.714 3.405 3.831 62.74
With 2% Flyash
0-5873 Page B - 27

MERRICK FLEXOMETER SAMPLE IDENTIFICATION
Triaxial Sieve Percent145.1 0 psi 28.6 1 3/45.7 15 psi 191.9 1 1/414 7/812 5/82 3/8
Wet Ball 33 #4 47.0% Increase 12 #10
#40 80.7
Initial Total Beam Width Height Load M max FlexuralTray Beam Steps Steps % Moisture (inches) (inches) (lb) in-lb (psi)
1 1 17 41 20.41 0.703 0.702 1.703 1.916 33.131 2 10 46 14.94 0.720 0.710 2.402 2.702 44.611 3 11 48 13.34 0.702 0.713 2.548 2.867 48.211 4 16 50 9.80 0.710 0.705 2.534 2.851 48.551 5 14 50 10.77 0.712 0.709 2.618 2.945 49.481 6 16 58 4.81 0.705 0.705 3.215 3.617 61.9 2 1 11 40 21.1 0.702 0.694 1.854 2.086 36.9 2 2 13 40 14.60 0.707 0.702 1.787 2.010 34.6 2 3 14 40 17.64 0.7 0.695 1.749 1.968 34.9 2 4 12 42 13.42 0.704 0.695 1.993 2.242 39.6 2 5 11 40 11.99 0.695 0.7 1.854 2.086 36.7 2 6 9 45 5.50 0.707 0.700 2.340 2.633 45.6 3 1 13 40 19 09 0 713 0 710 1 787 2 010 33 50
Weight lb
Specimen
OptimumDensity (pcf)Moisture(%)
LLPLPI
DISTRICT: Abilene SAMPLE NUMBERCOUNTY: various PRODUCER: Vulcan/Blacklease
Sample
0-5873 Page B - 28
3 1 13 40 19.09 0.713 0.710 1.787 2.010 33.503 2 16 48 12.70 0.710 0.700 2.359 2.654 45.763 3 16 46 14.18 0.712 0.705 2.184 2.457 41.643 4 15 50 8.31 0.709 0.709 2.577 2.899 48.713 5 14 52 6.00 0.712 0.712 2.792 3.141 52.253 6 11 62 3.24 0.709 0.705 3.726 4.192 71.394 1 11 40 21.63 0.707 0.700 1.854 2.086 36.144 2 12 46 11.47 0.705 0.697 2.341 2.634 46.134 3 14 46 11.93 0.705 0.700 2.268 2.552 44.224 4 11 44 13.77 0.710 0.698 2.199 2.474 42.964 5 10 46 11.52 0.705 0.700 2.402 2.702 46.824 6 12 56 4.60 0.705 0.691 3.206 3.607 64.24
With 4% Flyash
0-5873 Page B - 28
