0 3 5 - connecting repositories · ever since duverger (1954) distinguished ... to sartori’s...
TRANSCRIPT

MPRAMunich Personal RePEc Archive
The effective number of relevant parties :how voting power improvesLaakso-Taagepera’s index
Caulier, Jean-Francois and Dumont, Patrick
Facultes Universitaires Saint-Louis, Bruxelles, Universite du
Luxembourg
19. July 2005
Online at http://mpra.ub.uni-muenchen.de/17846/
MPRA Paper No. 17846, posted 13. October 2009 / 15:32

THE “EFFECTIVE NUMBER OF RELEVANT
PARTIES”:
How Voting Power Improves Laakso-Taagepera’s
Index
Patrick Dumont – Jean-Francois Caulier
19th July 2005
Abstract
This paper proposes a new method to evaluate the number of rel-evant parties in an assembly. The most widespread indicator of frag-mentation used in comparative politics is the ‘Effective Number of Par-ties’(ENP), designed by Laakso and Taagepera (1979). Taking boththe number of parties and their relative weights into account, the ENPis arguably a good parsimonious operationalization of the number of‘relevant’ parties. This index however produces misleading results insingle-party majority situations as it still indicates that more than oneparty is relevant in terms of government formation. We propose tomodify the ENP formula by replacing proportions of seats by votingpower measures. This improved index behaves more in line with Sar-tori’s definition of relevance, without requiring additional informationin its construction.
Key words: Voting power indices – Effective Number of Parties –Party system fragmentation – Relevance – Coalition Formation
1 INTRODUCTION
Attempts at classifying or characterizing party systems for comparative pur-poses constitute a classical endeavour in the more general comparative studyof democratic political systems. Ever since Duverger (1954) distinguishedparty systems on the simple basis of the counting of parties in competition,the numerical criterion has become a widely accepted basis for the compar-ative description of party systems (Lijphart (1994, 1999)).1 By means of
1The second property that emerged in the literature devoted to the comparison of party
systems is the ideological distance that separates the most extreme parliamentary parties
1

construction of typologies, scholars have pointed to discriminating featuresin the comparison of democratic polities. But the measurement of how manyparties compete and interact in parliament is needed because the shape ofa party system may be the product of different determinants in a polity or,conversely, may have broader implications for this polity. Amongst others,scholars have shown that the shape of the party system is largely determinedby the choice of an electoral system (Cox (1997); Duverger (1954); Lijphart(1994, 1999); Sartori (1976); Taagepera and Grofman (1985)), that it is alsoa function of the number of ideological cleavages present in a polity (Li-jphart (1999); Lipset and Rokkan (1967); Taagepera and Shugart (1989)),that an increase in the number of competing parties can be seen as a signof democratization or, in advanced industrialised democracies, of some formof electoral change like the party dealignment phenomenon (Dalton et al.(2000)). Party systems, on the other hand, determine the degree of bar-gaining complexity that may affect government formation and maintenance(De Winter and Dumont (2006); Lijphart (1999); Muller and Strøm (2000);Van Roozendaal (1997); Ware (1996))and feature amongst determinants ofpublic policy (Lijphart (1999); Schmidt (1996)).
The Effective Number of parties (ENP) designed byLaakso and Taagepera (1979) has become the standard numerical measurefor the comparative analysis of party systems, as it takes both the number ofparties and their relative weights into account to compute a single value. Ithas only recently been challenged by a number of scholars who showed thatthis index behaves inappropriately and thus gives counter-intuitive resultsunder a number of circumstances (Dunleavy and Boucek (2003); Molinar(1991); Taagepera (1999), for examples see below). In this article, we pro-pose to replace seat shares by voting power indices in the ENP formula.Laakso and Taagepera (1982) and Taagepera and Shugart (1989:259) hadthemselves already mentioned the interesting possibility of constructing anindex on the basis of power indices.2 As argued by Gallagher et al. (2001:
(the degree of polarization, that correlates with the type of party competition -centripetal
or centrifugal- Sartori (1976)). This property, that requires more information (ideological
placements) on the party system than the simple seat distribution amongst parliamentary
parties, is not discussed in the present article.2“It was high time that someone investigated this application” (personal communica-
tion with Prof. Rein Taagepera). The index was originally designed by Patrick Dumont
and Lieven De Winter in 1999 for the Coalition Governance Project as a measure of bar-
gaining complexity. It was computed for comparative party system data and used by
most members of this network for their comparative chapter to appear in Strom, Muller
and Bergman (2006). Independently from this research, Jean-Francois Caulier (2001)
developed the same index and used it as a predictor of Belgian governments’ duration.
2

344), the power index approach highlights ‘. . . the ways in which the dis-tribution of bargaining power can sometimes differ quite starkly from thedistribution of seats in the legislature’ and indeed the power to influence adecision is not always proportional to a party’s share of parliamentary seats.These authors, together with De Winter (2002) in his recent state of the artin government formation studies (2002: 186-187), argue that the power in-dex approach is a promising avenue for research in the field. Through theintroduction of voting power indices, that reflect the potential influence aparty may have in the formation of a majority coalition, we also come closerto Sartori’s definition of party ‘relevance’. We nevertheless adopt Laakso-Taagepera’s formula that allows us to give a degree of fragmentation ofrelevance in competition for government, rather than an absolute figure ofparties considered as relevant for majority government formation. We alsoargue that with our Effective Number of Relevant Parties the most prob-lematic counter-intuitive results of the ENP disappear. Moreover, there isno need to supplement our index with another variable to cope with specificcircumstances, and no other data on the party system than those needed forthe construction of the ENP are requested. Finally, the index we present inthis article is not only theoretically promising, as it has already been usedin empirical studies as reflecting bargaining complexity in political assem-blies and proved to be an important determinant in government formation(De Winter and Dumont (2006); Back and Dumont (2003); Mitchell (2004)).
2 THE MEASUREMENT OF PARTY SYSTEM
SHAPE
Although the name of Sartori is foremost linked to his seminal typologyof party systems that drew on both numerical and ideological criteria, hisdefence of the former type of measure in order to characterize party systemsis worth being recalled:
. . . it does matter how many are the parties. For one thing,the number of parties immediately indicates, albeit roughly, animportant feature of the political system: the extent to whichpolitical power is fragmented or non-fragmented, dispersed orconcentrated. Likewise, simply by knowing how many partiesthere are, we are alerted to the number of possible ‘interactionstreams’ that are involved. . . 2 parties allow for only 1 stream ofreciprocal interaction, . . . 5 parties for 10, . . . 7 parties for 21. . .the indication clearly is that the greater the number of parties
3

(that have a say), the greater the complexity and probably theintricacy of the system. . . in particular, the tactics of party com-petition and opposition appear related to the number of parties;and this has, in turn, an important bearing on how governmen-tal coalitions are formed and are able to perform. (Sartori (1976:120))
Hence, a numerical criterion, per se, may capture important features ofparty systems. One has however to find what Sartori calls an ‘intelligent’way of counting.
One way of characterizing a party system according to a numerical crite-rion is to simply count the number of parties that gained seats in parliament.Scholars may also set a threshold under which parties are not considered, butthe problem with this technique is that the definition of level of the hurdleis essentially arbitrary.3 Moreover, even when theoretically justified criteriaof ‘party relevance’ are applied, these methods treat each party –that clearsthe threshold or qualifies according to the criteria– equally, whatever theirdifferences in size or influence in the competition for office.
The simple criterion of the number of parties present in parliament isnevertheless at the heart of the seminal distinction between two-party sys-tems and multiparty systems made by Duverger (1954). In a refinement ofthis first classification, Blondel (1968) looked at both the number of partiesand their relative size to identify two-party systems, two-and-a-half partysystems and multiparty systems including (or not) a dominant party. Themain weakness of this new classification was that the relative size of ‘half’and ‘strong’ or ‘dominant’ parties was arbitrarily set (around 10 percent forthe former and 40 percent for the latter, in terms of popular vote). Moreover,the two criteria were treated separately. The first scholar who proposed aunique index based on both these variables was Rae (1967). The idea be-hind the design of such an index was that the universe of party system sizesis continuous and that scholars thus needed a continuous measure ratherthan setting numerical criteria in order to identify different classes of partysystems.Rae’s index of fractionalization can be computed using this formula :
3Ware (1996) for instance only considers parties that have at least 3 percent of the
seats available in an assembly. The number of parties sharing this property is then called
the number of ‘relevant’ parties, a very loose understanding indeed of Sartori’s concept of
‘relevance’ (see infra).
4

F = 1−n∑
i=1
s2i
where si is the proportion of parliamentary seats of party i, and∑
standsfor summation (in this case, the sum of all parties’ squared proportions ofseats is taken and subtracted from 1 to provide a measure of fragmentationof the party system).4
The more the value of the Rae index comes close to unit (its maximumvalue), the more fractionalized the system is. For instance, when 5 partiesget each 20 percent of the available seats, that is a proportion of 0.2 each,the Rae index will amount to 0.80, thus indicating a highly fractionalizedparty system, as we have to add all five squared proportions of seats andwithdraw this result from 1. If one party gets all the seats, thus getting aproportion of 1, it is easy to see that the Rae index will point to 0 (its min-imum value), indicating no fractionalization at all in an indeed completelyconcentrated party system. Thus, the fractionalization index designed byRae does summarize important information about the number of parties andtheir relative size.5
Laakso and Taagepera (1979) transformed this too abstract fractional-ization index into a more intuitive measure that will become widely acceptedin comparative political science, the Effective Number of Parties (ENP).6
4Although most of the classical fragmentation indices may be applied to both measures
at the electoral level (vote shares) and measures at the parliamentary level (seat shares),
we stick to the latter application.5The Rae fractionalization index is nothing else than the complement to unit of the
Herfindhal-Hirschman concentration index (abbreviated HH here), that is not as widely
known in political science. The basic idea is the same, that is to give a specific weight
–that is not arbitrary– to the parties according to their size when counting them: the seat
shares of parties determine their own weight, an operation that is done by squaring these
proportions (a party with half the seats will receive a weight of 0.5, so that its value is
0.5×0.5 = 0.25, whilst a party with 10 percent will have a weight of 10 percent and a
value of 0.1×0.1 = 0.01). The concentration index is then calculated as follows :
HH =
nXi=1
(si)2
where si is the proportion of seats for party i.6Two other indices are sometimes cited in theoretical discussions about indicators of
party system fragmentation, but they were not taken over in many empirical studies.
Whereas in Laakso and Taagepera’s index the shares of votes (or seats) of a party are self-
weighting (by squaring these values), Wildgen (1971)’s index of ‘hyperfractionalization’
accords special weight to small parties and Molinar (1991) gives more weight to the largest
party. Quite logically, the ENP usually generates values that are smaller than the Wildgen
5

The following formula shows how the ENP is computed and its logical linkwith Rae’s indices:
ENP =1∑n
i=1 s2i
=1
1− F
using the same notation as above.
Although it simply uses the same information as Rae’s index, the ‘. . . bigadvantage of ENP is that it can be visualized more easily as the number ofparties than the Rae abstract index’ (see Lijphart (1994: 69)). If five partiesget each 20 percent of the votes or seats, the Effective Number of Partiesis exactly 5.00 (F=0.80). When seats are equally distributed among theparties, the ENP coincides with the raw number of parties (the maximumvalue of the index). This means that doubling the number of equal-sizedparties provides an ENP value twice higher, the other requirement that Rae’sindex did not meet. If one party gets more seats than the others, the ENPwill go down, approaching 4.00. This depicts well the situation. A partysystem consisting of five parties but with an ENP lower than 5.00 tells usthat some parties are somewhat ‘dominated’ by others.
The value given by the ENP can be, and is usually, interpreted in com-parative political science as the number of hypothetical equal-sized partiescompeting or being influential for the building of a majority government.Taagepera and Shugart argue that the ENP has become widely used be-cause it ‘usually tends to agree with our average intuition about the numberof serious parties (1989: 80)’. A decade later, one of its designers goes fur-ther by stating that the ENP usually comes close to the estimates of Sartori(1976) of the number of ‘relevant’ parties, or at least ‘. . . as close as anyoperational index based on seat shares alone can come, without the detailedknowledge about the given country (Taagepera, (1999: 498))’. He never-theless acknowledges that the ENP is not that useful when a single partyhas more than the majority of seats available in an assembly, ‘. . .meaningabsolute dominance’, as the ENP ‘. . . still indicates a multi-party constella-tion (Taagepera (1999: 497))’. In other words, in such situations, the ENPprovides the counter-intuitive result that more than one party is relevantin terms of majority coalition formation, and thus gives a wrong pictureof how coalition or blackmail potential is distributed. We will show in thesubsequent sections of this article that, as size in seats is far from always
index and greater than Molinar’s. Although the latter seems at first sight quite attractive
as it gives more intuitive results than the ENP in certain circumstances, it triggers more
problematic counter-intuitive results in others, and is more difficult to compute (Lijphart
(1994: 69-70) ; Taagepera (1999: 499); Dunleavy and Boucek (2003: 308-13)).
6

synonymous to bargaining strength, it is possible to improve Laakso andTaagepera’s index in its operationalization of Sartori’s concept of party rel-evance.
Some refinements of the ENP were recently proposed. Taagepera (1999)himself suggested to ‘supplement’ the ENP in particular situations, throughhis ‘largest component approach’. His advice is to look at another indexwhen the ENP is deemed insufficient, that is, in particular when the largestparty’s share is bigger than 50 percent ‘. . . and hence dominates absolutelya crowd of smaller parties (Taagepera (1999: 497))’. This secondary index,the Largest Component index (LC) is the inverse of the share of the largestparty. When the value of this index is less than 2.00, this party dominatesthe party system as its share is larger than 50 percent, a feature that onecould see by simply looking at the share of the largest party. According tothe author, looking at both indices provides not only an idea of how a partysystem is fragmented and the weight of the largest party, but also reducesthe possible range of weights for the second party in the system (1999: 501).It is nevertheless clear that Taagepera is very cautious in defending the ENP,pointing out that : ‘It should be stressed that for most purposes ENP alonewill do. . . We should not clutter our data set by including the supplementaryindex unless it serves a purpose. However, the secondary index should beavailable when the need arises (Taagepera (1999: 499))’. We will see belowthat it is possible to create a single index that has the property of takingthe value 1.00 –meaning that only one party is relevant in majority coalitionformation, whenever a single-party majority of configuration exists– thustriggering a more complete measure without loss in parsimony.
More recently, Dunleavy and Boucek (2003) argued that averaging theENP score with the LC score yields a unique index that provides more re-alistic results than the ENP. Through a comprehensive experimental andempirical account of how different measures of fragmentation behave withchanges in the level of support of the largest party and the number of par-ties in competition, they show that their Nb index gives lower scores thanthe ENP (their main critique against the ENP is its over-rating of fragmen-tation). Although the general technique they propose in order to evaluatethe properties of any fragmentation measure is certainly worth considering,the gains in using Nb instead of the ENP (or the ENP and LC) when aparty has a seat share higher than 50 percent are at best minimal and inany case not satisfactory. Dunleavy and Boucek seem indeed content witha maximum Nb score more than half a party less than the ENP’s maximum
7

score when the largest party has 60 percent. But if what we are interestedin is to correct the ENP when one party has more than a majority and thus‘wins’ or dominates the others, having an index score of more than 1.00, evenwith a maximum possible value lower than the ENP remains misleading. AsTaagepera himself noted, ‘. . . once a party has more than 50%, how muchdoes it matter whether it has 53 or 57%? (Taagepera (1999: 502))’, im-plicitly reckoning that in any such a situation a fragmentation index shouldprobably be best set at 1.00. 7
Siaroff (2003) also presented recently his contribution to the field ofparty system characterization. He suggests to go back to the older agendaof the classification of party systems through the use of numerical indica-tors.8 Siaroff argues that adding the shares of the two largest parties pro-vides an index of two-party seat concentration that is instinctively clearerthan the other measures and that loses very little information in the processof its computation.9 He nevertheless acknowledges that this measure mustbe accompanied with another measure to distinguish between possibly quitedifferent configurations displaying the same cumulative index result (Siaroff(2003: 271)). He thus introduces two seat ratio measures as measures ofcompetitiveness that complement his first measure (one indicating the ratiobetween the share of the largest party and the second and the other thesame ratio but between the second and the third largest parties.10 Fromthese measures, Siaroff proposes a classification of party systems where ar-bitrary scores of different measures discriminate between four types of partysystems, and the combination of his cumulative index and the two ratio mea-sures specifically helps pointing at two-and-a-half-party-systems. Accordingto us, this contribution has the main disadvantages of setting arbitrary val-ues to distinguish party systems and of using several numerical variables
7In a personal communication, Prof. Rein Taagepera however argues that the ENP and
the LC do in that case indicate the cushion for losses of the majoritarian party in the next
election. Our index serves another purpose, however, that is to reflect the distribution of
forces in a given electoral period (rather than in the longer-run).8Since the creation of the fractionalization indices and the classic contribution of Sartori
on the basis of both numerical and ideological criteria, the identification of classes of party
systems according to the sole numerical criterion had been almost abandoned.9Cumulative indices of the like were already introduced by Lijphart (1994) but at
the electoral level (percentage of votes) only. Blondel (1968) even specifically suggested
the use of a cumulative index of the support for the two strongest parties in order to
identify different classes. Sartori (1976: 306-7) however showed that when seat shares were
computed instead of vote shares, the cutting points Blondel had found discriminating for
groups of countries disappeared.10Intervals between the first and the second party strengths were already used by Sartori
(1976) in order to identify predominant party systems.
8

–not in a quite consistent way– instead of a unique indicator.11 As it wouldbe preferable to compute a single measure for party system fragmentationif we are to use this indicator in large comparative datasets, we argue thatthe setting up of such a unique variable should be aimed at.
3 THE NORMALIZED BANZHAF INDEX
In this section, we define the most important notions and concepts relatedto the construction of indices in the voting power approach. As argued byGallagher et al.(2001: 344), this approach highlights ‘. . . the ways in whichthe distribution of bargaining power can sometimes differ quite starkly fromthe distribution of seats in the legislature’. Because the power to influencea decision is not always proportional to a party’s share of parliamentaryseats, we propose to replace seat shares by voting power indices in the ENPformula.
The language used in our subsequent presentation is intended to providethe most intuitive definition of the different notions necessary to understandwhat such indices measure and to indicate the type of contexts in which theycan be applied. In particular, we will concentrate on the index designed byJohn F. Banzhaf in 1965, which is aimed at giving the relative power of eachvoter in an assembly using a weighted voting–system.12
An important assumption, that is common to most rational choice the-ories applied to the field, must be pointed out from the outset: that of the‘unitary actor’. As will be seen below, we use the terms ‘voters’ and ‘parties’indifferently because we assume that when they can cast more than one votethey will cast all their votes in the same direction, or put differently, thatrepresentatives of the same party will vote as a bloc. Although we agreethat this assumption renders the analogy with the workings of a parliamen-tary party system less realistic, because party discipline is not enforced withequal success depending on parties and party systems we analyze, we cannevertheless argue that: first, for essential votes such as investiture votesat the stage of government formation or the passing of important pieces oflegislation, party discipline is empirically the rule rather than the exception,even when intra-party factions are identifiable (Laver and Schofield (1990));
11It is worth pointing out that the author’s main concern was to find a way to charac-
terize ‘two-and-a-half-party-systems’ and thus customized his research indicators for this
specific end.12As Felsenthal and Machover (1998) argue, the presentation of this index does not
require recourse to the formal apparatus of cooperative game theory, as this brand of
measure was first designed by Penrose in statistical theory (1946).
9

second, we would either need relevant information on the degree of faction-alization of all parties represented in an assembly at time t or have to rely onvoting patterns at t-1 (that would be used as a proxy for party discipline attime t) to be able to lift this assumption and recalculate power indices. It isthus preferable to acknowledge the unitary actor assumption and simply becautious when studying party systems known for their low degree of partydiscipline or highly factionalized parties.13
Assume an assembly with n voters (parties), that may have a different weightin votes (seats), and a well-defined decision rule (also called quota). Thisdecision rule determines the total number of votes needed for a proposal tobe adopted. If the decision rule is the simple majority, the quota is set at(n
2 + 1) when n is even and (n+12 ) when n is odd. Other decisions rules also
exist, such as qualified majorities, where the quota is set at a different level.When the quota is not reached, the proposal is rejected. In such a weightedvoting–system where the number of voters is n, the assembly is denoted N,the weight of voter i is denoted wi], for i = 1, . . . , n. The voting situationcan be summarized by the list :
[q;w1, w2, ..., wn]
with q the quota and wi the number of votes of voter i.Weighted voting system are particular cases of decisions rules. Not all
decision-making processes can be written as a weighted majority system.For a given proposal, the subset of voters in N that cast a ‘yes’ vote is
S, and those who cast a ‘no’ belong to N \ S, the complement of S in N.Abstention is not allowed in this setting. A subset S of voters voting inthe same direction is called a coalition. Without loss of generality, we thusassume that the members of the coalition S vote in favour of the proposal athand. The set 2n represents all the possible coalitions, including the emptyset. Any coalition S is thus either winning or losing. The collection of subsetsW is the set of all possible winning coalitions S such that
∑i∈S wi ≥ q. The
set W contains all the coalitions ensuring acceptance of the proposal. It iscommon to assume the following :
1. ∅ /∈ W
To be winning, a coalition needs members.13For instance, the power of a highly factionalized party will be overestimated because
of this assumption and the superadditivity property of the power indices, that makes the
power of the sum of several factions greater than the sum of power of different factions.
10

2. N∈ W
The Grand Coalition (that consists of all voters in N, in this case allvoting in the same direction) is always winning.
3. S and T⊂ N ; if S ∈ W and S⊂T then T∈ W
Any coalition that contains a winning coalition (and is thus larger thanthe latter) must also be winning.
A last condition is usually added to guarantee efficiency of the decision-making :
4. if S∈ W then N\S/∈ W
S and N \ S are disjoint coalitions, that is members of S vote the otherway round of those in N \ S. If coalition S appears to be winning, its con-tradictor cannot be winning at the same time. When a coalition (or a voteron its own) is not winning but can prevent its complement to win, we callit blocking. This type of coalition cannot enforce a decision on its own, butcan prevent the acceptance of any proposal.
When none of the parties reaches the majority threshold on its own,and the formation of a coalition is thus needed to attain this quota, theconfiguration is called a minority situation. A coalition is said to be minimalwinning (MWC), when all its members are necessary to reach the quota,and thus to enter the set of winning coalitions W . Stated otherwise, if oneof its members leaves the coalition, the remaining coalition becomes a losingone. In a MWC, all the members are swings14, that is each one can turn thecoalition into a losing one by changing its vote (defecting). If it withdrawsits support to the coalition, any member i swings this MWC into a losingcoalition.
i ∈ S ∈ W and S\{i} /∈ W
There are not only MWC’s in the set of winning coalitions.15 Thesenon-MWC’s that are nevertheless winning are called oversized coalitions.In oversized coalitions, there is at least one member that is not necessaryfor the coalition to reach the threshold.
A dummy is a voter that is never a swing, or in other words, a voter thatis never able to turn a winning coalition into a losing one. A voter that is a
14This concept is policy-blind and thus distinct from the spatial analysis notions of
pivotal, central or median player.15Unless we are in a 2-party assembly with equal seat shares.
11

swing in all winning coalition is a veto player. When the weight of the largestparty is bigger than the quota, we are dealing with a dictator, as this votercan enforce any decision on its own (all other voters are thus dummies). Wecall such type of configuration a single-party majority situation. If i is thelargest voter, then S ∈ W for all S 3 i and S /∈ W if i /∈ S. Thereby, thedictator is the only swing voter, as it is the only one that can turn a winningcoalition into a losing one by defecting, and the only possible MWC is thusthe singleton {i}. Notice that a veto player is a blocking voter in a minoritysituation. This voter is needed to form any winning coalition but cannotenforce a decision on its own. The blocking party must indeed find one ormore partners to reach the quota, and at least one of these partners will alsobe a swing. Hence, it is not a dictator as it is not the only swing voter inall winning coalitions.
We denote the number of times voter i is a swing in all winning coalitionsby ηi. The normalized Banzhaf Index of voter i is the number of times thisvoter i is a swing divided by the total number of swing positions. Thus allindividual voters’ β add up to one.
βi =ηi∑ni=1 ηi
n∑i=1
βi = 1
Hence if i is a dictator, βi = 1, and if i is a dummy, then βi = 0.
In practical terms, in order to calculate the distribution of power in anassembly, one has to look at the list of all possible winning coalitions andrecord for each of these whether voter 1, 2, . . . n is a swing or not. Thenthe total number of swings of any voter i is divided by the total number ofswings for all voters in order to provide βi. Summing the shares of power ofall voters should give a result of one.
The normalized Banzhaf index, as well as a number of other well-knownmeasures of voting power, is part of the class of a priori power indices. Thismeans that the measure only takes the distribution of resources (generallyseat weights) and the decision rule (the quota, usually set at the absolutemajority of seats available) into account to evaluate each party’s probabil-ity of affecting the outcome of a vote in an assembly. All other potentialfactors that may influence such an outcome (such as preferences, persuasionor negotiation skills, history of previous interactions, institutional setting,etc.) are abstracted away and thus all combinations of parties that clear the
12

threshold of the decision rule –those that form the set of winning coalitions–are considered as equally probable. This may be either because we do nothave reason to believe that certain coalitions are more likely to form thanothers or because we do not have accurate data for inferring a distribution ofprobabilities. The assumption of equiprobability is desirable in the formercase, and this is what scholars who engage in normative studies of consti-tutional design argue: when the goal is to (re-)design a voting system,16 itwould indeed be inappropriate to look at empirical patterns of roll calls inorder to allocate more or less weight to actors that happened to vote moreoften with others in the former institutional setting. On the other hand, ifwe have an intuition that some factors may well make some coalitions morelikely than others, and that information on those factors is both availableand trustworthy, positive research on the power each party has in an as-sembly may need the construction of actual, or a posteriori power indices.More specifically, it is possible to feed the a priori indices with this pertinentinformation in order to weight the probability of a certain type of coalitionto form with regard to another, or simply restrict the number of feasiblecoalitions according to such information.17 In any case, as Felsenthal andMachover (2003: 474) recently argued, a priori voting power is a componentof this actual or a posteriori voting power. What is to be reminded here isthat, in coalition theory parlance, a priori indices are policy-blind. 18
There is another distinction made amongst classes of indices in the votingpower literature. This one concerns the object of the decision taken by theassembly, and thus relates somehow to the motivation that drives parties inmajority building. The Banzhaf indices are part of the indices that reflect I-Power, that is ‘power as influence’ over the outcome of a decision. 19 These
16Or an aspect of this voting system. Take for instance the EU Council of ministers in
the wake of the coming enlargement: given the distribution of votes bargained in Nice in
2000, at what level the decision rule should be set in order to keep the same individual
distribution of voting power amongst incumbent member states before and after this
enlargement.17Different methods that plug preferences in have been presented. See Bilal and Hosli
(1999) or Laruelle and Valenciano (2002) for attributing different probabilities to potential
outcomes and Pajala (2002) for the restriction of the set of winning coalitions to connected
winning coalitions. See however Braham and Holler’s (2005) critique of preference-based
indices.18Thus, in a three-party assembly, two parties with precisely the same seats shares are
supposed to be considered by the third one as equally desired for a partnership, regardless
of their policy positions.19The absolute Banzhaf index, also referred to in the literature as the Penrose-Banzhaf
measure, divides the number of swings a party has by the total number of coalitions
(winning or losing) that party may be part of (thus 2n-1).
13

indices are indeed correctly interpreted as the probability each party has,under a specified decision rule, in influencing such an outcome (the passingor the rejection of a vote). This is computed by simply counting the numberof times it is crucial to the building of a majority. As this outcome is notrelated to a value, or a structure of payoffs, Felsenthal and Machover (1998;2001) argue that indices of I-Power reflect power in a context of competitionamongst policy-seeking parties.20 On the other hand, when a fixed totalpayoff is specified, majority building can be seen as a simple cooperativegame with transferable utility and indices reflecting P-Power, or ‘power asa price’ should be used. These indices, such as the one designed by Shapleyand Shubik (1954), reflect the expectations of parties in terms of share ofthe payoff to be distributed (amongst the components of a winning coalitiononly). 21 In this context, parties are essentially seen as office-driven as theyare expected to seek to maximize their office payoffs.
What our Effective Number of Relevant Parties accounts for is not nar-rowly the difficulty of forming a majority government given the size andstrength of parliamentary parties, but more broadly the difficulty of build-ing a majority in parliament. The frequency of minority governments inwestern democracies should not prevent scholars from using this index, asthese governments have to find partners (either an identifiable support partyin parliament or on an ad hoc basis) in order to reach a parliamentary ma-jority to vote on legislation and survive in power. Hence, the problem it isfacing is also the level of complexity for majority building.
In the following section, we argue that knowledge of preferences is not indis-pensable for a better operationalization of the number of parties that Sartoriconsiders as ’relevant’ than the one provided by the ENP.22 and that whatwe need is a reflection of the potential influence of individual parties on the
20This policy-seeking assumption is quite different than the one commonly understood
in coalition theories drawn from political science. Whilst in the latter it refers to the
maximisation of policy preferences in spatial models, it is here devoid of any reference to
expectations in terms of payoffs based on known policy positions.21Instead of looking at all the theoretically possible winning combinations (as in the
computation of Banzhaf indices), the Shapley-Shubik index looks at all theoretically pos-
sible permutations of voters. When one party is a swing and thus turns a losing coalition
into a winning one in a specific sequence of votes, it gets all the payoffs. By computing
the swings of all possible sequences of votes, the index averages out the share of payoffs
each party could expect in a given assembly.22Without even entering the debate over the quality of existing party policy placements
(see Laver (2001))or pointing at the possible overestimation of the explanatory power of
policy-seeking motivations of parties in coalition formation (see for instance the exclusion
of centre parties in Belgian, Dutch or Finnish governments and even the participation
14

building of a majority. We thus justify the choice of the normalized Banzhafindex, an a priori I-Power index, for this purpose.
4 TWO WORLDS COLLIDE: PARTY SYSTEM
LITERATURE AND THE VOTING POWER
APPROACH
4.1 The normalized Banzhaf index and Sartori’s concept of
‘relevance’
We have seen that the normalized Banzhaf index is the number of timeseach voter is a ‘swing’ when all winning coalitions are considered, dividedby the sum of the total number of swings (thus each time any voter isa swing). In this section, we show that this index, despite its a prioricharacter, gives an appropriate measure of what Sartori (1976) calls the‘relevance’ of parties in a parliamentary assembly. The concept of relevance
at the heart of Sartori’s typology of party systems refers to the place a partyhas in the competition for office in a given system. Mair (2002: 93) indeedpoints out that Sartori’s approach ‘. . . helps to focus attention directly onwhat is perhaps the most important aspect of party systems, and on whatdistinguishes most clearly between different party systems: the structureof inter-party competition, and especially the competition for government’.This focus on the competition for government is clear in his definition of atwo-party system: ‘We have a two-party format whenever the existence ofthird parties does not prevent the two major parties from governing alone,i.e. when coalitions are unnecessary. . . ’ and implies that one has to countparties on the basis of their seat shares because ‘. . . governments are formed,and perform, on the basis of their strength in parliament (Sartori (1976:186))’. According to Sartori, one should look at both the parties that areconsidered as having ‘coalition potential’ –are willing to compete for accessto government and are accepted as such by their competitors– and thosethat have a ‘blackmail potential’ –those that are either anti-system or notconsidered fit for government by other parties but that are able to blockthe formation of certain coalitions because of their weight in parliament– inorder to assess their relevance in the competition for office in a given partysystem. Given that the normalized Banzhaf index of a party is correctlyinterpreted as ‘what is that party’s probability to influence the outcome,
to power of populist and extreme parties in Italy, Austria or the Netherlands in the last
decade).
15

relative to the other parties present in a given assembly’, political scientistsshould immediately see the connection between Sartori’s relevance criteriaand this measure aimed at quantifying potential influence. 23 Sartori (1976:
121) however argued that the relevance of a party ‘. . . is a function not onlyof the relative distribution of power –as is obvious– but also, and especially,of its position value, that is, of its positioning along the left-right dimension’.Hence, comparative politics scholars like Lane and Ersson (1999) interpretthe coalition potential criterion as applying to all, thus even small parties,of the political centre, and the blackmail potential criterion as applying tolarge extremist parties. What the voting power approach teaches us howeveris that size does not always equal power, and that smaller parties, whatevertheir ideological position, may influence the composition of governments bypreventing some formulas to reach a majority: Gallagher et al. (2003: 344)take the classic example of a legislature in which two parties win 45 percentof the seats and a third party the remaining 10 percent. Because of thepresence of a third party, none of the big parties can govern on its ownand a coalition is needed to pass the majority threshold in parliament. Ifwe assume that parties are more concerned about getting into office thanabout implementing a specific policy, any coalition consisting of two partiescan form, regardless of parties’ policy positions. Hence, the smaller partyhas the same bargaining power as the two larger ones. Gallagher et al.point to the fact that this is the type of situation in which Germany wasbefore re-unification. They thus show that the presence of the smaller FreeDemocrat Party in most governments can also be explained without theexpress recourse to its (median) policy position in the German left-rightparty competition. Indeed, what the voting power approach shows is thatthe FDP had a disproportionate share of bargaining power (the same as thetwo larger parties’ despite its sheer size in seats). Even if we had reliableparty placements on the main dimensions of competition and we assumedthat parties are policy-seekers, isn’t it the case that even a small extremist
23Such a distinction between individual parties’ power to contribute positively to the
formation of a majority coalition and their power to destroy it (or in other words, block
its formation) is clearer in the indices designed by Coleman (1971). The Power to Initiate
action (I i) is the number of positive swings of a party (the number of times a party is able
to turn a losing coalition into a winning one), whereas the Power to Prevent action (P i)
is its number of negative swings (the number of times a party is able to turn a winning
coalition into a losing one). These indices measure parties’ decisiveness conditionally to
the outcome (respectively the formation of a majority coalition or its failure). But both
the Coleman indices, when normalized in order to have the sum of individual powers equal
to 1, give the normalized Banzhaf index (and the absolute Banzhaf index of party i is the
harmonic mean of I i and P i).
16

party can constrain the process of cabinet formation? In the example takenabove, not only an extremist party with 10 percent of the seats prevents, byits mere presence, any single-party majority to form, but it also forces thetwo larger parties to form a coalition, as any coalition in which the extremistparty would participate should be erased in the list of feasible coalitions onideological grounds. In this case, the presence of a small extremist partyin parliament indeed determines the composition of the coalition, as thecoalition of the two larger parties is the only possible majority formula.24 We argue that parties that exert such an influence on the process ofcabinet formation should not be discarded, as they display a clear blackmailpotential. Hence, if the blackmail potential25 of a party (that does notqualify under the coalition potential definition) is not related to its absolutebut to its relative strength in seats, taking the whole distribution of seatsinto account in order to evaluate each party’s bargaining power, even smallextremist parties qualify for relevance..
The combination of the two criteria for Sartori’s concept of party rele-vance and the insights of the voting power approach has an important impli-cation: as even smaller extremist parties can qualify for blackmail potential,counting the number of parties without knowledge of ideological positionsbecomes indeed a fair operationalization of the number of relevant parties.26 In any case, we argue that the index we present below comes closer tothe number of what Sartori refers as ‘relevant’ parties than any operationalindex created without such a detailed knowledge of a polity.
24To be sure, take also the example of a parliament with four parties, ordered alphabet-
ically from left to right: A has 41 percent of the seats, B has 10, C has 39 and D, which
is an extreme-right party considered unfit for government, has the remaining 10 seats.
Only coalitions AB, AC and ABC are feasible in terms of majority building. Hence, the
presence and weight of D in such a distribution of seats erase any possibility to form a
coalition without A (BC does not reach a majority and BCD is not feasible as D cannot
take part in government).25This example of a system consisting of two large parties and a smaller one, but the
latter considered by the others as unfit for government, closely resembles the Austrian case
in the 1990s. Because of its blocking power, the FPO largely determined the composition
of governments, as the SPO and OVP had to govern together in grand coalitions. In
such a paralyzed system, the populist stances of the FPO and the ever more negative
incumbency effect for outgoing coalition partners paved the way for electoral victories of
the pariah party and finally its participation to government.26If we accept this demonstration, then no information on policy positions are needed
in order to operationalize the concept of party relevance, as the influence any party may
have in restricting or expanding the number of feasible alternatives for parties competing
for office should be accounted for. Hence, using a voting power index that considers all
potential winning combinations of parties as equiprobable does not seem inappropriate.
17

However, the question of parties that are considered as having ‘coalitionpotential’ but are not as strong as to be a swing in any winning coalition(what we refer to as dummies) can be raised, as these will have a normal-ized Banzhaf index of zero, indicating that they have no relevance at all.To this potential objection, we would respond both theoretically and em-pirically: first, we would argue that the concept of relevance, at least inits coalition potential component, essentially refers to an ‘active’ role in thecompetition for office. If a dummy party eventually ends up being partof a government, it is through the will of other actors that are –contraryto the dummies– crucial to the building of the coalition, not through itsown bargaining strength. It may be because of its ideological leaning thatother parties request its presence, turning a minimal winning coalition intoan oversized one that can then become an ideologically minimal connectedcoalition (Axelrod (1970)). But this type of governmental participation for adummy party owes more to ‘luck’ more than to real ‘power’ (Barry (1980)).Moreover, we cannot evaluate a party’s coalition potential unless we look atother information than the distribution of seats in an assembly. If we wantour indicator to stick as much as possible to the principle of parsimony, weare thus better off computing relevance through the numerical blackmailpotential parties have. Second, dummies almost never participate in gov-ernments: in a dataset consisting of all the distributions of seats followingelections in twelve west-European parliaments over the full post-war period(1945-1999), and excluding cases of single-party majorities, there were nodummies included in the cabinets that were formed directly after these elec-tions (N=163). 27 Hence, the alleged coalition potential of dummies almostnever translate in effective participation to government (this is mainly dueto their sheer seat strength, 2.5 percent on average). Finally, let us notethat the normalized Banzhaf index can also be seen as operationalizing theconcept of ‘credible exit threats’ 28 or of ‘walk-away values’ 29 that parties
27In a larger dataset consisting of all cabinets formed in these twelve countries (N=300),
thus accounting for cabinets that form during the inter-election period, only 3 dummy play-
ers out of 101 entered a cabinet. The authors wish to thank Wolfgang Muller, Kaare Strom
and Torbjorn Bergman for allowing them to use this subset of the Coalitions Governance
dataset.28Van Roozendaal (1997) introduces this concept in his study of government duration,
and operationalizes it with the ‘dominance’ certain parties exert on others. In a nutshell, a
party system is dominated whenever the second largest party is unable to form a majority
coalition with the partner(s) that the largest party could choose to form a the smallest
majority coalition in seats it can be part of. In that case, the second party has less
evidently at least one alternative less than the largest in terms of majority building.29Lupia and Strom 2004 argue that walk-away values are amongst the most important
determinants of the life and death of coalition governments.
18

may or may not have when bargaining in coalition formation. The num-ber of swings parties have can indeed be seen as important resources in theprocess of coalition formation, as they can be used to exert threats on theother actors. If a party is a swing in the coalition formula that is beingnegotiated, but has a number of other alternatives in which it can exert thesame influence whilst the other members of that coalition have not, it canuse these resources by credibly threatening to leave the negotiation table ifits partners do not give in to its demands. If the partners have no alterna-tives (they may be a swing in the coalition being formed, but not in otherwinning combinations), they either give in or join the opposition by lettingthe powerful party implement is threat. Having more credible exit threatsthan others, or, in other words, having a larger amount of alternatives toturn to when walking away from the negotiation table is thus an importantasset in a bargaining situation. If the normalized Banzhaf index can be seenas operationalizing these concepts, the type of information it provides is therelative bargaining power of an individual party. By applying the formulaproposed by Laakso and Taagepera to these values instead of parties’ seatshares, we argue that we give a more appropriate picture of how ‘coalitionand blackmail potential’, ‘credible exit threats’ or ‘walk-away values’ aredistributed. We will come back to the potential applications of the Banzhafindex and our ENRP in terms of bargaining complexity in the discussionat the end of this article, but in the following section we first indicate howexactly to measure the new index and illustrate how it behaves.
4.2 Measuring the Effective Number of Relevant Parties:
formula and examples
The Effective Number of Relevant Parties present in an assembly is com-puted using the following formula :
ENRP =1∑n
i=1 β2i
where βi is the normalized Banzhaf index for party i, and∑
stands forthe summation over all parties’ normalized Banzhaf indices. Recall that,given our policy-blindness and unitary actor assumptions, we only need thesame type of data as for the construction of the ’normal’ Laakso-TaageperaENP to compute our index.
Table 1 shows how our ENRP behaves in a number of party constel-lations that are characterized by an Effective Number of Parties of 3.00.These examples are drawn from the article in which Taagepera suggests to
19
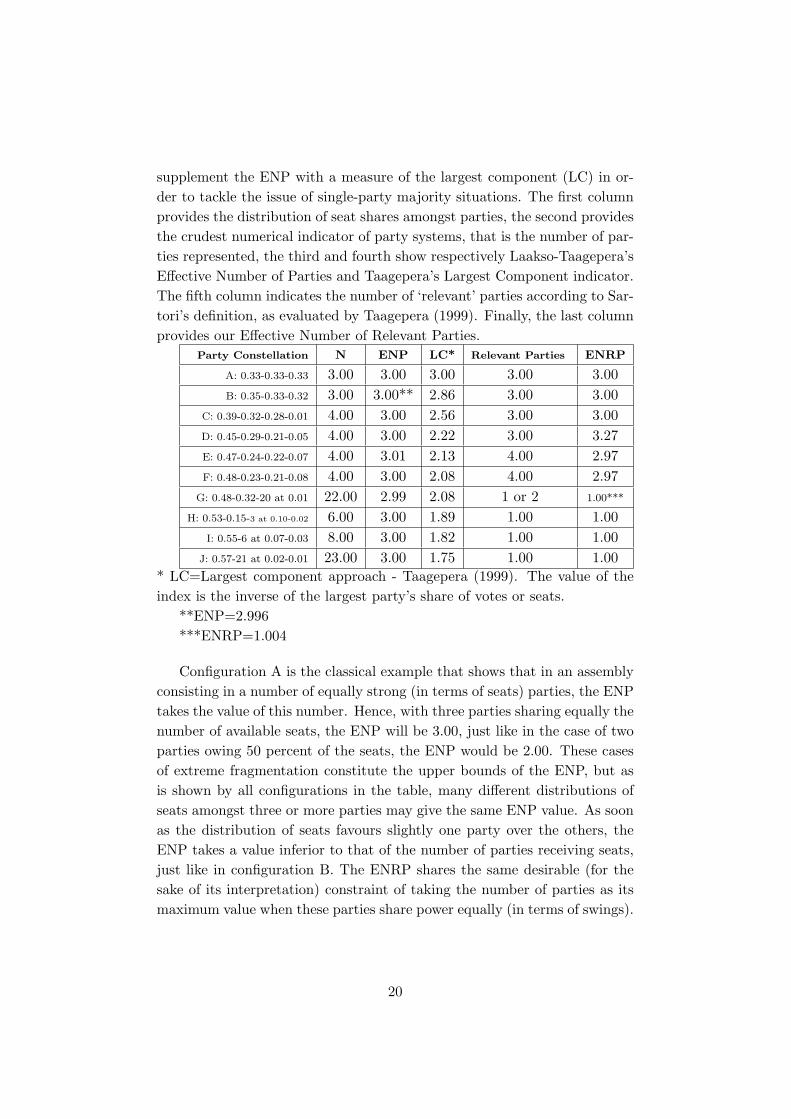
supplement the ENP with a measure of the largest component (LC) in or-der to tackle the issue of single-party majority situations. The first columnprovides the distribution of seat shares amongst parties, the second providesthe crudest numerical indicator of party systems, that is the number of par-ties represented, the third and fourth show respectively Laakso-Taagepera’sEffective Number of Parties and Taagepera’s Largest Component indicator.The fifth column indicates the number of ‘relevant’ parties according to Sar-tori’s definition, as evaluated by Taagepera (1999). Finally, the last columnprovides our Effective Number of Relevant Parties.
Party Constellation N ENP LC* Relevant Parties ENRP
A: 0.33-0.33-0.33 3.00 3.00 3.00 3.00 3.00B: 0.35-0.33-0.32 3.00 3.00** 2.86 3.00 3.00
C: 0.39-0.32-0.28-0.01 4.00 3.00 2.56 3.00 3.00D: 0.45-0.29-0.21-0.05 4.00 3.00 2.22 3.00 3.27E: 0.47-0.24-0.22-0.07 4.00 3.01 2.13 4.00 2.97F: 0.48-0.23-0.21-0.08 4.00 3.00 2.08 4.00 2.97
G: 0.48-0.32-20 at 0.01 22.00 2.99 2.08 1 or 2 1.00***
H: 0.53-0.15-3 at 0.10-0.02 6.00 3.00 1.89 1.00 1.00I: 0.55-6 at 0.07-0.03 8.00 3.00 1.82 1.00 1.00
J: 0.57-21 at 0.02-0.01 23.00 3.00 1.75 1.00 1.00* LC=Largest component approach - Taagepera (1999). The value of theindex is the inverse of the largest party’s share of votes or seats.
**ENP=2.996***ENRP=1.004
Configuration A is the classical example that shows that in an assemblyconsisting in a number of equally strong (in terms of seats) parties, the ENPtakes the value of this number. Hence, with three parties sharing equally thenumber of available seats, the ENP will be 3.00, just like in the case of twoparties owing 50 percent of the seats, the ENP would be 2.00. These casesof extreme fragmentation constitute the upper bounds of the ENP, but asis shown by all configurations in the table, many different distributions ofseats amongst three or more parties may give the same ENP value. As soonas the distribution of seats favours slightly one party over the others, theENP takes a value inferior to that of the number of parties receiving seats,just like in configuration B. The ENRP shares the same desirable (for thesake of its interpretation) constraint of taking the number of parties as itsmaximum value when these parties share power equally (in terms of swings).
20
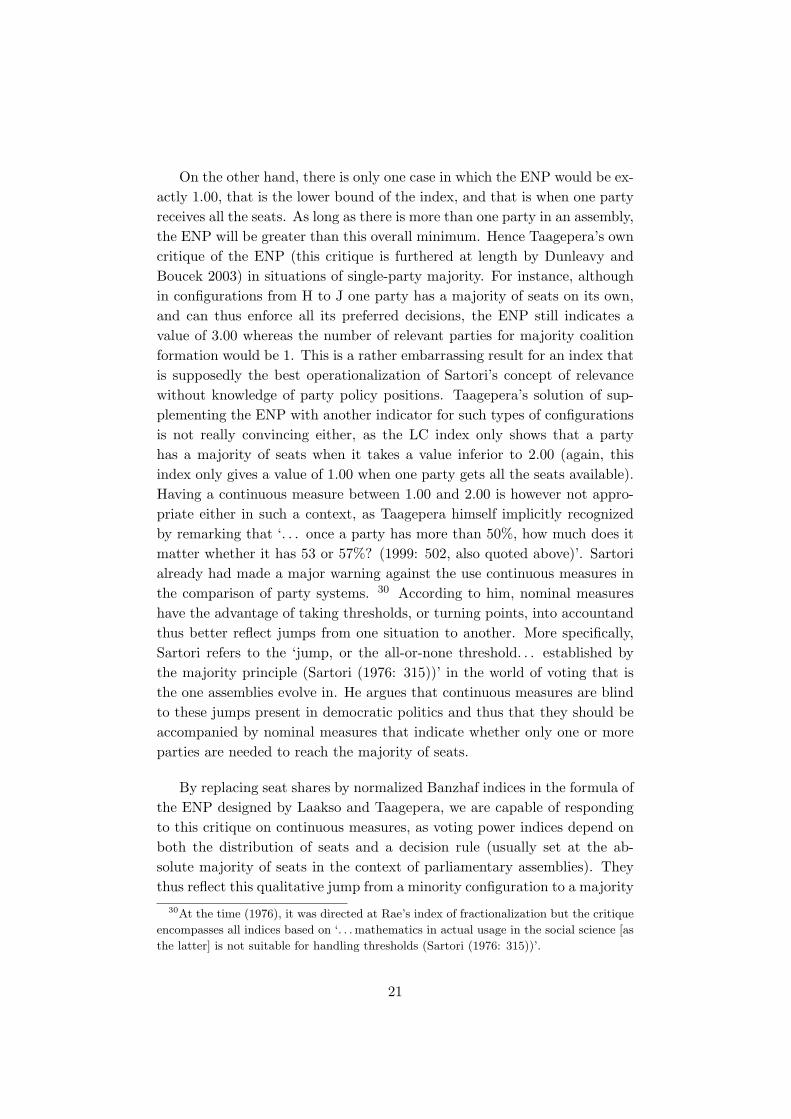
On the other hand, there is only one case in which the ENP would be ex-actly 1.00, that is the lower bound of the index, and that is when one partyreceives all the seats. As long as there is more than one party in an assembly,the ENP will be greater than this overall minimum. Hence Taagepera’s owncritique of the ENP (this critique is furthered at length by Dunleavy andBoucek 2003) in situations of single-party majority. For instance, althoughin configurations from H to J one party has a majority of seats on its own,and can thus enforce all its preferred decisions, the ENP still indicates avalue of 3.00 whereas the number of relevant parties for majority coalitionformation would be 1. This is a rather embarrassing result for an index thatis supposedly the best operationalization of Sartori’s concept of relevancewithout knowledge of party policy positions. Taagepera’s solution of sup-plementing the ENP with another indicator for such types of configurationsis not really convincing either, as the LC index only shows that a partyhas a majority of seats when it takes a value inferior to 2.00 (again, thisindex only gives a value of 1.00 when one party gets all the seats available).Having a continuous measure between 1.00 and 2.00 is however not appro-priate either in such a context, as Taagepera himself implicitly recognizedby remarking that ‘. . . once a party has more than 50%, how much does itmatter whether it has 53 or 57%? (1999: 502, also quoted above)’. Sartorialready had made a major warning against the use continuous measures inthe comparison of party systems. 30 According to him, nominal measureshave the advantage of taking thresholds, or turning points, into accountandthus better reflect jumps from one situation to another. More specifically,Sartori refers to the ‘jump, or the all-or-none threshold. . . established bythe majority principle (Sartori (1976: 315))’ in the world of voting that isthe one assemblies evolve in. He argues that continuous measures are blindto these jumps present in democratic politics and thus that they should beaccompanied by nominal measures that indicate whether only one or moreparties are needed to reach the majority of seats.
By replacing seat shares by normalized Banzhaf indices in the formula ofthe ENP designed by Laakso and Taagepera, we are capable of respondingto this critique on continuous measures, as voting power indices depend onboth the distribution of seats and a decision rule (usually set at the ab-solute majority of seats in the context of parliamentary assemblies). Theythus reflect this qualitative jump from a minority configuration to a majority
30At the time (1976), it was directed at Rae’s index of fractionalization but the critique
encompasses all indices based on ‘. . .mathematics in actual usage in the social science [as
the latter] is not suitable for handling thresholds (Sartori (1976: 315))’.
21

situation. Specifically, the ENRP we designed has the interesting propertyof taking the value 1.00 whenever a single-party majority exists. Hence, thelower bound of the ENRP will be reached any time a party is a dictator interms of swings and not only when one party is a dictator in terms of seats(when no other party is represented). These situations occur whenever oneparty has a majority of seats in an assembly, as it becomes a swing in allmajority formula and renders all parties powerless (dummies), whatever thenumber of parties owning seats. Our index thus displays the feature implic-itly suggested as desirable by Taagepera (1999), that is that whatever thestrength of the majority in seats for the largest party, the fragmentation ofrelevance for majority building is set at 1.00. Whatever how much the partyis majoritarian, the probability of this party letting a minority forming agovernment and enforcing decisions is indeed very small. In case it never-theless decides to form a surplus coalition by inviting a dummy party to joingovernment, it retains the absolute power to revoke this unnecessary partnerat any time, leaving the latter a negligible potential influence on decisions.Hence, such a feature seems pretty reasonable and makes our index comecloser Sartori’s concept of relevance, as shown in configurations H to J inTable 1. 31
How do the different measures reflect how coalition and blackmail poten-tial are distributed amongst parties indices in the rest of the configurationslisted in Table 1? In configuration C, the fourth party (P4) is a dummy(too small to be a swing for any winning coalition), leaving all bargainingpower to the three larger parties. As the latter three, despite some differ-ences in seats, have the same number of swings, the ENRP equals exactly3.00. From configuration D to configuration E, the largest party and thesmallest party gain seats from the two middle-sized parties. These increasesin seats for P1 and P4 render possible the formation of a minimal winningcoalition P1-P4 that was not feasible in configuration D. Both parties thusgain one swing. But this change in relative strengths also affects P2 and P3,as in configuration E they are not swings anymore in the respective winningcoalitions P1-P2-P4 and P1-P3-P4. Only P1 remains a swing in these coali-tions, and thus the gap between the most powerful party and the following
31Although calculated on these 10 examples only, the strength of correlation coefficients
between the different indices and the number of relevant parties as evaluated by Taagepera
(and depending on taking 1 or 2 as a value for this variable in configuration G) is around
0.9 for the ENRP, around 0.5 for the ENP and the LC (the latter being more correlated
than the former if the value 2 is taken for configuration G, and the other way round if
the value 1 is taken) and between -0.9 and -0.5 (thus negative) for the crude number of
parties.
22

widens, a change towards more power concentration that is reflected in theENRP but not in the ENP. It is unclear however why Taagepera estimatesthat the number of relevant parties is 4 for both configurations E and Fand not for D. He argues that ‘...in F, even the smallest of the four partieshas coalition potential. Ideology permitting, it could be the largest party’spreferred partner, or it could clinch a majority coalition that excludes thelargest party (Taagepera (1999: 501))’. But the balance of power tips morein favour of the largest party in F (and E) than in configuration D, indi-cating less fragmentation than in D (where the smallest of the four partiesalready had coalition potential, although less than in D, as it was a swing inthe coalition excluding the largest party). Hence, more potential coalitionsdoes not trigger an automatic increase in fragmentation, as the balance ofthe number of swings may change dramatically and the largest party maybenefit from it. Thereby our index should –and does– indicate more con-centration instead. The example of D also shows that our ENRP result isnot always lower than the value of ENP.32
The comparison of configurations F and G is more appealing, as the sizeof the largest party is the same, and thus so is the LC index. As Taageperapoints out (1999: 501) ‘. . . when political coalition building enters, thencases F and G look quite different, despite having the same ENP and alsothe same LC. . . ’ as with a highly fragmented number of small parties, thelargest party that is very close to the majority threshold can form a coalitionand be a swing in a very large number of coalitions. This is much less thecase for the second largest party that has to convince no less than 19 of the20 small parties to exclude P1 from government. We are thus confident inthe result given by our ENRP, that is very close to 1.00 (1.004), as the powerof majority building is highly concentrated in the hands of the largest party.33 In any case, none of the measures proposed by Taagepera manages toreflect this major difference between the two configurations, as he himselfacknowledges:
The disappointing surprise is that the same combination ofENP and LC can hide coalition-building implications as differentas those of cases F and G. What it means is that even the two
32In the comparative dataset referred to above (that excludes single-party majority
configurations), the value of the ENRP is higher than the ENP in one third of all cases.33Indeed, we would argue that the value 1 (suggested in Table 1 together with the
value 2) should be chosen for the number of relevant parties as estimated by Taagepera
according to Sartori’s definition.
23

indicators. . . jointly cannot always convey all the informationwe would like to have (Taagepera (1999: 502)).
5 SUMMARY and DISCUSSION
The Effective Number of Relevant Parties operationalizes Sartori’s conceptparty relevance by taking advantage of the insights from the voting powerliterature and the formula of the fragmentation index designed by Laaksoand Taagepera back in 1979. The latter was up to now rightly consideredas the best unique operational index for comparing party systems without adetailed knowledge of the polities under study. We showed that the ENP wasproblematic in single-party majority situations, in that it still indicates thatmore than one party is relevant in terms of government formation, whilst itis clear that such a party has the power to ensure the enforcement of all itspreferred policies without the others being able to prevent such an outcome.Our ENRP gives a more accurate picture of the number of relevant partiesfor building a majority in this type of configuration. We also explained whyand how Sartori’s definition of relevance might be operationalized withoutrequiring additional information such as ideological positions of the parties.Moreover, our ENRP provides a degree of fragmentation of Sartorian party‘relevance’, and not simply absolute figures of relevant parties. The two firstfeatures derive from our use of the voting power approach, and the third onefrom our recourse to a fragmentation formula. As these improvements of theENP are not detrimental to the principle of parsimony in the constructionof our index –it does not require new information nor the adjunction ofa second indicator to supplement it in special cases– and because of itseasiness to compute, 34 we argue that it should be used in instances inwhich the ENP was up to now supposed to operationalize adequately thenumber of relevant parties. This is certainly the case when it the ENPwas used as a predictor in government formation, maintenance of publicpolicy performance studies. In the field of the comparative description ofparty systems, on the other hand, we acknowledge that this claim is lesslegitimate as the ENP’s main handicap can also be seen as an advantage:whilst our index would indicate that, under the unitary actor assumption,only one party is relevant for majority building whenever a party has morethan 50 percent of the seats, the ENP would give a more complete pictureby pointing somehow at the degree of opposition facing majoritarian parties
34It is possible to compute individual power indices as well as fragmentation indices
such as the ENP on line at http://powerslave.val.utu.fi/, a website maintained by Antti
Pajala from the University of Turku, Finland.
24

of different sizes (even though this indication would be the same for quitedifferent constellations as well).
Contrary to Albert (2003)’s recent critique35 we thus argue that votingpower indices can become descriptive and even predictive tools in the contextof positive research. We even showed that a priori power indices may beused to reflect theoretical concepts more adequately than measures widelyendorsed by empirical scholars in political science. In so doing, they rendersuch concepts amenable to better empirical tests of hypotheses. We thushave good news for List, who argues that
. . . voting power might plausibly serve as a regressor in mod-els of certain empirical phenomena. . . it is conceivable (thoughstill an untested hypothesis) that voting power might affect de-cision outcomes: policies preferred by agents with greater votingpower might prevail more often than ones preferred by agentswith less voting power. Similarly, the distribution of votingpower might conceivably affect the dynamic of decision processesand perhaps the nature of deliberation in a collectivity (2003:490).
The index we propose in this article reflects bargaining complexity inpolitical assemblies and already proved to be an important determinant ingovernment formation. It is also a potentially useful indicator for research onthe relationship between electoral and party systems, and one could think offruitful applications in public policy analysis as well. Notice that individuala priori indices have also been recently used by scholars to explain andpredict parliamentary behaviour (Laver and Gianetti (2001); Laver and Kato(2001); Laver and Benoıt (2003)). Hence, as long as we are cautious inboth the validity of our operationalizations of theoretical concepts and theinterpretation of our results,36 we are convinced of the potential of the votingpower approach for positive research in political science.
35And to Garrett and Tsebelis (1999, 2001) critiques on the specific use of a priori
indices in empirical analyses of European Union institutions.36In non-normative research, scholars have so far mostly used and sometimes abused
power indices (in the interpretation of results) in descriptions of power distributions in
EU institutions or national assemblies.
25

References
Albert, M. (2003), ‘The Voting Power Approach: Measurement WithoutTheory’, European Union Politics 4(3), 351–66.
Axelrod, R. (1970), Conflict of Interest, Chicago: Markham.
Barry, B. (1980), ‘Is It Better To Be Powerful or Lucky?’, Political Studies28, 183–94, 338–52.
Blondel, J. (1968), ‘Systems and Patterns of Government in Western Democ-racies’, Canadian Journal of Political Science 1(2), 180–203.
Cox, G. W. (1997), Making Votes Count: Strategic Coordination in theWorld’s Electoral Systems, Cambridge University Press.
Dalton, R. J., McAllister, I. and Wattenberg, M. P. (2000), The Conse-quences of Party Dealignment, in ‘Parties Without Partisans: PoliticalChange in Advanced Industrial Democracies’, Russell J. Dalton and Mar-tin P. Wattenberg edn, Oxford: Oxford University Press.
De Winter, L. (2002), Parties and Government Formation, Portfolio Al-location and Policy Definition, in ‘Political Parties in the New WesternEurope. Political and Analytical Challenges.’, Kurt Richard Luther, Fer-dinand Muller–Rommel edn, Oxford: Oxford University Press.
De Winter, L. and Dumont, P. (2006), The Complexity of the Coalition Bar-gaining Process: Formation Duration and Bargaining Rounds, in ‘Coali-tion Governance in Western Europe’, Kaare Strøm, Wolfgang C. Mullerand Torbjorn Bergman edn, Oxford: Oxford University Press.
Dunleavy, P. and Boucek, F. (2003), ‘Constructing the Number of Parties’,Party Politics 9(3), 291–315.
Duverger, M. (1954), Political Parties: Their Organization and Activity inthe Modern State, London: Methuen; New York: Wiley.
Felsenthal, D. S. and Machover, M. (1998), The Measurement of VotingPower: Theory and Practice, Problems and Paradoxes, Cheltenham: Ed-ward Elgar.
Gallagher, M., Laver, M. and Mair, P. (2001), Representative Governmentin Modern Europe 3rd ed, New York: McGraw-Hill.
26

Garrett, G. and Tsebelis, G. (1999), ‘Why Resist the Temptation to ApplyPower Indices to the European Union?’, Journal of Theoretical Politics11(3), 291–308.
Garrett, G. and Tsebelis, G. (2001), ‘Even More Reasons to Resist theTemptation of Power Indices in the EU’, Journal of Theoretical Politics13(1), 99–105.
Laakso, M. and Taagepera, R. (1979), ‘Effective Number of Parties: AMeasure with Application to West Europe’, Comparative Political Studies12, 3–27.
Lane, J.-E. and Ersson, S. (1999), Politics and Society in Western Europe,London: Sage.
Laver, M. (2001), Estimating the Policy Position of Political Actors, London:Routledge.
Laver, M. and Schofield, N. (1990), Multiparty Government, Oxford: OxfordUniversity Press.
Lijphart, A. (1994), Electoral Systems and Party Systems: A Study ofTwenty-Seven Democracies, 1945-1990, Oxford: Oxford University Press.
Lijphart, A. (1999), Patterns of Democracy, New Haven: Yale UniversityPress.
Lipset, S. M. and Rokkan, S. (1967), Party Systems and Voter Alignments.Cross-national perspectives, New York: Free Press.
Molinar, J. (1991), ‘Counting the Number of Parties: An Alternative Index’,American Political Science Review 85, 1383–91.
Muller, W. C. and Strøm, K. (2000), Coalition Government in WesternEurope, Oxford: Oxford University Press.
Rae, D. (1967), The Political Consequences of Electoral Laws, New Haven:Yale University Press.
Sartori, G. (1976), Parties and Party Systems: A Framework for Analysis,Cambridge: Cambridge University Press.
Schmidt, M. G. (1996), ‘When Parties Matter: A Review of the Possibilitiesand Limits of Partisan Influence on Public Policy’, European Journal ofPolitical Research 30, 155–83.
27

Shapley, L. S. and Shubik, M. (1954), ‘A Method for Evaluating the Dis-tribution of Power in a Committee System’, American Political ScienceReview 48, 787–92.
Siaroff, A. (2003), ‘Two-and-a-Half-Party Systems and the ComparativeRole of the ‘Half”, Party Politics 9(3), 267–90.
Taagepera, R. (1999), ‘Supplementing the Effective Number of Parties’,Electoral Studies 18(4), 497–504.
Taagepera, R. and Grofman, B. (1985), ‘Rethinking Duverger’s Law: Pre-dicting the Effective Number of Parties in Plurality and PR Systems-Parties Minus Issues Equals One’, European Journal of Political Research13(4), 341–52.
Taagepera, R. and Shugart, M. S. (1989), Seats and Votes: The Effects andDeterminants of Electoral Systems, New Haven: Yale University Press.
Van Roozendaal, P. (1997), ‘Government Survival in Western Multi-PartyDemocracies: The Effect of Credible Threats via Dominance’, EuropeanJournal of Political Research 32(1), 71–92.
Ware, A. (1996), Political Parties and Party Systems, Oxford: Oxford Uni-versity Press.
Wildgen, J. K. (1971), ‘Measurement of hyperfractionalization’, Compara-tive Political Studies 4, 233–43.
28