0 .1. 2..~~. ~c.61 civil~ngineering studies c..c) ~ 5t~al … · 2015. 5. 30. · much has been...
TRANSCRIPT
\0 .1. 2..~~. ~c.61
CIVIL~NGINEERING STUDIES c..C) ~ 5T~AL RESEARCH SERIES NO. 54
STUDY OF PRESTRESSED CONCRETE
BEAMS FAILING IN FLEXURE ~ ...... ~ ~ -; ~ _. ,-'- . --.--~-, : .... ,,~ ~. .- '. --- '" .~ '; - - - 'I
" -. -:: ... - - .... '-. -', . -_. - ~.
-....J .1. •• _ ,_.......... ~.: -,. ~
- -- '-' :; ...... -: -: -... - - • _. 0'.-
A THESIS
by
D. F. BILLET
Issued as a Part
of the
SECOND PROGRESS REPORT
of the
, ~-....... .... '. -"- -.' - ,..
INVESTIGATION OF PRESTRESSED
CONCRETE FOR HIGHWAY BRIDGES
JUNE, 1953
UNIVERSITY OF ILLINOIS
URBANA, ILLINOIS

STUDY OF PRESTRESSED CONCRETE BEAMS FAILING IN FLEXURE
A Thesis by
Do F. Billet
Issued as a Part of the Second Progress Report
of the
}NVESTIGATION OF PRESTRESSED CO~CRETE FOR HIGHWAY BRIDGES
Conducted by
THE ENGINEERING EXPERIMENT STATION UNIVERSITY OF ILLINOIS
In Cooperation With
THE DIVISION OF HIGHWAYS STATE OF ILLINOIS
and
THE BUREAU OF PUBLIC ROADS U. S. DEPARTMENT OF COMMERCE
Urbana, Illinois June 1953

i
I. INTRODUCTION . . . . . 0 0 0 0 1
1. Introduction 0 0 0 0 · 1
2. Object of Investigation · " · · 2
3. Scope of Investigation and Outline of Tests. 3
(a) Modes of Flexural Failures · · · · · 3
(b) Variables 0 0 0 0 · · · · 4
(c) Scope of Tests · · · · · · · · 5
(d) Outline of Tests . · · · · · · 6
4. Acknowledgments. ft . 0 0 " · 7
5. Notation 0 . 0 0 0 · ., 0 · · · · · 9
II. DESCRIPTION OF MATERIALS J FABRICATION, AND TEST SPECIMENS. · 13
6. Materials 0 0 u 0 · · · · 13
(a) Cements 13
(b) Aggregates 0 13
(c) Concrete Mixtures 13
(d) Grout Mixtures 0 0 · · · · · · · 15
(e) Reinforcing Wire 0 · · · 16
7. Casting and Curing 0 0 0 Q 0 · 0 · · · · · · · 19
8. Description of Beams 0 · · · · · · · 21
III. PRESTRESSING EQUIPMENT AND PROCEDURE .. · 0 · · · · · · 24
,9. Anchorage Details of Wires . · 0 · · · 24
10. Tensioning Apparatuses 0 0 0 · · · · · · · 27
11. Measurement of Tensioning Force 28

CONTENTS (Cont'd)
12. Tensioning Procedure •
13. Grouting Equipment and Procedure
IV. INSTRUMENTATION, LOADING APPARATUS, AND TEST PROCEDURE
14. Instrumentation
(a) Electric Strain Gages . • • • •
(b) Mechanical Strain Gages •
(c) Measurement of Deflections
15. Loading Apparatus
16. Testing Procedure
V. ANALYTICAL STUDIES OF" THE ULTIMATE FLEXURAL CAPACITY OF PRESTRESSED BEAMS • • • • • • • • • • • • • • • • • •
17.
18.
General Remarks and Restrictions of Analysis .
Assumptions of the Analysis
(a) Crushing of Concrete ata Limiting Strain
(b) Linear Strain Distribution
(c) No Tension Resisted By Concrete ••
(d) Stress-Strain Relationship Of the Steel •
(e) Stress Block of the Concrete
(f) Bond Between Steel and Concrete •
19. Ultimate Strength of Rectangular Beams Reinforced in
ii
29
30
32
32
32
36
37
38
40
44
Tension Only • • . • • • • • • • • . • • • • •• 47
(a) Equations Derived From Equilibrium Conditions 47
(b) Equations Derived From Compatibility of Strains • • • • • • • • • 48
(c) Effective Percentage 55

CONTENTS (Cont'd)
(d) Comparison of Ultimate Flexural Capacities Based on Actual and Idealized Stress-Strain Diagrams for the Wire • • . • • . . •
iii
57
VI. ANALYTICAL STUDIES OF TEE SENSITIVITY OF THE ULTIMATE
VII.
FLEXURAL CAPACITY TO THE VARIATION OF SEVERAL PARAMETERS.. 61
20. Effect of Prestress, ise 0 . . . . . . . . . . . 21. Effect of Parameter ~ . . . . . . . . 22. Effect of Parameter ~k3 . . .. . 230 Effect of Ultimate Concrete Strain, E.u
ANALYTICAL STUDIES OF THill DEFORMATION OF BEAMS
24. Deflection at First Cracking
250 Defleution at Ultimate Load .
26. Mid-Span Deflection at an Intermediate Point Between
61
62
63
64
65
65
67
Cracking and Ultimate Load .... • 69
VIII. TEST RESULTS 72
72
74
75
78
80
27. Measured and Derived Quantities ••
28. Behavior and Mode of Failure of Test Beams
(a) Under-Reinforced Beam$
(b) Over-Reinforced Beams .
29. Strain Distribution Over Depth of Beam
30. Load-Deflection Characteristics .
(a) Effect of Effective Percentage Parameter,
83
Q IE sP I f ~ 0 0 .. • 0 • • • • • •• 86
(b) Effect of Variations in p and f~ for Beams Having the Same Value of Q 87
(0) Effects of Prestress

iv
CONTENTS (Cont'd)
(d) Reloading Characteristios •.•..•• 0 •• 93
(e) Comparisons With Ordinary Reinforced Concrete Beams • . . . 94
31. Steel Strains and Stresses
32. Conorete Strains on Top of Beams
330 Moment-Curvature Relationship
340 Loss of Prestress . • • • • •
35. Empirical Expression for ~~ •
IX. COMPARISON OF EXPERIMENTAL AND ANALYTICAL RESULTS
101
102
103
104
108
36. Comparison of Measured and Computed Ultimate Moments 108
37. Comparison of Measured and Computed Strains Before Craoking . 0 • • • • • • • • • a • • • • • • • • • • 113
38. Comparison of Measured and Predicted Cracking Loads. 115
39. Comparison of Measured and Computed Mid-Span Deflection . • • • . • • • • . . • . • ~~o
(a) Deflections at First Cracking . 116
(b) Deflections at Ultimate Load ..•• 118
(c) Deflections at an Intermediate Load. 119
40. Relative Energy Absorbing Capacities 120
x. SUMMARY AND CONCLUSIONS • 122
APPE:NDIX: BIBLIOGRAPHY 126

v
TABLES
1. Outline of Tests 0 . · . . · · · 127
2. Sieve Analysis of Aggregates 0 · .. 0 · · 128
3. Properties of Concrete Mixtures 129
4. Properties of Grout Mixtures 0 0 · · · . . 131
5. Properties of Reinforcement Steel 132
6. Properties of Beams · . Q · · 0 · 133
7· Properties of Net Cross-Section · .. .. · · · · · 135
8. Comparison of Measured and Computed Ultimate Steel Stresses 0 . . 136
9· Measured Values of kk 137 1 3
10. Comparison of Measured and Computed Ultimate Moments 138
11. Comparison of Measured and Computed Values of the Cracking Load " . . · · · · · · · · · · · · · 139
12. Comparison of Measured and Computed Mid-Span Deflections at First Cracking · · · · · · · · · · · · · . . 140
13. Comparison of Measured and Computed Mid-Span Deflections at Ultimate Load · · · · 0 0 0 141
140 Computed Loads and Deflections Corresponding to a Concrete Stress of 0.75 ff · · · · · · · 142 c
15. Comparison of Measured and Computed Relative Energy-Absorbing Capacities · · · · · · · " .. 0 · 0 0 · 143

1.
2.
3.
4.
5.
6.
7.
8.
9·
10.
11.
12.
13·
FIGURES
Stress-Strain Relationship for Type I Steel .
Stress-Strain Relationship for Type II Steel
Stress-Strain Relationship for Type III Steel . .
View of Grout Channel .
View of Test Set-Up . .
Details of Grout Channel
Beam B-5 After Shear Failure Had Occurred .
Beam B-16 After Failure By Fracture of a Wire
Outside Clamp-On Stirrup
Button Head Anchorages
Threaded Anchorages • • .
View of Nuts, Shims, and Dynamometer
View of Prestressing Apparatus
14. Details of Reinforcement Anchorages at Dynamometer End of
15.
16.
17.
18.
Beam
Location of SR-4 Strain Gages on Top Surface of Beams B-3 Through B-27 • . • • • . • . 0 0 0 • eo.
Location of Whittemore Strain Gage Lines on Sides of Beams
Deflection Measurement Locations
Testing Apparatus • 0 •
19. Idealized Stress-Strain Curves for Types I, II, and III Reinforcement 0 • • 0 •
20. Assumed Conditions at Ultimate Load 0 •
21. Strain Distribution in the Beam at Various Stages of Loading 0 0 Q 0 0 0 • • • 0 0 • 0 • • 0 0 • • • •
vi
144
146
148
149
149
150
151
151
152
152
153
154
155
156
157
158
159
160

22.
23.
24.
25.
26.
27.
28.
29.
30.
31.
32.
33.
34.
35.
36.
FIGURES (Cont'd)
Graphical Solutions for the Ultimate Steel Stress .•...
Comparison of Mult-Q' Curves Based on Actual and Idealized Stress-Strain Properties for Type II Reinforcement • • . •
Comparison of Mult-Q' Curves Based on Actual and Idealized Stress-Strain Properties for Type I Reinforcement •
Computed Ultimate Steel Stress, fsu 0 0 e •••••••
Effect of Prestress on Ultimate Moment Capacity
Effect of ~ On Ultimate Moment Capacity .•••
Effect of k k on Ultimate Moment Capacity 1 3
Effect of Eu on Ultimate Moment Capacity
Assumed Strain Distribution at Ultimate Moment
Idealized Moment-Curvature Relationship Q • •
Assumed Distribution of Curvature at Ultimate Moment
Assumed Strain Distribution at a Moment of ML . . . . Assumed Conditions of Equilibrium at a Moment of ML .. Assumed Distribution of Curvature at a Moment of ML . . Relation Between QI and Computed Ultimate Deflection
37. Crack Pattern and Extent of Failure of an Under-Reinforced
39.
40.
41.
42.
Beam, B-21
Crack Patterns and Extent of Failures of Typical Over-Reinforced Beams, B-8 and B-27 • • • . . . • .
Measured Strain Distribution in Concrete at Ultimate Load
Measured Strain Distribution for an Under-Reinforced Beam •
Measured Strain Distribution for an Over-Reinforced Beam
Load-Deflection Curve for B-1 0 0 0
vii
163
164
165
166
167
168
169
169
170
170
171
171
172
173
175
176
177
178

viii
FIGURES (Cont'd)
43. Load-Deflection Curve for B-2 0 0 179
44. Load-Deflection Curve for B-3 . · · · 0 0 · · · · 180
45. Load-Deflection Curve for B-4 . · · · · 181
46. Load-Defl~ction Curve for B-5 0 · 181
47. Load-Deflection Curve for B-6 182
48. Load-Deflection Curve for B-7 • 0 182
49. Load-Deflection Curve for B-8 183
50. Load-Deflection Curve for B-9 · 0 . · · · · · 183
51. Load-Deflection Curve for B-IO 184
52. Load-Deflection Curve for B-ll · 0 0 · 0 185
53. Load-Deflection Curve for B-12 0 · e 0 · 186
54. Load-Deflection Curve for B-13 0 0 .. 0 · · · · · · · 186
55. Load-Deflection Curve for B-14 · · · 0 · · · · .. · 187
56. Load-Deflection Curve for B-15 · · · 0 188
57. Load-Deflection Curve for B-16 · .. · · 189
58. Load-Deflection Curve for B-17 0 · · 0 0 0 190
59. Load-Deflection Curve for B-18 · · · · 190
60. Load-Deflection Curve for B-19 191
61. Load-Deflection Curve for B-20 · .. 0 · · · · · 191
62. Load-Deflection Curve for B-21 · · · 0 · · · · · · 192
63. Load-Deflection Curve for B-22 193
64. Load-Deflection Curve for B-23 193
65. Load-Deflection Curve for B-24 · 0 · 0 · 194

66.
67.
68.
71.
FIGURES (Contfd)
Load-Deflection Curve for B-25
Load-Deflection Curve for B-26 . Load-Deflection Curve for B-27
Moment-Deflection Curves for Beams Series 2 a 0 c 0 0 0 " 0
Moment-Deflection Curves for Bea.ms Series 1 and 4 0 0 0 " 0
Moment-Deflection Curves for Beams Series 3 0 0 0 a 0 0
. 0 0 0 0 · · 0 . . · · · 0 0 . ·
~ 0 · 0
with Various Values of Q: 0 0 . . " 0 0 0 · 0
with Va.rious Va.lues of Q:
· · 0 . · 0 · · · · with Various Values of Q:
72. Effect of Variations in p and f' for Beams Having "About the c
73.
74.
75.
76.
78.
Same Value of Q . 0 0 0 0 0
Effect of Prestress on Deflections: B-15 0 0 0 0 0 0 0 ., c 0 0 0 0 0 . Effect of Prestress on Deflections: B-18 0 " c " 0 . 0 . 0
Reloading Characteristics
Comparison Between Prestressed and Concrete Beams~ B-21 and TlLb
Comparison Between Prestressed and Concrete Beams~ B-5 and T2Lb
Comparison Between Prestressed and Concrete Beamsg B-18 and T3Mb
· 0 · · · Beams B-9, B-5, and
· Beams B-12, B-7, and
· 0 .
Ordinary Reinforced " 0 0 0 0 . 0 0 · 0
Ordinary Reinforced 0 · 0 " · 0 0 0 0 · Ordinary Reinforced
· · 0 . · . · · · · 79. Comparison Between Prestressed and Ordinary Reinforced
. ·
ix
194
195
195
196
197
199
200
201
202
203
204
205
Concrete Beams g B-8 and T5H 0 0 " 0 • • .. 0 0 205
80. Typical Applied Load versus Steel Strain Curves 206
81. Typical Load versus Concrete Strain Curves . • • • 207
82. Ultimate Concrete Strain versus Concrete Strength 208
83. Moment~Curvature Diagram for Typical Over-Reinforced Beams. 209

84.
85.
86.
88.
89·
Moment-Curvature Diagram for Typical Under-Reinforced Beams
Loss of Prestress 0 0 .. 0 • .. ..
Empirical Relationship for .. ~ ~ 0
Relation Between kl k3
snd Depth to Neutral Axis for Flexural Failures • 0 0 • 0 • .. .. • 0 0 0 0 .. .. 0 0 .. • •
Comparison of Theory with Test Resultsg Series 2
Comparison of Theory with Test Results: Series 1 and 4
Comparison of Theory with Test Results: Series 3
91. Comparison of Computed Ultimate Capacities with Test Results:
x
210
211
212
213
214
215
216
Using Computed f ........ 0 ...... 0 .. • • • • 217 su
92.
93.
94.
Modulus of Elasticity of Concrete •
Relation Between Modulus of Rupture and Concrete Strength ..
Effect of Q on Relative Energy-Absorbing Capacity ........
218
219
220

Ie INTRODUCTION
10 Introduction
STUDY OF PRESTRESSED CONCRETE BEAMS FAILING IN FLEXURE
Much has been written on the subject of prestressed concrete,
and much research has been done with this new structural material (1)*.
However, many of the tests have been concerned with the investigation of
materials for prestressed concrete or have been isolated tests of a parti-
cular type of construction. In planning this investigation, no attempt
was made to reproduce in detail any particular system of prestressed
concrete construction. The techniques employed were those found to be
most suitable for laboratory construction. The studies conducted have
been rather fundamental in nature. The major variables considered have
been studied over particularly large ranges so as to magnify their effects
on the behavior and ultimate strength of the test beams as well as to
cover more completely the practical range of the important variableso
A large number of variables affect the behavior, mode of failure,
and ultimate strength of prestressed concrete beamso To attempt to study
completely each of th~se variables in an empirical manner would involve
an exceptionally large number of testso Therefore, in order to reduce the
* Numbers in parenthesis refer to correspondingly numbered entries in the Bibliographyo

number of tests required, the general approach used in this investigation
was first to make analytical studies of the ultimate strength and behavior
of prestressed concrete beams as an aid in the planning and evaluation of
the testsc In this way the effects of many of the variables and parameters
involved could be studied analyticallyc The experimental phase of the
investigation, which followed, served to verify the assumptions made in
the analyses, to modify them where necessary, to evaluate certain para
meters, and to study the flexural behavior of the beamso Twenty-seven
beams were testedo
20 Object of Investigation
The ultimate aim of this investigation was the development of
analytlcal methods and the collection of data and information concerning
the ultimate strength and behavior of prestressed concrete structures for
use in choosing a satisfactory design procedureo Prestressed concrete is
most commonly used for structural members subject to flexure and shear,
and the phase of the investigation reported herein is limited to the study
of the most simple types of flexural members, beams having a region of
pure flexure.
The primary objective of the analytical studies was the develop
ment of methods of computing the ultimate flexural strength and the load
deflection characteristics of prestressed concrete beams 0 The analysis
has served two other purposes. First, it has helped to determine which
variables have a significant effect On the ultimate flexural strength and
mode of failureo And second, it has been used to study the sensitivity of
the ultimate flexural capacity to the variation of several parameters
appearing in the analysiso To do this, all parameters and conditions were

held constant except the one under considerationc Values covering a
relatively large range of this parameter were then assumed and the ultimate
flexural capacity computed 0
The objective of the experimental phase of the investigation was
to study the flexural behavior ,and mode of flexural failure of post~
tensioned, end-ancnored J bonded beamso RectanWJlar beams containing no
compression reinforcement and of this type of construotion were chosen
because it was felt they could be handled most easily by the analytical
procedures and that the required properties and characteristics could be
evaluated most readilyo
The test results were used to determine the adequacy and validity
of the analytical method~ Once the theories are established by these tests
and the effects of the significant variables evaluated, tests by other
investigators can be used to further check or refine the analyses 0
The tests were so planned that several parameters used in the
analyses could be evaluated empiricallyo The derived empirical expressions
and values were then used in later comparisons of the computed and measured
quantities 0
30 Scope of Investigation and Outline of Tests
(a) Mode~9~ Flexural Failureso Flexural failures may be grouped
into three categori8s~
10 Failure by crushing of the concre~e while the steel is
still in the elastic range or has undergone only small
inelastic deformations 0 Beams failing in this manner are
said to be over-reinforced 0

20 Failure by crushing of the concrete after the steel has
undergone large inelastic deformations. Beams failing in
this manner are said to be under-reinforced.
3. Failure by fracture of the steel before crushing of the
concrete occurs.
The first two modes of failures were obtained in these tests. Three of
the under-reinforced beams failed by fracturing one of the wires after
small amounts of crushing had occurred. The analysis is limited to those
types of failures in which the maximum load is reached when the concrete
crushes.
In addition to failure in flexure, a prestressed ,concrete beam
may fail initially in shear, in bond, or by failure of the anchorage of
the reinforcement. Beams failing in shear were tested in another phase
of this investigation and are reported in a thesis by E. M. Zwoyer (2).
Three beams of the tests reported in this thesis were nearly balanced
between shear and flexure. Beams B-1 and B-20 failed initially in bond.
Beam B-12 was nearly balanced between flexure and bond and failed by
destruction of the compression zone although it possibly suffered a
partial bond failure.
(b) Variableso The major variables considered in these tests
were the percentage of steel, type of steel (properties), amount of initial
prestress, and the concrete strength. Variations in the arrangement of the
steel wires were used to obtain a symmetrical pattern, and the effective
depth of the steel varied slightly. In order to prevent shear failures,
external clamp-on stirrups were used on 16 of the 27 beams. The other 11
beams had only the longitudinal tension reinforcement.

The following is a list of additional variables that were not
considered, but which may affect the behavior, manner of failure, and
strength of prestressed concrete beams 0 Many are common to ordinary rein
forced concreteo
10 Shape, size and proportions of beamQ
20 Effective depth of reinforcement~
3Q Type of construction~
aa Bonded or unbonded reinforcemento
bo Pre-tensioned or post-tensioned.
Co End anchored or noto
40 Loading~
ao Ratio of shear span to depth or M/V ratioo
bo Short time static or sustained loadingo
co Speed of loadingQ
do Repeated loading or fatigueo
From this partial listing of variables it can readily be seen
that the scope of the tests has been somewhat limited 0 A more extensive
list of variables has been compiled by Co Po Siess (3)0
(c) Scope of Testso The 27 rectangular beams tested were of
post-tensioned, end-anchored, bonded construction with the loads applied
at each third-point on a 9-ft span thus subjecting the middle third to
pure flexure a
The beams were all of the same nominal cross-section and lengtho
The tensile reinforcement was high strength steel wire, patented, cold
drawn, and stress-relieved or galvanizedo Adequate provisions against
shear failures were made in practically all beamso None of the beams had
compression reinforcemento

Cd) Outline of Testse The beams can be grouped into four major
series in which the prestress, percentage of steel, concrete strength,
and type of reinforcement have been variedo These series are considered
in groups for study of any particular variableo Table 1 gives the outline
of the test program 0 In this table the nominal values, ranges, and group
ing of the variables are giveno In the first three series of beams,
BI-B 8, B9-B14, and B15-B19, the major variables under consideration were
the prestress and the percentage of tension reinforcement. For each of
these three values of prestress, 20,000, 120,000, and 160,000 psi, the
percentage of reinforcement was varied from about 001 to 0.9 percent while
the concrete strength was of two grades 0 It is shown in later studies,
and verified by the tests, that the signifioant quantity governing strength
and behavior is the ratio of peroentage of reinforoement to the concrete
strengtho The two grades or qualities of ooncrete in the first three
series were used to obtain a wide range of this quotient of peroentage of
steel divided by the concrete strengtho In addition, the beams in the
different series were matched as nearly as possible with respect to this
quotient 0
The major variable under consideration in the fourth series was
the ooncrete strength which varied from about 1300 to 8200 psio In this
series the percentage of steel was varied from about 003 to 009 percent in
order to obtain quotients of percentage of steel divided by the concrete
strength nearly matching those of the other serieso This attempt to group
the variables was made to expedite comparisons 0 The beams with a nominal
initial prestress of 120,000 psi had two types of wire while those with a
prestress of 20,000 or 160,000 psi had a third type of wire as shown in
Table 10

One objective in planning the series with varying concrete
strength was to cover completely the practical range of concrete strengtho
In this manner, a wide range of applicability of the empirical relation-
ships derived from the tests was insured 0 The lower limit was the weakest
concrete that could be handled in the laboratory without special precau-
tionso The upper limit represented the strongest concrete obtainable with
the available aggregates.
The lower limit of the percentage of steel, 001 percent, was
used to obtain a beam in which a wire could be fractured after crushing
of the concrete had occurred 0 A percentage of steel of 009 percent
combined with a low concrete strength was found to be sufficient to cause
crushing of the concrete with the steel remaining in the ela$tic rangeo
30 Acknowledgments
The tests reported herein were made as part of the Investigation
of Prestressed Concrete for Highway Bridgeso The work was performed in
the Structural Research Laboratory in the Engineering Experiment Station
of the University of Illinois in cooperation with the Division of Highways,
State of Illinois and the Bureau of Public Roads, Uo So Department of
Commerce 0 Actual work on this phase of the project was begun in July, 1951.
The program of the investigation was guided by the following
Advisory Committee~
Representing the Illinois Division of Highways~
Wo Ec Chastain, Engineer of Physical Research, Bureau of Research and Planning
w~ Jo Mackay, Bridges and Traffic Structures Section~ Bureau of Design

Co E. Thunman, Bridges and Traffic Struotures Section7 Bureau of Design
Representing the Bureau of Public Roads~
R. Archibald, Chief, Western Headquarters
E. L. Erickson, Chief, Bridge Branch
E. Fo Kelley, Chief, Physical Research Branoh
Representing the University of Illinois~
Co Po Siess, Research Associate Professor of Civil Engineering
E. Hognestad, Research Associate Professor of Theoretical and Applied Mechanics
General direction of the investigation was given by
Dr. No M. Newmark, Research Professor of Structural Engineering, and
supervision of the program was provided by Dro Siesso The work was
carried out under the immediate supervision of Jo Ho Appleton, Research
Associate in Civil Engineeringo
This report was written as a thesis under the direction of
8~
Dro Siess and his assistance in planning the tests and his helpful comments
are gratefully acknowledged. Credit for assistance in the development
of equipment and analyses, and in conducting the tests and critical study
of the manuscript of this report is due to Mr. Appletono Appreciation is
expressed to E. Mo Zwoyer, Research Associate in Civil Engineering, and
I. M. Viest, Research Assistant Professor of Theoretical and Applied
Mechanics, for their many helpful suggestions, and to Ao Feldman, Research
Assistant in Civil Engineering for his aid in conducting the tests, reduc-
ing of data, and preparing of figures~
Portions of the wire reinforcement were donated by the American
Steel and Wire Division of the Uo So Steel Corporation through the courtesy

9·
of Mr. Wo O. Everling, Director of Research, and by the John A. Roebling's
Sons Corporation through the courtesy of Mro A. Lo Patterson, Sales
Engineer, Bridge Divisionu
5. Notation
The following notation has been used in this report~ The notation
for prestressed concrete, proposed in the report of Joint ACI-ASCE Committee
323 was used where applicable (4).
Loads
Cross-sectional constants
Ac = area of entire concrete section (steel area not deducted)
As = total area of tension reinforcement
b = width of rectangular beam
c.g.c. = center of gravity of entire concrete section
c.g.So = center of gravity of steel area
p =
d = effective depth of section
e = eccentricity of Cog.so with regard to c.g.c.
h total depth of section
Ic moment of inertia of entire concrete section about cogoc.
L = length of beam span As
steel percentage -= bd
Yb' Yt = distance of bottom (top) fiber to c.goco
C = total internal compressive force in concrete (Fig" 20)
T = total internal force in tension reinforcement
WD total dead load per unit length

Stresses
P = external load which, according to computations c (elastic analysis), would cause cracking of the
concrete
P = L concentrated live load
Pult = ultimate live load
~ = bending moment due to wD
ML = bending moment due to PL
MUlt' = ultimate bending moment due to wD + P ult
Mc = moment corresponding to Pc and wD
Fi = initial prestress force
F = effective prestress force after deduction of all losses
M' L
= bending moment due to eccentricity 'of effective prestress force
= bending moment corresponding to an arbitrarily assumed compressive stress of 3/4 ft on the top surface in the region of constagt moment
Concrete
Steel
.D J.
fl ~ C
compressive strength of concrete as determined from axially loaded 6 by 12 ino cylinders
fll = compressive strength of concrete in flexure c
f r
= modulus of rupture as determined from 6 by 6 by 18 ino control beams
modulus of elasticity of concrete
fO = ultimate strength of steel s
f Y
sy
ultimate steel stress at point of maximum moment
= yield strength at 002 percent offset (Figso l~ 2J and 3)
= idealized "yield" point stress (Figo 19)
10.

Strains
110
f . Sl
; steel stress due to initial prestress force
f se
Concrete
E ce
I €' tcc' tc
Steel
E cu
E u
E se
f e S
( su
E. y
= steel stress due to effective prestress force after deduction of all losses such as relaxation of steel, plastic flow of concrete, shrinkage of concrete, and elastic deformation of concrete
; modul~s of elasticity of steel
; compressive strain in the concrete at level of steel due to effective prestress force (Figo 30)
strain in top fiber due to effective prestress force (Fig ~ 30)
; strain in concrete at steel (top) level due to live loads (Figo 33)
; strain in concrete adjacent to steel at ultimate moment (Figo 30)
; ultimate compressive strain of concrete (Fig. 30)
= steel strain due to effective prestress
= ultimate strain of steel (at f~)
ultimate steel strain at point of maximum moment (at fsu)
= strain at 002 percent offset yield stress
Esy = idealized "yield" point strain
Parameters and Miscellaneous Terms
k d u
; distance from the extreme fiber in compression to the neutral axis at ultimate load (Fig. 20)
C kl = -k-f=n -b-k-d
3 c u
a parameter determining the magnitude
of the compressive force C (Fig. 20). It is the ratio of the average compressive stress to the maximum compressive stress

= coefficient determining the position of internal compressive force C (Figo 20)
fit k3 = ~ , ratio of compressive strength of concrete
fa C
in flexure to the cylinder strength
12.
E p Q = _s~ , effective percentage parameter (dimensionless)
fe c
:ill P QI = __ s __ , convenient form of effective percentage
q' = e
klk3f~
parameter for use in analytical studies of strength and behavior
f P sy ,effective prestress parameter
k k fS 1 3 c
f P q' = sy = "yield" point parameter
y k k fi 1 3 c
A = mid-span deflection
AC = mid-span deflection at first cracking
~L mid-span deflection at ML Ault = mid-span deflection at maximum load-carrying
capacity
~ = curvature of beam in region of constant moment
= curvature of beam at first cracking, in region of constant moment
rpult = curvature of beam at maximum load-carrying capacity, in region of constant moment

13.
II. DESCRIPTION OF MATERIALS, FABRICATION, AND TEST SPECIMENS
6. Materials
(a) Cements 0 Marquette Type I Portland Cement was used in 24 of
the beams. Alpha Type I Portland Cement was used in the last three beams.
Marquette Type III Portland Cement was used in the grout mixtures of all
beams. The Type I cements were purchased in paper bags in seven lots from
a local dealer and stored under proper conditions. The Type III cements
were purchased in six lots and stored under the same conditions.
(b) Aggregates. Wabash River sand and gravel were used for all
beams. The aggregate sieve analyses and fineness moduli are given in
Table 2. The coarse aggregate had a maximum size of about 1 in. and
contained a rather high percentage of fines. The sand had an average fine
ness modulus of about 3.20 Both aggregates have been used in this labora
tory for many previous investigations and have passed the usual specifica
tion tests. The absorption of both fine and coarse aggregate was about
one percent by weight of the surface dry aggregate. The origin of these
aggregates is a glacial outwash, mainly of the Wisconsin glaciation. The
fine and coarse aggregates were each purchased in six lots from a local
dealer.
The fine aggregate used in the grout mixtures of all beams was
a fine Lake Michigan beach sand. The gradation of this sand is also
given in Table 2.
(0) Concrete Mixtures. Data for the design of the mixes used
in the beams were obtained from a series of trial batches made prior to
the beam tests. These first trial mixes were based on experience and

results of former investigations conducted in this laboratory with the
same types of aggregateso When making the trial batches) enough water
was added to produce the desired slumpe The results of these trial batch
tests were reported in the First Progress Report of the Investigation of
Prestressed Concrete for Highway Bridges (5)0
The proportions of the concrete batches for each mix used in the
beams are given in Table 30 All proportions are in terms of oven-dry
weights 0 The amount of moisture in the aggregates was determined, and a
correction for free moisture in the aggregates was made, considering one
percent as absorbed moistureo These proportions gave mixes that were
easily placed with the aid of the vibrator. Slumps of all batches of
concrete are also listed in Table 30
The following properties of each batch are given in this same
table~ compressive strength, modulus of rupture, and modulus of elasticity.
The compressive strength, fa, given for each batch of every beam, is the c
average of four 6 x 12 ino control cylinders tested immediately after the
beam testo The age of all beams at the tiIDe of testing is recorded in the
table 0 The location of the batches in the beams is discussed in Section 7.
The values reported for the moulus of rupture are the average of two, three,
or four control beams J which were 6 by 6 by 18 ino The average moduli of
elasticity of the concrete are actually secant moduli at a strain of 0.0003
to 0000050 The moduli were obtained from strains measured on two, three,
or four cylinders of the second batch of concrete for each beamo A
compressometer having a gage length of 6 ino, a multiplication ratio of 200,
and a OoDOl-ino dial micrometer was used for this purposeo
The two concrete mixtures used in the first three series of beams
were designed to have 28~day strengths of about 3500 and 5500 psio The

strengths reported in Table 3 differ because of varying ages at time of
testing, different aggregate and cement lots, and adjustments in the water
contents to obtain workable mixes. The mixtures were therefore adjusted
slightly as the tests proceeded. The ooncrete mixtures used in the fourth
series of beams were designed to give a wide range of strengths, thus
giving a low, medium, and high strength concrete for each group of
quotients of percentage of steel to concrete strength mentioned in
Section 3d.
(d) Grout Mixtures. The grout in nearly all beams was composed
of equal parts of Type III Portland Cement and fine Lake Michigan beach
sand. The grout was mixed in a counter-current, horizontal, Lancaster
tub mixer of 2-cu ft capacity_ The sand, cement, and an aluminum powder
admixture were mixed thoroughly before-adding the waterc Enough water
was added to yield a grout with the consistency of a thick fluid. The
proportions of the grout mixtures and the compressive strengths of 2 by
4-in. control cylinders are given in Table 4. These strengths are the
average of four cylinders which were cast from the grout mix used in each
beam. The cylinders were cured in the molds in the air of the laboratory
until tested, with the exception of those from the first three beams. For
these beams the cylinders were moist cured until tested. All cylinders
were tested immediately after completion of the beam test and hence were
approximately two days old except for those of B-16 and B-23 which were
about three days oldo
The shrinkage was obse~~ed to be quite
in Beam B-1, which contained no aluminum, and is believed to have contri-
buted to the poor b~nd characteristics observed during the test of B-lo

As a result of these poor bond characteristios> a limited series
of bond tests were madso These bond tests, r6ported in the First Progress
Report (5), indicated the desirability of eliminating this shrinkage 0 The
pull-out specimens were 5 3/4-inQ cubes cast with the wires horizontal 0
The specimens with aluminum powder added developed a considerable amount
of sliding friction after the adhesion had brokeno
To counteract shrinkage of the grout, an addition of aluminum
powder was made to the grout mixes used in the remainder of beams testedo
The amount of aluminum powder in percent of the weight of cement is given
in Table 4 for each grout mixtureo This small amount of aluminum
powder caused expansion of the grout and materially improved the bond
between the wires and the grout. Beam B-20 failed in bond after crushing
had started because the wires had too smooth a surfaceo No bond failures
were observed in any other beam tests although Beam B-12 failed at a load
of about 93 percent of its computed flexural capacity and possibly could
have suffered a partial bond failure.
(e) Reinforoing Wireo Three types of high tensile strength
steel wire were used as tension reinforcement for the beamso Each type
is a cold-drawn high carbon wire given a special heat treatment, known as
"patentingllo The object of patenting is to obtain a grain structure which
combines high tensile strength with high ductility and thus imparts to the
wire the ability to withstand hard draftingo
The wire designated as Type I was manufactured by the American
Steel and Wire Division of the Uo S., Steel Corporationo This wire was
uncoated and was received in straightened 15-ft lengths 0 The following
steps were involved in its manufacture~ hot rolling J lead patentingJ

17.
cold drawing to 00192 ina diao, machine straightening, and treating
15 minutes at 750~ (stress relieving)o The manufacturer used the last
two treatments to produce a wire which was not oommercially available but
which had oertain physical properties desired for this investigation 0
Ordinarily, the wire is stress relieved by drawing through lead baths
without straightening firsto This basic steel wire has 0.80 percent
carbon and 0.70 percent manganeseo It has the stress-strain characteris
tics shown in Figo 1. The beams of Series 2 and 3 had this type reinforce
mento
Type II designates an acid steel wire manufactured by John A.
Roebling's Sons Corporation, and delivered in two 5-ft diameter coils, of
about 100 and 230 Ibs each. It also was stress relieved by a heat treat
ment after drawing and exhibited the stress-strain oharaoteristios shown
in Figo 2. This type wire was used in the last four beams of Series 1 and
in all beams of Series 4, as indicated in Table I.
The third type of wire J Type III, also manufaotured by John A.
Roebling's Sons Corporation, was a galvanized wire and was delivered in
one ooil of about 100 Ibo This wire was used in Beam B-1. The wires of
Beams B-2, B-3, and B-4 were of this type but the galvanizing was removed
with hydrochloric aoido The galvanizing prooess serves as a stress
relieving treatment for this type wireo The stress-strain relationship
for this wire, based on an average measured diameter of 0.192 in.
(galvanizing removed), is shown in Fig. 30
To improve the bond oharacteristics, the surfaoes of all wires,
with the exception of the reinforcement in Beam B-1, were rusted ~lightly
by placing the wires in a moist room for several days. This produced a

18.
slightly pitted surface which improved the bond characteristicso All
wires were cleaned with a wire brush to remove loose rust. The wires of
Beam B=20 were examined after the test was completed and found to be very
smooth and improperly rusted, thus accounting for the bond failure.
The nominal diameters of the wires in the as received condition
were given by the manufacturers as 0.192, 00197, and 0.196 ino respectively
for Types I, II and III. The average measured diameters of a large number
* of specimens were found to be 00193, 00199 and 0.192 in. for the respect-
ive types~ These diameters were used in all calculations and in the calcu-
lation of the stress-strain properties.
All wire specimens were tested in a 120,000-lb capacity Baldwin
Southwark Tate-Emery hydraulic testing machine, and strains were measured
with an 8-ino extensometer and recorded with an automatic recording device.
The averaging extensometer employs a Baldwin "microformer" coil in
measuring strain~ As used, the extensometer had a range of 4 percent
straina For some of the tests a steel sleeve was used to reduce the gage
length to 4 ino and thereby double the strain range. The extensometer is
so constructed that l.t may be left on the specimens up to fracture 0
The average properties determined from tension tests on the wire
a~8 tabulated in Table 50 All specimens listed were in a rusted condition
when testedo Loads were read to the nearest 10 lb.
The average properties reported for Type I and II wires are the
average of over twenty tests for each type. Small discrepancies exist
between some of these average values and the typical stress-strain curves
in Figs" 1, 2., and 30 This is because the curves are based on only those
.~. Gal vanizlng removed 0

tests believed to be more nearly representative in all respects" T:;:'.9
recorded values of ultimate strain, ~~, correspond to the ultimate siress,
fe o Some of the values were obtained from extensometer readings up to s
fracture, and others were obtained from elongations meas"..lred after :fracture
between scribe marks on the specimens. The latter values were corre8ted
for the elastic recovery, fifE. s s
The Type II and III wires had some initial curvature which caused
handling difficulties. The wire was very hard and stresses on the order
of 20-60,000 psi were developed in the tests before the grips of the test-
ing machine were seto Therefore, the lower portions of the stress~stra.in
curves represent extrapolations from higher stresseso For all calculations
a nominal value of Es = 30,000,000 psi was usede Measured values ranged
between 28 and 30 million psio
70 Casting and Curing
Since all beams were post tensioned, a hole was formed in the
lower part of each beam to provide a channel for the reinforcement 0 For
the first six beams the hole was roughly elliptical in cross-sectiono
The core form of tbis hole was composed of eight steel rods encased in
rubber tubing, a number of smaller tubes, and a cover of sheet rubber'o
The core form for subsequent beams was composed of eight 1/2-in" steel
rods, four I-inc angles, a number of rubber tubes, and a cover of sheet
rubber. The four angles were placed at the corners to form a more nearly
rectangular holeo The dimensions varied slightly, but in all comp~tations
the actual measured dimensions were used.
The rods were held in position by a steel template at each end
of the beam ana two metal II chairs" placed just outside the third-pointsQ

20.
The small tubes were placed between and outside the rods in such a manner
that the desired shape of core was formed 0 A strip of sheet rubber, about
4 inc wide, was then wrapped continuously around the tubes and anglesc
After the concrete had hardened, this form was removed from the beam by
first pulling out the steel rods, and then removing the tubes, angles, and
rubber wrapping 0 The edges of the rubber folds formed the rough surfaces
of the channel visible in the view of the finished core shown in Figo 4.
This roughness assisted in preventing any slip between the grout core and
the beam during the test. The hole was centered between 8 and 9 ina
below the top surface of the beamo The hole was nominally 2 by 3 in. and
was large enough to provide for 15 wires spaced on 11/16-ino centers. The
details of the grout channel are shown in Fig. 6.
To provide an access hole for grouting the reinforcement channel,
a section of garden hose was fastened to the core unit and extended to the
top surface. These holes were located about 1 ft from each end of the
beam.
The entire core unit was placed in metal forms. Wooden end
blocks which slipped over the core unit formed the ends of the forms. Two
form spacer pipes were located about 3 ft from each end of the beam.
Attached to these pipes were two steel hooks to facilitate handling of the
beams.
All concrete was mixed from three to six minutes in a non-tilting
drum type mixer of 6-cu ft capacity and was placed in the forms and cylin
der molds with the aid of a high frequency internal wibratoro The mixing
water was added after the dry materials had mixed a short timeo In spite
of the use of a butter mix to condition the mixer prior to mixing the

210
first batch, the strength of two separa;t,e- batches of the same proportions
varied to some extent 0
In order that the concrete in the oonstant moment section of
the beam be from the same b8tch~ the first batch of each mi~ was plaoed
in the outer qua:r'ters of ea.oh bea.m and the seoond in the centra.l ha.lfo
Four 6 by l2-ino control cylinders wer-e cast from each ba.tch.? a.nd two
6 by 6 by 18-ino control beams were cast from the seoond batGho
Several hours after casting the beams, the top surface was
troweled smooth and all cylinders capped with a neat cement pasteo The
forms were removed the day after the beams were cast J and the beams and
control specimens were stored under moist conditions for an additional
six dayso They were then stored in the air of the laboratory until
testedo All cylinders and control beams were tested i.tnms1ie.tely after
completion of the beam testo
80 Description of Beams
All 27 beams tested were re~>t.angula.r:; post~t3nsioned;.l. bonded
beams ha.ving end anchorages 0 They are desi~-nat.ed B~1./ B·_f~"0 J3.~3j etc 0
denoting the order in which they were testedv ~~e beams consisted of a
rectangular concrete sectio~ {Figo 4)J high strength 001d=clrawn steel~ire
reinforcement, and bearing blocks thrmrgh whioh the gpJ;<l.iEtd J.oads j the
reaotions, and the prestressing f01"08 from ths wiras we:{'6 s.pplied to the
beemc The beams were reinfor-ced longit.udinally in tar~sion onlyo The
wires extended in straight lines between the bearing blocks at each snd of
the beamo
The beams were nominal],y 6 by 12 ino in Cl"'oss:=sec:t,ion and 10 ft
in lengtho Although the beams were cast in metal forms the dimensions of

22.
the beams varied slightly, The measured widths and heights are given in
Table 60 The size of the grout channel was measured for each beam~ and in
Table 7. some of the properties of the net cross-section are giveno The
beam dimensions were chosen to be representative of full scale beams used
in practice and yet be small enough to permit easy handling in the labora
toryo
The number and size of wires used in each beam are given in
Table 60 The wires used in Beam B-1 were galvanized, but the area given
does not include that of the galvanizing 0 The areas for Beams B-1, B-2,
B-3, and B-4 are based on the diameters of the wires after the galvanizing
was removed.
Beams B~4, B-5, and B-6 failed in a manner similar to those
reported by Zwoyer (2) although the full flexural capacity was apparently
reached in these beamso A photograph of Beam B-5 taken after failure is
shown in Figo 7" In subsequent tests), outside "clamp-on tl sti::orups were
used in the beams requiring shear reinforcement in order to assure flex
ural failureo The clamp-on stirrups are shown in Figo 900 They were
chosen for two reasonsg first, they were available in the laboratory,
and second, they were easily applied and recovered for re-useo The
stirrups were spaced at 6 ino in the outer thirds of the span onlyo
Load was applied through bearing blocks at each third-pointo
These blocks were 6 inc wide} 8 ino long in the direction of the beam
span, and either 2 or 3 ino thicko The load blocks were made to act as
stirrups by attaching a 5/8-ino rod to each side and placing a heavy plate
on the underside of the beamo This was done in order to prevent distress
f!"om diagonal cracks which sometimes enter the region under the load.,

These load block stirrups and the clamp-on stirrups are visible in the
photograph given in Figo 50
The age of each beam at the time of the test was that given in
Table 3. All beams were prestressed and grouted two days before the test
with the exception of B-16 and B-23 which were prestressed and grouted
three days before the testo

IIIo PRESTRESSING EQUIPMENT AND PROCEDURE
90 Anchorage Details of Wires
One of the major problems encountered in the exploratory stages
of this investigation was the development of suitable equipment for
tensioning and properly anchoring the highly stressed reinforcement of
the beamso Two types of anchorages were used in the post-tensioned beams
described herein~ rivet-like heads formed on the ends of the wires, and
threaded connections 0
Wedge grips, although reliable and simple, were not used because
of two distinct disadvantages which they possess with respect to their use
in small test specimens 0 First, any slipping of the wires on release from
the tensioning jack could result in considerable drop of stress in short
beams if the wedges are set after tensioningc A threaded shimming device
used in conjunction with this type anchorage Gould possibly alleviate
this difficultyc Second, the size of the wedge grips required is such
that it is difficult. to obtain the small spacing of wires required in some
of the beams 0 For larger diameter wires this may not constitute an objec
tion to their useo
Rivet-like heads:; called "button heads", were used for end
anchorages in Beams B-1 through B-5o These button heads were used before
a satisfactory means of threading the ends of the wires was developedo
The button heads were cold formed on the ends of the wires by e. process
fully described in the First Progress Report (5)o Briefly the method was
as follows~ a chamfered washer was slipped over the wire leaving a projec
tion of about 3/8 ina for formation of the heado ?ne wire was tightly

25.
clamped, and a hardened plunger with a semi-circular recess was forced
down by applying load in a testing machineo The head produced was about
1/4 in. in diameter with a fillet below the head formed by contact with
the chamfer in the washer. Generally, the heads were slightly eccentric
because of a tendency to buckle in the heading operationo These button
heads are visible in the photograph of Figo 10.
A series of tests on the strength of button heads as anchorages,
reported in the First Progress Report (5), has shown that the heads formed
in this manner with proper washers consistently developed from 175,000 to
200,000 psi in the wireo Washers of different steel, length, and design
(chamfer or not) were used. The fillets on the heads seemed to help in
developing higher strengths, while the type of material in the washer and
length of washer had little effect upon the strength of the button head.
For post-tensioned beams with bonded reinforcement J threaded
oor~ections offer a simple means of anchoring the wires, and the wireS
may be arranged in a compact manner 0 Another advantage is that the
problem of shimming between the anchorage nuts and the bearing plates
is simplified, and practically no loss of prestress occurs when the stress
in the wire is transferred from the jack to the bearing platee In properly
grouted beams, the anchorages are called upon to resist no more stress than
that produced during tensioning of the wires, all additional steel stresses
being transferred to the concrete solely by bondo After securing special
hardened thread chasers and developing a satisfactory threading technique,
threaded anchorages were adopted and were used on all the remaining beams.
These threaded connections are shown in the photograph of Fig. 11.
Specially heat-treated chasers with 24 threads to the inch were
used in an automatic threading machine to cut the threads on the end three

inches of the wires. In spite of heat treatment j the chasers became
dull after threading thirty to fifty wires and required resharpaningo
The threads on the wires were cut to provide a medium ~it with the
threads in the nuts 0 This resulted in a thread which was slightly
larger than a NOQ 10 which has a basic major diameter of 00190 inv
The nominal diameters of the two types of wires on which th~eads were
cut were 00192 inc and 0.196 in.
The nuts were specially made in the laboratory machine shopo
They were sub-drilled with a No. 16 tap drill and tapped with a standard
Noo 12, 24 threads to the inch tape This provided a full No. 12 thread
in the nutsQ A NOe 10 thread in the nuts required too much material to
be cut from the wires to be practical. The thread cut on the wires to
fit the Noo 12 thread in the nuts was sufficient to develop at least
160 j ooo psi in the wires for several days and was considered to be the
most sui.table.
The first nuts were made from l/2-inv diameter dri.ll roG.~ the
properties of which are unknown. They were impr.operly hardened, and
several of theID failed after having been re-used a few tiroesc Subsequent
nuts were made from "Buster I) alloy punch and (:;hisel steel having the
following composition limits~
Carbon Silicon Chromium Tungsten 'lanad.ium
0056 ~. Co 60 0060 - 0080 1010 ~ 1030 2000 - 2030 0020 .- 0030
These nuts were octagonal in cross section and could easily be removed
from the tested bearrs wi tb. a wrencho Tr..ey wers hardened by the following
proaedur6~ pack in charcoal in a olosed steel box, heat fer 20 min0 at
1200'==F, heat for 45<--60 lllE" at l650~ J oil quench to slightly above room

temperature, temper 30 mino at lOOO~, and remove frc'ffi furnace 'and air
coolo Two furnaces wer'e used for the process so that ther'e was no
delay between consecutive operations 0
Both types of nuts were 5/8 inc long and are show~ in Figv 120
100 Tensioning Apparatuses
For the first few beams with button head anchorages a lO~ton
Blackhawk hydraulic ram and pump was used in conjunction with a jacking
fra.me and yoke to tension the reinforcement 0 The jacking frame was
bolted to the bearing plate to provide a reaction for the jacko To
tension the wires, the jack reacted against the frame and 'a yoke which
transferred the tensioning force from the jack to the wireo
A shimming device was developed to transmit the tensioning
force from the washer beneath the button head to the bearing pla.te on
the end of the beam without loss in stress when the jacking force is
releasedn This device consisted of a 5/8-in. threaded stud with an
internal hole of 002 i.n c diameter J and an inte~nally thre8.d.e(~ sleeve of
7/8 ino diametero The wire was tensioned by pulling on the S/B-ino stud.
Slotted steel shims were used to take up large amounts of elongationo
The 7/8-.ina sleeve WB.S then turned up tight agai,nst th9 bearing block or
shim and the pressure in the jack releasedo
For the other beams a 30-ton Simplex Genter~ho16 hydraulic ram
operated by a Simplex pump was usedo This jack eliminated the nsoessity
of a yokeo Figu~e 13 is a photograph of this apparatus in place during
the prestressing of a beamo To tension the wi~ees.5 the ram reaoted against
t~'J,6 :!:raL:18 and a 5/8'~ino rod, The thrust was transferred from the ram

to the wire through a threaded union connection. One sn~ of the ~Onnec-
~ion was tapped to a depth of 1 ino with a standa~d NOe 12, 24 threads
to the inch tap so that it could easily be turnei on ~hs w~reso The
connection was hardened in the same manns:::' as the ~':lts u Wben the wire
was tensioned to the desired stress, a nut was turned up tight against a
shimo The shims were 5/8 ina long and redu~9d the required length of
thread on the wiresa
The end bearing blooks used in all beams were 6 by 6 by 2 ina
and were heavy enough so that a fairly uniform bearing prassure was
produced on the ends of the beamo The heavy blocks eliminated the need
for speoial reinforoement near the ends of the beam and proved satis~
factory in this respeoto A bearing block is shown in place in the
photograph of Figo 110
.., -, I' _..J-e Measurement of Tension~ Force
Aluminum dynamometers were used to measure the teTIsioning forcea
They were placed on the end of the wire opposite that at which the tension
was applied. This means of measuring the tensioning force was ohosen
because a fairly precise measurement of stress in the wiras could be
obtained c Furthermore:J the dynamometers could easily bs rla'::ed on the
end of the w:..r-es and could be re-usedv These dynamometers are shown in
Figu 14~ They are 2-in. lengths of 9/16-ing aluminum a~loy rod 5 with
c) n 2·~in g diameter holes drilled through their centers"
The tensioning force was dete~mined by measuring the oompressive
strain in the dynamometer by means of two Type A7 SR"-4 elsctz":l.C strain
ge,geso Ilhese gages _~ fi:t-ts,i::;hed to opposite sides of the d:y:n6.IDOmet.er J were
wires in series, giving a strain reading which was the average of the

strain in the two gages, This arrangement was such that small eccentri
cities of the load would not affect the strain reading. The dynamometers
were calibrated on the 6,OOO-lbo range of a 120,OOO-lb capacity Baldwin
hydraulic testing machine, The calibrations of the dynamometers were
nearly the same; the strain increment necessary to measure a tensioning
stress of 120,000 psi in the 0.196-in. wires was about 1500 millionths.
This large increment of strain allowed a fairly precise measurement of
stress in the wires, since the strain indicator used had a sensitivity
of two or three millionths.
The tensioning force was transferred from the wire to the dyna
mometer through a nuto A washer was placed between the dynamometer and
the bearing block.
12v Tensioning Procedure
The following description applies to the wires with threaded
anchorages, however the procedure employed for the wires with button
head anchorages was similaro
Before inserting the wires into the grout channel, one end of
each wire was threaded through one of the bearing blocks and secured with
a nut. The other ends were placed in their respective positions in a
small metal template. Then all wires were pulled through the hole in the
beam in one operation, removed from the template, and inserted into the
other bearing blocko The blocks were set into a thin layer of "Hydrocel"
gypsum plaster, The easiest method found to secure the blocks was to
tension one wire with the tensioning apparatus. The washers and dynamom
eters were then slipped onto the wires at one end of the beam, then more

YJ8.shers if required to take up slack, and finally the anchorage nuts
were run on each end of each wireo
Initial readings were taken on all dynamometers and readings
were taken for each type of instrumentation described in Section 14.
The jacking frame was attached to the bearing block and the pull rod
connected to a wireo Next the center-hole ram was placed over the pull
Tod and each wire tensioned individually to the desired value of stress,
the anchor nut turned up snug against the washer or shim, and the
pressure on the ram releasedo
Since the beam underwent a certain amount of elastic shortening
with the tensioning of the wires, the first wires stressed had to be
adjusted if an exact ~\yalu.e of stress was desiredo In some instances the
interior wires were initially overstressed slightly and not further
adjustedo The actual average value of initial prestress, fsi' is listed
fo!' each beam in Tabi.e 60 Immediately following the tensioning of the
reinforcement, readings were taken for e~ch type of instrumentation
described in Section 140
:1.30 Grouting Equipment and Procedure
The grout pump was a positive displacement type pump with a
hydraulically operated pistono The cylinder of the pump was a 5-in~
diameter steel tube about 30 in. long with a steel plate, having a hole
threaded for a hose connection, welded to the lower end. A piston with
a cupped pump leather attached was bolted to the base of a I 1/2-ton
hydraulic automobile bumper jackv The jack was rigidly attached to the
cover of the pump in such a manner that the plunger of the jack extended
into the cylinder and drove the piston down. The cover was attached
wo the cylinder by togg18 bolts with wing nuts. This arrangement

permitted rapid refilling of the pump cylindero The grout was pumped
through a heavy garden hose into the beam immediately after tensioning
the wireso
The grout was pumped into the beam through a vertical hole
located about one ft from the end of the beamo In most cases sufficient
pressure could be developed and the grout flowed freelyo Care had to be
taken to avoid lumps in the grout mixturee Small lumps formed directly
underneath the piston as water was squeezed auto It was learned by
experience that removal of these hard lumps prior to refilling the pump
avoided any difficultieso To keep out any foreign matter and lumps of
cement, all sand and cement was sievedo Pumping was continued until
grout was forced out the other access hole at the other end of the beamo
Inspection of all tested beams revealed that all portions of the wires
were bonded and that this grouting procedure was satisfactoryo

IVo INSTRUMENTATION5 LOADING AFPARA':I"US, AND TEST ?ROCEDtJRE
140 Instrumentation
The types of measurements of strains and deflections in ~he
tests reported herein were selected with the object of studying the
action of post-tensioned bonded beams at all stages to failure and obtain
ing data for determining the applicability of the analytical method of
computing the ultimate flexural strength of such Jeamso
a. Electric Strain Gages. This subject is divided into two
sections for purposes of descriptiono First the electric gages on the
wires are discussed, and next the electric gages on the concrete 0
Strains were read with a Baldwin Portable Strain Indicator. Dummy gages
for temperature compensation were mounted on unstressed steel blocksc
Strains in Ghe reinforcing wires were measured with Type A12 and
Type A7 SR-4 electric strain gageso Both these types were found to be
suitable if special care was taken in attaching them~ The A12 gage
has a nominal gage length of 1 in ~ and a minimum ti"i::n wid. th of 1/8 in.;
it was chosen for its narrow widtho The A7 gage has a nominal gage
length of 1/4 in. and a minimum trim width of 3/16 ino 9 it waS chosen for
its narrow width, short length, and its flexibility;! which the A12 gage
lacks. The two types gave comparable results, but the AT was believed
preferable because it was easier to applyo
The wires of the beams in the first and four.th ser~es were not
initially straight 0 As these wires were tensioned, flexural strains
were introduced 0 To minimize these effects, the gages were applied on
trl.s sides rather than on the inside or outside fibers of the curved

wires. Because of this effect, the first increment of strain recorded
may be in error, but strains recor-ded after prestress (wire already
straightened) should reflect correctly the strains due to axial tension
in the wires.
All gages were placed on the wires within the constant moment
section of the beamsc Usually, gages were placed on at least one half
of the total number of wiresv Generally, gages were placed symmetric
ally with respect to the midpoint of the beam. In beams with mul1:i
layered reinforcement J gages were placed in each layer 00 preserve
vertical symmetry also" If all gages did not function properly through
out the entire test, the effective depth of the remaining gages was
computed so as to give the proper depth to which the average strain
applied.
The surface of the wire was prepared for the gage by removing
the rust with emery cloth and cleaning the surface thoroughly with
carbon tetrachloride and acetoneo Duco cement was used as the bonding
agento
Some difficulty was encountered in attaching the SR-4 gages
to the small diameter wireso The gages would not hold the contour of
the wire upon first applicationo The technique employed was to soften
the gages with the cemento They were then applied to the wire and the
excess cement squeezed out by applying a very slight pressurec Usually,
the gages had to be curled in this manner then lifted off and re-applied
with more cement 0 To be su.re that the entire grid pattern was bonded
8:1d excess cement removed, the gages were gently stroked with a ru.bber
eraser and then wrapped with either thread or a rubber band, which was

later removed when the osment had drieda After several hours of air
drying, heat lamps were used to hasten the drying of" the cementa
34.
Two different types of material were used to waterproof the
gages: Cycleweld 0-14 Cement and Petrolastico Gycleweld is a cement,
produced by Cycleweld Cement Products, Trenton, Michigan. It oonsists
of a resin and an activator whi.oh forms an extremely str"ong and water~
proof coating when cured0 However, several hours are ~6quired for the
material to set, and for the first hour it is quite viscous and tends to
drip from the wireso Some doubt exi.sts as to the elasticity of the
Cycleweld because in some bases the gage appeared to be waterproof before
prestressing (tested under water) but was not waterproof a.fter prestress
ingo Either the Cycleweld cracked due to the prestress elongation or it
was damaged when the wires were pulled through the grout channel.
Petrolastic is an asphaltic compound produced by Standard Oil of
California. It is easily applied and gives good re8ultso The material
is first melted with a low heat and when applied to the gages solidifies
quickly. Care was taken t.o avoid small air bubbles} caused by overheat
ing), which might puncture and admit moisture 0 It was found that if the
wires were heated by lamps first a better bond between the wi~e and Petro
lastic could be achieved~
Regardless of which waterproofing agent was used J the gage was
first padded with cloth adhesive tape and the lead wires wers taped to
the reinforcing wire so that they could not be moved and t.he waterproof
seal brokeno
The lead wires from the gages were carried down the grout channel
to the end of the beam where they were brought out from behind th3 bearing
block through a small groove formed in the concretav

The gages were read to the nearest 10 millionths strain, but the
results obtained were not always reliable to this degree of precision for
several reasonso First, the value of strain observed was a function of
the location of the gages with respect to cracks in the beam, which in
turn occurred in a random mannero Second, readings between zero stress
and full prestress in the wires were influenced by the flexural strains
due to the initial curvature of the wireso Also, some of the gages were
sluggish after grouting because of leakage 0 Generally, these gages
dried out and appeared to be as sensitive as the others at the time of
testing the beamo Although these gages could be compared with other
gages at the same level, it was never known for sure whether they were
functioning properlyo In spite of all these difficulties fair agreement
was obtained between the measured steel strains and concrete strains
measured at the level of the steel with a mechanical gageo
Strains in the concrete on top of the beam were measured with
Type A9, SR-4 electric strain gageso This type gage has a nominal gage
length of 6 in. and was suitable for finding average st~ains in the
constant moment section of the beams 0 On Beam B-1, strains were measured
only at mid-span on the top surface using two gages 0 Five gages, placed
symmetrically about mid-span and extending between the loading blocks
were used on Beam B-2Q The strains were measured in all other beams by
means of four A9 gages plaoed in a staggered line on the top surface in
order to have continuous strain measurements over a 24 inc length at
mid-span. Two of the gages were about 1/2 ino on one side of the longi
tudinal center line and the other two about 1/2 ino on the other side as
shown in Fig. 150

Shortly before the initial set of the concrete occurred, the
top surface of the beam was struck smooth with a finishing trowel. When
this surface was later ground and polished with a portable grinder, it
was suitable for mounting SR-4 gages. Only the small area necessary for
the gage was ground" A thin layer of Duco cement was applied and allowed
to dry before placing the gages. The gages were then attached with Duco
cement and light weights applied to the felt-covered gages while the
cement dried. Heat was not used to hasten the drying period since it
could be detrimental to the concrete. The' gages were generally applied
two or three days prior-to prestressing the beamo To protect them, a
coating of wax was applied after the cement had thoroughly dried,
b. Mechanical Strain Gages. The distribution of strains in the
concrete over the depth of the beam was measured with a 6-ino Berry
strain gage for Beam B-lo A lO-ino Whittemore strain gage was used in
all other testso If curvatures were so large that the strains were
beyond the range of these gages a direct reading reading gage employing
a O.OOl-in. dial micrometer was used and read to the nearest 00001 ino
Strains with the Whittemore gage were estimated to the nearest millionth.
Readings on all gage lines were read twice or until readings agreed with
in 10 millionths straino
The locations of the gage lines are given in Figo 16. For most
beams~ the gage lines were located at 2, 4, either 8 or 9, and 11 1/2 in.
below the top surface and on both sides of the beame A gage line was
placed at the intended level of the steel which was either 8 or 9 ino
below the top depending on the magnitude of the prestressing foroeo In
general the actual effective depths were greater than the planned depths.

Several causes of these deviations are~ variations in size of b8am J
upward deflection of beam during prestressing, and inaccura.cies in
setting the end bearing blockso However, in all beams the concrete
above the reinforoement was carefully removed after completion of the
test and the effective depth measuredo The gage line located at the
11 1/2-in" level was used only up to first cracking of the beamo At
each of the other three levels, strains were measured on three continu-
eus IO-inc gage lines giving the average strain over 30 ino at each
level and on both sides" The values for the two sides were averaged,
hence for each level six strain readings were obtained to give one
pOint on
Steel plugs, 1/2 inc in diameter and either 1/2 or 1/4 ino
long with gage holes dril:.ed to a depth of about 1/8 ino were cemented
to the sides of the bea.ms to form the gage lineso By keeping these
holas cleaned and beveled with a center punch, oonsistent readings could
be obtained a Very little difficulty was ericountered as far as loosen-
ing of the plugs was concerned 0 A short section of T'19.ilroad rail was
used as a standard bar.
Co Measurement of Deflectionso Deflections were measured with
OcOOl~ino dial indicato!''S and, for some beams, with a steel rule gradu-
ated in hundredths of an incho Deflections were taken at mid-span and
at or near (3 inc inside) the third-pointso The presence of the third-
point stirrups necessitated moving these gage locations 0 In all cases
the mid-span deflec;tions were observed with a dial indicator 0 For
20me beams,'7 particularly those with large deflections~ a steel rule was
used also~ A complete summary of locations of deflection measurements is

In all cases measurements were made from the base of the
testing machine to steel plugs on the longitudinal centerline on the
under side of the beam or to paper targets mounted on the sides of the
beam at mid-depth. All steel rule measurements were made on both sides
of the beam at each location and the average reading usedo Steel rule
measurements were abandoned when it was found that the Ames dial indica
tors could be used safely to ultimate load if blocks were provided to
keep the beam from falling on them when final collapse occurredc
As described in Section 15, the beams had one support near the
end of the arm of the machine and another over the stiffer central
portiono As load was applied, the arm deflected and the deflections
recorded were not the true deflections of the beam with respect to a
support line. Since this arrangement was used in two different testing
machines having different deflection characteristics it was necessary to
calibrate the machines and correct all deflection readingso This was
done for all beams except B-1, which was tested in a third type of
machine and not placed out on one arm.
15. Loading Apparatus
The beams were tested on a 9-ft span with loads applied at
each third-pointe The first beam was tested in a 300,000-lb capacity
Olsen screw-type testing machine and the load measured with the weighing
mechanism of the machine. Beams B-2 through B-9 were tested in a 300,000-
Ib capacity Riehle screw-type testing machine and the load measured with
a 125,OOO-lb elastic-ring dynamometerc The remaining 18 beams were
~ested in a 200 J OOO-lb capacity Olsen screw-type testing machine~ The

testing machine applied the deformation~ and a 50 J OOO-Ib elastic-ring
dynamometer measured the loadc The weight of the distributing beam
used was taken into account in all calculations since the dynamometer
did not measure this loado
In order to provide access to the beams during the tests, they
were not positioned in the middle of the machins j but to one sideo To
assure concentric loading and freedom at bearings, the arrangement shown
in Fig. 18 was used for the last 18 beams. Figure 5 is a photograph of
a beam in position ready for testingo For Beams B-2 through B-9 a set
up similar to that shown in FigQ 18 was used except that a half-round
bearing at one end of the beam was used instead of a ball.
The head of the testing machine moved down pulling down a load
beam which pivoted on a column pedestal on one arm of the machineo
Attached to the other end of this load beam was a dyna.mometer and a dis
t.ributing beam composed of two 12 by 5:...inc I~beams. This distributing
beam could easily be removed by an overh6ad crane; and the load beam
rotated so as to enable the test beam to be placed in the machineo
To secure proper alignment, the second bearing block on the
underside of the beam at the roller end was mounted in plaster after the
beam was put in its proper locationo Next the two blocks on top of the
beam were set in plaster, particular care being taken to place the one
carrying a roller in a level positiono After the plaster had set, the
di.stributing beam could be placed, and the dynamometer and load beam
rotated into positiono This technique made it possible to obtain a
stable and aligned set upo The distributing beam could be lifted with
the load beam by means of four suspender rods so that the zero-load
readings could be takeno

If required;! the vertical clamp-on stirrups were next mOlirrted"
They were tightened with a wrench, thus prestressing the beam slightly
in a vertical directiono After all readings were taken, the beam was
ready for prestressing as described earliero
The elastic-ring dynamometer rested on a steel ball for the
Riehle testing machine set up~ To provide greater stability this ball
was replaced by a few copper shims for the set up shown in Figo 180
This proved satisfactory since the rotation of the load beam was quite
small 0
160 Testing Procedure
The amount of time that the beams were under prestress wa.s
not a variable under considerationo Two days was believed to be the
minimum desirable amount of time between grouting and testing of" the
beams 0 This waiting period gave sufficient time fer the grout to ·:ry.arden
and gain strengthQ
All readings were taken immediately after t.ensioning as mentioned
earlierc To be able to study the rate of drop-off i:a p:restr"'ISSs9 rss.dings
were again taken after grouting, which took about ona hOD.:!:""> .s.:rl.Q at several
other times before starting the test two or three' days letex'c o
The number of increments of load applied to thebe-:l,m du.ri.ng the
test varied with the strength of the beam and its b8havlor 0 Ar:. ave!"age
number of increments per test was about 250 In most cases aboui; 4·-5 hours
were required for completion of a testo Generally, the increme:''1ts were
based on load until signs of distress such as soaling and slight 0rushing
were noted in the concrete on the top surface or until s:.tGeSsi··/8 8J..ongations

of the steel occurredo For most beams, about 1000 Ib or' load wers
applied per increment in these earlier stages of the testo Often j just
prior to first cracking, smaller increments of load were applied and
only deflections observed~
In the later stages of the tests the increments were based on
strain and deflection readings rather than loado Any significant change
in behavior of the beam such as extensive crushing or extensive cracking
governed the size of the incremento Particularly, just before cracking
and near ultimate load, the load and mid-span deflection were sometimes
observed simultaneously and the testing machine not stoppedo The beams
were loaded until there was a complete disintegration of the compres~ion
zone or fracture of a wire 9 at this stage the load-carrying capacity was
generally quite small 0 In only a few beams could any portion of the
load··deflection curve after ultimate be determined because of the yiolent
and sudden type of failures 0
The following measurements were recorded after the applioation
of each increment of deformation~ the maximum load attained during the
increment, the mid-span deflection corresponding to this load, the deflec
tion a;t, the load points, the strains on the top concrete surface.9 the
st.rains in the reinforcement, and the load and corresponding mid-span
deflection of the beam after all readings for the increment were oompleted.
During the four or five increments before cracking of the beam, the
Gencrete strains on the sides of the beam were observedo They were also
measured for several increments as the ultimate load was being approached
so 8"S to determine the strain distribution at \11 timate load 0 Crack.s were
m.arked for each increment, and the development of the cra0ks was recorded

by marking the number of the increment at the top of each cracko A
running log of any significant change in behavior of t.he beam was kepto
Photographs of the beams were taken showing the crack pattern shortly
before the ultimate load was reached and the general appearance of the
beam after failure had occurredo
The strains in the aluminum dynamom6te~s were recorded several
times during a test to see if any end slip had occurred. None was
observed except for Beams B-1 and B-20o Bond failures occurred in these
two beams because the reinforcement in them had too smooth a surfaceo
Most beams were tested to destruction without interruption or
unloading at any time 0 Some beams, however, were unloaded to study the
reloading characteristics of the beams, particularly after they had crack
ed,
v 0 ANALYTICAL STlJDIES OF THE ULTIMATE FLEXURAL CAPACITY OF PRESTRESSED BEAMS
1 '7 ~ General Remarks and Restrictions of AnalysJ.:s
The analysis is limited to bonded prestressed bee,ms failing in
flexure 0 Both post-tensioned and pre-tensioned beams are consider6~c
Failures by shear or bond are not consideredo The analysis was 6eveloped
for rectangular bea~ with straight reinforcement; however, it is believed
that the expressions derived are applicable also to beams of other oross-
sections if the compression area at failure is rectangularo Furthermore,
as long as the location of steel at the critical section is the same,
the computed ultimate flexural capacity of bonded beams with curved or
draped reinforcement is the same as for bonded beams with straight rsin-
forcement. The analysis is restricted to bea.ms without ccmpressJ.oYJ. rein-
forcement~
The equations for the ultimate moment of bonded prestressed
concrete beams as developed here are in essentially the same ~orm as
those presented in the First Progress Report {6·j} end the assump"ti')J.'ls on
which they are based are similar to those used in ultimate theories fo~
ordinary reinforced concrete 0 In fa.ct, when the terms in the ultimat.e
steel stress expression which relate to the prestress only are equated to
zero, the expression reduces to those given in ordin8.)"'Y reinfvrced Gonerete
theories (7) 0
Expressions are derived for the ultimate moment 0apaaity in terms
of the known properties of the beam and of the concrete a~d i·:"! ter-TIiS of
-t:,he steel stress at ultimate moment in the 2'"egion of maximum moment"
T.his ultimate steel st.ress is an unknown but ca.n be derived from the

44~
oO!.1di ti.ons of compatibility of strain as shown in Section 19b 0 By
~d€alizing the steel stress-strain curve, a relation between the ultimate
steel stress and known properties can be found 0 The results are conveni-
ently given in the form of non-dimensional curves of the ultimate moment
1)"S:r~SUS a parameter, Q!, involving the modulus of elast.icity, the percent-
E ... ge of steel, and the average strength of the concrete in flexure" The
effects of prestress enter into the analysis when the cGmpatibility
J"E;la.tionships for strains over the depth of the beam are oonsidered Q
18," Assumptions of the Analysis
The following assumptions are made in developing ihe expressions
fo!" the ultimate flexural capacity of the beams.
(a) Crushing of Concrete at a Limiting Strai:.lo The analysis is
b~,;~ed upon the supposition that the maximum flexural capeci-t:y- is reached
when the ooncrete crushes, with the steel stress in either the elastic or
:_~.1ela8tic range 0 It is assumed in the analysis that tht: crushing of the
C',\rlcret.e occurs when the maximum concrete strain reaohes £j, defini-sa
\Y6.:llieo 'rhis value of ultimate concrete stra.in, fu apge8X"S in the equa-
Mea.surements in these tests and a.lso those uf s.:<v8r'al othe:r.~
~.:;:r{.,;'estigations of ordinary reinforced concrete members {!a'\?8 indicated
that this assumption is justified (7) (8)0 Figures 81 and 82 indicate
t::i.a"t. this maximum concrete strain is independent of the concrete s-Grengtho
AD. 6:,terage strain over 24 ino of the top surface wi thin tha middle third
i:,:'i-S been considered to define E. 0 Studies given in S>jc"t 0 23 indicate t.he u
rLL1~,i:mate flexural strength is not sensitive to vari.ations in f ~ hence U'
-:~.:T':; lise of a constant E. proves to be sa.tisfa.ctory- fa>,:, 'the anaIysis c. u

(b) Linear Strain Distributiono Linear distributior: of the
strains in the concrete from the top of the beam to the le~)'el 0:: the
steel is assumed at all stages of loading. This assumption is required
in order to express the strain in the concrete adjacent to the steel in
terms of the ultimate strain in compression at the top surface of the
beamo
Measurements made in these tests have demonstrated that linear-
ity of strains exists in the region of pure flexure to a marked degree,
thus justifying this assumptiono
(c) No Tension Resisted by Concrete. Tensile stresses in the
concrete are neglected in the expressions for ultimate strengtho Tensile
st~esses undoubtedly exist in the concrete between cracks and also near
the neutral axis at high loads, but it has been assumed "that their contri-
·!:m-cion to the ultimate moment-carrying capacity of the baam Gan be
neglected in the cause of simplicity with little erroro
(d) Stress-Strain Relationship of the Stee~<, It is as;sumed that
~h9 stress-strain relationship for the steel is known y and in this analy=
s:~s the ultimate flexural strength has been computed us:Lng ·Gn.(~ 6.ctual
stress~strain diagram of the steel as determined from te::'1.8Io:-:1 t8StS"
Hc:rv;ever j in some cases the actual stress-strain curve of th8 steel illay be
8pproximated by an idealized curve of two straight lines as shown in
F:1.g" 190 The inac curacies resulting from this replacement a.ra discr'lssed
in Section 19 and shown in Figso 23 and 24 which are discussed latsro
~oroe is
(e) Stress Block of the Concreteo The internal compressiv9
defined at ultimate load by two parameters} k 1
and k and its ~ ./
:Location by a third parameter, ~, as shown in Figo 20" Hence the actual

shape of the concrete stress block (stress distribution) is not req~iredo
Man:" ultimate theories are based upon a particular distribution of
s (,ress in the compressive zone of the concrete at the ul t.imate flexural
:l.oad (8) 0 The usual means of getting this dis tri bution of s tre3S :is to
f,,3SUme that the strains measured on the compression sid.e of 8. bee.m may be
applied to the stress-strain curve of a cylinder tested in conc8n~riG
compression in order to obtain the flexural stress distribution,. However,
J."t; has been long recognized that an ultimate strain could be developed
in flexure which is greater than the strain attained in an axially loaded
;:ylinder (9) 0 By determining the parameters defining the stress block
from the flexural test results this difficulty is avoid8d~' T~e first
par~meterj kl' is defined as the ratio of the average compressive stress
-:~.() the maximum compressi va stress of the concrete in flexti~e v The paJ.'C'a-
meter, k3' is defined as the ratio of compressive strang-t.b. of concret.8
~i:.l flexure to the cylinder strengtho Actually in no place i.n tIle analyses
do these parameters appear separately 0 They can be interpretsd as one
par-a.meter, ~ k3 j which is the ratio of the average (;om:In~~s8:.v19 strength
fibant quantity for discussing results of fle~~e tests is k ~ ~e rather 4 :1--3'- c
thc..!1 f ~ 0 An expression for ~k3 is derived from "the test T'8sul ts and
prl:jsented in Section 350 The parameter, k2
, cannot be evalv.loted. from the
tast results since its magnitude depends on the shape of s-c,2~ess blockQ
How':3"Jer} it is known to have a small range of values and, further1!lore 5
«~',e ultimate moment capacity is not sensitive to variations in :~" A
'-~:'Tls"tant, 'I.yalue of 0042 was chosen for use throughout this report Co
(f) Bond Between Steel and Concrete 0 The bond condi 1)ion between
.... ;., .. ,? reinforcement and the concrete iI1..fluenoes the condi ti.on of

oompatibili ty of strains c Perfect bond is assumed tc· exist. between the
concrete and steel after the concrete or grout has hardenedc This
assumption is not strictly correct because local bond failures and local
slips will occur in the vicinity of cracks 0 However, this oondition is
approached when the beam develops many well-dist:K"ibuted cracks and it
seems rea.sonable to assume that no general slip exists between the
concrete and the reinforcing steel. Comparisons of measured concrete
strains over 30 in. at the level of the steel with measured steel strains
~onfirm this assumptionc
190 Ultimate Strength of Rectangular Beams Reinforced in Tension Only
(a) Equations Derived From Equilibrium Conditions~ The
condition at ultimate load at a point of maximum moment :1:5 illustra.ted
in Figo 20. From statics, referring to this figure~
T =
The ultimate resisting moment produced by this couple acting on the
beam is ~
<")
M = T(d k2kud ) = f bd~(l = k 2k'il. ) (2) ult suP ,
OT
M f p ult su (1 ~ " (3)
k k f~bd2 k k fe k2.Ku )
1 3 c 1 3 c

From the condition of equilibrium of horizontal for::;es stated in
Eq, (l) ~I the parameter k may be calculated as ~ u
f pbd f P k = =aoo..,.s..,.u___ = __ s_u_
u klk3f~bd ~k3f~ ( 4)
By substituting Eqo (4) in Eqo (3), the following equation can be written
for the ultimate moment capacity of a rectangular beam reinforced in
tension only~
M ult
k k f'bd2
130
= k u (1 - ~~)
This equation has been developed using only the oond.itions of equilibrium
and is valid for any type failure 0 In this equation, tht:.' quantities f Q, C
'tl;; d; ~J and ~k3 represent the physical propertie~~ of the '(,earn a.nd of
the ~oncrete 0 The meanings of all symbols are explained :Ln S;dctiO!1 50
:Ct l.S assumed that they are known for any specific bec~m" Tbe qua.nti ty ku'
whil)}:-l defines the position of the 'neutral axis at ult 1.IDB,t· 6:,' ,iep8nds on
-t:ne known p-roperties P.I k_ lr J f! and also on the ste::31 StY'SS8 f J which -l) 0' su
is an u:n1<nowno
Analytical expressions are derived for k In S2c~ion 19b from 11
·~:h.c cond~ tions of compatibility of strain that exJ.st ~:)O:!., bfia.m::: with bonded
rei.nfoY'·oement 0
t.\'S-:"W8'STI the steel and. the concrete is assumed to bE; e·:::te.-b:'J..8hed after the

steel has been tensioned. In Figo 21, the strain distribution in the beam
is shown at three stageso (1) At prestress, the strain in the concrete
at the level of the ste61 is a compression E. , and the steel strain is ce
( 0 (2) As the load is applied to the beam j the compressi''c?9 strain in se
the concrete at the steel level decreases, and at some stage of loading
it reaches zeroo At this stage the stesl strain is equal to ~ + f , se ce
and the top of the beam is under compress ion. (3 ) With a f:lrther increase
in load, the concrete at the steel level is subjected to tensionu The
compressive strain at the top increases until it reaehes the ultimat.e
value E • The elongation at the steel level during the third stage of u
loading is designa.ted as tcu. Thus the tota.l steel strain at ultimate,
t J may be thought of as composed of three components~ S'Q
E: =E +E +£ su se oe eu (6)
From the linearity of strains, an expression for the strain in the concrete
adjacent to the ste61 at ultimate can be written~
E (1 ~ k ) u u
k u
Substituting Eq. (7) into Eqo (6) gives
f. = E su se
+ E ce u
(8)

f P k = __ s_u_
u k k f' 1 3 c
E. su
( u
- £ se
50.
- E + E ce u
Whenever equations involving strains are used in the calculations~ the
absolute values of strain are inserted into the expressions, the signs
having been considered in the derivation.
The ultimate steel stress for a particular beam may be obtained
by a trial and error process by using Eq. (9) and the actual stress-
strain curve of the steelo For a given beam, P/~~f~ is known, the
parameter klk3 being found from an empirical relationship between kl~
and ft which is given in Section 35. For a particular effective prestress c
t,he steel strain E: is also known. The strain in the concrete at the se
level of the steel due to the effective prestress force; tee' may be com
puted by considering the concrete to be elastic at this stageo For a
rectangular section, an expression in terms of known properties can be
0.aveloped. This f term is very small compared to the othar terms BEd ce
does not warrant a refined analysis. Therefore, for simplicity the gross
concrete section was used and the effective depth assumed to be equal to
2/3 h (lower kern point). The modulus of elasticity of the concrete used
in these tests has been found empirically to be approximately 1000 lLk~f!~ ~ ...... c
By equating C to T the following expression for E is obtained~ ce
f ce
= 8 Qi E '9 se
T;::i.is equation has been modified, however, to offset somewhat th6 error

51.
introduced by using the gross section instead of the ne";~ section;; -1-' line
resulting equation is:
Q'( se
1000 (10)
A constant value for the limiting concrete strain.' f J has been u
assumed. Hence, by assuming a value for the ultimate steel stress, fsu'
the ultimate ste el strain, E su' may be calculated from Eq 0 (910. -By
means of the stress-strain curve, it can be seen whethEr ~his oomputed
steel strain corresponds to the assumed steel stres80 If not) another
steel stress must be assumed and the process repeated,
A graphica] representation of this solution fo~(' the steel stress
at the ultimate load is given in Fig. 22. One relation between fs and ts
is given by the stress-strain curve of the steele Anothel~ relation
between these two unknowns is Eq. (9). A curve can b'3 obtained :Erom
Eq. (9) for a particular prestress and effective p8r~en~ag8.~ E p/k~k f " S .L 3 c
Several such curves have been superimposed on the stres~:;..-stT'f..l.j_l1 curve in
Fig. 22. The only point satisfying these two relations is the intersec-
tion point, which therefore gives the desired values of ±' and f. at 8n su
failure. The lines shown indicate how convergence -Go s,n a.nswer results
when a trial and error procedure is used. It is i.n-i::,eres-t;:i.r:o.g to note that
proceeding in the opposite direction, assuming a steel strain and comput-
ing a steel stress, results in divergence. The k parameter is 88s1.1y u
found if the ultimate steel stress is known and substi tt!ted in Eq 0 < 5) to
get the ultimate moment. The above descriptions apply to th8 case for a
specific beam. To construct curves of the ultimate momen"t c8I-acity versus

52~
the non-dimensional parameter Q~ = IDs P/klk3f~ for a given pl"'estrsss~
the process is modified slightlyo It is easier tc start with an arbitrary
.p and its corresponding strain E ,and an assumed f ., and to compute ':"'su su os"
Then ths value of ~ is computed and oe
checked against the assumed value. This term is very small and easily
estimated. Hence, the procedure converges rapidlyo
It is desirable to be able to solve for the ultimate steel stress
or the ku parameter directly. This may be done by assuming an idealized
stress-strain curve for the steel that can be expressed algebraicallyo
Figure 19 shows that the stress-strain curves for the cold-drawn high
tensile strength wires oan be closely approximated by two straight lines
having two distinct slopes Es and nEs. Two expressions can then be
written for the ultimate steel stress depending on whetht3r the ult::..mate
~3tress is less than or greater than the idealized "yield point~'s f sy
It should be pointed out that the cold-drawn high tensile 8tre~gth wires
selected for the experimental studies do not have snarp or definite yield
points, hence the idealized case solutions are slightly ~n 8~ror in the
region of f sy •
Over-Reinforced Beam.. Consider first the solu't:ton for k for an u
c",)"el"'-reinforced beamo Since the steel stress at ultimate is less than
the idealized "yield point", f = E E. su s su
multiplied by Es to obtain
E. su = fsu
Both sides of Eq., (.3) may be
E r I;:.
s U K
U
- E s f. u (11)

con\;'snient to change this into a dimensionless i'O!"rrt bJ' mu.:l tiplyi-ng
through by P/~k3f ~ and t.o define the various parameter-s as f'cl"tows 6
E p s
k k fV 1 3 c
Equation (II) then becomes
Q'E. k = qi + Q' E + U
U S cs ~
or
k i'q e 1.: \, e
Solving this quadratio for k u
1 = 2 (q~
u Q'E
u
The ultimate moment capacity of over~reinforo8d bonded. prastress-
ed cH.mcrete beams may bE; computed by substituting "the value ,~f k obtained u
which is based on the idealized str8s~=strB:n 0urve for the
T"S2:nfo:r-cement" in The ultimate moment Gapac1.ty obta.:hlEPl In thIs
m....,Jn~li3r is plotted against a non-dimensional parametsl"'J Q a.'1 in l;'i.gs 0 23
c"\nd 24- 0 The ultimate moment capacity has also betS:::. compu:t'sd bYSl:lbsti tuting

the value of k obtained from Eq. (9) in Eq. (5). The value of k u u
cbta,ined from Eq. (9) and the actual stress-strain curve for the rein-
forcement by using the trial and error procedure is valid for both
over a.nd under-reinforced beams. The ultimate moment capacity based
on the "trial solution for k is also shown in Figs. 23 and 240 u
If the prestress is zero, q' and fee are zero, and Eqo (1:2) e
reduces to such a form that the ultimate moment given by Eq. (5) is
the same as that for ordinary reinforced concrete beams (7)0
Under-Reinforced Beam. In an under-reinforced beam the steel
stress at ultimate is greater than the idealized "yield point". If
the inelastic portion of the stress-strain curve can be represented
by a straight line having a slope of aEs as shown in FigQ 19, the
icllowing expression may be written for the ultimate steel strain~
f - f ( = €. + su sy su sy ex E
;,~ 13)
s
TiLe substitution of this value for E in Eq. (8) and. multiplication of su
both sides of Eq. (8) by IDs yields:
:':nt:roduction of dimensionless parameters gives
= ex (q! e
'u, (14)

where
f p q f = __ S.¥OY_
Y ~k3f~
'rhis may be solved for k ~ u
1 [q~ ~ + a:(q~ q' = - -2 Y
~; + a:(q' - q' e y
55 ..
\ - Q t E.. + Q' f ) I + I
u ce ~ l
-2 - Q'E +QIE: )1 + aQDE
u ce l u -~
(16)
If the inelastic portion of the stress-strain curve is flat, then a = 0,
and the expression for k reduces to q' which is the value for ordinary . u y
1:" a:1.nforced concrete containing mild steel. Thus, for under-reinforced
beams having reinforcement with a flat yield point, the prestress does
.not affect the ultimate load. The ultimate moment computed from Eqso (16)
and (5) is also given in Figs. 23 and 24.
c. Effective Percentage. The ratio of the percentage of steel,
7'· to the average stress in the oompression zone of the beam at failure,
klk3f~, is a convenient term for use in studying the strengt.h and behav~
:.(11' of the beams. This quotient has been found to be the significant
qua.ntity in determining the characteristic behavior of the beamsc This
x-atio may be made dimensionless by multiplying by a term having units of
a stress, such as Es. The parameter thus formed is called the "effective
This arbitrary insertion of E yields a s
convenient parameter for studying both over- and under-reinforced beamso
Since the parameter q~ is equal to Q'fse/Es a!ld the parameter q;
is equal to Q tfSy/Es' Eqs. (12) and (16) for ku can be \i\1ri tten in terms

of QOJ f ,(, and the stress-strain properties of tne steel reinforce-
S9 U "
mento Hence~ one of the major variables in the expres~lons for k , which il
are based on the idealized stress-strain curves, is seen to be QD whioh
is equal to EsP/klk3f~o For a particular beam and a given empirical
expreSSion for ~~, the parameter QO can be evaluatedc In order t()
compare the test results with the predicted ultimate moment capaclties;r
2 plots .of Mult/~~f~bd versus Q! = EsP/klk3f~ have been usedu For a
narticular prestress f ,limiting concrete strain f 9 type of !~ain~ ~ se u"
forcement, and k2' the parameter Q 6 determines the magni t'ude of
M It/k, k"f ~bd2 and whether the beam is over- or under~~r6inforc9dc U .L j C
Studies made in the next chapter indicate that the ultimate
flexural capacity is not sensitive to the parameter J ~.~ defining the
location of the internal compressive force Cj partiauls.::"ly for under-
reinforced beams.. Since this parameter is known to have a narrow range
of values, it has been assumed that ~ = 0.,42 for all studieso
The maximum moment is assumed to be reached '\'In.:m. the concrete
crushes at a limiting straiuo The test data indicate that this limiting
strai~9 f~} is about 0900340 and is independent of the concrete strengtho
The value of MUlt/~k3f~bd2 can be computed fro~ Eqo (5) if kU
and ~ ar9 knOWllo The parameter k2 is assumed as discussed abo\'?9o The
paramet.er kU may be evaluated by using Eqo (9) and the actual stress
strain curve of the reinforcement or it may be "eval.uated by using E40 (12)
or (16)0 Equations (12) and (16) are based on the idealized stress-strain
curve of the reinforcemento For over-reinforced beams, Eqo (12) is used
and for under-reinforced beams, Eqo (16) is usedo Both of these equations
are expressed in terms of known properties of the beam QC c f J sa' f , a.nd
1.1

the stress~strain properties of the steel reinforcemento ~1e param8tar
1J.k3 can be determined from an empirical expression given ).n S3ctioh 3t:;
... /0
The range of Q! in these tests has been :from 8 (-Jl _ 0 , to 89,,8 which
is a rela.tively large range compared to the values li~~~lly to be found in
practice 0 The computed ul tims. te steel stresses for bsB!llS ha.ving d.i.:tf$~~
ant ef'fective percentages, Type I reinforcement, and eff'3ctive p!"6stresses
of 20 7 000, 116,000, and 150,000 psi are shown in Figo 25... The 0urves of
f versus QI were obtained by using Eqso (5) a.nd (9) a.nd. the actual su
stress-strain curve of Type I reinforcemento The only 8ssump"ticrl Ll)8.de
in constructing a curve for a particular prestress was that the limiting
concrete strain equaled 00003400
(d) Comparison of Ultimate Flexural Canacities Based o~ctual
and Idealized Stress-Strain Diagrams for the Wire 0 Th6 'o.l·'d,.mate f'18~u!."al
capacity can be computed by using Eq. (5). Two methods of computing the
term k , which a.ppears in this equation, have been given" Ea.nn ID8thoQ u
has its adva.nta.ges and disadvantages 0
The first method, which involves use of the actv.al str6ss-;~~tr6.in
curve, is the most accurate, particularly for ultimate ste®l stT'ains near
~he knee of the stress-strain curve c> The idealized CFlI"Ve dClviates from
the actual stress-strain curve for strains greater 'tha:n e.bO';lt 4. percent
for the wires used in this investigation, as can be seen in Figo 19Q
Thi.s ultimate steel stra.in is reached for beams with a Q~ of' about :LO or
lasso Although the first mentioned method of solvir~ for the ultimate
st,e~l stress involves a trial and error procednre .~ it has been f'ot'!nd to
converge rapidly to an answero If only a few beams are to be analyzed~
Eq 0 (9) probably is the quicker and easier method of finding th~'
parameter k 0 However, the idealized solutions may be easier to use u
when studying the effect of varying any particular ter11!.o
In this section a. comparison of the two metr:'.ods is made for a
particular prestress and for two different types of wire used in the
testso Modified forms of the idealized case solutions are also present-
ed and discussedo
Figure 23 has been constructed by using IDqso (5J J (9)j (12)J
and (16)0 The following values have been assumed in constructing these
Gurves~ fse = 116j ooo psis Eu = 0.00340, ~ = Oo42J and the stress~strain
properties of Type II reinforcement (Figo 2).. The elastic shortening of
the concrete, fee' wa.s assumed to be given by Eqo (10)"
The solid curve has been constructed by means of Eqs" (5) and
(9) and the actual stress strain curve of the wireo The so=ca~.led flE;l1:8ct"
Elxpression for k (Eq 0 9) is valid for both under and (J'iY(:1r,=!'eJ..!1.i.'Q!"csd u
beams 0 A trial and error solution has been used to obtaJ .. n this smooth
The dashed curves in Figc 23 were obtained by using Eqo (5) and
Eqso (12) and (16) based on the idealized stress-strain diagram f(n~"
Type II reinforcement (Figo 2) 0 Two idealized oW'\res a~e :r'lgy,uired 0.Elpend-
ing on whether the ultima. te steel stress, f , is above or below tl'"i.e su
.idealized yield pointo The two dashed curves based on thE< idaalizeCi
stress-strain curve and shown in Figo 23 are extended until they intersect.
This intersection point corresponds to the idealized yield point stress, fSYo
The "exact" and idealized curves of Figo 23 will agree for values
of Q' which represent ultimate steel stresses in the regions whsr8 the
idealized and actual stress-strain Gurves for the rei:rr.t'o~cement caincideo

'I'hereroT"e ,9 the greatest deviations between the Mul.t=Q C Cli:z"ves of Fig 0 23
OCGur for values of Qi which represent ultirnats steEl stresses near the
kneEl of the stress-strain curve 0 The ultimate steel stresses correspond-
iug to values of Q~ equal to 20, 30, 45, 70, and 90 are gi,rsn in Figo 220
'I'ee range of Q 8 from 45 to 90 represents only a small portion of t.he
steel stress,-strain curve involving the knee and explains the di.fferences
in the Mu1t -Q8 curves of Figo 23 for values of QO greater than ~'7o When
the ultimate steel stress is below the proportional limit of the steel J
M. 14 -QU curves will merge since then the actual and idealized stress il ....... "
strain-curves coincideo
Equations (12) and (16) for ku' based on the idealized stress~~
strain ourves, were modified to give equations involving fewer terms
and yielding values of k that agree almost exactly with t~ose obtained u
f~om Eqs. (5) and (9) based on the actual stress-strain ourve. These
IDGdified equations areg
and.
(18)
Equation {l'7) is used for under-reinforced beams and EC3. 0 (18) for (Jver~
reJ.nfcr~}ed beams c Since they simply represent empiriGa.l adjustments to
t'ne 1'"Tl6a of the actual stress-strain curve J they are valid for only the
t,ype wire a.nd the particular prestress shown on Fig 0 2~5 0 The values of
k given by the modifisd and "exact" expression diff8~ only in the third . .:;,
0'.;' fcu:rt:h :iecimal place 0

Comparisons between the l1exactft and idealized stress-strain.
curves were made also for Type I reinforcement and are given in FigQ 24Q
The same assumptions have been made in constructing this figurso Because
thlS type steel has a sharper break point, its stress-strain curve is
more closely approximated by two straight lines as shown in Figa 19J and
better agreement is found between the two curves shown in Fig. 24.
Equation (17) and (18) also fit fairly well the ~exact~ curve for this
particular prestress and for this type reinforcemento
It should be emphasized that the curves given are for a particu-
lar. w~re with a particular stress-strain relationshipo If this relation-
ship cannot be represented adequately by two straight lines the idealized
expressions are not valid.
In pre-tensioned beams the reinforcement is tensioned before
the concrete has hardened, When the tension in the wires is transferred
to the hardened concrete the strain in the steel 23 immediately reduced
bsoause of the elastic shortening of the concrete 0 If this reduced
steel strain is used for fs in Eq. (6) this and all equations derived . ~e
from it are valid 0 For rectangular beams, .an approximatE:l value of the
('';8 term may be found from Eq 0 (10) 0

ANALYTICAL STUDIES OF THE SENSITIVITY OF THE ULTIYillTE FLEXURAL CAPACITY TO THE VARIATION OF SEVERAL PARAMETERS
The major variables appearing in the equations for ultimate
moment are: the percentage of steel (p), the compressive strength of
the concrete (f~), the effective tensioning stress in the steel (fse )'
the dimensions of the beam, and the stress-strain prope::."ties of the rein-
forcing steel. In addition, certain parameters relating to the shape
and magnitude of the compressive stress block appear in the analysis
(k2
and kl k3), as well as the ultimate concrete st.rain (E.
u) 0
Each of the factors, fse' k2' kl k3, and €u) have been varied
over large ranges to study their effects on the relation between
M /k k f'bd2 and QV = E p/k k f'. ult I 3 c s 1 3 c
200 Effect of Prestress, fse
.fl.
"-58'
To study the effect of the magnitude of the efiectlve prestress,
on the ultimate moment oapa.city of bonded beams, t!l9 curves of
lJ""Jigo 26 have been drawn for Type I reinforcement 0 Thefollowing 781u8s
h8.ve been assumed in constructing these curves g k2 = 00 42,9 and
t. = 0.00340. D
The curves have been computed by using Eqso 5) and (9) and the
a0tual stress-strain curve of the wirec The elastic 00~crete strain,
(oe' has been assumed to equal Q@E:se/1000 as given by Eqo (10)0 Curves
have been drawn for effective prestresses of 20>,000;1 116,000, and
150,000 psi because these were approximately the average measured values
for the beams testedo
The lower portions of the curves in Figo 26 ::~6p!"esent failures
cy crushing of the concrete after the steel has undergo::18 s. certain amount

62.
of inelastic deformation. It can be seen in Fig. 26 that the magnitude
of the effective prestress has practically no effect on the ultimate
moment capacity for these under-reinforced beams. However, as shown
later, the cracking load and behavior of the beams are influenoed consi-
derably by the prestress.
The portions of the curves above the points marked A, B, or C
represent failures by crushing of the concrete while the steel is in
the elastic range or has undergone only small inelastio deformations.
Beams failing in this manner are said to be over-reinforoedo In these
oases, increasing the magnitude of the prestress increases the ultimate
moment capacity of an over-reinforced beam with a given effeotive percent-
age, Qr, and the inorease is greater as the value of QI is increasedo
The effect of larger prestress values is to shift the entire "oompression"
curve up, thus increasing the range of "tension" failureso For example,
the points marked A, B, or C on the 20,000, 1l6,000, and 150,000 psi
prestress curves ,: respectively, represent the values of Q e for which the
beams of each prestress will fail at an ultimate steel stress correspond-
ing to the yield strength at 0.2 peroent offset (209,000 psi)o This
arbitrarily chosen offset stress is one way of distinguishing between
under- and over-reinforced beams.
210 Effect of Parameter ~
The parameter k2 defines the location of the resultant internal
compressive force (Fig. 20). Since the magnitude of the k2 parameter
depends only on the shape of the stress block, it is 1/3 for a triangular
distribution and 1/2 for a rectangular distribution of strasso For pur-
poses of this study values of k = 0.333, 0.420, and 00500 were chosen. 2

2 Figure 27 shows curves of Mult/~k3f~bd versus Q~ based on
Eqso (5) and (9), for beams with Type II reinforcement and having an
effective prestress of 116,000 psi. The ultimate concrete strain has
been taken as 0.00340. The range chosen represents a very wide range for
.~his parameter. It can be seen that the ultimate moment is not very sensi-
tive to variations of the parameter ~, particularly for under-reinforced
beams. For all other studies in this report an average value of ~ = 0.42
has been used.
22~ Effect of Parameter klk3
The sensitivity of the ultimate flexural capacity to the variation
of the parameter ~~ is discussed in this sectiono
tion of this parameter is discussed in Section 350
The empirical evalua-
The parameter k_ has .L
been defined as the ratio of the average to the maximum compressive stresso
Therefore, the magnitude of ~ depends only on the shape of the stress
block. For a triangular distribution of stress in the compression zone,
k.: is equal to 005 and for a rectangular stress block it is equal to 100 ..
The parameter ~ has been defined as the ratio of the compressive strength
of concrete in flexure to the cylinder strengtho The test results indicate
t~at this factor is sometimes greater than 1.0. As mentioned previously,
kl and ~ do not appear separately in any expression and can be evaluated
from the test results only as one parameter, ~k3' which is the ratio of
the average compressive stress in the beam at failure to the cylinder
~trength.
For purposes of studying the effect of klk3 on the ultimate
moment, values of 0075, 1000 and 1025 have been choseno Values covering
this range have been obtained from the tests. To study the effect of

this parameter, a dimensionless plot of Mult/f~bd2 versus Q = EsP/f~
has been used as shown in Figo 280 The following values have been
assumed in computing these curves by means of Eqso (5) and (9)~ Type II
reinforcement, fse = 116,000 psi, €.u = 0000340, and k..2 = 00420 As for
the other studies, the concrete has been assumed elastic under effective
prestress.
It can be seen that the ultimate moment capacity is very sensitive
to this parameter. The points marked on the various curves represent the
values of Q for which the steel stress at failure corresponds to the yield
strength at 002 percent offset for this type reinforcement (218,000 psi)o
The effect of the larger values of klk3 is to shift the entire curve up
and to increase the range of "tension" failures 0
230 Effect of Ultimate Concrete Strain, £u
The maximum moment is assumed to be reached when the concrete
crushes at a limiting straino This limiting strain7 (u~ is defined as
the average ultimate compressive strain of the concrete in the beamo
The effect on the ultimate moment capacity of variations of this
quantity is discussed in this articleo The curves in Figo 29 were
constructed using Eqso (5) and (9) and the actual stress-strain curve for
Type II reinforcement. The effective prestress was taken as 116,000 psiJ
and ~ assumed equal to 00420 Values of 000028, Oo0034y e,nd 000040 were
assumed for ( . This represents approximately the range of values u
observed in the tests (Figo 82). From Figo 29 the ultimate flexural
Gapacity of the beams seems to be rather insensitive to variations in f 0
u
Consequently, an average value of 0000340 has been ohosen for use in all
further studies in this report 0 The test data indicate that Eu is inde-
pendent of the concrete strengtho

VIIo ANALYTICAL STUDIES OF THE DEFORMATION OF BEAMS
In this chapter expressions are developed for the mid-span
deflections of the beams tested, for loads corresponding to the cracking
load, to the ultimate load, and to an arbitrary load intermediate between
these. This was done in order to predict the shape of the load-deflection
curves for the beams 0 The computed deflections and computed loads are
compared with the measured load-deflection curves in Chapter!Xo The
assumptions made and the methods of computing the various deflections are
discussed in the next three sectionso All deflections J both measured and
computed, reported herein are deflections due to the applied loadso The
deflections due to the dead weight of the beam and those due to the
prestress are not consideredQ
240 Deflection at First Cracking
The mid-span deflection of the beams at the instant the concrete
cracks can be expressed in terms of the computed cracking moment, Mc v the
simple span length, L; the modulus of elasticity of the concrete, Ee; and
the moment of inertia of the concrete section, I u If it is assumed that c
tha stiffness EcIc is the same at all points along the beamJ the distri-
bution of curvature along the beam is the same as that for momento Tnis
was approximately true for the beams tested at loads below the cracking
load since the moment versus curvature diagrams based on measured strains
are very nearly linear up to the cracking load as shown in Figso 83 and
840 Therefore, the mid-span deflection at first cracking for a beam
loaded at the third-points
6. - 23 c - 216
is given by~ (')
M Lcc
m I c c

The modulus of elasticity of the concrete in tension was
assumed to be equal to the modulus of elasticity in compression obtained
from the control cylinders as explained in Section 600 Actually, a
varying secant modulus would be more appropriate since the modulus of
elasticity was continually changing 7 but this is not believed to be
warranted in view of the other assumptions made and the nature of the
problem c
The moment of inertia of the net concrete section before grouting
the core hole was used in all deflection computationso This is strictly
correct for the beam under the action of the prestress and dead weighto
Moreover, since the grout core was not prestressed and could possibly
crack before the bottom fibers, the use of the net I seems to be justific
ed also to describe the action of the beam under applied load. In most
cases, the use of the net moment of inertia instead of the moment of
Inertia of the gross section was found to improve the agreement between
measured and computed deflectionso
The cracking moment, Mc ' appearing in Eq~ {19) was computed by
assuming the concrete to be elastic under the action of the effective
prestress force, F9 the bending moment due to the eccentricity of this
force J Me 9 and the bending moment due to the dead load of the beams MDo
The concrete was assumed to crack when the tensile stress became equal
to the modulus of rupture obtained from tests of 6 by 6 by l8-ino control
beams 0 The measured values of the modulus of rupture are listed in
Table 30 The cracking moment and corresponding deflection at cracking
were not computed for B-26 because this beam was cracked during handl~
ingo The computed cracking loads and computed deflections corresponding

to these loads are shown for all other beams on the observed load-
deflection curves in Figs. 42 through 68.
25. Deflection at Ultimate Load
The mid-span deflection at ultimate load was computed from the
distribution of curvature along the beam which in turn was determined
from the theoretical strain distribution at ultimate load. The moment-
curvature relationship derived for the region subject to pure flexure
was assumed,t.o' apply throughout the length of the beam. This is justifi-/'
ed t~c~~~e the cracking due to shear was inhibited by the longitudinal
prestress and the clamp-on stirrups which prestressed the beam slightly
in a transverse direction.
The strain-distribution in the concrete at effective prestress
and at ultimate load was assumed as shown in Fig. 30. The change in
curvature of the beam at the location of maximum moment between effect-
ive prestress and at ultimate load was assumed as shown in Fig. 30. The
change in curvature of the beam at the location of maximum moment between
effective prestress and ultimate can be expressed as~
t: + € u
+ f ce
+ E cu iF. ,- te
~ult = ----------d---------- (20)
For most beams the strains due to the prestress, Ete and Ece,were found
to be relatively small compared to the strains existing at ultimate.
These strains due to the prestress were computed by an elastic analysise
The strain in the concrete at the level of the steel at ultimate moment
can be found from Eq~ (7), in which the parameter kU can be computed by

68.
any of the methods discussed in Section 19b. Values of fsu' computed
by means of Eqo (9) and the actual stress-strain curve for the wire, are
given in Table 80 Curves of the computed ultimate steel stress, f , su
versus QO shown in Fig. 25 are convenient for finding the k parameter u
for a particular beam with a given prestress. The curves of fsu,versus
QO were obtained by using Eqs. (5) and (9) and the actual stress-strain
curves for the wirec The average limiting concrete strain for each beam
was assumed to be 0.00340.
The moment versus curvature relationship for the beams can be
represented approximately by two straight lines, one up to cracking and
another from cracking to ultimate, as shown in Fig. 310 The general
nature of this curve agrees reasonably well with results obtained from
measured strains in the constant moment region of the test beams as
shown in Figso 83 and 84. Assuming this idealized diagram for the M-~
relationship to apply throughout the entire length of -uhe beam, the
dJ.stribution of curvature at the ultimate flexural capacity OI a beam
loaded at the third-points is as shown in Figo 32Q
The deflection of a beam subject to this curvature is given by
4 M M .6Ult
- __ c (IDu1t
- ~c
Mult + =-"-" _c_
Mult
Values of M were computed by an elastic analysis as described in c
Section 24 and values of Mult were computed by means of Eqso (5) and
(9) and the actual stress-strain curve for the wireQ The curvature at
cracking was assumed equal to M IE I as beforeo c c c
(21)

260 Mid-Span Deflection at an Intermediate Point Between Cracking and Ul timate Load
In order to predict the shape of the load-deflection curve more
aocurately, the mid-span deflection was computed for an lntermediate load
corresponding to the load at which the concrete stress on the top surface
reached an arbitrarily assumed value of 0075 fi o This value of compresc
siv8 stress was chosen so that the assumption could be made that the
stress in the compressive zone was distributed linearly 0 Expressions can
be developed for the curvature, moment, and deflection corresponding to
this stage of loadingo The curvature can be determined from strains as
was done at ultimate load.
The assumed strain distribution at the moment (M o ), which L
causes a compressive stress of 0075 f~, and the assumed strain distribu-
tion due to the effective prestress are shown in Figo 330 The strains,
~0e and f te , were computed by an elastic analysis~ The strain fU tc
G~)rresponds to the assumed compressi va stress of 0075 fOe This strain c
was computed by assuming the concrete to be still eJ..astic" The tSEsile
strain in the concrete at the level of the steel due to MV has besn called L
€ i 0 This strain and the depth to the neutral axis k U dare unkno'wn ~ If co
a value for k' is assumed, the strain E.~c can be easily computed by the
following equation~
(22)
and the strain in the steel can be found from~
E: + E E. ~ (l-k ti
)
+ tc se ce k'

This equation is of the 2ame form as Eqo (8)0 The st8~1 stress corres-
ponding to this strain, whioh is compatible with the assumed depth to
t he neutral axis, is found. from the stress=strain cur'ire of the ste910
From the conditions of equilibrium shown in Figo 34, the steal
stress is also found to be given by~
k~f8
c (24) p
If the steel is still elast.ic, the depth to the netural axis and hence
fs cOillld also be found by solving the quadratic equation obtained by
combining Eqso (23) and (24) u For these st.udies, hOW8'iler;1' the values of
k~ and fs were found by a trial and error procedure that is valid even
if the steel is no longer elast.ico If the assumed. value for kG is
c.orrect;- the steel stress found from the condition of compatibility of
strains and the stress-strain curve of the wire will agree with thE)!
steel stresE computed from Eq" (24) ba.sed on the aqai1ibri,u:m conditionso
When the correct steel stress is found the moment M G is easi1d1" found 11
=rom the equation~
MLl _. f A s s
The curvatllr-e in the region of pure flexure of the beam;. Gorres-
ponding to this mom.ent~ 1.S given by~
d 26)

The moment-c~rvature relationship up to this stage of loading
Gan be approximated by two straight lineso If the assum~tion is made
that the moment-curvature relationship determined for the section of
pure moment applies throughout the beam, the distribution of curvature
at this stage of loading is as shown in Figo 35 for a beam loaded at the
third pointso
The deflection of a beam subject to this curvature is given by~
D,' L
4M
M' L
e M
c ..1-. ~
L
In this equation L is the span length and Me and CD c ere the moment and
curvature, respectivelYJ at the cracking load of the beamu These may be
computed as described previously 0

VIIIo TEST RESULTS
270 Measured and Derived Quantities
The types of measurements of strain and deflection were selected
with the object of studying the action of post-tensioned~ bonded beams at
all stages to failureo In addition, they were selected in sucb a maruler
that several parameters and assumptions appearing in the analysis could
be evaluated from the test results and so that the applicability of the
analytical methods of computing deformations and ultimate flexural
strengths of such beams could be determined.
The maximum load attained during each increment of load or
deformation and the mid-span deflection corresponding to this load were
,.)bserved simultaneously c The mid-span deflection was easily observed at
critical stages of the test and was a convenient quantity for use in
determining other measured quantities at some particular stage of the
test by interpolation or extrapolation" For example, the measurement of
the strain distribution in the concrete over the depth of the beam
required nearly 15 minutes and could not be observed simultaneously 'With
-the maximum load. By taking such strain measurement,s du!~ing several
increments immediately preceding ultimate load the roeas'ured st.rains Gould
be extrapolated with the aid of the observed deflections to obtain the
strain distribution at ultimate load. These measured strains were
corrected for the compressive strains due to prestressing~ hence, the
strain distribution gave the depth to the neutral axis J k d, at maximum U'
load-carrying capacityo This depth was required in Ord8I" to evalua~e the
k k parameter from the measured moment. The location of the strain gage :.. 3
l~nes on the sides of all beams are given in Figo 160

For each increment of load or deformation; strains were ID88sured
on the steel wires and on the top surface of the beam with SR-4 e18c~tric
strain gages 0 The steel strains were compared with the ID8asured conorete
strains at the level of the steel in order to check the assumption that
no general slip occurs between the concrete and the r6i~orcing st8610
The development of many well-distributed cracks also indicated that satis
factory bond was established by the grouting procedurec No attempt was
made to study the local bond failures that occurred in the vicinity of
the cracks. The average concrete strains on the top 3urface over a
distance of 24 ino were measured to check the assumption that the maximum
flexural capacity is reached when the concrete crushes at a compressive
strain having a definite value and to evaluate this limiting straino
In addition to deflections at mid-span, deflections of true beams
at or near the load points were takeno All defle,:;,tiol1 measurement lo~a~
tions are given in Fig. 170
At each increment of load a careful inspection of the beam was
made to locate any cracks or signs of crushing of the cOTIorsteo The
c!"'ack pattern was marked and notation 0::' any significant change i,11 the
behavior of the beam recordedo Several photographs were taken of each
beam to record the crack pattern before failure and the nature a.nd \3xt.ent
of the failure oj Before applying the next increment; tt\iS loa.d and corres~
ponding mid-span deflection were again noted" There was some decrease in
load and increase in deflection during the time requi~ed for meas~r8m8nts
at practically all stages of loading 0
The following quantities were derived from the msa.surements made~
the maximum moment attained during an increment of 1000. or 0.eformat.ion ~

the curvature in the region of pure flexure from the measured
concrete and steel strains; the strain distributions over the depth of
the beams~ the parameter ~~~ the limiting concrete strain, from the
strain distribution at ultimate load~ the steel stress at ultimate load,
from measured strains and the stress-strain curves for the reir~orcement9
and the relative energy-absorbing capacitieso
The measured ultimate and cracking moments of the beams are
presented in Chapter IX J where they are compared with the computed
moments and discussed.
280 Behavior and Mode of Failure of Test Beams
The behavior of all beams was very nearly the same until the
cracking load was reached. The load-deflection curves of the beams were
very nearly straight lines in this stage~ The initial slopes of the load
deflection curves were about the same, as would be expected for beams of
the same nominal cross section, span length, and manner of loading 0 The
small differences in slope that did exist were proba.bly due to variations
in the modulus of elasticity of the concrete and the grout, and minor
variations. in the dimensions of the cross-sections of the beamso
The ability of the cracked beams to take load 8,S deformation
was being applied, as reflected by the shape of the 10ad-deflection
curves, as well as the height of the cracks depended on whether the beams
were under- or over-reinforced. Furthermore, the behavior of a given
beam depended on the magnitude of the prestress. To describe the behavior
and also the manner of failure of the beams, under- and over-reinforced
beams will be discussed separately.

An arbitrary method of distinguishing between under- and cver-
reinforced beams is to compare the effective percentage parameter QG with
the value of Q! representing an ultimate steel stress equal to the yield
strength at 002 percent offset, f 0 Actually, however, there is no y
sharp distinction between under- and over-reinforced beamso The behavior
and manner of failure of beams having values of QG either slightly above
or below the linearly balanced" condition were simils.ro A la.rge proportion
of the beams had values of Q' such that they failed at an ultimate steel
stress corresponding with the "knee" of the stress-strain curve for the
steel. That this will occur for a relatively large range of Q3 is shown
by Figo 22 where several solutions of the stress-strain relationship
given by Eqo (9) are superimposed on a stress-strain curve obtain8d from
a tension test of Type II reinforcement 0 For values of Q 0 ranging ::~roID
30 to 70, the computed ultimate steel stress ranges only from 230.,000 to
205,000 psi for beams with an effective prestress of 116,000 PS~0 ~his
represents a relatively large range in QBo
The mid-span deflections at ultimate load;; c;vmpu~ed by th,9
method described in Section 25, varied only from abou~, 100 to 1,,8 ina for
the relatively large range in Q I of 30 to 70 for beams with an effecti'lJ'8
prestress of 116,000 psio In Fige 36 are shown computed Q" veraus A ult
curves for effective prestresses of 20,000 and 116,000 psia These curves
indicate a gradual transition from under- to over-reinforced beamso
ao Under-Reinforced Beamso Under-reinforced beams failing in
flexure fail by crushing of the concrete after the steel has undergone
large inelastic deformations 0 These beams fallon the lower portions of
the MUlt/klk3f~bd2 versus Q! curves (Figse 88, 89, and 90)" Ths majcrity

of beams used in practice are under-reinforced, hence benefiting from
the "ductilityll and warnings of distress that this type of beam exhibits
before complete collapse or failure occurs. The following discussion
applies to an under-reinforced beam with a value of QC considerably
below the balanced Q'.
This type of beam exhibited three distinct stages of behavior
during loading to failure. In the first stage, prior to cracking, the
beams were elastic. The beams were stiffest in this stage because the
full concrete cross-section was effective. After first cracking of the
beams, but before the steel became inelastic, the beams still behaved
in an essentially elastic manner, although the average slope of the load
deflection curves was smaller because of the reduced stiffness resulting
f~om the decrease in moment of inertia of the cross-sectio~~ Then, as
the steel strains became inelastic, the beams underwent a relatively
large increase in deflection with little further inorease in loads until
a. secondary compression failure occurredc The load·-de:!::,lection curves of
an under-reinforced beam can be represented by three sloping lines corres
ponding to the three stages of behavior; a relatively steep straight line
up to cracking, another line with a smaller slope extending to the load
and deflection at which the steel started to become inelestic: and a
third line that is nearly horizontal extending to the load ,and deflec
-tion at which the secondary compression failure occurrer:!."
In all the under-reinforced beams, except those failing in bond,
shear, or by fracturing of a wire, final failure occurred by destruction
of the compression zone. The first sign of distress was usually a slight
amount of scaling or spalling of the concrete~ Horizontal cracks, visible

on the sides of the beams, often formed near the top surface 0 As addi
tional deformation was applied to the beams, the crushing extended over
larger areas and to greater depths with only very slight increases in
loado The crushing extended until the concrete could no longer carry
the compressive force that existed at maximum load" At failure j the
compression zone seemed to explode suddenly. Often a wedge of relatively
intact concrete heaved up. This sudden and violent type of secondary
failure was due to the large amount of recoverable energy stored in the
steel. When final collapse occurred, the load-carrying capacity
dropped to a very small fraction of that at maximum loado The nature of
these failures prevented measurement of the unloading characteristics of
the beams except in a few cases.
The three beams with a value of Q' less than 10 (2 wires)
behaved and failed in a slightly different manner than thB other under
reinforced beams. The curvature in the central third of these beams was
concentrated above the one or two major cracks that formed 0 Co~sequently,
the concrete strains were highest over the cracks, and the average concrete
strain at first crushing was considerably less than that in baams which
had many cracks and a constant curvature within the middle t:hlrdo The
load-carrying capacity of these beams was not suddenly lost when the
f::oncrete crushed. The load dropped off slightly as deformation was being
applied until finally one' of the wires fractured. Beam B-16 failed. by
f~acture of a wire at the one crack which formed. A photograph of this
beam taken after a wire had fractured is shown in Fig. 8.
As the effective percentage parameter Q' of ths under-reinforced
beams was increased) the behavior of the beams became GiOre nearly like

that of the over-reinforced beams. The length of the loading stage
between yielding and the secondary compression failure decreased and the
failures became more sudden and violent.
The crack pattern and extent of failure of an :.1nder-reinfo!"ced
beam (B-21) are shown in the photographs of Fig. 370 This beam had a
value of QI = 16.7, an effective prestress of 118,000 psi~ and had no
shear reinforcement. The flexural cracks extended to within about
1 1/8 in. of the top surface. The beam cracked at a load of 9.0 kipso
The top photograph in Fig. 37 shows the crack pattern when the beam was
carrying a load 1401 kips. At this stage, the mid-span deflection was
about 0.60 in. and the steel strains were still within the' elastic
range. The center photograph was taken after the steel strains had
become inelastic and the secondary compression failu~e had occurred at
a maximum load of 1603 kips and a deflection of 2 (.> 10 J.n 0 Ene load and
corresponding deflection at the stage shown in the oenter photograph
were 7'.7 kips and 2"50 in., respectively. The bottom pnotograph shows
the beam with the load completely off. The cracks had partially closed,
and the mid-span deflection was 1.51 in.
b. Over-Reinforced Beams. An over-reinfo!"ced beam is one in
which failure occurs by crushing of the concrete while the steel is
within the elastic range or has undergone only small inelastic deforma
tions. In order for a beam to fail initially in compression, abnormally
high,percentages of tension steel are required~ This type of beam falls
on the upper portion of the Mult/klk3f~bd2 versus QU (JU!""<tiSSo The over
reinforced beams failed more violently and with less warning than the
under-reinforced beams J and showed little if any ducti,li tyo

79·
This type of beam exhibits two different stages of behavior
during loading to failure. In the first stage, prior to cracking, the
beams were elastic. After first cracking, the beams were less stiIf,
but still behaved in an essentially elastic mannero The load-defle~tion
curve of an over-reinforced beam can be approximated by two sloping lines,
one to cracking and another at a smaller slope extending from the cracking
load and deflection to the values of load and deflection at which a
compression failure occurred. Generally, the beams developed a relative
ly small additional deflection between initial cracking and the brittle
type of compression failure. The curve shown in Figo 36 has been drawn
through computed points and illustrates the effect of prestress on ~ ult
for flexural failures. The computed curves indicate that the ultimate
deflection of a beam with a value of Q' equal to 70 is decreased about
20 percent by increasing the prestress from 20,000 to 116,000 psio
Generally, the over-reinforced beams failed with very little
warning. When signs of crushing of the concrete were noted, the deflec
tions were quite small and the cracks relatively narrowo Sometimes,
after first crushing, the cracks closed for a short distance below the
top of the beams, replacing the compression area lost by crushingo
Usually crushing developed at several locations on the top surface and
horizontal oracks formed at depths up to several inches 0 If the crush
ing was extending, the loading was stopped and the beam observed closely.
Often the maximum load remained constant for a few seconds and then
decreased slightly in the next minute or two as the beam deformedu
Then suddenlY and quite violently the beam collapsed, completely destroy
ing the compression zone. Usually, the beams ware oaught on ooncrete

blocks placed to protect the dial indicators and no unloading character
istics were observed.
Since the large amount of steel used in these beams was still
elastic when the beam failed, a large quantity of energy was released
when the compression ZOne crushed. This sudden release of energy caused
the two portions of the beams to undergo a shearing displacement in the
longitudinal direction. This phenomenon is visible in the center and
lower photographs of Fig. 38. The cracks which are not marked all
occurred after the concrete had crushed and while the relative displace
ment was taking place.
The top photograph in Fig. 38 was taken at the stage of the test
when the first signs of distress in the concrete were visible in Beam B-21.
The load and mid-span deflection were respectively 3200 kips and about
Oc76 in. The maximum load reached was about 33.8 kips and the corres
ponding deflection was only about 0.95 in. The center photograph in this
figure was taken after failure and after the load was completely ~emoved;
at this stage, the beam had lifted off of the supporting blocks to which
it had dropped. The deflection at this stage was 1.83 in. The bottom
photograph shows Beam B-8 after failureo The effective prestress in B-8
was 112,900 psi, and in B-27 it was about 118,000 psio
290 Strain Distribution Over Depth of Beam
One of the major assumptions made in the analyses of the ulti
mate flexural strength and deformations of the beams was that a linear
distribution of strain existed from the top of the beam to the level of
the steel at all stages of loading. This assumption was required in

order to derive Eqso (7) and (22) which express t.he strain in the
concrete at the level of the steel with a compressi '\,"6 strain on the top
surface in the region of pure flexureQ
Strain measurements were taken on the top surfaGe B,nd at several
depths on the sides of the beams at several stages of l08,ding to obta.in
strain distributions in order to confirm this assumptionu Furthermore,
the distance from the extreme fiber in compression to -She nautr-al axis
k d, was obtained from the strain distribution at ultimate load" This u
depth ~as used in the computation of the klk3 parameter from ~h8 ultimate
moment 0 In order to give the true strain distributicm,s;i a.ll strains are
reckoned from the unprestressed state instead of from the effective
prestress state. Strain measurements made from the star-t of' the t.est
were corrected for the strains that existed due to ths 6~feGtive prestress
by considering the concrete elastic under the a.ction of -~hB p~es'Gress, 0
The value of modulus of elasticity from tests of cylinds:rs W8:-"6 used in
converting computed stresses to strains 0 Strains we:t"e ObS8J'"Vea a.t
t, e!.lsioning and at the start of the test 0 Although the o':;s3rv9,1 and
computed strain values at these stages differed by r8.t:~,8~:~ larg'9 peX"Gent-
a.ges in some instances, the differences were not cons~_st:3nt frO'ITI beam to
beamo Since these strains were practically insign:1.~l,u8.:tlt compared to
the strains that existed at ultimate load.\' the use of' c.omp'~1ted strains
'Was su:fficiently accurate for correcting later measured. stra.inso !n
some cases, the strains observed two days after tansioning we::'''8 la.rger
and in other cases smaller than those at tensioning" :::t, is beli'5ved that
these discrepanc ies resulted mainly from the inabili'toy -;;0 measure accurate-
:"y the small changes in strain that resulted from thl:' J_oss 1.n prestress.,

The strain distribution at ultimate is assumed to be defined
by Eq. (7) which involves the two quantities (u and kuo The test results
indicate that the limiting strain is nearly constant 0 No consistent
trend o~ Eu with concrete strength or with Q' was foundo Hence, if E u
is assumed constant, the strain distribution at ultimate load is defined
by k. This parameter defining the position of the neutral a.xis can be u
eva.luated from Eqo (12) or (16) depending On whether the beam is under-
or over-reinforced. The significant term in these equations is Q',
although the prestress and the stress strain properties of the steel are
also involvedo
The effect of QI on the strain distribution at ultimate for
beams with a nominal prestress of 120,000 psi is shown in Fig. 390 The
curves are based on measured strainso Increasing the effective ·percent-
age parameter Q' decreases the tensile strain at a given depth and
increases the depth to the neutral axiso The strains are seen to vary
linearly with depth as assumedo The strain in the concrete at the level
of the steel is seen to be much more sensitive to varia"t-ionsin k d for 1;1
tension failures than for compression failureso Fortunately, the ulti-
mate steel stress is not sensitive to variations in the steel strain
for tension failureso
For a beam with a given effective peroentage~ the effect of
deoreasing the prestress is to deorease the depth ~d and hence increase
the tensile strains and the curvatures of the beams at ultimatso As a
consequence of this, larger deflections resulto
Measured strain distributions at various stages of loading are
shown for an under-reinforced beam (B-21) and for an over-reinforoed.

beam (B=27) in Figso 40 and 41, respectivelyo Both beams contained
Type II reinforcement, and each had an effective prestress of 118 J oOO
psi~ The respective values of QI were 1607 and 69020 Tne strain distri
butions of both beams were linear at all stages of .Loading 0 This marked
degree of linearity was observed also in all other beamso The strains
due to the prestress were too small to be shown for the under-reinforced
beam but are shown for the over-reinforced bearno It Gan be seen that
Much larger tensile strains occurred in the under-reinforced beamo
300 Load-Deflection Characteristics
Much informs. tion about the behavior and mode of fa'ilure of the
beams can be derived from the load-deflection curveso In Figso 42
tlt..rough 68 the load versus mid-span deflection curves a~® given for all
of the bea.ms testedo Significant changes in the behavior ,0 such as
tJoserved cracking load, beginning of inelastic ste~l st7'ai.ns J and fi:nst
c:,ushing of the concrete, have been noted on these Cul"""l8S" The modes of
failure for each beam are also giveno
The observed cracking load is the load at whiGb. the cracks
'became visible to the naked eye 0 The point indicating t,h(~ beginning of
inelastic steel strains for the under-reinforoed beams 18 the loa.d at
which the observed steel stress was equal to the yie~c strength at 002
peroent offseto Measured steel strains and the aver~g8 stress-strain
(';t'l,x"ves were used for this purpose 0 Careful inspection of the top surfa.ce
uf th~ beams was made, pa.rticularly near ultima. te :0'::1.0. ,9 in order to
t)bssrve when crushing first begano The mode of fail'u~e given on tho
figures was determined by comparing the ultimate ste~l stress with the

yield strength at 002 percent offset or by visual observa.tion of the
beam behavioro Each of these significant changes ir behavior usually
caused a change in slope of the load-deflection curveo At crac:king,9
the curves deviated from the initial straight lins J and the begir.~ing
of inelastic steel strains or slight crushing of the concrete generally
caused the curves to become nearly horizontalo All the load-deflection
curves extend to ultimate load. In most cases an abrupt drop-off in
the load-carrying capacity occurred after the maximum load was attained.
The deflections plotted on all figures wsr~ observed either
during an increment of load or deformation or immediately after the
testing machine was shut off~ After all other measurements were taken J
the load and ~id-span deflections were again observed? but these points
have not been plotted 0 For practically all s1,ages of t,b\~ test ~ a small
decrease in load and slight increase in deflection Oc,ou!"':r\9d while other
maa.surements were taken 0 The decrease in load ge!lerall.)"i'" 'became larger
a.s the total load increased, but the amount of d6CT'(Sass WE/.S also a
function of the time required for the other readings and of the 0harac
t~'3ristics of the testing machine 0 These small drops :S.n Ioa.d did :''1ot
S8®m to affect the "envelope" deflection curveo HeJ..o,~ding deflection
characteristics were observed on some beams 0
discussed later~ . ·:r-
When cracking occured in the test beams tl1at wers unde!'=
reinforced, there was an immediate increase in deflection without increase
in loado Usually there was a. drop in load>, particulal"'}.y for th:B most
!ightly reinforced beamso The lower the effective percentage parameter,
Q c." the larger was the proportion of the total tension carried 'by the

concrete just prior to cracking 0 Hence, when the oonGre-se cracked J a
larger elongation of the reinforcement in the vicinity of the crack wa.s
necessary to develop the tensile force which the concrete and steel
shared before cracking 0 Also, the lower the parameter.~ Q Q 5' the higher
the height to which the cracks opened upon formationo It is conceivable
that in a grossly under-reinforced beam9 the reinforc8ment might frac
ture before crushing of the concrete or even as soon as -the conGrete
cracks. None of the beams tested failed in this manners however, wires
were fractured in three beams after crushing had oCClurI'ed 0
The over-reinforced beams behaved in essential.J..y the same manner
as the under-reinforced beams before cracking of the concrete occurred 0
The cracking loads were more difficult to observe in the o'rer-reinforced
beams because the steel was carrying a larger portion of' t.he tension
j~st prior to crackingo The load-deflection curves did not have a sharp
break in slope, except for three beams with a prest.res& of only 20.')000 psi.
:=nstead, the load-deflection curves of beams fcdling in1 ~~,ially in 0ompres
sion deviated in a gradual and smooth curve from the initial straight
portion. The cracks opened to only a small height (generally one or two
inches) upon .formation and then developed slowly as l~ad was applied to
the beams 0 Because of the relatively large 0ompress:i:J!:l force required
to cause a beam to fail in this manner J the depth of :J(»i.10rete involved in
the initial compression failure was a relatively }.e,rge p~opol"'tion of the
beam depth~ In the two over-reinforced beams shown in the photographs of
Figo 38, which have been discussed praviouslyy ths fle:zural oracks did
not penetrate the upper third of the beamo
Points representing the computed loads and computed defle~tions
at cracking, at ultimate, and at an intermediate stage 10f. loading ard

also given in Figso 42 through 680 The computation of these loads and
deflections has already been discussed. Comparisons between measured and
computed loads and deflections at cracking and at ultimate load are given
in Chapter rxo
(8) Effect of Effective Percentage Parameter, Q = E p/f s 0 The
s c
~est results indicate that the quotient of p/f~ or the effective percent
age parameter, Q = E p/f', determines the deflection characteristics for s c
a beam with a given prestress, type of reinforcement, and type of loading.
Figures 69, 70, and 71 have been plotted to illustrate the effect of the
magnitude of Q on the deflection characteristics. The dimensionless
ratio M/f ' bd2 has been used to account partially for variations in the c
concrete strength and to make the ordinates dimensionless. The use of
a~solute values of mid-span deflection as abscissas does not provide a
str'ictly correct basis for comparison since the depth to the steel, d,
\,.}8,S not exactly the same for all beams. This difficulty can be overcome
2 by using the dimensionless ratio ..6.d/L , where ~ is thSl deflection and
L is the spano Moment-deflection curves using this quantity were
plotted for all the data presented in Figs. 69 and 71 but no significant
d~fferences were found between these curves and those using the absolute
deflections, although the depths to steel varied from about 800 to
In Fig. 69 the moment-deflection curves are shown for all beams
of Series 2, for which fsi = 20,000 psi. The curves fall into the proper
sequence with respect to Q in this plot. These plots show that increasing
2 Q increases M/f~bd at any deflection between cracking and maximum loado

However, as Q increases the deflection at maximum load~'l}arrying r.apaci ty
decreases slightly 0 Beams B-12, B-13, and B-14 are over-r8iniQ}~c8d
"beams and hence the curves did not become horizontal at maximum load as
they did for the under-reinforced beams, B-9, B-IO, B-llo 'IJhe deflection
of B-IO was considerably larger than the other beams because concentrated
angle changes occurred above only two major cracks tha.t formed in the
region of constant moment. This beam failed by fracture of a wireo
The moment-deflection curves for beams of Series 1 and 4) for
which f . = 120,000 psi, are given in Fig. 70. Again the curves are in s~
order of ascending values of Q. Beam B-20 did not reach its full flexu-
ral capacity and deformation because of a bond failure" The computed
liu1t of this beam was about 2.2 in. thus indicating a more gradual
:i.ncrease in 6.ult
with decreasing Q values than that indic;ated in F:i..go 70.
The upper curves (Beams B-7, B-25, B-6, and B-8) are for o'ver,-reinforced
bea.ms.. These beams with higher values of Q were mo~e b~l. ttle and t:4ad
steeper moment-deflection curveso It can be seen that the shape of the
curve for a slightly over-reinforced beam such as B~7 is nearly tn6 same
a:3 the shape of the two slightly under-reinforced beems J B-23 and B~24o
The moment-deflection curves for beams of Ser'ies 33 for which
f , = 160,000 psi, are given in Fig .. 71. All of these beams were underS='.
reinforced, and the curves therefore approached a horizontal slope near
failure. Again increasing the Q values raised the curveso
(b) Effect of Variations in p and fc for Beams Having the Same
''Value of Q. The analytical studies for t.he deflection at any intermedi-
g,te load between cracking and ultimate also suggest that the quotient of
p divided by f~, or a dimensionless parameter such as QJ will la~g81y

determine the deflection characteristics of a beam with a given prestress,
type of reinforcement, and type of loading 0 The c.ef.'l'Clc-slon is ma~nly
dependent on the curvature within the region of Gonst;s:nt mcment." which in
turn depends on the compressi va strain on the tClP sur::SG8 8.EC. the depth
to the neutral axis 0 For a given compressive straIn) the ratio elf the
distance to the neutral axis to the effeotive depth i2 equal to kQ which
equals pf If 0 divided by a factor that depends on both tb.6 magnitude and s c
the shape of the c.ompressi va stress blocko Hence J this factor ~.sconti-
nually changing throughout the teste For the stress bloGK assumed :'in
Fig" 34, it is 3/8, and at ultimate this factor beoomes equal to ~k30
The steel stress, f , is determined from the conditions of compatibility s
of strains 0 Obwiously, therefore, no single paramete~ such as Q or QO
will completely define the deflection characteri~;d~i(~s <ST, 3.1:~, stages of
loading. At ultimate, QD determines the deflec/cion tof beams with a
particular prestress, type of reinforcement ~ a.nd i;Y'pe of }:)8.o.ing 51 if they
all fail at the same concrete strain51 Euo
Q satisfactorily neter-minas the general shape of thl3 CI"i}.::'"';.178iS) b'aeause in
all cases the curves were in the proper sequence with r~sp2ot to QJ they
do not show whether there are any differences iT! t,!~1e mo:n8:'1i>~d.6flectio~
curves for beams wi til the same Q but widely difie:r~mt "';'.9,11.1218 of '0 and f D 0 - /)
The effect of variations in p and f B for' bea.ms h'?l.ld .. ng the sa.me c
value of Q has been studied in Fig 0 72" The vurves 1:<:1 this £':~gure are
for Beams B-20, B~5~ and B-22 which have the folJ..owing prop.erti.as:)
respectively~

Each beam had Type II reiniorcemento It is believed that the minor vari-
a.tiOIlS in prestress had no significant effect on the deflection dharacter-
isticso In these three beams the concrete strengths ranged from 3820 to
7630 psi while the percentage of steel ranged from 00278 to 00561 percent,
Y8~-= no significant difference in the shape of the curves was foundo
The slope of the moment-deflection curves prior to cracking and
-:h8 rJ!"acking load is not defined by Q 0 The major facto!"'s affecting the
initial slope and the cracking load are Ec' fr' the properties of the
Gross section, p/f~, and f . The rather wide variations in the modulus c se
of. elasticity and the modulus of rupture, fr' for the three beams shown
in Figo 72 largely account for the relatively small dif=erenoes in the
moment-deflection curveso Similar differences in the computed moment-
deflection curves for Beams B-20, B-5, and B-22 also were found b80ause
of these same reasonso
Similar studies on other sets of beams with widely differ·ant
'ra.lues of p and f B but nearly the same value of Qp a,nd. "the proper sequence c
0::' the moment-deflection curves with respect to Q in ]~igs" 69, 70 J a.nd 71
al.so indicate that the parameter Q adequately defines the deflection
8~haraGteristics regardless of the relative magnitude of p and f ~ 0
(c) Effects of Prestresso It is difficult to saparate the ~ffects
of p~estress on the deflection characteristics from the effects of other
\1,e,ria,ble~o Actually it is not the effective prestress, fse' whic;h deter-
DJ..nes the cracking load (end of l1elastic" range) but the compressive
l1);d't stress induced in the bottom of the beam by the prestress force J F,
\ a,~:1d t.he moment J M J due to the eccentric i ty of this force 0 The modulus
e
i';)f r'u.pture, f J also affects the cracking load and must be considered" r

Another complication arises from the fact that the beams. with s, nominal
prestress of 20,000 psi and those with a nomina.l pr.estress of J.6o:vooo psi
had Type I reinforcement while those with a nomi~al prestress of 120,9000
psi had Type II reinforcemento The yield strength at 002 percent offset
for these two types was 206,700 psi and 219 J 800 psi, respect.iV'ell~>o
The shapes of the load-deflection curves were iOllnd tc be consi
derably different for the beams ha"J'ing different amounts of prestress"
Up to the cracking load~ which was increased as the prestress was
inoreased, all beams followed about the same slopeo At cracking] the
load-deflection curves of beams having a prestress of only 20,000 psi
had a sharp break in slope, while those beams with the highest prestress
of 160,000 psi deviated from the initial straight portion in a gradual
and smooth curveo The load-deflection curves for beams with a nomina.l
prestress of 120,000 psi also had a rather gradua.l change in slope a.fter
cracking 0
The extent of the sloping portion of the loe.d='isflecticm c'G!"ves
between the cracking and yielding stages for undera~rai,:Ctfr:!J"'Ged b66m.s also
is dependent On the amount of prestress 0 This por·tion O~~ t:;:'.8 IJUrV8 was
longest for the beams wi ih the lowest prestress bec&;us:~: -?:.;he COTIcY"ste
cracked in tension under a relatively small loacL The slops in "Gbe
seoond stage of their beha.vior was nearly constant and W8.8 govey'ned by
the properties of the era,cked sectioTIo The curves ~Jor.d~:_nuelj> at t.hi.s slope
~~til the steel strains started to become inelastic" Then the under-rein
forced beams underwent a relat.ively large increase in deflection with
little further increase !:rr load.) The length of this flat portio:n of the
load-deflection curV8S depended On the magnitude of t.he effee:;t:iv8 •

91.
percentage parameter, Qf, and was greatest for beams with the lowest Q~.
When the concrete in the compression zone reached its limiting strain,
the ultimate load was reached and a secondary compression failure cccurred.
The ultimate load of the under-reinforced beams was not signifi
~antly affected by changing the prestress. The effect of prestress on
the ultimate load-carrying capacity has been studied an8,lytically in
Figo 260 Furthermore, increasing the prestress decreases slightly the
deflection of under-reinforced beams at ultimate load} as indicated by
'tb,s data in Figs. 69, 70, 71, and 73.
The behavior of an over-reinforced beam is affected by changing
ths prestress. An increase in prestress not only changes the shape of
tn.o load-deflection curve for over-reinforced beams but also increases
ths ultimate flexural capacity and decreases the deflec·ti0n.correspond-·
:~.'I".Lg t.o ultimate load. For example, the ul time te load cf B·-8wi th a
l-;T8stress of 112,900 psi was about 32.3 kips, and the ds,:Clection at ulti
ma-te was about 1,.0 in., while the ultimate load and cor'l"espondillg
;'~:;flection of B-l4 with a prestress of 20,200 psi was abu~:rt 2504 kips
anC'. 1043 in., respectively. Both bea.ms contained 15 Wi!'6S> but t:J.8 araa
of steel in B-8 was about 6.4 percent larger because ths beams contained
(3., different type of reinforcement. The different yield strengths of the
!:6?~j.1.for0ement did not affect the ultimate load since bo·th beams were
compression failures and had an ultimate steel stress well below the
yield strength of the reinforcement. The concrete strength in B-8
(3280 psi) was even lower than that in B-4 (3755 psi). The effective
depth of both beams was 7.99 ino
Several other beams are also suitable for comparing the effect
of prestresso In Fig. 73, the ratio p/Pmax has been plotted against the

92.
mid-span deflection for Beams B-9, B-5, and B-15. These beams were
chosen for this comparison because they had nearly equal values of Q
(1908, 23.2, and 22.0, respectively), comparable concrete strengths
(6330~ 5650, and 5710 psi, respectively), and nearly equal effective
depths (9023, 9~33, and 9.29 in., respectively). The effective
prestress of these beams was 19,100, 114,100 and 150,000 psi.- Because
these beams were under-reinforced, the prestress had little or no effect
on the ultimate flexural capacity. For these beams the major variables
were the prestress and the type reinforcement. For under-reinforced
beams the effects of the different yield strengths of the steel can be
partially accounted for by considering plots of p/Pmaxo
In Fig. 73, increasing the prestress is seen to increase the
"elastic" range for these beams. The ratio of the measured cracking
load to the ultimate load is indicated on the curves $ This ratio was
0,241, 0.511, and 0.600 for B-9, B-5, an~ B-15, respectively. The
deflections at ultimate load for these beams decreased as the prestress
-increased~ The respective mid-span deflections at the ultimate loads of
22~79~ 26077, and 23~08 kips were about 2.08, 1.48, and 1.12 in., respect-
Another group of beams suitable for comparing the effects of
prestress are B-12, B-7, and B-18. Curves of pip versus the mid-span max
deflection for these beams are given in Fig. 740 The effective prestress
of these beams was 20,400, 112,800 and 148,800 psi, respectively. The Q
values were nearly equal, the average being about 47e4, and the concrete
strengths and effective depths were comparable. However, Beam B-7 had
Type II reinforcement while the other two had Type I reinforcement.

Increasing the prestress again increased the 8las~ic rangeQ
The respective values of the ratio of the measured. oracki.ng loaci -to the
ultimate load were 00216, 00515, and Oo639~ The deflections at ultimate
load decrsased with increasing prestresso The mid-8pan deflections at
ultimate load were about 1046, 0092, and 0081 irL. The. ei':sGts c'f
increased effective percentages can be obtained by oomparing these
deflections with those of the beams shown in Fig~ 730 Another effect of
increasing the prestress was to change the primary mode of failure of
Beams B-12, B-7, and B-18, although they all had nearly equal Q values~
Beams B-12 (f = 20,hOO psi) and B-7 (f = 112,800 psi) failed initial-se . se
ly in compression but Beam B-18 (148,800 psi) failed initially in tension.
(d) Reloading Chara.cteristicso Several beams were unloaded
before they had cracked and then reloadedo The orig~nal load-deflection
curve was retraced upon reloading regardless of wb.ether the beams were
over- or under-reinforced 0 The curves of load versus Goncrete s-t~ain on
the top surface or steel strain were also linear before cracking~
The range of elastic behavior prior to cracking was extended by
an increase in prestress or an increase in the eff6ctl~e peroentage, Q.
Changing either or both of these ~actors merely changed l.ne compressive
stress in the bottom of the beam and hence changed th.e cracklng load ..
Several beams were unloaded after having cracked and then reload-
edo Load-deflection curves for three of these beams) 3,,4, R .. 5~ and. B-6
are shown in Fig. 750 Each of these beams had a nominal prestress of
120,000 psi, but Beam B-4 contained Type III reinforcement while B~5
and B-6 contained Type II reinforcemento The cracks c~osed when the
load was removed because the steel had not become in81a8tic~
however, some permanent set existed 0 The lower portio'as of

94.
the reloading curves followed a slope roughly parallel to the initial
slope because the gross concrete section was still effectiv8a The
beams behaved in an essentially elastic manner before the cracks reopen-
ed, but there was a more gradual change in slope as the cracks began to
open slowly and as the stiffness of the beams began to decrease gradual-
lyo The range of near proportionality of deflections to loads was
smaller because the concrete no longer carried a relatively large amount
of tensiono When the previous maximum load was reached 5 the deflections
were only slightly larger than before. As more load was applied, the
load-deflection curve that was traced seemed to be an extension of the
original curve"
(e) Comparisons with Ordinary Reinforced Concrete Beams~ A few
studies were made in which the deflection characteristios ;)f several
prestressed beams reported herein were compared with those foro ordinary
reinforced concrete beams tested by J 0 R 0 Gaston in the Structu:r)al
Research Laboratory of the University of Illinois ('7) u ~J:'~e ordinary
reinforced beams were of the same cross-section and 'W8i:":';: also tested on
a 9-ft span with the loads applied at each third-pointe The ordinary
reinforced concrete beams selected for comparison were re:.nforosd in
tension only with intermediate grade reinforoing steeJ.o
The beams selected for comparison had approx,i.IDa.tely tb,8 same
value of the parameter ku = f suP/kl k:~l ~ 0 This parameter' has been shown
to be the ratio of the depth to the neutral axis at u:2 .. t::Lm:1te :toao. to the
effective deptho Beams with t.he same value of k will ~19;ve "~h6 same u
2 value of M /k k fijbd 0 Furthermore, if beams fail at -t~6 same limit
ult I 3 c
ing concrete strain, E. , they will have the same cur',la-Gure within the u

95.
region of pure flexure at ultimate load. Beams having the same curvature
within the region of pure flexure at ultimate are belle"\,,'sQ suitable for
comparing the deflection characteristicsc The studies ar8 intended to
compare the deflection characteristics of beams ha~\liLlg prestressed high
tensile strength steel wires with the deflection chara0teristics of beams
containing ordinary mild steel reinforcementc The studi8s do not
reflect the effects of different depths to the steelo
In Figs. 76, 77, 7B, and 79, Beams B-21 and TILb J Beams B-5
and T2Lb, Beams B-IB and T3Mb, and Beams B-B and T5H are compared 0 To
facilitate comparisons, the ratio of the applied load to the maximum load
attained in the tests (pip ) has been plotted against the dimensionless max
ratio~d/L2o The ratio~d/L2 was chosen because the ordinary reinforced
beams had effective depths which were greater than the pres"bressed
concrete beams 0 The reasons for choosing this partic'O.ltt.r grouping of
terms was discussed in Section 30ao The following prOI)8~ties of the beams
are tabulated in the figures~ strength, f'; c
the percentage of steel, p ~ the yield point or yield st:cEmgth at 002 per-
cent offset (prestressed beams), f ; maximum load attah18d :in test, P ; Y max
the effective prestress, fse; and the effective depthJ de Beams B-5 and
B·-21 had no shear reinforcement and Beams B-IB and B~8 had 5/B-ino external
clamp=on stirrups. These same clamp~on stirrups weT'e used in beams T2Lb
and T3Mb but Beam TILb had 1/4-in. conventional vertical stirrups at a
6=ino spacing, while Beam T5H had 3/B-in" conventional 'V8!:"tl:;al stirrups
at a 2-ino spacing in the outer thirds of the beamo
The ultimate steel stress used in computing £ 'was obtained from u
st:t'ains measured with a mechanical gage for the ordina7"Y reinforced

concrete beamso The ultimate steel stress in the prestressed beams was
computed from the measured ultimate moment, the measured depth·to the
neutral axis at ultimate, and an assumed value of k2 = 00420
All the ordinary reinforced concrete beams are reported to have
failed in tensiono Beams B-21 and B-18 also failed in tension~ Beam B-5
was a nearly balanced shear-tension failure, and Beam B-··8 failed in
oompressiono The following general remarks apply to each set of curves 0
The ordinary reinforced concrete beams cracked at a relatively low load
and the slopes of the load-deflection curves in Figso 76 l 77, 78, and 79
were smaller than for the prestressed beams and corresponded to the action
of the cracked sectionG The deflections remained proportional to the
load until the steel yieldedo At this stage of loading J the ordinary
reinforced concrete beams deflected with only a small incraase in load
'I'.lZltil a secondary compression failure occurred 0 When the c;onc:r.°ete crush
ed deeply, the load dropped of relatively slowly compared to the prestress
ed. concrete beams, particularly for the two beams with ~,he lower peroentage
of stesl,. and the unloading oharacteristics could be observed 0
The slopes of the initial portions of the It~d~·deflect:1.on curves
were greater for the prestressed concrete beams than for the ordinary
reir~orced concrete beams, because the entire cross=58ction was still
effectiveo The loads remained directly proportional t.o deflac.tions until
the concrete cracked 0 The ratio of the measured crackJ.Ylg load to the
maximl~ load for Beams B-5, B-8, B-2l and B-18 was Oo513~ 00538, 00551
and 006397 respectivelyo The first three beams had a I!JJminal prestress
of 120,000 psi while B-18 had a nominal prestress of 160,000 psio The
slope of the curves gradually decreased after cracking had oocurred

until the maximum load was reachedo During this time J the cracks
developed gradually 0
The deflections or6d/L2 ratios at maximum load were smaller
for the prestressed beams regardless of whether the prestressed beams
were under- or over-reinforcedo The ratio of the value of~diL2 at
97.
ultimate load for the prestressed beams to that for the ordinary reinforc
ed beams shown in Figso 76, 77, 78, and 79 was about 0051, 0071, 0067,
and 0.69, respectivelyo The smaller deflections in the prestressed
beams is partly the result of less cracking in the outer thirds of the
beams and partly due to a slightly smaller limiting concrete straino
The distribution of curvature in the outer thirds of the prestressed
beams was different from that of the ordinary reinforced beams because
the cracking was influenced by the prestress, but the analytioal studies
have shown the deflections were not affected appreciably by the curvature
in the outer thirds of the beamso The major oause of the smaller deflec
tions in the prestressed beams is belie~ed to be th~ faot that they fail
ed at e. lower limiting concrete strain" The curvature within the region
of pure flexure at ultimate load for bea.ms having abO'llt the same value of
XU is determined by the value of £u) and the analytioal studies have
shown that the defleotions are mainly determined. by this ourvature" The
average limiting conorete strains for the ordinary reinfo~oed ooncrete
beams was about 0.0040 while the average limiting strain tor the prestress
ed beams was about O.OO;4~ After the prestresled beams had oracked, but
before the ordinary reinforoed concrete beams had yielded, the load
defleotion ourves for the two types of beams approaohea eaoh otherc The
ourves approaohed each other in all oases beoause the ratio of the load

at. which the steel yielded to the maximum load for the ordinary rein-
fo~ced concrete beams was considerably higher than ~he ratio of the
cracking load to the maximum load for the prestressed cOl!crete beamso
In contrast to the ordinary reinforced concrste beams, the
prestressed concrete beams failed suddenly and more completely so that
the unloading curves could not be obtained 0 The deflsc'::'ions after
failure, with the load off, was measured for two of the pT8stressed
'oeams, however, and are shown in Figso 76 and 780
210 Steel Strains and Stresses
Steel stresses were computed from measured strains and from the
measured moment and lever arm of the internal resist.i!lg couple to aid in
~:~l6 study of the behavior of the beams, to check som~1 o:~: -'chi:;; e,ssumptions
of the analysis, and to evaluate ~k3 0 The load,-str;9..J.n CD.:'-.:.res for strain
:::,n the wire reinforcement of Beams B-7, B-21, B-2br7 s,!".i.Q 13-·25 in Fig 0 80
~8present the strain due to the applied load only. All th~ beams shown
hELd a nominal initial prestress of 120,000 psi 0 T::18 t:±o£'e,~'~ti.\'0 prest!'8ss
0f each beam is given in the figure 0 The strains W8:C'S mea2·ured with
~lectric SR-4 gages on the wires and measurements wera taken until the
gages failed. The measured cracking load is marked r:J!"l (j.::~,':':~l curve 0 The
'08s,ms were chosen to illustrate the change in stee~ ::..>-t::--i:.~.~:.:r.'. ,jU'3 to the
o.;}plied load. The beams had effective percentages 7 Q.9 raiJ.ging from 1300
to 5808 and percentages of steel ranging from 00284 t~ Ou942 per~ento
Up to cracking, the steel strains due. t.o t!18 applJ..ed load were
o.~~2'·ectly proportional to the load c However, t.he incr88,sI3 in steel strains
above those due to the effective prestress were relatively small up to the

99~
load at which the concrete cracked 0 For example, the additional steel
strain produced in Beam B-7 up to the cracking load was only about
20, x 10-5 in. per in. This represents an increase in steel stress of
only 6000 psi.
As the load was increased beyond the cracking load, the steel
strains increased much more rapidlyo Beam B-21 was under-reinforceci,
hence its load-strain curve became nearly horizontal at ultimate loedo
Beams B-'T and B~25 were over-reinforced and as a consequence the load.~
strain curves of these beams had an appreciable slope even at ultimate
load 0
A compe..ri.son of measured and theoretical ultimate steel stresSSE!
is given in Table 80 The ultimate steel stress predicted by the theoT'Y
for flexure failures is compared with ultimate steel stresses derived,
from measured strains and from the measured ultimate momento The strains
measured by the elsctric SR-4 gages, (column 2), were generally not
measured up to ultimate load. In order to obtain the ultimate steel
strain, the measured strains due to the applied load were plotted against
the mid-span deflBction. These strain-deflection curves were generally
linear a:fter crae-king and were believed to be the most accurate means of
extrapolating to the ultimate load conditions. A weighted strain was
'lsed if the gages were not placed symmetrically about the effective deprb,c
The . strains due to the effective prestress were computed from the effef3t
iva prestress as indicated by the dynamometer readings and were added to
the strains due to the applied load in order to obtain the ultimate
steel straino Tl":l.S appropriate stress-st~ain curve was then used in
·\3onverting strains to stresses 0

The ultimate steel strain and hence stress was also obtained. (,;y-
adding measured concrete strains at the level of the steel due to t:r .. ,~
eppl~.ed load to the computed steel strain at effective prestress E.S9 c
In othelr words, each of the component strains of Eq. (6) were ei theY'
measured or computed. The strain in the ooncrete at the level of the
steel at ultimate load, € ,was taken from the strain distribution a~ cu
tl.l timat.a load a:nc added to the computed strains Ese and Ece to obta5.n
All ooncrete strains were measured with mechanical gages and
represent the average strain over ;0 in. The steel stresses obtaine<i
in this manner are given in column (;) of Table 8.
The ultimate steel stress was also obtained from the measur."8;:~
~J.l timate moment} from the measured depth to the neutral axis at ul tim6."08;,
k 0)' and from the e.ssumed parameter ~. For all oomputations k_ was u C
c:r..1osen equal to O)-~2" These ultimate steel stresses, which satisfy tl:-~S
statical conditions~ are given in column (4) of Table 8.
The ultimate steel stresses for flexural failure as predic·c,6(1.
by the analytical method developed in Chapter V are given in column (5)
of Table 80 These stresses were obtained by the use of Eq. (9) and th~
actual stress-strain curve for the steel. The computed ultimate steel
stresses are compared with the measured steel stresses obtained by 6a':1~~
of th!"ee methods mentioned. The ratios of the measured steel stresses
given in columns (2);/ (3), and (4) to the computed steel stresses given
in column (5) are given in columns (6), (7), and (8), respectivelyo
Beams B-1, B-4 and B-20, which either failed in shear or bond, were not
included in the average ratios of measured to computed stresseso The
average ratio of the ultimate steel stresses derived from measured

1010
steel strains to the oomputed stresses, (oolumn 6), was Ov977 with a
mean deviation from this average of 0.025. The average ratio of ulti~
mate steel stresses obtained from measured oonorete strains to the
oomputed steel stresses, (oolumn 7), was 1.01 with a mean deviation
from this average ot 0.0,4. The oorresponding ratio (oolumnS), for
steel stresles obtained from the measured moment was 0.988 with a mean
deviation of 0.0280 The substantial agreement between the ultimate
steel stresses obtained from these three methods and the oomputed ulti
mate steel stresses oonfirms the assumptions that bond exists between
the steal and oonorete, that a linear distribution of strains exists,
and that the oono~ete oarries no appreoiab1e tension at ultimate loado
Bond tailures would be refleoted in deviations of measured steel strains
from measured oonorete strains at the level of the steel. No signs of
a bond tailure were reoorded tor Beam B-12, but the steel stresses
derived from measu~ed steel strains and from the measured moment were
oonsiderably below the oomputed stress and the stress derived from
measured oonorete strains. It is probable that a partial bond failure
oocurred in this beamo
;2u Conorete Strains on Top of Beams
Typioal ou~ves of load versus the average measured concrete
strain on the top surface of the beam within the region of pure flexure
are shown in Figc 81. The ourves have been extrapolated to the ultimate
load and ultimate strain obtained from the measured strain distributiono
The ooncrete strains were measured with electric SR-4 gages placed in a
staggered pattern over a region extending 12 in. each side of mid-spano

All the beams in Fig. 81 had a nominal prestress of 120,000 psi. These
typical curves were chosen to illustrate the fact that all beams reach.ed
ultimate load at about the same concrete strain, regardless of the ValG8
of the concrete strength or the value of the effective percentage. T~8
load-concrete strain curves for beams with a nominal prestress of
160,000 psi were similar in shape but the beams failed at a slightly
lower concrete strain. The beams with a prestress of 20,000 psi were
slightly different in shape because of the low cracking loads and fai1.8G.
at slightly higher limiting concrete strain than that developed in the
beams with a prestress of 120,000 psi
The average concrete strain in the region of pure flexure at ulti-
mate load has been plotted against the concrete strength in.Fig. 82 for
all beams which failed in flexure. There seems to be no significant tL--ent).
of E with concrete strength, in the range from 1270 to 8200 psi. The u
strain from the four gages on each beam'varied somewhat, the largest
strains being at the section where crushing later developed. The average
strain in the region of pure flexure however, was believed to be the signi·-
ficant quantity for use in the analyses. An average value of E = 0., OC34.(. u
derived from Fig6 82, has been used for all other studies in this report,
330 MOIDent-Curvature Relationship
The studies of the deflections of the beams given in Chapter VII
were based on idealized moment-curvature diagrams consisting of two slop-
ing lines (Fig. 31). These diagrams were used to approximate the
moment-curvature diagrams obtained from measured strains in the constant
moment region. The idealized diagrams were assumed to apply to the outer

103.
thirds in computing the distribution of curvature along the beams.
Typical moment-curvature diagra.ms for over-reinforced beams with effeo--
tive prestresses of 2o j 40o, 112,8ooJ and 151,300 psi are given in Fig, 83.
The cracking moments are indicated on the curves 0 Moment-curvature
diagrams for three under-reinforced beams with prestresses of 19,100,
114,100, and 151,000 psi are given in Fig. 84. Although in some cases>
the approximation of the actual curve by two straight lin~s is rather
crude, it is beli5ved to be sufficiently accurate because the deflection
~,~)f the bea.m is li-t,tJ.e affected by the shape of the curvature diagram in
the outer thirds of the beamo
I 340 Loss of Prestrsss
In most of the beams, the amount of tension in every wir6 was
mea.sur.ed immediately after tensioning and at several other times befo!"e
starting the test in ()rder to obtain information on the rate and magni--
tude of drop~off ~n prestresso The dynamometers placed on the ends of
the wires were used bacause they were believed to be the most accurate
means of measuring the prestresso Although the readings on the various
'dynamometers were consistent, it is possible that the prestress in the
wires near mid-span was different because of friction between the wires
and the bearing blockso Gages were mounted on a few wires of each beam
near mid-span but these were not believed to be as reliable as the dyna-
mometers.
The amount of loss of prestress seemed to be dependent only
On the initial prestresso No consistent tre~d with p/f' was found. c
The beams of Series 2 had an average initial prestress of 21,000 psi

and an average effective prestress of 20,100 psi. The corresponding
values for the beams in Series 1 and 4 were 120,700 and 115,600 psi,
and for the beams of Series 3, 159,400 and 150,300 psi. Thus, the average
effective prestress of the beams in each series was between 94 and 96
percent of the initial prestress.
The rate of drop-off in prestress for beams in Series 3 has
been studied by plotting the prestress in terms of percent of the initlal
prestress versus the time in hours since prestressing. The plotted
points for all beams in Fig. 85 fall into a rather distinct band and an
average curve has been drawn through these points. The curve indicates
that most of the drop in prestress occurred during the first 15-20 hours~
A similar band of points was found for the beams of Series 4 but there
was more scattero
35. Empirical Expression for klk3
In order that the effective percentage Q' can be evaluated for
a particular beam~ and hence the ultimate moment determined, it is
necessary ~o evalua.t.e ~k3' which is the ratio of the average compressive
stress in the beam at failure to the cylinder strength. This parameter,
the width of the beam by the concrete strength, f~, and the depth to
the neutral axis at ultimate load, k d, define the internal compressive u
force C at ultlma~e load.

The valu8 of klk3 can be computed if the total tensile force
in the steel at ul.timate load and the other quantities defining Care
k..l'J.owno By assuming the concrete to carry no appreciable tension at
ultimate load) the total tensile force T in the steel can be equated to
CJ and the value of klk3 computedQ The depth to the neutral axis has
-nean determined from the measured strain distributions at ultimate
loa.dQ The total tensile force in the steel at ultimate, and hence the
value of the in"'~ernal compressive force,. has been found by several
methodsQ
The most reliable method is believed to be that in which the
value of T or C is round from the measured ultimate moment and the lever
arm of the two foroes producing the internal resisting couple. The
length of this lever arm at ultimate load is (d - k2kud). The effec"Give
depth and the depth to the neutral axis were measured. A value of
k2 = 0042 was assumed) since studies made in Section 21 indicate that
the ultimate mome~t is not sensitive to variations in this parameter)
particula.rly for tension failuresa Hence, the value of klk3 can be
obtained from ELlS 0 C::..) and (2). Values of kl k3 determined from the test
results in this IDe.:i1Y1.er are listed in Table 9 together with other measured
quantities needHd in the computation of ~~. Ths~values for Beams B-1
and. B_l~ were no:· given because these beams were bond and shear failures,
respectlvely.
The val~6 of T or C and hence klk3 were also determined from
measu~ed steel strains or from measured concrete strains at the level of
t.he steslo The measured depth kud is also required in order to deter
mine klk3 by these two methods. The values obtained from either of

these methods were found to agree closely with the values obtained from
the measured moment, measured depth to the neutral axis, and assumed ~~o c:.
That this is true is shown by the close agreement of the ultimate st.eel
stresses ~hich are listed in Table 80
The values of k1k; given in Table 9, with the exception of
those for Beams B-1, B-3, and B-IO, are plotted as a function of the
concrete strength in Fig. 86. The three beams mentioned developed onl~'
One or two cracks within the middle third and failed by fracture of a
wireo These three beams are discussed later. For all the calculations
in this report, -the following empirical equation from Fig. 86 has been
used.~
;000 + 0.5 fi c
1500 + fV G
(26)
TIlis curve has not been accurately defined for concrete strengths belo'V]
3000 psi but seems to fit the data well for concrete strengths from
3000 to about 8000 psi. In this range, the test data indicate a decrease
in the value of ~k3 with an increase in concrete strengtho
It should be emphasized that this particular empirical relation-
ship foL" kl ~ has been determined for beams of the same shape, size, a,nd
manner of loading 0 That the relation between cylinder strengths and the
strength of the concrete in beams of varying shapes and sizes may vary
considerably is suggested by the variations in compressive strength
which have been observed for cylinders and cubes of different sizeso
Furthermore, variations in ~k3 with different types of loading arrangs
msnts may result from a statistical effect.

107.
The valu~ c,;'f." ~ k3 obtained from the measured moment, measured
depth to neutral aX:_B at ultimate, and assumed k2 has been plotted
e.ga.inst the measured depth to the neutral axis in Fig. 87. The three
under-reinforced beams which failed by fracture of a wire deviate
sharply from the average trend indioated for the other beams. This
sharp increase of the v8.lue of k. k~ for the three lowest values of k d ~ / U
is probably dU8 to the
particular b68,ms 0 The
different type failure that occurred for these
~alue of k d used for these three beams was u
obta,ii1Sd fr.om t.he st.~ain distribution measured at the section contain-
ing the orack, ~nd for the load at which distress in the extremely
S1IiS.ll compression 20ne was first notedo The concrete in these beams
merely cracked en~~. GTliShed slightly above the major crack that had formed,
a.nd -;~he beams f~; .. n&J .. ly failed by fracture of a wire instead of by general
c!Oushing and destril(';tlo~ of the compression zone as in the other beams 0
The concrete may ha:iye been able to carry considerably higher stresses
under these elonditions" The deviations of these kl~ values cannot be
8xplai.ned by any sl"a&,ll error in measuring kud or by a variatio,n from the
as~umed value of ~o The slight upward trend of klk3 for the other
beans with an incre':1,se in kud is at least partially caused by the fact'
that the beams ·~7it.h the larger values of k d generally ha.d lower. strength u
conc!"ste"

108.
IX" COMPARISON OF EXPERIMENTAL AND ANALYTICAL RESULTS
360 Comparison of Measured and Computed Ultimate Moments
Valures of the measured and computed ultimate moments are
compared in Figs. 88, 89, 90, and 91, and in Table 10. The computed
. /2/ c tr"'ve c.; o·p M k k f 9 bd versus Q I = E p k k f' were obtained by using' ~ ~ ~ ult 1 3 c s 1 3 c ~
Eqso (5) and (9) and the actual stress-strain curves for the reinforce-
mento It wa:.s a.ssumed in constructing each curve that ~ = 0042 and t.hat
e ... = 00003400 The cur~ves in Figso 88, 89, and 90 are based on average u
measured effective prestresses of 20,000, 116,000, and 150,000 psi J
respec~ivelyo The values of ~k3 are not required in the construction
of tb8 theoretical 0urves but of course must be known for the evaluation
of Qe and Mult for a particular beam. In all cases, values of klk3
were obtained from Eqo (26). The points marked B on the curves represent
balanced failures; that is, the value of QI for which the computed ulti-
mate steel stress for a beam with the given prestress and type of wire
would be equal to the yield strength at 0.2 percent offset.
In Fig., 88 the measured ultimate moment capacities of the beams
of Series 2 (fse = 20,000 psi) are compared with the theoretical valueso
The agreement is very good for all beams except B-12 which failed at
about 93 peroent of its computed flexural capacity_ This beam evidently
had a partial bond failure and then a secondary compression failure J
b8caU~6 t.he ultimate steel stress computed from the measured moment and
depth to neutral axis at ultimate both were considerably less than the
steel stress obtained from measured concrete strains at the level of the
ste81~ These respective steel stresses are listed in Table 80 Also

109.
shown on this figure :;'s Beam 8-2 tested by Zwoyer (2) which was an under-
reinforced beam having Type I reinforcement and a prestress of 50,000 pSi.
The measured ultimate moment capacities of beams which failed in
flexure and which had Type II reinforcement, B-5 through B-8 in Series I
and B-21 through B-2? in Series 4, are compared with the theoretical
values in Figc 89" Beam B-20 failed in bond at a load about 10 percent
below the computed fl~~ural capacityo Also shown on this figure are
Beams B~2 and B~J? whit~h contained Type III reinforcemento Although
these beams cOnta~ned a different type steel, they fall near the computed'
curV6 beoause tn(SlY mere tension failures and failed at an ultimate steel
stress where there is little difference between the two stress-strain
ourveso There is some scatter in the compression failure region
(high Q 0 values) bu~;~ this is to be expected since the ultimate moment
oapae.ity is more sensitive to the properties of the concrete, ~~ and Eu'
and the magnitude of the prestress, f ,for over-reinforced beams, as se
shown by the studies made in Chapter Vlo Beam B-8 in particular ha.d a,
measured moment about 11 percent greater than the theoretical momento
Values of the para.meter ~k3 determined from the moment, measured steel
strains, and measured concrete strains for this beam all were above the
empirical value of ~~c Because the moment is rather sensitive to this
parameter, partioularly for a high effective percentage as in B-8, the
high value for this beam is believed to be attribted mainly to the error
in evaluating this factor 0 In addition, the measured limiting concrete
strain for this beam was about 0.00370 which would also cause the measur-
ed load to be higho However, since the prestress for this beam was
slightly below the average value of 116,000 psi used in obtaining the

:UOo
rJomputed value, the measured load should theoretically be slightly 1623
than that obtainsd from the theory for a given value of ~ k3 and 6 u
~he measured values of the ultimate moment capacity for beaffis of
Series 3 (fse = 150,000 psi) are compared with the computed curvEt in
Figo 900 Also included on this figure is Beam S-13 tested by Zwoyer (2)
which had an effective prestress of 140,000 psio The measured values for
the six beams sh~')wn in this figure averaged about 101 percent less than
tb.8 theoretical moment capacities 0
Values of QC, f ,f', measured ultimate moment, and the comput-se c
eO ul-timate momen"G are listed in Table 10 for each beam tested in this
pha.se of the investigation together with three beams tested by ZWOY5;~" 2)
which failed in flaxu.re. The latter beams (S-2, S-13, and S-17) were
post-·tensioned and had the same dimensions and were loaded in tne sarna
mann'sr 8,S those :i."'sported herein, and each contained Type I reinforoewent 0
In all cases, the 00mputed dead load moment is included in the value (j'£'
"the measured ultimate moment.. The computed ultimate moments were obi:.a,in-
ed by ~sing Eqso (5) and (9) and the actual stress-strain curve for tI16
reinforcement used in the beam. Average values of k2 = 0.42 and
E == 0 D (0)40 were us ed. For all of the beams tested in this phase cf the 1.:. ~
investigation.~ an average effective prestress of either 20,000, l16,?ooo
or 150,000 psi was used in the calculations, while for Beams 8-2, S·~15J
and Sm17 th~ actual measured effective prestress was used 0 The GOmprsE:-
siva strain in the concrete at the level of the steel, Ece was computed
from Eq 0 (10) 0
The initial mode of failure for each beam is designated by a
letter B, S, T, or C indicating a bond, shear, tension, or compression

""/1""' . .!- __ .L 0
failure v Two letters for a single beam indicate a beam that was nearly
balanced between the two modes of failure.
~earn B~l defiuitely failed in bondo The wires in this beam were
galvanized 0 Bond slip extended to the end of this beam at a load of
about 73 percent of the measured maximum load, and increased the load on
the dyna.mometers at the end of the beam until they failed. Beams B-3>
B~lOJ &.r:·.d B-16 faileCi finally by fracture of one of the two wires present
in each beamo Beams B=4J B-5, and B-6 were near balanced shear-flexure
failures, In B-4 and B-5 the steel strains were becoming inelastic when
the bea~ suddenly failed in shear. A photograph of Beam B-5 taken after
the shear failure had occurred is shown in Figo 70 The flexural cra0ks
in Beams B-4 and B-5 were nearly as high as the diagonal tension cracks
at "the instant before the final collapse occurred. In Beam B-6 the
concrete had already begun to crush inside of both load blocks when ths
beam suddenly failed in shearo Each of the three beams that failed
finally in shear W9re near their computed flexural capacitiesc Beam 3=12
was an over-reinfo~ced beam, and final failure occurred by destructi.on
of the oompression zo:ne at a load that was about 7 percent less than the
oomputed flexural c~apB.(-:ityo A study of the steel strains and concret'?
strai~s at the level of the steel indicated a bond failure must have
occurred over a portion of this beam" No evidence of a bond failure was
.)o5arved during -thiS! test, however 0 The anchorages of Beam B-20 wers
fractured when this beam failed in bond before the steel strains had
become inelastic 0
All of th~ other beams, including 8-2, 8-13, and 3-17 were
definite flexural fail~es and failed initially in tension or compression

112,_
or were nearly balanoed between these two modes of failure 0 All those
that failed ini t:l.ally in tension had secondary compression failures ~
The mea.sured and computed ultimate moments are also compared
in Table 10. The average ratio of the computed moments to the measurec
moment for all 30 beams is 10009 with a mean deviation from this aver-a.gs
of 00 03l 0 If t.~"lG ceams in which bond failures occurred (B-1, B-12.l' a~d
B-20) a.re elimin.et6d. the average ratio becomes 1.005 with a mean devie.-
The form of Eq. (5) suggests plotting the quantity
Nt /k " .p' W bd2 'l, r..:::'"~ .. / _. K_...... "e .. •. u.':' Jr. = f k 1k-5f' 0 ult ~) c u su c
This has been done in Figv 91,
whioh enables al~ .. of the results to be shown on one plot regardless of
the prestress or type reinforcement. However, the ultimate steel
stress must be computed for each beam and these computations involve the
prestr~8SSJ the typa of reinforcement, the parameter kl k3' and the lim:.t.-
ing stra.in E.li
• The ultimate steel stress may be computed by using
Eq.o (9) and thes.pjJropriate stress-strain curve. The theoretical cur-.r8
shown in Fig. 91 is valid for any flexural failure because it depends
only on the condltl~:ms of equilibrium. A value of ~, which defines the
location of the :..nte!"nal compressive force at ultimate, must be assumed,
however; The ruot:l.30.i"ed values of Mul t/~ k3f ~bd2 for each of the 30 bea.ms
listed in Tab:Le :8 9.re plotted in Fig. 91 and compared with the theor8<-
tical cu~veo The general agreement of the measured values of
M /k ~f;bd2 witiL the theoretical curve for a computed value of ul t 1 _, c
f _ P /k.., k7f ~ suggests that the assumptions of the theory, such as, faiJ:~re su J..:J G
by crushing at a li.miting strain, linear strain distribution, no tension
resisted by the concrete, and good bond between the steel and concrete
are valid assumptions,

37. Comparison of Measured and Computed Strains Before Cracking
In this section, the applicability of an elastic analysis ~or
predicting strain distributions over the depth of the beams is discussedo
The computed strains are compared with concrete strains measured with a
mechanical gageo
Stresses computed by an elastic analysis were converted to
strains by using the moduli of elasticity from the tests of control
cylinders (Table 3) 0 In Fig. 92, the average measured modulus of elasti,··
city is plotted against the compressive strength of the cylinders", An
empirioal curve that fits the data fairly well for concrete strengths
between lOOO and 8000 psi has been drawn On thir figure. The prope~tie3
of the net oon6rete crosS section (area of grout hole deducted) were used
in computing stresses induced by the prestress. Stresses due to the
applied loads were computed by using the properties of the transformed
CT'OSS seotion (a.rea of grout channel a.nd tra.nsformed steel area included) c
The prestress was measured by the dynamometers on the wires at the ends
of thi3 bea.ms.
Comparisons of computed and measured strains at several stages
of loading were ma,de for Beams B-.5, B-8, and B-27. These beams had a
nominal prestress of 120,000 psi and had concrete strengths of 5650 J 3280,
and 4590 psi, respectively. Strains measured from the start of the tests
were corrected by an elastic analysis for the strains that already
existed due to the effective prestress; hence a study of measured and
computed strains due to applied loads does not reflect any errors in the
distribution of strains due to creep in the concrete or to relaxation o~
stress in the steel before the loads were applied.

l"! h _J... . 0
In gen.eral, the a.greement of measured and computed strains
was reasonably good up to loads producing tension in the bottom fibers,
The measured strains were distributed linearly but in some instances
the strain distribu.tion line was displaced slightly or rotated wi t!J
respect to the computed line. Obviously, after cracking, the elastic
analysis was not valido
Some of -tr.:.8 factors which could affect the computation of
strains a.re: trl6 effective prestress, the cross-sectional proper"'t;las 5
and the modulus Qf elastici tyof the concrete. The prestress was 'bel~tev=
ed to be quite aCGG.rately mea.sured by means of the dynamometers J tmt
small errors may have resulted from variations in the areas of t:t-i,e
individual wires, non-uniform tenSioning of the va.rious layers, or
friction los~es in the bearing blocks. The overall dimensions of the
beams were measuraG. at several locations within the middle third and
the average was u.sed in all calculations. The size and location of the
grout hole was measured at the ends of the beams. Only minor deviations
from the average Cl"'oss-sectional properties listed in Table 7 ar8
believed to have occurred because of the care used in determining the
dimensions of the beams. The largest source of error in the compu.ta.tions
for strains is probably the value of the modulus of elasticityo In most
cases;. the st~ain distributions could be made to agree by adjusting this
factor" It has been assumed that the modulus of elasticity obta:l:o.8d
from the control cylinders applies to the concrete in the beam regard=
less of the stress in ooncreteo Actually, the value of Ec was not
constant but varied as the stress in the concrete chR.ngedo

1150
380 Comparison of Measured and Predicted Cracking Loads
The assumptions and method of computing the cracking load have
been discussed in Section 240 The measured cracking load reported is
the load at which the first crack was noted during the testo The
cracking load was more difficult to observe in the beams in which the
concrete carried only a small portion of the total tension at the instant
before crackings as was the case in beams with a high percentage of
steel and a high prestresso In these be~, the cracks developed slowlys
and the load~deflection curves did not change slope suddently as they did
for the beams with a low prestress and a low percentage of steelo In
some cases a a sudden jump in the deflectometer reading was observed D
indicating the exact deflection at which the concrete cracked,9 while for
other beams the cracks were not noticed until a careful inspection of
the beam was made between increments of load~ For the latter type of
beam~ the maximum load reached during the previous increment was used~
therefore~ some of the observed values may be highc
In some cases~ the cracks appeared to form first at the level
of the steele This occurred because of the presence of the grout
channel which was not prestressedo Sometimes cracks which started at
the bottom of the beam divided at the level of the steel into two or
more cracks as shawn in Figo 38 0
The computed and measured cracking loads and their ratios are
reported in Table lIe The agree:rrent is better for those beams with high
percentages of steel and a prestress of 120»000 or 160»000 psio The
observed cracking load for Beam B~lO was grea.tly below the computed
cracking load c The first crack in this beam opened suddenly and extended

116.
to within 3 in. of the top surface. Because this beam contained or~y
two wires tensioned to only 20,000 psi~ the cracking load was very
sensitive to the modulus of rupture of the concrete which may have
differed considerably in the beam from the value obtained in the tests
of control specimens.
The modulus of rupture is believed to be the greatest source
of error in calculating the stress at which the concrete cracks. Yhe
two modulus of rupture control beams made with each test beam frequently
gave two very different values. For lack of anything better, the average
modulus of the control specimens was considered to be the tensile
strength of the concrete in flexure. In Fig. 93 the modulus of rupture
is plotted as a function of the compressive strength of the concrete.
The equation of the line of regression is shown on the figure. The
computed standard error of estimate about the line of regression is 70
psi.
The average ratio of the computed to the measured cracking load
for all beams except B-IO was 0.984 with a mean deviation from this
average of 00081. The average value of the ratio of the computed to
measured cracking load for the beams of Series 1, 3, and 4 only
(f . = 120,000 or 160,000 psi) was 00966 with a mean dsviation of 0.070. Sl
Beam B-26 was not included because it had been cracked during handlingo
39. Comparison of Measured and Computed Mid-Span Deflection
(a) Deflections at First Cracking. The mid-span deflections of
all beams were measured with dial indicators. In each beam an attempt
was made to observe the deflection at the instant before the concrete

117.
cracked but, as mentioned in Section 38, the first crack was difficult
to observe in some beams. In some cases a sudden jump in the reading of
the deflectometer dial was observed and a definite deflection corres-
ponding to the cracking load was recorded, but usually the cracks were
not noticed until a careful inspection of the beam was made between load
increments. For the latter cases the deflection corresponding to the
maximum load attained during the previous increment of load application . .
was used. Hence many of the observed defle:ctions: are likely to be high,
particularly for beams with a high percentage of steel and a high prestress.
The mid-span deflections of the beams were computed by the
method described in Section 24. Equation (19) for the mid-span deflection
assumes the concrete to remain elastic up to cracking. The moment of
inertia of the net concrete section and the modulus of elasticity of the
control cylinders were used for all deflection computations.
Values of the computed mid-span deflections at cracking, the
measured deflections, and the ratios of the computed to measured deflec-
tions are listed for all beams except B-26 in Table 12. In most cases
the computed deflections were less than the measured deflections, and
the average ratio of computed to measured deflections was only 0.72 with
a mean deviation of 0.18 from this average. Although the agreement is
poor in some cases, the absolute differences in deflections are only a
few hundredths of an inch in magnitude. As mentioned previously, many of
the observed deflections are likely to be high because of difficulties in
observing the first crack. Another source of error is the assumption
that the concrete remains perfectly elastic up to cracking, whereas in
reality deviations from a linear load-deflection relationship were
lIS.
observed in most of the testsc A third source of error in computing the
deflections at first cracking is the use of the modulus of elasticity
that was obtained from the control cylinders and, hence, was probably
different from that of the beam.
The computed cracking loads and computed deflections correspond-
ing to these loads are shown on the observed load-deflection curves in
Figs. 42 through 6S. Much better agreement is suggested by these figures
since the errors in the computed cracking deflections are relatively
small compared to the overall deflections of the beamso
(b) Deflections at Ultimate Load. In Table 13 J values of the
computed mid-span deflection at ultimate load, the measured mid-span
deflection at ultimate load, and the ratios of the computed to measured
deflections are listedo The computed deflections were obtained by use
of Eq. (21)0 Values of M and M appearing in this equation were ult c
computed by means of Eqo (5) and (9) and the actual stress-strain curve
for the wire, and by an elastic analysis, respectivelyo The computed
deflection at ultimate load has not been given for Beams B-I J B~3J B-IO,
B-16, B-20, and B-26 because the equations are not applicableo Beams B-1
and B-20 failed in bond~ Beams B-3, B-IO, and B-16 were greatly under-
reinforced and consequently did not have a constant curvature in the
middle third; instead the angle change was concentrated above the one
or two major cracks that formed in each beamo The moment-curvature
relationship for B~26 was curved throughout and could not be represented
by two straight lines because this beam was initially cracked on both
top and bottomo
The average ratio of the computed to measured mid=span deflec-
tion at ultimate load was 1015 with a mean deviation from this average

of 00'21.0 Unlike the ultimate moment, the deflection at ultimate load is
rather sensitive to the value of the limiting concrete straino The
computations of Table 13 were based on an average value of ~ = 0.00340. u
The beams with a nominal initial prestress of 160,000 psi in particular
developed lower ultimate concrete strains than the average value of
00003400 This largely accounts for the high ratios of computed to
measured ultimate deflections found for these beams.
The computed ultimate loads and computed mid=span deflections
at ultimate load are shown on the observed load-deflection curves in
Figso 42 through 68. In general the agreement between measured and
computed ultimate deflections was best for the over-reinforced beams.
In all cases except beams which failed in bond or by fracture of a wire,
the computations for the ultimate load and corresponding deflection
are satisfactory at least for predicting the relative shapes of the load-
deflection curves.
(0) Deflections at an Intermediate Load 0 In order to predict
the shape of the load~deflection curves more accurately, the mid-span
deflections were computed for an intermediate load corresponding to the
load at which the concrete stress on the top surface reached an arbitrari-
ly assumed value of 0075 flo These computations have been discussed in c
Section 260 The computations involve a trial and error solution for the
steel stress that, satisfied both the conditions of equilibrium and the
condition of compatibility of strains 0
The computed loads and deflections corresponding to the arbitrari-
ly assumed concrete stress of 0075 f! are given in Table 14 for the beams c
tsstedo The computed values of Pi and6~ are also plotted in Figso 42
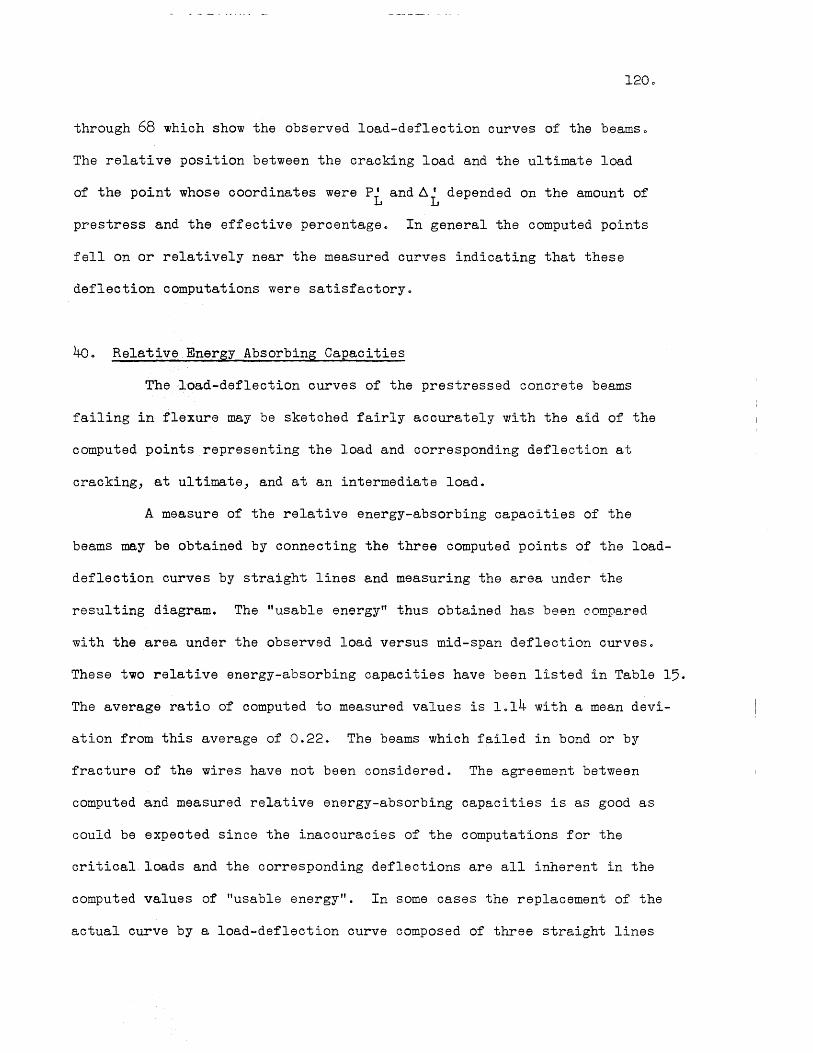
1200
through 68 which show the observed load-deflection curves of the beams 0
The relative position between the cracking load and the ultimate load
of the point whose coordinates were PL and6L depended on the amount of
prestress and the effective percentage~ In general the computed points
fell On or relatively near the measured curves indicating that these
deflection computations were satisfactory.
400 Relative Energy Absorbing Capacities
The load-deflection curves of the prestressed concrete beams
failing in flexure may be sketched fairly accurately with the aid of the
computed points representing the load and corresponding deflection at
cracking, at ultimate, and at an intermediate load.
A measure of the relative energy-absorbing capacities of the
beams may be obtained by connecting the three computed points of the load
deflection curves by straight lines and measuring the area under the
resulting diagram. The "usable energy" thus obtained has been compared
with the area under the observed load versus mid-span deflection curves.
These two relative energy-absorbing capacities have been listed in Table 15.
The average ratio of computed to measured values is 1014 with a mean devi
ation from this average of 0.22. The beams which failed in bond or by
fracture of the wires have not been considered. The agreement between
computed and measured relative energy-absorbing capacities is as good as
could be expected since the inaccuracies of the computations for the
critical loads and the corresponding deflections are all inherent in the
computed values of "usable energy". In some cases the replacement of the
actual curve by a load-deflection curve composed of three straight lines

121.
resulted in appreciable errors. The beams with a nominal initial
prestress of 160,00 psi have computed energy-absorbing capacities which
are considerably higher than the measured values because the computed
deflections at ultimate for these beams were too greate
Studies were also made to compare the measured relative energy
absorbing capacities for beams having different effective percentages
and different amounts of prestress. The measured relative energy
absorbing capacity of the beams is plotted against Q in Figo 940 Although
considerable scatter exists, the data indicate a decrease in the energy
absorbing capacity with an increase in Q. A slightly different trend
having a higher rate of decrease was obtained when the computed energy
absorbing capacities were plotted against Q. The data also indicate,
that for a given Q, a beam with a prestress of 20,000 psi has about the
same energy-absorbing capacity as a beam with a prestress of 120,000 psio
However, the elastic energy-absorbing capacity (energy up to cracking)
was greater for the beam with the higher prestresso The beams with a
prestress of 160,000 psi seemed to have slightly lower energy-absorbing
capacitieso

X. SUMMARY AND CONCLUSIONS
The primary objectives of 'this investigation were~
1. To study the flexural behavior and mode of failure of
post-tensioned, end-anchored, bonded prestressed
concrete beams.
2. To develop methods of computing the ultimate flexural
capacity and the load-deflection characteristics of
prestressed concrete beams.
122.
The test results were used to determine the adequacy and validity of the
analytical methods which were developed. Several parameters used in the
analyses were evaluated empirically. The analyses were also used to
study the sensitivity of the ultimate flexural capacity to the variation
of several parameters appearing in the analysis.
A total of 27 rectangular, post-tensioned, bonded beams having
end anchorages were tested. The loads were applied at each third-point
on a 9-ft span thus subjecting the middle third to pure flexure. The
beams were nominally 6 by 12 in. in cross-section and 10 ft in length.
All beams were reinforced with cold-drawn high strength steel wire
which was placed in a channel of the beam that was filled with grout after
the wires had been tensioned. External clamp-on stirrups were provided
for most of the beams in order to insure flexural failures.
The major variables considered in these tests were the percent
age of steel, type of steel (properties), amount of initial prestress,
and the concrete strength. The outline of the test program is given in
Table 1. Three types of steel were used, and the percentage of steel
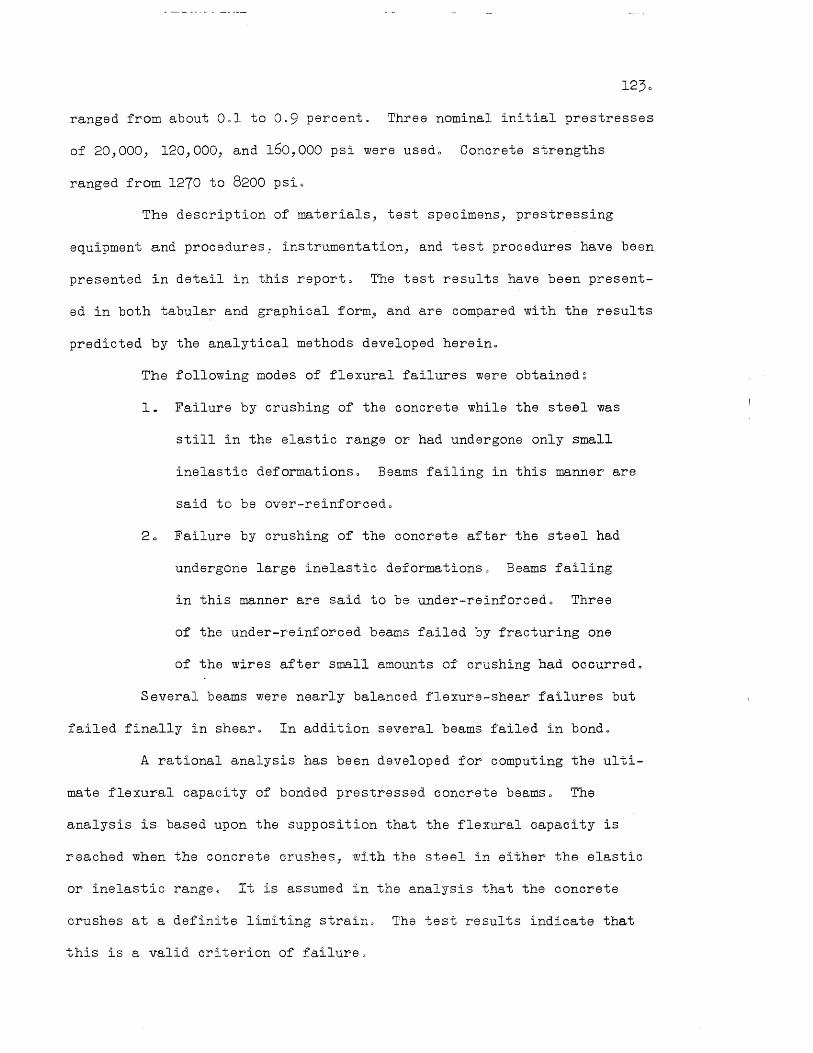
ranged from about 001 to 0.9 percent. Three nominal initial prestresses
of 20,000, 120,000, and 160,000 psi were usedo Concrete strengths
ranged from 1270 to 8200 psio
The description of materials, test specimens, prestressing
equipment and procedures) instrumentation, and test procedures have been
presented in detail in this reporto The test results have been present
ed in both tabular and graphi~al forms and are compared with the results
predicted by the analytical methods developed hereino
The following modes of flexural failures were obtained~
1. Failure by crushing of the concrete while the steel was
still in the elastic range or had undergone only small
inelastic deformations. Beams failing in this manner are
said to be over-reinforcedo
20 Failure by crushing of the concrete after the steel had
undergone large inelastic deformations 0 Beams failing
in this manner are said to be under-reinforced 0 Three
of the under-reinforced beams failed by fracturing one
of the wires after small amounts of crushing had occurred.
Several beams were nearly balanced flexure-shear failures but
failed finally in shear 0 In addition several beams failed in bondo
A rational analysis has been developed for computing the ulti
mate flexural capacity of bonded prestressed concrete beamso The
analysis is based upon the supposition that the flexural capacity is
reached when the concrete crushes, with the stesl in either the elastic
or inelastic range. It is assumed in the analysis that the concrete
crushes at a definite limiting straing The test results indicate that
this is a valid criterion of failureo

124.
Ezpressions were derived for the ultimate moment capacity in
terms of the known properties of the beam and of the concrete and in
terms of the steel stress at ultimate moment in the region of maximum
moment 0 By idealizing the steel stress-strain curve a relation between
the ultimate steel stress and known properties wa.s fO'J.nd by means of the
condition of compatibility of strains~ In addition a procedure has been
presented by which the ultimate steel stress can be found by a trial and
error procedure using the actual stress-strain curve for the steelo
The results of the latter method are conveniently given in the form of
non-dimensional curves of the ultimate moment capacity versus a parameter,
QI, involving the modulus of elasticity of the steel, the percentage of
steel, and the average compressive strength of the concrete in flexure,
k k f 0 An empirical expression for ~ k.... was derived from the test I 3 c --1 )
resultso A non-dimensional curve so developed is of course valid for
only One particular type of reinforcement and only one value of prestress.
The test results indicate that the assumptions on which the
analyses are based are reasonableo Excluding three beams which failed
in bond, the average ratio of the computed to measured ultimate moments
for the beams reported herein plus three beams tested i.n anot.her phase of
the investigation was 1 .. 005 with a mean deviation from this average of
The analytical studies of the deformations of the beams develop-
ed was found to be sufficiently accurate to predict the shape of the
load-deflection curves for the beams testedv The effective percentage
parameter, Q = E /pf' determined the deflection characterist.ics for a s c
beam with a given prestress, type reinforcement, and type of loadingo

This is shown in the dimensionless plots of M/f 9 bd2 versus the mid-span c
deflection of Figs~ 69, 70, and 71c
The test results show that the magnitude of the effective
prestress has practically no effect on the ultimate moment capacity for
an under-reinforced beam, but that increasing the magnitude of the
prestress increases the ultimate moment capacity of an over-reinforced
beam with a given effeotive percentage, Q~, and the increase is greater
as the value of QO is increasedo By comparing beams with nearly the
same effective percentage it can be seen that the beams with an initial
prestress of 120,000 psi developed smaller deflections at ultimate load
than the beams with an initial prestress of only 20,000 psio Little
difference in the relative energy-absorbing capacities was found, however,
because the beams with a prestress of 120,000 psi had higher cracking
loads and much higher elastic energy-absorbing capacitieso

APPENDIX~ BIBLIOGRAPHY
10 Zwoyer, Eo M. j and Viest, Io Me>, "Bibliographyon Prestressed Concrete", First Progress Report of the Investigation of Prestressed Concrete for Highway Bridges, Engineering Experiment Station, University of Illinois, 1952, Section Go
2. Zwoyer, E~ M., "Shear Strength of Simply-Supported Prestressed Concrete Beamst/J PhoD. Thesis, University of Illinois, June 1953.
30 Siess, Co Po, "Research in Prestressed Concrete", Proceedings of the First Do So Conference on Prestressed Goncrete, Aug., 19510
4. Joint ACI-ASCE Committee 323, "Proposed Definitions and Notations for Prestressed Concrete", Journal.of the American Concrete Institute, ACI Proceedings Vol., 49, Oct~ 19520
5. Appleton, J. Ho, Billet, D. Fo, and Zwoyer, E~ M., "Tests of Prestressed Concrete Beams"., First Progress Report of the Investigation of Prestressed Concrete for Highway Bridges, Engineering Experiment Station, University of Illinois, 19520 Section Bo
60 Billet, Du Fo, and Appleton, Je He, "Analytical Studies of the Ultimate Flexural Capacity of Prestressed Concrete Beams", First Progress Report of the Investigation of Prestressed Concrete for Highway Bridges, Engineering Experiment Station, University of Illinois~ 1952 Section A.
70 Gaston, Jo R", Siess, Co Po, and Newmark, No MO J
"An Investigation of the Load-Deformation Characteristics of Reinforced Concrete Beams up to the Point of F'ailure ", Technical Report to ONR Prcject NR-·064-372, University of IllinOis., December 19520
8. Hognestad, E~J "A Study of Combined Bending and Axial Load in Reinforced Concrete Members!!, University of Illinois Engineering Experiment Station Bulletin Noo 399, 19510
9., Talboty Ao N~, "Tests of Reinforced Concrete Beams", Series of 1905> University of Illinois Engir-eering Experiment Station Bulletin Noo 4, 1906.

TABLE 1
OUTLINE OF TESTS
This investigation was restricted to post~tensioned9 bonded prestressed concrete beams fail= ing in fle:x.:ure 0 All beams were 6 by 12 inches in cross..,..section and 10 feet long (I They were tested o:n a 9 £'O\.' t span wi th 1~hird=poi:rrt loading 0 The beams were rein,forced In tensio:r.', only 9
Vli'th 'tvires having end anchorages"
""","""""~ __ ~ __ ",._"""",,,,,,,,,,"'.~_~ __ :o-O""""""' __ "-\~"'_---.u>~_"f1<.'-.~~~~.~~~~. ~~'DIt~~"~~.
Series Beam. Nominal Nom.i.nal Nominal Type Nwnber Numbs!" Prestress Percentage Concrete Reinf~
f 0 9 ps~l P strength S~ fi 9 psi
C
,~1lAL4C:
1 Bl=BB 120~OOO 0$1=O~9 3500 9 5500 IIII' II
'" B9~B14 20 9 000 Ool=Oe9 .3500 9 5500 I t:."
,3 B15=B19 1609 000 0.1=0.9 3500f) 5500 I
~~ B20=B27 120 9 000 0C)3=O~9 1300 = 8200 II
I-'
~

Lot 4
1 7 2 2 3 7~5 4 0,,9 5 302 6 202
Lot 1 172
1 0 2 0 .3 0 4 0 5 0 6 0
Lot 4
1 o
TABLE 2
SIEVE ANALYSES OF AGGREGATES
SAND Percentage Retained on Sieve No.
8 16 30 50 100
17 34 63 88 99 19 36 65 90 98
9Q6 4105 70,,3 90.2 0/105 1306 42CJ9 7207 92.5 9804 1902 40e6 7.3e9 94.9 99.3 1406 3706 75Q4 9406 99~5
_GRAVEL Percentage Retained on Sieve NOe
374 3/8 4 8 16
?,ry ,./! 80 93 95 96 23 64, 93 97 98 37~6 8504 9805 99Q4 99G8 5208 9502 9901 9903 99t>4 17Q9 6607 93Q3 4701 91Q5 9904 99Cl5 9905
GROUT SAND Percentage Retained on Sieve Noo
8 16 30 50 100
1 ., .J.. 1 87 100
128
Fineness Modulus
.3008 3.10 3-017 .3.21 30.31 3024
Fineness Modulus
7.01 607; 7.21 7.46
7037
Fineness Modulus
~------~-----------------

TABLE 3
PROPERTIES OF CONCRETE MIXTURES
Beam Nix by Weight c/w Slump~ *Compressive e:s~g c:s~g by Weight inches strength~ f~
o C ps~
Bat.ch** 1 '~I ,:" 1 2 1 2 1 2
B=·l 1:;203:308 1~2.o3:3.,8 21:15 2f>Ol 0 3/4 4900 54,90 B=2 1 ~ ;2, 0 7 : II- 0 5 1~207g4o5 1~66 3/4, 2 ]/2 4300 54.20 B=,,3 lg~301g5.,2 1~Jol:5~2 1~45 1('45 1 1 1/2 4180 3760 &'·4 1 ~lt-o 0: 506 lgl~oO~506 1015 1Q15 2, 6 1/2 4.180 3440 B~·5 1~;2,o9g402 192(19g4c~~ IdlrIl 1,,67 1 '2 :1 1/2 6260 5650 /, B,c6 1:J@9g506 1:~309g5o~; 1,,05 l~ll 4· 1/2 7 34·70 2950 B.~7 19;2.,9 ~11- 01 192'G9~4,~1 lel~2 1065 1 1/2 .3 4,930 5910 J3a.r8 1~:305~5o0 1~JCl9~505 101.3 1~20 ~5 3470 3280
lJe,,,9 1~:209:4o2 19~~09g4Q2 1~79 l/il86 1 1/2 5790 6330 13=10 1 ~ll- 0 O~5 0 5 .lg4"C):5,,5 1020 1020 1 1/2 2 3350 J530 &~ll 1~,t;.~Og5()5 194,~O~5()5 1~18 1 III 22 2 2 3530 ~3910 13=12 1~2'Qg~402 1:2$8~4~2 1$6f~ le64, ';2 2, 1/2 5780 5550 f>=o.13 1~'400g5o5 1~400:5~5 1~24 1025 2 1/2 1 1,,310 3750 ~14 1:3~9~5,,4 193",9g5c4 1019 1015 2 1/2 5 11410 3755
+Modulus of +t ModuJ us Age at Rupture, f of Elas= Test~
psi r ticitY9E days . ~6
psl x 10
1 2 2
490 560 29 595 690 4008 7'1
605 ;3028 66 615 3 0 ~.39 120 805 5010 87
450 475 3008 44 650 750 11- ,,84, 38 555 475 3084, 32
690 760 4~80 35 585 645 3~13 45 510 570 3070 45 735 725 4084· 53 630 555 4046 55 570 560 4026 76
f-J l\) '.0

TABLE 3 (Continued)
PROPERTIES OF CONCRETE MIXTURES
Beam Nix by Weight c/w Slump 9 *Compressive +Modulus of ++Modu1us .Age at CgS~g C~Sgg by Weight inches strength~ f~ Rupture 9 f of Elas= Test9 r psi psi ticitY9E days
~ psi x 10
Batch** 1 2 1 2 1 2 1 2 1 2 2 B15 1:208:402 1~208g4~2 ' 1067 1069 1 1/2 2 1/4 5780 5710 660 645 4079 64 J3<x,16 1~309:5Q5 1~400g505 1017 1{)16 1 1/2 2 .,110 3330 605 565 31357 62 B=17 1~4~0~5,,5 1:400~5o5 1019 1024- 1 2 1/2 3900 4580 545 600 4044 70 Bo-o18 1~400:505 194()Og5~5 ,1023 1028 1/2 1 3690 4100 565 560 4049 70 13=19 1:209&402 1:209~4a2 1065 1076 2 2 5725 6225 640 600 4064 50
B-2 0 1:400:505 1:400:505 1a18 loIS 1 1 1/4 2820 3820 460 495 Jo95 44' B-21 1:1,,5:206 1:106:209 2,,23 2035 3 2 1/2 6380 6560 590 710 5fil27 5~ B-22 1:106:208 191Q6g2Q1S 2034 2054 1 " '1/4 72S0 7630 655 710 5099 53 B=23 lg106g2o9 1:1,,6:208 2.39 2&51 3/4 1/4 7940 8200 670 605 5050 52 &"'24 1~208:4o1 1:2ct8:401 1057 1c59 1 2 5930 6115 680 660 5023 52 B=-.25 l:ly.O: 5 05 1;400g505 1015 1.20 1 1/4 2 2275 3265 4.15 515 3071 52 B0-026 1:ly06g604- 18406g6o4. 0091 0092 ') 6 1/2 2100 1270 520 355 2()12 66 I!!'"
B=27 1;304~402 1:303~4,o2 1~4-3 lo~~~; 2 1 1/2 4580 4590 625 580 4010 66 ~;
'* AYerage of four 6 by 12=iuo control cylinderso
** Bat.ch 1 in outer quarters of beamQ Batch 2 in center half of beam~ + Average value from two j three 9 or four 6 by 6 by 18=1nQ control beamso J-l
\.tJ
++ 0 Average of t,.fO 9 three 9 or four control cylinders of batch 20

1,31
TABLE 4
PROPERTIES OF GROUl' ~1IXTURfS
Beam Mix by c/w Aluminum., . percent *Compressive Weight by Weight of· weight of cement strength 9
c:s psi
B=-l 1~1 1~64 0 4390 B-2 1:1 1098 00009 3230 B-3 1:1 2c OO 00011 4500 B-4 1:1 2000 0~01l 1710 B-5 1:1 OoOll 1620 B-6 1:1 2000 00011 1570 B-7 1:1 2000 00013 2670 B-8 1:1 2000 00013 3230 B-9 1:1 2000 011013 1580 B-1 0 1:1 2000 00013 2100 B-ll 1:1 2015 00013 2460 B-12 1:1 2 0 08 00013 2520 B-13 1:1 2000 Go 011 2470 B-14 1:1 2019 0 0 012 1380 B-15 1:1 2~17 OoOll 1510 B-16 1:1 20.31 00012 4640 B-17 1:1 2063 00013 3600 B-18 1:1 2017 00013 3220 B-19 1:00 83 2030 00011 442,0 B-2 0 1;101 2004 00015 2610 B-21 1:1 2008 00013 .3400 B-22 1:1 2000 00013 3100 :8-23 1:1 2008, 00013 2600 B-24 1:1 2017 00013 1290 B-25 1:1 2000 00013 3560 B:-26 1!1 2008 .3Q)O B-27 1:1 2017 00013 3530
* Average of four 2 by 4"",ino cylinders

TABLE 5
PROPERTIES OF REINFORCfi1ENT STEEL
002 0/0 * Type Av. ·P1 s.tress at Ultimate Reduction Reinfo Dia$
.L· s Offset 0.7 0/0 Strain in Area Stress, f;:r Elongation c l
s in. ksi ksi J ksi percent percent
Nominal Surface E - Condition 6s
10 psi
U-C1<O ___ "--==-.... -""""""-..oo----=-- .. -:._.
I 0.193 240.0 206.7 194.6 4.2(0) 34.5 30 Rusted 6.3(1)
II 0.199 249.0 219.8 191.9 3.8(0) 41.9 30 Rusted 5.3(1)
III 0.192 211-5.6 2CX) .0 187.1 7.6(r) 34.2 30 Galvanizing Removed
and Rusted
.------------~---~-.-- .•... ---~,~~.~~-~.....,-----~--------~-~~--.---~-~----~
* Average strain of specimens fracturing outside (0) and inside (I) the gage lengths respectivelyo
I--' \..V l\)

Beam b d h Nwnber inGl ine in. Wire:3
and Diameter
in.
:s,..,l 6 000 9011 12000 80<>0 0 196 B=2 6015 ge53 12015 11-=04>192 B,..,3 6 000 9962 12012 2cx>0~192
B-4 6010 9,,19 12009 80<>00192 B=5 6010 9.33 12006 8,.,00199 13=6 6006 8,,12 12~()) 11=OQ199 11=7 6.13 8009 12~13 15=00199 &--'>8 6013 7e99 120CX) 150<>00199
]30.,9 6006 9,,23 12Q06 8=0 0 19.3 B-IO 6006 9001 12003 2=0,,193 13=11 60CXS 902.1 12006 8=0,,193 13=12 6,,06 8.33 12013 15=00193 13=lJ 6002 8~15 124110 11=0,,193 B=14· 6~OO 7,,99 12.08 15=00193
TABLE 6
JPROPERTIES OF BEA.l£
A p Type * f 0
. S2 51 Reinf. J.n. psi
0 0 232** 0.00424- III 1199 300 0.116 O~OO198 III 1209 000 0~058 0 0 00101 III 1219000 00232 0000413 III 122~000
0.24·9 0.00437 II 1199400 0 0 342 Oa00695 II 1209700 0.467 0,,00942 II 118~200 0.467 OCl100953 II 121 9 500
00234 0 .. 004·18 I 20~400 0.059 0.00107 I 21~400 00234 0 0 00419 I 20 9 900 0~439 0~OO870 I 20~300 OQ322 0.00656 I 2294·00 00439 00 00916 I 20 9800
f~ c
psi
5490 5420 3760 3440 5650 2950 5910 3280
6330 3530 3910 5550 3750 3755
Ep 5
Q~ fB c
2302 11 g 0
801 ,36.0 23C12 70 0 7 47.8 8702
19.8 901
32C1l1 4700 52.5 7.302
Stirrups
None None None None None None Clamp:=on Clamp'-'on
Clam~on None Clamp=on Clampooon C1amp:=on Clam~Jon
f-J \.Jj \JJ

Beam b d h ine irtlt> ine
13=15 6003 9,,29 12009 13=16 6001 9~OO 12 0 01 B~17 6000 9G09 12 0 01 &...18 6000 8029 IlG96 B~19 6 0 08 8027 12007
J.3c~20 6005 902.7 120]-3 B-2l 6 0 08 9 005 12.~(Jl
E=22 6oa? 9013 12${Yl H",2J 6 0 04. 8a20 12.00,3 :&,024 6 0 eR 8(J24. 12 0 01j. B=25 6006 ScpOl 12~01,.. B=26 6010 9~27 114197 B=2.'l 60W 8¢136 12 0 Cfl c.a~_~~~
Number Wires
and Diameter
i:oo
800>00193 2=OG193 8=0 0 193
11=00193 15=00193
5=OCl199 5=.00199
10=00199 15L~Oo199
12=00199 10=0,,199
8=00199 15cxoOo199
TABLE: 6 (Continued)
PROPEHTIES OF BEAMS
A p Type * s Reinf. ine
00234 0 0 00418 I OQ059 0~00108 I 00234 OdlO0429 I 04J322 0®006/~7 I O~439 0000873 I
0(;)156 0~OO278 II Oti>156 0~OO284· II O~Jll O~O0561 II OQ4·67 000094:3 II 00;37:3 OoOa71~.6 II O~Jll 0,,00641 II O~24·9 0<pOO~,4·0 II 0~467 0,,00920 II
* Patented 9 cold--drawu 9 and stress relieved 'Hire Type I "'" Type II <= Patented 9 cold-drawn)) and stress relieved wire Type III ~ Patented)) cold-drawu9 and galvanized 'fire
** Galvanizing not included in area of wire
fsi fR E P c Q- ;1 Stirrups psi psi c
1505)000 5710 2200 C1amIP'on 150,300 3330 907 None 151 9 000 4580 28.1 None 11,,8 9 800 4100 479'3 C1amp=on 151 9300 6225 11-201 None
1209400 .382.0 2108 Clamp=on 1219000 6560 1300 None 120~400 7630 22.01 Clamp=on 1219200 8200 34,(~5 Clamp=on 1219300 6115 36e6 Clamp=on 1219200 3270 5808 Clamp=ou 12]'9600 1270 10",,9 Clamp-on 1219700 4590 6001 Clamp=o:n
J-I
~

135
TABLE 7
PROPERTIES OF NET CROSS-SECTION
Beam f A e Yb I wn se .c 2 in. 0° 4 ksi m. ins 2nGl 1bs/ft"
B-1 lCJ708 65.4 3e41 6e30 796 85 :&-2 116.8 68.1 3.75 6037 848 85 B-3 120.0 66.1 3.e:? 6037 822 85 B-4 113.9 67.0 3,.46 6-.36 822 85 B-5 114.1 67.0 3.63 6e36 811 85 13-6 116.0 67.4 2.27 6,,21 868 85· B-7 112.8 65.4 2.28 6.31 868 100 13-8 112.9 66.9 2e17 6024 867 100
:8-9 19.1 65.1 3.56 6039 805 100 :8-10 19.0 69.0 3.18 6020 8'''~ .J,.J' 85 B-11 20.4 64.3 3e61 6(;46 781 100 B-12 20.4 64.1 2.58 6038 84.5 100 B-13 21.2 63".5 2.41 6~36 837 100 B-14 20.2 63.7 2.25 6034 8)0 100
:&-15 150,,0 65.6 3.59 6e39 808 100 B-16 150.3 64"eO 3038 6039 781 85 B-17 15100 6303 3·50 6042 772 85 :&-18 148,,8 62.7 2.60 6,,27 808 100 B-19 1510.3 6505 2050 6.30 845 85
B-20 118.6 63.8 3065 6051 798 100 B-21 11800 65 .• 6 3.38 6040 805 85 B-22 11502 65.5 3046 6040 804· 100 B-23 117.3 6501 2046 6,,29 825 100 13-24- 116.4 6504 2e46 6026 845 100 B-25 11405 64.5 2o'Zl 6fJ30 835 100 B-26 11605 64.9 3.66 6036 781 100 B-27 118.0 64.8 2.58 6029 84.8 100

TABLE 8 136 COI·1PARISON OF NEASURED AND COl1PUTED ULTIMATE STEEL STRESSES
Ultimate Steel stress in k . from s~
! Ratio of Meas. to Compo f su Beam Steel Concrete lv1 Theory for ffi ffi ill Strains Strains at Ult
Flexural and (SR-4 Level of k d Failures Gages) Steel u
(Mech. Gage)
(1) (2) (3) (4) (5 ) (6 ) (7) (8)
B-1 184 217.5 0.846 B-2 231 225 252 235.5 00981 09955 1007 B-3 245 244- 248 245.6 00998 00993 1001 B-4 203 213cO 0 0 95.3 ---=---B ..... 5 228 228 233 229.5 0.993 08993 1.02 B-6 204 195 233 205 0 0 0.995 0.951 0.980 B-7 188 193 206 21400 00878 Oe902 0$96.3 B-$ 195 190 204 18905 1.03 1.00 1.,08
B-9 213 214 211 216.0 0.986 0 0 991 00977 B-IO 240 240 231 240.0 1000 1.00 00962 B-l1 210 215 215 212$0 00991 1001 1.01 B-12 170 205 173 19100 00890 1007 0.9C6 B-l.3 193 207 186 192 0 0 1.01 1008 00969 :&-'14 165 188 159 160.0 100,3 1018 00994
B-15 215 217 219 00 00982 0.,991 :8-16 240 240 245 240.0 leOO 1800 1002 B-1? 21.3 213 215 21605 00984 00984 00993 B-18 206 210 208 212.0 0 0 972 0 0 991 00981 B-19 205 211 207 21105 00969 00998 00979
:8-2.0 195 2.31 211 2.32.5 00839* 0 0 994 00908*
B-21 232 236 228 23805 0 0 973 00990 0.0956 B-22 223 231 229 229~5 0 0 0/72 1001 0.998 B-2.3 224 222 217 223.5 00958 0 0 993 00971 s...24 218 227 221 2240 0 0 0 973 1001 00987 B-25 205 213 217 213 0 0 00962 1000 1 0 02 B-26 191 225 181 197 05 00967 1014 00916 B-27 196 207 198 206.0 0.951 1 0 00 00961
Average Ratio 00977 1001 Oc988 Hean Deviation 00025 00034 00028
* not included in average and in Ho Do
(2) From average measured steel strain at effective depth (electric SR=4 gages) (3 ) From measured strain distribution at ultimate load (mechanical gage) (4) From measured ultimate moment~ measured k d~ assumed k2 = 00 42 (5 ) From theory for flexural failure Eqo (9) Rnd actual stress-strain curve for
steel

Beam
B-2 B-3 B-5 B-6 B-7 B-8 B-9 B-I0 B-11 B-12 B-13 B-14 B-15 B-16 B-17 B-18 B-19 B-20 B-21 B-22 B-23 B-24 B-25 B-26 B-27
TABLE 9
MEASURED VALUES OF k1 k3
k d* ft u c
in. psi
1.31 5420 0.40 3760 2.05 5650 3.72 2950 3.30 5910 4..20 3280 1.60 6330 0.70 3530 2.17 3910 2.60 5550 2.55 3750 3002 3755 ?.olO 5710 0061 3330 2045 4580 3.30 4100 3.08 6225 1075 3820 1020 6560 1095 7630 2.85 8200 2052 6115 3.40 3270 3.80 1270 3095 4590
k k ** 13
00670 1059 00822 le103 D08US 1013 00804 00902 0 0 979 00867 1 0 04 1003 0 0 703 1017 00749 00824 00 778 00814 00744 00789 00716 00882 1000 1053 00842
* From measured strain distribution at ultimate load.
Mult ** From k1k3 = (d-k k d) (fRbk dJ 9 k2 = 0042 2 u c u
1.37

TABLE 10 138
COHPARISON OF BEASURED 1h~ CO}1PUTED ULTIHATE 110I~NTS
Ultimate MomentQFt-~ Com~ted Mode of Beam Q! f fR Measured Computed Measured Failure**
se c
B-1 28.2 10708 5490 36e86 35002 00 950 B
B-2 13.3 11608 5420 21089 20 0 71 00 946 T B-3 8.7 120.0 3760 11033 11015 00 984 T B-4 37.7 11309 3440 331P31 33056 10008 T=S B-5 28.5 11401 5650 41eOl 40034 00984 ToeS B-6 70.3 116.0 2950 37057 37085 1.007 caS B-7 59.5 112.8 5910 53080 550Zl 1~027 c B-8 89.8 112e9 3280 ~,9~54, 44086 00906 c
B-9 25.2 19.1 6330 .35~20 35679 1 0 017 T B-I0 906 19.0 3530 9082 100 19 lc038 T' B-l1 35.0 20 .. 4 3910 3408.3 33,,91 00 974 T-C B-12 57.4 20 .. 4 5t"l"f"\ TJV
Pt::. rye:. '4.)0/.) 4902.1 1<7076 C"",B
B-l.3 56.5 2102 3750 35042 35064 loom C B-14 7809 20.,2 3755 39016 38060 Oe986 C
B-15 ,.....,.., , 150 0 0 ern ri ~t::. hQ 36,,60 100.27 T ~{ • .L .)I.L.V '/./' C)Va/
B-16 lO.O 1500.3 33,30 10043 1.0009 0 0 967 T B-17 32.3 15100 4580 33085 34056 10021 T B-18 52.4 148 .. 8 4100 38e48 39078 10034 T=C B-19 5.3.2 15103 6225 52078 53093 1 0 022 T~C
J3.=-.20 23.6 11806 .3820 23042. 25081 10102 B B-21 16.7 11800 6560 25037 26072 10053 T B-22 29.6 11502 76,30 49037 4.9020 Oe997 T B-23 47.1 ll703 8200 58099 61J075 10030 TcooC B-24- 4600 116Q4 6115 49039 4,9010 0 0 994- T~
B-25 60c5 11405 3270 37000 ,36026 00980 ("\
v
B-26 79.2 11605 1270 28Q76 29002 10030 C B-27 6902 . 118 0 0 4590 51073 53058 1 0036 C
S-2 27.7 50t>O 3660 26092 ,.../ ,... ....
~CoC>~ 0 0 90/1 T 8-13 56.0 14000 4840 45tl79 45065 0 0 997 TccC 8-17 61.7 13600 .3350 41039 44015 10067 T=C
Average Ratio (All 30 beams) 10009 Nean Deviation 00 0305
Average Ratio (All except B=ls B-12~ :8-20) 10005 Hean Deviation 0 0 0258
* Computed Ultimate Flexural Capacity = Eqso (5) and (9) ** Initial Mode Failure
B - Bond C ,.. Compression T '"'" Tension S - Shear

139
TABLE 11
COMPARISON OF MEASURED AJ\1J) CO}1PUTED VALUES OF THE CRACKING LOAD
Beam Measured Computed Computed Cracking Load Cracking Load
Kips Kips Measured
B-1 14870 10 0 77 0,,733 B-2 9~99 8082 00883 B-3 6022 6 0 01 00966 B-4 13004 11075 00 901 B-5 13.74 13086 10009 B-6 13.91 12069 00912 B:-7 18015 17089 00986 B.c8 17.39 15,,43 008'2:7
:8-9 5.50 6,,01 10093 13-10 2065 4,,57 10725* B-11 5.47 4061 0 0 84.3 B-12 6045 6~98 10082 B-13 4-44 5009 10146 B-14 5000 5051 1,,102
B-15 13,,85 14061 10055 ~16 5050 5087 1,,067 :&.,17 14030 14003 00981 B-18 15096 15073 0 0986 B-19 20095 20,,68 0 0 987
B-20 6065 8.42 10266 B-21 9 0 00 7086 0,,8(1'3 B-22 15099 14099 00937 ~23 19014 17035 O09C6 :s,.,24 14.83 15~19 1,,024-B-25 11099 11 0 67 OoCJl3 ~27 18001 17,,94 00996
Average Ratio 00 984 Mean Deviation 0,,081
* not included in average and in HoD-o

140
TABLE 12
COMPARISON OF HE.ASURED AND CONPUTED HID-SPAN DEFLECTIONS AT
FIRST CRACKING
Computed Heasured Compu:Cea Deflection, DeflectionS)
Beam Ll "'" inQ .6c - in"o 14easured c
B-1 0.C63 00115 Oe55 B-2 0~057 00055 1.04 B-3 0.050 00043 1016 B-4 0 0 094 00090 le04 B-5 00fJ75 00097 0077 B-6 0.1C6 00112 0095 B-7 00095 00136 0070 B-8 0.104 00162 0064
B-9 00035 0 0 0.37 0095 B-10 0,,039 00042 o !'! 93 B-l1 0t!)036 0,,083 0 0 43 B-12 00038 00050 0076 B-13 0 0 0.30 00055 0055 B-14 00035 00065 0054
B-15 00084 04POffl 0097 B-16 00047 00052 0090 ~17 00091 0 0 15.3 0059 B-18 Oe097 0016.3 0060 B-19 0 0 118 00186 0063
B-20 0.(60 0 0 078 0077 :8-21 0 0 041 00106 0 0 39 £-.22 0 0 070 0 0 164. 0043 B-23 0.085 0 .. 166 0051 B-24 0.W7 0 0 134 o r-r'j o},
B-25 0.084 00131 0064 :8-27 00 115 0.172 0 0 67
Average Ratio Oc72 Nean Deviation 0018

TABLE 1.3
COMPARISON OF MEASURED AND COMPUTED 1-lID-SPAN DEFLECTIONS AT
ULTINATE LOAD
Computed Heasured Computed Deflection Deflection
Beam 6 ult - me Lult ao> in. Measured
&.01 1000 B-2 3.55 B-3 le65 P....",.l 1 ,t,. 1.')Q n_Q1 ~'-i" ..&- .... ....., ..&..o~v ........ 0' / .....
B=5 1084 1048 1024-B-C 1001 1,,13 0089 B-7 1013 0 0 92 1023 B=8 00'07 1000 Oo??!l
B=9 2040 2Q08 1015 B:-cl0 2~22 B=ll 1079 1«181 Oe99 H-12 1034 1046 0.92 B=lJ 1038 1054 0090 Bo--14 1021 1043 0085
:8=15 1097 1012 1076 B-16 2,,34 B~17 1072 1 0 05 1064 :&...18 1020 0081 1048 B=19 1021 1 0 02 1019
B=,20 1029 :8=21 3017 2«110 1051 :8=22 1085 1«152 1022 :8=23 1.27 1019 loa? :8=24 1035 1.30 1 0 04 Bc-025 1010 1004 IIJ06 B=26 1000 B=27 0099 0095 100ly
Average Ratio 1&15 Mean Deviation 0021
Average Ratio loCO (omitting B-15~ :8-17 9 B=18 9 and B-19)
Mean Deviation 0014 (omitting B-15~ B-179 :8=18 9 and 13=19)
141

142
TABLE 14
CO}~UTED LOADS AND DEFLECTIONS CORRESPONDING TO A CONC~E STRESS
OF 0075 f~ c
Computed Load Computed
Beam P! = 3. ML' Kips Def1ection*
L 3 6 1/ ino
B-1 17e7 0036 Bc-2 11~5 01>54 B-3 600 0052 B-4 1408 0033 B-5 1803 Oe30 13-6 1401 0016 B-7 2207 0024-J3.,..8 1606 00 14
B-9 1308 0055 B-10 408 0058 &-011 9~8 0038 B-12 1306 0036 B-13 803 0027 B-14 905 0025
:8-15 2001 0030 13-16 506 0037 B-1? 1802 0024-B-18 1806 0017 B-19 Z7 02 0025
B=20 1108 0028 B-21 1309 0050 B-22 2301 0036 B-2.3 2705 0034 :sa.,24- 2008 0026 B-25 1.305 0016 B-Zl 2145 0020
* (25 ) From Eq.

TABLE 15
C OHP ARISON OF 1v1EASlJRED AND COMPUTED RELATIVE ENERGY ABSORBING CAPACITIES
Computed Measured Computed Beam Relative Energy Relative Energy
Absorbing Capacities Absorbing Capacities Measured ino-kips inQ-kips
B-5 40 02 3301 1021 B-6 18~2 2200 0.83 B-7 30f)7 2402 1027 B-8 1908 2402 0.82
~9 4006 3602 1012 :8-11 2503 2902 0087 :&-.12 2509 2702 0095 B-13 1904 2303 0083 :&.014 1806 2306 0079
:8-15 41 .. 8 2403 1072 B-17 334'4 2303 1043 B-18 2402 1508 1053 s,.,19 3406 2706 1025
B,,·21 4508 3005 1050 B-22 4800 .39 0 0 1023 B-23 3608 3404 1007 :s,.,24 3301 3106 1 0 05 B-25 1903 1900 1002 B-2? 2504 2304 1009
Average Ratio 1.,14 }Iean Deviation 0022

.-en ~
cn en Q) ... ... f/)
... c ::J
250 I I L...----~ J f~ = 240,000 psi
200
I -----~ T
~ offset stress = 209,000 psi
I 150
( I J j
100 I I
I Es= 30,000,000 psi 0.193- in. dia.
III -
8 - in. GaQe LenQ1th
50 II II ~I
00 4 6 2 3 5 7 8
Unit Strai n - percent
FIG. I STRESS-STRAIN RELATIONSHIP FOIR TYPE I STEEL
,~ ____ ~~ __ ~"""'"~,~_. '""" """"-.,"", ... ~~ __ ,,, .... :x=um,,,,,,,,,,,-",u,,.-...··_,,.~~-=u __ ~~·= _____ ~m_""-~-='
I-' +-. +-

~-
tit ~
en tit ., ... .. (/)
~ c
:::>
250 - I I
+ f~: ~ ~ 248,000 psi
----~
:~oo
jO.2% offset stress = 218,000 psi
'1 1!50
~I I I
100 I ~ Es= 30,000,000 psi 0.199 jn. dia.
It 8 - in. GOQ8 Length
50 II II f/
-0 0 2 3 4 5 6 7 Unit Strain - percent
FIG.:2 STRESS-STRAIN RELATIONSHlP FOR TYPE II STEEL
-
8
f--I +:'vI

250 I -1
f~ = 2~5 .60~ Dsi ~ ~--~
200
~~
A ~ Offset Stress = 20"000 Dsi I fit
150 CI)
~
71 I
I
I I c: 0 '--(f) 100 -c:
=>
~Es = 30,000,000 psi
I
J J 0.192 in. dia. I I
J I 8 -in. Gaoe Length , I I
50 I j
1 V
00 2 3 4 5 6 7 8
Unit Strain - percent
FIG.3 STRESS-STRAIN REILATIONSHIP FOR TYPE ]I[ STEEL r-'
~ .~"""''''''''"=,~"..'''' . .....,,~"".~~~~~.al.IS'lrt~~~_--.:-= •

· ..
VIEW OF GROUT CHANNEL
FIG.5VIEW OF TEST SET-UP

I I I I I I I I
-::=::--~-::-::---1 ~ .... I ~ ~.... I <..)
Q)OC" I E 'to- .!:: I -o _ I ::l ._ Q) ~ 0 o - 0 '--_ 0 '-- (!)
-_ :I: (!)
CD
148
...J lLJ Z z I « ::I: 0 I
~
.1- I !l
::::> 0 a:: <!)
LL 0
en ..J -<2: I-l&J 0
I U)
.-~
<!) I I.L.

FIG.7 BEAM 8-5 AFTER SHEAR FAILURE HAD OCCURRED
FIG.8 BEAM 8-16 AFTER FAILURE
BY FRACTURE OF A WIRE
149

It--- I I " - 3/8" Stiffeners
~6t"~ 8 J...II
4
Leather Pad
Leather Pad
FIG.9 OUTSIDE CLAMP-ON STIRRUP
Weld
1'---4" X It II [
5/:B" ~
1~4" lill C
Nut
~ \'.11 o
~>n'-~......-.'~=' 't,.~C"_""-,""",,=~-<=> -woI

151
FIG. 10 BUTTON HEAD ANCHORAGES
FIG. II THREADED ANCHORAGES
I

152.
Round Nut H eaatona I Nut
Split Shim Washer Shim Dynamometer
FIG. 12 VIEW OF NUTS, SHIMS, AND DYNAMOMETER
FIG.13 VIEW OF PRESTRESSING APPARATUS

r--
Steel Washer
2" X 9/16" ct Aluminum Alloy Dynamometer
1---._.- ----
r-Two A-7 S R - 4 Strain Gages in Series on E~ach dynamometer ~--=-~...-:---- IWi
---~'---t--I------"--- --_.--_0- _ -- --;, IW --- -r - - -r- r .-
-----~--I - -
.. __ .. --- ---
= I~
L-
-----+------
5 III
~ Hardened Steel Hex Nuts
-Bearing Plate
Steel 'Nasher
FIG.14. DETAILS OF REINFORCEMENT ANCHORAGES
AT DYNAMOMETER END OF BEAM f-I VI \jJ

~--IS"---~-------IS'-' -------.4
7-/1 -"-"--3" 3/1~ ----7"-----a.I
1 ----*-_-----+---1-_ 6/1
~~_+--*---------"-~l Bearing Block
6"XS"X2/1or3 /1 Type A-9 SR -4 Gage
FIG.15 LOCATION OF SR-4 STRAIN GAGES
ON TOP SURFACE OF BEAMS
B-3 THROUGH B - 27.

=t '+ =, 7 =' 7 :. -IN
~ ~
10" 511
511 10" -
I 2 3
4 51 6
7 8 9
10 II 12
t.
Beams B-I,2,3
Lines on 8-1 8-2 8-3
2 1,2,3 1,2,3 5 4,5,6 4,5,6
7,8,9 7,8,9 7,8,9 II II 10,11,12
Beams 8-4 throu gh B - 27:
Lines 1,2,3,4,5,6, a 10 on all beams.
Lines 7,8,9 on beams
7,8,12,13) 4,18) 9,23,24,25, and 27 at 81~
4,5,6,9,10,,",,15,16)7,20,21,22, and 260t 9
11•
FIG.16 LOCATION OF WHITTEMORE STRAIN GAGE
LINES ON SIDES OF BEAMS f---1 \.Jl \.Jl

I~ •• I" ,- I 16 -I- 3'0" -I
Horizontal t. of Targets--ll--I-F 6" I _~ I t , , -H3"1-- T
2'br3'={=-~ -0 -----£ I~
I
C\J
C\J C\J (/) ... 6 E m C\J c Dial Indicators I~ Q) co co I I
co co «
lD lD I
I -tril C\J I
Targets-Steel Rule , I co co
~ f--It" I I , ,
-~3"H_
AAt--Dial ~I Indicators
I'C\J I
~~~ om C\J_ co,....: I I I coco
I co
lD I
C\J I
co
FIG.17 DEFLECTIO'N MEASURE~1ENT LOCATIONS
L I
I-' V1 0,

North
Moving Head of Testing Machine
Loading Beam
II I rU; 2 Rol er :~
l Steel r-- Pedestal I
Distributing 8eam
South
50,000 lb. Elastic - Ring Dynamometer
I '12 II B a II I ::II I (~ 2 II Roll e r
Test Beam
\~211 Roller 4" Rocker I ( \ ,
~ Z-----~-·· Bed of Testing Machine ~77777Tm77777777 / //// / / 111171TT7TT71T177777777T7mllTt- .
FIGURE 18
TESTING APPARATUS ~
\J1 --:J

(J)
~
(J) (J) Q) .... +-(f)
+-
c ::>
:250
I I' ~
...-
-----<xEs~== ~ ~ ~r------ ---l----:: I--
~ ~ ~ --- ..--::::::: ~
fsy ~ ------..--- ~
~ ....... L...-----
:200
,-
TVV ~I ~
~ V-- -----r/ IL ~
l~ V r 150
1/ : ~ .~
I
I I J I I
100
50
I I
I I I I ]I m I
/ I
I I Dio. - in. 0.193 0.199 0.192
I Es -kiPs/in~ 30XI03 30XI03 30XI03
I I
fsy -kips/in~ 207 223 207
I I
I / I csy -percent 0.70 0.75 0.68 I a -- 0.0340 0.0271 0.0397
I i
I I I I I
I I I I ~ I 0
0 Esy 1 2 345 Unit Strain - percent
6 7 8
FIG.19 IDEALIZED STRESS-STRAIN CURVIES FOR TYPES 1,1I, AND m REINFORCEMENlr
f-l \JI OJ

r b--1 r~~ ~" ~ 'T" ~rk3f~~
f k~T2kud I.... ) I C=klk3f~bkUd
d d
... IL,._ h
:t=: == === ==. == == ===c:::::J-I-
FIG. 20 ASSUMED CONDITIONS
AT ULTIMATE LOAD
kud
~ (d - k2kUd)
~ T = fsuPbd
j--J
Vl \0

160
-,.-.------.
d
J' I . I I
I I I I
L ;c~f-
a. Stage I. At Prestress
M ( )M F -- - F 1'\
I ''\ I ' L __ ~
b. St.age 2. At Intermed iote Moment
l- EU
MUlt Mult
( ) F F
I- ECU
c. Stage 3. At Ultimate Moment
FIG. 21. STRAIN DISTRIBUTION IN THE
BEAM AT VARIOUS STAGES OF LOADING

0-(J)
.::ti.
(J) (J)
Q) '-+-en +-
c: ::>
250
200
\ \ \ ~
\ \ h-~ ~ \ ~
Roebling Type 'IT E = 30,OOO,OOOpsi ~ fse= 116,OOOpsi
\\1 \' \ \ Eu =0.00340 ~ 1\
X \ \ \ €se= 0.00387
Eee=a'€se X 10-3
150
\ \ 1\ ~ \
I \ \ \ \ ~ f - Eu E§
~ i'-.,. /~ - su- QI (€su-cse+€u-€ce)
100 I \\ "-
"" "'" ~
~ ~" ...........
I Q'~ ~ " ~ ~
.............
~ ~ d;m
50 I I ~
0 0 2 3 4 5 6 7 8 Strain - percent
FIG.22 IGRAPHICAL SOLUTIONS FOR THE ULTIMATE STEEL STRESS !-l 0\ !-l

0.50
Eqs.(12) and (5)-rJ
0.40
1--f-~-_..- ....... :.-----------........ "'- ~
...... - V-- \ /
~ /'" / :\
0~30
N -0 .0 -u 'to-
If') .x 0.20 .x ......... ..: :;
"", ~ ~ I
,.' V Eqs.(9) and (5)-I
I
V- or I
Eqs. (16) and (5) V E q s. (I 8) and ( 5 ) I
or /
Eqs. (17) and (5)- V V
[7/ .,/ V
k2 = 0.42
~
0.10 V €u= 0.00340
I
/ fse= 116,000 psi
/ /
fsy =218,000 psi
Es= 30X I06psi i
V' I
<X = 0.0271 o
o 10 20 30 E p 40 QI= S I
. k,k3 fc
~)o 60 70 80
FIG. 23 COMPARISON OF Mu1t.-Q' CURVES BASED ON ACTUAL ~ AND IDEALIZED STRESS-"STRAIN PROPE:RTIES FOR TYPE TI REINFOr~CEME,
-------.~---.--- ---~-~------.-~-----

N "0 ..0 -u '+-rt)
~
~
......... -'5 ::E
0.50 Eqs.(l21 and (51
7
0.40
10-'--- .1--,~ ~
",. L-----' " ".. -----
/~ ;-~ ~
0.30
0.20
0.10
V tt' /
V L r-- Eqs.(9) and (5)
V or
Eqs.(l6) and (5) V Eqs.(18)and (5) .. - or
Eqs.(l7)and (5) _ t7 /
/
j :/ k2 = 0.42
/ ,/ €u = 0.00340
./ fse =116,000 psi
~,/ V f sy =207,OOOpsi
Es = 30 XI06
psi ~ ....
a =0.0340 V 00 10 20 30 Ep 40
QI:_S_
.,~", "
50 60 70 80
k, k3 f~
FIG. 2~,4 COMPARISON OF Mu1t.- Q1 CURVES BASED ON ACTUAL AND I DI~'I~LIZED STRESS-STRAIN PROPERTIES FOR TYPE I REINFORCEMENT &
I
I

240
(f) 220 ~
I (f) (f) Q) L. +-CJ)
200 Q) Q) +-CJ)
Q) +-c E 180 +-
::::> II
::J ."
'+-
160
140 o
I I
~ ~ €u= 0.00340
'~ ~~ Type I Reinf.
~ ~ [==::::::::: r-----:: r---::: t::-- fse= 150,000 PSiZ r----- I--
r---..... - ~-r---u_ ~
~ --- r--- K-r---- r-----fy::: Yield Stress at 0.2 % Offset
'" r----r------- ~ r-.
~ fse=116,OOOpsi ~ ~
'" I
I ""-
~ I
fse=201OOOpsi v /
~ K " G
-- b 10 20 30 E p 40 50 60 70 80
QI: S
klk3f~ FIG. 2~) COMPUTED ULTIMATE STEEL STRESS lit II
SU
f--I 0\ +=""

C\I "0 ..c - u 'to-
f() ~
~ ........ ..: :::J
~
-
k2 = 0.42 0.5 €u=O.00340
Type I Reinforcement
I I 1 I
0.4 I
r--
I I
0.3 r-
r----
0.2 r- -r--
r---- -t-
./ r--
/ 0.1
L -
Cd 1 1 00 10
I I I I I
r- -
-
- 1-I
t --
e - ~- /A L
/ 1 L f---V
r----
>------
1- L 20
r---
1 1 30Q,=~40
klk3f~
I I 1 I ---r-r I I 1
- r----
I -r---I- ,I
I '~ f =150,000IPSI ~ ~I _ se , 1 l, -
I ~~'16'00f PSI Id -, -J
~ .. Y" --~o.oo6 psi J L ~f..-- I J J
~ I . ~ ,...-'
-r---
- r- -
- r-----
-f---r--r------ r--
:-..- - - -
1 1 1 1 1 1-- l~-50 60 70 80
FIG. 26 EFFECT OF PRESTRESS ON ULTIMATE MOMENT CAPACITY j--J
0\ Vl

(Ot'S
0.4
03 iN
"'0 ..Q
~o III)
.x
..x "- 02
+= ::I
~
0.11
o
ff.e=IIII~~i
<Gu::~
'~]I[ lRftiitff..
'0 il(O 20 30 E p 40 50 60 70 QI __ S~ - klk3f~
FIG.27 EFFECT OF k2 ON ULTIMATE MOMENT CAPACITY
80
~ 0\ 0\

N -0 ..0
- U 'to-
"-... ::I
~
fse= 116,000 psi 0.5 r--
€u= 0.00340
>- k2 =0.42
Type]I Reinforcement 0.4
0.3
0.2
~ ~
v
~
/ V
0.1
V ~
0 0 10 20
# ~ ~ ~ ~
il ~
~
30 E p 40 Q - -..r--s _
- I fc
~ ~
~ v---~ /V ~ ~ ~ ~
~~ L----~ ---V ~ -v-'
50 60 70
FIG. 28 EFFECT OF k, k3 ON ULTIMATE MOMENT CAPACITY
'i-~ \(. " v- I
"''''~::~ ~~
'" \C.~::0.15 \.;J~
~--
80
f-l 0, -l

0.5
0.4
C\J 0.3 'U -0 -~
.:P ~
" ....: 0.2 :; ~
0.1
o
fse= 116,000 psi
k2= 0.42
Type IT Reinf.
/ ./ V
./ V
V v
o 10 20
------------------------------------------------------------------------------------------------------~
~ V ~~ ~
~ ~:
V
3g,=_ Es p , 40
k I k3 fc
~~ ~ ~
50
€'U =0.0040 ~~ ~ ?
~ ~C ::.---
b6 I- €u= 0.0034 ..........::
~ ~ r- Eu=0.002B
I !
I
60 70 80
FIG. ~~9 EFFECT OF tu C)~J ULTI~~ATE MOMENT CAPACITY I--' 0\ 0)

r- €u ~I t--Ete
7 f kud
t
FIG. 30 ASSUMED STRAIN DISTRIBUTION
AT ULTIMATE MOMENT
Mult. -- - --- -- I
ML J
I
I \
mult.
FIG.31 IDEALIZED ~v10~v1Ef'JT -CURVATURE
RELATIONSHIP

Me L t
F---__ a..--__ ..L.--_M_u,_t X~3.1It
FIG. 32 ASSUMED DIST.RIBUTION OF
CURVATURE A T ULTIMATE MOMENT
d /
/ /
--'---L ___ '-~ ~cee I.. cieri
FIG.33 ASSUMED STRAIN DISTRIBUTION
AT A MOMENT OF MIL
170

~O.75fH
d
FIG. 34 ASSUMED CONDITIONS OF
EQUILIBRIUM AT A MOMENT OF ·M~
J.. ~___ J.. ____ ~ .L... 333
FIG. 35 ASSUMED DISTRIBUTION OF
CURVATURE AT A MOMENT OF M~
171

172
80 r Prestress Type Reinf.
• 20,000psi I 70 c \
o 116,000psi ]I
)C \50,000 psi I I \
~ \ 1> ~ \ .~
60
50 . \
I
1\
\ ,_ (J 40
\~ \ ~J:~ Wl~-
II -o
I
\\ ~ ~~ I
30
~ "" ~" ~ ..... ~ ...........
20
" ~ h;::-, i'--..
......... r-k-10
o ~I ---..~~--~--~~--~--~~--~--~~ o 2 3 4 5
Computed .6.u1t. in inches
FIG.36 RELATION BETWEEN Q' AND COMPUTED
ULTIMATE DEFLECTION

-.... ~.- .. . .........
• t ~ :: .. ~ .. I ...... .
~:,
~- ',:,,~, '''~~?' ·'7if.~:· ,) "~.;<."~~'
:"\ "ti '>' " "
)
Load = 14.1 kips
.D. = 0.60 in.
Steel Strains Elastic
Load = 7.7 kips
.D. = 2.50 in.
After Secondary
Compression Failure
Load Off
.D. = I. 51 in.
173
FIG. 37 CRACK PATTERN AND EXTENT OF FAILURE
OF AN UNDER-REINFORCED BEAM, B-21

Beam B-27
Load = 32.0 kips
l:l. = 0.76 in.
Beam B- 27
Load Off
L3. = 1.83 in.
After Compression
Failure
Beam 8-8
After Compression Fai lure
174
FIG. 38 CRACK PATTERNS AND EXTENT OF FAILURES
OF TYPICAL OVER-REINFORCED BEAMS, 8-8 8 8-27

-500
1'11\\ " ~\\f\ i'-.
o +500 +1000
8EAM
8-21
8-20 8-5 8-23
8-8
Q'
16.7
23.6 28.5 47.1
89.8
fse ksi
118.0
118.6 114.1 117.3
112.9
Third - Point Loading
Type 1I Reinf.
+1500 +2000
175
Top Surface
2 in.
4 in.
+2500
Compression Tension
Strain X 10 5 Unit
FIG. 39 MEASURED STRAiN DISTRIBUTION IN
CONCRETE AT ULTIMATE LOAD

176
Too Surface
BEAM B-21
QI = 16.7 I-----+--~ 2 in.
Type II Reinf.
d=9.o5 in.
1
I
--I- -~I
I I
-500
I I 1
o I
.. I · Compression Tension
, _ ~ I I " ~,01t../--+--------! 1 0 in. \t I'd) I ,
\ "\ I ,,~
+500 +1000 +1500 t£ooo +2500
Unit Strain X 105
FIG. 40 MEASURED STRAIN D1STRIBUT10N
FOR AN UNDER-RElNFORCED BEAM

177
~ 5 rface op u , ~\ \
'\ ~\ BEAM B-27
QI: 69.1
~ ~ kud =3.95 in. p: 0.92%
2 in.
,,~ Type::rr Reinf.
• ~e= 118.0 ksi
=8.36in. ~ d 4 in.
'\ ~ \ ~ ~
6 in.
~ '\~ ~-I ~, - -,
- --~--I-J:= ---- \ , -- \ , " " ~~ \. ~ '(9
<t- \ ''\~ '/
• , ~;. ~ ~\~ "0 ',~~ ... \: 0 ,CP ~. <t- :::i \
, ~ '\~<> ~ b 0 \ ~ <t- \.
(/) \ '\ ~
8 in.
10 in.
\ ~.
~ \ ~ 4
~ \ " ! , " -400 -200 o +200 +400 +600 +800
• I -Compression Tension
Unit Strain X 105
FIG.41 MEASURED STRAIN DISTRIBUTION
FOR AN OVER-RElNFORCED BEAM

4()1
32
U) 2 0-
G "r
.-~
c:
"0
~ 16, ..J
o +-
~
8
!
-_._-.- ----
Q = 28.2
fse = 107.8 Dynamometer on
/ Wire Failed d = 9.11 in.
V ""--- C)
~ /" 1"-V ~ ~ .. 4 Bond Slip ove r Secondary Compression
_Full Len(Jth of Wlr~ Fa lIure ,; . I I ~
(- I I , -First Crackln9
Noted . c{
/ 00 0.5 LO 1.5 2.0 2.5 ·31.0
Mid - Span DeflE~ction in Inches
FIG. 42 LOAD - DEFLECTI()N CURVE FOR B -- I f-J -..l CP

40
I
32
., 24 Q. .-~
c Steel 8ecom ing First .--0 16 0 0 ...J
Inelastic 7 Crushing7
v / ,l 1/ I '<:-1--- .
---~T 0 .... 0 l- e r V 0
- First Crackinq One Hour~ Noted Delay
I
I
°0 0.5 1.0 1.5 20 2.5 3.0
Mid - Span Deflection In Inches
FIG.43 LOAD - DEFLECTION CURVE FOR 8-2
Q' = 13.3
fse= 116.8 ksi
d = 9.53 in.
I
i
Secondary \ompression
Failure I
~~ I 0 !
I 3.5 4.0
f-l --.:j \D

4 ,
3
• .~ 2 It:
c -~
CJ 16 o ...J
., .... o I-
8 ,t-
00
/
vF,lrst Cracking Notedl
(cFlrlt Crushing
{
P I .--.. .--
~
0.5 to 1.5 2.0 2.5
Mi d - Span Deflection In Inches
F1G. 44, LOAD - DEFLECTION CURVE FOR
Q' = 8.7
fse = 120.0
d : 9.62 In.
1
I
Wire Fract~
Z One Wire I -- Remalnl~ .. t---.....
:::;::::.. 1/
3.0 3.5 4.0
B-3 I---l CP o

• Go .-~
c: .-"G a 0 ..J
a ... 0 t-
40 Q' = 37.7
fl. a 113.9 kll
d • 9.19 In.
3e
24
8a I aft c:;;l N.arl, T.nlton - Shear
I
I
Fallur'2~ First __
1---_, 0 /' ! CNlhlnQ ~-1 ~ ---
16
V ,
!
/ I
I- o FI rlt
- CracklnQ Not.d
r I
e I I
i
I J
I ----L------- .... _~ ____ ~----.-
00 0.5 1.0 1.5 Mid-Span Deflection in Inches
FIG. 45 LOAD- DEFLECTION CURVE FOR B- 4
40 Q' = 28.5
fse = 114.1 kal
d • 9.33 In.
32 Nearly Ba lanced
'" Tension - Shear ~ Failure
'" • Go ~24
c:
~ ~,
~~ ~
V / Stetl Btc omlnQ
/ Inetastlc .-."
~ 16 ....
~ / i-~Flrst
Crac klnQ Nottd
a ... 0 l- e
00 0.5 1.0 1.5
Mid - Span Deflfction in Inches
FIG.46 LOAD - DEFLECTION CURVE FOR B-5
0
I
I
2.0
f---I CD f---I

40 Q' = 70.3
fse= 116.0 ksl
tJ = 8.12 In.
32
., Nearly Balanced A. '-~ 24
c '-
o Shear- Compression l--, Failure
V ~ , I
~First Crushing /~
" a / 0 16 ...J
0 .... 0 l-
)
f ~Fir:st Cracklno Noted
1 S
I ~
°0 0.5 1.0 15
Mid - Spain Deflection in Inche.
FIG. 47 LOAD-DEFLECTION ':UR~vE FOR 8-6
40
32
41) CL
~24
c:
" a ~16
a +o I-
8
o
Q' = 59.5
0 fse = 112.8 ksl - ~Com pression
d = 8.09 In. ~ Failure /
/ L
/ l or l.--"First Crackino
Noted
I J
o 0.5 10 l5
Mld- Span DefleCTion in Inche.
F\G. 48 LOAD -DEFLECTION CURVE FOR 8- 7 }---J
en I\)

40 I I
Q = 89.8
I f = 112.~!3 ksi
Compression se
d = 7. 9~:~ In. Fail~
L~ ~ 32
• Q. .-~ 24
c:
/ V First ~
Crushinv
/ I
"V 0
16 0 ...J
I f:~irst CrackinQ
Noted
<1 I
a .. 0 ....
8 ~- -+-- --- +-- ---- ------- ---- -
00 0.5 1.0
Mid - SI:)On Deflection in Inche.
FIG.49 LOAD - DEFLECTION C:l.JRVE FOR B-8
40 Q' = 25.2
f = 19.1 ksi se
d = 9.23 in.
32
r- First Crulhin CJ
Steel Becominv .... .,
I> -~
.... ,'---Inelastic
"" I'
24
V Secondary Compressio~ V Failure II
V ./
V ./
~ vFirst Crocking
Noted
8
°0 0.5 1.0 I.~
Mid - Span 0 efl.ction in I nche.
FIG. 50 LOAD- DEFLECTION CURVE FOR 8-9
20 2.5
t-I (» ~

., Q.
~
c
4 0
3
2 ,
" a o 16 ..J
a ... ~
8
First Cracking
Noted7
/ V
if------~
o 0 0.5
FIG. 51
------
/ Steel Becoming
.I r-T
1.0
Inelastic
,~ •
1.5
Mid- Span
/
/.First l/ Crus h inCJ
2.0 2.5 3.0
[)eflec t i()n in Inches
LOAD - DEFLECTIION CURVE FOR
Q' = 9.6 ~ !
I
fse =19.0 ksi
d = 9.01 in.
Wire
Fractured 7
]
3.5 4.0
B -10 !...l CP +:-

." Q.
~
c
" a o
....J
a +o I-
4 0 Q' = 35.0
fse = 20.4 ksi
d = 9.21 In.
3 :~
'\ First Crushing
~ Secondary n
2
/ I--T --~ ~~ Compression / , Failure
c/ L ~ Steel Becomln~ ,
V Inelastic
V 16
~ 7- First
Crocking Noted
8
~ 0
0 0.5 1.0 1.5 2.0 2.5 3.0 35
Mid - Span Deflection in Inches
f=IG. 52 LOAD - DEFLECTION CURVE FOR B - II f-J eX> \Jl

40 O' = 57.4
fSf = 20.4 ksi Compression )\
d = 8.33 In. Failure 0
\ 32
/\ ., Q. .-~ 24
c: .-
First Crushing VV ~
/ ~ a 0 J6 .J
0 t-o ...
8
/ 0/
V
V /
i- First Crocking Not@d
J
o ~ o "5 1.0 1.5
Mid-Span Deflection in Inches
FIG. 53 LOAD - DEFLECTI()N CURVE FOR 8··12
40
32
24
16
8
o
Q = 56.5
fse= 21.2 ksi
d = 8.15 In.
compressl7 Failure
v 1-/
~ V \.
/ V ~ First
Crushing
VV V ~ vFirst Cracking
Noted
~ a 0.5 1.0 1.5 20 Mid - Span Deflecti on in Inches
FIG. 54 LOAD - DEFLEC TION CURVE FOR B -13 !--l
CD 0'\

., Q.
~
c:
~ a o
~ 4C:
I . 3~:
~ 2 .. 1J
..J IE,
o .... o ~
8
o
/}
~ ~ r~ 'oui'
/ V
/ V l--Flrst Crock
Not ed
''''''''''',-,--
0.5
FIGI. 55
Fi rst
crushing;
~( V Compression 0 Failure \J
/' ~
/ [7
I \ ........ .==
1.0 15 2.0
Mid - Span Deflection in
LOAD - DEFLECTION
, Q = 78.9
f = 20.2ksi se
d = 7.99 In.
2.5 30
Inches
CURVE FOR 8-14 !--l ex> --.1
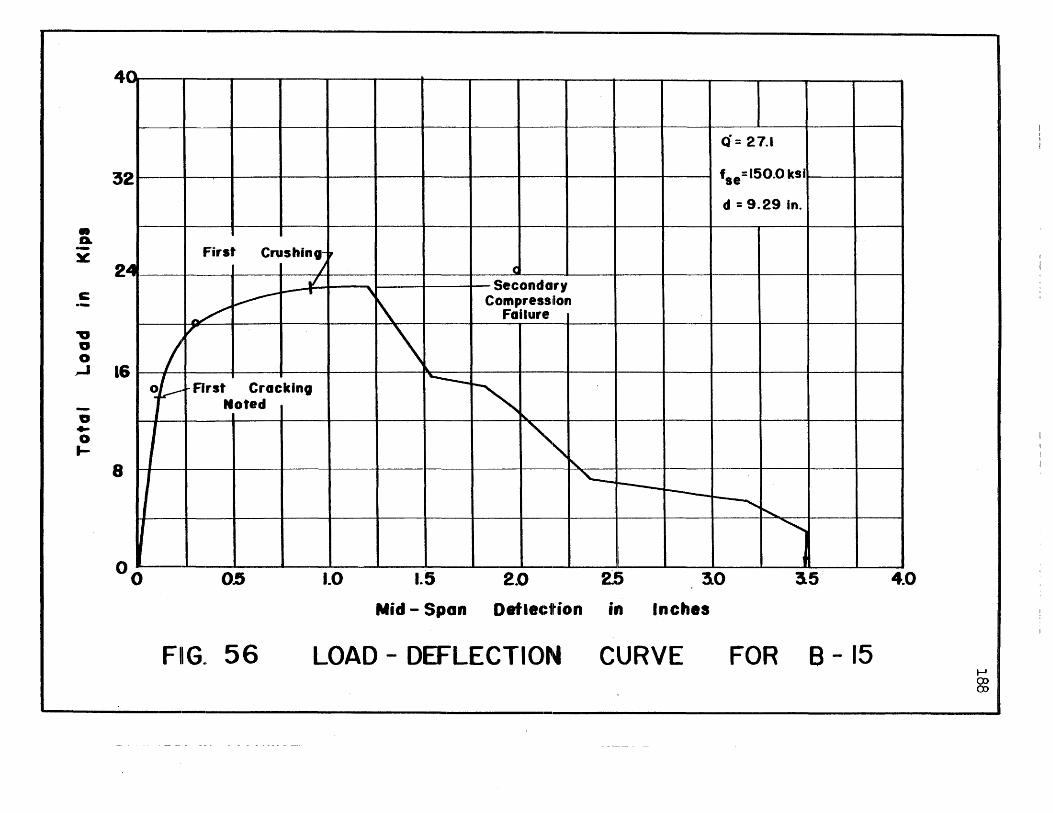
• D. -~ c:
." o o
4 _.
32 _.
2 4
/ or-'
~ 16
" .. o ....
8
'---.
°0
First Crushinl-' J
.t V--- .
~ r
Arst Cracklna Noted
O~ 1.0
ci = 27.1
fse=150.0 ksi
d = 9.29 in .
(
Secondary ,
" Compresslton
Failure
\ "----~~
", " ~
"--~ r----~
! ......... ............
1.5 2D 2.5 3.0 35
Mid - Span Deflection in Inches
FIG. 56 LOAD - DEFLECTION C'URVE FOR B - 15
4.0
l-' ex> ex>

,40,
I~ 3
., .~ 2 lie
4
c:
-a CJ o ..J
a .... o ...
16
8
n~ T
II o -
I I
I
i
i
!
1/ Fir sf Crockino i{c Flrs1 Noted ; Crushino
I
! II
---
-- .... -
Mid - Span· Deflection
FIG. 57 LOAD - DEFLECTION
1 Q'=IO.O j I fs~=150.3 ksl
, d -9.00 in.
-:
I
-I I !
~ Wire
1\ Fro cfured
\ -t
- o in Inches
CURVE FOR 8-16 I---' CP \.0

en .go ~
c:: -" CJ 0 -I
a <t-o t-
40 Q' = 32.3
fse = 151.0 ksi
d = 9.09 in. 32
24
Steel Becoming r First Inelastic l / Crushing
~ ./ a
~ -.
1"-
16 ·V r "Seeo ndary
C om'presslon I Failure
of-~Flrst Crocktng
Noted
I I
8
~ 00 1.5 0.5 1.0
Mid - Span Deflection in Inches
FIG. 58 LOAD - DEFLECTION CURVE FOR 8- 17
~ a. ~
c
" 0 0 ...i
a +-0 I-
2.0
40 , Q = 52.4
fs e= 148.8ksi
d = 8.29 in. 32 Secondary
Compress ion Fail~re
0
24 ~ ~'"
/ ~teel " Becoming
Ine losti c
16
o V
J Of" i'-First Crocking
Note d
a I I ~ \
°0 0.5 1.0 1.5
Mid - Span Deflection in Inches
FIG. 59 LOAD-DEFLECTION CURVE FOR B -18 f-l
\0 o

• Go ~
c
" o o
4 n
32
2 ~
f First Crushing and 1 Q = 53.2 Steel Becoming
fse= 151.3 ksl Inelastic 1 I
LV !
d = 8.27In. / ~ V'\ I
./
/ V '~arIY Balanced
Tension - Compression <! Failure .. Q. .-~
oj /First Cracking Noted
c
" 0 I I
0 ..J ..J 16
o .... o .... I
I 8
~ 1.5 °0 0.5 1.0
Mid - Span Deflection in Inches
a +-
~
FIG. 60 LOAD-DEFLEC-rION
CURVE FOR B - 19
40 Q' = 23.6
fse =118.6ksl
d = 9.27 in. 32
24
16 ""'- First Crushtn9 ~ I
~ t-- ~Bond
~ - ~ ./."
l,.---- Failure
01 ~
I First Cracking r Noted
8
~ °0 0.5 1.0
Deflection
1.5
Mid- Span In Inches
FIG. 61 LOAD-DEFLECTION
,CURVE FOR 8-20
0
20
I-' \0 I-'

40
32
CI)
a. .-~ 24
c: .-." 0 0 16 -.J
Steel Becoming ,ne,astic1l
r-( V
/" 0 +-0 t-
8 -f V VFirs,t Crackino
Noted
7 ~
- -- 1I 00 1.0 1.5 ().5
Mid - Span
FIG.62 LOAD - DEFLECTION
Q' = 16.7
fse= 118.0 ksi
d = 9.05 in.
I
/c First Crushing (~
1/
"'-I --... Sec ond ory Compression Failure
2.0 2~5 3.0 3.5
Deflection in Inches
CURVE FOR B- 21
4.0
!--J \0 f\)

fI)
Q, -~ r:: .-~ tJ 0 ...J
10 ... 0 ....
40 Second a ry
0' : 29.6 Compress ion Failure Z
fse =115.2ksi
/ V
d = 9.13 in. 0 - ~
/--- 10- il V 32
24 / ~Steel Becoming
Ine lasti c
7 16
V v-First Cracking
! V Noted
o{ I
8 I
00 0.5 1.0 1.5 Mid - Span Deflection in Inche~s
FIG. 63 LOAD - DEFLECTION CURVE FOR 8-2:2
2.0
40 '" Q': 47.1 V~ ~ /
fse =117.3 ksi V ~ d = 8.20 in. / ~ V Nearly Balanced· ~
Tension -Compression j Failure
32
7 V 24
/
ot I--First Cracking Noted
/ 16
8 J
1
I --
°0 0.5 LO 1.5 Mid-Span Deflection In Inche.
FIG_ 64 LOAD- DEFl_E.CTION CURVE FOR 8-23
I
,
I-' \D \.N

--Go .-~
c:
." a 0 ..J
a ... 0 ...
40 I Q" = 46"~
32
fse = 116.,4 ksi vc First d = 8.24 In. Crushing
/ ~ 0
/ V-Y ~~
~
24 V Nearly Bolonced~ Tension-Compression
Failure
)/ II
16 / Of .fiirst Crocking Noted
S J
! L. I o 0 os 1.0 1.5
Mid - Span o.flection in Inche.
FIG. Ei!:5 LOAD-DEFLECTION CURVE FOR 8-24
~ Q.
~
c: -"" ., 0 ..J
a .... 0 l-
40 (j = 60.5
fse = 114.5 ksl
d = 8.01 in. I
Compression 32 Failure 7
24
First ! I
Crushing "' r'-. ~ "\
1/ ; I
16 1/ I
~ First. Crocking Noted
,
'1 e J
I I
I
~ o
o 0.5 1.0 ~
I.~
Mid - Span Deflection in Inche.
FI G. 66 LOAD- DEFLECTION CURVE FOR 8-25
-i"T.l.r",-.-.=..;;..~.~~..:...:...·.-,,-'>.~J:.'7l."~I':~:::::;;~::;:~:'·_~-n::ro ... ·..:.a:;.·~_ ... ~o;,-.. ~:_l .. :-;:_:-:.:r.:c:r.:::.-=-~"'41"==.;>;.\x.::.~=r02=r.:==-:.u:--~=.=z-===\':r....::~-.:~xz.L.;G
f-I \0 +

I ,-~
c:
" a 0 ...J
a ... 0 l-
40 I --
o z 79.2
f. e =1I6.5ksi -.
d: 9.27 in.
32 Beam InUlaUy Cralcked on Top and Bo'1roml
I
I
24
~ Fh~lt Crushlnv I ~ J
'-...... ~C()mpr.sllol"1 I
[:>-----K 16 /' Failure
JII"
/ V \
f\ S
IV \ [\
/ I ,
~ I
I 00 0.5 1.5 1.0
Mid - Span Ol.flection in Inch.s
FIG. 67 L_O~AID· DEFLE(:TION CURVE FOR 8-26
2.0
to G. .-x
c: -"'G a 0 ...I
o .... o ~
40 Q' = 69.2
32
fs e = 118.0 ksi .. /compreSSion .
d = 8.36 In. V'\ fa Ilure,
1/ ~~ \ I. I· r--....... Firs' Crushlno
24 / 0 /
J
16 of vFlrst Crocking
Noted
I I I
8
~ 00 0.5 1.0 1.5
Mid - Span Deflection in Inch ••
FIG.68 LOAD -DEFLECTION CURVE FOR 8-27
j--J
\0 \Jl

01
'~u
0.40 I I I I I
Nominal Prestress = 20,000 psi
Beam Q l' c - - -0.32 8-14 B-IO 9.1 3530
-- ---.-
r /
B- 9 19.8 6330
B-13 B-II 32.1 3910
0.24 / V /~ 8-12 47.0 5550
~ B-13 52.5 3750
/ V / / B-12 8-14 73.2 3755
/ /" Type r Reinf.
0.16 V/ V V ~ " ,8-11
I h V/ ~ V
B-9
0.08 i ~ "/ ,.,-----~
./ ~
~ ~ V-/ ----~ IV _ V--
o ( -
o 0.5 1.0 I.S 2.0 2.~ 5.0 5.S Mid -Span O,fl,ction in Inch,.
FIG. 69 MOMENT-DEFLECT'ION CURVES FOR BEAMS WITH VARIOUS VALUES OF Q: SERIES 2
d -9.01
9.23
9.21
8.33
8.15
1.99
I
i
I
8-10 -
4.0
I--' \0 0\

"
~0I1:g . ~ ...
Q5
0.4
Q.3 I
I Q2
/ /
V
// v;: I ij
V
f; I V L
I I I I
Nominal Prestre~.s = 120,000 psi 8-8
/
8-6
~ ~
~ 1\ 6-25
8-7
k-": B-24
k-----"'" l-~ L...--- 8-23
Beam Q l' c d - - -8-3 8.1 3760 9.62
8-2 10.9 5420 9.53
8-20 21.8 3820 9.27
8-23 345 8200 8.20
8-24 36.6 6115 8.24
8-7 47.8 5910 8.09
8-25 58.8 3270 8.01
8-6 70.7 2950 8.12
B-8 87.2 3280 7.99
VI V..-0 ::::: ~ Type II and m R~inf.
o. I
o o
Vj ~
V ~ ----~
0.5 1.0
_ 8-20
B-2
- - - 1- -1""--1.5 2.0 2.5 3.0 3.5
Mid -,Span Cleflection in Inches
FIG. 70 MOMENT-DEFLECTION CURVES FOR BEAMS WITH
VARIOUS VALUES OF C) SERIES AND 4 '~
a. ,.. .,=~,~.,~
B-3
4.0
!-l 'D --..1

oa
2/:U
0.40 I I I I
I
Nominal Prestlress : 160,000 psi
8eam Q f' d ~ -0.32 8-16 9. 7 3330 9.00
8-15 22.0 5710 9.29
8-17 28.1 4580 9.09
0.24 ~
8-18 8-19 42.1 6225 8.21
/ 8-'18 47.3 4100 8.29
/ ~
~ ~ ,8-19
~ Type I Reinf.
0.16 / V/ 8-,17 ~ t-"""
It V ~
~ ~ ~~ ..--
0.08 If V ......
"'- 8-15 -I
rJ 8- 16 r .
J
~ o 0 0.4 0.8 1.2 1.6 2.0 2.4 2.8 3.2
Mid-Spa"l Dlfllctlon In InCMI
FIG. 71 MOMENT- DEFLI::CTION CURVES FOR BEAMS WITH : SERIES 3 VARIOUS VALUE~) OF Q
t-'
'&
.. ------------,----------------------------------------------------------------------------------------------------------..

.. 2f-U
Q20 8 No. p f' q Ec fr ~ Wires ~ ------8-20 5 0.00278 3820 21.8 3.95 495
8-5 8 0.00431 5650 23.2 5.10 805 0.1 5
BM22 10 0.00561 7630 22J 5.99 110 .---~--l------
fsi = 120,000 psi ,..,.--~ -----~
~
~ ..... -
~ b.--:= I----~ + ~ ~ L -~ ~ ~ ~ ~ ./
0.1
---
.~ / V·
Ii ~I 0.08
004
[1 1/
~I o Measured
~~. o 0 0.6 0.8 10 1.2 0.4 0.2
Mid - Span Defllction in Inchl'
FIG. 72 EFFECT BEAMS HAVING
OF ~VAR'ATIONS I ~J P AND AB()UT THE SAME:: VALUE
8-5 - 1 8-22
t 8-20
Crocking Load
f ' c
1.4
OF FOR Q
I
I
I I
1.6
1--1 \.0 \.0

~--------_---,--------,------------------------.--------------------------------------~
P
P"'GI
1.0 ,.--' ,.,-- -------
8 .. 15 ~~ /
.----- ~ ;7 ~ .W" ./
o / / ~'5 / ~
G WI I V VS-9 / / /
II V /
• / »
V V o
~ /
/ o
! /'
~'
o !
0 Observed Crocking Loold
• Load at which steel stress = I fy I I I I o
o 0.4 0.8 1.2 1.6
Mid - Span Oefl.c'tion
FIG. 73 EFIFECT OF PRESTRE,SS 13EAMS 8-9 , 8-5, ,AND
--
I
I i
!
j tse f~ "f pe '
Beam Q d f(einf. I -- -- - -- - __ I
B-9 19.1 19.8 6330 9.23 I I
8-5 114.1 23.2 5650 9.33 n B-15 150.0 22.0 5710 9.29 1
2.0 2.4 2.8 3.2
in Inchl'
ON DEFLECTIONS, 8-15 [\)
o o
~------------------------------------~-----------~------------------------,--------------------------------------------------------------------~

_ _~_~.~c~· ·~~~--""~~L_' __ ~ ___ ~_r _______________________ -. 1.0
~..-----~ ~ ~
~ ~ /" L ~
V ,." v v ..... v
/ ~ ./
II / V8-7 V /
0.8
P -P",ox
( / ~ ,/
L
II v v ......
r v , Type
/ 8eam ~ _Q_ ~ --L Reinf.
J 8-12 I
/ V 20.4 47.0 5550 8.33
V B-7 112.8 47.8 5910 8.09 n
0.6
0.4
I~ V 8-18 148.8 47.3 4100 8.29 1
V J
0.2
~ 0 Observed Crocking Load
• Load at which steel stress =1 fy o 0 0.2 0.4 O.E; 0.8 1.0 1.2 1.4
Mid - Span Deflection In Inch ••
FIG. 74 EFFECT OF PRESTRESS ON DEFLECTIONS , BE AM S B-· 12, B -7, A NO B - 18
I
I
I
1.6
f\) o t--I
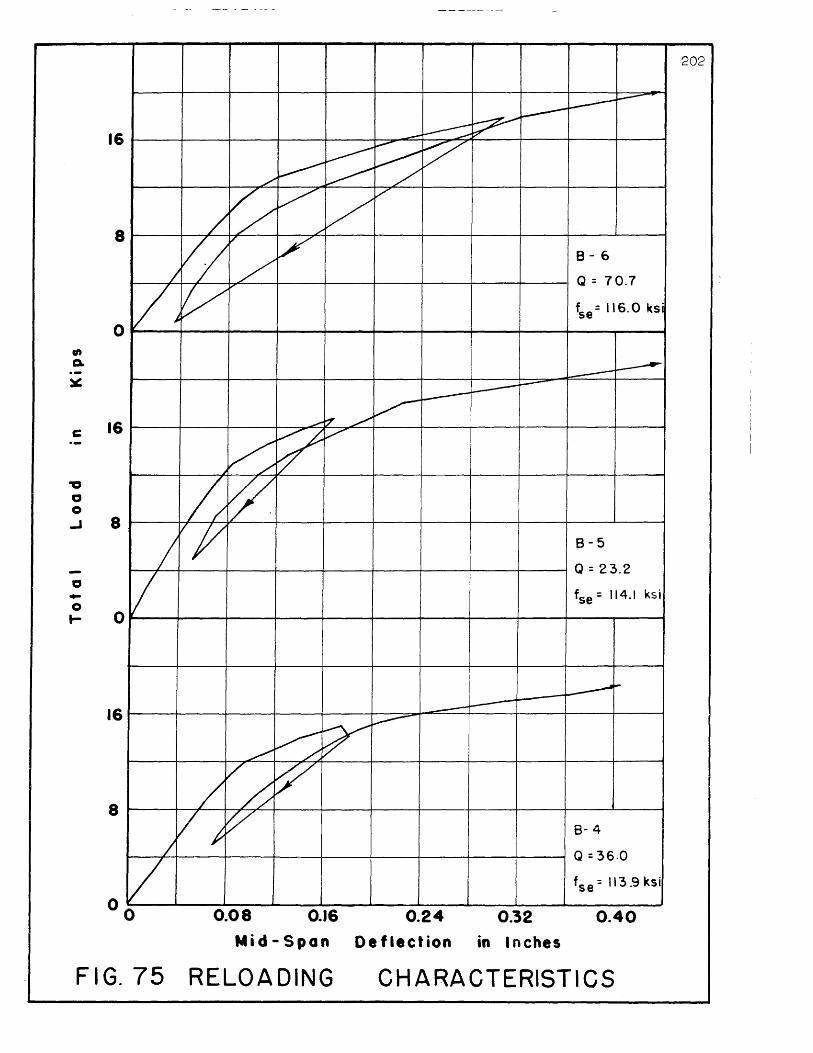
202
~ ~
~ ~
16 -~ ~ / V ~
~ ~ /'
~ V V /'
/ ./' 8
V/ v v L
8-6
/ Q = 70.7
/J V fse= 116.0 ksi
0 CIt Co
~ ~ .-~
~ ~
~ ----b"./ 16 ~
c
b2: V .- ,V "0
~ ~ 0 0 ..J 8
'}/ / 8-5
Q = 23.2 -V 0
fse = 114.1 ksi .. 0 t- O
~ -L-----~ ~ ~ 16 .----
~ ~ V /
V V ~ 8 V j
~/ B- 4
I
0/ Q = 36.0
f s e = 113.9 k s i
0 0.08 0.16 0.24 0.32 0.40
Mid-Span Deflection in Inches
FIG.75 RELOADING CHARACTERISTICS

P
Pmax
1.0
0.8
0.6
0.4
0.2
o
L t I I j I
~ ---/
~ f----.
---~ A
/ !
/
/ I
8-21
1-~
~ ----L----
------~- \ , Beam
1\ ku
\ f' ~-
P
\ fy
P,nax
) fse
d
/ V
/ II o Observed Cracking
Load
o 0.4 0.8 1.2 1.6 3 2.0 2.4 2.8 ~ Yc x 10
FIG.76 COMPARISON 8IETWE:EN PRESTRESSED AND ORDINARY BEt~MS: B- 21 AND TILb '----------------
~ .......... TILb
B-21 TILb
0.127 0.136
6560 2520 I
----M2-l 0.28 ------- -
219.8 46.0
16.34 12.94
118.0 -9.05 10.72
3.2
CONCRETE f\) o

Beam 8-5 T2Lb
1.0 ku 0.220 0.220 ---- \ f' 5650 244O,
~ ~ ~ c
---" P 0.44 0.97 !
! ~ \ fy 219.8 55.4
1\ Pmax 26.77 19.39
I ~ fse 114.1 -\.T2 Lb d 9.33 10.65
0.8
P 0.6
Pmax
/ ~I ~ r-----j JV \ I '\
~ I
, r---.-1-- ........
I ...
. I{ i
0 Observed Crockin 9 Load
0.4
0.2
--
o o 10.4 0.8 1.2 1.6 3 2.0 2.4 2.8 3.2 A~~ It 10
FIG. 77 COIMPARISON BETWEEN PRESTRESSED AND ORDINARY CONCRETE BEAMS: B- 5 AND T2LB
f\)
o ~

p p max
1.0
0.8
0.6
0.4
0.'2
o 0
FIG. 78 AND
/ I I I
I 1/ V
~ ---- \ 8-'~1 11 \
VI \ \
\ \
/ \ \
-'1 IT.3Mb
\
\
\ \
\
o Observed Crackino Load
0.4 Ad/2 0.8 3 /C )( 10
\
\
\ ,
8eam IB-IS T3Mb
ku 0.365 0.365
f • c I!l~ 100 4110
P 0.65 3.22
fy ~~06.7 41.7
Pmox ~~4.98 40.73
fse 1148.8 -d IB.29 10.37
1\
\ _\
\ ,
~
-' \ \ \ \
1 1.2
COMPARISON BETWEEN PRESTRESSED ORDINARY CONCRETE BEAMS :
8-18 AND T3Mb
Beam B- 8 T5H
I- \" 8-8 ku 0.612 0.620
r;J H--~l f~ 3280 5900
P 0.95 2.22 j/ fy 209.8 40.6 .-
Pmox 32.35 5703
III fse 112.9 ---d 7.99 9.23
/ / T5H ---
I II / I /
'/ l - ---~. o Observed Crackino Load
o 0.4 Ad 2 0.8 3 YL.: x 10 1.2 1.6
FIG.79 COMPARISON BETWEEN PRESTRESSED AND ORDINARY CONCRETE BEAMS: 25
\.J1
8-8 AND T5H

40
i
I
I
i
32
I
." Q.
~
24
c /
'0 0
16 0 .J
'/ -0 ... 0 ... 8
ry '(
~----
00
FI G. 80
Beom p Q E. X'lcY fse 0 Observed Cracking Load S8
B-7 0.942 47.8 376 112.8 ,
8-24 0.746 36.6 388 116.4
8-25 0.641 58.8 382 114.5
/ 8-21 0.284 13.0 393 118.0 8-7 v / 8-24 Type II Reinf.
// V -----f--." .----- I
----- j
V ~ .-----
// ~ 8-25
/ /' l.---- -r"I""'" -- --V/ V--~
./ ~ --
V ,.......... --.. ---~---~- ---
V/ ~
B-21 --~~~- ---.---~- -- - .. - - - - .- - -_.--- ----- I-- ...
----~ --~ f---------- ----,,-----~-
1------~------ ---"------- - --- ----- -----".- ------- --- -- .. ,,-- ---._-- ---- - ----- ------.- - ---_ ..... -- ------ ----.-
-------1· ------ -_.- _.- --- ------------ ---- ------ ----------~~--f------ r------- ---------- ----_._----
100 200 300 Steel Strain Due
TYPICAL APPLIED
400 500 To App I ied Load
LOAD VS. STEEL
600 s
x 10 700
STRAIN
800
CURVES :)',
o

.. a. .-~
4 r:
35
30
25
.~ 20
~ o o ..J 15
-o .. o t-
10
5
o r o
Y
_ 8-23 " /"
V /
V 8-27 "
/ /'" "
/ / v"
/ /V
/; / 8-5 ~
/ ~
/ / V 8-6
V ~
A
II VI / V
/// (/ V 8-26 ---...---
l VI V ~ ~
./
II v/ V
ift V
V
Nominal Prestress = 120,000
100
Average
200
Concrete
300
Strain on
I
.--. .---.. --Beam f~ - -8-26 1270
8-6 2950
8-5 5650
8-'27 4590
8-23 8200
psi Type II Reinf.
400 500
Top Surface 5
x to
FIG. 81 TYPICAL LOAD VS. CONCRETE
STRAIN CURVES
207

In o )(
500
~ 400
,.
c 0 .. .. 300 (/)
., .. • ~ 200 c o (,)
• .. a e .. :)
100
0
; I
i
I I
I I I I
C>--
I I I
I I 0
A 00
Average = 0.00340 J
I I I
I ! !
I------
:
! I
I
I
~--- I -~----- --
o 1000 2000 3000
Concrete
-FIG. 82 UL TI M A.TE CONCRETE
I
o 0
0 0 0 0 .-
V
0 IU
0 0
0
0 o 0 0
0
--_. --
I---- _ .. -.
- -
1-------- -------
- --- - - -~ --~--- ---4000
StrenQ1'h ,
5000 , fC
6000
psi
C()NCRETE, STRAIN Sl-REN(,TH
7000
VS.
0
0
I I
!
----
_L..- --~
8000
f\)
g

I I
I .. La.. 50 I Q. .-~
I .----;::?
V~ ! ....... I
:/ / ! / B-/ ./
c .- 40 -0 0 0
/ v V! ./'~
/ /" ~
B - 7 I
// v / / / ..J
." 30 • -Go a.
V/ / /{;2 /
/ v / /
c(
0 20 .. .,
V / /
~
! / :::J 0
10 .. c ., E 0 ~
I / V V o Measured Crackling j Moment
I 0
o 20 40 60 80 100 120 Measured Curvatures in Region of Constant
FIG. 83 MOMENT - CURVATURE DIAGRAM FOR OVER - REINFORCED BEt~MS
Beam Q !a - -
8-12 47.0 20.4
B-7 47.8 112.8
B-I9 42.1 151.3
------
140 160 t 5.1
Momen x 10 ,In.
TYPICAL r\) o ~
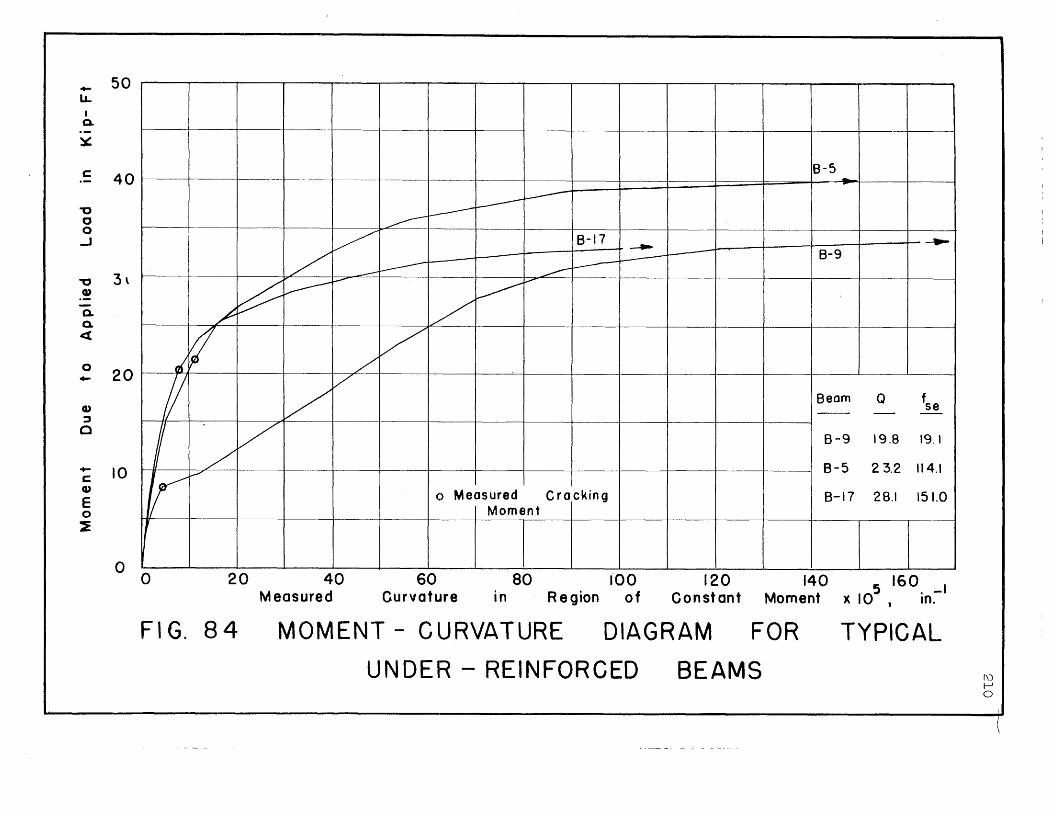
+- 50 LL
I 0-
~
c 40
"0 0 0 .J
"0 3, CD
Q.
0. <t
0 20 +-
CD :::J
0
+- 10 c CD
E 0 ~
0
~-- ---- t---------
V / ---
~ ------I-"""
L
ti ~ /
jI V V
I L~ V
.r v
I
o 20 40 Measured
~ ~
~ ~
- r---~ ~
~ ~
/ V
o Measured
60 Curvature
Moment
80 in
8-17
------~ -------
Cracking
100 Region of
~
120 Constant
8-5 --
----8-9
8eam Q fse -- -
8-9 19.8 19.1
8-5 23.2 114.1
8-17 28.1 151.0
140 Moment
5 160, _I x 10, m.
FI G. 84 MOMENT - CURVATURE DIAGRAM FOR TYPICAL
UNDER - REINFORCED BEAMS 1\) f-' o

100
~ Nominal Prestress = 160,000 psi
\~ ~ • (
.....
98
~ ~
~ -~ r-----r----- <:> r---- ~
96
• --t' ~ CJ) CJ)
. ~ 94 ...... CJ)
Average Curve cv '-
0...
0 ...... c: 92
...... 0
...... c Q) u '-
cf. 90
880 5 10 15 20 25
Hours After Prestressing
FIG. 85 . LOSS OF PRESTRES~3
~
• -v
Beam Symbol Q
8-15 X 22.0
8-16 W 9.7
8-17 .. 28.1
8-18 • 47.3
8-19 0 42.1
30 35
•
fsi 158.9
160.4
159.9
158.0
159.7
40
~
"
fse 150.0
150.3
151.0
148.8
151.3
I\) f-I f-I

It)
~
~
2.0
~ \
1.6
1.2
'---
0.8 I--
A ..... o .
o o
-
~ ~
~ _ l
~
0
112" 0
7 k k = 3000+~ f~
l ___ -9'-0"-I .. .,~~
~
-, 6
V I 5 1500+ fl -
C
I
~ ~ 0
-
~ - ~ ~
~ 0 ----0 0 0------ 0 0 --0.-.. ,.. ,...
0 U"~ ~ --~ 0
0 --0-
-- - - -
1000 2000 3000 4000 5000' 6000 7000 8000 Concrete Strength - f~ - psi.
FIG.86 EMPIRICAL RELATlONSHIP FOR k I k3 I\) f-l I\)

.J> ~
2.0
I !
i I
-. I !
~ ~ 1.6
, ~
\ Vi ~Wlre Fracture ~veroQ' Curv,
/
\ / liP 0 .... 0
L2
\ V 0 J--...,
I----j.---
12-----~'" ---- ~ '" () ~ , ........ ~ - v
0 0 r- 1"\ --- 0 0 0
0.8
0.4 ..
I- -
°0 0.5 1.0 1.5 2.0 2.5 3.0 3.5
Measured Depth to Neutral Axis J ku d , inches
FIG. 87 RELATION AXIS
BETWEEN kl k3 AN D DEPTH TO FOR FLEXURAL FAILURES
0
0
4!O
NEUTRAL I\) f-I \..N

N "'C ...c -~I
.P
.:Z "--'5 ~
0.5
0.4
B-I~
~ ~
~ ----~ ~~ ~ es-12
B~
0.3
0.2
~ ~
B-·n 0 Flexural Failures ~ • Bond Failures
~~ B - Balanced Flexural
/ ~B-9 Failure
0.1 V
V k2= 0.42
./ Eu = 0.00340
~ fse= 20,000 psi
/ Type I Reinf.
V ~ ....
k k - 3000 + fd/2 I 3- 1500 +f~
00 10 20 30 lEs P I
Q =-k1k
3f ~
40 50 60 70 80
FIIG. 88 COMPARISON OF THEORY WIT~i TEST RESULTS = SERIES 2
-
f\) j---I
+"

(\J
-0 .0
-'4-0 ,."
..=.::: ~
"--::J
~
0.5
I B-B ( I
T
___ ----I ~ ~ 0 ! PB-6 B-26 i
~ ;
8-25 B-27° ! I
: :
0.4
~ ~o B-7
8-24 ./' . I ' / "'0
8-23 I
/ i i
0.3
0.2 k;;
V
B- 5--c1 o Flexural Failures
~ AI • Bond Failures
~20 B - Balanced Flexural
Failure
~ ~
k2 =0.42
0.1 B-2~
B-:~' /
Eu =0.00340 I I
/' fse = 116,000 psi
I
V/ Type ]I Reinf. k k = 3000 +f~/2 131500+t;.
00 10 20 30 E p 40 Q
I __ S_ - I
k,k3fc
50 60 70
FIG. ~39 COMPARISON OF THEORY WITH TEST RESULTS SERIES I AND 4
80 90

(\J "0 ..c -~
rt') ~
~ ........
...: :; ~
0.5 -I"'"""
~ 8 ~ ~
/ ~
0.4
~ ~ -19
V 8-18
/ 0.3
0.2
0.1
~ V 0 Flexural Failures 7
~ 8- Balanced Flexural Failure
/ k2 =0.42
V V
€u =0.00340 /
8-16 ~ fse= 150,000 p.s.i. /'/
Type I Reinf.
V /'
k k = 3000 ~fi/2 I 3 1500 +fc
°0 20 10 3g,: Es p 40
k,k3fc
50 60 70 80
FIG. 90 COMPARISON OF THEORY WITH TEST RESULTS: SERIES 3 ",) ~-' ~.'\
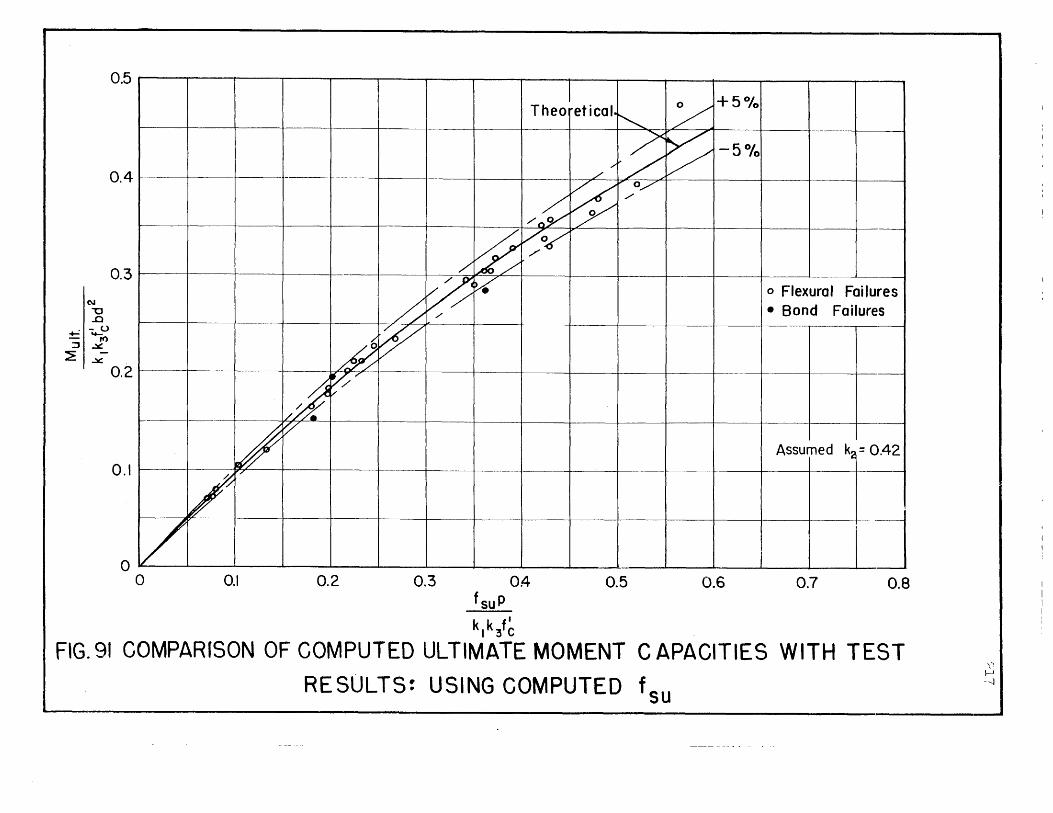
t\I "U ...c
±:: ....... rt)
:::J ...:.c::
0.5
0.4
0.3
'1- u ~ -...:.c:: .
0.2
0.1
o
._-
~ /#.
~/ v
~ V
./ ./
V o 0.1 0.2
I /
+5% Theo etical.
~ ::: ~ -5% ./
./
~ 0/
~ /'
/oy
~ vV ./
/
~ ~ o Flexural Fai lures
h • Bond Failures ./
~
Assumed k2 = 0.42
'= 0.3 OA- 0.5 0.6 0.7 O.B f suP
k I k3f~ FIG.91 COMPARrSON OF COMPUTED ULTIMATE MOMENT CAPACITIES WITH TEST
RE SULTS: USING COMPUTED f su \ ... ~ ---.)

.-(/)
d. I
0
X ~
-+-
'u .--+-(/)
0 -W
'+-0
(/)
::J
:::J "'0 0 ~
6 I I I I I I I I I I I I /f'1 ___ l//r I n I 1 5 t--I -~
,/ _/
~~--I~ /1/ 1 /'lo .1 / -() ~dlo ~~/y
4
3 yM;f?
/01 ~
I\EC= 1,800,000 +530 f~ 2
o 0 1000 2000 3000 4000 5000 6000 Concrete Strength - p. s. i.
FIG. ~~~~ MODULUS OF ELASTICITY OF CONCRETE
611X 1211 Control Cylinders
7000 8000 9000
f\) j---l
co

u; ci:
..:-ro
Q) '-::l ...... a. :::J
0::::.
t+-o (j') ::l :::J
""0 0 ~
1000 r---'
SOO
600
400
200
1----. o o
--0
1000
fr =450 + 0.0313 f~ \
\ 0 n
~ 0
~ --~ 0
o c 0 C
0
--I----
2000 3000
0 C)
,.. - ~~ ~ 0
10 u
4000
...
0 0
0 0 0 0 -0 00 ------~ 0
0 ~ ~ 0
0 L------ -~ .... 0 --0 o(~
0
6" X 6" X IS" Control Beams
5000 6000 7000 8000
Concrete Strength, f~, p,S. i.
FIG. 93 RELAT10N BETWEEN CONCRETE
MODULUS OF RUPTURE STRENGTH
AND f\) I-' \()

• I
I
X
• /
•
I • xl
• ./ x 0
I 0 I.
~
• / i. xl I
I
V' 0
J
• -; 0
-- ,/
/ / •
0 0 2 • ",
sd,,. - ·U! ~J!ODdDO
OU!qJOsq'1 ~6JeU3 SA !ID·I e~
.- ";; 'en ~ Q, Q.
0 00 0 00 o 0 .. 0 ...
.. ° ° o t\l (0 N --
\I \I .. ~;n .Jit.;..~
X • 0
0 -
paJnSOew
-
-
-
o CD
o po..
o U)
o 10
o ",
o N
o
0 0
220
(!) Z CO 0::: 0 en CD «
I >- I (!) I a:: I w z ~
w (
w > -...... « ...J >-W t-o::: (.)
« z a.. 0 «
(.)
0
lJ... 0
t-O W lJ... lJ... W
~ en <.!)
lJ...