0(˛/%+* + !*!-1˛/! -˛/ .’!(!/˛( )0 ... · es on muscle atrophy are influenced by the type...
TRANSCRIPT

220
Introduction
Both the mass and structure of bone tissues adapt to the me-
chanical loading of gravity and movement. Limb disuse due to
denervation causes musculoskeletal atrophy, together with
changes in structural and functional profiles. We previously
showed that trabecular bone loss and morphological changes due
to denervation start during the first week after surgery and grad-
ually decrease over the next three weeks1. Muscle mass also rap-
idly decreases during the first week after denervation to 50% of
basal control levels2. Transcutaneous electrical stimulation (ES)
is generally applied to patients undergoing physical rehabilitation
to maintain and/or recover mass and force in denervated muscles.
Some clinical reports have found that that direct ES to denervated
muscles in patients with spinal cord injury (SCI) increases mus-
cle mass and average fiber diameter3,4. Some findings of exper-
imental animals lend further support to the notion that ES helps
to limit denervation-induced muscle atrophy and improve muscle
force and recovery5-7, whereas other studies have generated con-
tradictory results8-10. Some studies have found that the effects of
ES on muscle atrophy are influenced by the type of disuse mod-
els and the nature of experimental regimens such as the intensity,
frequency and number of contractions11,12.
On the other hand, muscle contraction force confers mechan-
ical load upon bone tissue. Some studies have demonstrated
that even low-magnitude mechanical stimuli increase bone and
muscle mass in studies of disused muscles in humans and other
animals13-15. Therefore, ES-induced muscle contraction force
J Musculoskelet Neuronal Interact 2014; 14(2):220-228
Electrical stimulation of denervated
rat skeletal muscle retards trabecular bone loss in
early stages of disuse musculoskeletal atrophy
H. Tamaki1, K. Tomori2, K. Yotani3, F. Ogita3, K. Sugawara1, H. Kirimto1,
H. Onishi1, N. Yamamoto1,4, N. Kasuga5
1Institute for Human Movement and Medical Sciences, Niigata University of Health and Welfare, Japan; 2Kanagawa University of Human Services, Japan; 3National Institute of Fitness and Sports in Kanoya, Japan;
4Niigata Rehabilitation Hospital, Japan; 5Department of Physical Education, Aichi University of Education, Japan
Abstract
Objectives: We aimed to determine the intensity of muscle stimulation required to prevent structural failure as well as bone
and skeletal muscle loss after denervation-induced disuse. Methods: Seven-week-old rats (weight, 198-225 g) were randomly
assigned to age-matched groups comprising control (CON), sciatic nerve denervation (DN) or direct electrical stimulation (ES)
one day later [after denervation] with 4, 8 and 16 mA at 10 Hz for 30 min/day, six days/week, for one or three weeks. Bone ar-
chitecture and mean osteoid thickness in histologically stained tibial sections and tension in tibialis anterior muscles were assessed
at one and three weeks after denervation. Results: Direct ES with 16 mA generated 23-30% maximal contraction force. Dener-
vation significantly decreased trabecular bone volume fraction, thickness and number, connectivity density and increased trabec-
ular separation in the DN group at weeks one and three. Osteoid thickness was significantly greater in the ES16 group at week
one than in the DN and other ES groups. Trabecular bone volume significantly correlated with muscle weight. Conclusions: Rel-
atively low-level muscle contraction induced by low-frequency, high-intensity electrical muscle stimulation delayed trabecular
bone loss during the early stages (one week after DN) of musculoskeletal atrophy due to disuse.
Keywords: Electrical Stimulation, Muscle Force, Bone Volume, Disuse, Atrophy
Original Article Hylonome
The authors have no conflict of interest.
Corresponding author: Hiroyuki Tamaki Ph.D., Institute for Human Movement
and Medical Sciences, Niigata University of Health and Welfare, 1398 Shi-
mami, Kita-ku, Niigata 950-3198, Japan
E-mail: [email protected]
Edited by: S. Warden
Accepted 8 March 2014

H. Tamaki et al.: Electrical stimulation and bone loss
221
would help to prevent/reduce disuse-induced osteopenia be-
cause mechanical loading is a major influence on bone volume
and architecture16,17. Osteopenia of the distal femur and proxi-
mal tibia and the loss of quadriceps strength in humans with
SCI can be partly reversed by training assisted by ES at 25 Hz
for 24 weeks18. Dynamic muscle stimulation with mid-, and
high-frequency ES (>20 Hz) inhibited trabecular bone loss of
the femur in a suspension disuse model for four weeks19. Such
stimulation with 10 Hz was not examined in that study. The no-
tion that a higher ES frequency increases muscle contraction
force is conceivable because of the summation of twitch con-
traction20. Qin et al. reported that electrical muscle stimulation
between 1 and 100 Hz might generate nonlinear bone stress and
fluid pressure in bone, and that 10 Hz produces maximal strain
on bone, which helps to mitigate bone loss21,22. On the other
hand, electrical muscle stimulation at a cycling rate might gen-
erate muscle mass but it is not necessary to prevent bone loss23.
It would be important to explore the potential of muscle stim-
ulation with 10 Hz should be explored from the viewpoint of
reducing the volume of disused muscle and bone loss.
Skeletal muscle is also a resource for generating force. An ES
training regimen that would reduce structural and functional
damage in denervated muscle fibers might potentiate the anabolic
activity of bone tissue through mechanical loads on bone induced
by muscle force. We previously assessed the appropriate stimu-
lation intensity according to individual structural recovery of
skeletal muscle after denervation and found that high-intensity
(16 mA) ES retarded denervated muscle atrophy and up-regu-
lated the expression of insulin-like growth factor-1 (IGF-1)
mRNA24. However, this intensity of ES might adversely affect
the regeneration of nerve terminals and/or the membrane systems
involved in excitation-contraction (e-c) coupling which is the
physiological process of converting an electrical stimulus to the
mechanical activation of the contractile myofibrils. Conversely,
middle- and low-intensity (4 and 8 mA) ES regenerated mem-
brane systems involved in e-c coupling and nerve terminals, but
did not retard denervated muscle atrophy. This dilemma indicates
the importance of establishing the appropriate stimulation inten-
sity according to the individual structural and functional profiles
that are targeted for improvement. Similarly, whether the ES reg-
imen can prevent/reduce muscle and bone loss induced by disuse
is important for the development of clinical interventions.
Here, we assessed effective stimulation intensity according
to the prevention of individual structural failure and loss of
bone and skeletal muscle after inducing disuse by denervation.
We thus applied direct ES at three intensities of current to den-
ervated rat tibialis anterior (TA) muscles. We confirmed the
muscle force induced at these intensities and assessed the ef-
fects of ES on the atrophy process in terms of the volume and
architectural profiles of trabecular bone and muscle mass at
one and three weeks after denervation.
Materials and methods
Animals and denervation
Eighty-six male Wistar rats (CLEA, Tokyo, Japan) were indi-
vidually housed in standard cages under a constant temperature
(23±2°C), humidity (55±5%), and 12-h:12-h light-dark cycles,
and provided with CE-2 rodent chow (CLEA) and water ad libi-
tum. When they reached seven weeks of age (body weight, 198-
225 g), the rats were randomly assigned to the following groups:
age-matched controls (CON, n=15), and denervation without
(DN, n=15), or with direct electrical stimulation (ES, n=44). The
ES group was subdivided into groups that were stimulated with 4
(ES4, n=15), 8 (ES8, n=15), and 16 (ES16, n=14) mA. Basal con-
trol rats (n=12) were sacrificed at seven weeks of age. Tibiae and
TA muscles were collected from the basal group and from the
CON, DN and ES groups at one and three weeks after denerva-
tion. The rats in the DN and ES groups were anesthetized with an
intraperitoneal injection of sodium pentobarbital (40 mg/kg body
weight). The skin covering the buttock was cut on the left side,
and the sciatic nerve was exposed and separated from the sur-
rounding tissue. The sciatic nerve was frozen for 5 s with a stain-
less steel rod (5 mm diameter) that had been cooled in liquid
nitrogen1,25,26. This freezing procedure uniformly damages nerve
fibers, although they are more likely to become re-innervated
using this procedure compared to others, such as nerve crushing,
cutting or transection with a suture24-26. Neurectomy creates an
enduring model of leg disuse for situations where subsequent nat-
ural recovery is not desired. However, freezing nerves creates a
model of temporary disuse that allows complete immobilization
of innervated muscles for a specific period by temporarily dis-
abling peripheral nerve function, thus allowing observation of the
post-atrophy recovery process. We previously reported that tibial
bone loss continues for three weeks and recovers for ten weeks
after freezing the nerve1. All animal manipulations and protocols
proceeded in accordance with the guidelines presented in the
Guiding Principles for the Care and Use of Animals in the Field
of Physiological Sciences, published by the Physiological Society
of Japan. This study was approved by the Animal Committee of
the National Institute of Fitness and Sports.
Figure 1. Time courses of body weight of control (CON), sciatic denerva-
tion (DN) and DN with electric stimulation (ES4, ES8 and ES16) groups.
H. Tamaki et al.: Electrical stimulation and bone loss
222
Direct ES procedures
The day after muscle denervation, the TA muscle in all ES
groups were electrically stimulated by ES using Torio300 and
SEM-4201 electrostimulators (Sakai, Tokyo, Japan and Nihon
Kohden, Tokyo, Japan, respectively) with an isolator, and
paired silver surface electrodes (diameter 3 mm). The age-
matched control, DN and ES groups were anesthetized by
isoflurane inhalation (1.5-2.5%), and surface electrodes were
attached to the shaved anterior surface of the left leg only in
the ES rats. The left TA muscle was stimulated with an inten-
sity of 4, 8 or 16 mA at a frequency of 10 Hz and pulse width
of 250 μs, for 30 min per day, six days per week, for one or
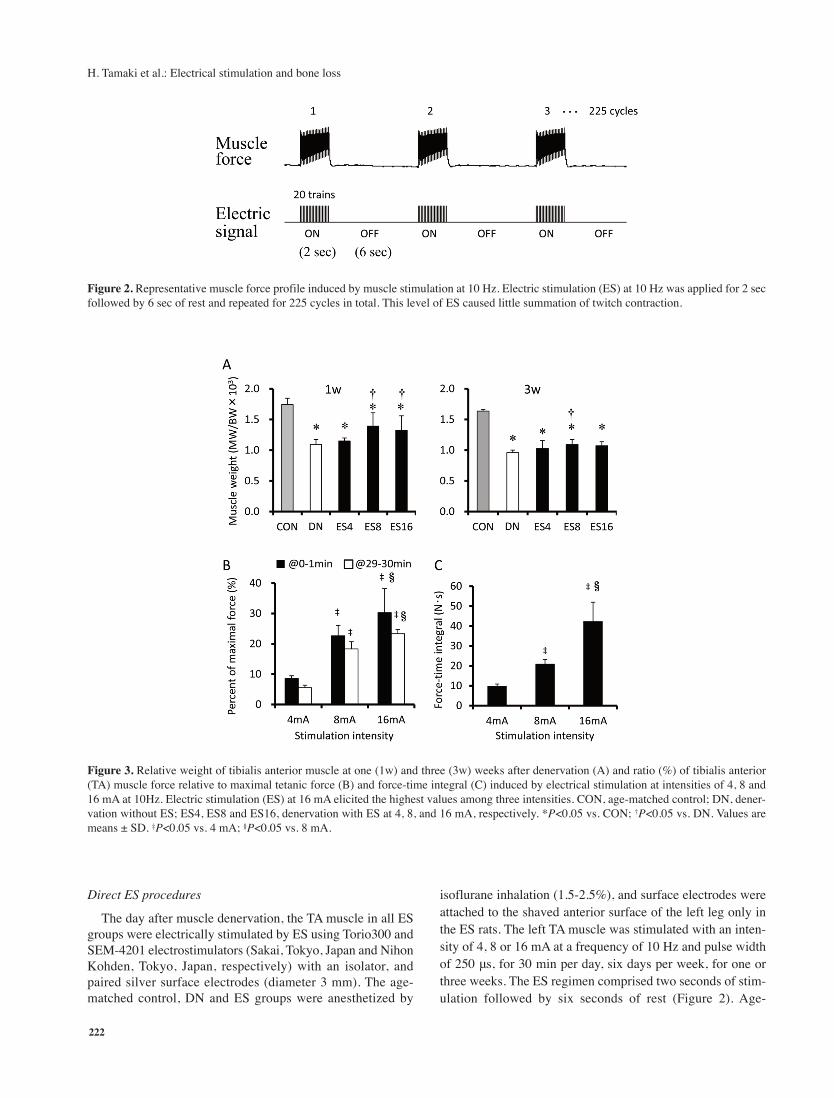
three weeks. The ES regimen comprised two seconds of stim-
ulation followed by six seconds of rest (Figure 2). Age-
Figure 2. Representative muscle force profile induced by muscle stimulation at 10 Hz. Electric stimulation (ES) at 10 Hz was applied for 2 sec
followed by 6 sec of rest and repeated for 225 cycles in total. This level of ES caused little summation of twitch contraction.
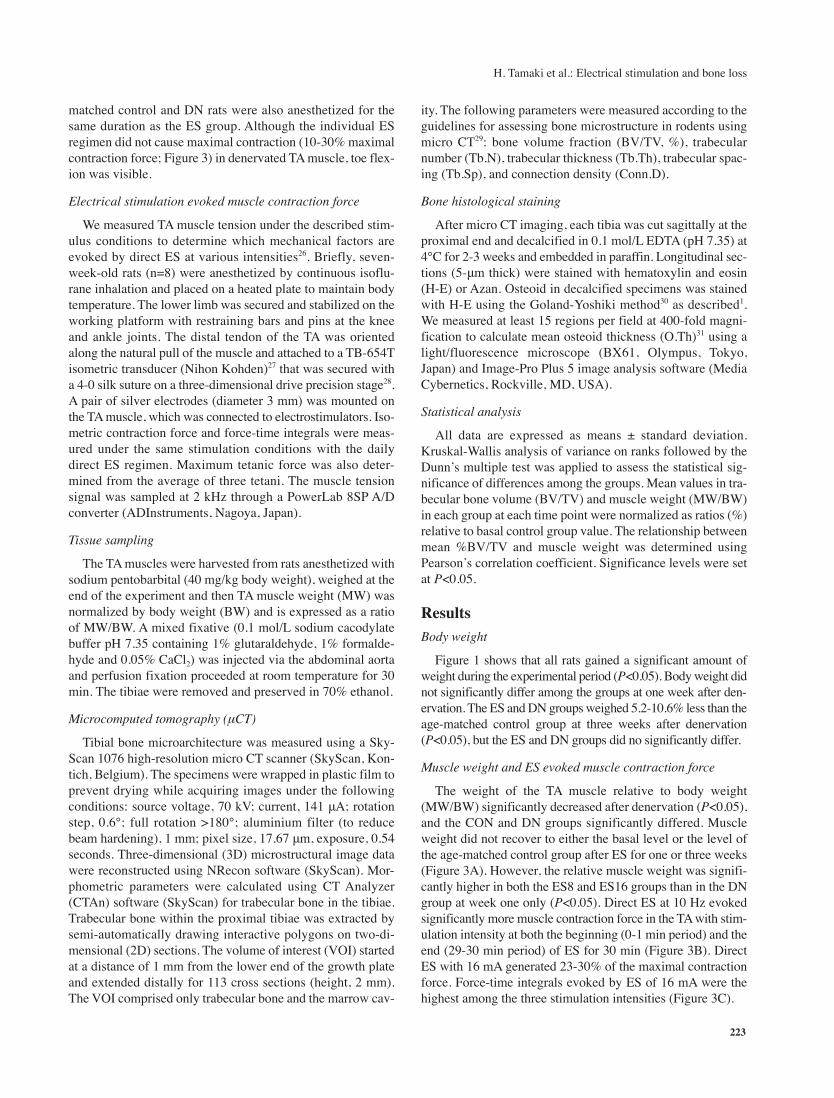
Figure 3. Relative weight of tibialis anterior muscle at one (1w) and three (3w) weeks after denervation (A) and ratio (%) of tibialis anterior
(TA) muscle force relative to maximal tetanic force (B) and force-time integral (C) induced by electrical stimulation at intensities of 4, 8 and
16 mA at 10Hz. Electric stimulation (ES) at 16 mA elicited the highest values among three intensities. CON, age-matched control; DN, dener-
vation without ES; ES4, ES8 and ES16, denervation with ES at 4, 8, and 16 mA, respectively. *P<0.05 vs. CON; †P<0.05 vs. DN. Values are
means ± SD. ‡P<0.05 vs. 4 mA; §P<0.05 vs. 8 mA.
H. Tamaki et al.: Electrical stimulation and bone loss
223
matched control and DN rats were also anesthetized for the
same duration as the ES group. Although the individual ES
regimen did not cause maximal contraction (10-30% maximal
contraction force; Figure 3) in denervated TA muscle, toe flex-
ion was visible.
Electrical stimulation evoked muscle contraction force
We measured TA muscle tension under the described stim-
ulus conditions to determine which mechanical factors are
evoked by direct ES at various intensities26. Briefly, seven-
week-old rats (n=8) were anesthetized by continuous isoflu-
rane inhalation and placed on a heated plate to maintain body
temperature. The lower limb was secured and stabilized on the
working platform with restraining bars and pins at the knee
and ankle joints. The distal tendon of the TA was oriented
along the natural pull of the muscle and attached to a TB-654T
isometric transducer (Nihon Kohden)27 that was secured with
a 4-0 silk suture on a three-dimensional drive precision stage28.
A pair of silver electrodes (diameter 3 mm) was mounted on
the TA muscle, which was connected to electrostimulators. Iso-
metric contraction force and force-time integrals were meas-
ured under the same stimulation conditions with the daily
direct ES regimen. Maximum tetanic force was also deter-
mined from the average of three tetani. The muscle tension
signal was sampled at 2 kHz through a PowerLab 8SP A/D
converter (ADInstruments, Nagoya, Japan).
Tissue sampling
The TA muscles were harvested from rats anesthetized with
sodium pentobarbital (40 mg/kg body weight), weighed at the
end of the experiment and then TA muscle weight (MW) was
normalized by body weight (BW) and is expressed as a ratio
of MW/BW. A mixed fixative (0.1 mol/L sodium cacodylate
buffer pH 7.35 containing 1% glutaraldehyde, 1% formalde-
hyde and 0.05% CaCl2) was injected via the abdominal aorta
and perfusion fixation proceeded at room temperature for 30
min. The tibiae were removed and preserved in 70% ethanol.
Microcomputed tomography (μCT)
Tibial bone microarchitecture was measured using a Sky-
Scan 1076 high-resolution micro CT scanner (SkyScan, Kon-
tich, Belgium). The specimens were wrapped in plastic film to
prevent drying while acquiring images under the following
conditions: source voltage, 70 kV; current, 141 μA; rotation
step, 0.6°; full rotation >180°; aluminium filter (to reduce
beam hardening), 1 mm; pixel size, 17.67 μm, exposure, 0.54
seconds. Three-dimensional (3D) microstructural image data
were reconstructed using NRecon software (SkyScan). Mor-
phometric parameters were calculated using CT Analyzer
(CTAn) software (SkyScan) for trabecular bone in the tibiae.
Trabecular bone within the proximal tibiae was extracted by
semi-automatically drawing interactive polygons on two-di-
mensional (2D) sections. The volume of interest (VOI) started
at a distance of 1 mm from the lower end of the growth plate
and extended distally for 113 cross sections (height, 2 mm).
The VOI comprised only trabecular bone and the marrow cav-
ity. The following parameters were measured according to the
guidelines for assessing bone microstructure in rodents using
micro CT29: bone volume fraction (BV/TV, %), trabecular
number (Tb.N), trabecular thickness (Tb.Th), trabecular spac-
ing (Tb.Sp), and connection density (Conn.D).
Bone histological staining
After micro CT imaging, each tibia was cut sagittally at the
proximal end and decalcified in 0.1 mol/L EDTA (pH 7.35) at
4°C for 2-3 weeks and embedded in paraffin. Longitudinal sec-
tions (5-μm thick) were stained with hematoxylin and eosin
(H-E) or Azan. Osteoid in decalcified specimens was stained
with H-E using the Goland-Yoshiki method30 as described1.
We measured at least 15 regions per field at 400-fold magni-
fication to calculate mean osteoid thickness (O.Th)31 using a
light/fluorescence microscope (BX61, Olympus, Tokyo,
Japan) and Image-Pro Plus 5 image analysis software (Media
Cybernetics, Rockville, MD, USA).
Statistical analysis
All data are expressed as means ± standard deviation.
Kruskal-Wallis analysis of variance on ranks followed by the
Dunn’s multiple test was applied to assess the statistical sig-
nificance of differences among the groups. Mean values in tra-
becular bone volume (BV/TV) and muscle weight (MW/BW)
in each group at each time point were normalized as ratios (%)
relative to basal control group value. The relationship between
mean %BV/TV and muscle weight was determined using
Pearson’s correlation coefficient. Significance levels were set
at P<0.05.
Results
Body weight
Figure 1 shows that all rats gained a significant amount of
weight during the experimental period (P<0.05). Body weight did
not significantly differ among the groups at one week after den-
ervation. The ES and DN groups weighed 5.2-10.6% less than the
age-matched control group at three weeks after denervation
(P<0.05), but the ES and DN groups did no significantly differ.
Muscle weight and ES evoked muscle contraction force
The weight of the TA muscle relative to body weight
(MW/BW) significantly decreased after denervation (P<0.05),
and the CON and DN groups significantly differed. Muscle
weight did not recover to either the basal level or the level of
the age-matched control group after ES for one or three weeks
(Figure 3A). However, the relative muscle weight was signifi-
cantly higher in both the ES8 and ES16 groups than in the DN
group at week one only (P<0.05). Direct ES at 10 Hz evoked
significantly more muscle contraction force in the TA with stim-
ulation intensity at both the beginning (0-1 min period) and the
end (29-30 min period) of ES for 30 min (Figure 3B). Direct
ES with 16 mA generated 23-30% of the maximal contraction
force. Force-time integrals evoked by ES of 16 mA were the
highest among the three stimulation intensities (Figure 3C).
H. Tamaki et al.: Electrical stimulation and bone loss
224
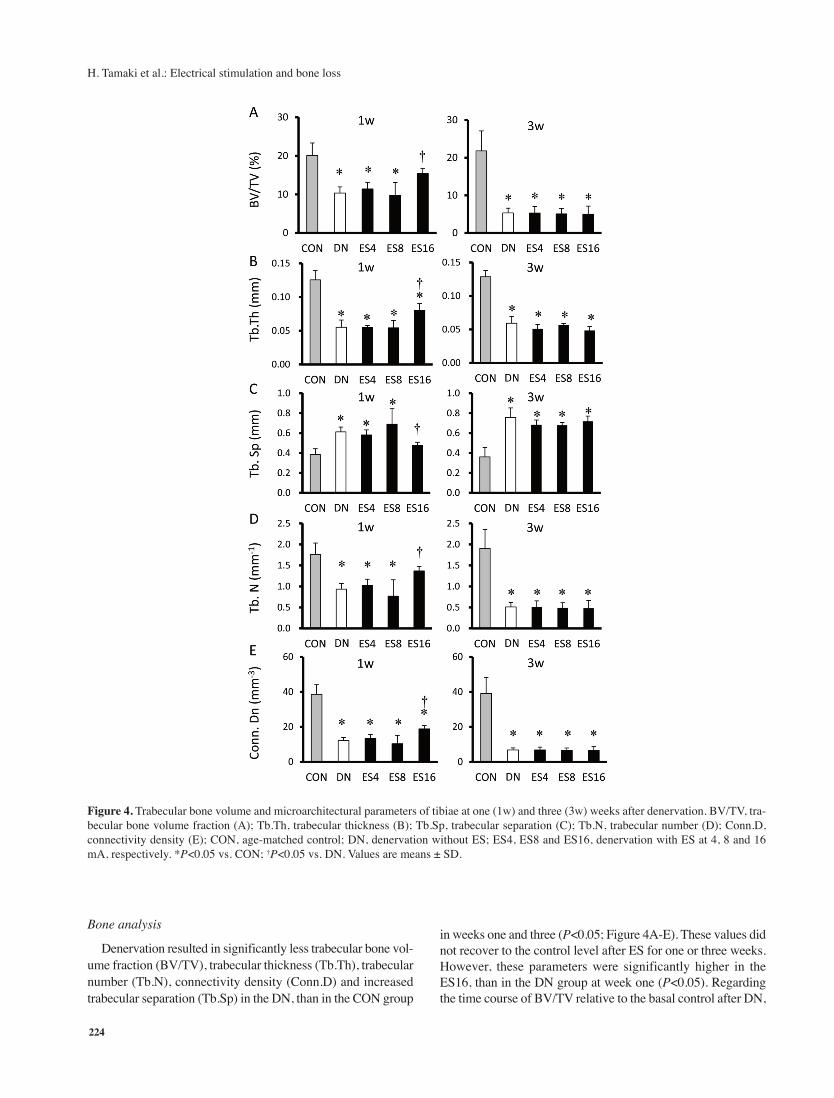
Bone analysis
Denervation resulted in significantly less trabecular bone vol-
ume fraction (BV/TV), trabecular thickness (Tb.Th), trabecular
number (Tb.N), connectivity density (Conn.D) and increased
trabecular separation (Tb.Sp) in the DN, than in the CON group
in weeks one and three (P<0.05; Figure 4A-E). These values did
not recover to the control level after ES for one or three weeks.
However, these parameters were significantly higher in the
ES16, than in the DN group at week one (P<0.05). Regarding
the time course of BV/TV relative to the basal control after DN,
Figure 4. Trabecular bone volume and microarchitectural parameters of tibiae at one (1w) and three (3w) weeks after denervation. BV/TV, tra-
becular bone volume fraction (A); Tb.Th, trabecular thickness (B); Tb.Sp, trabecular separation (C); Tb.N, trabecular number (D); Conn.D,
connectivity density (E); CON, age-matched control; DN, denervation without ES; ES4, ES8 and ES16, denervation with ES at 4, 8 and 16
mA, respectively. *P<0.05 vs. CON; †P<0.05 vs. DN. Values are means ± SD.
H. Tamaki et al.: Electrical stimulation and bone loss
225
the process of BV/TV loss was more gradual in the ES16, than
in the other ES and DN groups. The BV/TV was significantly
higher in the CON, than in the ES4, ES8 and DN (P<0.05), but
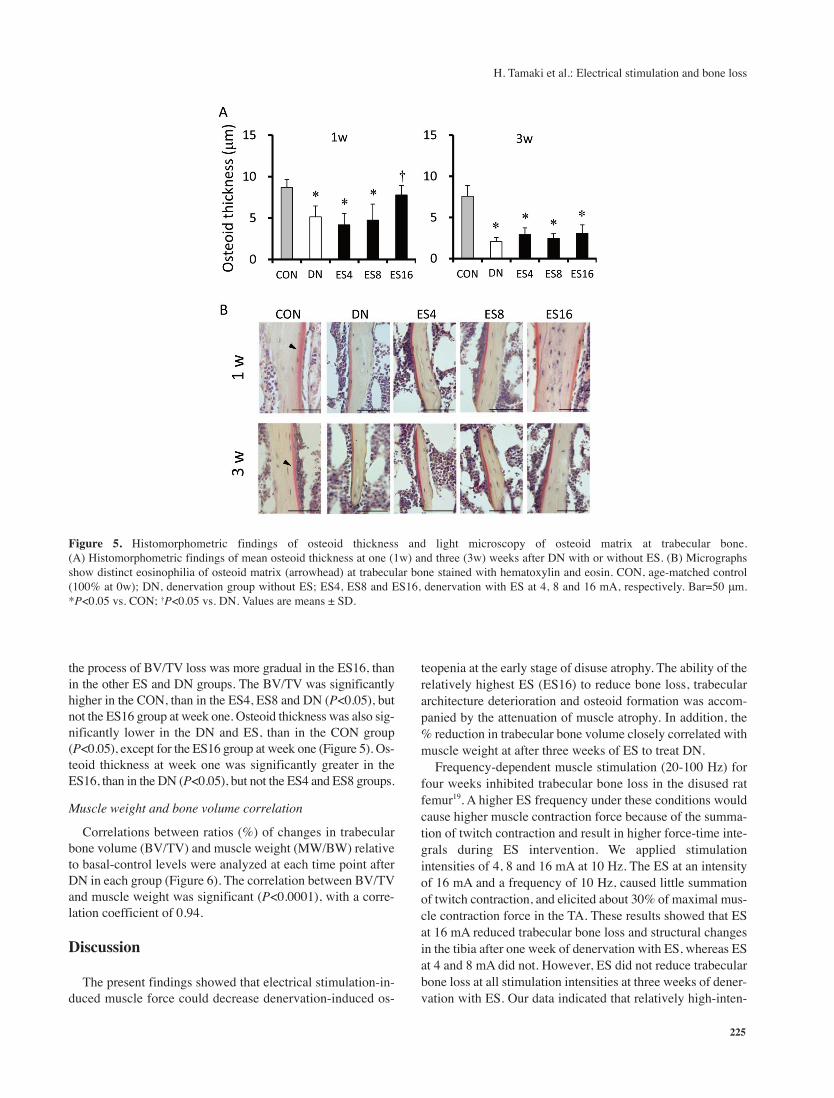
not the ES16 group at week one. Osteoid thickness was also sig-
nificantly lower in the DN and ES, than in the CON group
(P<0.05), except for the ES16 group at week one (Figure 5). Os-
teoid thickness at week one was significantly greater in the
ES16, than in the DN (P<0.05), but not the ES4 and ES8 groups.
Muscle weight and bone volume correlation
Correlations between ratios (%) of changes in trabecular
bone volume (BV/TV) and muscle weight (MW/BW) relative
to basal-control levels were analyzed at each time point after
DN in each group (Figure 6). The correlation between BV/TV
and muscle weight was significant (P<0.0001), with a corre-
lation coefficient of 0.94.
Discussion
The present findings showed that electrical stimulation-in-
duced muscle force could decrease denervation-induced os-
teopenia at the early stage of disuse atrophy. The ability of the
relatively highest ES (ES16) to reduce bone loss, trabecular
architecture deterioration and osteoid formation was accom-
panied by the attenuation of muscle atrophy. In addition, the
% reduction in trabecular bone volume closely correlated with
muscle weight at after three weeks of ES to treat DN.
Frequency-dependent muscle stimulation (20-100 Hz) for
four weeks inhibited trabecular bone loss in the disused rat
femur19. A higher ES frequency under these conditions would
cause higher muscle contraction force because of the summa-
tion of twitch contraction and result in higher force-time inte-
grals during ES intervention. We applied stimulation
intensities of 4, 8 and 16 mA at 10 Hz. The ES at an intensity
of 16 mA and a frequency of 10 Hz, caused little summation
of twitch contraction, and elicited about 30% of maximal mus-
cle contraction force in the TA. These results showed that ES
at 16 mA reduced trabecular bone loss and structural changes
in the tibia after one week of denervation with ES, whereas ES
at 4 and 8 mA did not. However, ES did not reduce trabecular
bone loss at all stimulation intensities at three weeks of dener-
vation with ES. Our data indicated that relatively high-inten-
Figure 5. Histomorphometric findings of osteoid thickness and light microscopy of osteoid matrix at trabecular bone.
(A) Histomorphometric findings of mean osteoid thickness at one (1w) and three (3w) weeks after DN with or without ES. (B) Micrographs
show distinct eosinophilia of osteoid matrix (arrowhead) at trabecular bone stained with hematoxylin and eosin. CON, age-matched control
(100% at 0w); DN, denervation group without ES; ES4, ES8 and ES16, denervation with ES at 4, 8 and 16 mA, respectively. Bar=50 μm.
*P<0.05 vs. CON; †P<0.05 vs. DN. Values are means ± SD.

H. Tamaki et al.: Electrical stimulation and bone loss
226
sity (16 mA) ES, which does not cause tetanic muscle contrac-
tion, would retard trabecular bone loss and structural changes
at the early stages of disuse atrophy.
We previously reported that high-intensity (16 mA) ES re-
tarded denervated muscle atrophy, although it might adversely
affect the regeneration of nerve terminals and/or the membrane
systems involved in e-c coupling after three weeks of denerva-
tion24. We speculated that muscle denervation for three weeks
with ES (16 mA) in the present study could not provide suffi-
cient functional load to reduce bone loss and that the appropri-
ate intensities should be determined to generate a reduction in
structural and functional damage in denervated muscle fibers.
The relative muscle weight was significantly higher in the
ES8 and ES16, than in the DN group. However, muscle weight
in all DN and ES groups gradually decreased over three weeks.
Muscle weight was 21% and 11% higher in the ES16, than in
the DN group after one and three weeks of ES, respectively.
Electrical stimulation reduced muscle atrophy after DN more
effectively at one, than at three weeks. A decrease in muscle
mass as a force-generating resource would result in a decrease
in mechanical stress to bone during ES. Although we did not
determine mechanical strain in the tibia during daily ES inter-
vention, the magnitude of mechanical strain induced by direct
ES in the tibia might be lower at three weeks than at one week
after DN. This might be one reason why ES did not reduce tra-
becular bone loss after DN at three weeks. Moreover, osteoid
was significantly thicker in the ES16 than the other ES groups
at one, but not at three weeks. This suggests that osteoblasts
maintained more bone collagen formation in the ES16 group
for one week after DN with ES. Therefore, the maintained os-
teoid formation appeared to reflect retardation of the decrease
in trabecular bone thickness at one week after DN.
We also found a significantly close correlation coefficient
between relative BV/TB fractions and relative muscle weight
under our experimental conditions. This indicates that main-
taining muscle mass after DN with or without ES appreciably
impacts trabecular bone loss, and an ES regimen that can pre-
vent/retard muscle atrophy and maintain a muscle force output
sufficient to exert mechanical stress on bone tissue should be
important.
The effects of ES on the reduction of bone loss due to disuse
might be explained by the induction of mechanical and hu-
moral factors by muscle contraction and ES. Although we did
not examine bone strain in the present study, mechanical load-
ing is a major functional influence on the mass and structure
of bone tissue. The adaptive response of bone to mechanical
loading is essentially linear between peak dynamic load and
changes that occur in trabecular bone after denervation17. Even
low-magnitude mechanical stimuli (<10 microstrains) increase
bone formation in animal models of disuse15,32. Mechanotrans-
duction converts physical forces into biochemical signals that
are then integrated into cellular responses33. During mechani-
cal signal transmission, osteoblasts, osteocytes and cells that
line bone might act as sensors. These cells also produce growth
factors that might signal osteoprogenitors to differentiate into
osteoblasts and promote osteoblast activity34. Mechanical load-
ing promotes bone formation35, osteoblastic differentiation and
activity, and lining-cell reactivation36, while inhibiting the ex-
pression of osteoclast differentiation factor and osteoclast
numbers37. Mechanical stimuli of osteoblasts also induce the
secretion of growth factors including insulin-like growth factor
(IGF), vascular endothelial growth factor (VGEF), transform-
ing growth factor (TGF)-β, and the bone morphogenetic pro-
tein (BMP) that are considered to be the principal local
regulators of osteogenesis38.
Systemic effects of ES were not investigated in the present
Figure 6. Correlations between muscle weight (MW/BW) and bone volume fraction (BV/TV) relative to basal-control values (100%) after DN
with or without ES.
H. Tamaki et al.: Electrical stimulation and bone loss
227
study, but electrically stimulated muscle contraction enhances
venous and arterial blood flow39, which subsequently increases
intramedullary pressure (ImP) and fluid flow in bone40. Oscil-
latory fluid flow-induced shear stress decreases osteoclasto-
genesis41 and stimulates osteoblast proliferation and
differentiation42. The role of muscle-derived growth factors in
bone formation has recently been discussed43,44. Muscle seems
to be an important, local source of growth factors for bone tis-
sue, yet the cellular and molecular mechanisms linking muscle
and bone tissues are not well understood. Exercise and muscle
contraction alter the secretion of several myokines that appear
to affect bone metabolism44. Some authors have reported that
myostatin (growth differentiation factor (GDF)-8) secretion in
muscle inhibits bone formation45, whereas IGF-1 and fibrob-
last growth factor (FGF)-2 stimulate bone formation in vivo
and in vitro46,47. Myokine secretion induced by muscle contrac-
tion might be one pathway of stimulating bone formation.
One limitation of this study is that we did not determine pa-
rameters of possible mechanisms that might explain the effects
of ES on the reduction of bone loss due to disuse, and thus
more studies are required to elucidate such mechanisms. Al-
though dynamic and static histomorphometry analyses would
increase understanding of bone formation and bone resorption,
the main objective of this study was to assess the stimulation
intensity required to prevent structural failure and loss of in-
dividual bone and skeletal muscle after disuse induced by den-
ervation. Our data suggested that relatively small muscle
contraction induced by low-frequency (10 Hz) high-intensity
(16 mA) electrical muscle stimulation could delay trabecular
bone loss during the early stages (only at week one after den-
ervation) of musculoskeletal atrophy due to disuse.
Acknowledgements
This study was supported in part by a Grant-in-Aid for Scientific Re-
search from the Japan Society for the Promotion of Science (project nos.
C, 25350829 and B, 25282163), and by a Grant-in-Aid for Developed
Research (B) from the Niigata University of Health and Welfare. The au-
thors are grateful to the Niigata Bone Science Institute for technical sup-
port with the histomorphometry.
References
1. Tamaki H, Yotani K, Ogita F, Takahashi H, Kirimoto H,
Onishi H, Yamamoto N. Changes over time in structural
plasticity of trabecular bone in rat tibiae immobilized by
reversible sciatic denervation. J Musculoskelet Neuronal
Interact 2013;13:251-8.
2. Takekura H, Kasuga N, Kitada K, Yoshioka T. Morpho-
logical changes in the triads and sarcoplasmic reticulum
of rat slow and fast muscle fibres following denervation
and immobilization. J Muscle Res Cell Motil 1996;
17:391-400.
3. Kern H, Salmons S, Mayr W, Rossini K, Carraro U. Re-
covery of long-term denervated human muscles induced
by electrical stimulation. Muscle Nerve 2005;31:98-101.
4. Modlin M, Forstner C, Hofer C, Mayr W, Richter W, Car-
raro U, Protasi F, Kern H. Electrical stimulation of den-
ervated muscles: first results of a clinical study. Artif
Organs 2005;29:203-6.
5. Guo BS, Cheung KK, Yeung SS, Zhang BT, Yeung EW.
Electrical stimulation influences satellite cell proliferation
and apoptosis in unloading-induced muscle atrophy in
mice. PLoS One 2012;7:e30348.
6. Zhang BT, Yeung SS, Liu Y, Wang HH, Wan YM, Ling
SK, Zhang HY, Li YH, Yeung EW. The effects of low fre-
quency electrical stimulation on satellite cell activity in
rat skeletal muscle during hindlimb suspension. BMC
Cell Biol 2010;11:87.
7. Willand MP, Holmes M, Bain JR, Fahnestock M, De
Bruin H. Electrical muscle stimulation after immediate
nerve repair reduces muscle atrophy without affecting
reinnervation. Muscle Nerve 2013;48:219-25.
8. Dow DE, Carlson BM, Hassett CA, Dennis RG, Faulkner
JA. Electrical stimulation of denervated muscles of rats
maintains mass and force, but not recovery following
grafting. Restor Neurol Neurosci 2006;24:41-54.
9. Dow DE, Cederna PS, Hassett CA, Dennis RG, Faulkner
JA. Electrical stimulation prior to delayed reinnervation
does not enhance recovery in muscles of rats. Restor Neu-
rol Neurosci 2007;25:601-10.
10. Gigo-Benato D, Russo TL, Geuna S, Domingues NR,
Salvini TF, Parizotto NA. Electrical stimulation impairs
early functional recovery and accentuates skeletal muscle
atrophy after sciatic nerve crush injury in rats. Muscle
Nerve 2010;41:685-93.
11. Dupont Salter AC, Richmond FJ, Loeb GE. Effects of mus-
cle immobilization at different lengths on tetrodotoxin-in-
duced disuse atrophy. IEEE Trans Neural Syst Rehabil Eng
2003;11:209-17.
12. Fujita N, Murakami S, Arakawa T, Miki A, Fujino H. The
combined effect of electrical stimulation and resistance
isometric contraction on muscle atrophy in rat tibialis an-
terior muscle. Bosn J Basic Med Sci 2011;11:74-9.
13. Gilsanz V, Wren TA, Sanchez M, Dorey F, Judex S, Rubin
C. Low-level, high-frequency mechanical signals enhance
musculoskeletal development of young women with low
BMD. J Bone Miner Res 2006;21:1464-74.
14. Hannan MT, Cheng DM, Green E, Swift C, Rubin CT,
Kiel DP. Establishing the compliance in elderly women
for use of a low level mechanical stress device in a clini-
cal osteoporosis study. Osteoporos Int 2004;15:918-26.
15. Rubin C, Xu G, Judex S. The anabolic activity of bone
tissue, suppressed by disuse, is normalized by brief ex-
posure to extremely low-magnitude mechanical stimuli.
FASEB J 2001;15:2225-9.
16. Frost HM. Bone “mass” and the “mechanostat”: a pro-
posal. Anat Rec 1987;219:1-9.
17. Sugiyama T, Meakin LB, Browne WJ, Galea GL, Price
JS, Lanyon LE. Bones’ adaptive response to mechanical
loading is essentially linear between the low strains asso-
ciated with disuse and the high strains associated with the

H. Tamaki et al.: Electrical stimulation and bone loss
228
lamellar/woven bone transition. J Bone Miner Res 2012;
27:1784-93.
18. Belanger M, Stein RB, Wheeler GD, Gordon T, Leduc B.
Electrical stimulation: can it increase muscle strength and
reverse osteopenia in spinal cord injured individuals?
Arch Phys Med Rehabil 2000;81:1090-8.
19. Lam H, Qin YX. The effects of frequency-dependent dy-
namic muscle stimulation on inhibition of trabecular bone
loss in a disuse model. Bone 2008;43:1093-100.
20. Lieber RL. Skeletal muscle structure, function & plastic-
ity: the physiological basis of rehabilitation. 2nd ed.
Philadelphia: Lippincott Williams & Wilkins; 2002.
21. Qin YX, Lam H. Intramedullary pressure and matrix strain
induced by oscillatory skeletal muscle stimulation and its
potential in adaptation. J Biomech 2009;42:140-5.
22. Qin YX, Lam H, Ferreri S, Rubin C. Dynamic skeletal
muscle stimulation and its potential in bone adaptation. J
Musculoskelet Neuronal Interact 2010;10:12-24.
23. Giangregorio L, McCartney N. Bone loss and muscle at-
rophy in spinal cord injury: epidemiology, fracture pre-
diction, and rehabilitation strategies. J Spinal Cord Med
2006;29:489-500.
24. Tomori K, Ohta Y, Nishizawa T, Tamaki H, Takekura H.
Low-intensity electrical stimulation ameliorates disrup-
tion of transverse tubules and neuromuscular junctional
architecture in denervated rat skeletal muscle fibers. J
Muscle Res Cell Motil 2010;31:195-205.
25. Sakakima H, Kawamata S, Kai S, Ozawa J, Matsuura N.
Effects of short-term denervation and subsequent reinner-
vation on motor endplates and the soleus muscle in the
rat. Arch Histol Cytol 2000;63:495-506.
26. Takekura H, Tamaki H, Nishizawa T, Kasuga N. Plasticity
of the transverse tubules following denervation and sub-
sequent reinnervation in rat slow and fast muscle fibres.
J Muscle Res Cell Motil 2003;24:439-51.
27. Tamaki H, Murata F, Takekura H. Histomorphological ev-
idence of muscle tissue damage and recording area using
coiled and straight intramuscular wire electrodes. Eur J
Appl Physiol 2006;98:323-7.
28. Tamaki H, Yotani K, Yuki A, Kirimoto H, Sugawara K,
Onishi H. Magnetic field strength properties in bone mar-
row during pulsed electromagnetic stimulation. Journal
of Biomedical Science and Engineering 2010;3:1156-60.
29. Bouxsein ML, Boyd SK, Christiansen BA, Guldberg RE,
Jepsen KJ, Muller R. Guidelines for assessment of bone
microstructure in rodents using micro-computed tomog-
raphy. J Bone Miner Res 2010;25:1468-86.
30. Yoshiki S. A simple histological method for identification
of osteoid matrix in decalcified bone. Stain Technol 1973;
48:233-8.
31. Fujimoto R, Tanizawa T, Nishida S, Yamamoto N, Soshi
S, Endo N, Takahashi HE. Local effects of transforming
growth factor-beta1 on rat calvaria: changes depending
on the dose and the injection site. J Bone Miner Metab
1999;17:11-7.
32. Rubin C, Turner AS, Bain S, Mallinckrodt C, McLeod K.
Anabolism. Low mechanical signals strengthen long
bones. Nature 2001;412:603-4.
33. Huang C, Ogawa R. Mechanotransduction in bone repair
and regeneration. FASEB J 2010;24:3625-32.
34. Duncan RL, Turner CH. Mechanotransduction and the
functional response of bone to mechanical strain. Calcif
Tissue Int 1995;57:344-58.
35. De Souza RL, Matsuura M, Eckstein F, Rawlinson SC,
Lanyon LE, Pitsillides AA. Non-invasive axial loading of
mouse tibiae increases cortical bone formation and mod-
ifies trabecular organization: a new model to study corti-
cal and cancellous compartments in a single loaded
element. Bone 2005;37:810-8.
36. Chow JW, Wilson AJ, Chambers TJ, Fox SW. Mechanical
loading stimulates bone formation by reactivation of bone
lining cells in 13-week-old rats. J Bone Miner Res 1998;
13:1760-7.
37. Rubin J, Murphy T, Nanes MS, Fan X. Mechanical strain
inhibits expression of osteoclast differentiation factor by
murine stromal cells. Am J Physiol Cell Physiol 2000;
278:C1126-32.
38. Papachroni KK, Karatzas DN, Papavassiliou KA, Basdra
EK, Papavassiliou AG. Mechanotransduction in os-
teoblast regulation and bone disease. Trends Mol Med
2009;15:208-16.
39. Valic Z, Buckwalter JB, Clifford PS. Muscle blood flow
response to contraction: influence of venous pressure. J
Appl Physiol (1985) 2005;98:72-6.
40. Qin YX, Lin W, Rubin C. The pathway of bone fluid flow
as defined by in vivo intramedullary pressure and stream-
ing potential measurements. Ann Biomed Eng 2002;
30:693-702.
41. Kim CH, You L, Yellowley CE, Jacobs CR. Oscillatory
fluid flow-induced shear stress decreases osteoclastoge-
nesis through RANKL and OPG signaling. Bone 2006;
39:1043-7.
42. Kapur S, Baylink DJ, Lau KH. Fluid flow shear stress
stimulates human osteoblast proliferation and differenti-
ation through multiple interacting and competing signal
transduction pathways. Bone 2003;32:241-51.
43. Hamrick MW, McNeil PL, Patterson SL. Role of muscle-
derived growth factors in bone formation. J Muscu-
loskelet Neuronal Interact 2010;10:64-70.
44. Hamrick MW. A role for myokines in muscle-bone inter-
actions. Exerc Sport Sci Rev 2011;39:43-7.
45. Elkasrawy MN, Hamrick MW. Myostatin (GDF-8) as a
key factor linking muscle mass and bone structure. J Mus-
culoskelet Neuronal Interact 2010;10:56-63.
46. Yakar S, Rosen CJ, Beamer WG, Ackert-Bicknell CL, Wu
Y, Liu JL, Ooi GT, Setser J, Frystyk J, Boisclair YR,
LeRoith D. Circulating levels of IGF-1 directly regulate
bone growth and density. J Clin Invest 2002;110:771-81.
47. Liang H, Pun S, Wronski TJ. Bone anabolic effects of
basic fibroblast growth factor in ovariectomized rats. En-
docrinology 1999;140:5780-8.