0. 0 0.5 1.0 1.5 2. 0 2. 5 3.0 s u g a r ( t b s ) statistics... · its corresponding residual...
TRANSCRIPT

1
AP Statistics – Unit 1 Concepts (Chapters: 1, 2, 3) Baseline Topics: (must show mastery in order to receive a ‘3’ or above
I can utilize the formula for standardizing to ‘compare apples & oranges’ (via z-score). I can utilize the formula for standardizing to calculate probabilities (via z-scores).
Strive: p. 26/p.38 I can describe a distribution (OR compare two distributions) by focusing on the
following features: Center, Shape, Spread, Outliers. Strive: p. 7/p.20
I can interpret the slope and intercept of a regression line in the context of a given problem.
Strive: p. 51; p. 55 #12; p. 56 #15; p. 58 part a; Textbook: p. 172, 173, 182-183 “Beer”; p. 190
I can understand how to use a “line of best fit” (LSRL) to model the relationship between two variables.
Strive: p. 48/p.49
I can examine the fit of a regression line by studying its residuals. Strive: p. 50
I can interpret the linearity of a relationship between two quantitative by looking at its corresponding residual plot.
Strive: p. 50
Sugar (tbs)
Resid
ua
l
3.02.52.01.51.00.50.0
10
5
0
-5
-10
-15
I can use an LSRL to make predictions.
Strive: p. 54 #8; p. 58 part b
I can identify the locations of the mean and median on a density curve based on whether it is symmetric or skewed.
Strive: p. 29 “Ms. Chauvet”; Textbook p. 102
I can understand how to determine whether a distribution is normal and can also identify the key characteristics of a normal curve and how it differs from distributions that are not symmetric shaped.
Strive: p. 36 #10

2
I can understand how to use a normal probability plot to assess the normality of a distribution.
Strive: p. 36 #10
I can understand how a transformation of a set of data (changing units of measurement or by adding a constant ‘a’ to the data) will affect the measures of center and spread, along with the measures of location (quartiles & percentiles)
Strive: p. 29
I can calculate a percentile rank by using its general definition (% at OR below the value) and by using skills acquired from:
The 5 # summary, Quartiles and IQR 68-95-99.7% Rule (Empirical Rule)
Strive: p. 27
I can detect outliers and influential observations that may or may not significantly affect or change its corresponding correlation and/or regression line.
(See Chapter 3 Packet)
I can interpret a correlation value, as well as the value of the coefficient of determination (r-squared) in the context of a given problem.
Strive: p. 50 A sociologist finds that the correlation between the personality characteristics “ambition” and “strong work ethic” is 0.68. What percentage of the variation in ambition can be explained by the relationship with strong work ethic?
I can display relationships between two variables appropriately using a scatter plot and can also properly identify and relate an explanatory (x) and response (y) variable.
Strive: p. 45
I can properly describe a scatter plot by identifying its: Direction, Form, Strength, and Outliers
Strive: p. 46

3
AP Statistics – Unit 1 Review MULTIPLE CHOICE PRACTICE CONCEPT: I can calculate a percentile rank by using its general definition (% at OR below the value) and by using skills acquired from:
The 5 # summary, Quartiles and IQR 68-95-99.7% Rule (Empirical Rule)
#1. The dotplot below displays the total number of miles that the 28 residents of one street in a certain community traveled to work in one five-day work week.
Which of the following is closest to the percentile rank of a resident from this street who traveled 85 miles to work that week?
a. 60 b. 70 c. 75 d. 80 e. 85
#2. The histogram above shows the number of minutes needed by 45 students to finish playing a computer game. Which of the following statements is correct?
a. The distribution is skewed to the right. b. The distribution is skewed to the left. c. The distribution appears to be normal. d. The distribution appears to be chi-square. e. The distribution appears to be uniform.

4
#3. Janelle collected data on the amount of time in minutes each person in a large sample of customers spent in a local store. The data also included recording the gender of each customer. These data were used to generate the boxplots shown. Which of the following statements is true?
a. The range in the amount of time in minutes males in the sample of customers spent in the store is approximately 40 minutes.
b. The mean amount of time in minutes males in the sample of customers spent in the store is approximately 20 minutes.
c. The third quartile of the amount of time in minutes males in the sample of customers spent in the store is approximately 45 minutes.
d. The interquartile range of the amount of time in minutes females in the sample of customers spent in the store is 15 minutes.
e. Approximately half of the males in the sample of customers spent at least as much time in the store as any female in the sample of customers.
#4. A random sample of 374 United States pennies was collected, and the age of each penny was determined. According to the boxplot below, what is the approximate interquartile range (IQR) of the ages?
a. 8 b. 10 c. 16 d. 40 e. 50
5
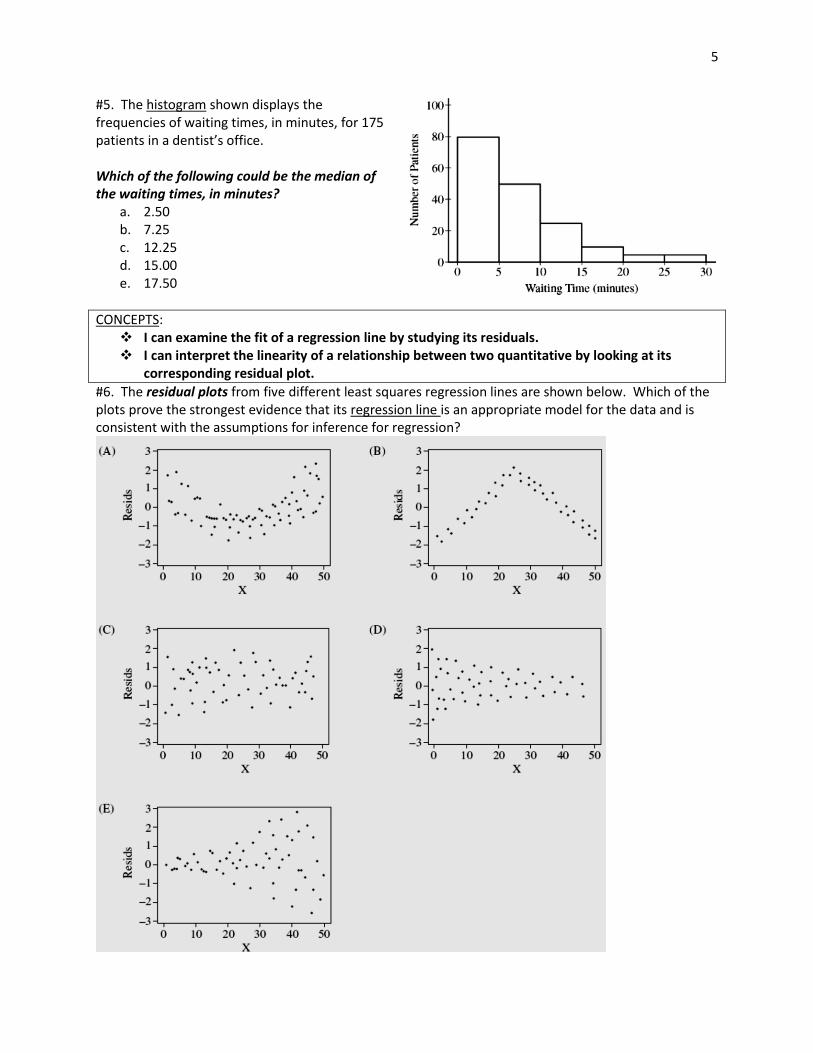
#5. The histogram shown displays the frequencies of waiting times, in minutes, for 175 patients in a dentist’s office.
Which of the following could be the median of the waiting times, in minutes?
a. 2.50 b. 7.25 c. 12.25 d. 15.00 e. 17.50
CONCEPTS: I can examine the fit of a regression line by studying its residuals. I can interpret the linearity of a relationship between two quantitative by looking at its
corresponding residual plot.
#6. The residual plots from five different least squares regression lines are shown below. Which of the plots prove the strongest evidence that its regression line is an appropriate model for the data and is consistent with the assumptions for inference for regression?

6
CONCEPT: I can describe a distribution by focusing on the following features: Center, Shape, Spread, Outliers
FREE RESPONSE QUESTION: (from 2007 AP Statistics Exam (Form B) #1) The Better Business Council of a large city has concluded that students in the city’s schools are not learning enough about economics to function in the modern world. These findings were based on test results from a random sample of 20 twelfth-grade students who completed a 46-question-multiple-choice test on basic economic concepts. The data set below shows the number of questions that each of the 20 students in the sample answered correctly. 12 16 18 17 18 33 41 44 38 35 19 36 19 13 43 8 16 14 10 9
a. Display these data in a stemplot. b. Use your stemplot from part (a) to describe the main features of this score distribution. c. Why would it be misleading to report only a measure of center for this score
distribution?

7
I can compare the basic features of TWO or more distributions.
a. Use the stem plots above to compare the distributions of acorn sizes between Atlantic
Coast and California oak species.
b. Approximate the Interquartile Range (IQR) for both distributions.

8
I can interpret slope in the context of the problem.
a. Interpret the slope in the context of the problem.
b. The correlation between these two variables is -0.75. If the amount of rainfall were measured in centimeters rather than inches, how would the correlation change? Explain.
c. Predict the relative abundance of adult red locusts after 25 inches of rainfall.

9
a. What is the 33rd percentile of points scored by the Celtics?
b. The mean number of points scored by Los Angeles Lakers was 101.7. In what proportion of their games did the Celtics score more than the Lakers’ mean score?

10
I can compare the basic features of TWO or more distributions.
a. Approximate the interquartile range (IQR) for each of the two dot plots.
b. Use the boxplots above to compare the distributions of the number of words recalled for those students who listened to classical music versus those who listened to rap music.

11
I can interpret slope in the context of the problem.
a. Describe what the scatterplot reveals about the relationship between length of courtship and
length of marriage. Below is the computer output regression of length of marriage versus length of courtship.
b. What is the slope of the regression line? Interpret the slope in the context of the problem.
c. Write the least squares regression equation. Predict the length of a marriage after 4 ½ years of courtship.
d. Using the regression line from part c, what is the value of the residual for the point whose x-value is 0.5?

12
AP Statistics Exam Review – MULTIPLE CHOICE PRACTICE CONCEPT: I can utilize the formula for standardizing to ‘compare apples & oranges’.
#1. One of the values in a normal distribution is 58 and its corresponding z-score is 2.08. If the mean of the distribution is 53, what is the standard deviation of the distribution?
a. 5 b. .416 c. 2.40 d. -2.40 e. -.416
#2. How would a distribution be described that has a set of data, in which the median is equal to the mean?
a. Skewed right b. Skewed left c. Approximately normal d. Normal e. Symmetric
#3. The weight of adult male grizzly bears living in the wild in the continental United States is approximately normally distributed with a mean of 500 pounds and a standard deviation of 50 pounds. The weight of adult female grizzly bears is approximately normally distributed with a mean of 300 pounds and a standard deviation of 40 pounds. Approximately, what would be the weight of a female grizzly bear with the same standardized score (z-score) as a male grizzly bear with a weight of 530 pounds?
a. 276 pounds b. 324 pounds c. 330 pounds d. 340 pounds e. 530 pounds
#4. For a sample of 42 rabbits, the mean weight is 5 pounds and the standard deviation of weights is 3 pounds. Which of the following is MOST LIKELY true about the weights for the rabbits in this sample?
a. The distribution of weights is approximately normal because the sample size is 42, and therefore the central limit theorem applies.
b. The distribution of weights is approximately normal because the standard deviation is less than the mean.
c. The distribution of weights is skewed to the right because the least possible weight is within 2 standard deviations of the mean.
d. The distribution of weights is skewed to the left because the least possible weight is within 2 standard deviations of the mean.
e. The distribution of weights has a median that is greater than the mean.

13
CONCEPT: I can interpret the slope and intercept of a regression line in the context of a given problem.
#5. The computer output below shows the result of a linear regression analysis for predicting the concentration of zinc, in parts per million (ppm), from the concentration of lead, in ppm, found in fish from a certain river.
Response Variable is Zinc (ppm) Variable Coefficient Std. Dev. T P Constant 16.3 4.90 3.32 0.003 Lead (ppm) 19.0 1.89 10.01 0.000 S = -16.17 R-Sq = 82.0%
Which of the following statements is a correct interpretation of the value 19.0 in the output? a. On average there is a predicted increase of 19.0 ppm in concentration of lead for every
increase of 1 ppm in concentration of zinc found in the fish. b. On average there is a predicted increase of 19.0 ppm in concentration of zinc for every
increase of 1 ppm in concentration of lead found in the fish. c. The predicted concentration of zinc is 19.0 ppm in fish with no concentration of lead. d. The predicted concentration of lead is 19.0 ppm in fish with no concentration of zinc. e. Approximately 19% of the variability in zinc concentration is predicted by its linear
relationship with lead concentration.
CONCEPT: I can understand how a transformation of a set of data (changing units of measurement or by adding a constant ‘a’ to the data) will affect the measures of center and spread, along with the measures of location (quartiles & percentiles)
#6. Suppose the distribution of a set of scores has a mean of 28 and a standard deviation of 6. If 3 is added to each score, what will be the mean and the standard deviation of the distribution of new scores?
Mean Standard Deviation a. 31 10 b. 31 6 c. 28 10 d. 28 18 e. 28 6
CONCEPT: I can understand how to determine whether a distribution is normal and can also identify the key characteristics of a normal curve and how it differs from distributions that are not symmetric shaped.
#7. Which of the following histograms would be best approximated by a normal distribution: (a) (b) (c) (d)

14
#8. The distribution of test scores is not symmetric. Which of the following is the BEST estimate of the z-score of the third quartile?
a. 0.67 b. 0.75 c. 1.00 d. 1.41 e. This z-score cannot be determined from this given information.
Concept: I can calculate a percentile rank by using its general definition (% at OR below the value) and by using skills acquired from:
The 5 # summary, Quartiles and IQR 68-95-99.7% Rule (Empirical Rule)
#9. The stem plot below shows the yearly earnings per share of stock for two different companies over a sixteen-year period.
Which of the following statements is true? a. The median of the earnings of Company A is less than the median of the earnings of Company B. b. The range of the earnings of Company A is less than the range of the earnings of Company B. c. The third quartile of Company A is smaller than the third quartile of Company B. d. The mean of the earnings of Company A is greater than the mean of the earnings of Company B. e. The interquartile range of Company A is twice the interquartile range of Company B.
Concept: I can identify the locations of the mean and median on a density curve based on whether it is symmetric or skewed.
#10. For the following histogram, what is the proper ordering of the mean, median, and mode? Note that the graph is NOT numerically precise – only the relative positions are important.
a. I = mean, II = median, III = mode b. I = mode, II = median, III = mean c. I = median, II = mean, III = mode d. I = mode, II = mean, III = median e. I = mean, II = mode, III = median

15
FREE RESPONSE QUESTION: (from 2006 AP Statistics Exam #3) “Golf Balls” Golf balls must meet a set of five standards in order to be used in professional tournaments. One of these standards is distance traveled. When a ball is hit by a mechanical device, Iron Byron, with a 10-degree angle of launch, a backspin of 42 revolutions per second, and a ball velocity of 235 feet per second, the distance the ball travels may not exceed 290.7 yards. Manufacturers want to develop balls that will travel as close to the 290.7 yards as possible without exceeding that distance. A particular manufacturer has determined that the distances traveled for the balls it produces are normally distributed with a standard deviation of 2.6 yards. This manufacturer has a new process that allows it to set the mean distance the ball will travel. If the manufacturer sets the mean distance traveled to 288.5 yards, what is the probability that a ball that is randomly selected for testing will travel too far?

16
AP Statistics Exam Review – MULTIPLE CHOICE PRACTICE CONCEPT: I can understand how to use a normal probability plot to assess the normality of a distribution.
#1. The graph shown is a Normal probability plot for the amount of rainfall (in acre-feet) obtained from 26 randomly selected clouds that were seeded with silver oxide. Which of the following statements about the shape of the rainfall distribution is true?
a. The distribution is Normal. b. The distribution is approximately Normal. c. The distribution is skewed left. d. The distribution has no potential outliers. e. The distribution is skewed right.
CONCEPT: I can interpret a correlation value, as well as the value of the coefficient of determination (r-squared) in the context of a given problem.
#2. An agricultural economist says that the correlation between corn prices and soybean prices is r = 0.7. This means that
a. When corn prices are above average, soybean prices also tend to be above average. b. There is almost no relation between corn prices and soybean prices. c. When corn prices are above average, soybean prices tend to be below average. d. When soybean prices go up by 1 dollar, corn prices go up by 70 cents. e. The economist is confused, because correlation makes no sense in this situation.
CONCEPT: I can use an LSRL to make predictions.
For children between the ages of 18 months and 29 months, there is an approximately linear relationship between height and age. The relationship can be represented by �̂� = 64.93 + 0.63x, where y represents height (in centimeters) and x represents age (in months). #3. Joseph is 22.5 months old. What is his predicted height?
a. 50.80 b. 64.96 c. 65.96 d. 79.11 e. 87.40
#4. Loretta is 20 months old and is 80 centimeters tall. What is her residual?
a. -2.47 b. 2.47 c. –12.60 d. 12.60 e. 77.53

17
CONCEPT: I can detect outliers and influential observations that may or may not significantly affect or change its corresponding correlation and/or regression line.
#5. A scatterplot is shown below. After calculating the least-squares regression line, it is determined that the point (13, 15) was mistakenly entered. If this point is removed from the dataset, which of the following statements would be true?
a. The slope will increase and the correlation will decrease. b. The slope will increase and the correlation will increase. c. The slope will decrease and the correlation will remain the same. d. The slope will decrease and the correlation will decrease. e. The slope will decrease and the correlation will increase.
CONCEPT: I can identify the locations of the mean and median on a density curve based on whether it is symmetric or skewed.
#6. A local real estate magazine used the median instead of the mean when it reported the SAT score of the average student who attends Groveland High School. A graphical display of SAT scores of students who attend Groveland High School indicated that the data were strongly skewed to the right. Which of the following explains why, in this situation, the median is a more accurate indicator of the SAT score of the average student than the mean is?
a. The mean is affected by the skew ness, whereas the median is not. b. The median is always the preferred statistic. c. The mean will be less than the median when the data are strongly skewed to the right. d. The mean should be used only when data are strongly skewed to the left. e. The median is equal to one-half the sum of the maximum and minimum SAT scores at
Groveland High.

18
CONCEPT: I can describe a distribution by focusing on the following features: Center, Shape, Spread, Outliers
FREE RESPONSE QUESTION: (from 2010 (B) AP Stats Exam #3) “River Clean-Up” As a part of the United States Department of Agriculture’s Super Dump cleanup efforts in the early 1990’s, various sites in the country were targeted for clean-up. Three of the targeted sites – River X, River Y, and River Z – had become contaminated with pesticides because they were located near abandoned pesticide dump sites. Measurements of the concentration of aldrin (a commonly used pesticide) were taken at twenty randomly selected locations in each river near the dump sites. The boxplots shown below display the five-number summaries for the concentrations, in parts per million (ppm) of aldrin, for the twenty locations that were sampled in each of the three rivers.
a. Compare the distributions of the concentration of aldrin among the three rivers.

19
b. The twenty concentrations of aldrin in River X are given below:
3.4 4.0 5.6 3.7 8.0 5.5 5.3 4.2 4.3 7.3
8.6 5.1 8.7 4.6 7.5 5.3 8.2 4.7 4.8 4.6
Construct a stem plot that displays the concentrations of aldrin for River X.
c. Describe a characteristic of the distribution of aldrin concentrations in River X that can be seen in the stem plot but cannot be seen in the boxplot.
20
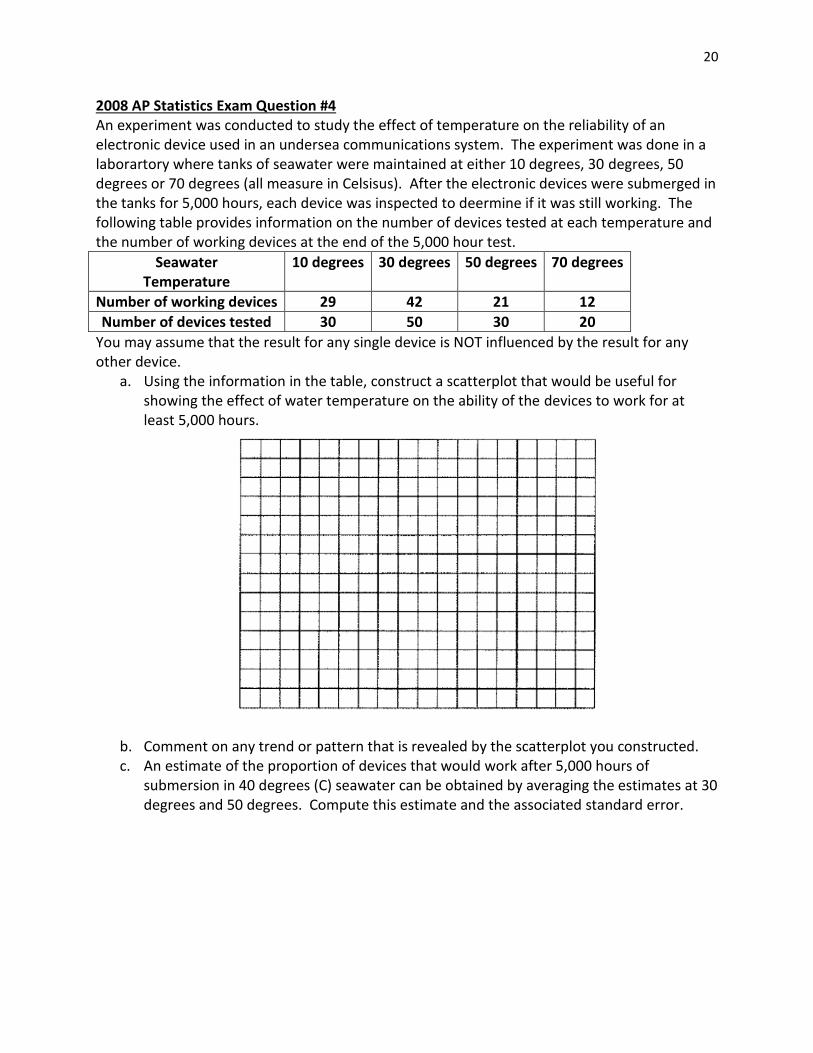
2008 AP Statistics Exam Question #4 An experiment was conducted to study the effect of temperature on the reliability of an electronic device used in an undersea communications system. The experiment was done in a laborartory where tanks of seawater were maintained at either 10 degrees, 30 degrees, 50 degrees or 70 degrees (all measure in Celsisus). After the electronic devices were submerged in the tanks for 5,000 hours, each device was inspected to deermine if it was still working. The following table provides information on the number of devices tested at each temperature and the number of working devices at the end of the 5,000 hour test.
Seawater Temperature
10 degrees 30 degrees 50 degrees 70 degrees
Number of working devices 29 42 21 12
Number of devices tested 30 50 30 20
You may assume that the result for any single device is NOT influenced by the result for any other device.
a. Using the information in the table, construct a scatterplot that would be useful for showing the effect of water temperature on the ability of the devices to work for at least 5,000 hours.
b. Comment on any trend or pattern that is revealed by the scatterplot you constructed. c. An estimate of the proportion of devices that would work after 5,000 hours of
submersion in 40 degrees (C) seawater can be obtained by averaging the estimates at 30 degrees and 50 degrees. Compute this estimate and the associated standard error.