wind engineering society quality assurance manual, awes-qam-1-2001 (2001) and the american society...
TRANSCRIPT
�
������������� ��� ���
���� ����������� ����� ��� ����
������� � ��������� ����
� ���� ������ ���� ����� ���� ������ ��� � ��
�
�
CH2M HILL Hong Kong Limited
Suite 1801, Harcourt House
39 Gloucester Road, Wanchai
Hong Kong
August 2008
i
EXECUTIVE SUMMARY
At the request of the CH2M HILL Hong Kong Limited, on behalf of Planning Department of The Government of the Hong Kong Special Administrative Region, wind tunnel model tests were conducted by the CLP Power Wind/Wave Tunnel Facility (WWTF) at The Hong Kong University of Science and Technology, for Design Scheme B of the new Central Waterfront development. The tests were undertaken for an air ventilation assessment to investigate the pedestrian level wind environment within and around the proposed Design Scheme B at the Central Waterfront Site.
The study was undertaken in accordance with the requirements stipulated in the Australasian Wind Engineering Society Quality Assurance Manual, AWES-QAM-1-2001 (2001) and the American Society of Civil Engineers Manual and Report on Engineering Practice No. 67 for Wind Tunnel Studies of Buildings and Structures (1999). The study was also conducted in accordance with the recommendations of Planning Department’s Feasibility Study for Establishment of Air Ventilation Assessment System – Final Report (2005) and Technical Guide for Air Ventilation Assessment for Developments in Hong Kong (2005).
A 1:400 scale model of the study area and surrounding areas was fabricated to include all known existing and proposed surrounding buildings, structures and topographical features within a diameter of approximately 1760 m, in accordance with plans, drawings and information supplied by CH2M HILL Hong Kong Limited, Aedas Limited and Planning Department during the period of 28 November 2007 to 5 December 2007 inclusive.
A 1:2000 scale site wind availability study has been undertaken previously (WWTF Investigation Report WWTF007-2006) to determine the effects of local topography on mean wind direction, mean wind speed and turbulence intensity of non-typhoon winds approaching the proposed development site at the new Central Waterfront. The results of that study were combined with a probabilistic model of the Hong Kong non-typhoon wind climate, based on wind speed and direction measurements taken by Hong Kong Observatory (HKO) at Waglan Island during the period of 1953 – 2000 inclusive, to determine the site wind availability for the proposed development site.
Wind speeds were measured at 144 test points, including 17 special test points, within the proposed development site for 16 wind directions ranging from 22.5º to 360º (north) at increments of 22.5º using a multi-channel thermal anemometer system. Directional wind velocity ratios were measured at each individual test point and subsequently combined with the site wind availability data to determine annual overall wind velocity ratios, spatial averaged wind velocity ratios for the whole region, i.e. the Assessment Area and Project Site, and for each of the Sites 1, 2, 3 and 4 and functional areas, namely a High-rise Development Area, Existing Development Area, Open Area, North Harbourfront, East Harbourfront and West Harbourfront, instructed by Planning Department.
Overall wind velocity ratios within Sites 1 and 2 were the highest among the designated sites and instructed functional areas, which is attributed to a combination of the presence of tall buildings within the Sites and their proximity to Victoria Harbour. The medium-rise buildings within Site 3 had localised effects on the measured velocity ratios. In particular, air ventilation conditions were adversely affected at the southern end of Site 3 which is

ii
attributed to the relatively enclosed area formed by the large landscaped podium and adjacent structures. Low-rise buildings in Site 4 and the nearby landscape features, and the piers in the North Harbourfront and the West Harbourfront influenced the winds from north east quadrant, reducing the overall wind velocity ratios over those areas.
The relatively low height of the buildings in Site 4, the North Harbourfront and the West Harbourfront allowed upper level winds from the north-east and north-west quadrants to penetrate further into the built environment of the Existing Development Area and the High-rise Development Area. Overall wind velocity ratios were enhanced by the penetration of upper level winds and their subsequent interaction with the tall buildings in those Areas.
iii
NOMENCLATURE
F wind speed scaling factor;
M the total number of test points at pedestrian level;
pi annual probability of occurrence of winds approaching the study site (%);
SAVR Spatial Averaged Velocity Ratio;
open,500u directional non-typhoon mean wind speed at 500 mPD above open terrain
(m/s);
refu mean wind speed measured at the nominated reference height (m/s);
zu mean wind speed measured at a height z (m/s);
Vp,i,j wind speed at pedestrian level, i.e. at 2 m above ground at each test point and
under the influence of buildings and other urban features (m/s);
VR500,i,j directional wind velocity ratio, with respect to the reference mean wind speed
at 500 m, for a particular wind direction (i) at the j-th test point,
i,500
j,i,pj,i,500 V
VVR = ;
∞V wind speed at the top of the atmospheric boundary layer, taken as the wind
velocity at 500 mPD in this study, denoted as V500,i (m/s);
VRw,j overall wind velocity ratio of the j-th test point, �=
×=16
1ij,i,500ij,w VRpVR .

iv
TABLE OF CONTENTS
1. INTRODUCTION _______________________________________________________________ 1
2. WIND TUNNEL MODELLING _____________________________________________________ 2
2.1 Modelling the Natural Wind ___________________________________________________ 2 2.2 Non-typhoon Wind Climate for the New Central Waterfront ________________________ 3 2.3 Physical Model of the new Central Waterfront____________________________________ 4
3. EXPERIMENTAL AND ANALYSIS PROCEDURE _____________________________________ 6
3.1 Wind Tunnel Testing_________________________________________________________ 6 3.2 Wind Speed Measurements and Analysis Procedures _____________________________ 6
4. EXPERIMENTAL RESULTS AND DISCUSSION ______________________________________ 8
4.1 Annual Spatial Average Wind Velocity Ratios (SAVR) _____________________________ 8 4.2 Topography Effects on Overall Wind Velocity Ratios______________________________ 8 4.3 Effects of Annual Directional Probabilities of Occurrence on Overall Wind Velocity Ratios __________________________________________________________________________ 8 4.4 Air Ventilation Conditions within the Project Site _________________________________ 9 4.5 Air Ventilation Conditions within the Assessment Area___________________________ 11 4.6 Recommendations for improving wind conditions at relevant locations within the Project Site _____________________________________________________________________ 12
5. CONCLUSIONS _______________________________________________________________ 14
6. REFERENCES ________________________________________________________________ 16
LIST OF TABLES Table 1 Directional approach wind conditions 17 Table 2 Wind speed scaling factors for the new Central Waterfront 17 Table 3 Annual probabilities of occurrence for directional winds 18 Table 4 SAVR for the Assessment Area and the Project Site 18 Table 5 Overall wind velocity ratios (VRw,j) for all test points 19
LIST OF FIGURES Figure 1 Assessment Area and Project Site – New Central Waterfront Study 22 Figure 2 Focus Areas and Functional Areas – New Central Waterfront Study 23 Figure 3 1:400 scale wind characteristics, approach condition A 24 Figure 4 Longitudinal velocity spectrum of 1:400 scale wind, approach condition A 24 Figure 5 1:400 scale wind characteristics, approach condition B 25 Figure 6 Longitudinal velocity spectrum of 1:400 scale wind, approach condition B 25 Figure 7 1:400 scale wind characteristics, approach condition C 26 Figure 8 Longitudinal velocity spectrum of 1:400 scale wind, approach condition C 26 Figure 9 Wind rose for annual non-typhoon winds at Waglan Island, corrected to 500 m 27 Figure 10 Wind rose for annual non-typhoon winds at the new Central Waterfront, corrected to 100 m 28 Figure 11 A 1:400 scale model of Design Scheme B at the New Central Waterfront in the low speed test
section of the CLP Power Wind/Wave Tunnel Facility 29 Figure 12 Layout of proposed buildings within the Project Site: Design Scheme B 31
v
Figure 13 Models of the proposed buildings within the Project Site: Design Scheme B 32 Figure 14 Locations of test points: Design Scheme B 33 Figure 15 Overall wind velocity ratios – annual 34
APPENDICES Appendix I Tabulated Wind Rose Data
Appendix II Directional Wind Velocity Ratios of the Test Points
CH2M HILL Hong Kong Limited Central Waterfront Site - Wind Tunnel Test Report for Scheme B
August 2008 1
1. INTRODUCTION
1.1.1.1 At the request of the CH2M HILL Hong Kong Limited, on behalf of Planning Department of The Government of the Hong Kong Special Administrative Region (HKSAR), wind tunnel model tests were conducted in the low speed test section of the CLP Power Wind/Wave Tunnel Facility (WWTF) at The Hong Kong University of Science and Technology (HKUST) for an air ventilation assessment (AVA) to investigate the pedestrian level wind environment within and around the proposed Design Scheme B at the new Central Waterfront development. The Assessment Area and the Project Site are shown in Figure 1. The Project Site comprises Sites 1, 2, 3 and 4 as indicated in Figure 2. In accordance with the instructions of Planning Department on 17 April 2008, the Project Site and Assessment Area were further subdivided into a number of functional areas, namely a High-rise Development Area, Existing Development Area, Open Area, North Harbourfront, East Harbourfront and West Harbourfront for the air ventilation assessment study.
1.1.1.2 A 1:400 scale model of the Assessment Area, Project Site and the surrounding areas was fabricated to include all known existing and proposed surrounding buildings, structures and topographical features within a diameter of approximately 1760 m, in accordance with plans, drawings and information supplied by CH2M HILL Hong Kong Limited, Aedas Limited and Planning Department during the period of 28 November 2007 to 5 December 2007 inclusive.
1.1.1.3 Wind speed measurements were taken at 22.5º increments for the full 360º azimuth (i.e. 16 wind directions), where a wind direction of 0º or 360º corresponds to an incident wind approaching the proposed development site directly from the north, 90º corresponds to an incident wind approaching the proposed development site directly from the east, etc. A multi-channel thermal anemometer was used to measure wind speeds at 144 test points that were jointly selected by WWTF, Planning Department and CH2M HILL Hong Kong Limited.
1.1.1.4 Wind tunnel test results were combined with WWTF’s statistical model of the Hong Kong non-typhoon wind climate based on measurements of wind speed and direction taken by Hong Kong Observatory (HKO) at Waglan Island during the period of 1953 to 2000 inclusive (Hitchcock et al., 2003) to determine the wind velocity ratios at each test point.
1.1.1.5 The wind tunnel model study was undertaken in accordance with the requirements stipulated in the Australasian Wind Engineering Society Quality Assurance Manual, AWES-QAM-1-2001 (2001) and the American Society of Civil Engineers Manual and Report on Engineering Practice No. 67 for Wind Tunnel Studies of Buildings and Structures (1999). The study was also conducted in accordance with the recommendations of Planning Department’s Feasibility Study for Establishment of Air Ventilation Assessment System – Final Report (2005) and Technical Guide for Air Ventilation Assessment for Developments in Hong Kong (2005).
CH2M HILL Hong Kong Limited Central Waterfront Site - Wind Tunnel Test Report for Scheme B
August 2008 2
2. WIND TUNNEL MODELLING
2.1 Modelling the Natural Wind
2.1.1.1 In conducting wind tunnel model tests of structures on the surface of the Earth, it is necessary to adequately simulate the lowest layer of the atmosphere, known as the atmospheric boundary layer. It is within this layer that the surface of the Earth imparts drag forces on the moving air, generally resulting in mean wind speed increasing with height to a point where the effects of surface drag become negligible. In wind engineering, a convenient measure of the thickness of the atmospheric boundary layer is commonly referred to as the gradient height and its magnitude depends on the surrounding surface roughness over which the air must flow. Obstacles to air flow can vary from relatively large expanses of smooth, open water, to vegetation such as forests, built-up environments such as city centres, and large, rugged mountain ranges. The resulting gradient heights are typically in the range of several hundred metres to in excess of 1000 m.
2.1.1.2 A 1:2000 scale site wind availability study has been undertaken previously (WWTF Investigation Report WWTF007-2006) to determine the effects of topography on local wind conditions and the site wind availability close to the proposed development site. In that study, all buildings and structures within the proposed development site were removed for all measured wind directions, and measurements were taken at eight (8) heights above the study area. Measurements were taken at 22.5° intervals for the full 360o azimuth to determine the characteristics of winds approaching the site.
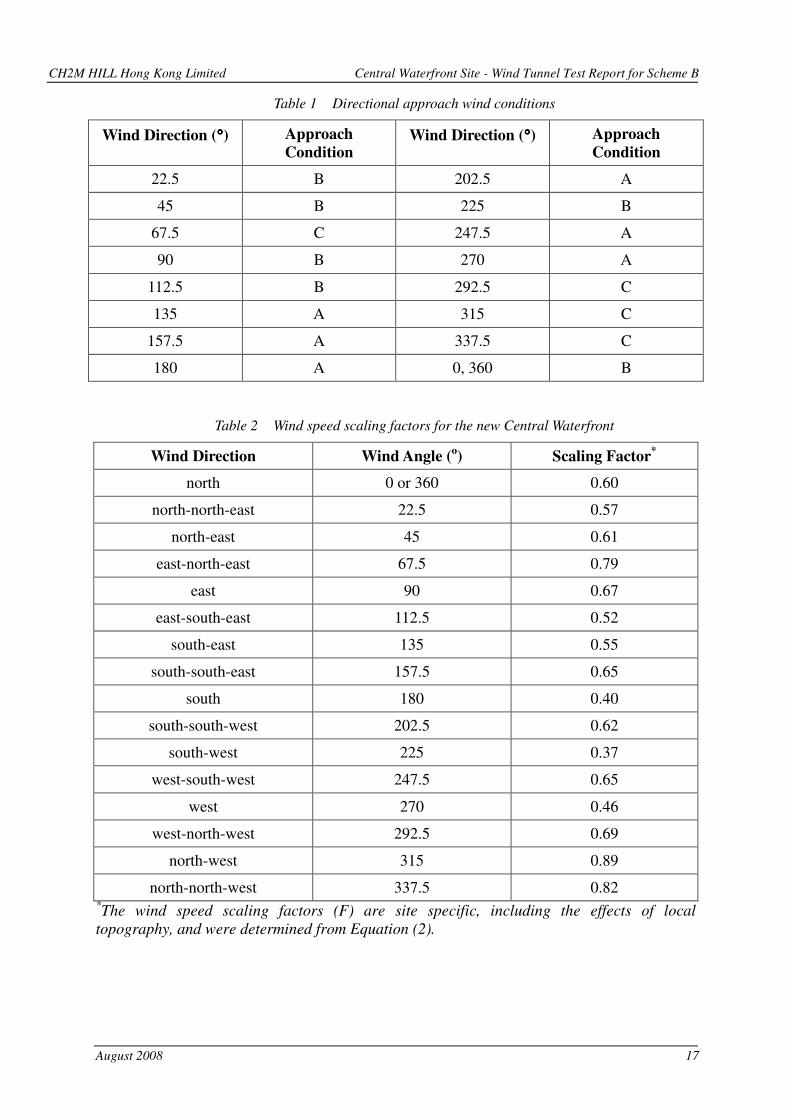
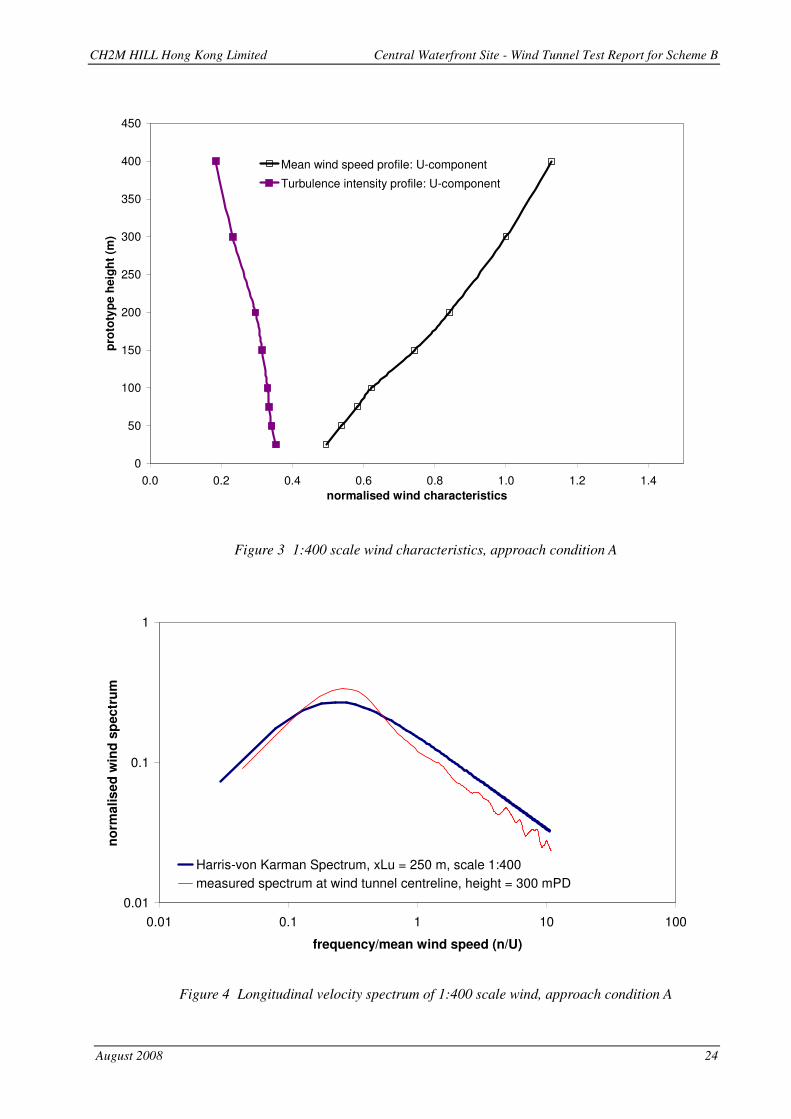
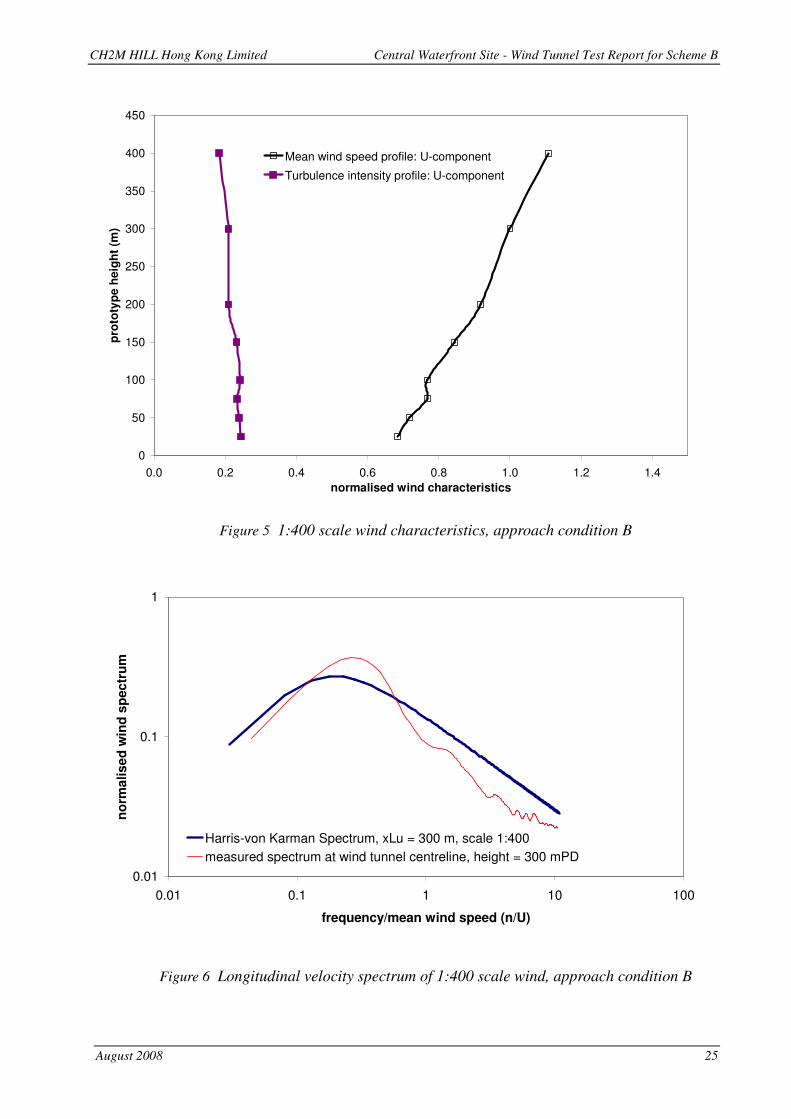
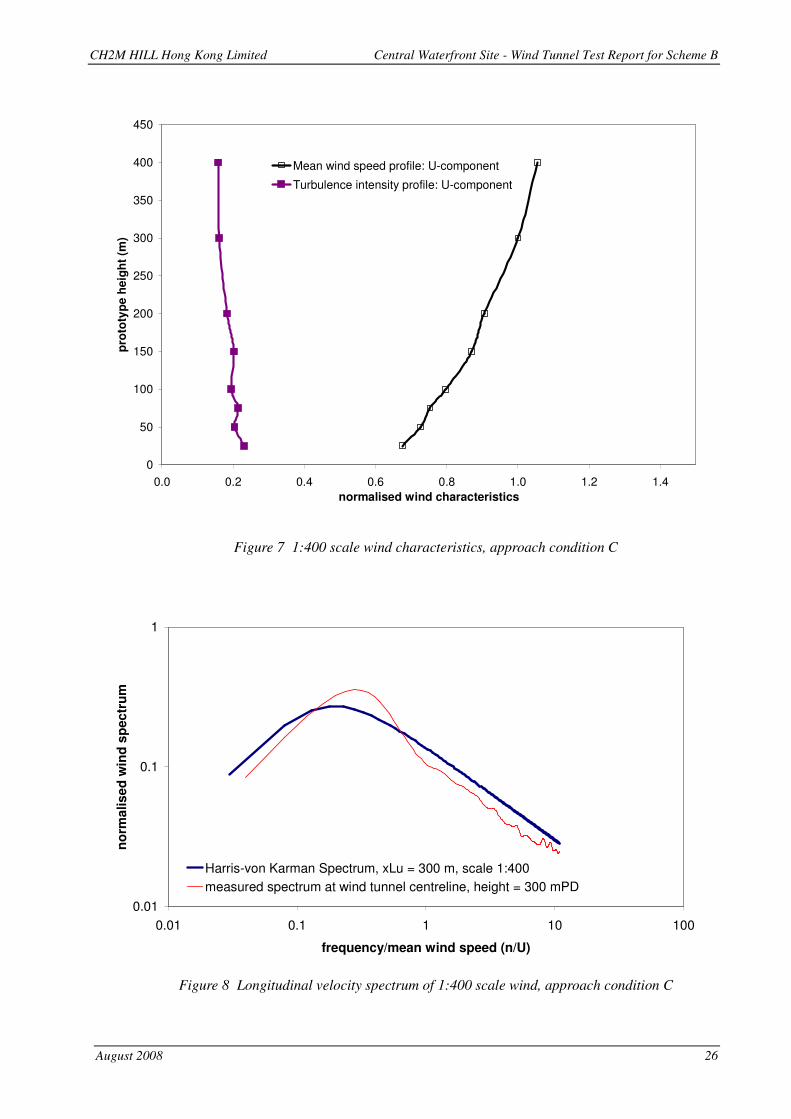
2.1.1.3 Due to the similarities between both mean wind speed and turbulence intensity profiles for certain wind directions, three representative approach profiles (denoted here as approach conditions A, B and C) are considered to be adequate to represent the range of wind conditions affected by the local terrain for the full 360° azimuth. The approach conditions corresponding to each of the 16 wind directions tested are presented in Table 1. Mean wind speed profiles, turbulence intensity profiles and longitudinal velocity spectra for the approach conditions A, B and C are presented in graphical form in Figures 3 to 8.
2.1.1.4 For all tests, reference wind speeds were measured at a height of 300 mPD. Wind speed scaling factors (F) were applied to relate the non-typhoon wind speed at 500 mPD above open terrain to wind speeds at the reference height, as shown in Equation (1).
open,500ref uFu = (1)
where:
F = wind speed scaling factor;
refu = the mean wind speed measured at the reference height (equivalent to 300
mPD in this 1:400 scale study); and

CH2M HILL Hong Kong Limited Central Waterfront Site - Wind Tunnel Test Report for Scheme B
August 2008 3
open,500u = directional non-typhoon mean wind speed at 500 mPD above open
terrain.
2.1.1.5 The wind speed scaling factors (F) are based on the matching of mean wind speeds between the 1:2000 scale topographical model and the 1:400 scale model as shown in Equation (2), averaged over four heights equivalent to 25 mPD, 50 mPD, 75 mPD and 100 mPD at prototype scale.
:4001z
ref
:20001open500,
z
uu
uu
F ��
���
�
���
�
���
�=
where:
zu = mean wind speed measured at a height z (i.e. where z is equivalent to 25 mPD, 50 mPD, 75 mPD and 100 mPD respectively at prototype scale);
refu = wind speed measured at the reference height (zref) in the 1:400 scale tests, taken as 300 mPD for this study; and
open,500u = directional mean wind speed at 500 mPD above open terrain.
2.1.1.6 The wind speed scaling factors presented in Table 2 for each of the 16 measured wind directions were determined as an average from the wind speeds measured in the 1:2000 and 1:400 scale tests at 25 mPD, 50 mPD, 75 mPD and 100 mPD.
2.2 Non-typhoon Wind Climate for the New Central Waterfront
2.2.1.1 In the assessment of the pedestrian level wind environment, the primary concerns are of pedestrian comfort and safety. The main objective for conducting an AVA is to investigate and determine the likely impact of buildings on air flow at pedestrian level within the proposed development sites at the new Central Waterfront. Although the current AVA framework does not provide absolute criteria by which wind conditions may be quantitatively assessed as acceptable or unacceptable on the basis of comfort or safety, it does provide a relative indicator of potential wind conditions that are likely to occur on a relatively frequent basis. Typhoons affect Hong Kong, on average, only once or twice per year during the summer months and, from the point of view of safety, it is expected that people would remain indoors during typhoon wind events. Hence, typhoon winds have been excluded from this study and only non-typhoon winds have been considered in the current assessment and prediction of pedestrian level wind conditions for the proposed development site.
2.2.1.2 Waglan Island, located approximately 5 km south-east of Hong Kong Island, has been used by HKO for the collection of long-term wind data since December 1952. Due to its location, relative lack of development and its generally uninterrupted exposure to winds, data collected at Waglan Island is considered to be representative of winds approaching the Hong Kong region.
2.2.1.3 HKO data, measured at Waglan Island during the period of January 1953 to May 2000 inclusive, have been combined with wind tunnel measurements to determine a
CH2M HILL Hong Kong Limited Central Waterfront Site - Wind Tunnel Test Report for Scheme B
August 2008 4
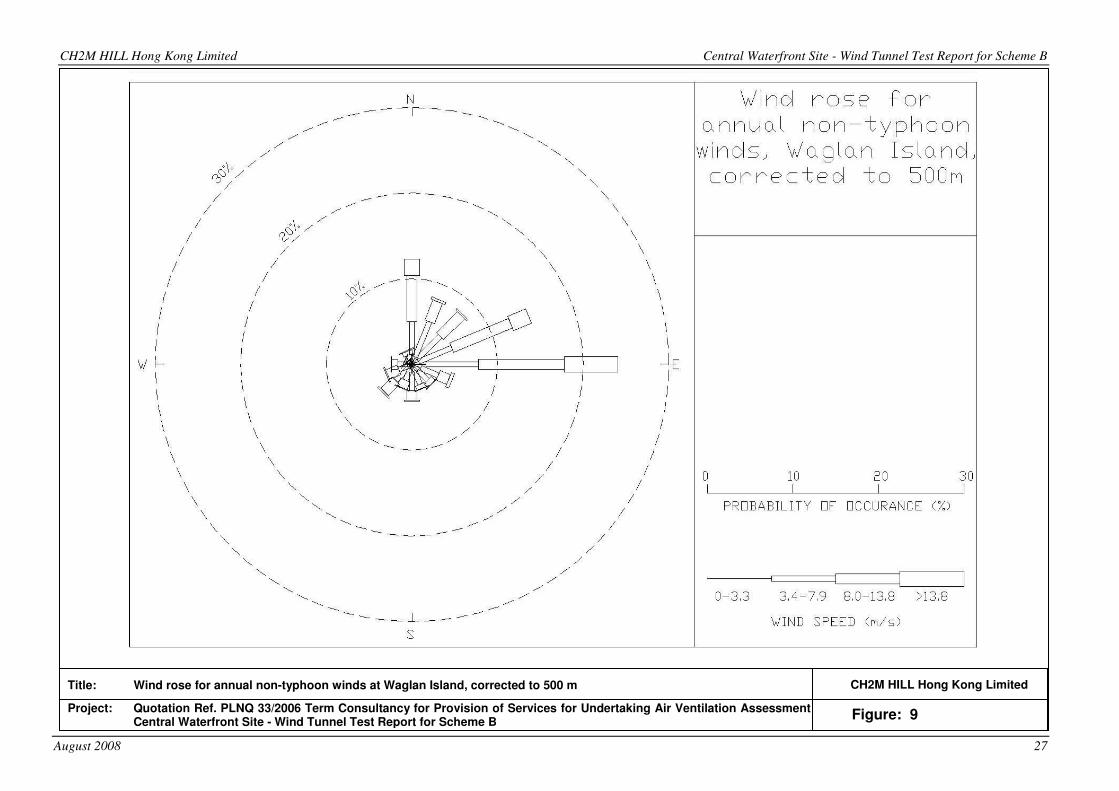
probabilistic model of mean speed and direction of non-typhoon winds affecting Hong Kong (Hitchcock et al. 2003). The wind rose representing annual, non-typhoon winds at Waglan Island, corrected to 500 m, is presented in Figure 9, which indicates that the prevailing non-typhoon winds affecting Hong Kong occur mainly from northerly, easterly and south to south-westerly directions.
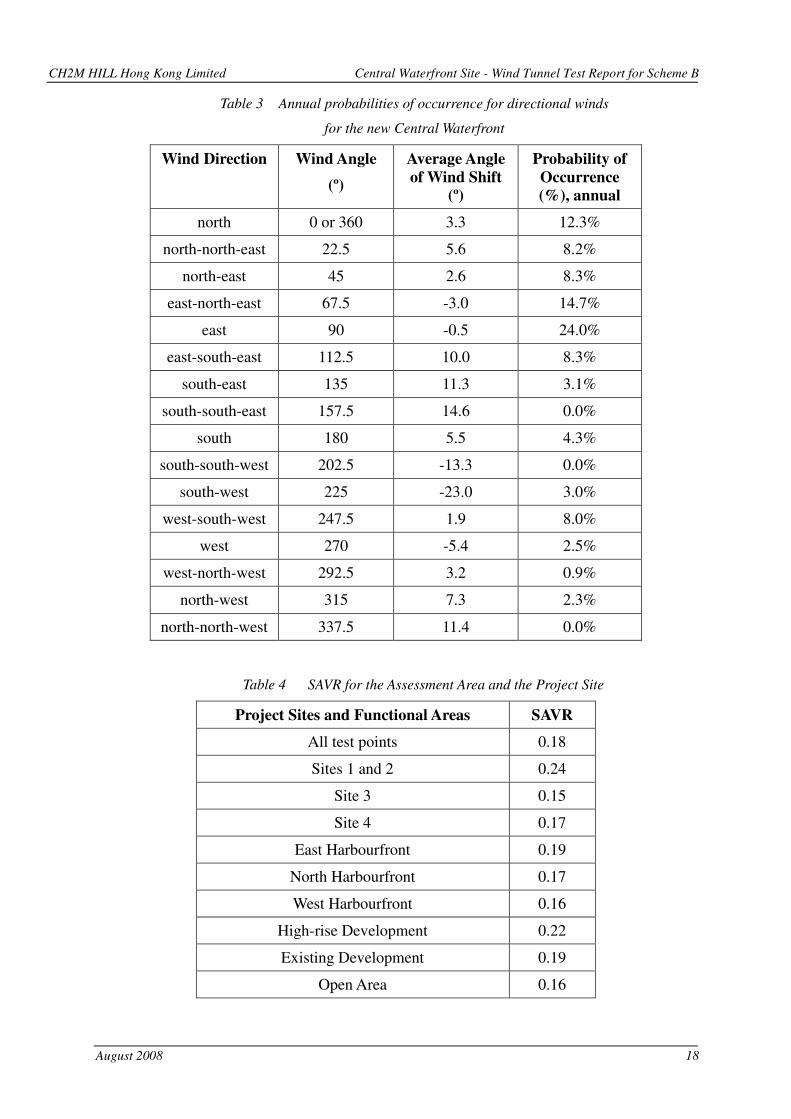
2.2.1.4 The results obtained from the previously conducted 1:2000 scale site wind availability study (WWTF Investigation Report WWTF007-2006) correspond to 22.5º sectors, for example the east sector corresponds to winds from 90º ± 11.25º, and some deviations were noted for certain approach wind directions. For this study, those deviations, or wind shifts, were averaged over heights of 25 mPD, 50 mPD, 75 mPD, 100 mPD, 150 mPD and 200 mPD, i.e. the range of heights in the current study that are considered likely to influence pedestrian level wind conditions. If the average wind shift determined in the 1:2000 scale study deviated by more than ±11.25º from the approach wind direction, those winds were treated as having shifted to an adjacent sector. Therefore, the probability of occurrence was added to that of the adjacent sector and the annual directional probabilities of occurrence were adjusted accordingly, as presented Table 3.
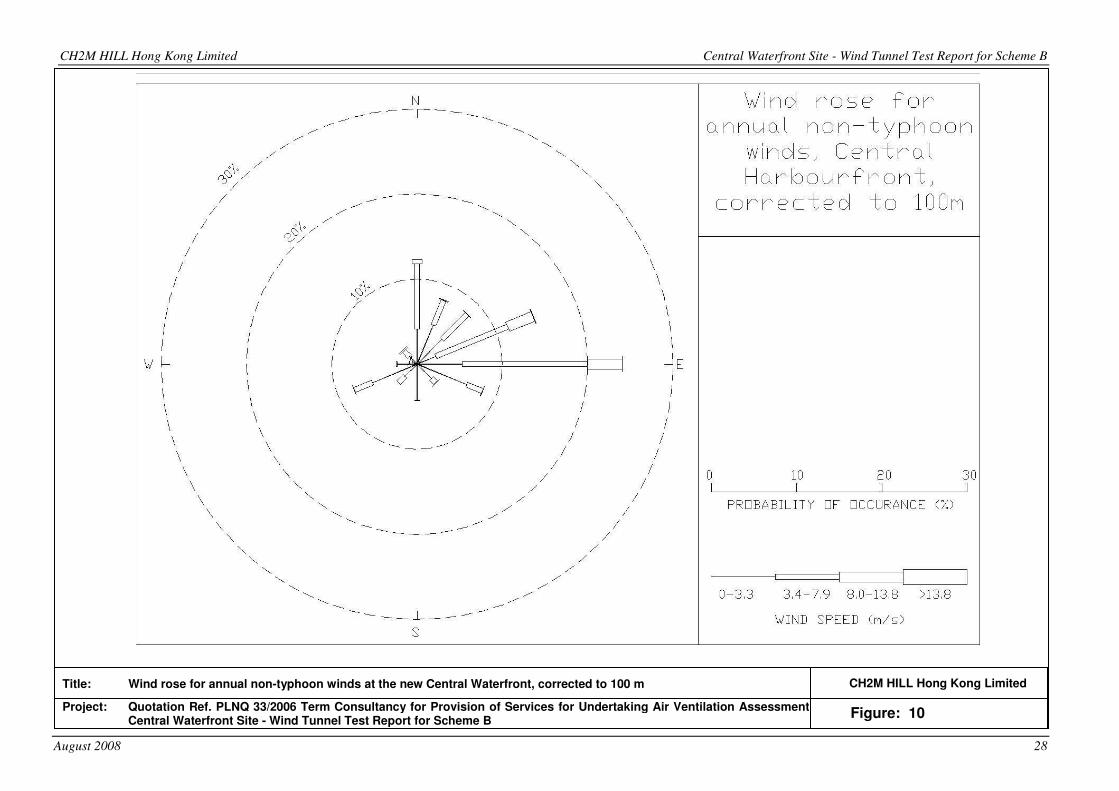
2.2.1.5 A probabilistic model of mean speed and direction of non-typhoon winds at the new Central Waterfront was then determined by combining the adjusted annual directional probabilities of occurrence with wind speed data from the previously conducted 1:2000 scale site wind availability study (WWTF Investigation Report WWTF007-2006) to determine the annual wind rose, corrected to a height of 100 m and incorporating the wind shifts averaged over heights of 25 mPD, 50 mPD, 75 mPD, 100 mPD, 150 mPD and 200 mPD, for the new Central Waterfront, as presented in Figure 10. Corresponding data are also presented in tabular form in Appendix A.
2.2.1.6 In Figure 10, mean wind speeds are segregated into four categories (0 – 3.3 m/s, 3.4 – 7.9 m/s, 8.0 – 13.8 m/s and greater than 13.8 m/s) that are indicated by the thickness of the bars for the 16 cardinal wind directions. The length of the bars indicates the average probability of occurrence per year. For example, Figure 10 illustrates that, on an annual basis at a height of 100 m, east winds occur approximately 24.0% of the time and hourly mean wind speeds for east winds are in the range of 3.4 m/s to 7.9 m/s for approximately 14.6% of the time.
2.2.1.7 It is obvious from Figure 10 that, on an annual basis, the prevailing winds approach the proposed development site from the north, east-north-east and east (0°, 67.5° and 90°) with a total percentage occurrence of more than 50%. In the previously conducted site wind availability study (WWTF Investigation Report WWTF007-2006), significant wind shifts were recorded for winds approaching the proposed development site from 135°, 157.5°, 202.5°, 225° and 337.5°, thereby affecting the average annual probability of occurrence for winds approaching the proposed development site from 112.5°, 135°, 157.5°, 202.5°, 225°, 247.5°, 315° and 337.5°
2.3 Physical Model of the new Central Waterfront
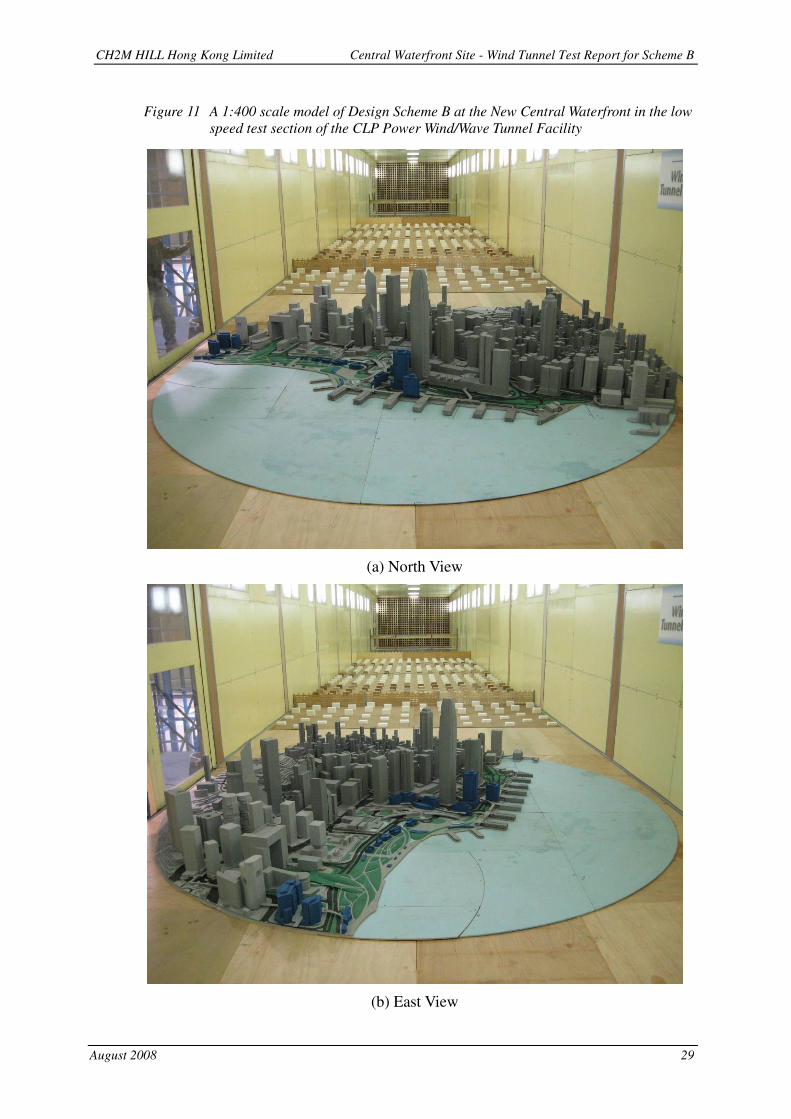
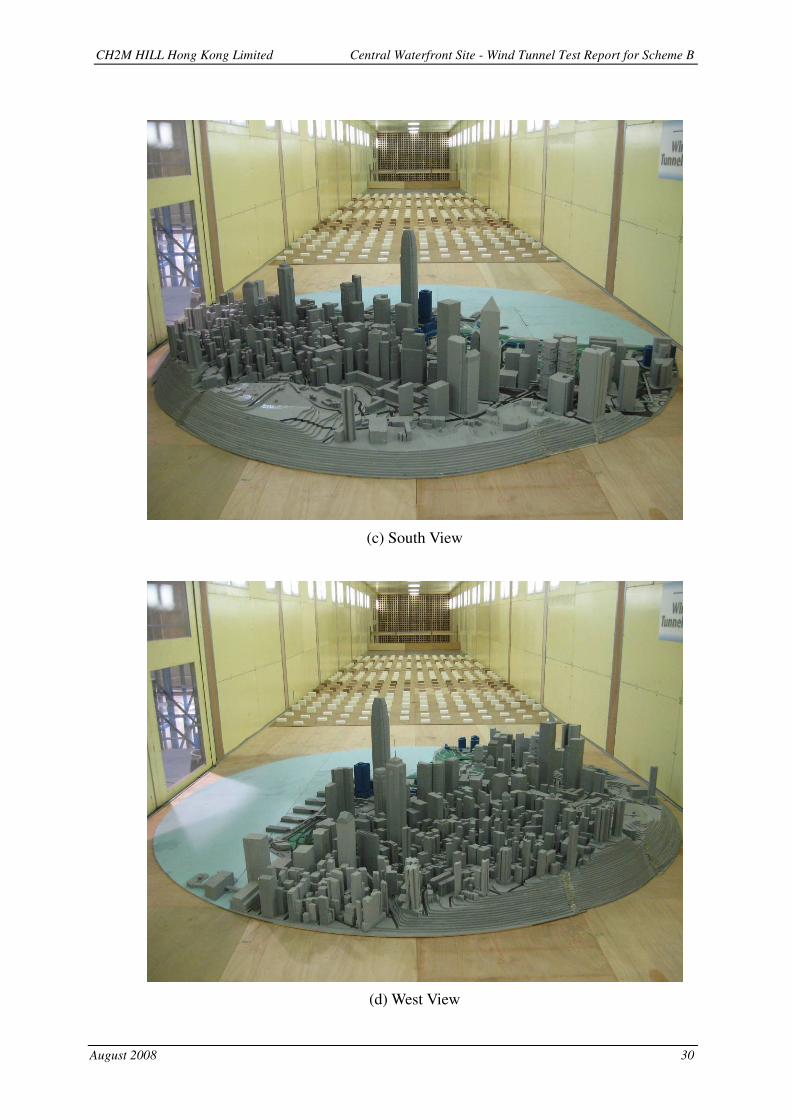
2.3.1.1 A 1:400 scale model of the new Central Waterfront (Scheme B) was tested in WWTF’s low speed test section, as shown for various illustrative views in Figures 11a to 11d. The test model was fabricated to include all known existing and proposed buildings, structures and topographical features within a radius of
CH2M HILL Hong Kong Limited Central Waterfront Site - Wind Tunnel Test Report for Scheme B
August 2008 5
approximately 880 m from the centre of the proposed development site at the new Central Waterfront
2.3.2 Central Waterfront Study Site Boundary
2.3.2.1 The Project Site for the new Central Waterfront study covered an area of 16.2 ha along the Central Waterfront, as shown in Figure 1. The Project Site (Sites 1, 2, 3 and 4) as earmarked by Planning Department for development were the focus of the current AVA. The Assessment Area covered an area of 48.2 ha and was bounded by Victoria Harbour to the north, the Central Government Complex to the east, Connaught Road Central, including Statue Garden, to the south, and International Finance Centre (IFC) to the west.
2.3.3 Buildings and Streetscape within and Adjacent to the Project Site and Assessment Area
2.3.3.1 The Project Site is bounded by Victoria Harbour to the north while the areas to the south and west of the Project Site are bounded by the Central and Admiralty business districts, including the People’s Liberation Army Hong Kong Garrison Headquarters, City Hall, Connaught Centre, Exchange Square and the International Finance Center complex.
2.3.3.2 The adjacent Central and Admiralty business districts comprise a mixture of parks (including Hong Kong Park, Chater Garden and Statue Square), roads and overpasses, and high-rise buildings. The effects of the mountainous terrain to the south of the Project Site, such as the 552 m Victoria Peak, were measured in the previously undertaken site wind availability study (WWTF Investigation Report WWTF007-2006) and hence those topographical features were not included in the 1:400 scale model for the detailed AVA.
2.3.4 Proposed Building Layout within the Project Site
2.3.4.1 The layout of proposed buildings within the Project Site for Design Scheme B is shown in Figures 12 and 13. Proposed buildings for Sites 1 and 2 comprise three piers earmarked for retail (18 mPD), an office building (81 mPD), an office and retail complex (140 mPD) with a public transport interchange (PTI), and an elevated covered walkway linking Central to the ferry terminals.
2.3.4.2 Proposed buildings for Site 3 comprise a cluster of four office and retail buildings (43 to 50 mPD) linked by covered walkway and landscaped podium, and gallery building (10 mPD) close to the centre of the Site.
2.3.4.3 Proposed buildings for Site 4 comprise a cluster of four buildings (15 to 20 mPD) designated for commercial and leisure use.
CH2M HILL Hong Kong Limited Central Waterfront Site - Wind Tunnel Test Report for Scheme B
August 2008 6
3. EXPERIMENTAL AND ANALYSIS PROCEDURE
3.1 Wind Tunnel Testing
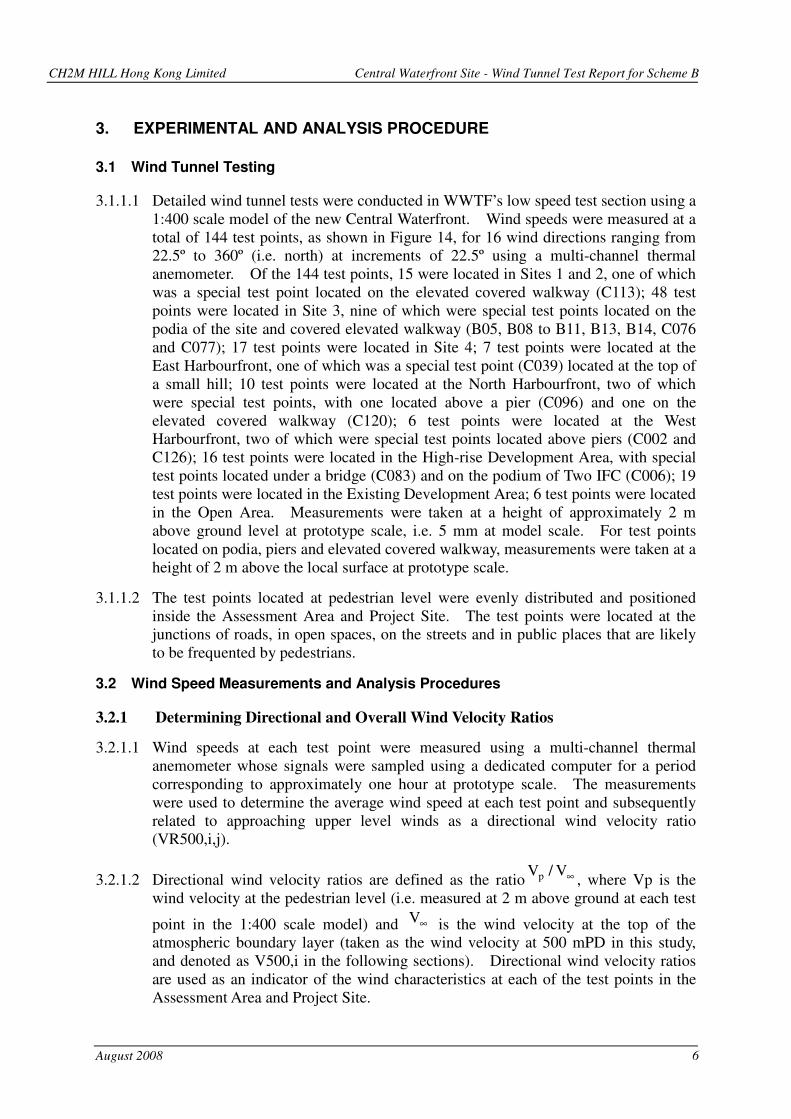
3.1.1.1 Detailed wind tunnel tests were conducted in WWTF’s low speed test section using a 1:400 scale model of the new Central Waterfront. Wind speeds were measured at a total of 144 test points, as shown in Figure 14, for 16 wind directions ranging from 22.5º to 360º (i.e. north) at increments of 22.5º using a multi-channel thermal anemometer. Of the 144 test points, 15 were located in Sites 1 and 2, one of which was a special test point located on the elevated covered walkway (C113); 48 test points were located in Site 3, nine of which were special test points located on the podia of the site and covered elevated walkway (B05, B08 to B11, B13, B14, C076 and C077); 17 test points were located in Site 4; 7 test points were located at the East Harbourfront, one of which was a special test point (C039) located at the top of a small hill; 10 test points were located at the North Harbourfront, two of which were special test points, with one located above a pier (C096) and one on the elevated covered walkway (C120); 6 test points were located at the West Harbourfront, two of which were special test points located above piers (C002 and C126); 16 test points were located in the High-rise Development Area, with special test points located under a bridge (C083) and on the podium of Two IFC (C006); 19 test points were located in the Existing Development Area; 6 test points were located in the Open Area. Measurements were taken at a height of approximately 2 m above ground level at prototype scale, i.e. 5 mm at model scale. For test points located on podia, piers and elevated covered walkway, measurements were taken at a height of 2 m above the local surface at prototype scale.
3.1.1.2 The test points located at pedestrian level were evenly distributed and positioned inside the Assessment Area and Project Site. The test points were located at the junctions of roads, in open spaces, on the streets and in public places that are likely to be frequented by pedestrians.
3.2 Wind Speed Measurements and Analysis Procedures
3.2.1 Determining Directional and Overall Wind Velocity Ratios
3.2.1.1 Wind speeds at each test point were measured using a multi-channel thermal anemometer whose signals were sampled using a dedicated computer for a period corresponding to approximately one hour at prototype scale. The measurements were used to determine the average wind speed at each test point and subsequently related to approaching upper level winds as a directional wind velocity ratio (VR500,i,j).
3.2.1.2 Directional wind velocity ratios are defined as the ratio ∞V/Vp , where Vp is the wind velocity at the pedestrian level (i.e. measured at 2 m above ground at each test
point in the 1:400 scale model) and ∞V is the wind velocity at the top of the atmospheric boundary layer (taken as the wind velocity at 500 mPD in this study, and denoted as V500,i in the following sections). Directional wind velocity ratios are used as an indicator of the wind characteristics at each of the test points in the Assessment Area and Project Site.
CH2M HILL Hong Kong Limited Central Waterfront Site - Wind Tunnel Test Report for Scheme B
August 2008 7
3.2.1.3 Directional wind velocity ratios were measured at 22.5º intervals for the full 360º azimuth (i.e. 16 wind directions) for each test point. At a particular wind direction (i), the wind velocity ratio of the j-th test point is expressed in Equation (3).
500,i
jp,i,j500,i, V
VVR = (3)
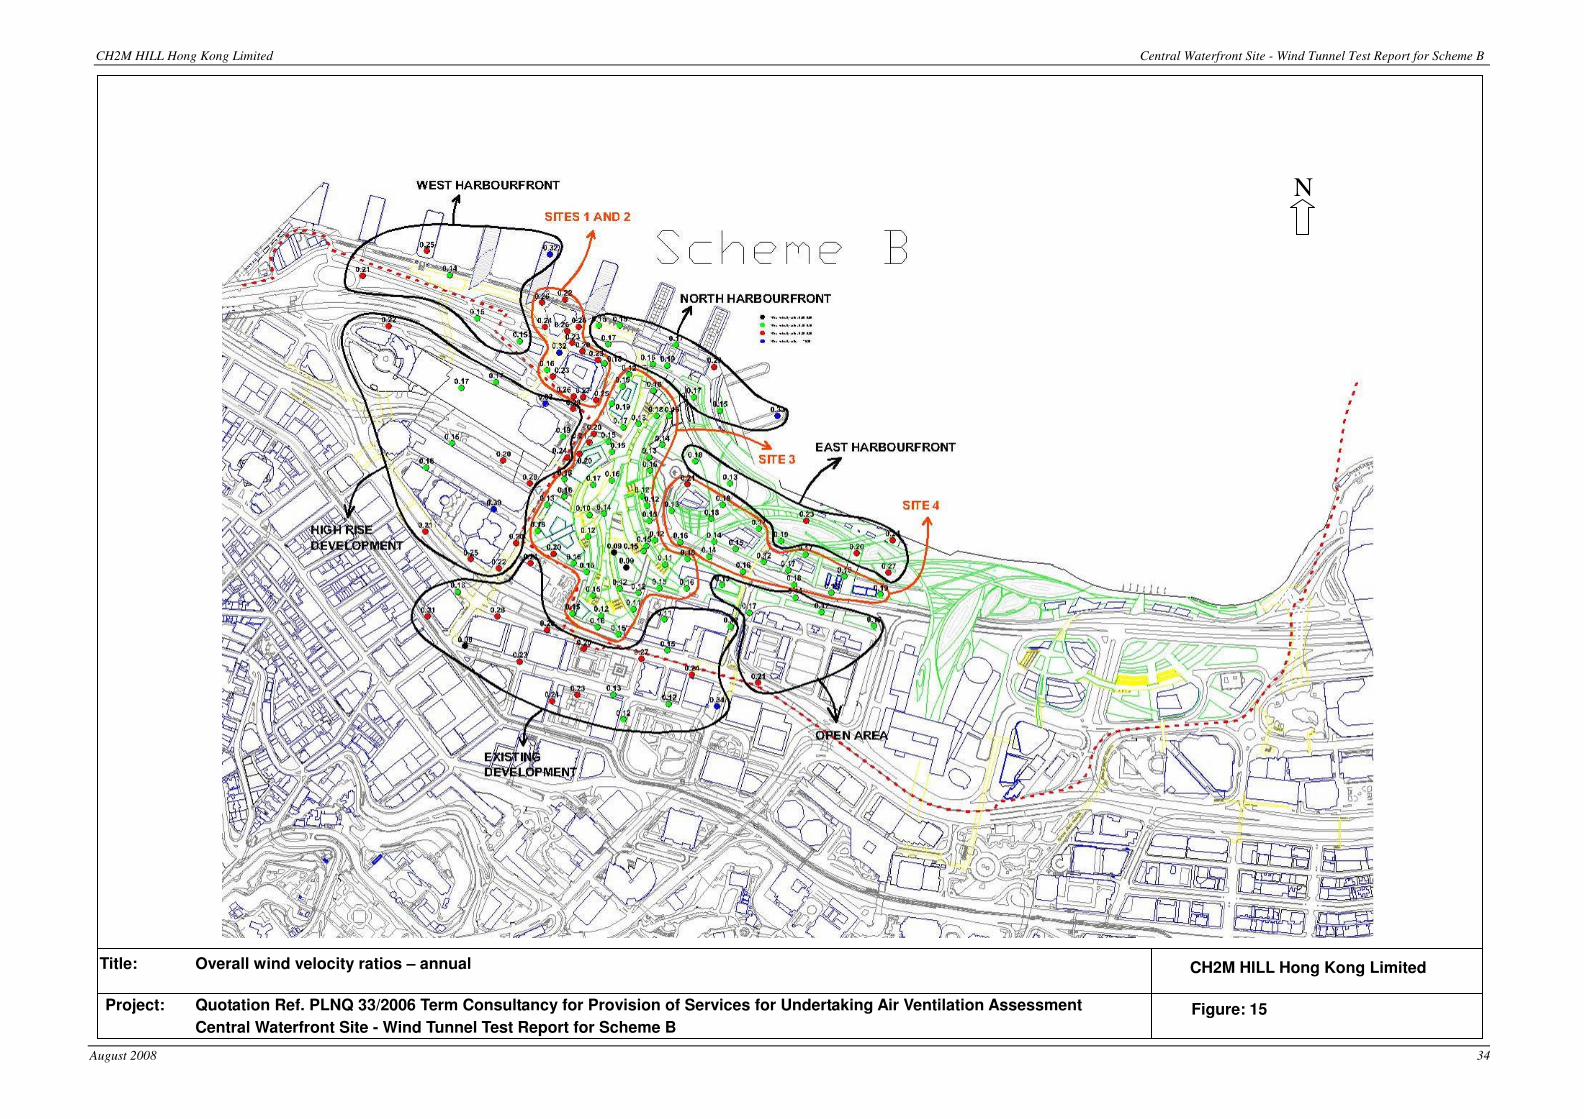
3.2.1.4 The overall wind velocity ratio of the j-th test point (VRw,j) is defined in Equation (4), which accounts for the probability of occurrence (pi) of winds approaching the proposed development site at the new Central Waterfront from each of the 16 measured wind directions. The annual probabilities of occurrence (pi) of the approach winds to the site are expressed as percentages in Table 3 and in Figure 10. The overall wind velocity ratios for all of the test points are summarised in Figure 15.
�=
×=16
1ij500,i,ijw, VRpVR (4)
3.2.2 Definition of Spatial Average Wind Velocity Ratio (SAVR)
3.2.2.1 Spatial average wind velocity ratios (SAVR), defined in Equation (5) as the average of the VRw,j of the test points, excluding all of the indicated special test points, at pedestrian level in the corresponding Sites or functional areas. The SAVR were determined for each of the Sites and functional areas and indicate the air ventilation conditions within each of those Sites and functional areas.
�==
M
1j
jw,
M
VRSAVR (5)
3.2.2.2 where M is the total number of test points at pedestrian level, of which there are 14 in Sites 1 and 2, 39 for Site 3, 17 for Site 4, 6 for the East Harbourfront, 8 for the North Harbourfront, 4 for the West Harbourfront, 14 for the High-rise Development Area, 19 for the Existing Development Area and 6 for the Open Area.
CH2M HILL Hong Kong Limited Central Waterfront Site - Wind Tunnel Test Report for Scheme B
August 2008 8
4. EXPERIMENTAL RESULTS AND DISCUSSION
4.1 Annual Spatial Average Wind Velocity Ratios (SAVR)
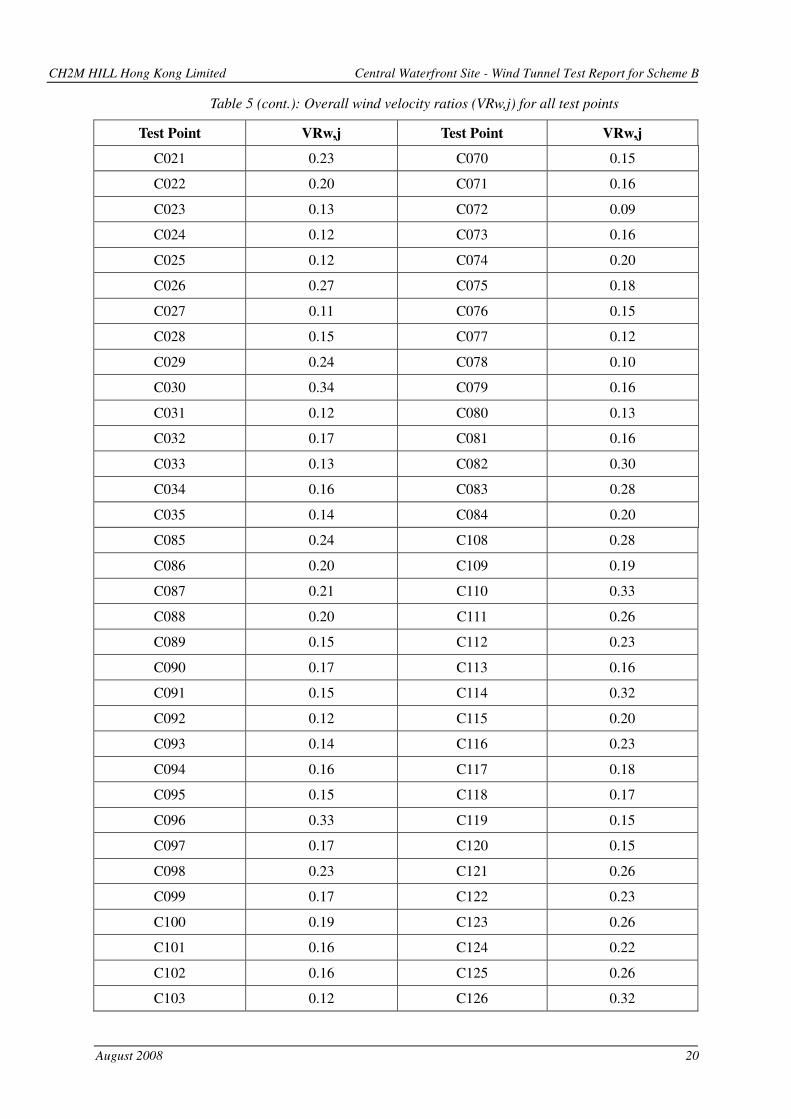
4.1.1.1 SAVR were determined to quantify the general air ventilation conditions within the Assessment Area and the Project Site and they are summarised in Table 4. The SAVR of all the test points, including all of the special test points, in the Assessment Area and Project Site of Design Scheme B at the new Central Waterfront was 0.18. SAVR for Sites 1 and 2, Site 3, and Site 4 are 0.24, 0.15 and 0.17, respectively. The SAVR for the East Harbourfront, North Harbourfront and West Harbourfront functional areas are 0.19, 0.17 and 0.16, respectively. The SAVR for the High-rise Development Area, Existing Development Area and Open Area are 0.22, 0.19 and 0.16, respectively. The overall wind velocity ratios of all test points for the current study are summarised in Table 5. The overall wind velocity ratios and the directional wind velocity ratios, VR500,i,j, for each test point are summarised and classified in Tables B1 to B10 of Appendix B in accordance with the instructed functional areas.
4.2 Topography Effects on Overall Wind Velocity Ratios
4.2.1.1 The air ventilation characteristics of a particular site are heavily influenced by the effects of the surrounding topography on the ability of wind to penetrate into the site and adjacent areas, hence playing an important role in governing the magnitudes of the overall wind velocity ratios at the test points. The topography to the south of the new Central Waterfront is dominated by the mountainous terrain that spans Hong Kong Island, including the 552 m tall Victoria Peak. The previously undertaken site wind availability study (WWTF Investigation Report WWTF007-2006) demonstrated that winds approaching the new Central Waterfront from the south-east and south-west quadrants were generally slowed down, thereby inhibiting wind penetration to the site from those directions. Those characteristics are reflected in the VR500,i,j at the majority of the test points, for which winds approaching the proposed development site from the south-east and south-west quadrants have smaller VR500,i,j than those for winds approaching the site from the north-east and north-west quadrants.
4.3 Effects of Annual Directional Probabilities of Occurrence on Overall Wind Velocity Ratios
4.3.1.1 Annual directional probabilities of occurrence of winds for the proposed development site are also an important factor affecting the overall wind velocity ratios at the test points. One of the main aims of good air ventilation design is to capture and/or convey the available and reliable wind resources, which are indicated by high probabilities of occurrence, to pedestrian level.
4.3.1.2 As shown in Figure 10, the annual wind rose for the proposed development site at the new Central Waterfront, corrected to a height of 100 m, indicates that prevailing non-typhoon winds approaching the site from the north, east-north-east and east (0°, 67.5° and 90°), with a total percentage occurrence of more than 50% on an annual basis. Therefore, those test points with higher VR500,i,j for winds approaching the proposed development site from the north, east-north-east and east also tend to have higher overall wind velocity ratios.
CH2M HILL Hong Kong Limited Central Waterfront Site - Wind Tunnel Test Report for Scheme B
August 2008 9
4.4 Air Ventilation Conditions within the Project Site
4.4.1 Air Ventilation Conditions within the East Harbourfront
4.4.1.1 The SAVR for the East Harbourfront is 0.19, which is similar to the corresponding SAVR of all test points (0.18), including all the special test points.
4.4.1.2 The East Harbourfront area is relatively open with test points C040 and C047 located at positions where effects from adjacent buildings or structures are negligible. The average directional wind velocity ratios of those test points, summarised in Table B11, are representative of the directional wind velocity ratios at pedestrian level at the new Central Waterfront site that are largely unaffected by localised effects caused by buildings. Therefore, for the purposes of comparison in this study, those test points are convenient locations against which other wind velocity ratios within the Assessment Area and Project Site can be benchmarked. The SAVR of these benchmark test points C040 and C047 is 0.24.
4.4.1.3 A relatively low overall wind velocity ratio was measured at test point C059 (VRw,j = 0.13) that is located close to a canopy at the western part of the East Harbourfront. The directional wind velocity ratios, summarised in Table B4, indicated that the position was effectively shielded from winds from north-east quadrant. Hence, the VRw,j of test point C059 is less than the average VRw,j of the benchmark test points.
4.4.2 Air Ventilation Conditions within the North Harbourfront and West Harbourfront
4.4.2.1 The SAVR of the North Harbourfront and West Harbourfront functional areas are 0.17 and 0.16, respectively. The overall wind velocity ratios for test points within the two areas ranged from 0.15 to 0.23 and 0.14 to 0.21 for the North Harbourfront and West Harbourfront, respectively.
4.4.2.2 Although the North Harbourfront and the West Harbourfront areas are located adjacent to Victoria Harbour, the SAVR of the North Harbourfront and West Harbourfront are considerably lower than that of the benchmark test points (0.24). By comparing the directional wind velocity ratios of test points within the North Harbourfront and West Harbourfront areas with the average directional wind velocity ratios of the benchmark test points, it is found that the directional wind velocity ratios, for winds approaching from north-east quadrant, of test points within the North Harbourfront and West Harbourfront are generally reduced by about 40%. The reduction of directional wind velocity ratios for winds approaching from north-east quadrant is likely to be due to the effects of nearby structures, such as the piers to the north-east of the measurement locations.
4.4.3 Air Ventilation Conditions within Sites 1 and 2
4.4.3.1 The SAVR of Sites 1 and 2 is 0.24 and hence is approximately equal to the SAVR of the benchmark test points. The overall wind velocity ratios for Sites 1 and 2 ranged from 0.18 to 0.32.
4.4.3.2 Sites 1 and 2 are characterised by the presence of tall buildings both within the sites and in the adjacent areas, with the tallest building in the Assessment Area, the 420 m tall Two IFC located to the south of Sites 1 and 2. The SAVR of Sites 1 and 2 is the
CH2M HILL Hong Kong Limited Central Waterfront Site - Wind Tunnel Test Report for Scheme B
August 2008 10
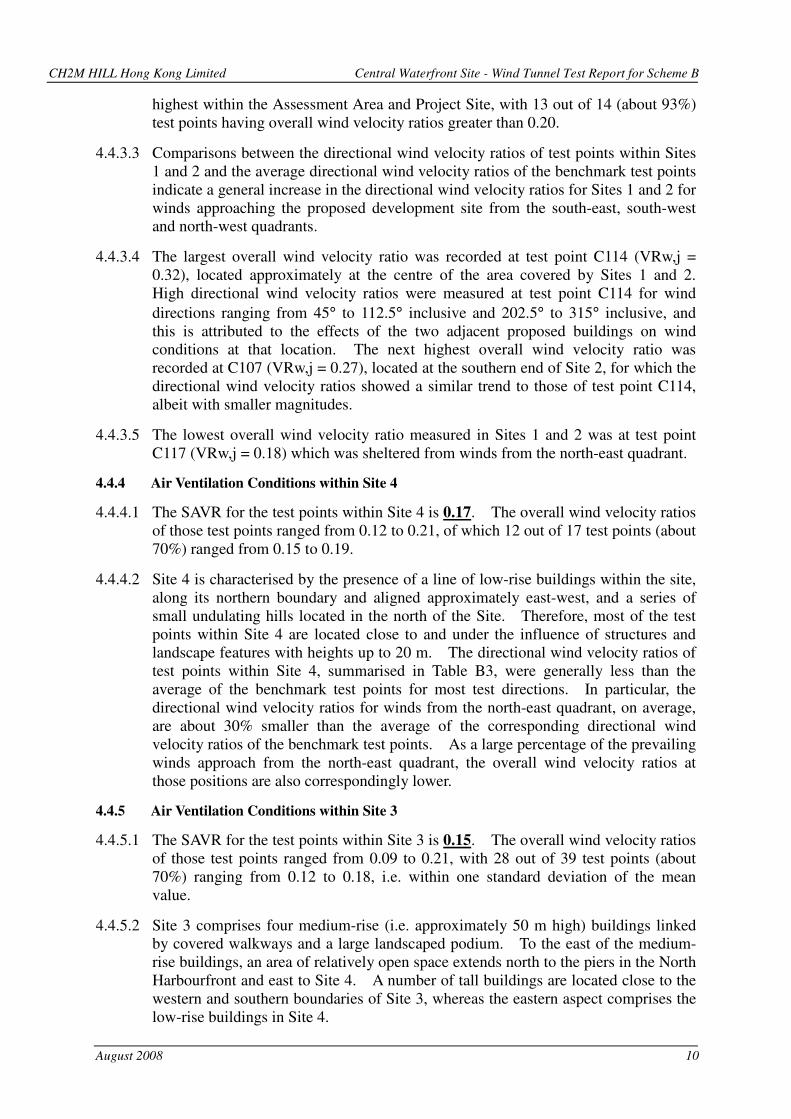
highest within the Assessment Area and Project Site, with 13 out of 14 (about 93%) test points having overall wind velocity ratios greater than 0.20.
4.4.3.3 Comparisons between the directional wind velocity ratios of test points within Sites 1 and 2 and the average directional wind velocity ratios of the benchmark test points indicate a general increase in the directional wind velocity ratios for Sites 1 and 2 for winds approaching the proposed development site from the south-east, south-west and north-west quadrants.
4.4.3.4 The largest overall wind velocity ratio was recorded at test point C114 (VRw,j = 0.32), located approximately at the centre of the area covered by Sites 1 and 2. High directional wind velocity ratios were measured at test point C114 for wind directions ranging from 45° to 112.5° inclusive and 202.5° to 315° inclusive, and this is attributed to the effects of the two adjacent proposed buildings on wind conditions at that location. The next highest overall wind velocity ratio was recorded at C107 (VRw,j = 0.27), located at the southern end of Site 2, for which the directional wind velocity ratios showed a similar trend to those of test point C114, albeit with smaller magnitudes.
4.4.3.5 The lowest overall wind velocity ratio measured in Sites 1 and 2 was at test point C117 (VRw,j = 0.18) which was sheltered from winds from the north-east quadrant.
4.4.4 Air Ventilation Conditions within Site 4
4.4.4.1 The SAVR for the test points within Site 4 is 0.17. The overall wind velocity ratios of those test points ranged from 0.12 to 0.21, of which 12 out of 17 test points (about 70%) ranged from 0.15 to 0.19.
4.4.4.2 Site 4 is characterised by the presence of a line of low-rise buildings within the site, along its northern boundary and aligned approximately east-west, and a series of small undulating hills located in the north of the Site. Therefore, most of the test points within Site 4 are located close to and under the influence of structures and landscape features with heights up to 20 m. The directional wind velocity ratios of test points within Site 4, summarised in Table B3, were generally less than the average of the benchmark test points for most test directions. In particular, the directional wind velocity ratios for winds from the north-east quadrant, on average, are about 30% smaller than the average of the corresponding directional wind velocity ratios of the benchmark test points. As a large percentage of the prevailing winds approach from the north-east quadrant, the overall wind velocity ratios at those positions are also correspondingly lower.
4.4.5 Air Ventilation Conditions within Site 3
4.4.5.1 The SAVR for the test points within Site 3 is 0.15. The overall wind velocity ratios of those test points ranged from 0.09 to 0.21, with 28 out of 39 test points (about 70%) ranging from 0.12 to 0.18, i.e. within one standard deviation of the mean value.
4.4.5.2 Site 3 comprises four medium-rise (i.e. approximately 50 m high) buildings linked by covered walkways and a large landscaped podium. To the east of the medium-rise buildings, an area of relatively open space extends north to the piers in the North Harbourfront and east to Site 4. A number of tall buildings are located close to the western and southern boundaries of Site 3, whereas the eastern aspect comprises the low-rise buildings in Site 4.
CH2M HILL Hong Kong Limited Central Waterfront Site - Wind Tunnel Test Report for Scheme B
August 2008 11
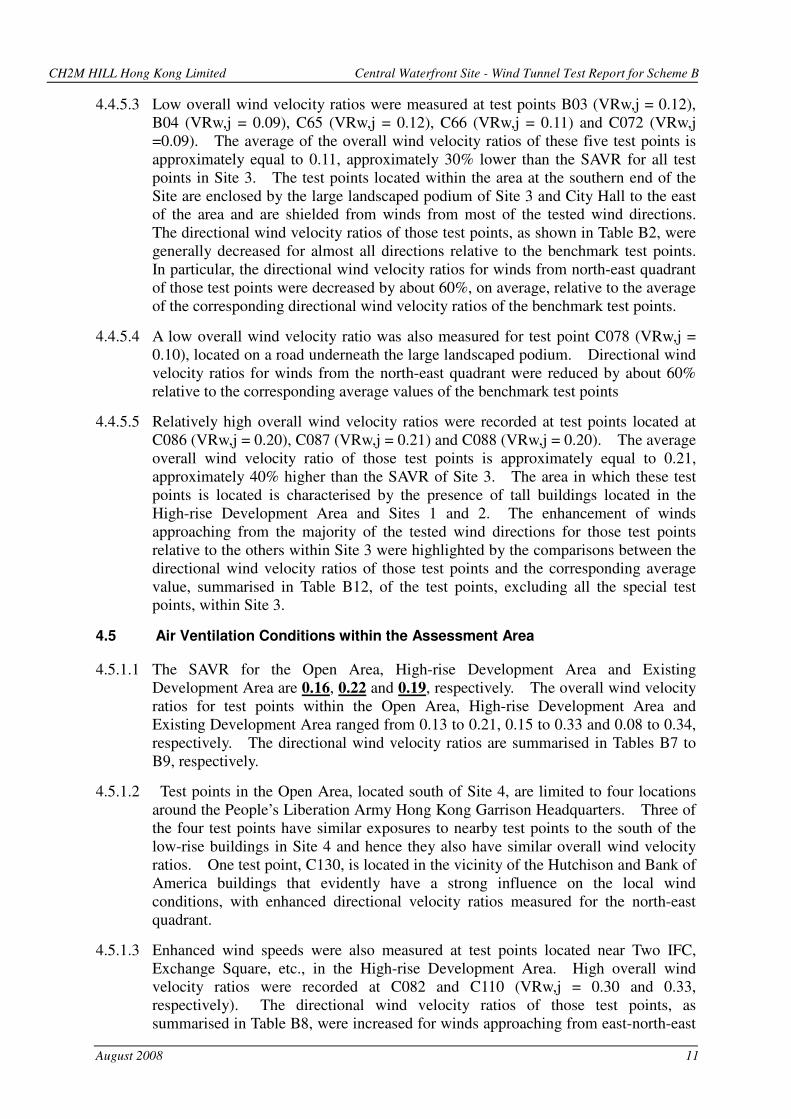
4.4.5.3 Low overall wind velocity ratios were measured at test points B03 (VRw,j = 0.12), B04 (VRw,j = 0.09), C65 (VRw,j = 0.12), C66 (VRw,j = 0.11) and C072 (VRw,j =0.09). The average of the overall wind velocity ratios of these five test points is approximately equal to 0.11, approximately 30% lower than the SAVR for all test points in Site 3. The test points located within the area at the southern end of the Site are enclosed by the large landscaped podium of Site 3 and City Hall to the east of the area and are shielded from winds from most of the tested wind directions. The directional wind velocity ratios of those test points, as shown in Table B2, were generally decreased for almost all directions relative to the benchmark test points. In particular, the directional wind velocity ratios for winds from north-east quadrant of those test points were decreased by about 60%, on average, relative to the average of the corresponding directional wind velocity ratios of the benchmark test points.
4.4.5.4 A low overall wind velocity ratio was also measured for test point C078 (VRw,j = 0.10), located on a road underneath the large landscaped podium. Directional wind velocity ratios for winds from the north-east quadrant were reduced by about 60% relative to the corresponding average values of the benchmark test points
4.4.5.5 Relatively high overall wind velocity ratios were recorded at test points located at C086 (VRw,j = 0.20), C087 (VRw,j = 0.21) and C088 (VRw,j = 0.20). The average overall wind velocity ratio of those test points is approximately equal to 0.21, approximately 40% higher than the SAVR of Site 3. The area in which these test points is located is characterised by the presence of tall buildings located in the High-rise Development Area and Sites 1 and 2. The enhancement of winds approaching from the majority of the tested wind directions for those test points relative to the others within Site 3 were highlighted by the comparisons between the directional wind velocity ratios of those test points and the corresponding average value, summarised in Table B12, of the test points, excluding all the special test points, within Site 3.
4.5 Air Ventilation Conditions within the Assessment Area
4.5.1.1 The SAVR for the Open Area, High-rise Development Area and Existing Development Area are 0.16, 0.22 and 0.19, respectively. The overall wind velocity ratios for test points within the Open Area, High-rise Development Area and Existing Development Area ranged from 0.13 to 0.21, 0.15 to 0.33 and 0.08 to 0.34, respectively. The directional wind velocity ratios are summarised in Tables B7 to B9, respectively.
4.5.1.2 Test points in the Open Area, located south of Site 4, are limited to four locations around the People’s Liberation Army Hong Kong Garrison Headquarters. Three of the four test points have similar exposures to nearby test points to the south of the low-rise buildings in Site 4 and hence they also have similar overall wind velocity ratios. One test point, C130, is located in the vicinity of the Hutchison and Bank of America buildings that evidently have a strong influence on the local wind conditions, with enhanced directional velocity ratios measured for the north-east quadrant.
4.5.1.3 Enhanced wind speeds were also measured at test points located near Two IFC, Exchange Square, etc., in the High-rise Development Area. High overall wind velocity ratios were recorded at C082 and C110 (VRw,j = 0.30 and 0.33, respectively). The directional wind velocity ratios of those test points, as summarised in Table B8, were increased for winds approaching from east-north-east
CH2M HILL Hong Kong Limited Central Waterfront Site - Wind Tunnel Test Report for Scheme B
August 2008 12
and east directions relative to the corresponding directional velocity ratios for the benchmark test points.
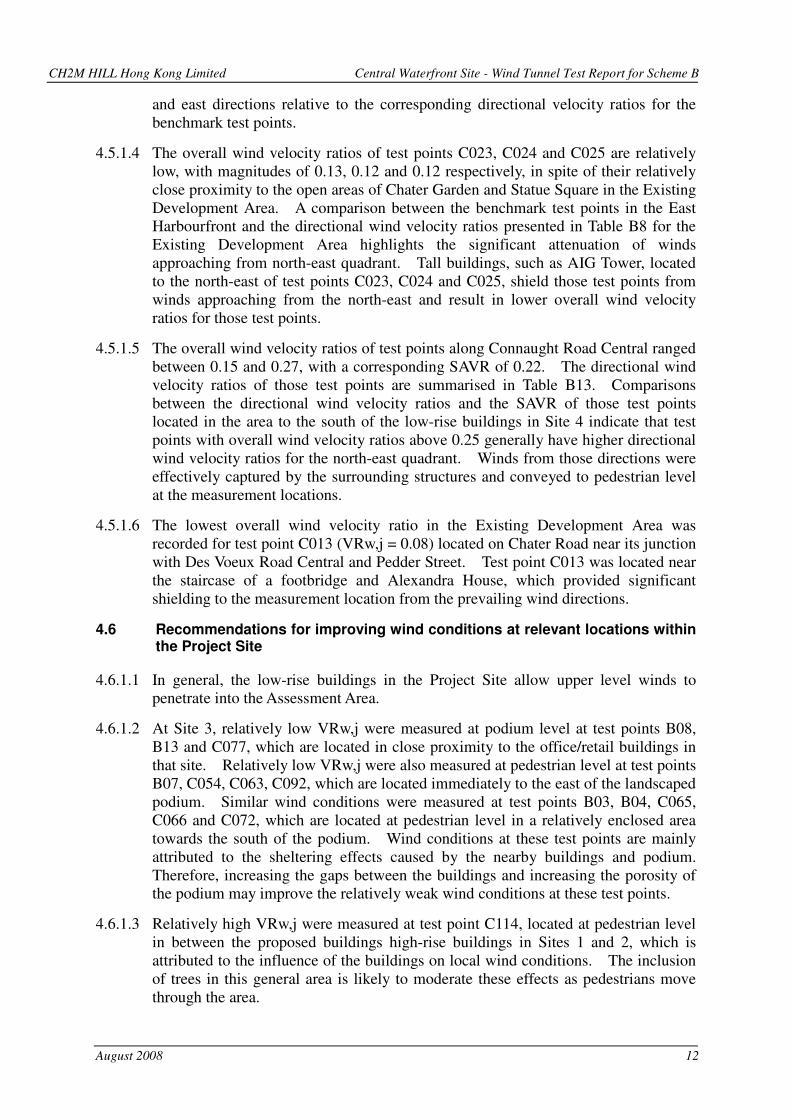
4.5.1.4 The overall wind velocity ratios of test points C023, C024 and C025 are relatively low, with magnitudes of 0.13, 0.12 and 0.12 respectively, in spite of their relatively close proximity to the open areas of Chater Garden and Statue Square in the Existing Development Area. A comparison between the benchmark test points in the East Harbourfront and the directional wind velocity ratios presented in Table B8 for the Existing Development Area highlights the significant attenuation of winds approaching from north-east quadrant. Tall buildings, such as AIG Tower, located to the north-east of test points C023, C024 and C025, shield those test points from winds approaching from the north-east and result in lower overall wind velocity ratios for those test points.
4.5.1.5 The overall wind velocity ratios of test points along Connaught Road Central ranged between 0.15 and 0.27, with a corresponding SAVR of 0.22. The directional wind velocity ratios of those test points are summarised in Table B13. Comparisons between the directional wind velocity ratios and the SAVR of those test points located in the area to the south of the low-rise buildings in Site 4 indicate that test points with overall wind velocity ratios above 0.25 generally have higher directional wind velocity ratios for the north-east quadrant. Winds from those directions were effectively captured by the surrounding structures and conveyed to pedestrian level at the measurement locations.
4.5.1.6 The lowest overall wind velocity ratio in the Existing Development Area was recorded for test point C013 (VRw,j = 0.08) located on Chater Road near its junction with Des Voeux Road Central and Pedder Street. Test point C013 was located near the staircase of a footbridge and Alexandra House, which provided significant shielding to the measurement location from the prevailing wind directions.
4.6 Recommendations for improving wind conditions at relevant locations within the Project Site
4.6.1.1 In general, the low-rise buildings in the Project Site allow upper level winds to penetrate into the Assessment Area.
4.6.1.2 At Site 3, relatively low VRw,j were measured at podium level at test points B08, B13 and C077, which are located in close proximity to the office/retail buildings in that site. Relatively low VRw,j were also measured at pedestrian level at test points B07, C054, C063, C092, which are located immediately to the east of the landscaped podium. Similar wind conditions were measured at test points B03, B04, C065, C066 and C072, which are located at pedestrian level in a relatively enclosed area towards the south of the podium. Wind conditions at these test points are mainly attributed to the sheltering effects caused by the nearby buildings and podium. Therefore, increasing the gaps between the buildings and increasing the porosity of the podium may improve the relatively weak wind conditions at these test points.
4.6.1.3 Relatively high VRw,j were measured at test point C114, located at pedestrian level in between the proposed buildings high-rise buildings in Sites 1 and 2, which is attributed to the influence of the buildings on local wind conditions. The inclusion of trees in this general area is likely to moderate these effects as pedestrians move through the area.

CH2M HILL Hong Kong Limited Central Waterfront Site - Wind Tunnel Test Report for Scheme B
August 2008 13
Photo 1 Location of test points with relatively low VRw,j
Photo 2 Location of test point with relatively high VRw,j
C114
B13
B07
C092
C063
C054
B08 C077
B04
B03
C072
C065
C066
Suggest to increase the gaps between buildings and increasing the porosity of podium
Suggest to plant trees as mitigation measures

CH2M HILL Hong Kong Limited Central Waterfront Site - Wind Tunnel Test Report for Scheme B
August 2008 14
5. CONCLUSIONS
5.1.1.1 A 1:400 scale model of the proposed Design Scheme B at the new Central Waterfront was tested in the low speed test section of the CLP Power Wind/Wave Tunnel Facility at The Hong Kong University of Science and Technology. The wind tunnel study was conducted for an air ventilation assessment (AVA) of the pedestrian level wind environment within and around the proposed Design Scheme B at the new Central Waterfront development. The current study focussed on Sites 1, 2, 3 and 4 from among the eight sites within the Project Site. The Project Site and Assessment Area were further subdivided into a number of instructed functional areas, namely a High-rise Development Area, Existing Development Area, Open Area, North Harbourfront, East Harbourfront and West Harbourfront for this study.
5.1.1.2 Wind speeds were measured at 144 test points, including 17 special test points, for 16 wind directions ranging from 22.5º to 360º (north) at increments of 22.5º using a multi-channel thermal anemometer. Wind tunnel test results were combined with WWTF’s statistical model of the Hong Kong non-typhoon wind climate, based on measurements of wind speed and direction taken by Hong Kong Observatory (HKO) at Waglan Island, and the results of a previously undertaken 1:2000 scale topography study (WWTF Investigation Report WWTF007-2006) to determine the site wind availability for the new Central Waterfront. Approximately 70% of the measured annual overall wind velocity ratios were within the range of 0.10 to 0.20.
5.1.1.3 The mountainous terrain that spans Hong Kong Island had a significant effect on the strength of the available winds approaching the new Central Waterfront from the south-east and south-west quadrants. Therefore, the prevailing winds for the proposed development site occurred mainly from the north, east-north-east and east (0°, 67.5° and 90°).
5.1.1.4 Overall wind velocity ratios within Sites 1 and 2 were the highest among the designated sites and instructed functional areas, with 13 out of 14 test points having magnitudes greater than 0.20 and a spatial averaged wind velocity ratio of 0.24. This is attributed to a combination of the presence of tall buildings within the Sites and its proximity to Victoria Harbour.
5.1.1.5 Wind velocity ratios within Site 3 were relatively consistent over its area, with approximately 70% of the overall wind velocity ratios within one standard deviation of the mean value (0.15), highlighting the effects of a number of medium-rise buildings dispersed throughout the Site. Air ventilation conditions at the southern end of Site 3, which is significantly shielded by the large landscaped podium of Site 3 and adjacent structures, were evidenced by the relatively low wind velocity ratios in the area. Relatively high overall wind velocity ratios were measured at positions near tall buildings within the Site and adjacent areas, highlighting the potential for tall buildings to locally enhance velocity ratios.
5.1.1.6 Overall wind velocity ratios were relatively consistent for test points over Site 4, where the spatial averaged velocity ratio was 0.17, highlighting the influence of low-rise buildings and landscape features with heights up to 20 m. These buildings also have an influence on the velocity ratios in the eastern part of Site 3 and in the Open Area around the People’s Liberation Army Hong Kong Garrison Headquarters. Likewise, localised effects of the enclosed ferry piers are likely to be responsible for
CH2M HILL Hong Kong Limited Central Waterfront Site - Wind Tunnel Test Report for Scheme B
August 2008 15
the lower overall velocity ratios measured within the North Harbourfront and West Harbourfront, due to their sheltering effects for north-east winds in particular.
5.1.1.7 It is also apparent that the relatively low height of the buildings in Site 4, the North Harbourfront and the West Harbourfront allows upper level winds from the north-east and north-west quadrants to penetrate further into the built environment of the Existing Development Area. Those winds are then able to be captured by the relatively taller buildings and conveyed to pedestrian level, thus generally enhancing the overall wind velocity ratios. Similarly, in the High-rise Development Area, overall wind velocity ratios were enhanced by the penetration of upper level winds from the north-east quadrant through Site3, Site 4 and the East Harbourfront, and their subsequent interaction with the tall buildings in the High-rise Development Area.
5.1.1.8 The overall wind velocity ratios for the Existing Development Area and the High-rise Development Area are not affected by the Scheme B, as upper level wind can penetrate the Project Site and captured by tall buildings which enhance the wind velocity ratios in Existing Development Area and High-rise Development Area.
5.1.1.9 Overall, Scheme B for the project site do not have adverse impact on the pedestrian level wind conditions of the Project Site and the Assessment Area.
CH2M HILL Hong Kong Limited Central Waterfront Site - Wind Tunnel Test Report for Scheme B
August 2008 16
6. REFERENCES
Australasian Wind Engineering Society (2001), Wind Engineering Studies of Buildings, AWES-
QAM-1-2001.
CLP Power Wind/Wave Tunnel Facility, The Hong Kong University of Science and Technology
(2006), Investigation Report WWTF007-2006: Experimental Site Wind Availability Data for Central
Waterfront.
Hitchcock, P.A., Kwok, K.C.S. and Yu, C.W. (2003), A study of anemometer measurements at Waglan
Island, Hong Kong, Technical Report WWTF002-2003, CLP Power Wind/Wave Tunnel Facility, The
Hong Kong University of Science and Technology.
Manual of practice for wind tunnel studies of buildings and structures (1999), Editor Nicholas
Isyumov, Task Committee on Wind Tunnel Testing of Buildings and Structures, Aerodynamics
Committee, Aerospace Division, American Society of Civil Engineers.
Planning Department, The Government of the Hong Kong Special Administrative Region (2005),
Feasibility Study for Establishment of Air Ventilation Assessment – Final Report, Department of
Architecture, The Chinese University of Hong Kong.
Planning Department, The Government of the Hong Kong Special Administrative Region (2005),
Technical Guide for Air Ventilation Assessment for Developments in Hong Kong.
CH2M HILL Hong Kong Limited Central Waterfront Site - Wind Tunnel Test Report for Scheme B
August 2008 17
Table 1 Directional approach wind conditions
Wind Direction (°°°°) Approach Condition
Wind Direction (°°°°) Approach Condition
22.5 B 202.5 A
45 B 225 B
67.5 C 247.5 A
90 B 270 A
112.5 B 292.5 C
135 A 315 C
157.5 A 337.5 C
180 A 0, 360 B
Table 2 Wind speed scaling factors for the new Central Waterfront
Wind Direction Wind Angle (o) Scaling Factor*
north 0 or 360 0.60
north-north-east 22.5 0.57
north-east 45 0.61
east-north-east 67.5 0.79
east 90 0.67
east-south-east 112.5 0.52
south-east 135 0.55
south-south-east 157.5 0.65
south 180 0.40
south-south-west 202.5 0.62
south-west 225 0.37
west-south-west 247.5 0.65
west 270 0.46
west-north-west 292.5 0.69
north-west 315 0.89
north-north-west 337.5 0.82 *The wind speed scaling factors (F) are site specific, including the effects of local topography, and were determined from Equation (2).
CH2M HILL Hong Kong Limited Central Waterfront Site - Wind Tunnel Test Report for Scheme B
August 2008 18
Table 3 Annual probabilities of occurrence for directional winds
for the new Central Waterfront
Wind Direction Wind Angle
(º)
Average Angle of Wind Shift
(º)
Probability of Occurrence (%), annual
north 0 or 360 3.3 12.3%
north-north-east 22.5 5.6 8.2%
north-east 45 2.6 8.3%
east-north-east 67.5 -3.0 14.7%
east 90 -0.5 24.0%
east-south-east 112.5 10.0 8.3%
south-east 135 11.3 3.1%
south-south-east 157.5 14.6 0.0%
south 180 5.5 4.3%
south-south-west 202.5 -13.3 0.0%
south-west 225 -23.0 3.0%
west-south-west 247.5 1.9 8.0%
west 270 -5.4 2.5%
west-north-west 292.5 3.2 0.9%
north-west 315 7.3 2.3%
north-north-west 337.5 11.4 0.0%
Table 4 SAVR for the Assessment Area and the Project Site
Project Sites and Functional Areas SAVR
All test points 0.18
Sites 1 and 2 0.24
Site 3 0.15
Site 4 0.17
East Harbourfront 0.19
North Harbourfront 0.17
West Harbourfront 0.16
High-rise Development 0.22
Existing Development 0.19
Open Area 0.16

CH2M HILL Hong Kong Limited Central Waterfront Site - Wind Tunnel Test Report for Scheme B
August 2008 19
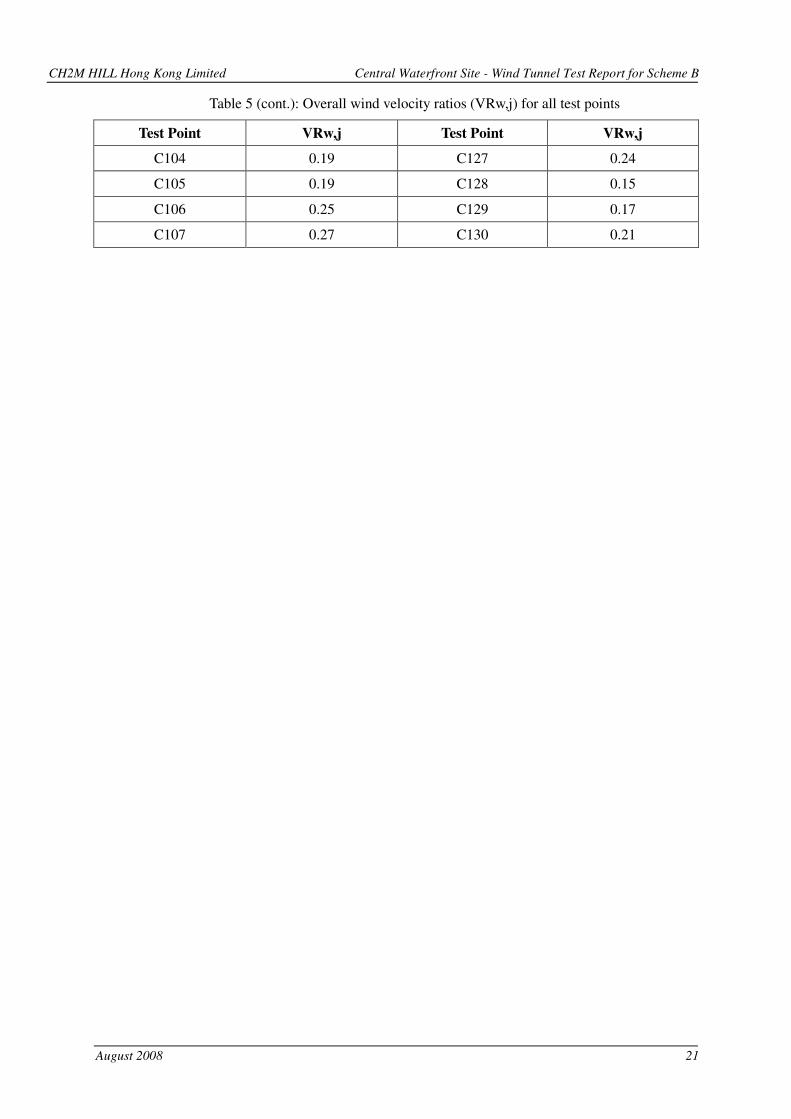
Table 5 Overall wind velocity ratios (VRw,j) for all test points
Test Point VRw,j Test Point VRw,j
B01 0.12 C036 0.17
B02 0.15 C037 0.16
B03 0.12 C038 0.19
B04 0.09 C039 0.27
B05 0.15 C040 0.24
B06 0.15 C041 0.20
B07 0.12 C042 0.18
B08 0.14 C043 0.18
B09 0.17 C044 0.18
B10 0.16 C045 0.17
B11 0.15 C046 0.17
B12 0.13 C047 0.23
B13 0.13 C048 0.19
B14 0.18 C049 0.16
C001 0.21 C050 0.17
C002 0.25 C051 0.14
C003 0.14 C052 0.16
C004 0.22 C053 0.15
C005 0.15 C054 0.11
C006 0.17 C055 0.16
C007 0.15 C056 0.14
C008 0.16 C057 0.18
C009 0.21 C058 0.18
C010 0.25 C059 0.13
C011 0.18 C060 0.18
C012 0.21 C061 0.21
C013 0.08 C062 0.13
C014 0.26 C063 0.12
C015 0.22 C064 0.15
C016 0.20 C065 0.12
C017 0.21 C066 0.11
C018 0.20 C067 0.15
C019 0.23 C068 0.16
C020 0.21 C069 0.12
CH2M HILL Hong Kong Limited Central Waterfront Site - Wind Tunnel Test Report for Scheme B
August 2008 20
Table 5 (cont.): Overall wind velocity ratios (VRw,j) for all test points
Test Point VRw,j Test Point VRw,j
C021 0.23 C070 0.15
C022 0.20 C071 0.16
C023 0.13 C072 0.09
C024 0.12 C073 0.16
C025 0.12 C074 0.20
C026 0.27 C075 0.18
C027 0.11 C076 0.15
C028 0.15 C077 0.12
C029 0.24 C078 0.10
C030 0.34 C079 0.16
C031 0.12 C080 0.13
C032 0.17 C081 0.16
C033 0.13 C082 0.30
C034 0.16 C083 0.28
C035 0.14 C084 0.20
C085 0.24 C108 0.28
C086 0.20 C109 0.19
C087 0.21 C110 0.33
C088 0.20 C111 0.26
C089 0.15 C112 0.23
C090 0.17 C113 0.16
C091 0.15 C114 0.32
C092 0.12 C115 0.20
C093 0.14 C116 0.23
C094 0.16 C117 0.18
C095 0.15 C118 0.17
C096 0.33 C119 0.15
C097 0.17 C120 0.15
C098 0.23 C121 0.26
C099 0.17 C122 0.23
C100 0.19 C123 0.26
C101 0.16 C124 0.22
C102 0.16 C125 0.26
C103 0.12 C126 0.32
CH2M HILL Hong Kong Limited Central Waterfront Site - Wind Tunnel Test Report for Scheme B
August 2008 21
Table 5 (cont.): Overall wind velocity ratios (VRw,j) for all test points
Test Point VRw,j Test Point VRw,j
C104 0.19 C127 0.24
C105 0.19 C128 0.15
C106 0.25 C129 0.17
C107 0.27 C130 0.21

CH2M HILL Hong Kong Limited Central Waterfront Site - Wind Tunnel Test Report for Scheme B
August 2008 22
Figure 1 Assessment Area and Project Site – New Central Waterfront Study
Figure: 1
Title: Assessment Area and Project Site – New Central Waterfront Study CH2M HILL Hong Kong Limited
Project: Quotation Ref. PLNQ 33/2006 Term Consultancy for Provision of Services for Undertaking Air Ventilation Assessment Central Waterfront Site - Wind Tunnel Test Report for Scheme B

CH2M HILL Hong Kong Limited Central Waterfront Site - Wind Tunnel Test Report for Scheme B
August 2008 23
Figure 2 Focus Areas and Functional Areas – New Central Waterfront Study
Figure: 2
Title: Focus Areas and Functional Areas – New Central Waterfront Study CH2M HILL Hong Kong Limited
Project: Quotation Ref. PLNQ 33/2006 Term Consultancy for Provision of Services for Undertaking Air Ventilation Assessment Central Waterfront Site - Wind Tunnel Test Report for Scheme B
CH2M HILL Hong Kong Limited Central Waterfront Site - Wind Tunnel Test Report for Scheme B
August 2008 24
0
50
100
150
200
250
300
350
400
450
0.0 0.2 0.4 0.6 0.8 1.0 1.2 1.4normalised wind characteristics
prot
otyp
e he
ight
(m)
Mean wind speed profile: U-component
Turbulence intensity profile: U-component
0.01
0.1
1
0.01 0.1 1 10 100
frequency/mean wind speed (n/U)
norm
alis
ed w
ind
spec
trum
Harris-von Karman Spectrum, xLu = 250 m, scale 1:400measured spectrum at wind tunnel centreline, height = 300 mPD
Figure 3 1:400 scale wind characteristics, approach condition A
Figure 4 Longitudinal velocity spectrum of 1:400 scale wind, approach condition A
CH2M HILL Hong Kong Limited Central Waterfront Site - Wind Tunnel Test Report for Scheme B
August 2008 25
0
50
100
150
200
250
300
350
400
450
0.0 0.2 0.4 0.6 0.8 1.0 1.2 1.4normalised wind characteristics
prot
otyp
e he
ight
(m)
Mean wind speed profile: U-component
Turbulence intensity profile: U-component
0.01
0.1
1
0.01 0.1 1 10 100
frequency/mean wind speed (n/U)
norm
alis
ed w
ind
spec
trum
Harris-von Karman Spectrum, xLu = 300 m, scale 1:400measured spectrum at wind tunnel centreline, height = 300 mPD
Figure 5 1:400 scale wind characteristics, approach condition B
Figure 6 Longitudinal velocity spectrum of 1:400 scale wind, approach condition B
CH2M HILL Hong Kong Limited Central Waterfront Site - Wind Tunnel Test Report for Scheme B
August 2008 26
0
50
100
150
200
250
300
350
400
450
0.0 0.2 0.4 0.6 0.8 1.0 1.2 1.4normalised wind characteristics
prot
otyp
e he
ight
(m)
Mean wind speed profile: U-component
Turbulence intensity profile: U-component
0.01
0.1
1
0.01 0.1 1 10 100
frequency/mean wind speed (n/U)
norm
alis
ed w
ind
spec
trum
Harris-von Karman Spectrum, xLu = 300 m, scale 1:400measured spectrum at wind tunnel centreline, height = 300 mPD
Figure 7 1:400 scale wind characteristics, approach condition C
Figure 8 Longitudinal velocity spectrum of 1:400 scale wind, approach condition C
CH2M HILL Hong Kong Limited Central Waterfront Site - Wind Tunnel Test Report for Scheme B
August 2008 27
Figure 9 Wind rose for annual non-typhoon winds at Waglan Island, corrected to 500 m
Figure: 9
Title: Wind rose for annual non-typhoon winds at Waglan Island, corrected to 500 m CH2M HILL Hong Kong Limited
Project: Quotation Ref. PLNQ 33/2006 Term Consultancy for Provision of Services for Undertaking Air Ventilation Assessment Central Waterfront Site - Wind Tunnel Test Report for Scheme B
CH2M HILL Hong Kong Limited Central Waterfront Site - Wind Tunnel Test Report for Scheme B
August 2008 28
Figure 10 Wind rose for annual non-typhoon winds at the new Central Waterfront, corrected to 100 m
Figure: 10
Title: Wind rose for annual non-typhoon winds at the new Central Waterfront, corrected to 100 m CH2M HILL Hong Kong Limited
Project: Quotation Ref. PLNQ 33/2006 Term Consultancy for Provision of Services for Undertaking Air Ventilation Assessment Central Waterfront Site - Wind Tunnel Test Report for Scheme B
CH2M HILL Hong Kong Limited Central Waterfront Site - Wind Tunnel Test Report for Scheme B
August 2008 29
Figure 11 A 1:400 scale model of Design Scheme B at the New Central Waterfront in the low speed test section of the CLP Power Wind/Wave Tunnel Facility
(a) North View
(b) East View
CH2M HILL Hong Kong Limited Central Waterfront Site - Wind Tunnel Test Report for Scheme B
August 2008 30
(c) South View
(d) West View

CH2M HILL Hong Kong Limited Central Waterfront Site - Wind Tunnel Test Report for Scheme B
August 2008 31
Figure 12 Layout of proposed buildings within the Project Site: Design Scheme B

CH2M HILL Hong Kong Limited Central Waterfront Site - Wind Tunnel Test Report for Scheme B
August 2008 32
Figure 13 Models of the proposed buildings within the Project Site: Design Scheme B
Figure: 13
Title: Models of the proposed buildings within the Project Site: Design Scheme B
CH2M HILL Hong Kong Limited
Project: Quotation Ref. PLNQ 33/2006 Term Consultancy for Provision of Services for Undertaking Air Ventilation Assessment Central Waterfront Site - Wind Tunnel Test Report for Scheme B
��������� ����������
����� �

CH2M HILL Hong Kong Limited Central Waterfront Site - Wind Tunnel Test Report for Scheme B
August 2008 33
Figure 14 Locations of test points: Design Scheme B
Figure: 14
Title: Locations of test points: Design Scheme B
CH2M HILL Hong Kong Limited
Project: Quotation Ref. PLNQ 33/2006 Term Consultancy for Provision of Services for Undertaking Air Ventilation Assessment Central Waterfront Site - Wind Tunnel Test Report for Scheme B
N
CH2M HILL Hong Kong Limited Central Waterfront Site - Wind Tunnel Test Report for Scheme B
August 2008 34
Figure 15 Overall wind velocity ratios – annual
Figure: 15
Title: Overall wind velocity ratios – annual
CH2M HILL Hong Kong Limited
Project: Quotation Ref. PLNQ 33/2006 Term Consultancy for Provision of Services for Undertaking Air Ventilation Assessment Central Waterfront Site - Wind Tunnel Test Report for Scheme B
N

Appendix A
Tabulated Wind Rose Data

Table A1: Percentage occurrence of annual non-typhoon winds for
the new Central Waterfront, corrected to 100 m
Percentage occurrence of mean wind speed (%) Wind Direction
Wind Angle
(º) 0m/s -3.3m/s
3.4m/s-7.9m/s
8m/s-13.8m/s >13.8m/s Total
north 0 4.1% 7.7% 0.5% 0.0% 12.3%
north-north-east 22.5 5.0% 3.1% 0.1% 0.0% 8.2%
north-east 45 4.1% 4.2% 0.0% 0.0% 8.3%
east-north-east 67.5 2.4% 9.1% 3.2% 0.0% 14.7%
east 90 5.3% 14.6% 4.1% 0.0% 24.0%
east-south-east 112.5 3.4% 1.5% 0.0% 0.0% 5.0%
south-east 135 5.2% 1.1% 0.0% 0.0% 6.4%
south-south-east 157.5 0.0% 0.0% 0.0% 0.0% 0.0%
south 180 4.2% 0.1% 0.0% 0.0% 4.3%
south-south-west 202.5 0.0% 0.0% 0.0% 0.0% 0.0%
south-west 225 2.0% 1.0% 0.0% 0.0% 3.0%
west-south-west 247.5 5.7% 2.3% 0.0% 0.0% 8.0%
west 270 2.4% 0.1% 0.0% 0.0% 2.5%
west-north-west 292.5 0.6% 0.3% 0.0% 0.0% 0.9%
north-west 315 0.4% 0.2% 0.0% 0.0% 0.6%
north-north-west 337.5 0.8% 0.7% 0.2% 0.0% 1.7%

Appendix B
Directional Wind Velocity Ratios of the Test Points
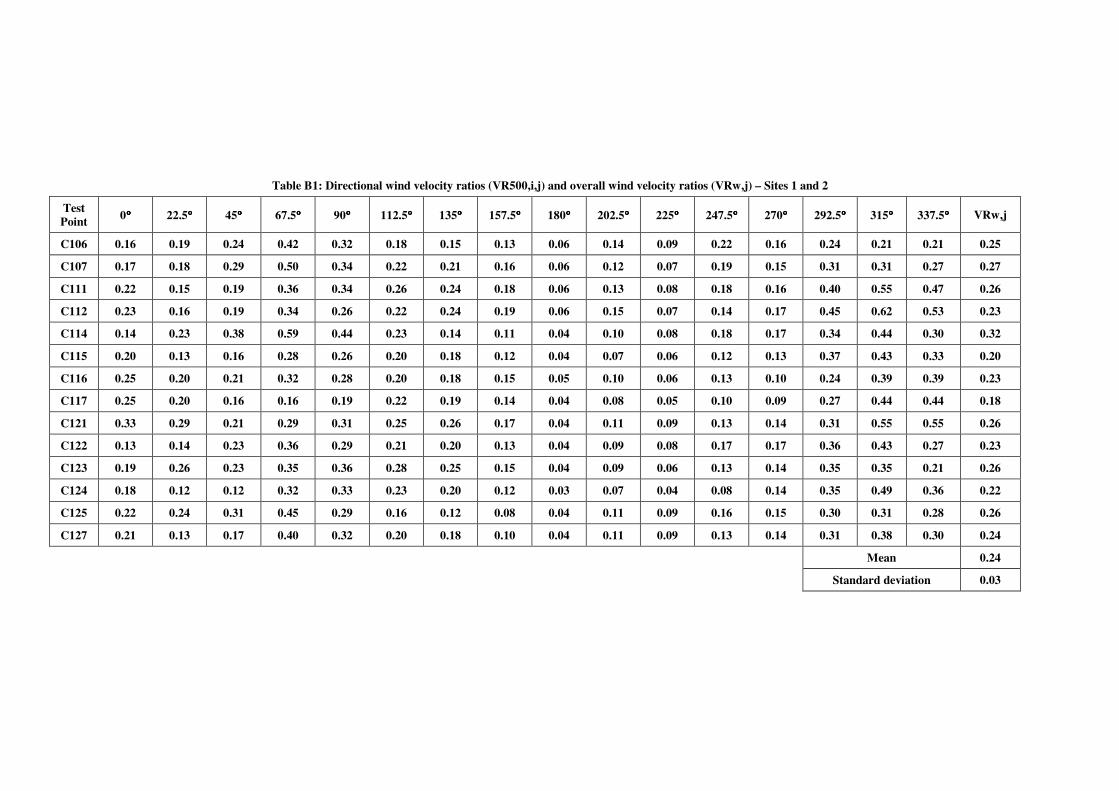
Table B1: Directional wind velocity ratios (VR500,i,j) and overall wind velocity ratios (VRw,j) – Sites 1 and 2
Test Point 0°°°° 22.5°°°° 45°°°° 67.5°°°° 90°°°° 112.5°°°° 135°°°° 157.5°°°° 180°°°° 202.5°°°° 225°°°° 247.5°°°° 270°°°° 292.5°°°° 315°°°° 337.5°°°° VRw,j
C106 0.16 0.19 0.24 0.42 0.32 0.18 0.15 0.13 0.06 0.14 0.09 0.22 0.16 0.24 0.21 0.21 0.25
C107 0.17 0.18 0.29 0.50 0.34 0.22 0.21 0.16 0.06 0.12 0.07 0.19 0.15 0.31 0.31 0.27 0.27
C111 0.22 0.15 0.19 0.36 0.34 0.26 0.24 0.18 0.06 0.13 0.08 0.18 0.16 0.40 0.55 0.47 0.26
C112 0.23 0.16 0.19 0.34 0.26 0.22 0.24 0.19 0.06 0.15 0.07 0.14 0.17 0.45 0.62 0.53 0.23
C114 0.14 0.23 0.38 0.59 0.44 0.23 0.14 0.11 0.04 0.10 0.08 0.18 0.17 0.34 0.44 0.30 0.32
C115 0.20 0.13 0.16 0.28 0.26 0.20 0.18 0.12 0.04 0.07 0.06 0.12 0.13 0.37 0.43 0.33 0.20
C116 0.25 0.20 0.21 0.32 0.28 0.20 0.18 0.15 0.05 0.10 0.06 0.13 0.10 0.24 0.39 0.39 0.23
C117 0.25 0.20 0.16 0.16 0.19 0.22 0.19 0.14 0.04 0.08 0.05 0.10 0.09 0.27 0.44 0.44 0.18
C121 0.33 0.29 0.21 0.29 0.31 0.25 0.26 0.17 0.04 0.11 0.09 0.13 0.14 0.31 0.55 0.55 0.26
C122 0.13 0.14 0.23 0.36 0.29 0.21 0.20 0.13 0.04 0.09 0.08 0.17 0.17 0.36 0.43 0.27 0.23
C123 0.19 0.26 0.23 0.35 0.36 0.28 0.25 0.15 0.04 0.09 0.06 0.13 0.14 0.35 0.35 0.21 0.26
C124 0.18 0.12 0.12 0.32 0.33 0.23 0.20 0.12 0.03 0.07 0.04 0.08 0.14 0.35 0.49 0.36 0.22
C125 0.22 0.24 0.31 0.45 0.29 0.16 0.12 0.08 0.04 0.11 0.09 0.16 0.15 0.30 0.31 0.28 0.26
C127 0.21 0.13 0.17 0.40 0.32 0.20 0.18 0.10 0.04 0.11 0.09 0.13 0.14 0.31 0.38 0.30 0.24
Mean 0.24
Standard deviation 0.03
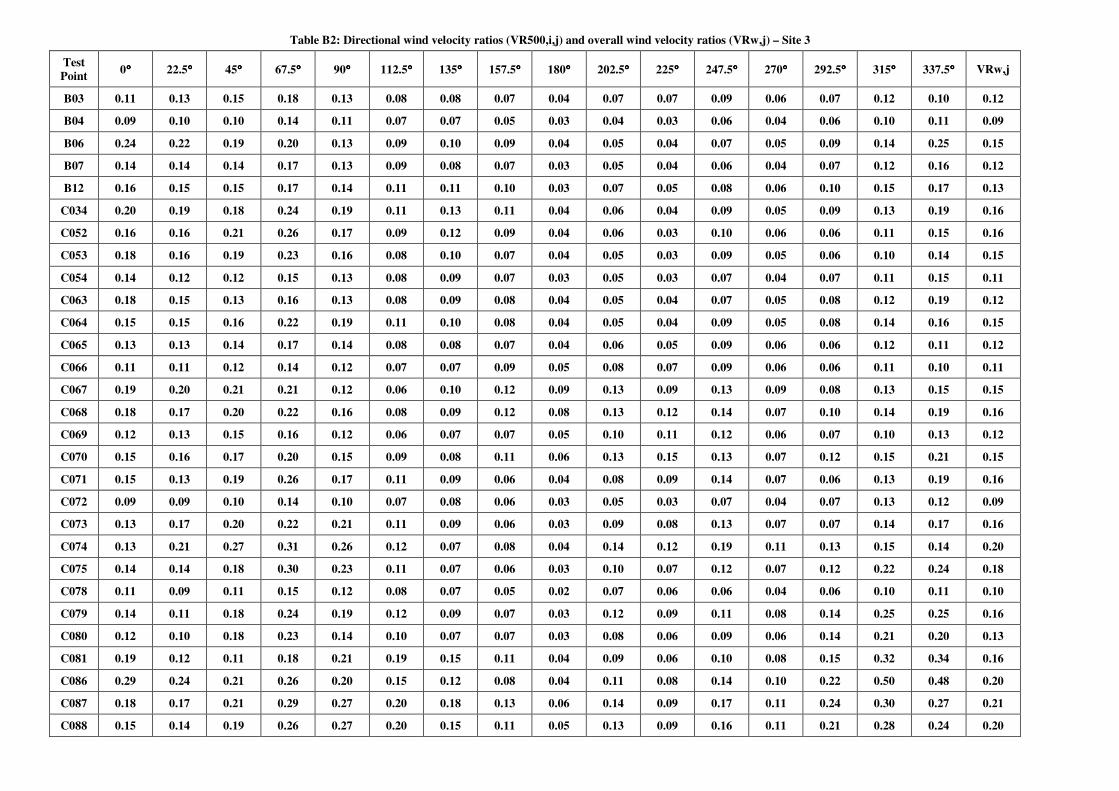
Table B2: Directional wind velocity ratios (VR500,i,j) and overall wind velocity ratios (VRw,j) – Site 3
Test Point 0°°°° 22.5°°°° 45°°°° 67.5°°°° 90°°°° 112.5°°°° 135°°°° 157.5°°°° 180°°°° 202.5°°°° 225°°°° 247.5°°°° 270°°°° 292.5°°°° 315°°°° 337.5°°°° VRw,j
B03 0.11 0.13 0.15 0.18 0.13 0.08 0.08 0.07 0.04 0.07 0.07 0.09 0.06 0.07 0.12 0.10 0.12
B04 0.09 0.10 0.10 0.14 0.11 0.07 0.07 0.05 0.03 0.04 0.03 0.06 0.04 0.06 0.10 0.11 0.09
B06 0.24 0.22 0.19 0.20 0.13 0.09 0.10 0.09 0.04 0.05 0.04 0.07 0.05 0.09 0.14 0.25 0.15
B07 0.14 0.14 0.14 0.17 0.13 0.09 0.08 0.07 0.03 0.05 0.04 0.06 0.04 0.07 0.12 0.16 0.12
B12 0.16 0.15 0.15 0.17 0.14 0.11 0.11 0.10 0.03 0.07 0.05 0.08 0.06 0.10 0.15 0.17 0.13
C034 0.20 0.19 0.18 0.24 0.19 0.11 0.13 0.11 0.04 0.06 0.04 0.09 0.05 0.09 0.13 0.19 0.16
C052 0.16 0.16 0.21 0.26 0.17 0.09 0.12 0.09 0.04 0.06 0.03 0.10 0.06 0.06 0.11 0.15 0.16
C053 0.18 0.16 0.19 0.23 0.16 0.08 0.10 0.07 0.04 0.05 0.03 0.09 0.05 0.06 0.10 0.14 0.15
C054 0.14 0.12 0.12 0.15 0.13 0.08 0.09 0.07 0.03 0.05 0.03 0.07 0.04 0.07 0.11 0.15 0.11
C063 0.18 0.15 0.13 0.16 0.13 0.08 0.09 0.08 0.04 0.05 0.04 0.07 0.05 0.08 0.12 0.19 0.12
C064 0.15 0.15 0.16 0.22 0.19 0.11 0.10 0.08 0.04 0.05 0.04 0.09 0.05 0.08 0.14 0.16 0.15
C065 0.13 0.13 0.14 0.17 0.14 0.08 0.08 0.07 0.04 0.06 0.05 0.09 0.06 0.06 0.12 0.11 0.12
C066 0.11 0.11 0.12 0.14 0.12 0.07 0.07 0.09 0.05 0.08 0.07 0.09 0.06 0.06 0.11 0.10 0.11
C067 0.19 0.20 0.21 0.21 0.12 0.06 0.10 0.12 0.09 0.13 0.09 0.13 0.09 0.08 0.13 0.15 0.15
C068 0.18 0.17 0.20 0.22 0.16 0.08 0.09 0.12 0.08 0.13 0.12 0.14 0.07 0.10 0.14 0.19 0.16
C069 0.12 0.13 0.15 0.16 0.12 0.06 0.07 0.07 0.05 0.10 0.11 0.12 0.06 0.07 0.10 0.13 0.12
C070 0.15 0.16 0.17 0.20 0.15 0.09 0.08 0.11 0.06 0.13 0.15 0.13 0.07 0.12 0.15 0.21 0.15
C071 0.15 0.13 0.19 0.26 0.17 0.11 0.09 0.06 0.04 0.08 0.09 0.14 0.07 0.06 0.13 0.19 0.16
C072 0.09 0.09 0.10 0.14 0.10 0.07 0.08 0.06 0.03 0.05 0.03 0.07 0.04 0.07 0.13 0.12 0.09
C073 0.13 0.17 0.20 0.22 0.21 0.11 0.09 0.06 0.03 0.09 0.08 0.13 0.07 0.07 0.14 0.17 0.16
C074 0.13 0.21 0.27 0.31 0.26 0.12 0.07 0.08 0.04 0.14 0.12 0.19 0.11 0.13 0.15 0.14 0.20
C075 0.14 0.14 0.18 0.30 0.23 0.11 0.07 0.06 0.03 0.10 0.07 0.12 0.07 0.12 0.22 0.24 0.18
C078 0.11 0.09 0.11 0.15 0.12 0.08 0.07 0.05 0.02 0.07 0.06 0.06 0.04 0.06 0.10 0.11 0.10
C079 0.14 0.11 0.18 0.24 0.19 0.12 0.09 0.07 0.03 0.12 0.09 0.11 0.08 0.14 0.25 0.25 0.16
C080 0.12 0.10 0.18 0.23 0.14 0.10 0.07 0.07 0.03 0.08 0.06 0.09 0.06 0.14 0.21 0.20 0.13
C081 0.19 0.12 0.11 0.18 0.21 0.19 0.15 0.11 0.04 0.09 0.06 0.10 0.08 0.15 0.32 0.34 0.16
C086 0.29 0.24 0.21 0.26 0.20 0.15 0.12 0.08 0.04 0.11 0.08 0.14 0.10 0.22 0.50 0.48 0.20
C087 0.18 0.17 0.21 0.29 0.27 0.20 0.18 0.13 0.06 0.14 0.09 0.17 0.11 0.24 0.30 0.27 0.21
C088 0.15 0.14 0.19 0.26 0.27 0.20 0.15 0.11 0.05 0.13 0.09 0.16 0.11 0.21 0.28 0.24 0.20
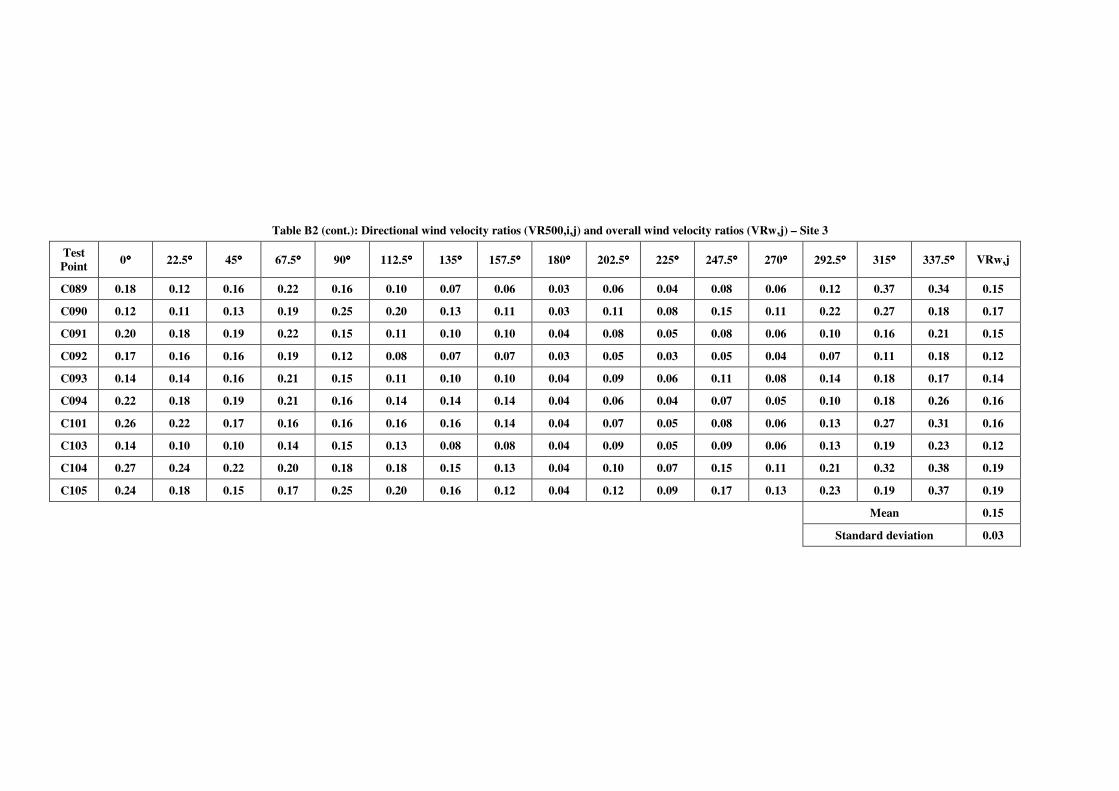
Table B2 (cont.): Directional wind velocity ratios (VR500,i,j) and overall wind velocity ratios (VRw,j) – Site 3
Test Point 0°°°° 22.5°°°° 45°°°° 67.5°°°° 90°°°° 112.5°°°° 135°°°° 157.5°°°° 180°°°° 202.5°°°° 225°°°° 247.5°°°° 270°°°° 292.5°°°° 315°°°° 337.5°°°° VRw,j
C089 0.18 0.12 0.16 0.22 0.16 0.10 0.07 0.06 0.03 0.06 0.04 0.08 0.06 0.12 0.37 0.34 0.15
C090 0.12 0.11 0.13 0.19 0.25 0.20 0.13 0.11 0.03 0.11 0.08 0.15 0.11 0.22 0.27 0.18 0.17
C091 0.20 0.18 0.19 0.22 0.15 0.11 0.10 0.10 0.04 0.08 0.05 0.08 0.06 0.10 0.16 0.21 0.15
C092 0.17 0.16 0.16 0.19 0.12 0.08 0.07 0.07 0.03 0.05 0.03 0.05 0.04 0.07 0.11 0.18 0.12
C093 0.14 0.14 0.16 0.21 0.15 0.11 0.10 0.10 0.04 0.09 0.06 0.11 0.08 0.14 0.18 0.17 0.14
C094 0.22 0.18 0.19 0.21 0.16 0.14 0.14 0.14 0.04 0.06 0.04 0.07 0.05 0.10 0.18 0.26 0.16
C101 0.26 0.22 0.17 0.16 0.16 0.16 0.16 0.14 0.04 0.07 0.05 0.08 0.06 0.13 0.27 0.31 0.16
C103 0.14 0.10 0.10 0.14 0.15 0.13 0.08 0.08 0.04 0.09 0.05 0.09 0.06 0.13 0.19 0.23 0.12
C104 0.27 0.24 0.22 0.20 0.18 0.18 0.15 0.13 0.04 0.10 0.07 0.15 0.11 0.21 0.32 0.38 0.19
C105 0.24 0.18 0.15 0.17 0.25 0.20 0.16 0.12 0.04 0.12 0.09 0.17 0.13 0.23 0.19 0.37 0.19
Mean 0.15
Standard deviation 0.03
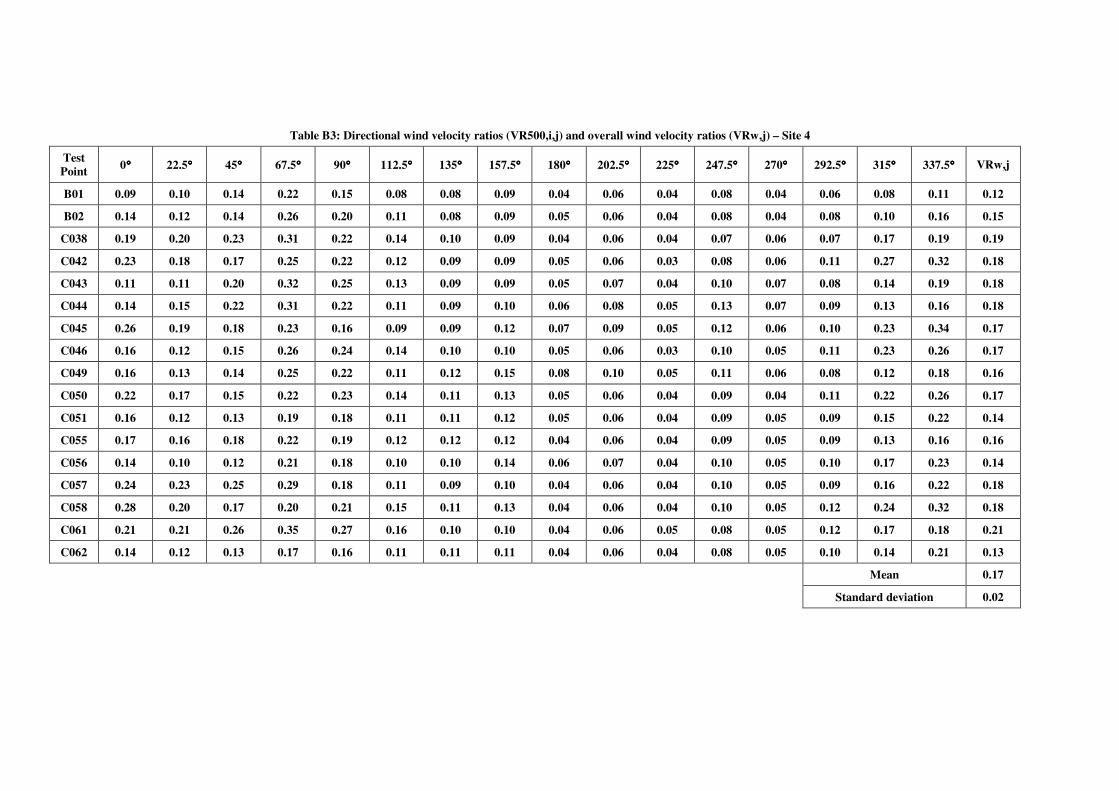
Table B3: Directional wind velocity ratios (VR500,i,j) and overall wind velocity ratios (VRw,j) – Site 4
Test Point 0°°°° 22.5°°°° 45°°°° 67.5°°°° 90°°°° 112.5°°°° 135°°°° 157.5°°°° 180°°°° 202.5°°°° 225°°°° 247.5°°°° 270°°°° 292.5°°°° 315°°°° 337.5°°°° VRw,j
B01 0.09 0.10 0.14 0.22 0.15 0.08 0.08 0.09 0.04 0.06 0.04 0.08 0.04 0.06 0.08 0.11 0.12
B02 0.14 0.12 0.14 0.26 0.20 0.11 0.08 0.09 0.05 0.06 0.04 0.08 0.04 0.08 0.10 0.16 0.15
C038 0.19 0.20 0.23 0.31 0.22 0.14 0.10 0.09 0.04 0.06 0.04 0.07 0.06 0.07 0.17 0.19 0.19
C042 0.23 0.18 0.17 0.25 0.22 0.12 0.09 0.09 0.05 0.06 0.03 0.08 0.06 0.11 0.27 0.32 0.18
C043 0.11 0.11 0.20 0.32 0.25 0.13 0.09 0.09 0.05 0.07 0.04 0.10 0.07 0.08 0.14 0.19 0.18
C044 0.14 0.15 0.22 0.31 0.22 0.11 0.09 0.10 0.06 0.08 0.05 0.13 0.07 0.09 0.13 0.16 0.18
C045 0.26 0.19 0.18 0.23 0.16 0.09 0.09 0.12 0.07 0.09 0.05 0.12 0.06 0.10 0.23 0.34 0.17
C046 0.16 0.12 0.15 0.26 0.24 0.14 0.10 0.10 0.05 0.06 0.03 0.10 0.05 0.11 0.23 0.26 0.17
C049 0.16 0.13 0.14 0.25 0.22 0.11 0.12 0.15 0.08 0.10 0.05 0.11 0.06 0.08 0.12 0.18 0.16
C050 0.22 0.17 0.15 0.22 0.23 0.14 0.11 0.13 0.05 0.06 0.04 0.09 0.04 0.11 0.22 0.26 0.17
C051 0.16 0.12 0.13 0.19 0.18 0.11 0.11 0.12 0.05 0.06 0.04 0.09 0.05 0.09 0.15 0.22 0.14
C055 0.17 0.16 0.18 0.22 0.19 0.12 0.12 0.12 0.04 0.06 0.04 0.09 0.05 0.09 0.13 0.16 0.16
C056 0.14 0.10 0.12 0.21 0.18 0.10 0.10 0.14 0.06 0.07 0.04 0.10 0.05 0.10 0.17 0.23 0.14
C057 0.24 0.23 0.25 0.29 0.18 0.11 0.09 0.10 0.04 0.06 0.04 0.10 0.05 0.09 0.16 0.22 0.18
C058 0.28 0.20 0.17 0.20 0.21 0.15 0.11 0.13 0.04 0.06 0.04 0.10 0.05 0.12 0.24 0.32 0.18
C061 0.21 0.21 0.26 0.35 0.27 0.16 0.10 0.10 0.04 0.06 0.05 0.08 0.05 0.12 0.17 0.18 0.21
C062 0.14 0.12 0.13 0.17 0.16 0.11 0.11 0.11 0.04 0.06 0.04 0.08 0.05 0.10 0.14 0.21 0.13
Mean 0.17
Standard deviation 0.02
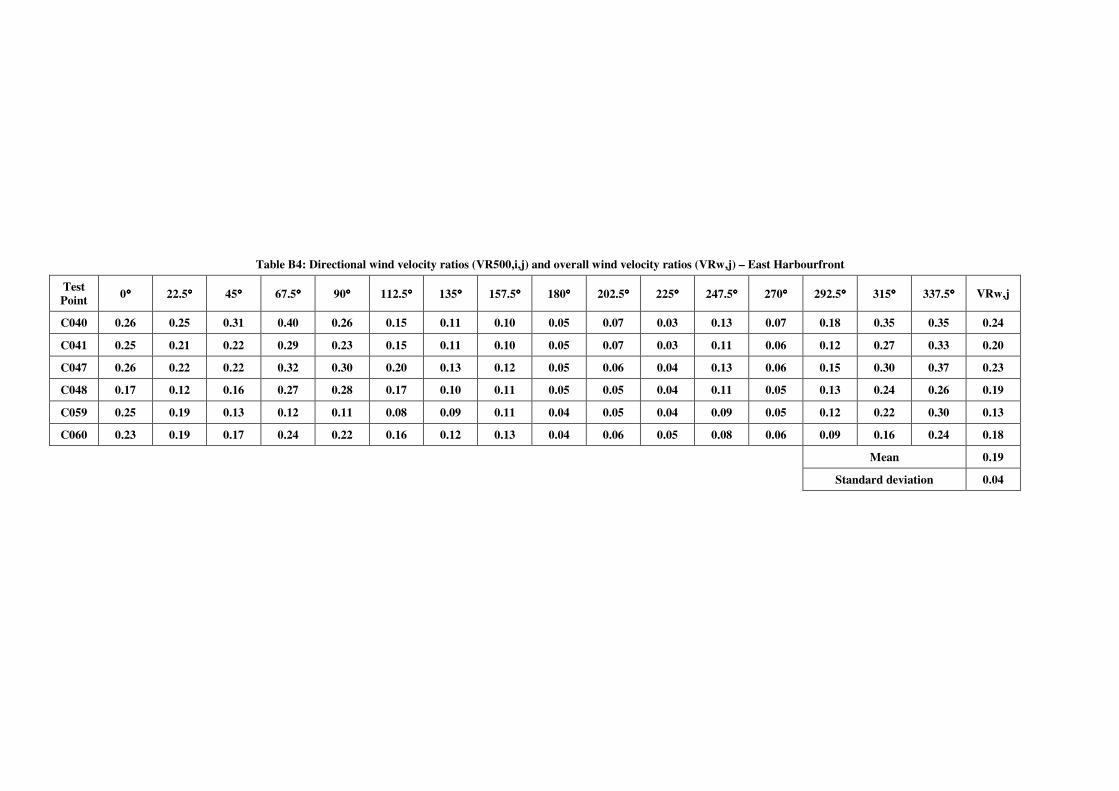
Table B4: Directional wind velocity ratios (VR500,i,j) and overall wind velocity ratios (VRw,j) – East Harbourfront
Test Point 0°°°° 22.5°°°° 45°°°° 67.5°°°° 90°°°° 112.5°°°° 135°°°° 157.5°°°° 180°°°° 202.5°°°° 225°°°° 247.5°°°° 270°°°° 292.5°°°° 315°°°° 337.5°°°° VRw,j
C040 0.26 0.25 0.31 0.40 0.26 0.15 0.11 0.10 0.05 0.07 0.03 0.13 0.07 0.18 0.35 0.35 0.24
C041 0.25 0.21 0.22 0.29 0.23 0.15 0.11 0.10 0.05 0.07 0.03 0.11 0.06 0.12 0.27 0.33 0.20
C047 0.26 0.22 0.22 0.32 0.30 0.20 0.13 0.12 0.05 0.06 0.04 0.13 0.06 0.15 0.30 0.37 0.23
C048 0.17 0.12 0.16 0.27 0.28 0.17 0.10 0.11 0.05 0.05 0.04 0.11 0.05 0.13 0.24 0.26 0.19
C059 0.25 0.19 0.13 0.12 0.11 0.08 0.09 0.11 0.04 0.05 0.04 0.09 0.05 0.12 0.22 0.30 0.13
C060 0.23 0.19 0.17 0.24 0.22 0.16 0.12 0.13 0.04 0.06 0.05 0.08 0.06 0.09 0.16 0.24 0.18
Mean 0.19
Standard deviation 0.04
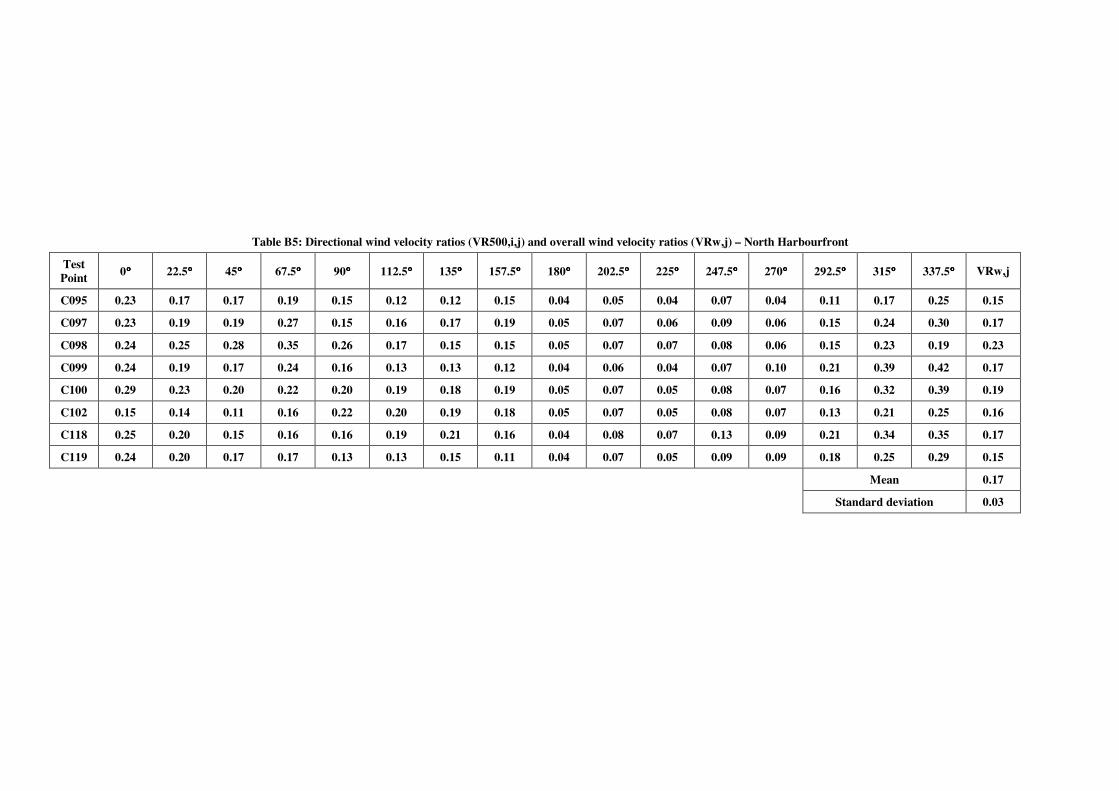
Table B5: Directional wind velocity ratios (VR500,i,j) and overall wind velocity ratios (VRw,j) – North Harbourfront
Test Point 0°°°° 22.5°°°° 45°°°° 67.5°°°° 90°°°° 112.5°°°° 135°°°° 157.5°°°° 180°°°° 202.5°°°° 225°°°° 247.5°°°° 270°°°° 292.5°°°° 315°°°° 337.5°°°° VRw,j
C095 0.23 0.17 0.17 0.19 0.15 0.12 0.12 0.15 0.04 0.05 0.04 0.07 0.04 0.11 0.17 0.25 0.15
C097 0.23 0.19 0.19 0.27 0.15 0.16 0.17 0.19 0.05 0.07 0.06 0.09 0.06 0.15 0.24 0.30 0.17
C098 0.24 0.25 0.28 0.35 0.26 0.17 0.15 0.15 0.05 0.07 0.07 0.08 0.06 0.15 0.23 0.19 0.23
C099 0.24 0.19 0.17 0.24 0.16 0.13 0.13 0.12 0.04 0.06 0.04 0.07 0.10 0.21 0.39 0.42 0.17
C100 0.29 0.23 0.20 0.22 0.20 0.19 0.18 0.19 0.05 0.07 0.05 0.08 0.07 0.16 0.32 0.39 0.19
C102 0.15 0.14 0.11 0.16 0.22 0.20 0.19 0.18 0.05 0.07 0.05 0.08 0.07 0.13 0.21 0.25 0.16
C118 0.25 0.20 0.15 0.16 0.16 0.19 0.21 0.16 0.04 0.08 0.07 0.13 0.09 0.21 0.34 0.35 0.17
C119 0.24 0.20 0.17 0.17 0.13 0.13 0.15 0.11 0.04 0.07 0.05 0.09 0.09 0.18 0.25 0.29 0.15
Mean 0.17
Standard deviation 0.03
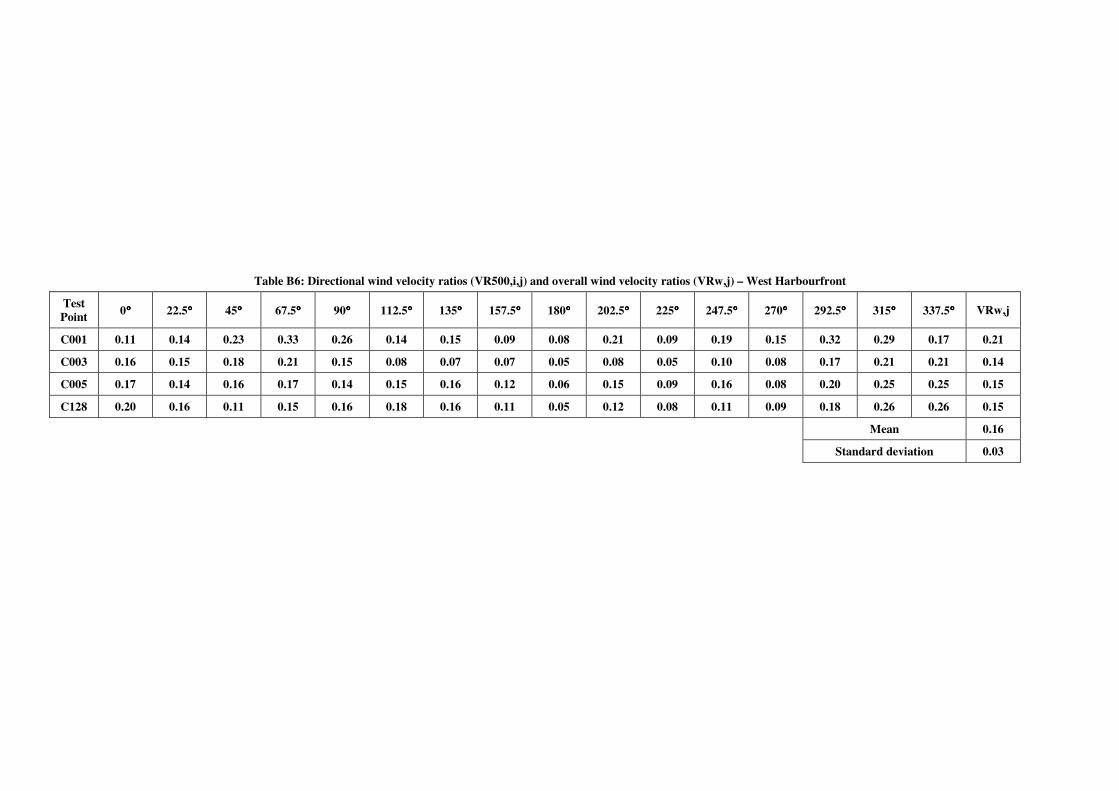
Table B6: Directional wind velocity ratios (VR500,i,j) and overall wind velocity ratios (VRw,j) – West Harbourfront
Test Point 0°°°° 22.5°°°° 45°°°° 67.5°°°° 90°°°° 112.5°°°° 135°°°° 157.5°°°° 180°°°° 202.5°°°° 225°°°° 247.5°°°° 270°°°° 292.5°°°° 315°°°° 337.5°°°° VRw,j
C001 0.11 0.14 0.23 0.33 0.26 0.14 0.15 0.09 0.08 0.21 0.09 0.19 0.15 0.32 0.29 0.17 0.21
C003 0.16 0.15 0.18 0.21 0.15 0.08 0.07 0.07 0.05 0.08 0.05 0.10 0.08 0.17 0.21 0.21 0.14
C005 0.17 0.14 0.16 0.17 0.14 0.15 0.16 0.12 0.06 0.15 0.09 0.16 0.08 0.20 0.25 0.25 0.15
C128 0.20 0.16 0.11 0.15 0.16 0.18 0.16 0.11 0.05 0.12 0.08 0.11 0.09 0.18 0.26 0.26 0.15
Mean 0.16
Standard deviation 0.03
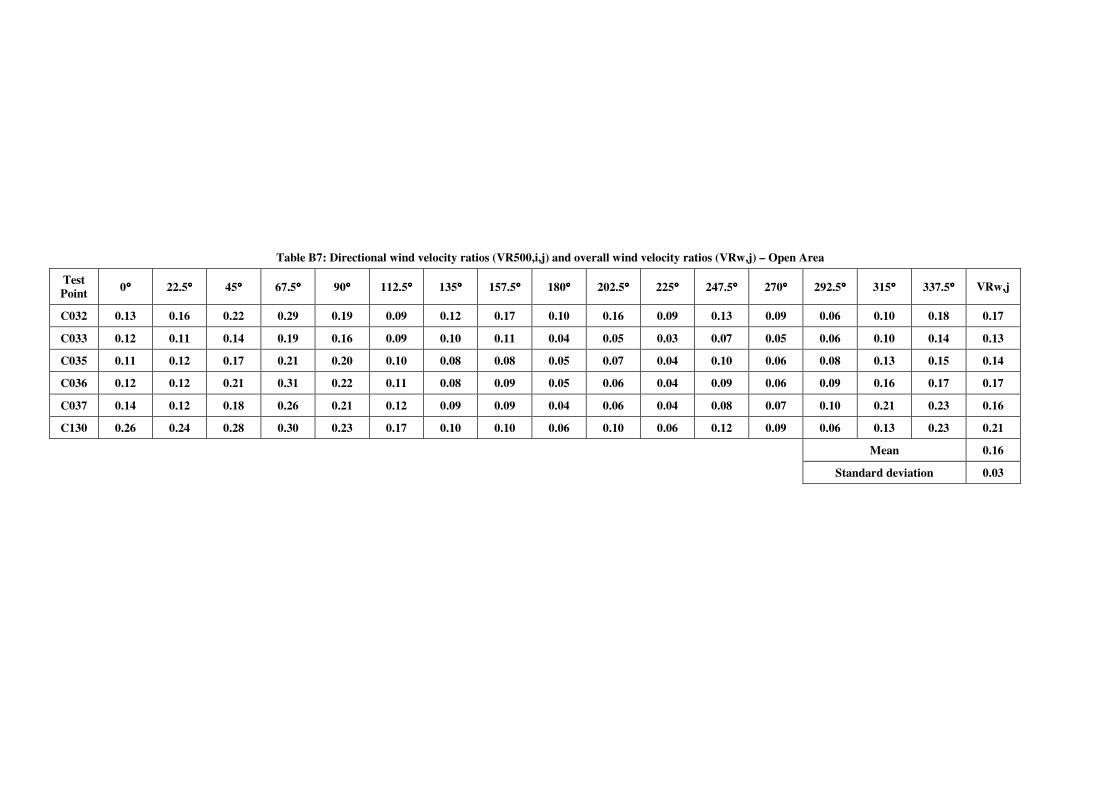
Table B7: Directional wind velocity ratios (VR500,i,j) and overall wind velocity ratios (VRw,j) – Open Area
Test Point 0°°°° 22.5°°°° 45°°°° 67.5°°°° 90°°°° 112.5°°°° 135°°°° 157.5°°°° 180°°°° 202.5°°°° 225°°°° 247.5°°°° 270°°°° 292.5°°°° 315°°°° 337.5°°°° VRw,j
C032 0.13 0.16 0.22 0.29 0.19 0.09 0.12 0.17 0.10 0.16 0.09 0.13 0.09 0.06 0.10 0.18 0.17
C033 0.12 0.11 0.14 0.19 0.16 0.09 0.10 0.11 0.04 0.05 0.03 0.07 0.05 0.06 0.10 0.14 0.13
C035 0.11 0.12 0.17 0.21 0.20 0.10 0.08 0.08 0.05 0.07 0.04 0.10 0.06 0.08 0.13 0.15 0.14
C036 0.12 0.12 0.21 0.31 0.22 0.11 0.08 0.09 0.05 0.06 0.04 0.09 0.06 0.09 0.16 0.17 0.17
C037 0.14 0.12 0.18 0.26 0.21 0.12 0.09 0.09 0.04 0.06 0.04 0.08 0.07 0.10 0.21 0.23 0.16
C130 0.26 0.24 0.28 0.30 0.23 0.17 0.10 0.10 0.06 0.10 0.06 0.12 0.09 0.06 0.13 0.23 0.21
Mean 0.16
Standard deviation 0.03
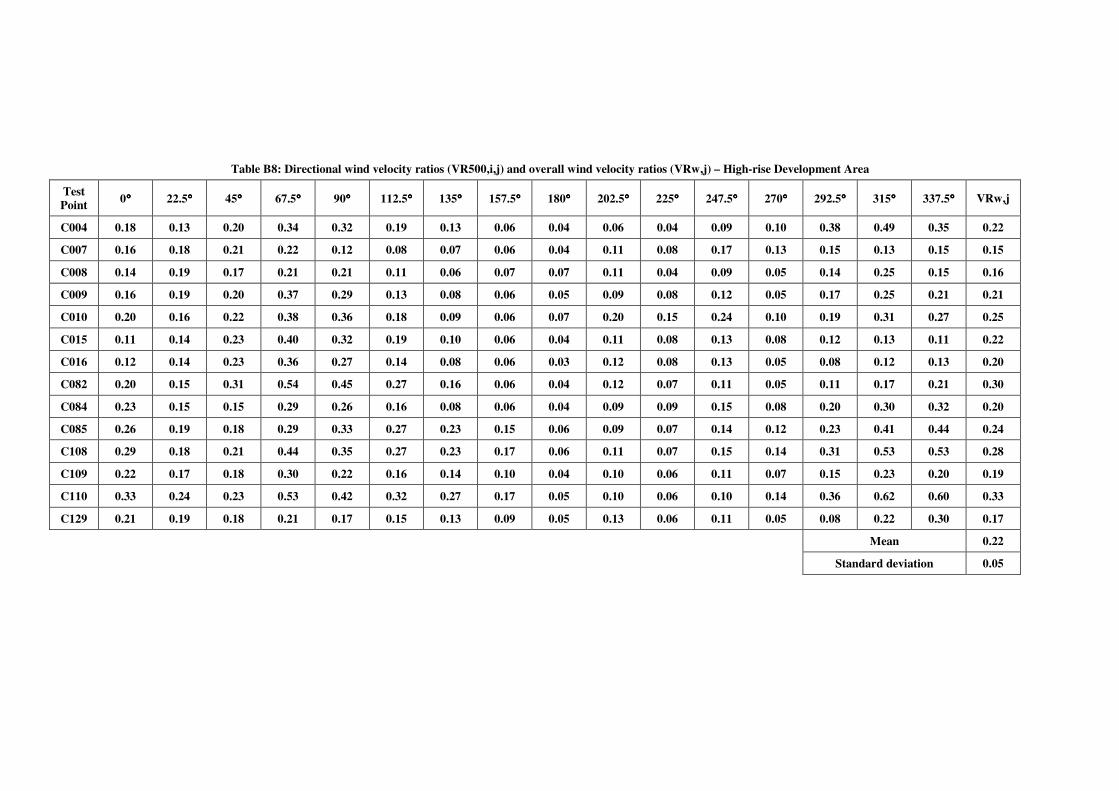
Table B8: Directional wind velocity ratios (VR500,i,j) and overall wind velocity ratios (VRw,j) – High-rise Development Area
Test Point 0°°°° 22.5°°°° 45°°°° 67.5°°°° 90°°°° 112.5°°°° 135°°°° 157.5°°°° 180°°°° 202.5°°°° 225°°°° 247.5°°°° 270°°°° 292.5°°°° 315°°°° 337.5°°°° VRw,j
C004 0.18 0.13 0.20 0.34 0.32 0.19 0.13 0.06 0.04 0.06 0.04 0.09 0.10 0.38 0.49 0.35 0.22
C007 0.16 0.18 0.21 0.22 0.12 0.08 0.07 0.06 0.04 0.11 0.08 0.17 0.13 0.15 0.13 0.15 0.15
C008 0.14 0.19 0.17 0.21 0.21 0.11 0.06 0.07 0.07 0.11 0.04 0.09 0.05 0.14 0.25 0.15 0.16
C009 0.16 0.19 0.20 0.37 0.29 0.13 0.08 0.06 0.05 0.09 0.08 0.12 0.05 0.17 0.25 0.21 0.21
C010 0.20 0.16 0.22 0.38 0.36 0.18 0.09 0.06 0.07 0.20 0.15 0.24 0.10 0.19 0.31 0.27 0.25
C015 0.11 0.14 0.23 0.40 0.32 0.19 0.10 0.06 0.04 0.11 0.08 0.13 0.08 0.12 0.13 0.11 0.22
C016 0.12 0.14 0.23 0.36 0.27 0.14 0.08 0.06 0.03 0.12 0.08 0.13 0.05 0.08 0.12 0.13 0.20
C082 0.20 0.15 0.31 0.54 0.45 0.27 0.16 0.06 0.04 0.12 0.07 0.11 0.05 0.11 0.17 0.21 0.30
C084 0.23 0.15 0.15 0.29 0.26 0.16 0.08 0.06 0.04 0.09 0.09 0.15 0.08 0.20 0.30 0.32 0.20
C085 0.26 0.19 0.18 0.29 0.33 0.27 0.23 0.15 0.06 0.09 0.07 0.14 0.12 0.23 0.41 0.44 0.24
C108 0.29 0.18 0.21 0.44 0.35 0.27 0.23 0.17 0.06 0.11 0.07 0.15 0.14 0.31 0.53 0.53 0.28
C109 0.22 0.17 0.18 0.30 0.22 0.16 0.14 0.10 0.04 0.10 0.06 0.11 0.07 0.15 0.23 0.20 0.19
C110 0.33 0.24 0.23 0.53 0.42 0.32 0.27 0.17 0.05 0.10 0.06 0.10 0.14 0.36 0.62 0.60 0.33
C129 0.21 0.19 0.18 0.21 0.17 0.15 0.13 0.09 0.05 0.13 0.06 0.11 0.05 0.08 0.22 0.30 0.17
Mean 0.22
Standard deviation 0.05
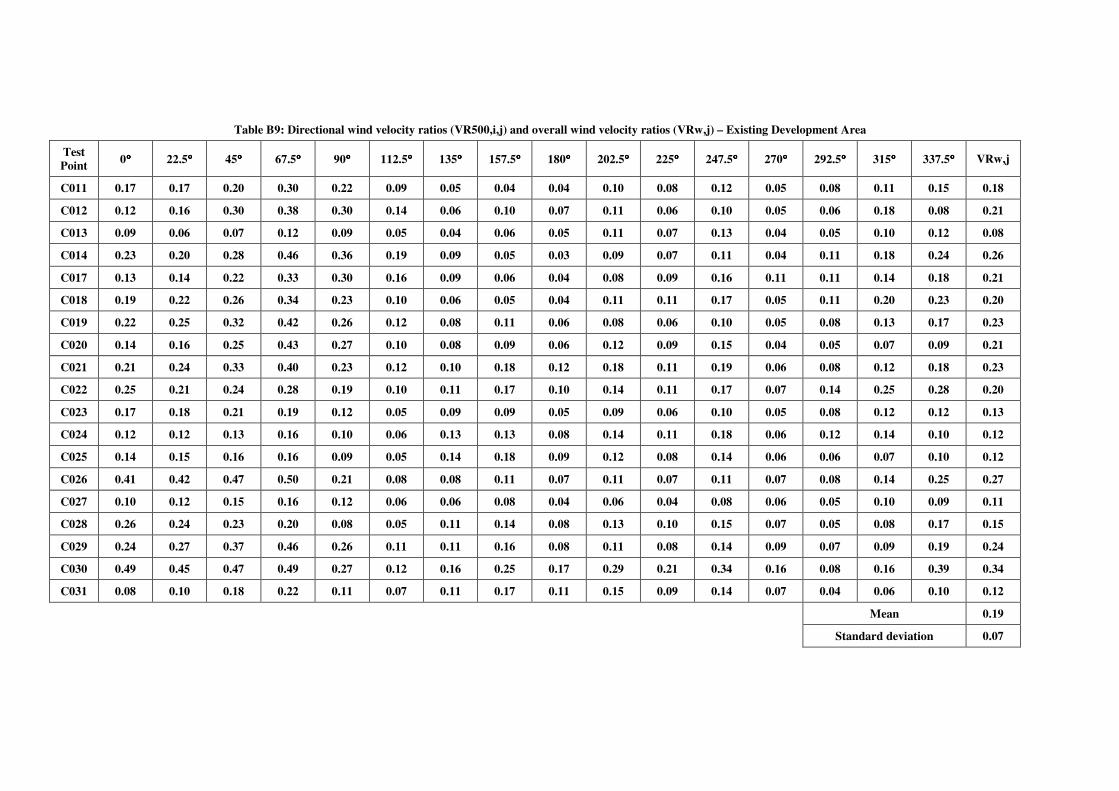
Table B9: Directional wind velocity ratios (VR500,i,j) and overall wind velocity ratios (VRw,j) – Existing Development Area
Test Point 0°°°° 22.5°°°° 45°°°° 67.5°°°° 90°°°° 112.5°°°° 135°°°° 157.5°°°° 180°°°° 202.5°°°° 225°°°° 247.5°°°° 270°°°° 292.5°°°° 315°°°° 337.5°°°° VRw,j
C011 0.17 0.17 0.20 0.30 0.22 0.09 0.05 0.04 0.04 0.10 0.08 0.12 0.05 0.08 0.11 0.15 0.18
C012 0.12 0.16 0.30 0.38 0.30 0.14 0.06 0.10 0.07 0.11 0.06 0.10 0.05 0.06 0.18 0.08 0.21
C013 0.09 0.06 0.07 0.12 0.09 0.05 0.04 0.06 0.05 0.11 0.07 0.13 0.04 0.05 0.10 0.12 0.08
C014 0.23 0.20 0.28 0.46 0.36 0.19 0.09 0.05 0.03 0.09 0.07 0.11 0.04 0.11 0.18 0.24 0.26
C017 0.13 0.14 0.22 0.33 0.30 0.16 0.09 0.06 0.04 0.08 0.09 0.16 0.11 0.11 0.14 0.18 0.21
C018 0.19 0.22 0.26 0.34 0.23 0.10 0.06 0.05 0.04 0.11 0.11 0.17 0.05 0.11 0.20 0.23 0.20
C019 0.22 0.25 0.32 0.42 0.26 0.12 0.08 0.11 0.06 0.08 0.06 0.10 0.05 0.08 0.13 0.17 0.23
C020 0.14 0.16 0.25 0.43 0.27 0.10 0.08 0.09 0.06 0.12 0.09 0.15 0.04 0.05 0.07 0.09 0.21
C021 0.21 0.24 0.33 0.40 0.23 0.12 0.10 0.18 0.12 0.18 0.11 0.19 0.06 0.08 0.12 0.18 0.23
C022 0.25 0.21 0.24 0.28 0.19 0.10 0.11 0.17 0.10 0.14 0.11 0.17 0.07 0.14 0.25 0.28 0.20
C023 0.17 0.18 0.21 0.19 0.12 0.05 0.09 0.09 0.05 0.09 0.06 0.10 0.05 0.08 0.12 0.12 0.13
C024 0.12 0.12 0.13 0.16 0.10 0.06 0.13 0.13 0.08 0.14 0.11 0.18 0.06 0.12 0.14 0.10 0.12
C025 0.14 0.15 0.16 0.16 0.09 0.05 0.14 0.18 0.09 0.12 0.08 0.14 0.06 0.06 0.07 0.10 0.12
C026 0.41 0.42 0.47 0.50 0.21 0.08 0.08 0.11 0.07 0.11 0.07 0.11 0.07 0.08 0.14 0.25 0.27
C027 0.10 0.12 0.15 0.16 0.12 0.06 0.06 0.08 0.04 0.06 0.04 0.08 0.06 0.05 0.10 0.09 0.11
C028 0.26 0.24 0.23 0.20 0.08 0.05 0.11 0.14 0.08 0.13 0.10 0.15 0.07 0.05 0.08 0.17 0.15
C029 0.24 0.27 0.37 0.46 0.26 0.11 0.11 0.16 0.08 0.11 0.08 0.14 0.09 0.07 0.09 0.19 0.24
C030 0.49 0.45 0.47 0.49 0.27 0.12 0.16 0.25 0.17 0.29 0.21 0.34 0.16 0.08 0.16 0.39 0.34
C031 0.08 0.10 0.18 0.22 0.11 0.07 0.11 0.17 0.11 0.15 0.09 0.14 0.07 0.04 0.06 0.10 0.12
Mean 0.19
Standard deviation 0.07

Table B10: Directional wind velocity ratios (VR500,i,j) and overall wind velocity ratios (VRw,j) – Special Test Points
Test Point 0°°°° 22.5°°°° 45°°°° 67.5°°°° 90°°°° 112.5°°°° 135°°°° 157.5°°°° 180°°°° 202.5°°°° 225°°°° 247.5°°°° 270°°°° 292.5°°°° 315°°°° 337.5°°°° VRw,j
B05 0.18 0.19 0.18 0.21 0.17 0.10 0.11 0.08 0.04 0.05 0.04 0.08 0.05 0.08 0.14 0.16 0.15
B08 0.14 0.17 0.16 0.20 0.16 0.12 0.10 0.07 0.03 0.06 0.04 0.06 0.04 0.08 0.11 0.13 0.14
B09 0.10 0.13 0.21 0.33 0.22 0.15 0.11 0.07 0.03 0.07 0.07 0.07 0.04 0.09 0.11 0.14 0.17
B10 0.15 0.21 0.21 0.27 0.18 0.12 0.09 0.07 0.03 0.05 0.04 0.05 0.03 0.06 0.11 0.12 0.16
B11 0.19 0.12 0.12 0.18 0.18 0.13 0.12 0.08 0.03 0.06 0.04 0.08 0.07 0.17 0.43 0.34 0.15
B13 0.13 0.15 0.16 0.19 0.15 0.11 0.10 0.08 0.03 0.06 0.04 0.07 0.05 0.10 0.11 0.12 0.13
B14 0.21 0.20 0.20 0.24 0.21 0.17 0.15 0.13 0.04 0.08 0.07 0.10 0.06 0.12 0.15 0.17 0.18
C002 0.21 0.20 0.24 0.39 0.34 0.19 0.14 0.09 0.07 0.11 0.07 0.13 0.18 0.40 0.39 0.27 0.25
C006 0.24 0.20 0.18 0.21 0.15 0.12 0.14 0.12 0.07 0.16 0.09 0.16 0.12 0.16 0.30 0.35 0.17
C039 0.32 0.28 0.30 0.42 0.32 0.20 0.15 0.11 0.06 0.08 0.05 0.13 0.09 0.18 0.38 0.41 0.27
C076 0.13 0.20 0.20 0.25 0.19 0.10 0.07 0.06 0.04 0.04 0.03 0.08 0.04 0.04 0.09 0.08 0.15
C077 0.11 0.10 0.13 0.17 0.15 0.09 0.07 0.05 0.03 0.07 0.06 0.09 0.04 0.06 0.13 0.21 0.12
C083 0.24 0.12 0.24 0.47 0.43 0.26 0.17 0.06 0.03 0.04 0.03 0.06 0.12 0.32 0.44 0.46 0.28
C096 0.42 0.36 0.36 0.43 0.39 0.33 0.24 0.23 0.08 0.08 0.06 0.12 0.07 0.29 0.45 0.53 0.33
C113 0.17 0.13 0.14 0.19 0.17 0.15 0.17 0.13 0.05 0.12 0.06 0.13 0.15 0.32 0.44 0.39 0.16
C120 0.18 0.17 0.16 0.17 0.15 0.12 0.16 0.13 0.03 0.08 0.09 0.14 0.07 0.17 0.31 0.28 0.15
C126 0.25 0.24 0.36 0.44 0.41 0.31 0.23 0.15 0.06 0.15 0.09 0.17 0.23 0.40 0.52 0.46 0.32
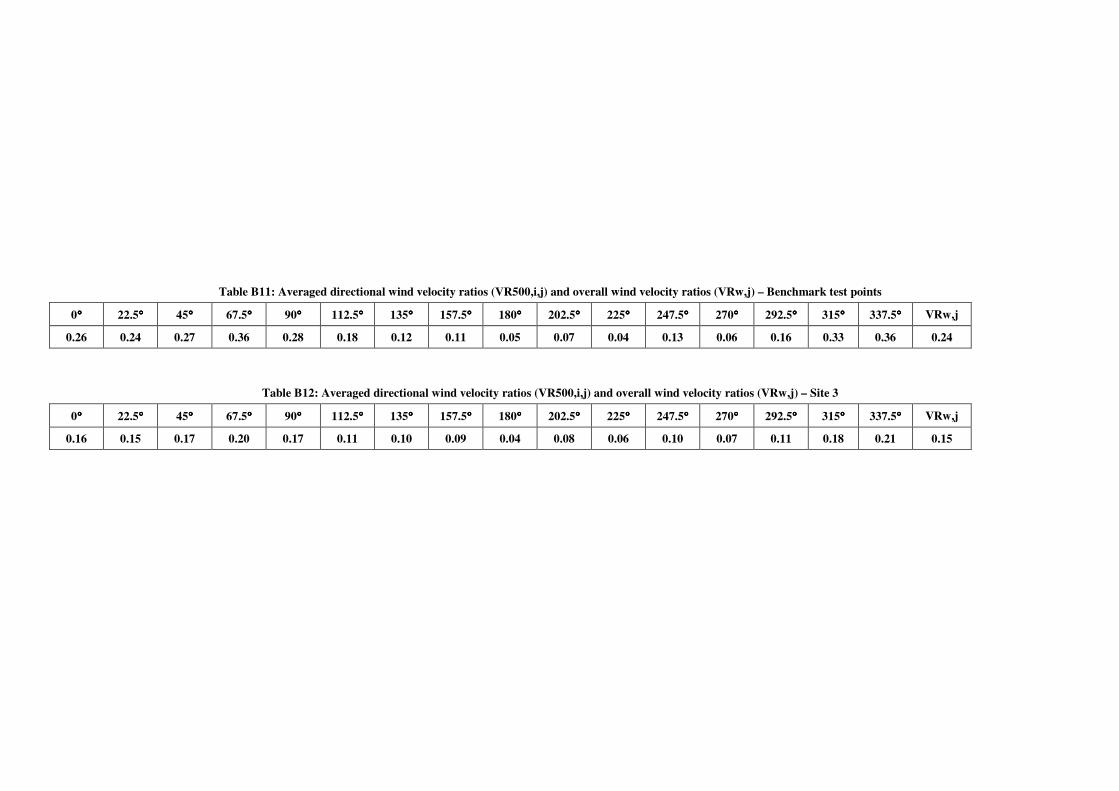
Table B11: Averaged directional wind velocity ratios (VR500,i,j) and overall wind velocity ratios (VRw,j) – Benchmark test points
0°°°° 22.5°°°° 45°°°° 67.5°°°° 90°°°° 112.5°°°° 135°°°° 157.5°°°° 180°°°° 202.5°°°° 225°°°° 247.5°°°° 270°°°° 292.5°°°° 315°°°° 337.5°°°° VRw,j
0.26 0.24 0.27 0.36 0.28 0.18 0.12 0.11 0.05 0.07 0.04 0.13 0.06 0.16 0.33 0.36 0.24
Table B12: Averaged directional wind velocity ratios (VR500,i,j) and overall wind velocity ratios (VRw,j) – Site 3
0°°°° 22.5°°°° 45°°°° 67.5°°°° 90°°°° 112.5°°°° 135°°°° 157.5°°°° 180°°°° 202.5°°°° 225°°°° 247.5°°°° 270°°°° 292.5°°°° 315°°°° 337.5°°°° VRw,j
0.16 0.15 0.17 0.20 0.17 0.11 0.10 0.09 0.04 0.08 0.06 0.10 0.07 0.11 0.18 0.21 0.15
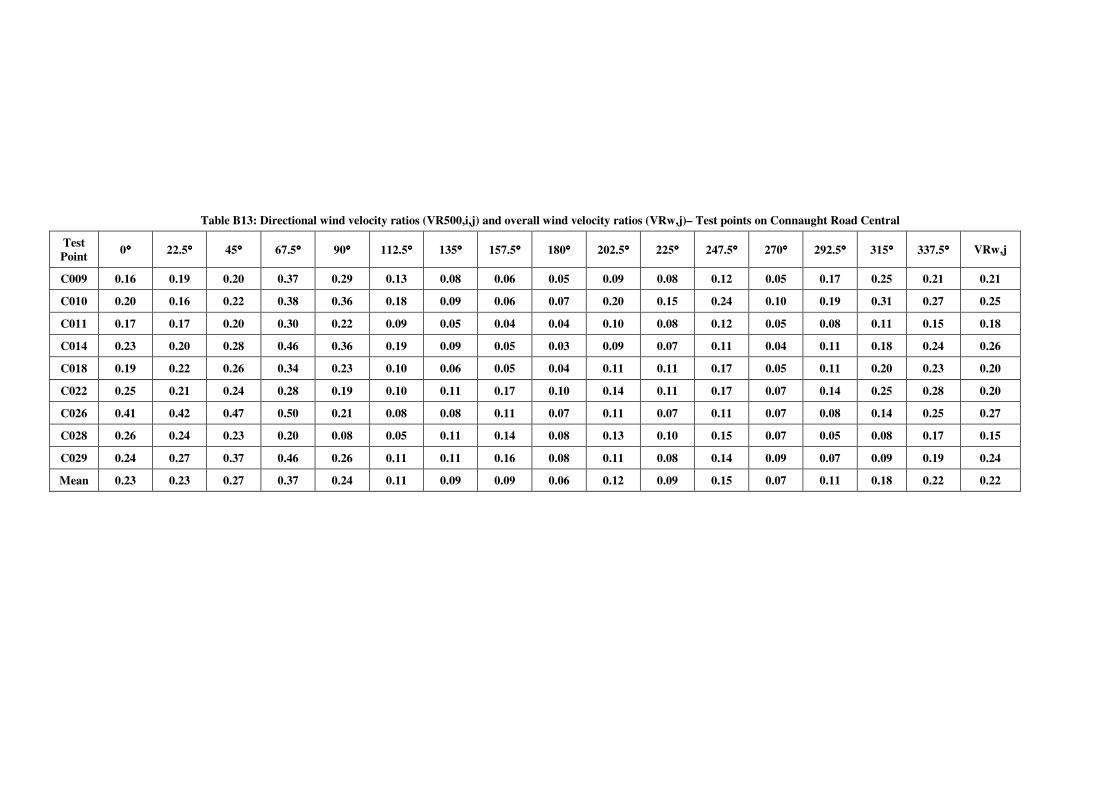
Table B13: Directional wind velocity ratios (VR500,i,j) and overall wind velocity ratios (VRw,j)– Test points on Connaught Road Central
Test Point 0°°°° 22.5°°°° 45°°°° 67.5°°°° 90°°°° 112.5°°°° 135°°°° 157.5°°°° 180°°°° 202.5°°°° 225°°°° 247.5°°°° 270°°°° 292.5°°°° 315°°°° 337.5°°°° VRw,j
C009 0.16 0.19 0.20 0.37 0.29 0.13 0.08 0.06 0.05 0.09 0.08 0.12 0.05 0.17 0.25 0.21 0.21
C010 0.20 0.16 0.22 0.38 0.36 0.18 0.09 0.06 0.07 0.20 0.15 0.24 0.10 0.19 0.31 0.27 0.25
C011 0.17 0.17 0.20 0.30 0.22 0.09 0.05 0.04 0.04 0.10 0.08 0.12 0.05 0.08 0.11 0.15 0.18
C014 0.23 0.20 0.28 0.46 0.36 0.19 0.09 0.05 0.03 0.09 0.07 0.11 0.04 0.11 0.18 0.24 0.26
C018 0.19 0.22 0.26 0.34 0.23 0.10 0.06 0.05 0.04 0.11 0.11 0.17 0.05 0.11 0.20 0.23 0.20
C022 0.25 0.21 0.24 0.28 0.19 0.10 0.11 0.17 0.10 0.14 0.11 0.17 0.07 0.14 0.25 0.28 0.20
C026 0.41 0.42 0.47 0.50 0.21 0.08 0.08 0.11 0.07 0.11 0.07 0.11 0.07 0.08 0.14 0.25 0.27
C028 0.26 0.24 0.23 0.20 0.08 0.05 0.11 0.14 0.08 0.13 0.10 0.15 0.07 0.05 0.08 0.17 0.15
C029 0.24 0.27 0.37 0.46 0.26 0.11 0.11 0.16 0.08 0.11 0.08 0.14 0.09 0.07 0.09 0.19 0.24
Mean 0.23 0.23 0.27 0.37 0.24 0.11 0.09 0.09 0.06 0.12 0.09 0.15 0.07 0.11 0.18 0.22 0.22