nadiawohlfarth.weebly.com · web viewthis image shows contour strip mining: used on mountainous...
TRANSCRIPT

Chapter 10:
This is a map of 34 hotspots. Ecologists identified these hotspots as important and endangered centers of biodiversity/natural capital.
This shows an area in Moab, Utah that contains damage from off-road vehicles in a proposed wilderness. These vehicles damage soils and vegetation.

Chapter 12:
This image is of Norwegian whalers harpooning a sperm whale, an example of aquatic natural capital degradation.
An example of threatened natural capital is the endangered green sea turtle.
Chapter 13:
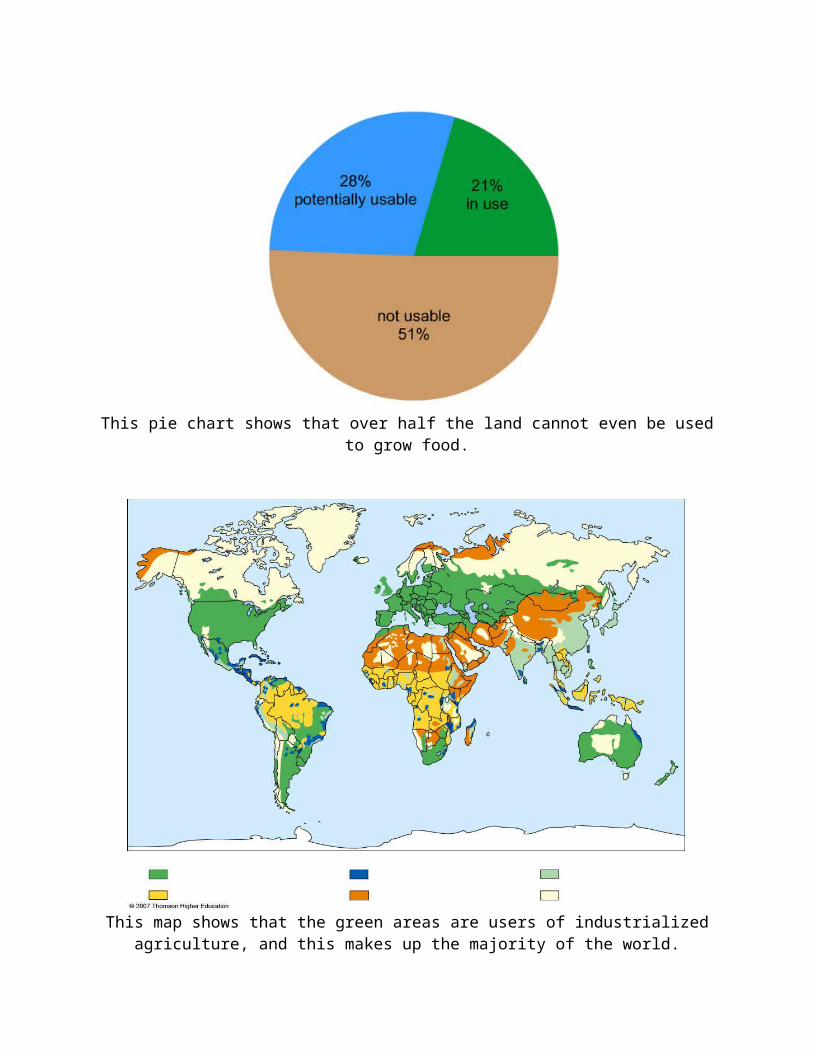
This pie chart shows that over half the land cannot even be used to grow food.
This map shows that the green areas are users of industrialized agriculture, and this makes up the majority of the world.

Chapter 14:
This map shows areas that are quickly depleting their groundwater use, places like the midwest, and parts of California.
This is a diagram of a more efficient way to use water called drip irrigation.

Chapter 15:
This shows the major features that are on the earth’s crust as well as the upper mantle.
This image shows contour strip mining: used on mountainous terrain, it often leaves an erodible bank called a highwall.
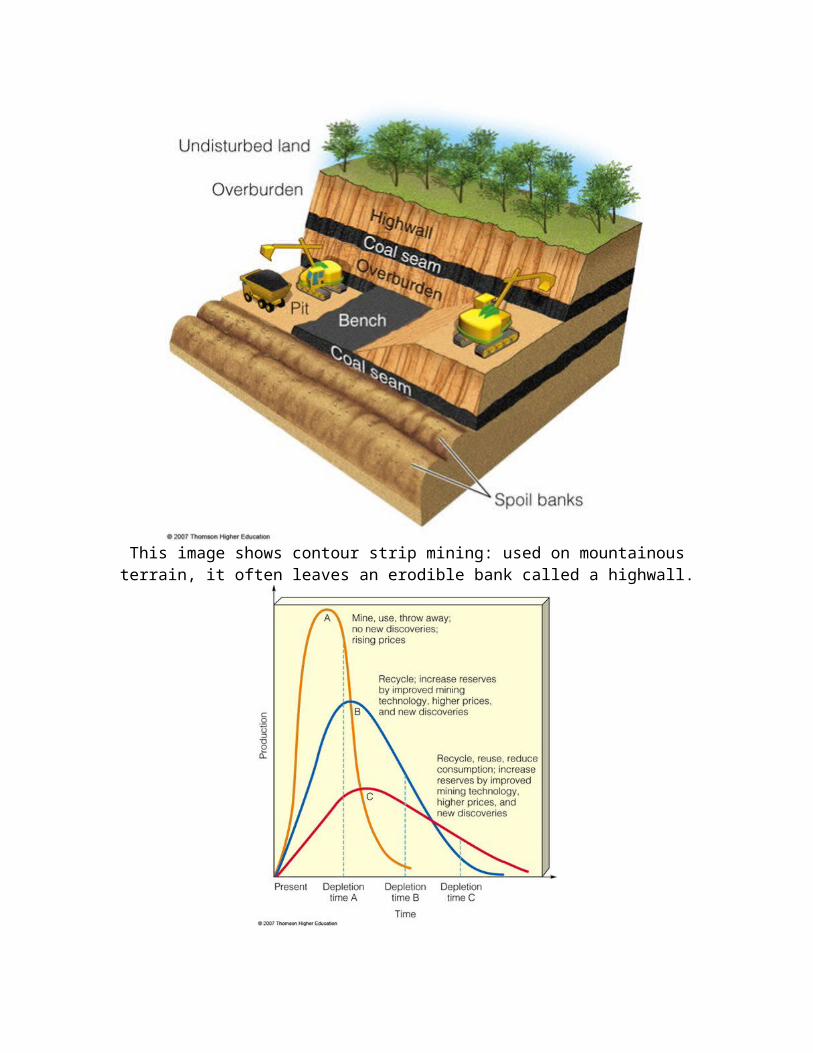
This image shows depletion curves of renewable resources using certain assumptions.
Chapter 16:
This image shows different sources of nonrenewable resources as well as geothermal energy sources that come from the earth’s crust.

This image shows the CO2 emissions per unit of energy produced with various energy resources.
This image shows how one can compare coal and nuclear and what their disadvantages and advantages are.
Chapter 17:

This image shows a hybrid car which is known to be much more fuel efficient than a typical gasoline car. It uses an electric motor as well as a gasoline engine.
This image shows the energy inputs and outputs of the economy and lifestyle of the US.
Chapter 18:

This image shows the seven deadliest diseases and their yearly deaths.
This image shows the pathways in which infectious diseases infect humans.

Chapter 21:
Water pollution is caused many different sources, in different areas and stages.
Chapter 22:
Incinerators produce energy and reduce the size of solid wastes.

Chapter 23:
Buildings use green roofs to lower urban air temperatures and diminish the heat island effect.