mathatelite.weebly.com€¦ · web viewthe letters spell the word elephant.a ... the total number...
TRANSCRIPT

Probability1. A Venn diagram has three main categories. How many total groups can be formed from the three main categories?
A) 5 B) 6 C) 7 D) 82. A model has 15 different shirts, 8 different hats, and 10 different pairs of pants to choose from. How many different outfits of 1 shirt, 1 hat, and 1 pair of pants are possible?A) 33 B) 99 C) 400 D) 12003. The probability that it will rain tomorrow in Georgia is 30%. The probability that it will rain tomorrow in both Georgia and Alaska is 12%.If it rains tomorrow in Georgia, what is the probability that it will rain tomorrow in Alaska?A) 12% B) 18% C) 32% D) 40%4. A bag contains equal numbers of red, blue, and yellow marbles. A student chooses a marble at random. What is the relationship between the probability that the marble is red and the probability that the marble is NOT red?A)P(red)=P(not red) B) P(red) = • P(not red) C) P(red) = P( not red) -1 D) P(red) = 1- P(not red)5. A bag contains tiles that each have a letter on them. The letters spell the word ELEPHANT.A tile is chosen at random. What is the probability that the tile chosen has a vowel on it?
A) B) C) D) 6. This spinner is divided into 12 congruent sections numbered 1 through 12.
A student will spin the arrow on the spinner one time. What is the probability that the arrow will stop on a number that is a multiple of 3 or 4?
A) B) C) D) 7. A high school cross-country team consists of 6 freshmen, 5 sophomores, 4 juniors, and 5 seniors. The coach randomly chooses one of the runners to hand out race numbers.What is the probability that the chosen runner is a junior or senior?A) 1/20 B) 1/5 C) 1 / 4 D) 9 /20 8. The freshman class is choosing representatives for a homecoming contest. The names of 6 girls and 6 boys are each written on a piece of paper. The pieces are placed in a bag. Two names are chosen at random. What is the prob. That one boy’s name and one girl’s are chosen? A ¼ B) 3/11 C) 1/2 D)6/11

9. Which scenario represents a dependent situation?A) Two coins are flipped by the same person.B) Two marbles are taken from a bag at the same time.C) Two number cubes are rolled at the same time and their face values are added together.D) A colored paperclip is taken from a box, put back, and then a second paperclip is taken.10. There are 4 blue tiles and 1 red tile in a bag. Two tiles are drawn from the bag at the same time. What is the probability that both tiles drawn are blue?A) 1 / 5 B) 2 / 5 C) 3 / 5 D) 4 / 5 11. A drawer contains the following 9 pairs of socks: - 3 blue pairs, 2 black pairs and 3 white pairs Two pairs of socks are randomly selected from the drawer at the same time. What is the Probability that both pairs are white?A) 1 / 6 B) 16 / 81 C) 59/ 72 D) 8 / 9 13. This graph shows a set of data from a study of the nitrogen concentration in plants with multiple base stems.
Which equation BEST fits the data in the graph?A) y=0.38x+18.08 B) y= - 0.38x+18.08 C) y= 0.00058 x2+0.38x +18.08 D) y= - 0.00058x2+0.38x+18.0814.A student concludes from a set of experimental data that the relationship between the growth of a plant and the loss of water through its surface is modeled well by a quadratic function. Which graph MOST likely show the data from this experiment?
A) B) C) D)

15. A student measures the period of a simple pendulum using strings of different lengths. The student concludes that the data can best be modeled by an increasing linear function. Which graph could represent the student’s data?
A) B) C) D) 16. These graphs show experimental data that relates the energy intake of infants to their age, in months. Which graph is MOST likely to be best modeled by a quadratic function?
A) B) C) )
17. A researcher concludes from a set of experimental data that the relationship between the protein concentration of a plant and the plant's density is best modeled by a quadratic function. Which graph BEST supports this conclusion?
A) B) C) D
18. This scatter plot shows the relationship between the length of some plant stems that are covered by lichen, and the mass of the lichen.

What is the approximate slope of the median-median line?A) 0.23 B) 0.35 C) 0.64 D) 0.88Constructed Response1. Below fair number cubes are rolled and the products of the outcomes are determined. The table shows all possible outcomes for the products.
Part ABased on the table, what is the probability that the product is greater than 10, given that a 6 lands face-up on the first number cube? Explain your work.
Part BBased on the table, what is the probability that the product is even or a multiple of 5? Show your work.2) A group of students participated in snow activities over winter break. The table shows the numbers of girls and boys and which type of snow activities they participated in.

What is the value of P ( Sn or G) ?
3) A business owner asked all 60 of her employees to put their names on cards for a prize drawing. She plans to randomly select one employee for the prize. The table shows the distribution of the employees by gender and age.
The following are events in this situation.
Explain whether the events F and Y are independent.
2) The two-way frequency table shows data from a survey of students enrolled in science classes at Einstein College.

Part ABased on the model, how much more likely is it that a student chosen at random would be enrolled in General Science or Physics than Chemistry? Show your work or explain your answer.
Part Busing the data from the model, estimate the probability that a randomly selected student would be enrolled in Biology given that the student is in the 9th grade. Show your work or explain your answer.
Part CAccording to the model, are the probability of a student enrolled in Chemistry and the probability of a student enrolled in 12th grade independent of each other? Justify your answer by showing or explaining your work.3) The two-way frequency table shows information from a random sample of students about participation in school-sponsored activities and enrollment in foreign language classes.

Part ACopy and complete the two-way frequency table showing the data in the table and its marginal frequencies. Explain how you found your answers. Create a table showing the conditional probabilities by participation in school-sponsored activities and another table showing the conditional probabilities by enrollment in foreign language classes. Show your work and round the probabilities to the nearest hundredth. What trends are shown by the data?
Part BThere are 426 students in the school. The conditional probability that a female student participates in a school-sponsored activity is 0.80, and the conditional probability that a male student is enrolled in a mathematics class is 0.80. Are the two probabilities independent of each other? Explain your answer.4) The total number of full-time and part-time employees at a store is 50. Each employee works either the morning shift or the afternoon shift. More information about the employees is given below.
15 employees are part-time 28 employees are males 30 employees work the morning shift 6 male employees work part-time

12 male employees work the morning shiftThe names of each of the 50 employees are written on separate cards. The cards are shuffled and placed into a container.
Part AIf one card is selected at random from all 50 cards in the container, what is the probability that the employee is part-time or male? Show your work and explain your answer.
Part BIf one card is selected at random from all 50 cards in the container, what is the probability that the employee is male or works the afternoon shift? Show your work and explain your answer.
Part CIf one card is selected at random from all 50 cards in the container, what is the probability that the employee is a female who does not work the morning shift? Show your work and explain your answer.5) A pharmaceutical lab conducts two studies. The researchers want to determine if their allergy medication stops eyes from itching.
In the first study, the researchers interview people who have complained of itchy eyes. The participants are divided into two groups, those using the allergy medication and those not using it.
In the second study, the researchers recruit people who suffer from allergies that cause itchy eyes. Participants are assigned to Group A or Group B at random and do not know which group they are in. Group A receives the allergy medication and Group B receives a placebo. The researchers record the reduction of eye itchiness in each group after one treatment.
Part AIs the data-gathering process described in the first study an observational study, an experiment, or a sample survey? What is an advantage to this data-gathering process? Explain your answer.
Part BIs the data-gathering process described in the second study an observational study, an experiment, or a sample survey? Why is random selection important in this data-gathering process? Explain your answer.
Part CGroup A has 40 members, and Group B has 25 members. The table shows the results of the second study.

Does the medication being tested appear to reduce the occurrence of itchy eyes? Justify your conclusion.6) Two competing airlines offer commuter flights from Los Angeles to Catalina Island. The table represents one year of data for flights at both airlines.
Part ACalculate the on-time rate for all flights for both airlines over the past year.
Part BCalculate the on-time rate for Airline A. Calculate the on-time rate for Airline B. Show your work.
Compare the two airlines. Which airline would you choose to fly to Catalina if your main concern is being on time? Explain your answer.
Part CWhat proportion of delayed flights was Airline A responsible for? What proportion of on-time flights was Airline B responsible for? Show your work.
Part DThe on-time rate for flights at Airline B has been charted for prior years.

Identify the trend in the data. Based on the on-time rate that you calculated for this year, predict what will happen to the on-time rate in upcoming years.6) One hundred high school students were asked which type of music, limited to rock and country, they like to listen to. The results of the survey will be displayed in the two-way table shown.
The survey showed that 50 students like both rock music and country music, 31 do not like either rock or country music, 12 like rock music but do not like country music and 7 like country music but do not like rock music.
Part ACopy the table onto your paper and record the data given in the table. Then complete the table by filling in the marginal frequencies.
Part B

Is there evidence of a positive association between liking rock music and liking country music? Explain your answer.
Part CSuppose you interview another student from the population represented by this sample, and that student does not like country music. Based on the sample, what is the probability that this student does like rock music? Explain your answer.7) The director of a community recreation center would like to increase the number of teens who participate in summer programs. She creates a questionnaire to gather data about the types of programs that teens in the community like. The community has approximately 2,000 teens, but the director’s funds are limited. She has decided to give the questionnaire to 50 teens and then draw conclusions from the results.
Part AIs the data-gathering process described part of an observational study, an experiment, or a sample survey? Explain your answer.
Part BSuppose that the director gives the 50 questionnaires to the first 50 teenage boys who show up for the boys’ soccer tournament. Is her selection of teens a good one statistically? Explain your answer.
Part CSuppose that the director is given permission to distribute the questionnaires to students at the community’s only high school since almost all of the local teens attend that school. She selects 50 students at random from the list of all students and gives them the questionnaire. Is her selection of teens a good one statistically? Explain your answer.
Part DIf the director uses the method of data-gathering in Part C, describe a method she could use to ensure that the students are selected at random. Why is random selection important in this process?8) The dot plot shows Kim’s quiz scores for last semester. The maximum score on each quiz is 10.

The table shows Kim’s quiz scores for this semester.
Part ACreate a dot plot for Kim’s quiz scores for this semester.
Part BWhat is the difference between the means of the two data sets? Show your work.
Part CKim takes two more quizzes this semester. The mean for this semester’s quiz scores decreases by 1 from what is shown in the table. What could be Kim’s scores on these two quizzes? Show your work or explain your answer.9) The two-way frequency table shows the adoption data for an animal shelter for the first five months of a year.
Part AWhat is the difference between the interquartile ranges of the number of cats adopted and the number of dogs adopted during the first five months? Show your work or explain your answer.
Part B

Create a conditional relative frequency table for this data. Explain the values you used in your table.10) The table shows the amounts Anita earned for babysitting.
Part AA linear model for the data is What do the slope and y -intercept of the linear model represent in the context of the given data?
Part BAnalyze the residuals for the data shown in the table. Show your work and explain your answer.12) Jeff collected information from 100 cities in the United States. He plotted the average monthly temperature for September ( x ) and the total number of inches of rainfall in September ( y). Using his calculator, Jeff determined the equation for a line of best fit. The correlation coefficient for his data is
Part AWhat information does the correlation coefficient give about the strength of the linear relationship between temperature and rainfall? Explain your answer.
Part BHow useful is Jeff’s line of best fit for predicting rainfall from temperature? Explain your answer.
Part CJeff switched the x and y values for all of the ordered pairs of his original data and plotted the results. How does the r of this new data set compare with his original r? Explain how you know.
Part DAfter Jeff switched the x and y values for the original data and plotted the results, is the line of best fit of this new data set the same as his original line of best fit? Explain how you know.

13) A car dealer summarizes his business by recording the number of customers who purchased or leased cars. He also records the size of the car (small, midsize, and full-size). The table shows his summary for one week.
Part ARegardless of whether a customer purchased or leased a car, which size was most preferred? Justify your answer using the information in the table.
Part BOf the people who purchased a car, what trend (in terms of car size) appears to be true for that week? Explain your reasoning.
Part CWhat association do you see between the type of sale (purchased or leased) and the size of the car? Justify your answer using the information in the table.14) Several students completed a paper-and-pencil maze multiple times in an experiment. Their times, in seconds ( y ), were plotted against the number of previous attempts they had made ( x ) in a scatter plot as shown.

A linear model that describes the data is given by the equation
Part AInterpret the slope of the line in terms of the context.
Part BDetermine the y -intercept of the line. Explain what the y -intercept represents in terms of the context.
Part CDetermine the x -intercept of the line. What is the significance of the x -intercept in terms of the context? Explain your answer.14) Jelena is considering buying a used car from two different dealerships. The list shows the prices of the cars Jelena is considering buying from Dealership A.

The box plot displays the prices of the 7 cars Jelena is considering buying from Dealership B.
Part ADraw a box plot to represent the prices of the cars Jelena is considering buying from Dealership A.
Part BWhat is the difference in the interquartile ranges of the two data sets? Show your work.
Part CFor which dealership is the mean of the prices of the cars that Jelena is considering buying greater? Explain your answer.
Part DWhat is the median car price for each dealership? Compare the medians and means for each dealership. Which best represents the prices at each dealership, the mean or the median? Explain your answer.15) The table shows the number of bacteria in a culture at different times during an experiment.
Part AWhat was the number of bacteria at the beginning of the experiment? Show your work or explain your answer.
Part BWrite an exponential equation that fits the data for n , the number of bacteria, in terms of h , the number of hours since the experiment began.

Part CUse your equation from Part B to find the number of bacteria 4 hours after the experiment began. Show your work.
Part DSketch a graph of the equation that represents the data for the first 4 hours of the experiment. Label the scales for both axes. Include an appropriate title for the graph and for each axis.15) The scatter plot shows Grace’s distance, in miles, from her destination at the end of each hour during her car trip.
Part AWrite a linear function that fits the data shown in the scatter plot. Explain how you determined your function.
Part BIdentify and interpret the slope, x -intercept, and y -intercept of the linear function in the context of the situation.
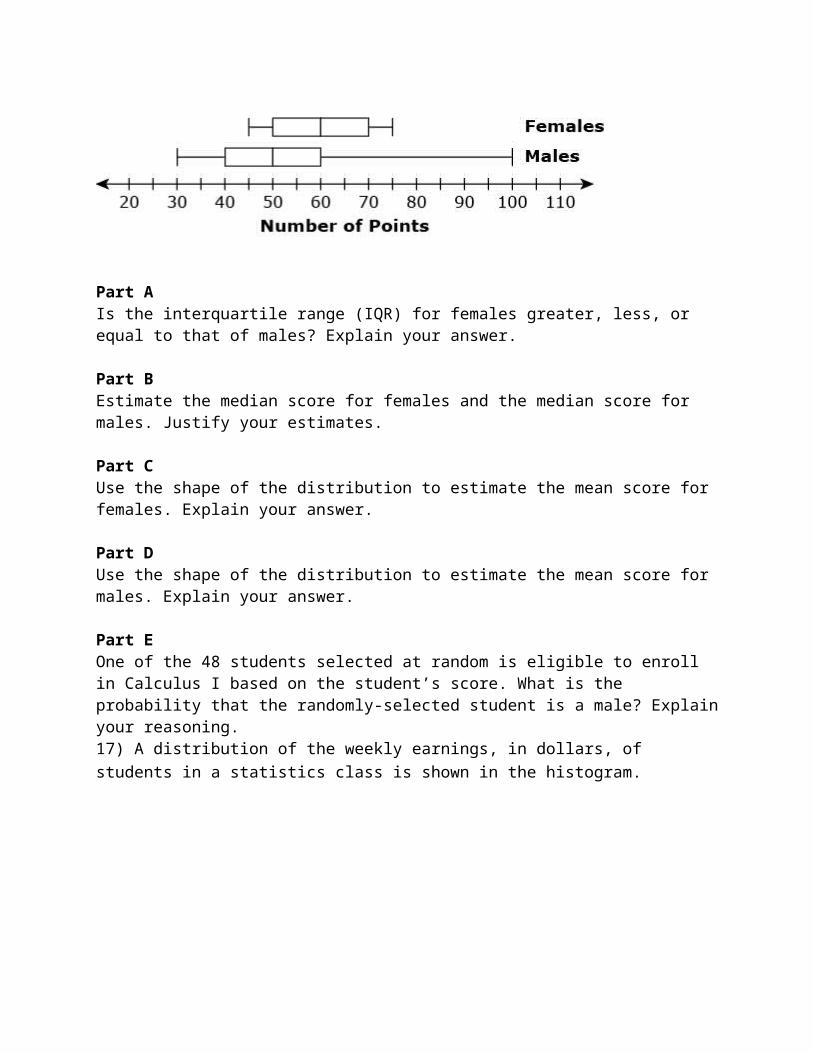
Part CDefine the domain of the function that best fits this situation. Explain your answer.16) Incoming freshmen at a community college can take a placement test to determine if they are eligible for a college Calculus class. A student needs to score 50 or more points to enroll in Calculus I. Students scoring less than 50 points must enroll in a Pre-Calculus course first. The box plots show the data collected from the scores of 24 females and 24 males who took a recent placement test.

Part AIs the interquartile range (IQR) for females greater, less, or equal to that of males? Explain your answer.
Part BEstimate the median score for females and the median score for males. Justify your estimates.
Part CUse the shape of the distribution to estimate the mean score for females. Explain your answer.
Part DUse the shape of the distribution to estimate the mean score for males. Explain your answer.
Part EOne of the 48 students selected at random is eligible to enroll in Calculus I based on the student’s score. What is the probability that the randomly-selected student is a male? Explain your reasoning.17) A distribution of the weekly earnings, in dollars, of students in a statistics class is shown in the histogram.

Part AIn which interval is the median of this distribution located? Explain your answer.
Part BIf the data set is graphed as a box-and-whisker plot, describe how the upper and lower whiskers would compare with each other.
Part COne of the students made a dot plot of this data set. Explain what information a dot plot would provide that is not provided by the histogram.
Part DOne of the students was absent the day the data was collected, and his weekly salary of $200 is added to the data set. Explain what effect, if any, this new data point has on the median.18) Garret sells laptop and desktop computers. He asks his customers what the computer will be primarily used for-school, home, or work. The table shows Garret's yearly summary giving the proportion of each type of computer he sold and its primary use.
Part AWhat proportion of Garret's sales are computers primarily used for school or work? Show your work and explain your answer.
Part BConsider the following two situations:
A customer buys a computer from Garret for work. A customer buys a desktop computer from Garret.
Based on the data in the table, which of the two situations is most likely to occur? Show your work and explain your answer.
Part CIf Garret randomly selects a customer from those who purchased a desktop computer, what is the probability the customer uses the computer primarily for work? Show your work and explain your answer.

Part DIf Garret randomly selects a customer from those who purchased a computer primarily for school, what is the probability the customer bought a laptop? Show your work and explain your answer.19) The graph shows the data the students in a botany class recorded for the height of a plant over several days.
The students were instructed to fit a function h to describe the height of the plant after t days.
The teacher informed the class to use the point and one other point to create their function. The students were also instructed to assume that the plant kept growing as the graph indicated for the next two days.
Part AA student used point and point to write a linear function to fit the data. Write the equation of that function. Show and explain your work.
Part B
Another student used point as the vertex of a parabola that contained the
point to write a quadratic function to fit the data. Write the equation of the quadratic function. Show and explain your work.
Part CUse the functions from Part A and from Part B to determine the projected height of the plant after 32 days for each function. Show and explain your work.

Part DBased on your results in Part C, which function better fits the data? Explain your answer.20) The two-way frequency table shows survey results for how many hours students at a high school worked on average each week last summer by grade.
What is the difference between the probability that a junior worked an average of 10 to 19 hours each week and the probability that a freshman worked an average of 20 to 29 hours each week? Round your answer to the nearest hundredth.21) Consider the given Venn diagram.

What is
22) The board of directors of a large aviation museum wanted to find ways to increase the donations made to the museum. They wondered whether having patriotic music playing in the background would affect the generosity of visitors.
The days were selected at random. Patriotic music was played during 30 out of 60 days. At the end of the experiment the daily donation totals were compared.
The table shows the results of the experiment.
Part AWhat kind of study was this? Why was it necessary to select the days randomly? Give an example to support your answer.
Part BCompare the center and spread of the two data sets. What does this information tell you about the daily donations?
Part CBased on the data, what recommendations would you give the board of directors? Justify your answer.
Part DWhat additional information would a graph of the data give about the situation?23) Question Preview
CloseTwo groups in a class took the same quiz. The results of each group are shown.
The difference between the interquartile ranges of the two groups is 7.5. Write an equation that can be used to find x, the first quartile of Group B.24) The table shows the number of pre-owned vehicles at an auto dealership that went through a safety inspection.
The manager stated, “More trucks than cars passed the safety inspection.” Write a statement, using the data from the table, which would more accurately compare the results of the safety inspection.
56) Beth made the following pie graph to represent her monthly budget.

What percentage of her budget does she spend on her rent and car combined?A) 50% B) 72% C) 90% D) 180%
