gwendolynkidera.weebly.comgwendolynkidera.weebly.com/uploads/8/3/8/4/8384521/... · web viewlittle...
TRANSCRIPT

FACTORS AFFECTING MALNUTRITION IN MERU, KENYA 1
A Study on Factors Affecting Cases of Malnutrition
In and Around Meru, Kenya
Gwendolyn Kidera
Northeastern University
Author Note
This report was prepared for the Miriam Kanana Mubichi Foundation, per their request,
and in conjunction with Noel Mugambi Mutuma, an intern at Meru District Hospital. Data was
collected between the months of September and December of 2011.
FACTORS AFFECTING MALNUTRITION IN MERU, KENYA 2
Abstract
The 2008-09 Kenya Demographic and Health Survey indicates that currently in Kenya 7% of
children under the age of five are considered to have moderate acute malnutrition and an
additional 2% have severe acute malnutrition (p. 144). Although Meru, Kenya is typically not
considered a malnutrition-prone area—and therefore does not generally receive international aid
—the Meru District Hospital’s protein energy malnutrition ward receives a number of new
patients each week. The Miriam Kanana Mubichi Foundation, a locally-based nonprofit,
requested an analysis of malnutrition in the area for the development of future preventative
programs. Interviews of the primary caretakers, generally mothers, of 23 malnourished children
in the ward were conducted over a period of two months. To supplement this data, admittance
records dating back to June 2010 were also analyzed. Generally, the women interviewed ranged
in age from 20 to 25 years old, had not completed primary school, were unemployed and had
husbands who were also unemployed, and gave birth to their first child when they were between
the ages of 15 and 20 years old. Malnourished children were primarily male, between the ages
of 3 and 15 months, had a birth interval of 24 to 47 months, and a diet lacking in protein. It is
believed that lack of education, especially nutritional education, as well as unemployment, and
concurrently poverty, are some of the leading factors associated with malnutrition in the Meru
area. Preventative programs will be developed based on these results in an effort to increase
their impact and effectiveness.

FACTORS AFFECTING MALNUTRITION IN MERU, KENYA 3
A Study on Factors Affecting Cases of Malnutrition
In and Around Meru, Kenya
Introduction
The Kenya National Bureau of Statistics 2008-09 Demographic and Health Survey (p.
144) indicates that currently in Kenya 2% of children under the age of five are considered to be
severely wasted with severe acute malnutrition (SAM) while an additional 7% are thin (wasted)
with moderate acute malnutrition (MAM) based on weight-for-height indicators (Ministry of
Medical Services, n.d.). According to past census data, since 2000, the percentage of children
considered wasted has changed very little. However, the Eastern Province of Kenya, within
which Meru District Hospital is located, showed a marked increase of 4% of children who were
wasted in 2003 to 7% of children in 2008-09. In addition, cases of wasting increased over two-
fold in Kenya between 2000 (7%) and 2003 (15%) among the children of mothers with no
education. Data collected in 2008-09 revealed a 2% drop in cases of wasting, among the same
group, down to 13% (Kenya National Bureau of Statistics [KNBS] et al., 2010, p. 145).
The Miriam Kanana Mubichi Foundation, a Kenyan nonprofit, has been donating baby
formula to Meru District Hospital (MDH) since August of 2010 for the purpose of feeding
premature babies, whose mothers cannot afford formula, and malnourished children under the
age of six months. To date they have donated 125 tins (50,000 grams) of formula powder for a
total of Ksh 78,482.00. Little data had been collected about how it was distributed and who the
beneficiaries were, making the impact of the donations unknown. This research project began as
a way to collect this data, thereby measuring impact, but through a Provost Research Grant from
Northeastern University, evolved to include a general study of malnourishment in the Meru area
(See Appendix A).
FACTORS AFFECTING MALNUTRITION IN MERU, KENYA 4
Definition of Malnutrition
For the purposes of this study, “malnutrition” refers to children suffering from
“undernutrition” whereas their diet is characterized by an “intake of nutrients insufficient to meet
daily energy requirements as a result of inadequate food intake or improper digestion and
absorption of food” (Kozier, B., Erb, G., Berman, A.J., & Burke, K., 2000, p. 1134). A child’s
nutritional status affects their growth, mental functions and learning capabilities, as well as their
overall health. Children with poor nutrition commonly experience deficiencies in vitamins, iron,
and proteins (1, p. 834-835). According to Kidd and Wagner (2001) malnutrition can cause or
lead to immunocompromise, making it difficult for a child’s immune system to fight off illnesses
and infections (p. 607). Many of the children in the protein energy malnutrition (PEM) ward at
MDH also had pneumonia and other diseases, thereby complicating treatment.
This report seeks to compare malnutrition in Meru, based on the data collected, to
malnutrition in the greater context of Kenya by referencing the most recent Demographic and
Health Survey (DHS). For the DHS, the Kenya National Bureau of Statistics surveyed children
under the age of five years for malnutrition using three different indices, height-for-age, weight-
for-height, and weight-for-age. For the purposes of this report, focus was placed on the weight-
for-height index which measures the current nutritional status of a child by calculating a child’s
body mass in comparison to their height. For this method, a child’s “Z-score” is determined with
a Middle Upper Arm Circumference (MUAC) test, an “alternative way to measure ‘thinness’”
(Ministry of Medical Services, n.d.). Children with Z-scores under negative two standard
deviations (-2 SD) are “considered thin (wasted) and are acutely malnourished” (KNBS, 2010, p.
142). This means that the child did not consume sufficiently nutritious food during the time
directly before the survey was conducted. Possible causes are insufficient consumption of food,
FACTORS AFFECTING MALNUTRITION IN MERU, KENYA 5
or a recent illness which led to weight loss and the commencement of malnutrition. If a child’s
index is below negative three standard deviations (-3 SD), they are said to be “severely wasted”
(KNBS, 2010, p. 142). The children in MDH’s PEM ward could all be classified as either
wasted or severely wasted.
Malnourished children at Meru District Hospital were characterized as having either
marasmus or kwashiorkor. Both are considered forms of starvation which is “a severe condition
of malnutrition” (Kidd & Wagner, 2001, p. 532). When a child does not consume enough
calories or proteins, they may have marasmus, while children who consume enough
carbohydrates but lack sufficient proteins in their diets will suffer from kwashiorkor (Kidd &
Wagner, 2001, p. 532). The National Guideline for Integrated Management of Acute
Malnutrition (2009) by the Ministry of Medical Services and Ministry of Public Health and
Sanitation, listed the following symptoms of marasmus and kwashiorkor (p. 5):
Marasmus Kwashiorkor
Severe weight loss and wasting Ribs prominent Limbs emaciated Muscle wasting May have good appetite With correct treatment, good prognosis
Bi-lateral oedema and fluid accumulation Loss of appetite Brittle thinning hair Hair colour change Apathetic and irritable Face may seem swollen High risk of death
According to discussions with the nutritionists at MDH, kwashiorkor is the more deadly
form of malnutrition because children suffering from it generally appear healthy due to their
distended abdomens, a common symptom. Uneducated mothers often see their children’s
swollen stomachs and believe they are well-fed and healthy. It generally is not until additional
FACTORS AFFECTING MALNUTRITION IN MERU, KENYA 6
symptoms or illnesses arise when the mothers seek treatment for their children, at which point it
is often too late.
Methodology
Research was conducted via informal discussions and interviews of the mothers of
malnourished children in the PEM ward of Meru District Hospital. As many of the women did
not speak English, and in an effort to ensure a strict adherence to ethical guidelines, interviews
were conducted in Kiswahili by a Kenyan intern at the hospital, Noel Mugambi Mutuma. The
mothers’ answers were then translated to Gwendolyn Kidera, the note taker and data compiler.
Efforts were made to make the women feel comfortable, such as keeping the interviews
confidential and explaining the purpose of the questions before asking them. The questions were
also kept short and simple so as not to pry, inconvenience the mothers, or take too much of their
time. Also, by keeping the questions brief and direct, accurate responses were more probable.
Questions were developed by Kidera and Mutuma who sought approval from the head
nutritionist before the interviews commenced (See Appendix B).
A total of 23 interviews were conducted between the months of September and
November of 2011. Twenty one of those interviews were with the mothers of malnourished
children, the remaining two interviews were conducted with the child’s primary caretaker, one
was the child’s grandmother and the other was the child’s aunt. Neither primary caretaker was
able to fully answer questions about the child’s mother. For the purpose of keeping the data
consistent and comparable, data from these two interviews was exempt from analysis and
calculations. However, both interviews will be discussed later in a separate section.
In addition to the interview data, with the consent of the head nutritionist and the
superintendent of the hospital, confidential admittance records for new patients were released for

FACTORS AFFECTING MALNUTRITION IN MERU, KENYA 7
analysis. The records included the details of 282 children admitted between the dates of June 8,
2010 and November 24, 2011. Their names were not recorded to retain anonymity.
All data, both quantitative and qualitative, was first copied by hand then input into Excel
spreadsheets. Quantitative data, such as foods included in a child’s typical diet, was first
grouped into comparable categories before being analyzed and used in the creation of graphs and
charts. The quantitative data is primarily descriptive in that it seeks to analyze the overall
context of malnutrition in Meru. For the qualitative data a method of triangulation was used in
which information collected from the Kenya National Bureau of Statistics was compared to
admission records from Meru District Hospital dating back to June 2010 and interview data from
the 23 caretakers questioned.
Hypothesis
Before data collection began, it was hypothesized by the researchers that there would be a
high correlation between mothers with no or low levels of education and high levels of
malnutrition. An inverse correlation was believed to exist between women with low levels of
wealth and high levels of malnutrition. Meaning, women who were impoverished were more
likely to have malnourished children. Farming of miraa, a stimulant, among the families of
malnourished children, or its prevalence in the areas where they lived, was also thought to be a
contributing factor. Its growth and distribution is common in the Meru area as well as Maua, a
neighboring town (Wrong, 2005). The growth of miraa, rather than crops for consumption, was
suspected to be tied to malnutrition.
Significance of the Study
The underlying goal of this research project was to draw general conclusions from the
interview responses and use this information to develop suggestions for future projects or

FACTORS AFFECTING MALNUTRITION IN MERU, KENYA 8
programs to prevent malnutrition in the Meru area. As part of her senior thesis project, Kidera
will be researching best practices for malnutrition prevention programs and working on ways to
apply them to the local context. An American volunteer, Sandi Troup, will be traveling to Meru
in the fall of 2012 to work with the Foundation for a minimum duration of two years. One of her
responsibilities will be to further develop these projects and implement them with the assistance
of the Foundation. These preliminary findings and suggestions have the potential to make a
major positive impact in the lives of many people. If the projects developed are successful, they
will hopefully help keep kids healthy and out of the hospital.
Scope and Limitations
Although the interviews were conducted over a period of approximately two months,
many days were unproductive and yielded no interviews. The hospital staff was busy and did
not have much time to devote to the project and the interviews could not be conducted without
their direct support and supervision. Between the first interview, conducted on September 13th,
and the last, conducted on November 11th, 32 children were admitted, six of which died shortly
after beginning treatment. Three of the interviews were with the mothers of children who later
died. A total of 23 caretakers were interviewed, out of 32 children who were admitted during the
time period, or about 72%.
Newly admitted patients are recorded in a handwritten record book which commonly had
blanks and missing information. These records were then copied by hand before being typed
into an Excel Spreadsheet. Data may have been lost or altered during transfer from one form to
another; however, precautions were taken to make sure the information was recorded as
accurately as possible. When the admittance date was not recorded, it was assumed to fall
between the two entries it sat in between. If the outcome of a child’s admittance was not

FACTORS AFFECTING MALNUTRITION IN MERU, KENYA 9
recorded, they were assumed to have been discharged as deaths were always reliably recorded.
Some of the children’s ages were recorded as whole numbers, rather than as an improper fraction
with 12 months as the denominator, but some of their ages most likely fell between whole
numbers, thereby skewing some of the graphs slightly. The record book began with June of
2010, and as such, data from previous months, and potentially additional data from that month,
was unavailable.
Additional questions were added to the questionnaire after a few initial interviews were
held. The new questions served to provide a better understanding of some of the responses from
these first interviews. As a result, some of the data is recorded as “unknown”, meaning the
particular question was not asked at the time of the interview.
Results
The results are divided into two sections, the first being an analysis of compiled data
from the admission records and the second being data collected through interviews with the
primary caretakers.
Compilation of Admission Record Data as Context for Interview Data
The admittance records for each child included their date of admission, name, address,
age, sex, their diagnosis, and the outcome of their stay at the hospital, either discharge or death.
All children suffered from PEM, but many had additional illnesses as well. The primary goal of
analyzing these records was to give a more well-rounded representation of cases of
malnourishment in the Meru area, thereby supplementing the interview data.
Meru District Hospital is a Level 5 government hospital, meaning it is one of the more
advanced hospitals, and patients from all over the district are referred here from health centers.
As a result, they treat many of the more severe cases of malnutrition in the area. The next step

FACTORS AFFECTING MALNUTRITION IN MERU, KENYA 10
above district hospitals is provincial hospitals, where patients at district hospitals are referred if
they lack the resources or expertise needed to treat a particular case. Provincial hospitals are the
step between district hospitals and national referral hospitals, of which there are two in the
country. National referral hospitals are the most sophisticated and advanced, providing the best
care the country has to offer (Muga, Kizito, Mbayah, & Gakuruh, 2005, p.15-16).
Between June of 2010 and November of 2011, 282 children were admitted to the PEM
ward of MDH. The number of new admissions spiked considerably in March of 2011,
potentially due to a drought which started in late 2010 and lasted through early 2011. The
drought worsened considerably from February to March 2011. Parts of northern and eastern
Meru were classified as “Alert”, falling between “Normal” and “Alarm”, by the Office for the
Coordination of Humanitarian Affairs (2011).
The following graph shows the number of new admissions per month as well as the
discharges and deaths per month. At the time that data collection was terminated, for the
purposes of compiling the information and formulating this report, a number of children were
still patients in the PEM ward, annotated by the purple line “Still A Patient”.
Jun-1
0Ju
l-10
Aug-10
Sep-1
0
Oct-10
Nov-10
Dec-1
0
Jan-1
1
Feb-1
1
Mar
-11
Apr-11
May
-11
Jun-1
1Ju
l-11
Aug-11
Sep-1
1
Oct-11
Nov-11
0
5
10
15
20
25
30
35
Newly Admitted Patients Month by Month
New AdmissionsDischargesDeathsStill A Patient
Num
ber
of P
atien
ts
FACTORS AFFECTING MALNUTRITION IN MERU, KENYA 11
Death and discharge rates have remained relatively consistent, as evident in the following
graph. However, there is some indication that death rates have been rising slightly in recent
months. October through November of 2011 were left out of the calculations because some
children admitted in those months were still patients at the time that data collection ceased and
their final outcome was unknown.
Jun-1
0
Jul-1
0
Aug-10
Sep-1
0
Oct-10
Nov-10
Dec-1
0
Jan-1
1
Feb-1
1
Mar
-11
Apr-11
May
-11
Jun-1
1
Jul-1
1
Aug-110%
10%
20%
30%
40%
50%
60%
70%
80%
90%
100%
Discharge and Death Rate by Month
Discharge RateDeath Rate
Pe
rce
nta
ge O
ut
of
All
Ch
ildre
n A
dm
itte
d E
ach
M
on
th
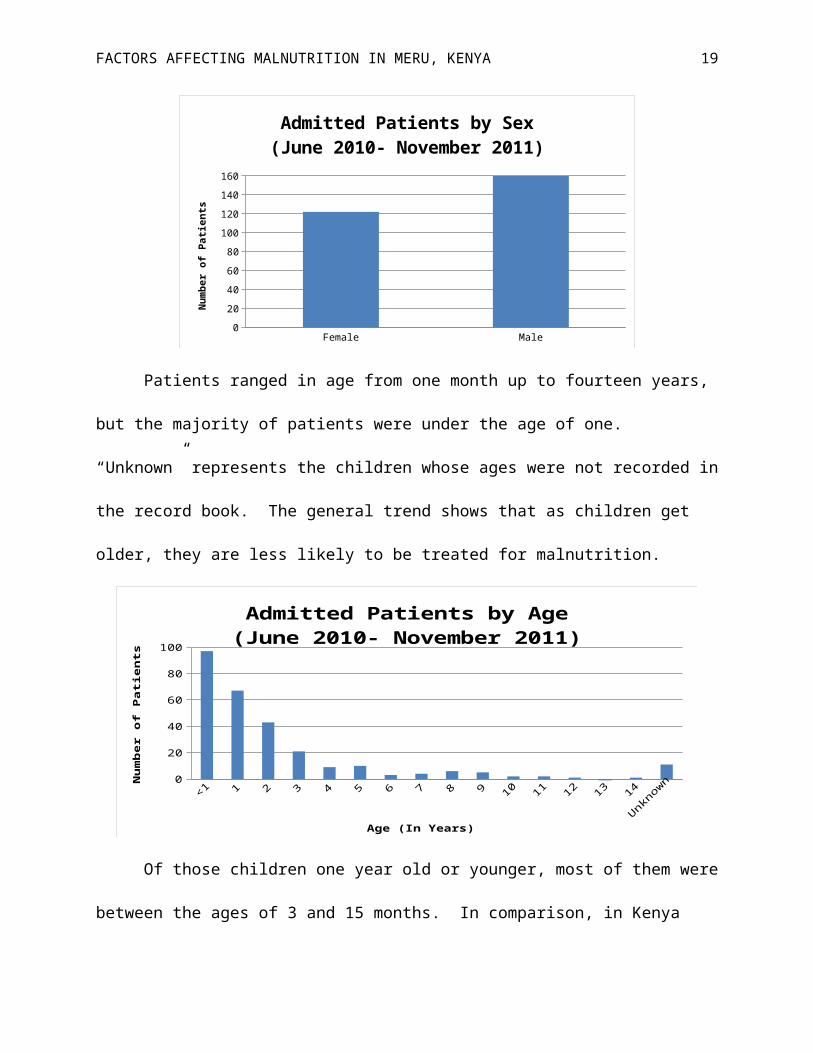
The majority of malnourished patients were found to be males, with 160 males admitted
(56.7%) in comparison to 122 females between June 2010 and November 2011. National
averages in Kenya show that males are more likely to be both severely wasted (2.1%) and wasted
(7.8%) than girls are (1.6% and 5.6% respectively) (KNBS, 2010, p. 143).
Female Male0
20
40
60
80
100
120
140
160
Admitted Patients by Sex(June 2010- November 2011)
Num
ber o
f Pati
ents
FACTORS AFFECTING MALNUTRITION IN MERU, KENYA 12
Patients ranged in age from one month up to fourteen years, but the majority of patients
were under the age of one. “Unknown” represents the children whose ages were not recorded in
the record book. The general trend shows that as children get older, they are less likely to be
treated for malnutrition.
<1 1 2 3 4 5 6 7 8 9 10 11 12 13 14
Unknown0
102030405060708090
100
Admitted Patients by Age(June 2010- November 2011)
Age (In Years)
Nu
mb
er
of
Pati
en
ts
Of those children one year old or younger, most of them were between the ages of 3 and
15 months. In comparison, in Kenya wasting is the highest among children between the ages of
6 and 8 months, at 11.4%, followed by ages 9 to 11 months (10.6%), and then those under six
months (9.7%). It is the lowest among children 36 to 47 months old at 4%. Severe wasting, the
classification of many of the PEM ward’s malnourished children is the highest among children
under the age of six months at 5% (KNBS, 2010, p. 143).
0-2 3-5 6-8 9-11 12-14 15-17 18-20 21-230
5
10
15
20
25
30
35
40
Segment of Admitted Patients by Age(June 2010-November 2011)
Age (In Months)
Nu
mb
er
of
Pati
en
ts
FACTORS AFFECTING MALNUTRITION IN MERU, KENYA 13
According to the United Nations Children’s Fund (UNICEF) and the World Health
Organization (WHO), children should be fed solely breast milk until they reach the age of six
months, at which point supplemental foods should be added to their diet, as they continue to
breastfeed until the age of 24 months. Breast milk is pure, unadulterated and full of the nutrients
a young child needs. Another benefit of exclusive breastfeeding in the first six months of life is
an “immunity to disease” provided by “the mother’s antibodies” (KNBS, 2010, p. 148). Early
substitution of solid foods, before the age of six months, can lead to illnesses and infections from
pathogens. At six months, supplemental solid foods must be given to the child because breast
milk is not enough to sustain them and their ideal growth rate. During a child’s movement from
exclusive breastfeeding, to breast milk with solid or semisolid supplements, to solid foods,
between the ages of 6 and 23 months, malnutrition rates often rise. If the supplemental food is
nutritionally poor, in comparison to breast milk, or exposes the child to pathogens, they are at a
higher risk of being malnourished (KNBS, 2010, p. 148-151).
Dates of discharge or death were recorded for 61 of 282 patients. Data analysis showed
that the majority of deaths occurred within 5-10 days of admittance and the majority of
discharges happened between 10-15 days. This potentially means that most children recover
from malnutrition within two weeks.
1-5 5-10 10-15
15-20
20-25
25-30
30-35
35-40
40-45
45-50
50-55
0
2
4
6
8
10
12
14
Duration of Time in the Hospital(In Days)
Of Patients That DiedOf Patients That Were Discharged
Nu
mb
er
of
Pati
en
ts

FACTORS AFFECTING MALNUTRITION IN MERU, KENYA 14
An unsuccessful attempt was made to analyze the addresses of the children admitted.
The addresses had been handwritten and misspelled, and many of the locations are small, rural
towns which are difficult to find on a map.
Data Collected from Mother/Primary Caretaker Interviews
This section is divided into four parts: first background information of the 21 children
whose mothers were interviewed is discussed, second is an analysis of the 21 mother’s interview
data, third is the two primary caretaker’s compiled interview data, and fourth is a summary and
exploration of the typical diets of all 23 children.
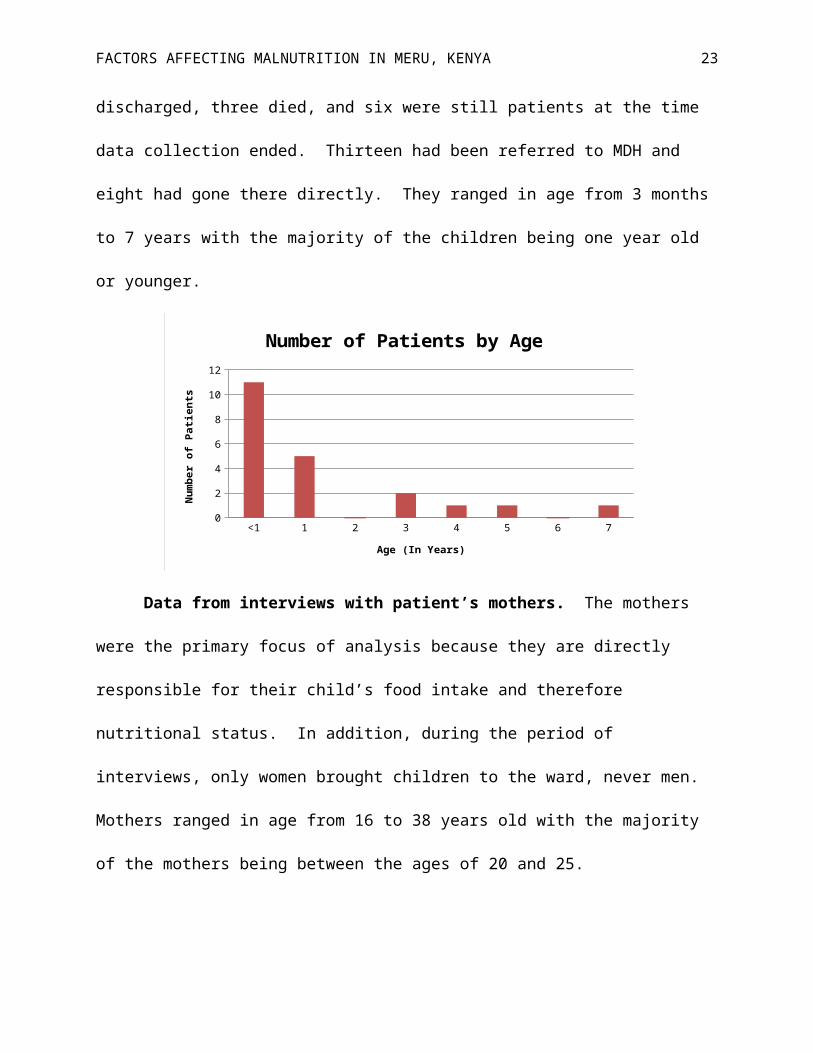
Background information for patients whose caretakers were interviewed. Of the 21
mothers interviewed, 11 of their children were males and 10 were females. Twelve of the
children were discharged, three died, and six were still patients at the time data collection ended.
Thirteen had been referred to MDH and eight had gone there directly. They ranged in age from
3 months to 7 years with the majority of the children being one year old or younger.
<1 1 2 3 4 5 6 70
2
4
6
8
10
12
Number of Patients by Age
Age (In Years)
Num
ber o
f Pati
ents
Data from interviews with patient’s mothers. The mothers were the primary focus of
analysis because they are directly responsible for their child’s food intake and therefore
nutritional status. In addition, during the period of interviews, only women brought children to
FACTORS AFFECTING MALNUTRITION IN MERU, KENYA 15
the ward, never men. Mothers ranged in age from 16 to 38 years old with the majority of the
mothers being between the ages of 20 and 25.
15-20 20-25 25-30 30-35 35-400
1
2
3
4
5
6
7
8
Mother's Age
Years
Num
ber
of M
othe
rs
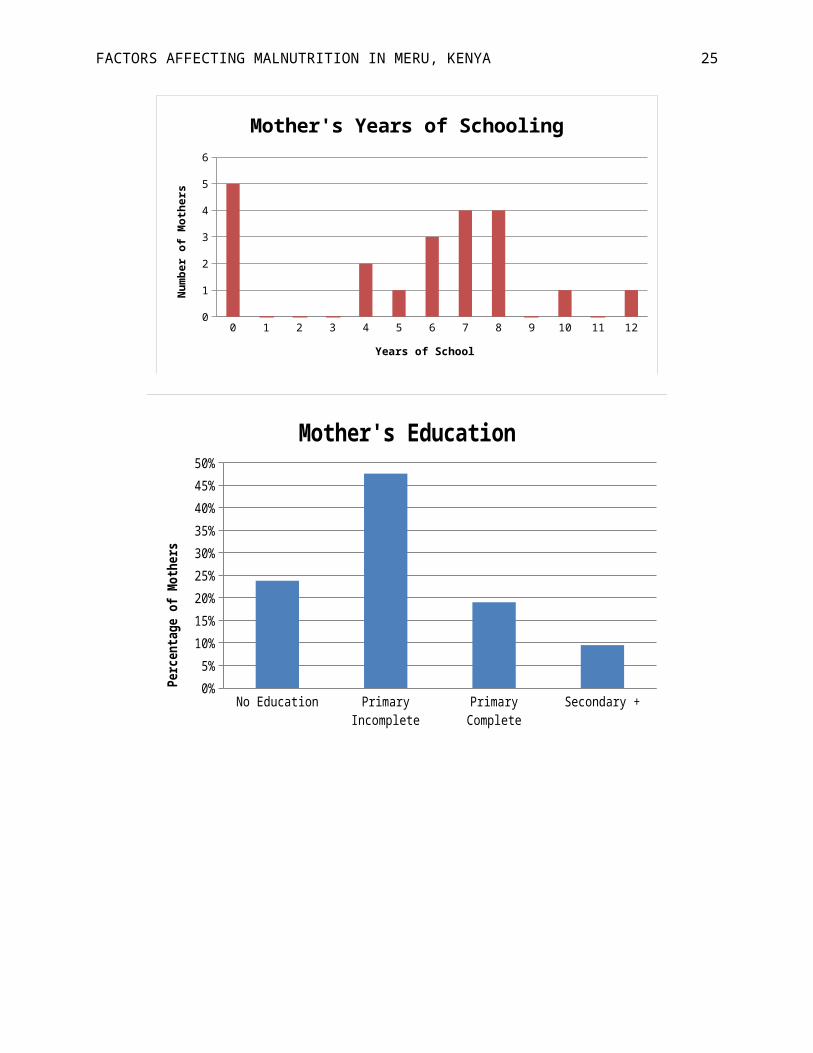
Five of the mothers had never been to school and only two had been as far as secondary
school (high school). Most mothers had between 6 and 8 years of schooling. The most recent
census data in Kenya shows that uneducated mothers are significantly more likely to have
children with wasting (15%) or severe wasting (5%). There is a negative correlation between
mothers’ education rates and children with wasting, in that mothers who have completed more
years of schooling are less likely to have malnourished children (KNBS, 2010, p. 143).
0 1 2 3 4 5 6 7 8 9 10 11 120
1
2
3
4
5
6
Mother's Years of Schooling
Years of School
Num
ber o
f Mot
hers

FACTORS AFFECTING MALNUTRITION IN MERU, KENYA 16
No Education Primary Incomplete Primary Complete Secondary +0%
5%
10%
15%
20%
25%
30%
35%
40%
45%
50%
Mother's EducationPe
rcent
age o
f Mot
hers
In Kenya, according to the Human Development Report 2011, most adults have had an
average of seven years of education and the rate has been steadily rising since the 1980’s.
Note. This graph was adapted from “Mean years of schooling (of adults)” by the Human Development Report 2011,
United Nations Development Programme, November 2, 2011, retrieved from Google public data explorer.
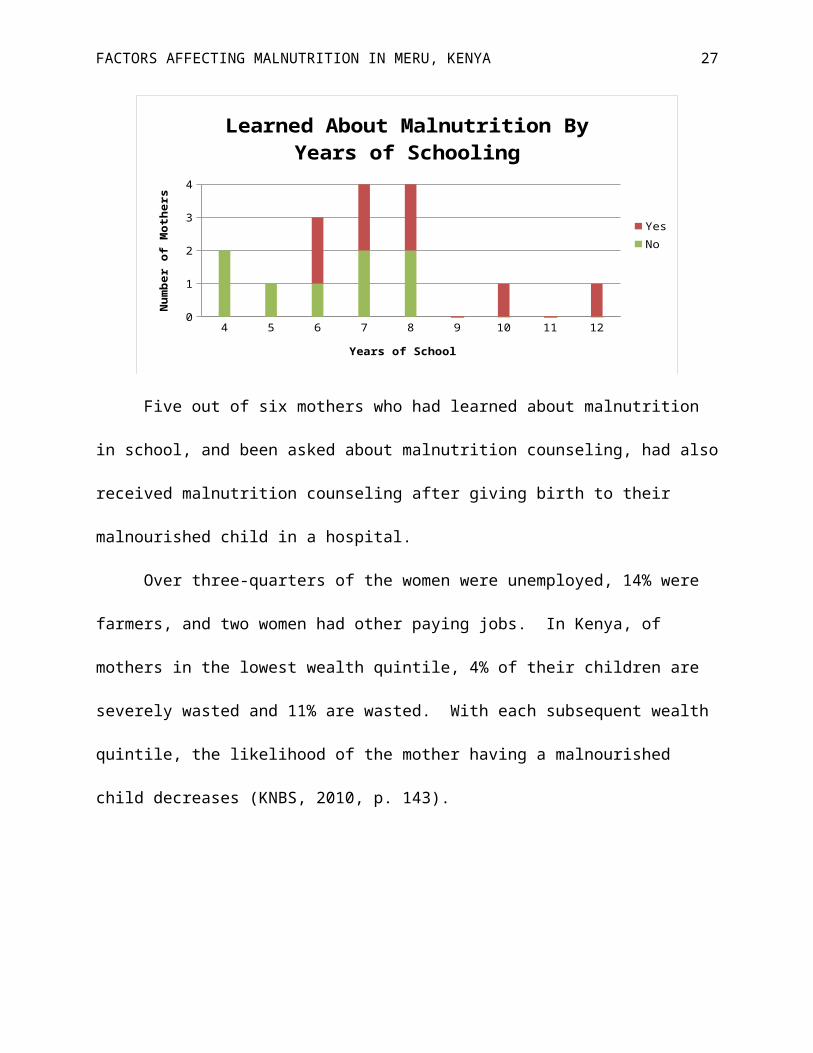
Of the 16 mothers who attended school, half of them had learned about malnutrition in
school and half had not. When a comparison is made between a mother’s years of schooling,

FACTORS AFFECTING MALNUTRITION IN MERU, KENYA 17
and whether or not she learned about malnutrition in school, the general trend illustrates that the
longer someone stays in school, the more likely they are to learn about malnutrition.
4 5 6 7 8 9 10 11 120
1
2
3
4
Learned About Malnutrition By Years of School-ing
YesNo
Years of School
Num
ber
of M
othe
rs
Five out of six mothers who had learned about malnutrition in school, and been asked
about malnutrition counseling, had also received malnutrition counseling after giving birth to
their malnourished child in a hospital.
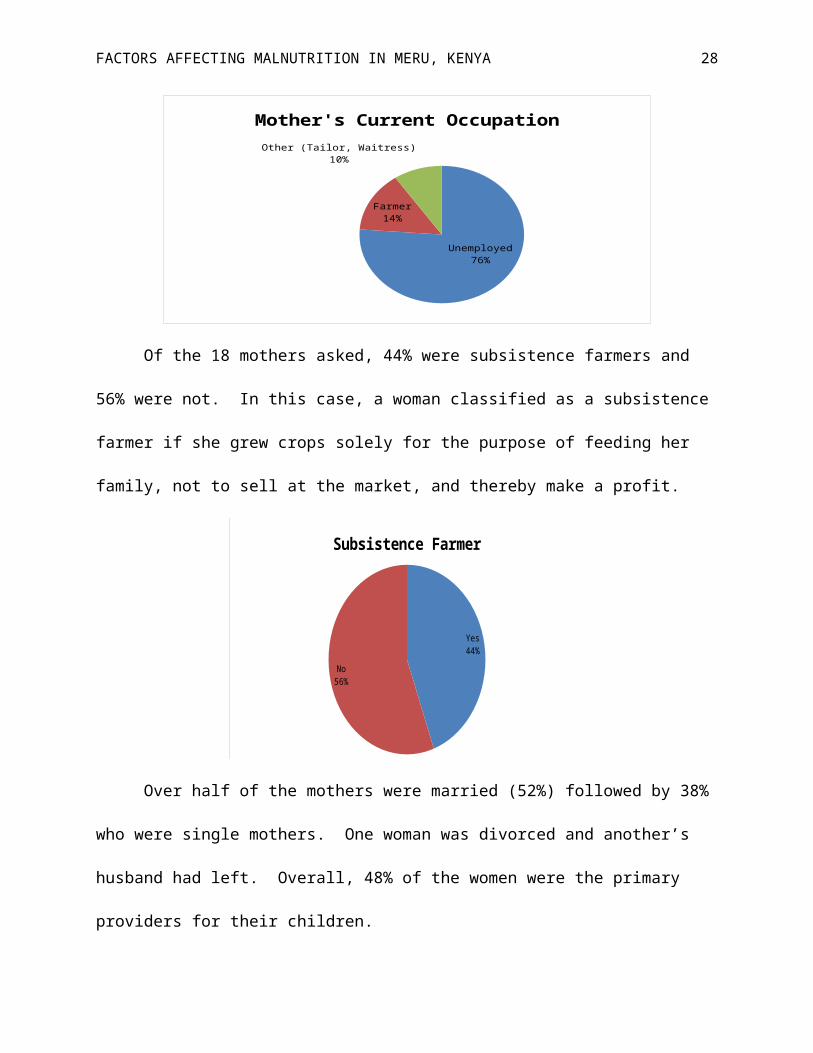
Over three-quarters of the women were unemployed, 14% were farmers, and two women
had other paying jobs. In Kenya, of mothers in the lowest wealth quintile, 4% of their children
are severely wasted and 11% are wasted. With each subsequent wealth quintile, the likelihood of
the mother having a malnourished child decreases (KNBS, 2010, p. 143).
Unemployed76%
Farmer14%
Other (Tailor, Waitress)10%
Mother's Current Occupation

FACTORS AFFECTING MALNUTRITION IN MERU, KENYA 18
Of the 18 mothers asked, 44% were subsistence farmers and 56% were not. In this case,
a woman classified as a subsistence farmer if she grew crops solely for the purpose of feeding
her family, not to sell at the market, and thereby make a profit.
Yes44%
No56%
Subsistence Farmer
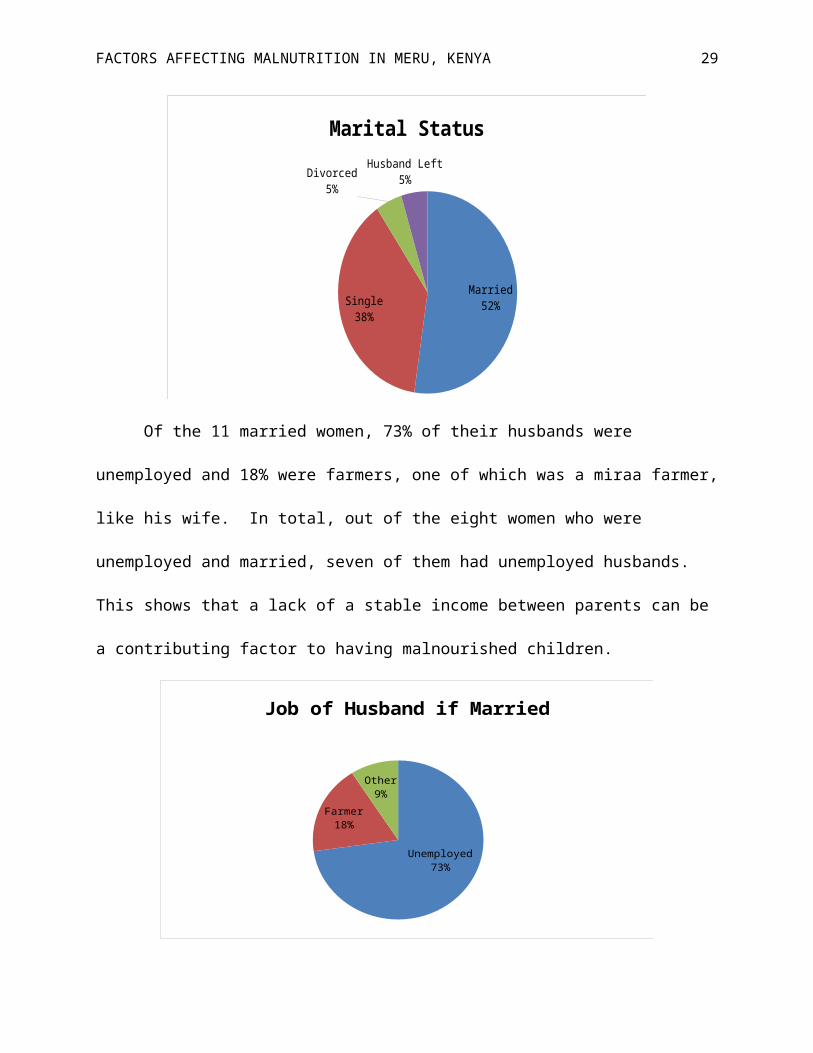
Over half of the mothers were married (52%) followed by 38% who were single mothers.
One woman was divorced and another’s husband had left. Overall, 48% of the women were the
primary providers for their children.
Married52%Single
38%
Divorced5%
Husband Left5%
Marital Status
Of the 11 married women, 73% of their husbands were unemployed and 18% were
farmers, one of which was a miraa farmer, like his wife. In total, out of the eight women who
FACTORS AFFECTING MALNUTRITION IN MERU, KENYA 19
were unemployed and married, seven of them had unemployed husbands. This shows that a lack
of a stable income between parents can be a contributing factor to having malnourished children.
Unemployed73%
Farmer18%
Other9%
Job of Husband if Married
All of the mothers with paying jobs or whose husbands had paying jobs gave birth in
hospitals or health centers. Of the 18 mothers asked, most of the women gave birth to their
malnourished child in a hospital, at 56%, while another 33% gave birth at home. When the
mothers were asked where they gave birth, they were only asked where they had given birth to
the malnourished child, not where they had given birth to their other children. It is possible that
those who had given birth at home had given birth to their other children at hospitals or vice
versa.
Hospital56%
Home33%
Clinic6%
Health Center6%
Birth Location of Malnourished Child

FACTORS AFFECTING MALNUTRITION IN MERU, KENYA 20
In comparison, in Kenya, according to the World Bank World Development Indicators,
approximately 43.8% of all births are attended by skilled health staff and rates have been
decreasing since 1989.
Note. This graph was adapted from “Births attended by skilled health staff (% of total)” by the World Bank, World
Development Indicators, November 1, 2011, retrieved from Google public data explorer.
The majority of the women did not receive nutrition counseling after birth. None
received counseling at home, at the clinic, or at the health center. However, eight of ten women
who gave birth at a hospital received counseling.

FACTORS AFFECTING MALNUTRITION IN MERU, KENYA 21
Hospital Home Clinic Health Center0
2
4
6
8
10
12
Mothers Who Received Nutrition Counseling
Num
ber o
f Mot
hers
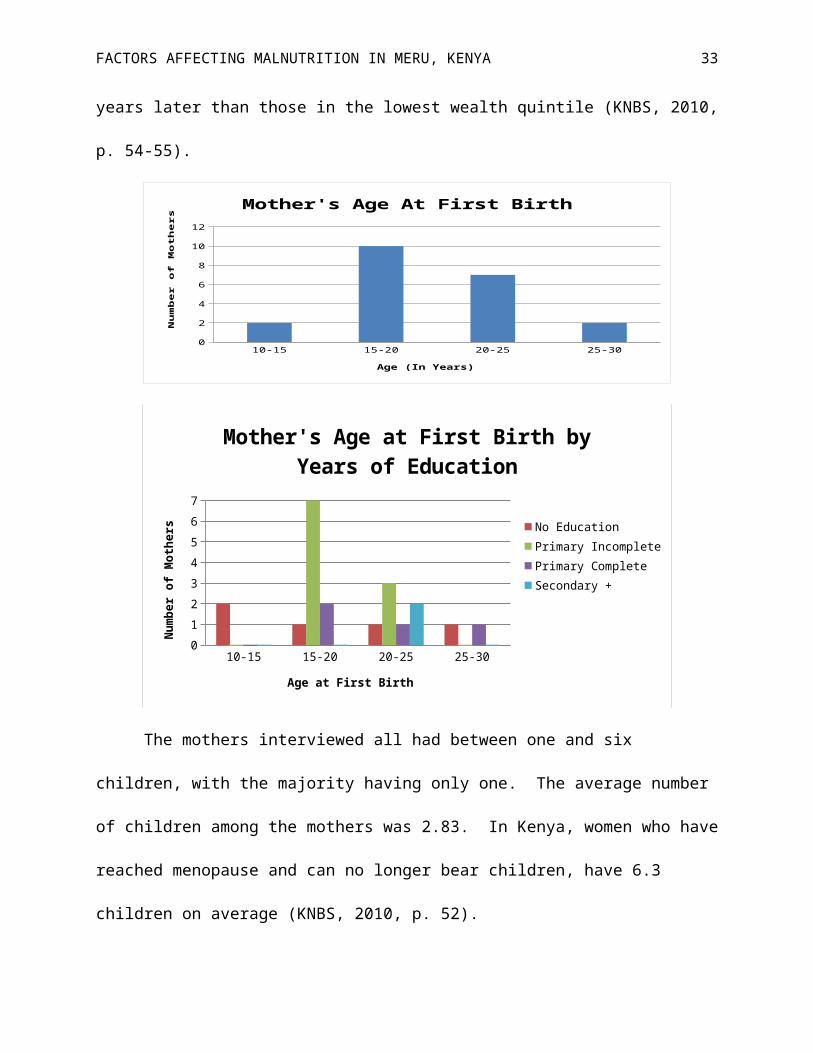
Many of the mothers gave birth for the first time when they were between the ages of 15
and 20. Mothers that spent more years at school were generally more likely to give birth for the
first time at an older age. Of those mothers who gave birth at a young age and attended fewer
years of school, they may have dropped out of school after getting pregnant.
In Kenya, the median age at first birth among mothers is approximately 20 years of age.
Also, women who reached secondary school generally were three years older at their age of first
birth than women with no education. Similarly, mothers in the highest wealth quintile usually
have their first birth three years later than those in the lowest wealth quintile (KNBS, 2010, p.
54-55).
10-15 15-20 20-25 25-300
2
4
6
8
10
12
Mother's Age At First Birth
Age (In Years)
Nu
mb
er
of
Mo
the
rs

FACTORS AFFECTING MALNUTRITION IN MERU, KENYA 22
10-15 15-20 20-25 25-300
1
2
3
4
5
6
7
Mother's Age at First Birth by Years of Edu-cation
No EducationPrimary IncompletePrimary CompleteSecondary +
Age at First Birth
Num
ber o
f Mot
hers
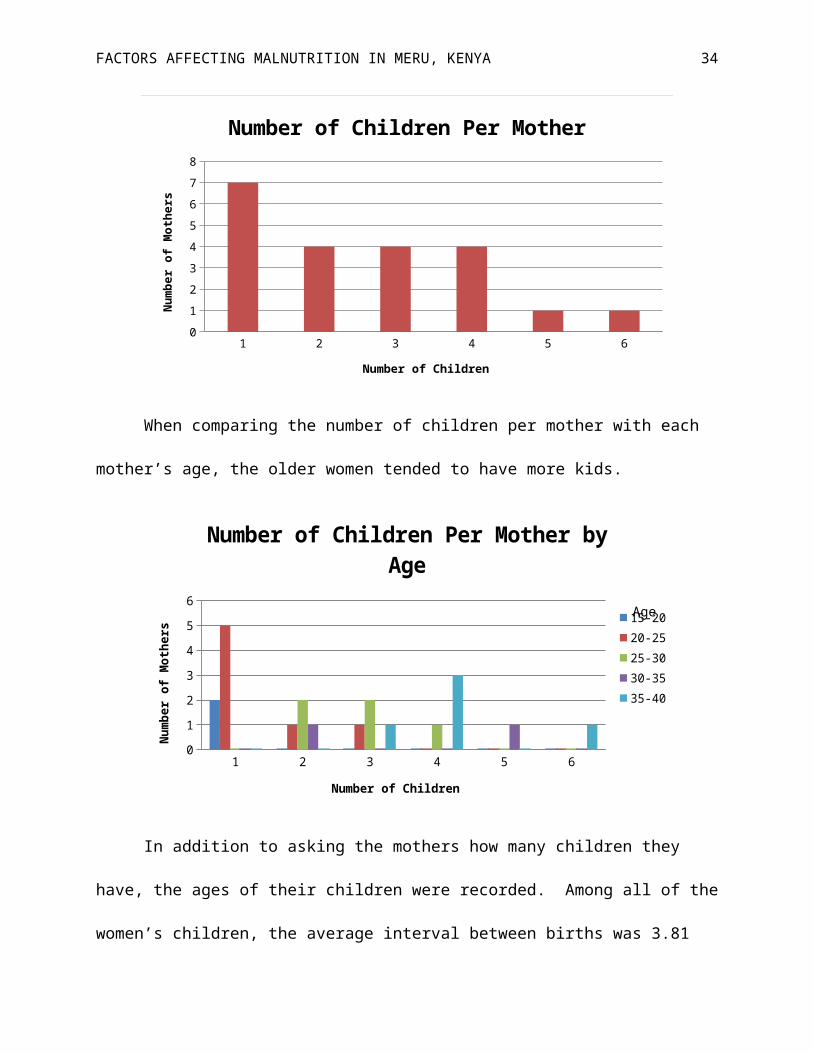
The mothers interviewed all had between one and six children, with the majority having
only one. The average number of children among the mothers was 2.83. In Kenya, women who
have reached menopause and can no longer bear children, have 6.3 children on average (KNBS,
2010, p. 52).
1 2 3 4 5 60
1
2
3
4
5
6
7
8
Number of Children Per Mother
Number of Children
Num
ber o
f Mot
hers
When comparing the number of children per mother with each mother’s age, the older
women tended to have more kids.
FACTORS AFFECTING MALNUTRITION IN MERU, KENYA 23
1 2 3 4 5 60
1
2
3
4
5
6
Number of Children Per Mother by Age
15-2020-2525-3030-3535-40
Number of Children
Num
ber o
f Mot
hers
Age
In addition to asking the mothers how many children they have, the ages of their children
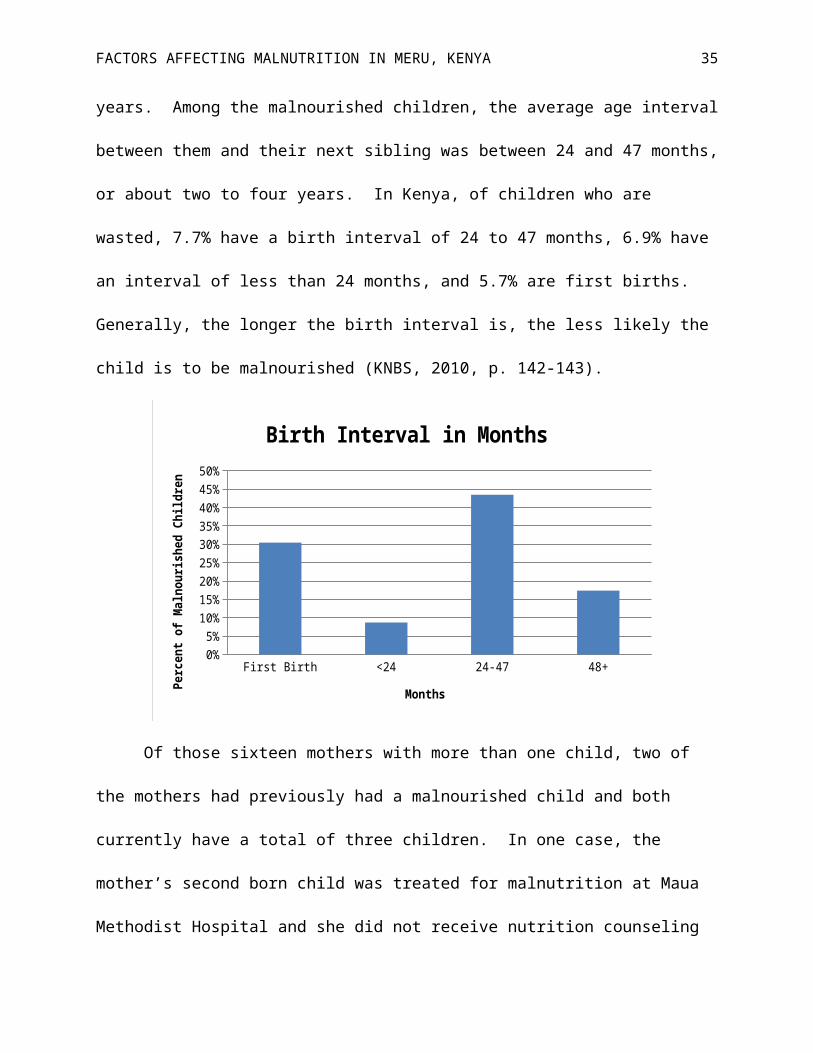
were recorded. Among all of the women’s children, the average interval between births was 3.81
years. Among the malnourished children, the average age interval between them and their next
sibling was between 24 and 47 months, or about two to four years. In Kenya, of children who
are wasted, 7.7% have a birth interval of 24 to 47 months, 6.9% have an interval of less than 24
months, and 5.7% are first births. Generally, the longer the birth interval is, the less likely the
child is to be malnourished (KNBS, 2010, p. 142-143).

FACTORS AFFECTING MALNUTRITION IN MERU, KENYA 24
First Birth <24 24-47 48+0%
5%
10%
15%
20%
25%
30%
35%
40%
45%
50%
Birth Interval in Months
Months
Perc
ent o
f Maln
ouris
hed
Child
ren
Of those sixteen mothers with more than one child, two of the mothers had previously
had a malnourished child and both currently have a total of three children. In one case, the
mother’s second born child was treated for malnutrition at Maua Methodist Hospital and she did
not receive nutrition counseling when the child was discharged. In the second case, the mother
had two malnourished children at the same time, a four-year-old and a nine-month-old. The
nine-month-old girl had a more severe case, so she chose to bring her to the hospital, leaving the
older child at home.
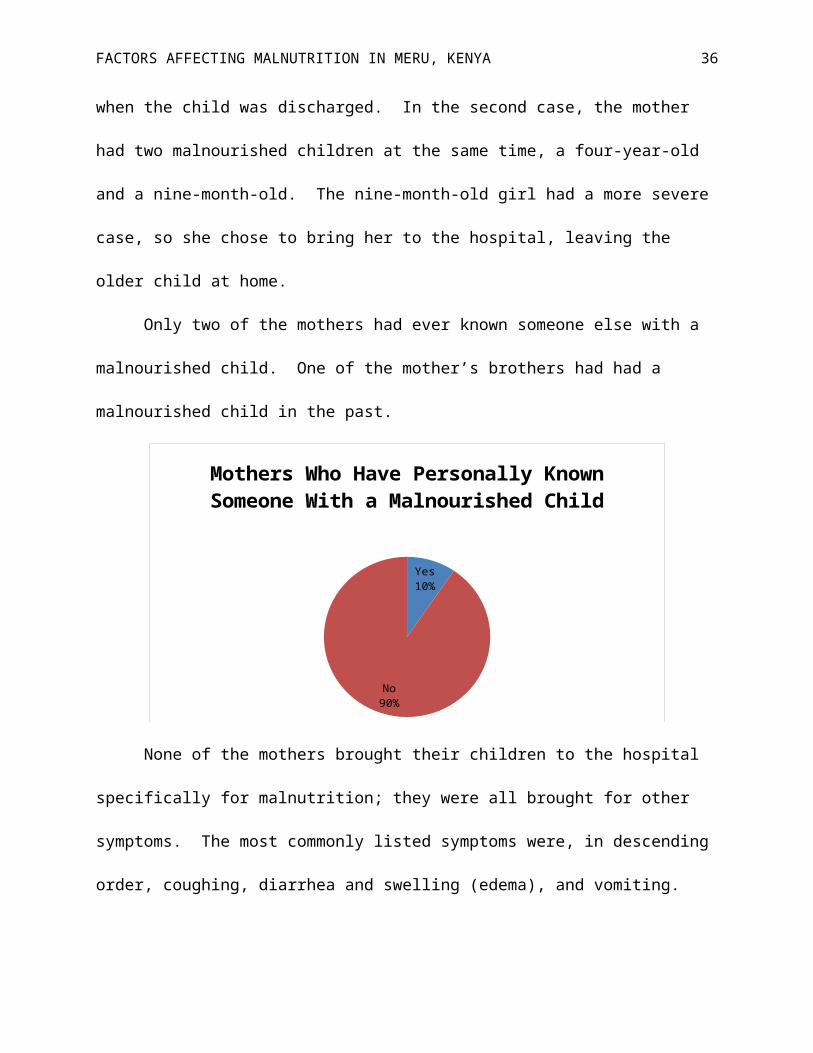
Only two of the mothers had ever known someone else with a malnourished child. One
of the mother’s brothers had had a malnourished child in the past.
FACTORS AFFECTING MALNUTRITION IN MERU, KENYA 25
Yes10%
No90%
Mothers Who Have Personally Known Someone With a Malnourished Child
None of the mothers brought their children to the hospital specifically for malnutrition;
they were all brought for other symptoms. The most commonly listed symptoms were, in
descending order, coughing, diarrhea and swelling (edema), and vomiting.
Coughing Diarrhea Swelling (Edema) Vomiting0
2
4
6
8
10
12
Most Commonly Listed Symptoms
Symptoms
Num
ber
of M
othe
rs W
ho L
iste
d Ea
ch S
ympt
om
Primary caretaker interview data. One of the primary caretakers interviewed was the
50 year old grandmother of a malnourished child. The grandmother had been caring for the child
for over a year and a half, since she was four months old. At this time, the child’s father, the
grandmother’s son, and the child’s mother left. The child’s mother has never been to school, is
unemployed, and also has a four-year-old daughter who is cared for by the grandmother. At the

FACTORS AFFECTING MALNUTRITION IN MERU, KENYA 26
time of the interview, the four-year-old had been at home living on her own for over a month.
The grandmother had never been to school, was unemployed, and widowed, making her the
single parent of the two children. She has raised eight children of her own and none have ever
been treated for malnutrition. She has also never known anyone with a malnourished child. She
brought the child first to Charia Hospital, for coughing, before being referred to MDH.
The second primary caretaker interviewed was the child’s 35 year old aunt, and mother’s
sister, who had been taking care of him and three siblings, ages 19, 18, and 4, for over a year.
The child’s mother is 39 years old, attended school up to Class 8, and gave birth at home. The
caretaker had also been to school up to Class 8 and had learned about malnutrition in school.
She is unemployed and single, but grows maize and beans to feed the children. She also has
three children of her own, and as such, is currently caring for 7 children. She gave birth for the
first time when she was 15 and none of her children have ever been treated for malnutrition. She
has also never personally known someone with a malnourished child. She first brought the child
to a clinic in Maua, for swelling, before being referred to MDH.
Typical diet of malnourished patients. Mothers and primary caretakers were asked to
describe a “typical meal” for the malnourished child. Each woman listed off a number of
different foods. The children were broken into four age groups of <6 months (3 children), 6
months-1 year (8 children), 1 year (5 children) and 2 years or older (7 children). For each food
listed, the percentage of children who eat that food, in each age group, was determined. Because
mothers were asked to describe a typical meal, and did not go in depth about their child’s diet, it
is possible that their children ate other foods in addition to the ones listed. However, this gives a
general idea of food consumed by the malnourished children on a daily basis.
FACTORS AFFECTING MALNUTRITION IN MERU, KENYA 27
Breastfeed
ingFormula
Cow Milk Uji
Mixed Porrid
ge
Traditional D
ishesMaizeBeansGitheri
Bananas Ugali
Mashed Potato
esGreens
Lentils
CowpeasMillet
Green Gram
s Rice Meat0%
10%20%30%40%50%60%70%80%90%
100%
Typical Diet By Age Group
<6 Months6 Mos-1 year1 Year2+ Years
Perce
ntag
e of C
hildr
en in
Age
Gro
up
Note. Githeri is a mixture of dried beans and maize, uji is porridge, and ugali is maize flour cooked with water to
form a thick consistency.
All of the children under the age of six months were breastfeeding as well as 75% of
children from the age of six months up to, but not including, one year. Exclusive breastfeeding
until the age of 6 months is encouraged by the Republic of Kenya Ministry of Health Division of
Nutrition and NASCOP’s educational pamphlet “How to Feed a Baby After 6 Months” (2007),
as well as by UNICEF and the World Health Organization (WHO) (KNBS, 2010, p. 148). Of
the three children aged six months and younger, whose mothers were interviewed, one consumed
solely breast milk, one consumed breast milk and formula, and one consumed breast milk, cow
milk and uji. After six months, mothers are advised to supplement breast milk with other
mashed foods as breast milk is no longer sufficient. Breast milk should continue to be fed to a
FACTORS AFFECTING MALNUTRITION IN MERU, KENYA 28
baby until they reach the age of two, but can instead be replaced with two cups of milk daily
(Republic of Kenya Ministry of Health Division, 2007).
Data from the most recent census in Kenya showed that girls are commonly breastfed for
a longer duration than boys and for a longer duration in rural areas (21 months) than in urban
areas (19 months). The Eastern Province exhibits the longest breastfeeding duration of 26
months while the shortest is in Nairobi Province at 15 months. Also, if a woman has no
education, she will commonly breastfeed longer, for 21 months, than someone who has attended
at least some of secondary school (19 months) (KNBS, 2010, p. 151).
Mashed bananas and potatoes were common foods among children older than 6 months.
Markedly absent in the children’s diets is protein. None of the children over the age of one
consumed any milk products and only one of the mothers mentioned feeding meat to her child;
none listed eggs, fish, or poultry. The most prevalent form of protein was beans which were
consumed by 25% of children over the age of 6 months. As all of the malnourished children
suffer from protein energy malnutrition, it is not surprising that their daily protein intake is fairly
low.
When mothers were asked what their own primary diet consists of, they listed many of
the same foods, indicating that if their children are malnourished, they may be undernourished as
well. According to the Kenya National Bureau of Statistics (2010) “a woman who has poor
nutritional status as indicated by a low body mass index, short stature, anaemia, or other
micronutrient deficiencies has a greater risk of…producing lower quality breast milk” (p. 141).
In which case, although young babies are breastfeeding, as recommended, they may be
consuming milk of poor quality, thereby affecting their nutritional status.
FACTORS AFFECTING MALNUTRITION IN MERU, KENYA 29
The majority of the women purchased food for their families from the local market, while
35% supplemented this food with crops they grew on their farm. One of the mothers, the
youngest interviewed at 16, fed her child with food provided by her parents, most likely
purchased from the local market.
Local Market61%
Local Market & Farm35%
Parents4%
Food Sources
Discussion
The trends found among the interview data can be compiled to create a hypothetical
profile of a mother who may be at risk of having a malnourished child, as well as a profile for the
child itself. Here are the most common attributes among the women interviewed and their
children:
1. Mother
a. Age: 20-25 years
b. Schooling: Primary incomplete
c. Occupation: Unemployed
d. Marital Status: Married with an unemployed husband
e. Birth Location: Hospital

FACTORS AFFECTING MALNUTRITION IN MERU, KENYA 30
f. Age at First Birth: 15-20 years
g. Birth Interval: 24-47 months
h. Personally Knew/Knows Someone With a Malnourished Child: No
2. Child
a. Sex: Male
b. Age: 3-15 months
It was observed that many of the mothers remained at the hospital after their child was
discharged because they could not afford to pay their hospital bills of 200/= per day. As the
average length of stay for a patient before being discharged is about 10 to 15 days, the average
hospital bill was most likely between 2,000 and 3,000/= (about $23-35). The women would wait
at the hospital, meanwhile exposing their child to other illnesses and opportunistic infections in
the ward, until they received government waivers for their expenses. This suggests that poverty
is also a common denominator among the mothers.
Conclusion & Recommendations
The research hypothesis predicted positive correlations between low levels of education
and wealth and high levels of malnutrition as well as a prevalence of miraa farming among the
parents of malnourished children. The two correlations were supported by the collection of
interview data, but miraa farming was not found to be a common factor. Mothers typically had
no years of schooling, or had not completed primary school. In addition, of those mothers who
had attended school, half had learned about malnutrition and half had not. Many of the women
did not understand why their child was in the hospital, thinking that they were sick, but not
knowing they were malnourished, or even what it meant to be malnourished. Without
knowledge of proper nutrition, the women were unable to effectively feed their children in a

FACTORS AFFECTING MALNUTRITION IN MERU, KENYA 31
healthy manner. Although some of the mothers had received nutrition counseling after giving
birth in a hospital, their child had still become malnourished. It is possible that the counseling
was inadequate or confusing, stressing the importance of comprehensive nutrition education,
especially for new mothers.
The interview questions did not ask specifically about the mother’s income, in an effort
not to pry and make them uncomfortable, but it was found that the majority of mothers were
unemployed, lending to the belief that they may have been impoverished. This meant that the
mothers most likely had difficulty in providing food for their families. In addition, they had
chosen to take their child to a less-expensive public, government hospital and many of the
mothers remained in the hospital with their discharged children because they could not pay the
hospital fees.
Miraa farming was not found to be common among the parents of malnourished children,
as only one of the child’s parents were miraa farmers. This is not to say that miraa farming is not
prevalent in the areas where these children live. Meru and neighboring Maua are known to be
top producers of miraa in Kenya. Until the children’s addresses can be better analyzed in context
with areas of miraa growth in the area, no conclusions can be drawn.
As a result of the mother and child profiles developed and explained in “Hypothetical
Profiles” and the leading causes of malnutrition being linked to a lack of education, especially
nutritional education, as well as unemployment, and concurrently poverty, MKMF’s preventative
programs will focus on educational campaigns and outreach to impoverished mothers who may
be at risk of having malnourished children. A follow up research paper is currently being
developed as a senior thesis project by Kidera. It is meant to expand upon the above research by
analyzing case studies and best practices for malnutrition prevention programs and offering

FACTORS AFFECTING MALNUTRITION IN MERU, KENYA 32
recommendations for how best to proceed with their development and implementation by
MKMF.
FACTORS AFFECTING MALNUTRITION IN MERU, KENYA 33
References
Human Development Report 2011, United Nations Development Programme. (2011, November
2). Mean years of schooling (of adults) [Graph]. Retrieved from Google public data
explorer.
Kenya National Bureau of Statistics. (2010, June). Kenya Demographic and Health Survey 2008-
09. Retrieved from http://www.measuredhs.com/pubs/pdf/FR229/FR229.pdf
Kidd, P.S., & Wagner, K.D. (2001). High Acuity Nursing. New Jersey: Prentice Hall.
Kozier, B., Erb, G., Berman, A.J., & Burke, K. (2000). Fundamentals of Nursing Concepts,
Process, and Practice. New Jersey: Prentice Hall Health.
Ministry of Medical Services and Ministry of Public Health and Sanitation. (n.d.). Management
of Acute Malnutrition [Flipbook].
Ministry of Medical Services and Ministry of Public Health and Sanitation. (2009). National
Guideline for Integrated Management of Acute Malnutrition [Guidebook].
Muga, R., Kizito, P., Mbayah, M., and Gakuruh, T. (2005). Overview of the Health System in
Kenya. Retrieved from: http://www.measuredhs.com/pubs/pdf/SPA8/02Chapter2.pdf
Office for the Coordination of Humanitarian Affairs (OCHA). (2011). Drought Stages
Progression in Kenya. Retrieved from
http://reliefweb.int/sites/reliefweb.int/files/resources/map_156.pdf
Republic of Kenya Ministry of Health Division of Nutrition and NASCOP. (2007). How to Feed
a Baby After 6 Months [Brochure].
World Bank, World Development Indicators. (2011, November 1). Births attended by skilled
health staff (% of total) [Graph]. Retrieved from Google public data explorer.
FACTORS AFFECTING MALNUTRITION IN MERU, KENYA 34
Wrong, Michela. (2005, August 22). Green Gold [Supplemental material]. Slate. Retrieved from
http://www.slate.com/articles/news_and_politics/dispatches/2005/08/
green_gold.single.html
FACTORS AFFECTING MALNUTRITION IN MERU, KENYA 35
Appendix A
Map of Kenya
CIA World Factbook. (2012). Kenya. Retrieved from https://www.cia.gov/library/publications/the-
world-factbook/geos/ke.html
FACTORS AFFECTING MALNUTRITION IN MERU, KENYA 36
Map of Meru
Soft Kenya. (2012). Kenya Counties Map. Retrieved from http://softkenya.com/county/kenya-
counties-map/

FACTORS AFFECTING MALNUTRITION IN MERU, KENYA 37
Appendix B
Questionnaire
1. Mother
a. Age
b. Years of education
i. If attended school, Did you learn about malnutrition in school?
c. Hometown
d. Occupation
e. Marital Status
i. If married, What is your husband’s occupation?
2. Family
a. Where did you give birth? (to the malnourished child)
i. If at a hospital, Did you receive nutrition counseling?
b. Children
i. Number
ii. Ages
iii. If other children aren’t at the hospital, Is there someone taking care of
your children at home?
iv. Have any of your other children been treated for malnutrition?
v. Have you ever personally known someone with a malnourished child?
vi. When/why did you know to take your child to the hospital?
1. If taken for other symptoms, What symptoms?
vii. Did you first go to a different hospital? (Were they referred?)

FACTORS AFFECTING MALNUTRITION IN MERU, KENYA 38
c. Home Diet
i. What does a typical meal for your child consist of?
ii. Do you eat the same food as your child?
iii. Where do you get food from? (Market, farm, etc.)
iv. If child is old enough to attend school, Is there a feeding program at your
child’s school?
1. Do you use it?
2. How much does it cost?