msdavidblog.files.wordpress.com€¦ · web viewlecture notes. week one ... statements and...
TRANSCRIPT

SOC 2105 – ELEMENTS OF SURVEY SAMPLING AND SOCIAL STATISTICS
LECTURE NOTESWEEK ONE – September 3RD, 2015
The word statistics has two meanings. In the more common usage, statistics refers to numerical facts. The numbers that represent the income of a family, the age of a student, the percentage of passes completed by the quarterback of a football team, and the starting salary of a typical college graduate are examples of statistics in this sense of the word.
A 1988 article in U.S. News & World Report declared “Statistics are an American obsession.”1 During the 1988 baseball World Series between the Los Angeles Dodgers and the Oakland A’s, the then NBC commentator Joe Garagiola reported to the viewers, numerical facts about the players’ performances.In response, fellow commentator Vin Scully said, “I love it when you talk statistics.”In these examples, the word statistics refers to numbers.
What does the word statistics bring to mind? To most people, it suggests numerical facts or data, such as unemployment figures, farm prices, or the number of marriages and divorces.
Two common definitions of the word statistics are as follows:1. [used with a plural verb] facts or data, either numerical or non-numerical, organized and summarized so as to provide useful and accessible information about a particular subject.2. [used with a singular verb] the science of organizing and summarizing numerical or non-numerical information.
Statisticians also analyze data for the purpose of making generalizations and decisions. For example, a political analyst can use data from a portion of the voting population to predict the political preferences of the entire voting population, or a city council can decide where to build a new airport runway based on environmental impact statements and demographic reports that include a variety of statistical data.
Every day we make decisions that may be personal, business related, or of some other kind.Usually these decisions are made under conditions of uncertainty. Many times, the situations or problems we face in the real world have no precise or definite solution. Statistical methods help us make scientific and intelligent decisions in such situations. Decisions made by using statistical methods are called educated guesses. Decisions made without using statistical (or scientific) methods are pure guesses and, hence, may prove to be unreliable. For example, opening a large store in an area with or without assessing the need for it may affect its success.Like almost all fields of study, statistics has two aspects: theoretical and applied. Theoretical or mathematical statistics deals with the development, derivation, and proof of statistical theorems, formulas, rules, and laws. Applied statistics involves the applications of those theorems, formulas, rules, and laws to solve real-world problems.

Students study statistics for several reasons: 1. Like professional people, you must be able to read and understand the various statistical studies performed in your fields. To have this understanding, you must be knowledgeable about the vocabulary, symbols, concepts, and statistical procedures used in these studies. 2. You may be called on to conduct research in your field, since statistical procedures are basic to research. To accomplish this, you must be able to design experiments; collect, organize, analyze, and summarize data; and possibly make reliable predictions or forecasts for future use. You must also be able to communicate the results of the study in your own words. 3. You can also use the knowledge gained from studying statistics to become better consumers and citizens. For example, you can make intelligent decisions about what products to purchase based on consumer studies, about government spending based on utilization studies, and so on.
The following examples present some statistics:1. During the 43rd Super Bowl on February 1, 2009, NBC charged $3 million for a 30-second commercial.6. According to the Centers for Disease Control and Prevention, flu costs the United States about $87 billion a year in terms of direct medical costs, loss of life, and reduced quality of life.• Eating 10 grams of fiber a day reduces the risk of heart attack by 14%. (Source: Archives of Internal Medicine, Reader’s Digest.) • The median age of people who watch the Tonight Show with Jay Leno is 48.1. (Source: Nielsen Media Research.)
Descriptive StatisticsSuppose we have information on the test scores of students enrolled in a statistics class. In statistical terminology, the whole set of numbers that represents the scores of students is called a data set, the name of each student is called an element, and the score of each student is called an observation. A data set in its original form is usually very large. Consequently, such a data set is not very helpful in drawing conclusions or making decisions. It is easier to draw conclusions from summary tables and diagrams than from the original version of a data set. So, we reduce data to a manageable size by constructing tables, drawing graphs, or calculating summary measures such as averages. The portion of statistics that helps us do this type of statistical analysis is called descriptive statistics.
In descriptive statistics, the statistician tries to describe a situation. Consider the national census conducted by the Bureau of Statistics every 10 years or so. Results of this census give you the average age, income, and other characteristics of the population. To obtain this information, the Bureau must have some means to collect relevant data. Once data are collected, the bureau must organize and summarize them. Finally, the bureau needs a means of presenting the data in some meaningful form, such as charts, graphs, or tables.

Inferential StatisticsIn statistics, the collection of all elements of interest is called a population. The selection of a few elements from this population is called a sample.
A major portion of statistics deals with making decisions, inferences, predictions, and forecasts about populations based on results obtained from samples. For example, we may make some decisions about the political views of all college and university students based on the political views of 1000 students selected from a few colleges and universities. As another example, we may want to find the starting salary of a typical college graduate. To do so, we may select 2000 recent college graduates, find their starting salaries, and make a decision based on this information. The area of statistics that deals with such decision-making procedures is referred to as inferential statistics. This branch of statistics is also called inductive reasoning or inductive statistics.
Here, the statistician tries to make inferences from samples to populations. Inferential statistics uses probability, i.e., the chance of an event occurring. You may be familiar with the concepts of probability through various forms of gambling. If you play cards, dice, bingo, or lotteries, you win or lose according to the laws of probability. Probability theory is also used in the insurance industry and other areas. It is important to distinguish between a sample and a population.
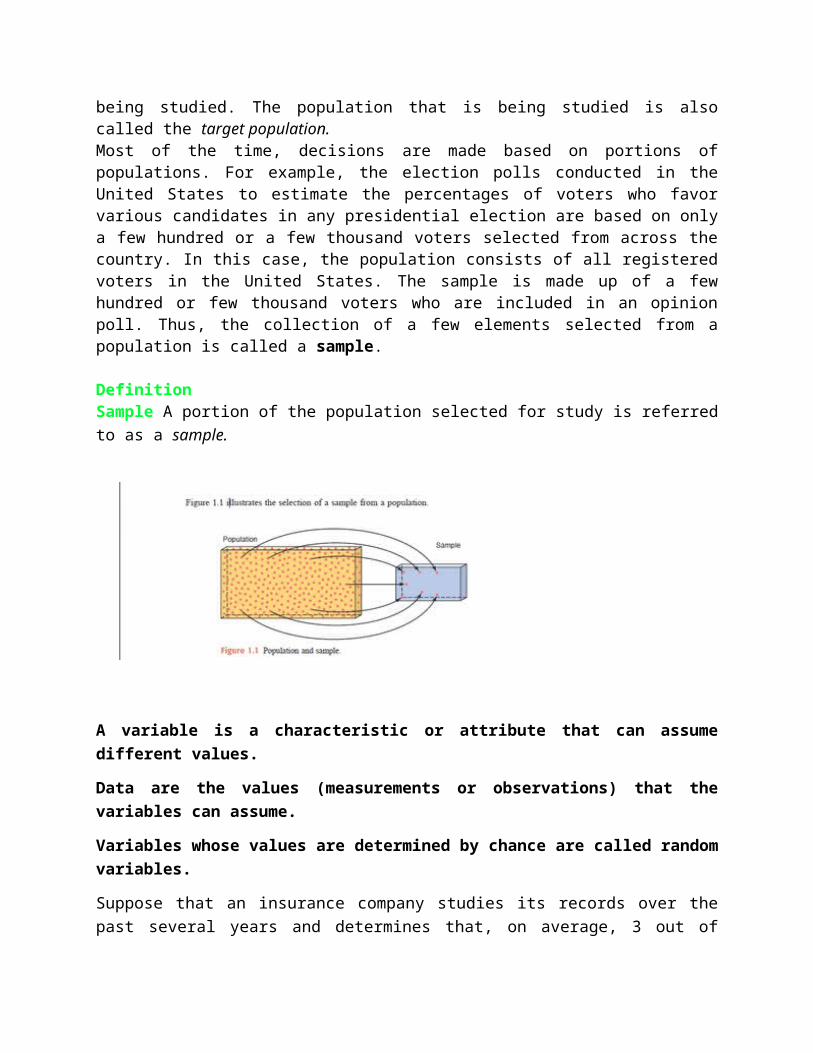
DefinitionPopulation or Target Population A population consists of all elements—individuals, items, or objects—whose characteristics are being studied. The population that is being studied is also called the target population.Most of the time, decisions are made based on portions of populations. For example, the election polls conducted in the United States to estimate the percentages of voters who favor various candidates in any presidential election are based on only a few hundred or a few thousand voters selected from across the country. In this case, the population consists of all registered voters in the United States. The sample is made up of a few hundred or few thousand voters who are included in an opinion poll. Thus, the collection of a few elements selected from a population is called a sample.
DefinitionSample A portion of the population selected for study is referred to as a sample.
A variable is a characteristic or attribute that can assume different values.
Data are the values (measurements or observations) that the variables can assume.
Variables whose values are determined by chance are called random variables.
Suppose that an insurance company studies its records over the past several years and determines that, on average, 3 out of every 100 automobiles the company insured were involved in accidents during a 1-year period. Although there is no way to predict the specific automobiles that will be involved in an accident (random occurrence), the company can adjust its rates accordingly, since the company knows the general pattern over the long run. (That is, on average, 3% of the insured automobiles will be involved in an accident each year.)
A collection of data values forms a data set.
Each value in the data set is called a data value or a datum.
Other examples of variables are the incomes of households, the number of houses built in a city per month during the past year, the makes of cars owned by people, the gross profits of companies, and the number of insurance policies sold by a salesperson per day during the past month.In general, a variable assumes different values for different elements,
Attendance and Grades
Read the following on attendance and grades, and answer the questions.
A study conducted at Manatee Community College revealed that students who attended class 95 to 100% of the time usually received an A in the class. Students who attended class 80 to 90% of the time usually received a B or C in the class. Students who attended class less than 80% of the time usually received a D or an F or eventually withdrew from the class. Based on this information, attendance and grades are related. The more you attend class, the more likely it is you will receive a higher grade. If you improve your attendance, your grades will probably improve. Many factors affect your grade in a course. One factor that you have considerable control over is attendance. You can increase your opportunities for learning by attending class more often.
1. What are the variables under study? 2. What are the data in the study? 3. Are descriptive, inferential, or both types of statistics used? 4. What is the population under study?
5. Was a sample collected? If so, from where?
6. From the information given, comment on the relationship between the variables .
Variables and Types of Data
Discrete VariablesThe values that a certain quantitative variable can assume may be countable or non-countable.For example, we can count the number of cars owned by a family, but we cannot count the height of a family member. A variable that assumes countable values is called a discrete variable. Note that there are no possible intermediate values between consecutive values of a discrete variable.
For example, the number of cars sold on any day at a car dealership is a discrete variable because the number of cars sold must be 0, 1, 2, 3, and we can count it. The number of cars sold cannot be between 0 and 1, or between 1 and 2. Other examples of discrete variables are the number of people visiting a bank on any day, the number of cars in a parking lot, the number of cattle owned by a farmer, and the number of students in a class.
Continuous VariablesSome variables cannot be counted, and they can assume any numerical value between two numbers.Such variables are called continuous variables.
The time taken to complete an examination is an example of a continuous variable because it can assume any value, let us say, between 30 and 60 minutes. The time taken may be 42.6 minutes, 42.67 minutes, or 42.674 minutes. (Theoretically, we can measure time as precisely as we want.) Similarly, the height of a person can be measured to the tenth of an inch or to the hundredth of an inch. However, neither time nor height can be counted in a discrete fashion.Other examples of continuous variables are weights of people, amount of soda in a 12-ounce can (note that a can does not contain exactly 12 ounces of soda), and yield of potatoes (in pounds) per acre. Note that any variable that involves money is considered a continuous variable.
As stated earlier, statisticians gain information about a particular situation by collecting data for random variables. Here, we will explore in greater detail the nature of variables and types of data. Variables can be classified as qualitative or quantitative.
Qualitative variables are variables that can be placed into distinct categories, according to some characteristic or attribute. For example, if subjects are classified according to gender (male or female), then the variable gender is qualitative. Other examples of qualitative variables are religious preference and geographic locations.
Quantitative variables are numerical and can be ordered or ranked. For example, the variable age is numerical, and people can be ranked in order according to the value of their ages. Other examples of quantitative variables are heights, weights, and body temperatures.
Quantitative variables can be further classified into two groups: discrete and continuous. Discrete variables can be assigned values such as 0, 1, 2, 3 and are said to be countable. Examples of discrete variables are the number of children in a family, the number of students in a classroom, and the number of calls received by a switchboard operator each day for a month. Discrete variables assume values that can be counted. Continuous variables, by comparison, can assume an infinite number of values in an interval between any two specific values. Temperature, for example, is a continuous variable, since the variable can assume an infinite number of values between any two given temperatures. Continuous variables can assume an infinite number of values between any two specific values. They are obtained by measuring. They often include fractions and decimals.
EXERCISES
_ CONCEPTS AND PROCEDURES1.1 Explain the meaning of the following terms.a. Quantitative variableb. Qualitative variablec. Discrete variabled. Continuous variablee. Quantitative dataf. Qualitative data
1.2 What are the two major types of statistics? Describe them in detail.1.3 Identify some methods used in descriptive statistics.1.4 Explain two ways in which descriptive statistics and inferential statistics are interrelated.
APPLICATIONS1.3 Indicate which of the following variables are quantitative and which are qualitative.a. Number of persons in a familyb. Colors of carsc. Marital status of peopled. Time to commute from home to worke. Number of errors in a person’s credit report
1.4 Indicate which of the following variables are quantitative and which are qualitative.a. Number of typographical errors in newspapersb. Monthly TV cable billsc. Spring break locations favored by college studentsd. Number of cars owned by familiese. Lottery revenues of states
1.5 Classify the quantitative variables in Exercise 1.14 as discrete or continuous.1.6 Classify the quantitative variables in Exercise 1.15 as discrete or continuous.
1.7 Indicate whether each of the following examples refers to a population or to a sample.a. A group of 25 patients selected to test a new drugb. Total items produced on a machine for each year from 1995 to 2009c. Yearly expenditures on clothes for 50 personsd. Number of houses sold by each of the 10 employees of a real estate agency during 2009
1.8 Indicate whether each of the following examples refers to a population or to a sample.a. Salaries of CEOs of all companies in New York Cityb. Five hundred houses selected from a cityc. Gross sales for 2009 of four fast-food chainsd. Annual incomes of all 33 employees of a restaurant
Week One – Glossary of important terms
Census A survey that includes all members of the population.Continuous variable A (quantitative) variable that can assume any numerical value over a certain interval or intervals.Cross-section data Data collected on different elements at the same point in time or for the same period of time.Data or data set Collection of observations or measurements on a variable.Descriptive statistics Collection of methods for organizing, displaying, and describing data using tables, graphs, and summary measures.Discrete variable A (quantitative) variable whose values are countable.Element or member A specific subject or object included in a sample or population.Inferential statistics Collection of methods that help make decisions about a population based on sample results.Observation or measurement The value of a variable for an element.Population or target population The collection of all elements whose characteristics are being studied.Qualitative or categorical data Data generated by a qualitative variable.Qualitative or categorical variable A variable that cannot assume numerical values but is classified into two or more categories.Quantitative data Data generated by a quantitative variable.Quantitative variable A variable that can be measured numerically.Random sample A sample drawn in such a way that each element of the population has some chance of being included in the sample.Representative sample A sample that contains the same characteristics as the corresponding population.Sample A portion of the population of interest.Sample survey A survey that includes elements of a sample.Simple random sampling If all samples of the same size selected from a population have the same chance of being selected, it is called simple random sampling. Such a sample is called a simple random sample.Statistics Group of methods used to collect, analyze, present, and interpret data and to make decisions.Survey Collection of data on the elements of a population or sample.Time-series data Data that give the values of the same variable for the same element at different points in time or for different periods of time.

Variable A characteristic under study or investigation that assumes different values for different elements.