· web viewappendix. table 1. exact search strings to identify systematic reviews of...
TRANSCRIPT
Appendix.
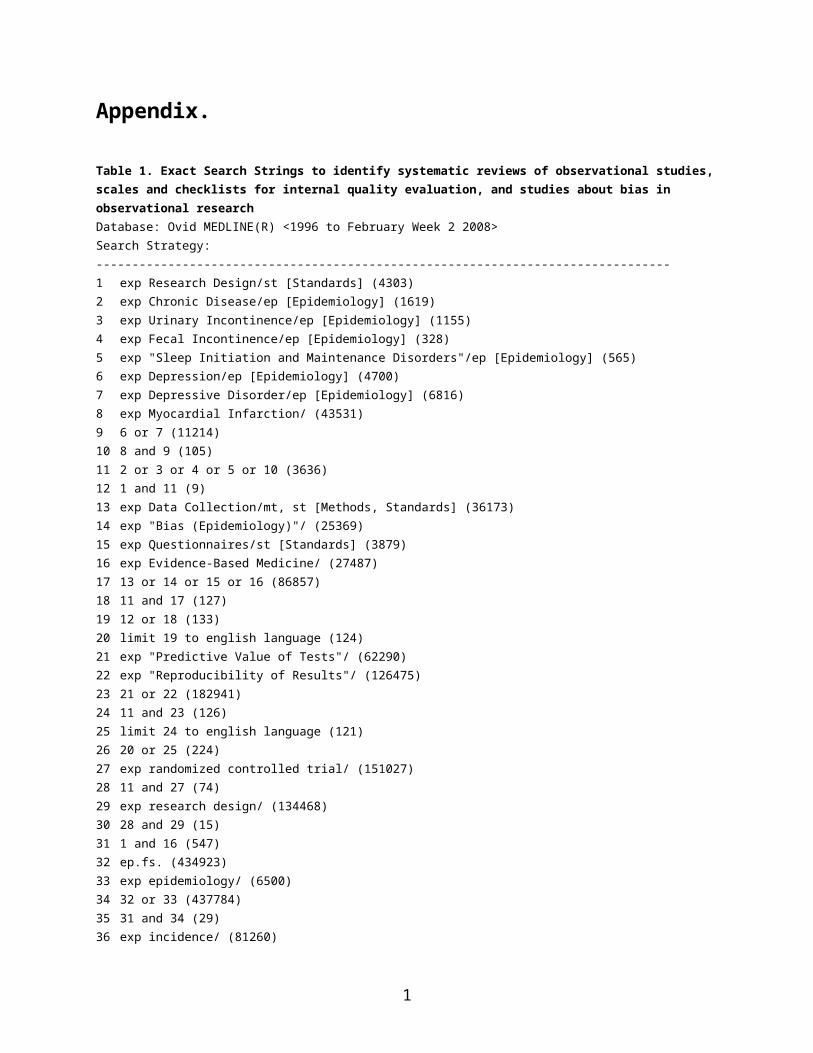
Table 1. Exact Search Strings to identify systematic reviews of observational studies, scales and checklists for internal quality evaluation, and studies about bias in observational researchDatabase: Ovid MEDLINE(R) <1996 to February Week 2 2008>Search Strategy:--------------------------------------------------------------------------------1 exp Research Design/st [Standards] (4303)2 exp Chronic Disease/ep [Epidemiology] (1619)3 exp Urinary Incontinence/ep [Epidemiology] (1155)4 exp Fecal Incontinence/ep [Epidemiology] (328)5 exp "Sleep Initiation and Maintenance Disorders"/ep [Epidemiology] (565)6 exp Depression/ep [Epidemiology] (4700)7 exp Depressive Disorder/ep [Epidemiology] (6816)8 exp Myocardial Infarction/ (43531)9 6 or 7 (11214)10 8 and 9 (105)11 2 or 3 or 4 or 5 or 10 (3636)12 1 and 11 (9)13 exp Data Collection/mt, st [Methods, Standards] (36173)14 exp "Bias (Epidemiology)"/ (25369)15 exp Questionnaires/st [Standards] (3879)16 exp Evidence-Based Medicine/ (27487)17 13 or 14 or 15 or 16 (86857)18 11 and 17 (127)19 12 or 18 (133)20 limit 19 to english language (124)21 exp "Predictive Value of Tests"/ (62290)22 exp "Reproducibility of Results"/ (126475)23 21 or 22 (182941)24 11 and 23 (126)25 limit 24 to english language (121)26 20 or 25 (224)27 exp randomized controlled trial/ (151027)28 11 and 27 (74)29 exp research design/ (134468)30 28 and 29 (15)31 1 and 16 (547)32 ep.fs. (434923)33 exp epidemiology/ (6500)34 32 or 33 (437784)35 31 and 34 (29)36 exp incidence/ (81260)37 exp prevalence/ (83713)38 36 or 37 (157239)39 31 and 38 (14)40 26 or 30 or 35 or 39 (268)41 limit 40 to english language (267)42 limit 41 to journal article (251)43 from 42 keep 1-251 (251)
1

2
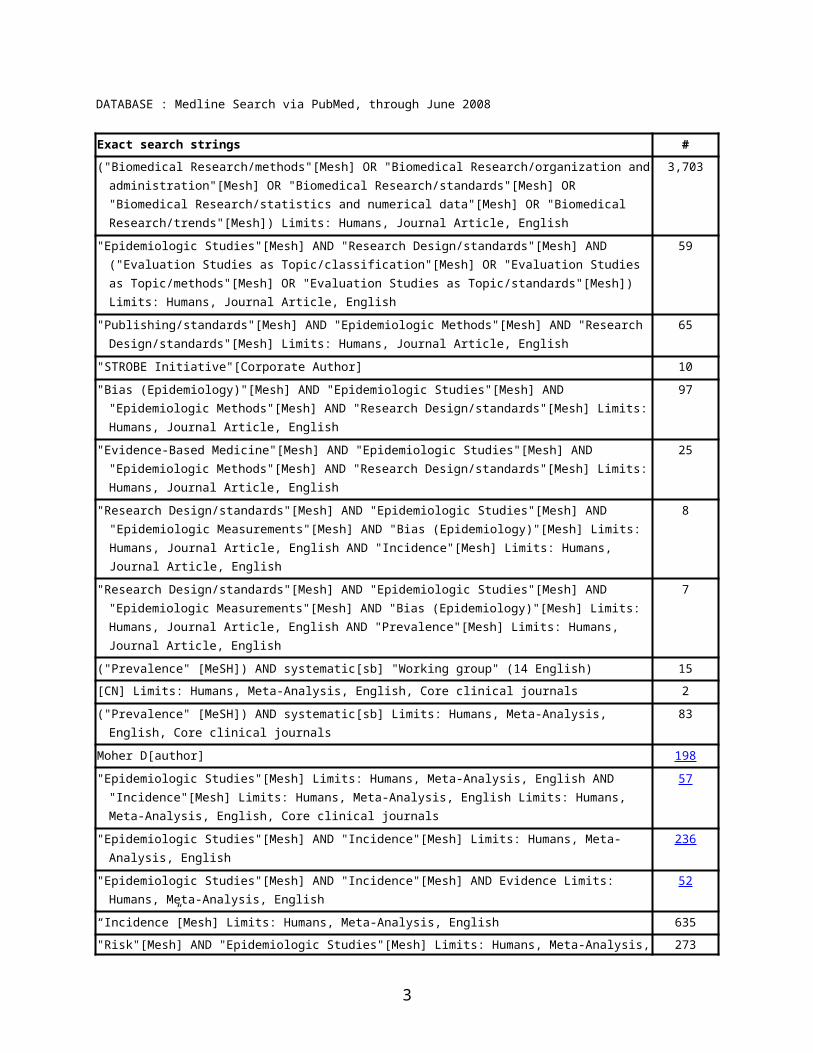
DATABASE : Medline Search via PubMed, through June 2008
Exact search strings #("Biomedical Research/methods"[Mesh] OR "Biomedical Research/organization and
administration"[Mesh] OR "Biomedical Research/standards"[Mesh] OR "Biomedical Research/statistics and numerical data"[Mesh] OR "Biomedical Research/trends"[Mesh]) Limits: Humans, Journal Article, English
3,703
"Epidemiologic Studies"[Mesh] AND "Research Design/standards"[Mesh] AND ("Evaluation Studies as Topic/classification"[Mesh] OR "Evaluation Studies as Topic/methods"[Mesh] OR "Evaluation Studies as Topic/standards"[Mesh]) Limits: Humans, Journal Article, English
59
"Publishing/standards"[Mesh] AND "Epidemiologic Methods"[Mesh] AND "Research Design/standards"[Mesh] Limits: Humans, Journal Article, English
65
"STROBE Initiative"[Corporate Author] 10
"Bias (Epidemiology)"[Mesh] AND "Epidemiologic Studies"[Mesh] AND "Epidemiologic Methods"[Mesh] AND "Research Design/standards"[Mesh] Limits: Humans, Journal Article, English
97
"Evidence-Based Medicine"[Mesh] AND "Epidemiologic Studies"[Mesh] AND "Epidemiologic Methods"[Mesh] AND "Research Design/standards"[Mesh] Limits: Humans, Journal Article, English
25
"Research Design/standards"[Mesh] AND "Epidemiologic Studies"[Mesh] AND "Epidemiologic Measurements"[Mesh] AND "Bias (Epidemiology)"[Mesh] Limits: Humans, Journal Article, English AND "Incidence"[Mesh] Limits: Humans, Journal Article, English
8
"Research Design/standards"[Mesh] AND "Epidemiologic Studies"[Mesh] AND "Epidemiologic Measurements"[Mesh] AND "Bias (Epidemiology)"[Mesh] Limits: Humans, Journal Article, English AND "Prevalence"[Mesh] Limits: Humans, Journal Article, English
7
("Prevalence" [MeSH]) AND systematic[sb] "Working group" (14 English) 15
[CN] Limits: Humans, Meta-Analysis, English, Core clinical journals 2
("Prevalence" [MeSH]) AND systematic[sb] Limits: Humans, Meta-Analysis, English, Core clinical journals
83
Moher D[author] 198
"Epidemiologic Studies"[Mesh] Limits: Humans, Meta-Analysis, English AND "Incidence"[Mesh] Limits: Humans, Meta-Analysis, English Limits: Humans, Meta-Analysis, English, Core clinical journals
57
"Epidemiologic Studies"[Mesh] AND "Incidence"[Mesh] Limits: Humans, Meta-Analysis, English 236
"Epidemiologic Studies"[Mesh] AND "Incidence"[Mesh] AND Evidence Limits: Humans, Meta-Analysis, English
52
“Incidence”[Mesh] Limits: Humans, Meta-Analysis, English 635
"Risk"[Mesh] AND "Epidemiologic Studies"[Mesh] Limits: Humans, Meta-Analysis, English, Core clinical journals
273
"Prevalence"[Mesh] Limits: Humans, Meta-Analysis, English, Core clinical journals 84
Altman DG[author] 7
Higgins J[author] 3
"Review Literature as Topic"[Mesh] AND "Research Design/standards" [Mesh] AND "Epidemiologic Studies"[Mesh] Limits: Humans, English, Core clinical journals
0
"Review Literature as Topic"[Mesh] AND "Epidemiologic Studies"[Mesh] AND "Quality control" [Mesh] 1
"Incidence"[Mesh] AND "Chronic Disease/epidemiology"[Mesh] AND "Peer Review, Re"[Mesh] AND "Re Design/standards"[Mesh]
0
"Incidence"[Mesh] AND "Chronic Disease/epidemiology"[Mesh] AND "Peer Review, Re"[Mesh] 0
3
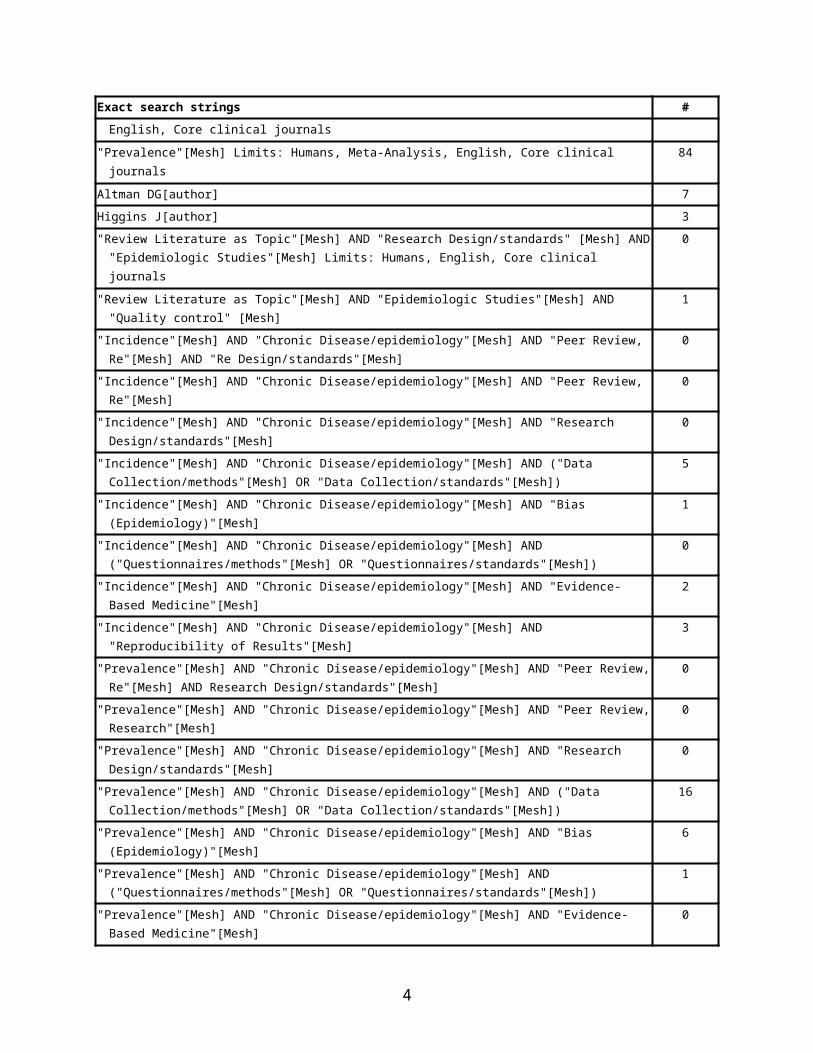
Exact search strings #"Incidence"[Mesh] AND "Chronic Disease/epidemiology"[Mesh] AND "Research
Design/standards"[Mesh] 0
"Incidence"[Mesh] AND "Chronic Disease/epidemiology"[Mesh] AND ("Data Collection/methods"[Mesh] OR "Data Collection/standards"[Mesh])
5
"Incidence"[Mesh] AND "Chronic Disease/epidemiology"[Mesh] AND "Bias (Epidemiology)"[Mesh] 1
"Incidence"[Mesh] AND "Chronic Disease/epidemiology"[Mesh] AND ("Questionnaires/methods"[Mesh] OR "Questionnaires/standards"[Mesh])
0
"Incidence"[Mesh] AND "Chronic Disease/epidemiology"[Mesh] AND "Evidence-Based Medicine"[Mesh] 2
"Incidence"[Mesh] AND "Chronic Disease/epidemiology"[Mesh] AND "Reproducibility of Results"[Mesh] 3
"Prevalence"[Mesh] AND "Chronic Disease/epidemiology"[Mesh] AND "Peer Review, Re"[Mesh] AND Research Design/standards"[Mesh]
0
"Prevalence"[Mesh] AND "Chronic Disease/epidemiology"[Mesh] AND "Peer Review, Research"[Mesh] 0
"Prevalence"[Mesh] AND "Chronic Disease/epidemiology"[Mesh] AND "Research Design/standards"[Mesh]
0
"Prevalence"[Mesh] AND "Chronic Disease/epidemiology"[Mesh] AND ("Data Collection/methods"[Mesh] OR "Data Collection/standards"[Mesh])
16
"Prevalence"[Mesh] AND "Chronic Disease/epidemiology"[Mesh] AND "Bias (Epidemiology)"[Mesh] 6
"Prevalence"[Mesh] AND "Chronic Disease/epidemiology"[Mesh] AND ("Questionnaires/methods"[Mesh] OR "Questionnaires/standards"[Mesh])
1
"Prevalence"[Mesh] AND "Chronic Disease/epidemiology"[Mesh] AND "Evidence-Based Medicine"[Mesh]
0
"Prevalence"[Mesh] AND "Chronic Disease/epidemiology"[Mesh] AND "Reproducibility of Results"[Mesh] 12
"Risk Factors"[Mesh] AND "Chronic Disease/epidemiology"[Mesh] AND "Peer Review, Research"[Mesh] AND "Research Design/standards"[Mesh]
0
"Risk Factors"[Mesh] AND "Chronic Disease/epidemiology"[Mesh] AND "Peer Review, Research"[Mesh] 0
"Risk Factors"[Mesh] AND "Chronic Disease/epidemiology"[Mesh] AND "Research Design/standards"[Mesh]
1
"Risk Factors"[Mesh] AND "Chronic Disease/epidemiology"[Mesh] AND ("Data Collection/methods"[Mesh] OR "Data Collection/standards"[Mesh])
18
"Risk Factors"[Mesh] AND "Chronic Disease/epidemiology"[Mesh] AND "Bias (Epidemiology)"[Mesh] 7
"Risk Factors"[Mesh] AND "Chronic Disease/epidemiology"[Mesh] AND ("Questionnaires/methods"[Mesh] OR "Questionnaires/standards"[Mesh])
1
"Risk Factors"[Mesh] AND "Chronic Disease/epidemiology"[Mesh] AND "Evidence-Based Medicine"[Mesh]
4
"Risk Factors"[Mesh] AND "Chronic Disease/epidemiology"[Mesh] AND "Reproducibility of Results"[Mesh]
10
"Health Care Quality, Access, and Evaluation"[Mesh] AND "Chronic Disease/epidemiology"[Mesh] AND "Peer Review, Research"[Mesh] AND "Research Design/standards"[Mesh]
0
"Health Care Quality, Access, and Evaluation"[Mesh] AND "Chronic Disease/epidemiology"[Mesh] AND "Peer Review, Research"[Mesh]
0
"Health Care Quality, Access, and Evaluation"[Mesh] AND "Chronic Disease/epidemiology"[Mesh] AND "Research Design/standards"[Mesh]
4
"Health Care Quality, Access, and Evaluation"[Mesh] AND "Chronic Disease/epidemiology"[Mesh] AND "Evidence-Based Medicine"[Mesh]
8
4
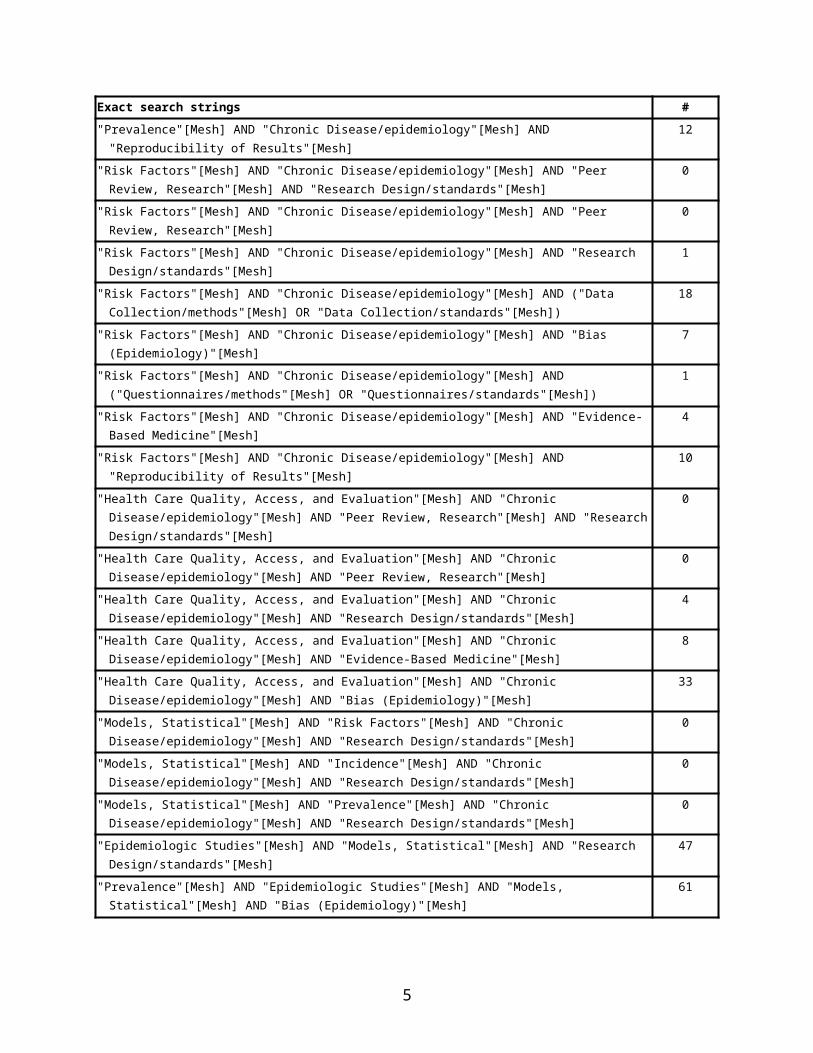
Exact search strings #"Health Care Quality, Access, and Evaluation"[Mesh] AND "Chronic Disease/epidemiology"[Mesh] AND
"Bias (Epidemiology)"[Mesh]33
"Models, Statistical"[Mesh] AND "Risk Factors"[Mesh] AND "Chronic Disease/epidemiology"[Mesh] AND "Research Design/standards"[Mesh]
0
"Models, Statistical"[Mesh] AND "Incidence"[Mesh] AND "Chronic Disease/epidemiology"[Mesh] AND "Research Design/standards"[Mesh]
0
"Models, Statistical"[Mesh] AND "Prevalence"[Mesh] AND "Chronic Disease/epidemiology"[Mesh] AND "Research Design/standards"[Mesh]
0
"Epidemiologic Studies"[Mesh] AND "Models, Statistical"[Mesh] AND "Research Design/standards"[Mesh]
47
"Prevalence"[Mesh] AND "Epidemiologic Studies"[Mesh] AND "Models, Statistical"[Mesh] AND "Bias (Epidemiology)"[Mesh]
61
"Incidence"[Mesh] AND "Epidemiologic Studies"[Mesh] AND "Models, Statistical"[Mesh] AND "Bias (Epidemiology)"[Mesh]
66
"Research Design/standards"[Mesh] AND ("Biomedical Re/methods"[Mesh] OR "Biomedical Research/organization and administration"[Mesh] OR "Biomedical Research/standards"[Mesh] OR "Biomedical Research/statistics and numerical data"[Mesh] OR "Biomedical Research/trends"[Mesh]) Limits: Humans, Journal Article, English
62
5

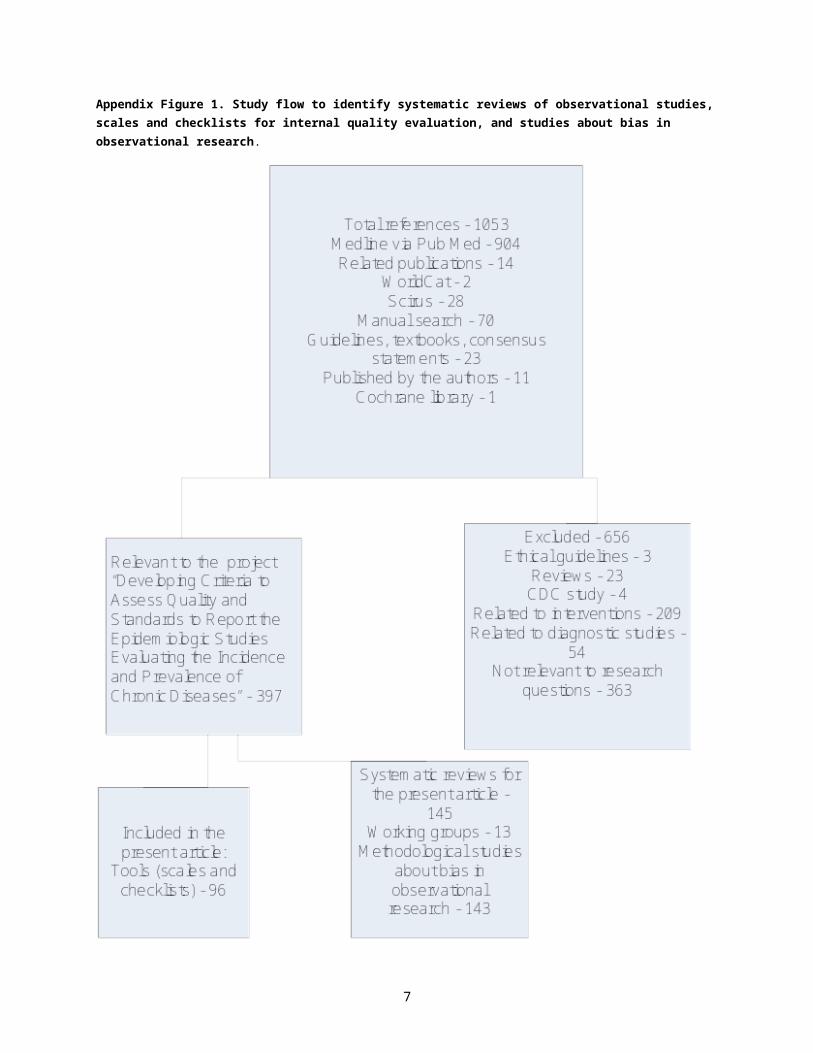
Appendix Figure 1. Study flow to identify systematic reviews of observational studies, scales and checklists for internal quality evaluation, and studies about bias in observational research.
6
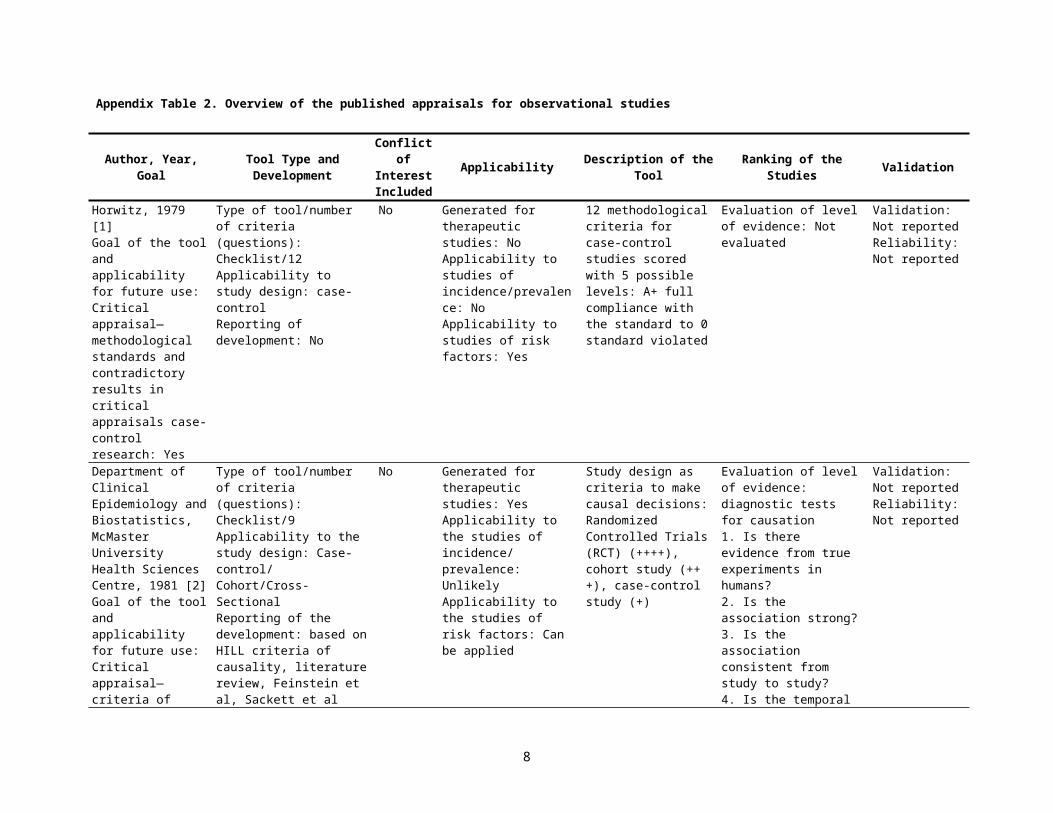
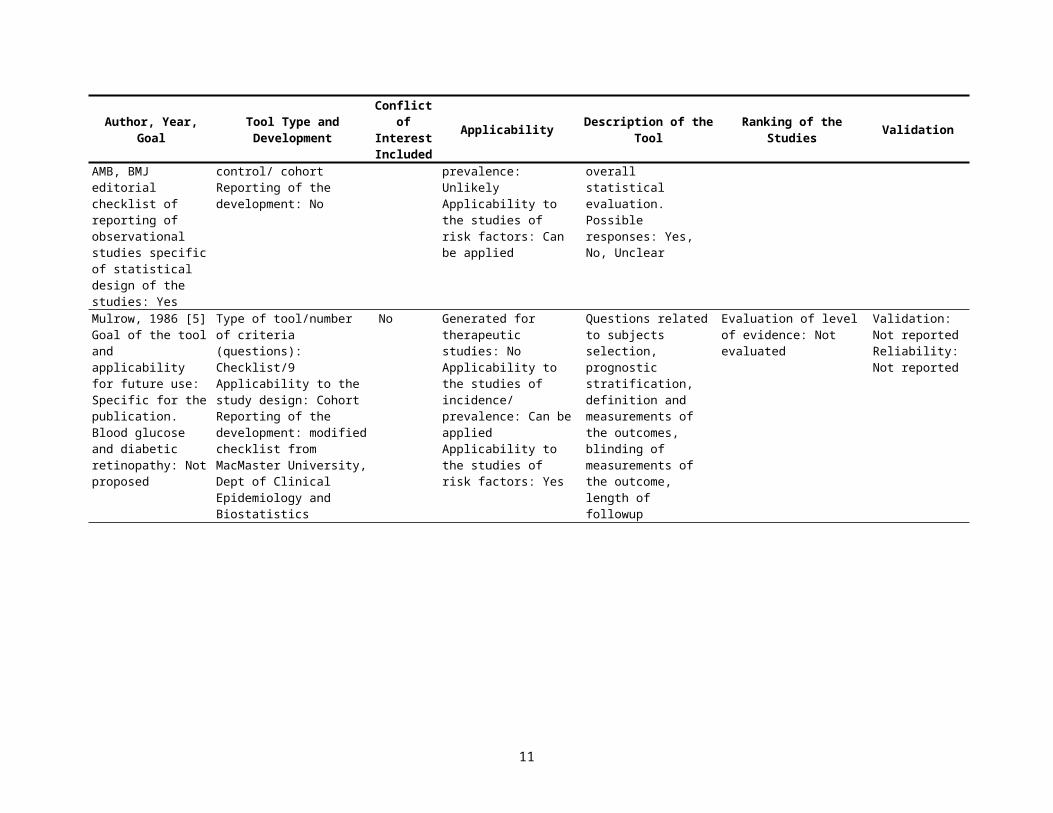
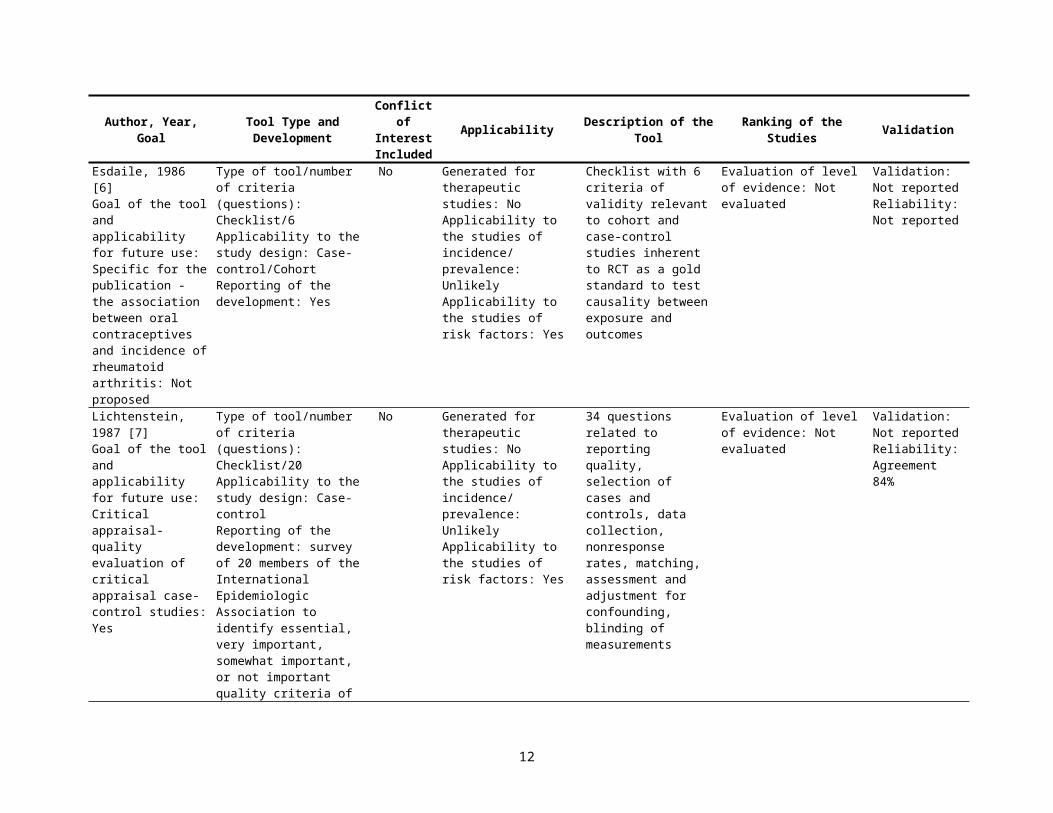
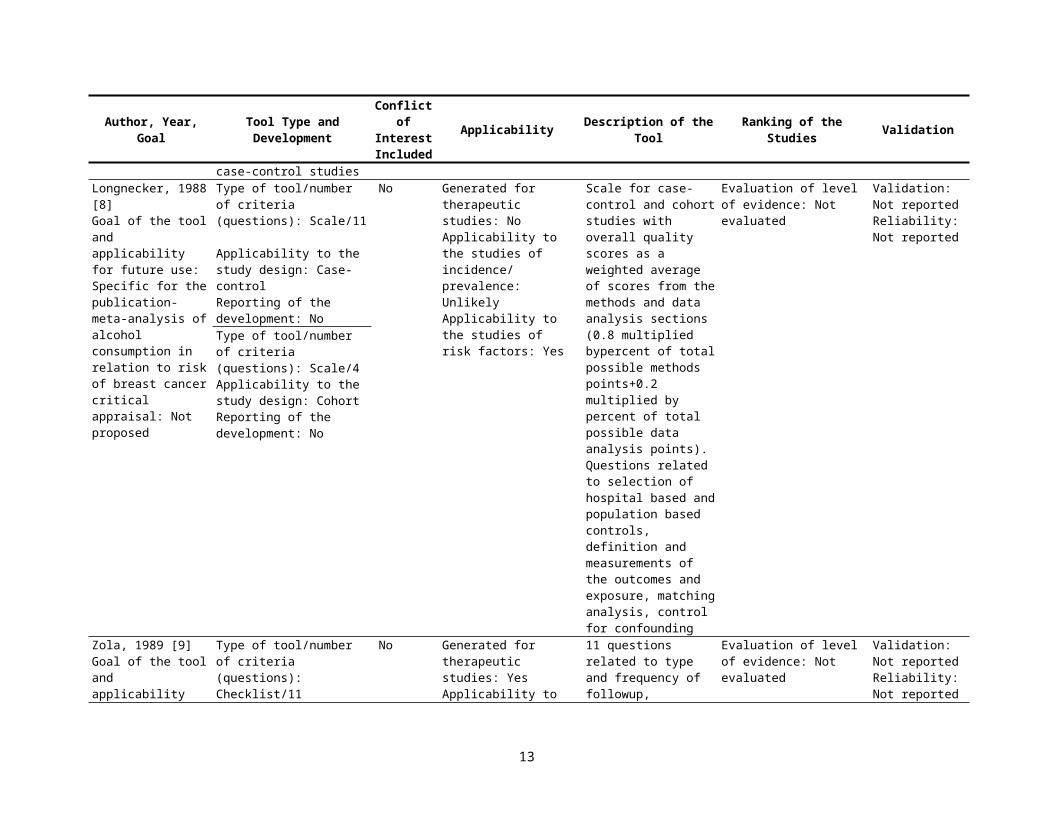
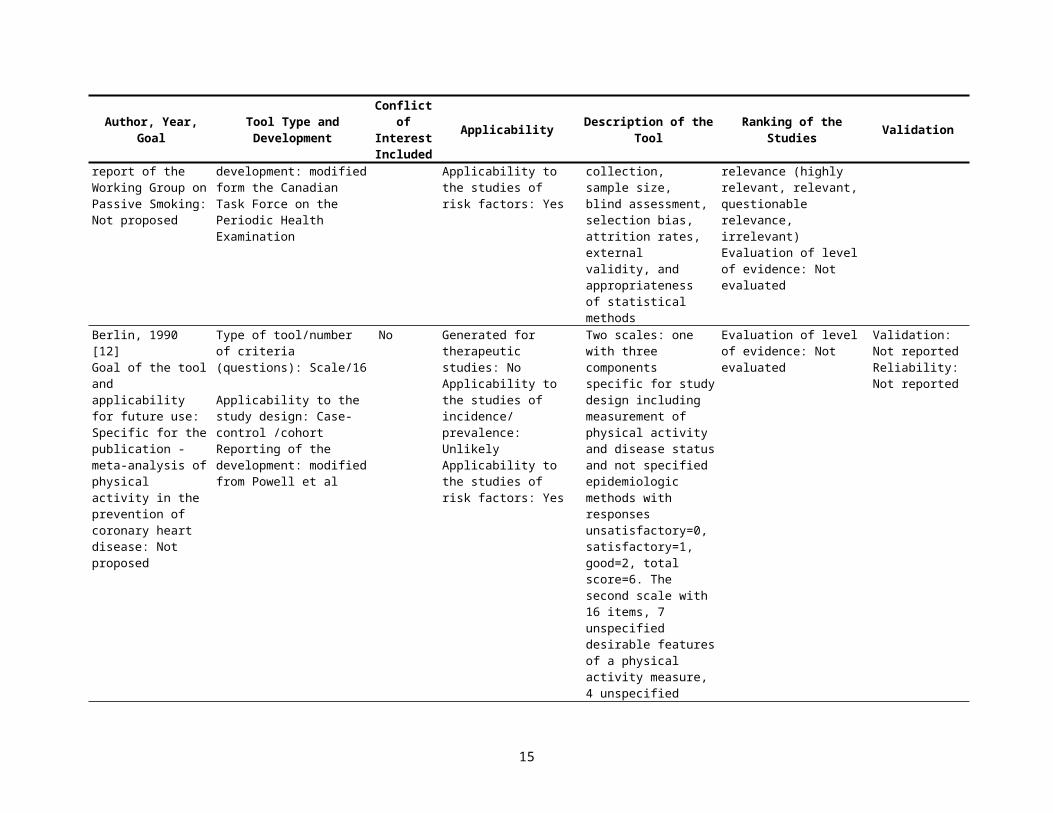
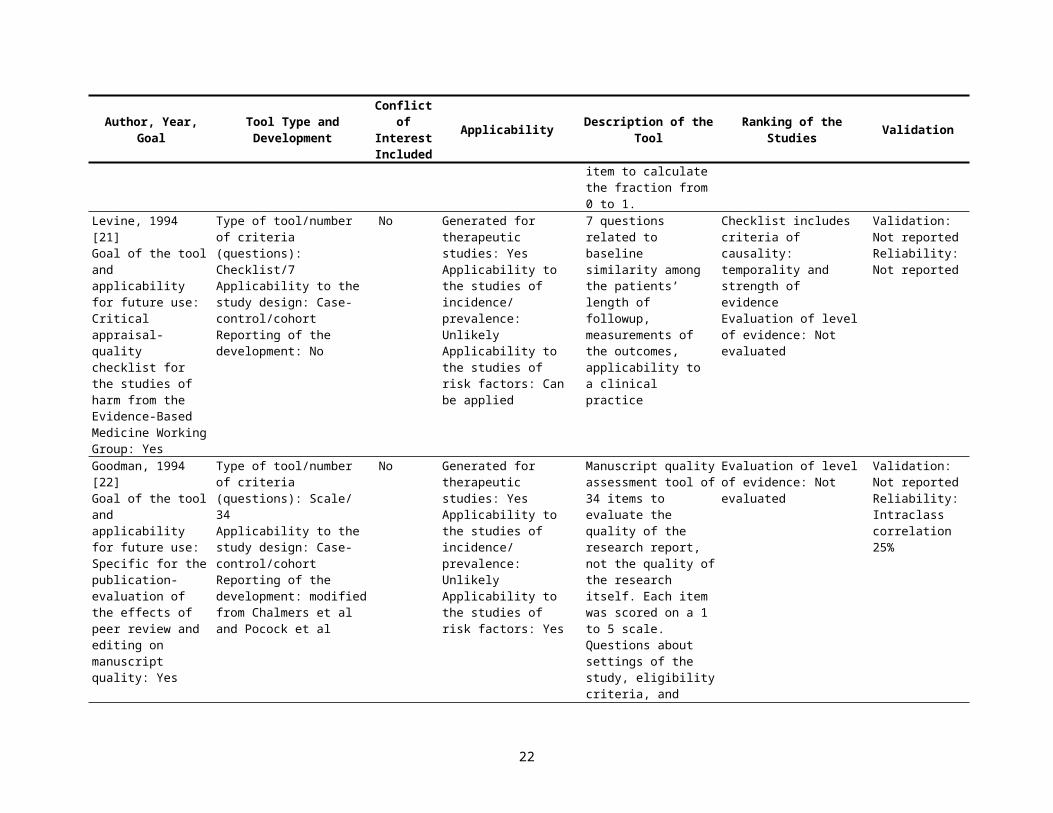
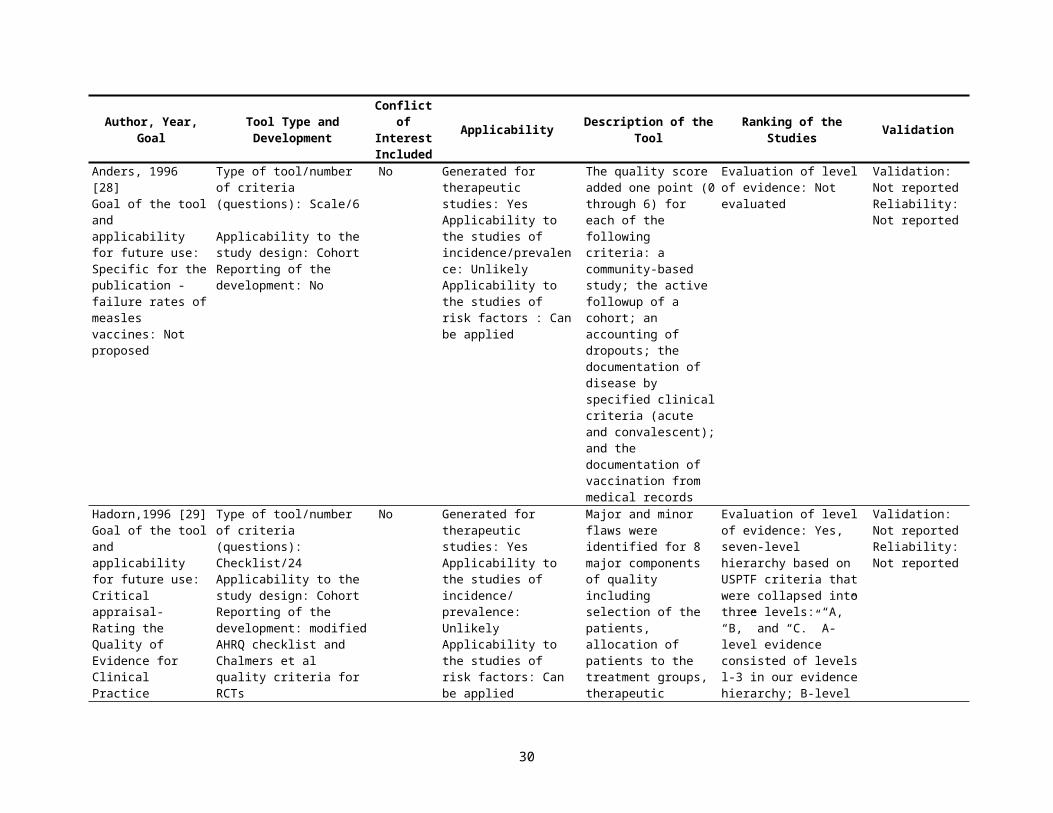
Appendix Table 2. Overview of the published appraisals for observational studies
Author, Year, Goal Tool Type and Development
Conflict of Interest Included
Applicability Description of the Tool Ranking of the Studies Validation
Horwitz, 1979 [1]Goal of the tool and applicability for future use: Critical appraisal— methodological standards and contradictory results in critical appraisals case-control research: Yes
Type of tool/number of criteria (questions): Checklist/12 Applicability to study design: case-controlReporting of development: No
No Generated for therapeutic studies: NoApplicability to studies of incidence/prevalence: NoApplicability to studies of risk factors: Yes
12 methodological criteria for case-control studies scored with 5 possible levels: A+ full compliance with the standard to 0 standard violated
Evaluation of level of evidence: Not evaluated
Validation: Not reportedReliability: Not reported
Department of Clinical Epidemiology and Biostatistics, McMaster University Health Sciences Centre, 1981 [2]Goal of the tool and applicability for future use: Critical appraisal—criteria of critical appraisal of causality: Yes
Type of tool/number of criteria (questions): Checklist/9Applicability to the study design: Case-control/ Cohort/Cross-SectionalReporting of the development: based on HILL criteria of causality, literature review, Feinstein et al, Sackett et al
No Generated for therapeutic studies: YesApplicability to the studies of incidence/ prevalence: Unlikely Applicability to the studies of risk factors: Can be applied
Study design as criteria to make causal decisions: Randomized Controlled Trials (RCT) (++++), cohort study (+++), case-control study (+)
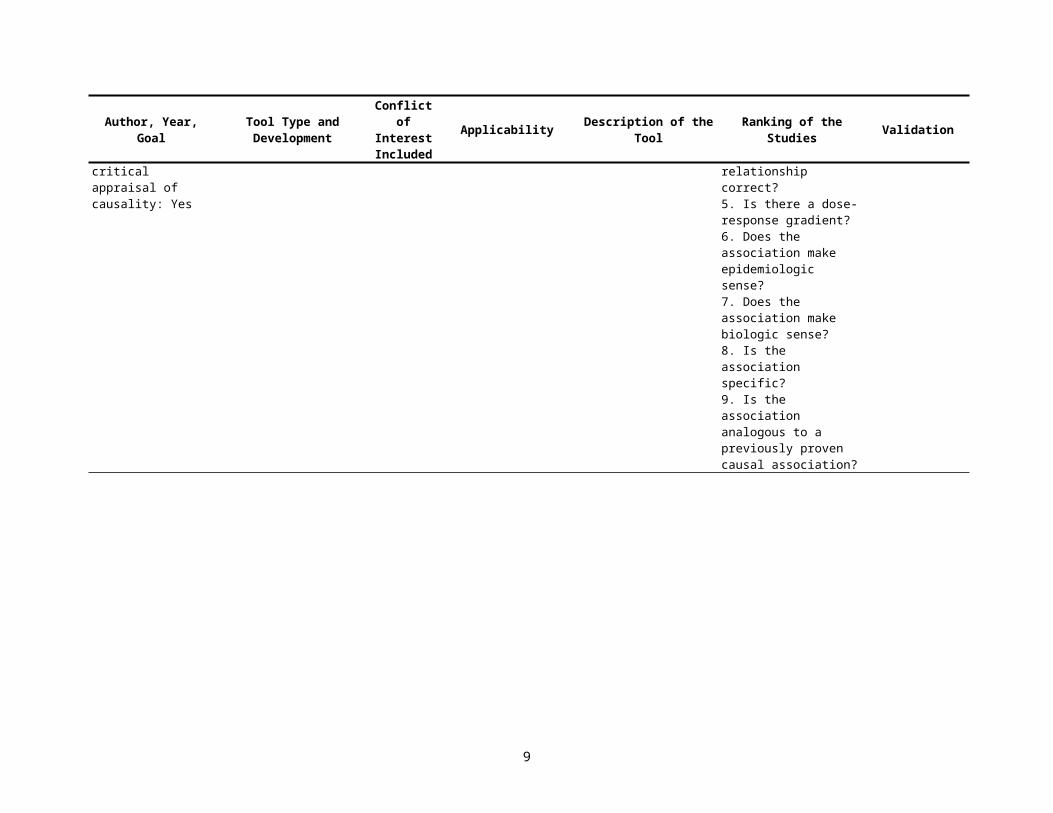
Evaluation of level of evidence: diagnostic tests for causation1. Is there evidence from true experiments in humans?2. Is the association strong?3. Is the association consistent from study to study?4. Is the temporal relationship correct?5. Is there a dose-response gradient?6. Does the association make epidemiologic sense?7. Does the association make biologic sense?8. Is the association specific?9. Is the association analogous to a previously proven causal association?
Validation: Not reportedReliability: Not reported
7
Author, Year, Goal Tool Type and Development
Conflict of Interest Included
Applicability Description of the Tool Ranking of the Studies Validation
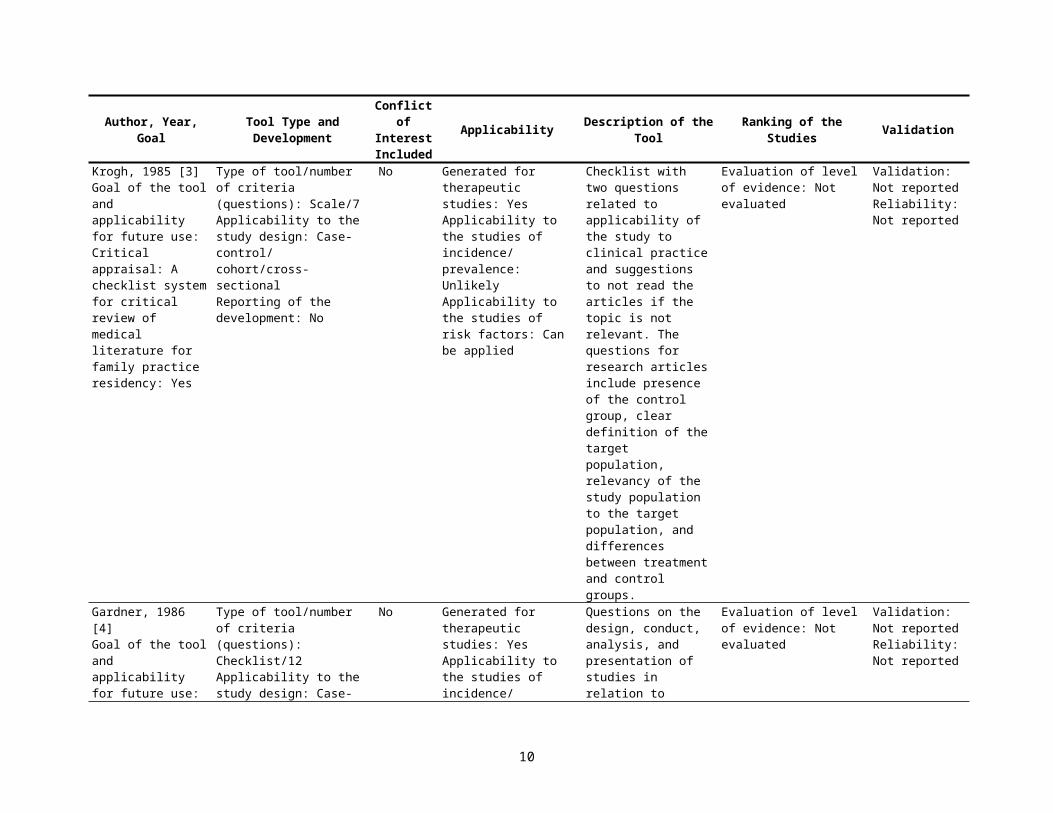
Krogh, 1985 [3]Goal of the tool and applicability for future use: Critical appraisal: A checklist system for critical review of medical literature for family practice residency: Yes
Type of tool/number of criteria (questions): Scale/7Applicability to the study design: Case-control/ cohort/cross-sectionalReporting of the development: No
No Generated for therapeutic studies: YesApplicability to the studies of incidence/ prevalence: UnlikelyApplicability to the studies of risk factors: Can be applied
Checklist with two questions related to applicability of the study to clinical practice and suggestions to not read the articles if the topic is not relevant. The questions for research articles include presence of the control group, clear definition of the target population, relevancy of the study population to the target population, and differences between treatment and control groups.
Evaluation of level of evidence: Not evaluated
Validation: Not reportedReliability: Not reported
Gardner, 1986 [4]Goal of the tool and applicability for future use: AMB, BMJ editorial checklist of reporting of observa-tional studies specific of statistical design of the studies: Yes
Type of tool/number of criteria (questions): Checklist/12 Applicability to the study design: Case-control/ cohortReporting of the development: No
No Generated for therapeutic studies: YesApplicability to the studies of incidence/ prevalence: UnlikelyApplicability to the studies of risk factors: Can be applied
Questions on the design, conduct, analysis, and presentation of studies in relation to overall statistical evaluation. Possible responses: Yes, No, Unclear
Evaluation of level of evidence: Not evaluated
Validation: Not reportedReliability: Not reported
Mulrow, 1986 [5]Goal of the tool and applicability for future use: Specific for the publication. Blood glucose and diabetic retinopathy: Not proposed
Type of tool/number of criteria (questions): Checklist/9 Applicability to the study design: CohortReporting of the develop-ment: modified checklist from MacMaster University, Dept of Clinical Epidemi-ology and Biostatistics
No Generated for therapeutic studies: NoApplicability to the studies of incidence/ prevalence: Can be appliedApplicability to the studies of risk factors: Yes
Questions related to subjects selection, prognostic stratification, definition and measurements of the outcomes, blinding of measurements of the outcome, length of followup
Evaluation of level of evidence: Not evaluated
Validation: Not reportedReliability: Not reported
8
Author, Year, Goal Tool Type and Development
Conflict of Interest Included
Applicability Description of the Tool Ranking of the Studies Validation
Esdaile, 1986 [6]Goal of the tool and applicability for future use: Specific for the publication - the association between oral contraceptives and incidence of rheumatoid arthritis: Not proposed
Type of tool/number of criteria (questions): Checklist/6 Applicability to the study design: Case-control/CohortReporting of the development: Yes
No Generated for therapeutic studies: NoApplicability to the studies of incidence/ prevalence: UnlikelyApplicability to the studies of risk factors: Yes
Checklist with 6 criteria of validity relevant to cohort and case-control studies inherent to RCT as a gold standard to test causality between exposure and outcomes
Evaluation of level of evidence: Not evaluated
Validation: Not reportedReliability: Not reported
Lichtenstein, 1987 [7]Goal of the tool and applicability for future use: Critical appraisal- quality evaluation of critical appraisal case-control studies: Yes
Type of tool/number of criteria (questions): Checklist/20 Applicability to the study design: Case-controlReporting of the development: survey of 20 members of the International Epidemiologic Association to identify essential, very important, somewhat important, or not important quality criteria of case-control studies
No Generated for therapeutic studies: NoApplicability to the studies of incidence/ prevalence: UnlikelyApplicability to the studies of risk factors: Yes
34 questions related to reporting quality, selection of cases and controls, data collection, nonresponse rates, matching, assessment and adjustment for confounding, blinding of measurements
Evaluation of level of evidence: Not evaluated
Validation: Not reportedReliability: Agreement 84%
Longnecker, 1988 [8]Goal of the tool and applicability for future use: Specific for the publication-meta-analysis of alcohol consumption in relation to risk of breast cancer critical appraisal: Not proposed
Type of tool/number of criteria (questions): Scale/11 Applicability to the study design: Case-controlReporting of the development: No
No Generated for therapeutic studies: NoApplicability to the studies of incidence/ prevalence: UnlikelyApplicability to the studies of risk factors: Yes
Scale for case-control and cohort studies with overall quality scores as a weighted average of scores from the methods and data analysis sections (0.8 multiplied bypercent of total possible methods points+0.2 multiplied by percent of total possible data analysis points). Questions related to selection of hospital based and population based controls, definition and
Evaluation of level of evidence: Not evaluated
Validation: Not reportedReliability: Not reported
Type of tool/number of criteria (questions): Scale/4 Applicability to the study design: CohortReporting of the development: No
9
Author, Year, Goal Tool Type and Development
Conflict of Interest Included
Applicability Description of the Tool Ranking of the Studies Validation
measurements of the outcomes and exposure, matching analysis, control for confounding
Zola, 1989 [9]Goal of the tool and applicability for future use: Specific for the publication-review of treatment options for cervical cancer Critical appraisal: Yes
Type of tool/number of criteria (questions): Checklist/11 Applicability to the study design: CohortReporting of the development: modified from Chalmers et al
No Generated for therapeutic studies: YesApplicability to the studies of incidence/ prevalence: UnlikelyApplicability to the studies of risk factors: Can be applied
11 questions related to type and frequency of followup, treatment adherence, withdrawals, analytical methods, patient characteristics, exclusion of eligible patients, therapeutic regimes, presence of control arm, timing of reported events
Evaluation of level of evidence: Not evaluated
Validation: Not reportedReliability: Not reported
Reisch, 1989 [10]Goal of the tool and applicability for future use: Critical appraisal-scale evaluating therapeutic studies: Yes
Type of tool/number of criteria (questions): Scale/35Applicability to the study design: Case-control/cohortReporting of the development: modified from Sackett et al and review of literature
No Generated for therapeutic studies: YesApplicability to the studies of incidence/ prevalence: UnlikelyApplicability to the studies of risk factors: Can be applied
Questions related to sample size determination, randomization, selection of control group(s), "blinding," and support for treatment recommendations
Evaluation of level of evidence: Not evaluated
Validation: Not reportedReliability: Not reported
Spitzer, 1990 [11]Goal of the tool and applicability for future use: Specific for the publication - A report of the Working Group on Passive Smoking: Not proposed
Type of tool/number of criteria (questions): Checklist/17 Applicability to the study design: Case-control/cohortReporting of the development: modified form the Canadian Task Force on the Periodic Health Examination
No Generated for therapeutic studies: NoApplicability to the studies of incidence/ prevalence: UnlikelyApplicability to the studies of risk factors: Yes
Questions related to the study design and similarity in comparison groups, strategies to reduce bias, data collection, sample size, blind assessment, selection bias, attrition rates, external validity, and appropriateness of statistical methods
Overall assessment of the study quality by scientific value (very good, good, admissible, inadmissible) and by clinical relevance (highly relevant, relevant, questionable relevance, irrelevant)Evaluation of level of evidence: Not evaluated
Validation: Not reportedReliability: Not reported
Berlin, 1990 [12]Goal of the tool and applicability for future use: Specific for the publication - meta-analysis of physical
Type of tool/number of criteria (questions): Scale/16 Applicability to the study design: Case-control /cohortReporting of the
No Generated for therapeutic studies: NoApplicability to the studies of incidence/ prevalence: UnlikelyApplicability to the
Two scales: one with three components specific for study design including measurement of physical activity and disease status and not
Evaluation of level of evidence: Not evaluated
Validation: Not reportedReliability: Not reported
10
Author, Year, Goal Tool Type and Development
Conflict of Interest Included
Applicability Description of the Tool Ranking of the Studies Validation
activity in the prevention of coronary heart disease: Not proposed
development: modified from Powell et al
studies of risk factors: Yes
specified epidemiologic methods with responses unsatisfactory=0, satisfactory=1, good=2, total score=6. The second scale with 16 items, 7 unspecified desirable features of a physical activity measure, 4 unspecified desirable features of disease measure, and 5 unspecified desirable features of epidemiology study, total 32 scores.
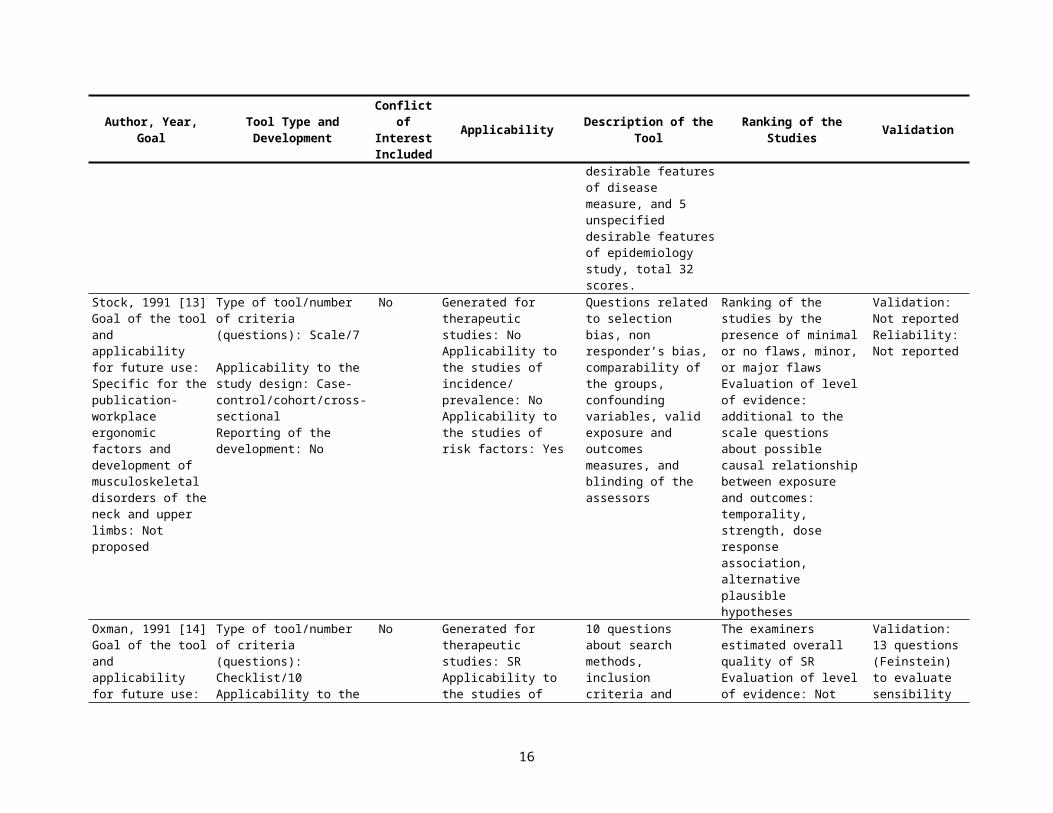
Stock, 1991 [13]Goal of the tool and applicability for future use: Specific for the publication-workplace ergonomic factors and development of musculoskeletal disorders of the neck and upper limbs: Not proposed
Type of tool/number of criteria (questions): Scale/7
Applicability to the study design: Case-control/cohort/cross-sectionalReporting of the development: No
No Generated for therapeutic studies: NoApplicability to the studies of incidence/ prevalence: NoApplicability to the studies of risk factors: Yes
Questions related to selection bias, non responder’s bias, comparability of the groups, confounding variables, valid exposure and outcomes measures, and blinding of the assessors
Ranking of the studies by the presence of minimal or no flaws, minor, or major flawsEvaluation of level of evidence: additional to the scale questions about possible causal relation-ship between exposure and outcomes: temporality, strength, dose response association, alternative plausible hypotheses
Validation: Not reportedReliability: Not reported
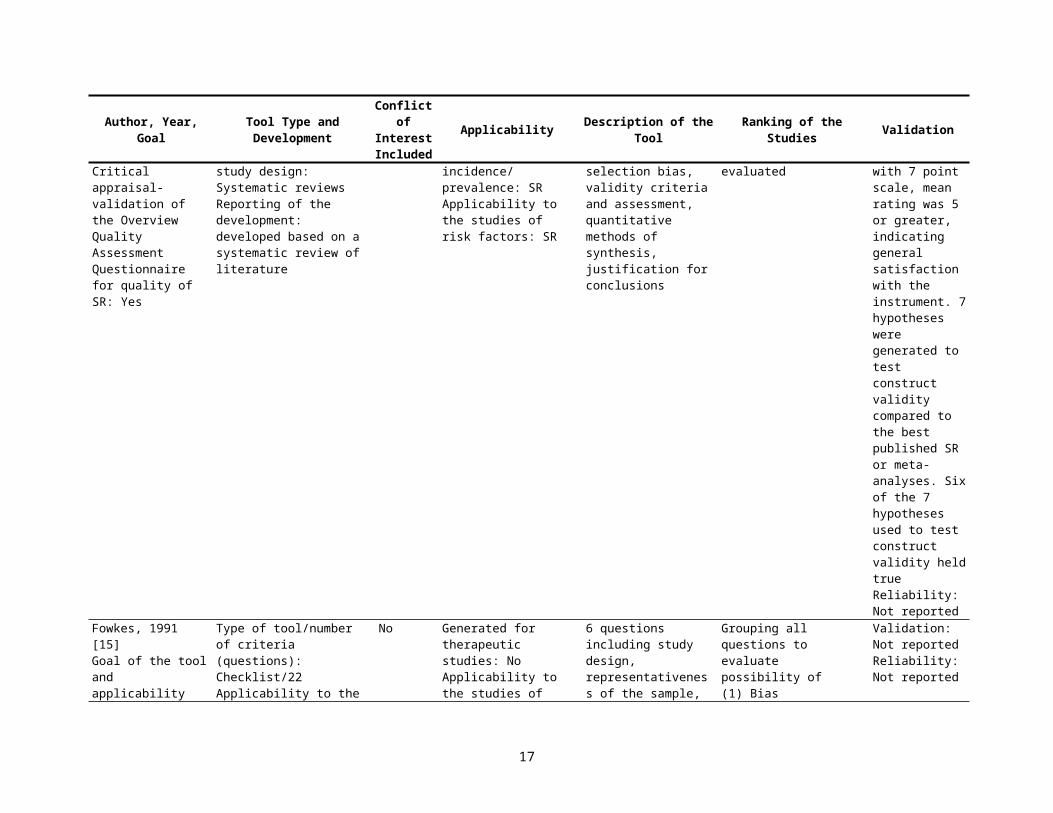
Oxman, 1991 [14]Goal of the tool and applicability for future use: Critical appraisal- validation of the Overview Quality Assessment Questionnaire for quality of SR: Yes
Type of tool/number of criteria (questions): Checklist/10Applicability to the study design: Systematic reviewsReporting of the development: developed based on a systematic review of literature
No Generated for therapeutic studies: SRApplicability to the studies of incidence/ prevalence: SRApplicability to the studies of risk factors: SR
10 questions about search methods, inclusion criteria and selection bias, validity criteria and assessment, quantitative methods of synthesis, justification for conclusions
The examiners estimated overall quality of SREvaluation of level of evidence: Not evaluated
Validation: 13 questions (Feinstein) to evaluate sensibility with 7 point scale, mean rating was 5 or greater, indicating general satisfaction with the instrument. 7 hypotheses were
11
Author, Year, Goal Tool Type and Development
Conflict of Interest Included
Applicability Description of the Tool Ranking of the Studies Validation
generated to test construct validity compared to the best published SR or meta-analyses. Six of the 7 hypotheses used to test construct validity held trueReliability: Not reported
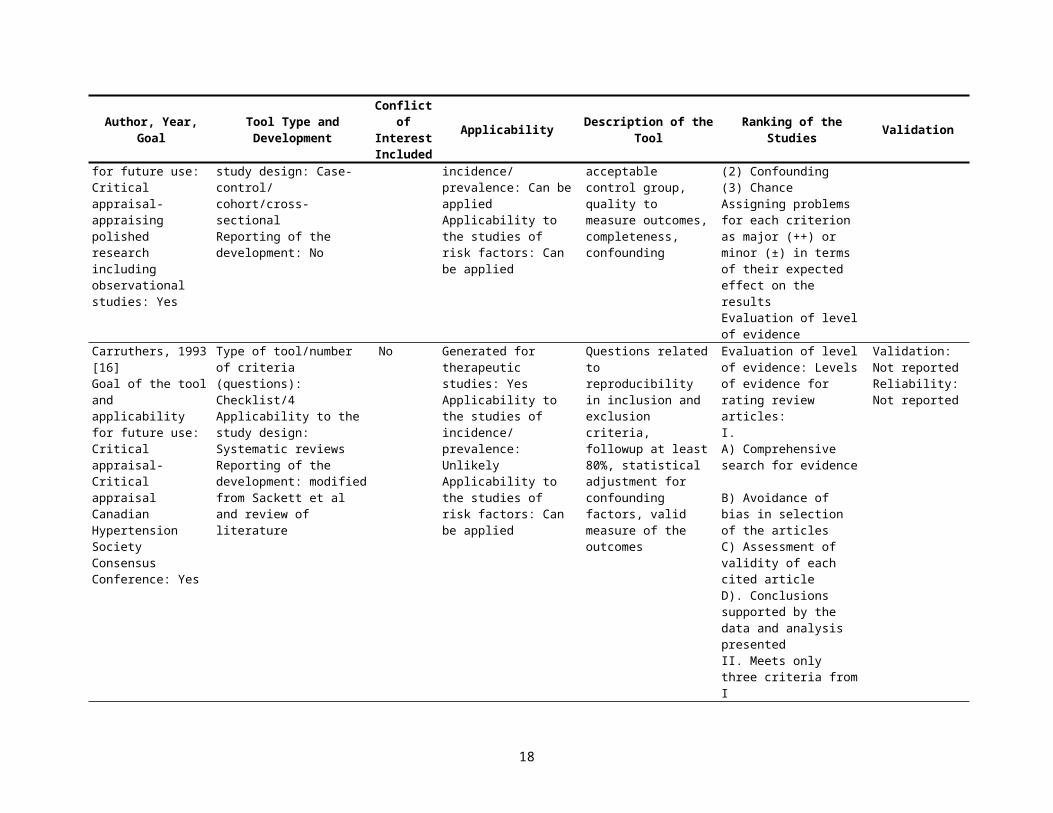
Fowkes, 1991 [15]Goal of the tool and applicability for future use: Critical appraisal- appraising polished research including observational studies: Yes
Type of tool/number of criteria (questions): Checklist/22 Applicability to the study design: Case-control/ cohort/cross-sectionalReporting of the development: No
No Generated for therapeutic studies: NoApplicability to the studies of incidence/ prevalence: Can be appliedApplicability to the studies of risk factors: Can be applied
6 questions including study design, representativeness of the sample, acceptable control group, quality to measure outcomes, completeness, confounding
Grouping all questions to evaluate possibility of (1) Bias(2) Confounding(3) ChanceAssigning problems for each criterion as major (++) or minor (±) in terms of their expected effect on the resultsEvaluation of level of evidence
Validation: Not reportedReliability: Not reported
Carruthers, 1993 [16]Goal of the tool and applicability for future use: Critical appraisal- Critical appraisal Canadian Hypertension Society Consensus Conference: Yes
Type of tool/number of criteria (questions): Checklist/4Applicability to the study design: Systematic reviewsReporting of the development: modified from Sackett et al and review of literature
No Generated for therapeutic studies: YesApplicability to the studies of incidence/ prevalence: UnlikelyApplicability to the studies of risk factors: Can be applied
Questions related to reproducibility in inclusion and exclusion criteria, followup at least 80%, statistical adjustment for confounding factors, valid measure of the outcomes
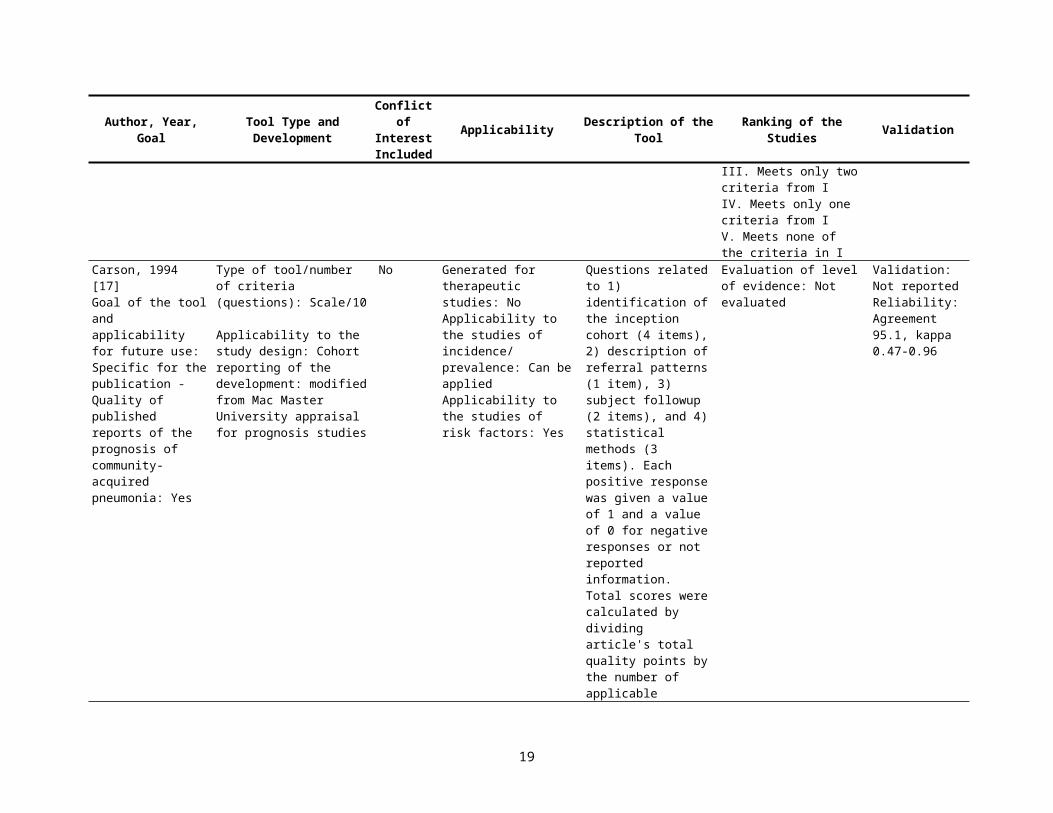
Evaluation of level of evidence: Levels of evidence for rating review articles: I. A) Comprehensive search for evidence B) Avoidance of bias in selection of the articles C) Assessment of validity of each cited articleD). Conclusions supported by the data and analysis presentedII. Meets only three criteria from IIII. Meets only two criteria
Validation: Not reportedReliability: Not reported
12
Author, Year, Goal Tool Type and Development
Conflict of Interest Included
Applicability Description of the Tool Ranking of the Studies Validation
from IIV. Meets only one criteria from IV. Meets none of the criteria in I
Carson, 1994 [17]Goal of the tool and applicability for future use: Specific for the publication - Quality of published reports of the prognosis of community-acquired pneumonia: Yes
Type of tool/number of criteria (questions): Scale/10 Applicability to the study design: Cohortreporting of the development: modified from Mac Master University appraisal for prognosis studies
No Generated for therapeutic studies: NoApplicability to the studies of incidence/ prevalence: Can be appliedApplicability to the studies of risk factors: Yes
Questions related to 1) identification of the inception cohort (4 items), 2) description of referral patterns (1 item), 3) subject followup (2 items), and 4) statistical methods (3 items). Each positive response was given a value of 1 and a value of 0 for negative responses or not reported information. Total scores were calculated by dividing article's total quality points by the number of applicable quality items. Minimum total scores were 0, max -1.
Evaluation of level of evidence: Not evaluated
Validation: Not reportedReliability: Agreement 95.1, kappa 0.47-0.96
Avis, 1994 [18]Goal of the tool and applicability for future use: Critical appraisal- quality of evidence and the validity of conclusions in nursing research: Yes
Type of tool/number of criteria (questions): Checklist/24 Applicability to the study design: Case-control, cohortReporting of the development: modified from Fowkes
No Generated for therapeutic studies: YesApplicability to the studies of incidence/ prevalence: UnlikelyApplicability to the studies of risk factors: Yes
Questions related to objectives and design, sampling, presence of controls, reliability and validity of the measurements, probability of bias due to poor compliance, dropouts, missing data, co-interventions, or confounding factors, and validity of conclusions
Evaluation of level of evidence: Not evaluated
Validation: Not reportedReliability: Not reported
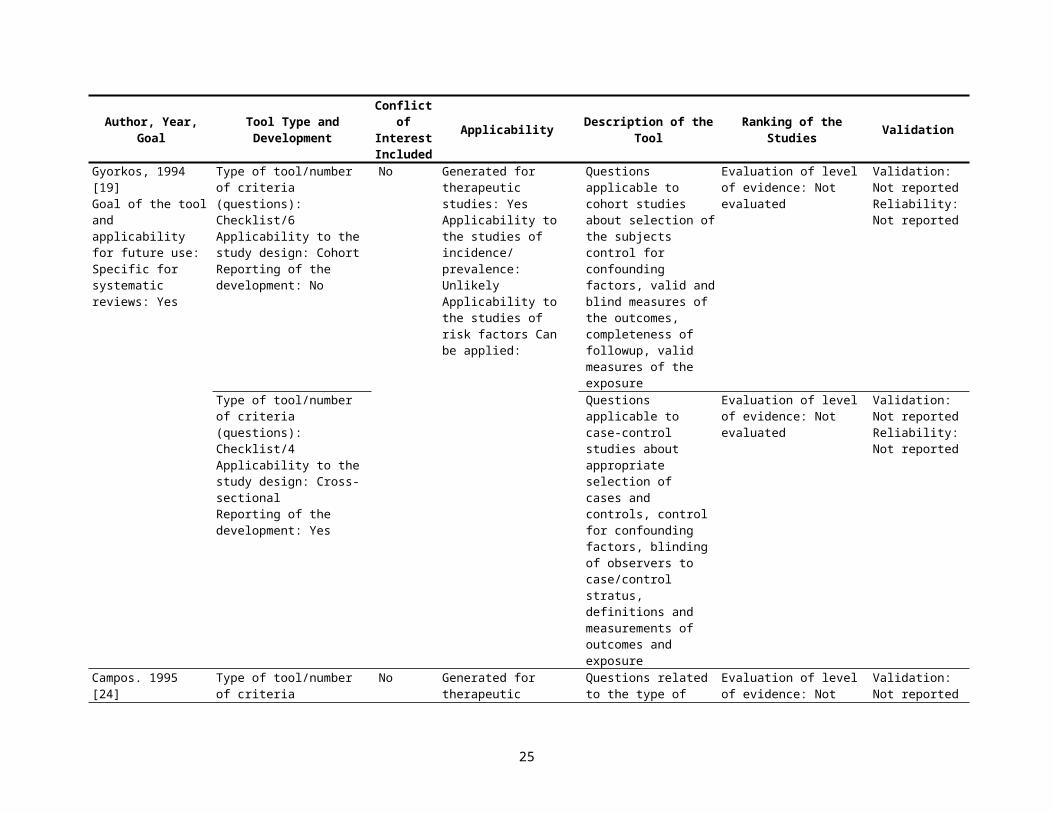
Gyorkos, 1994 [19]Goal of the tool and
Type of tool/number of criteria (questions):
No Generated for therapeutic studies: Yes
Questions applicable to cross-sectional studies
Evaluation of level of evidence: Not evaluated
Validation: Not reported
13

Author, Year, Goal Tool Type and Development
Conflict of Interest Included
Applicability Description of the Tool Ranking of the Studies Validation
applicability for future use: Specific for systematic reviews-development of practice guidelines for community health interventions: Yes
Checklist/5 Applicability to the study design: Case-controlReporting of the development: Based on community health practice Guideline working group
Applicability to the studies of incidence/ prevalence: UnlikelyApplicability to the studies of risk factors: Can be applied
about selection of the study population, control for confounding factors, valid measures of exposure and outcomes
Reliability: Not reported
Cho, 1994 [20]Goal of the tool and applicability for future use: Critical appraisal- quality of observational drug studies: Yes
Type of tool/number of criteria (questions): Scale/18
Applicability to the study design: Case-control/cohort/ cross-sectionalReporting of the development: modified Spitzer et al to apply for both, interventions and observational studies
No Generated for therapeutic studies: YesApplicability to the studies of incidence/ prevalence: UnlikelyApplicability to the studies of risk factors: Can be applied
15 questions related to selection of the patients, sample size, blinding of the investigators, and patients when possible, attrition of the patients’, assessments is included in the analysis of confounding factors, appropriateness of stat analysis. The responses were scored as 2 for "Yes,” 1 for "partial," and 0 for “not applicable.” Study design was scored from 5 for RCT to 1 for case-series. Total points were divided by max points for each item to calculate the fraction from 0 to 1.
Weighting of study design (RCT), blinding, stat analysis, and justified conclusionsEvaluation of level of evidence: Not evaluated
Validation: Not reportedReliability: Not reported
Levine, 1994 [21]Goal of the tool and applicability for future use: Critical appraisal- quality checklist for the studies of harm from the Evidence-Based Medicine Working Group: Yes
Type of tool/number of criteria (questions): Checklist/7 Applicability to the study design: Case-control/cohortReporting of the development: No
No Generated for therapeutic studies: YesApplicability to the studies of incidence/ prevalence: UnlikelyApplicability to the studies of risk factors: Can be applied
7 questions related to baseline similarity among the patients’ length of followup, measurements of the outcomes, applicability to a clinical practice
Checklist includes criteria of causality: temporality and strength of evidenceEvaluation of level of evidence: Not evaluated
Validation: Not reportedReliability: Not reported
Goodman, 1994 [22]Goal of the tool and applicability for future use: Specific for the
Type of tool/number of criteria (questions): Scale/ 34Applicability to the study
No Generated for therapeutic studies: YesApplicability to the studies of incidence/
Manuscript quality assessment tool of 34 items to evaluate the quality of the research
Evaluation of level of evidence: Not evaluated
Validation: Not reportedReliability: Intraclass
14
Author, Year, Goal Tool Type and Development
Conflict of Interest Included
Applicability Description of the Tool Ranking of the Studies Validation
publication-evaluation of the effects of peer review and editing on manuscript quality: Yes
design: Case-control/cohortReporting of the development: modified from Chalmers et al and Pocock et al
prevalence: UnlikelyApplicability to the studies of risk factors: Yes
report, not the quality of the research itself. Each item was scored on a 1 to 5 scale. Questions about settings of the study, eligibility criteria, and dropouts are related to generalizability of the results. Control for confounding is related to internal validity.
correlation 25%
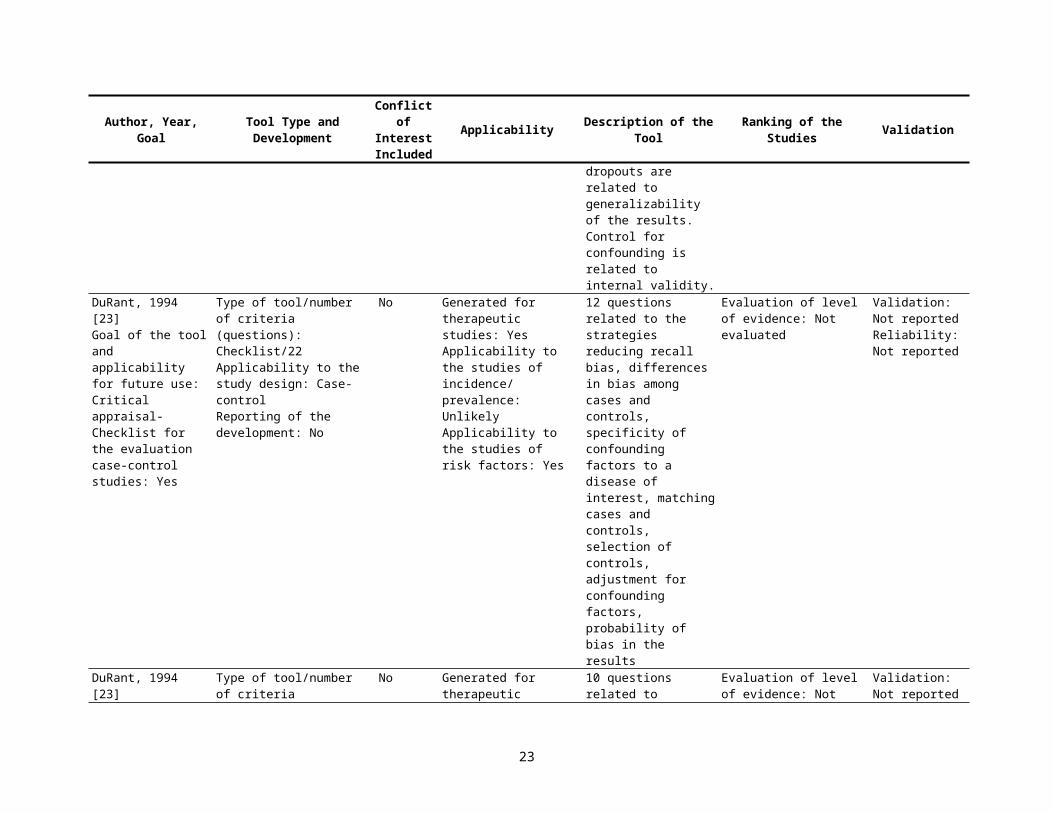
DuRant, 1994 [23]Goal of the tool and applicability for future use: Critical appraisal- Checklist for the evaluation case-control studies: Yes
Type of tool/number of criteria (questions): Checklist/22 Applicability to the study design: Case-controlReporting of the development: No
No Generated for therapeutic studies: YesApplicability to the studies of incidence/ prevalence: UnlikelyApplicability to the studies of risk factors: Yes
12 questions related to the strategies reducing recall bias, differences in bias among cases and controls, specificity of confounding factors to a disease of interest, matching cases and controls, selection of controls, adjustment for confounding factors, probability of bias in the results
Evaluation of level of evidence: Not evaluated
Validation: Not reportedReliability: Not reported
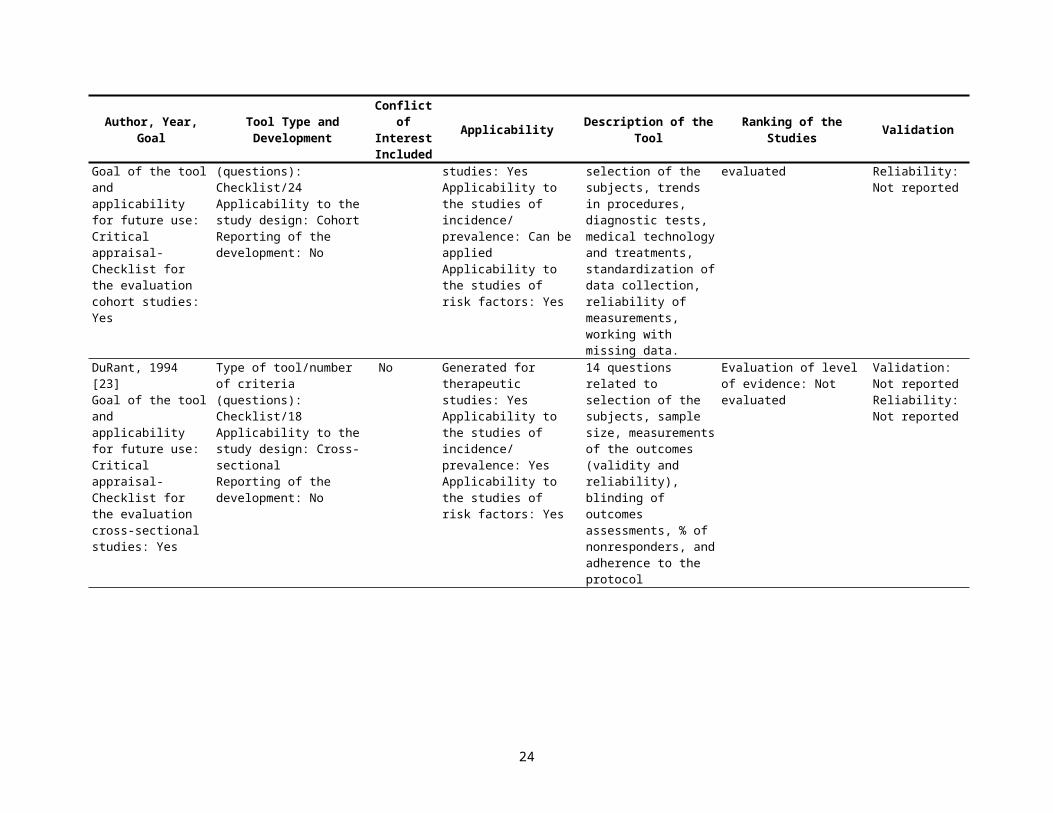
DuRant, 1994 [23]Goal of the tool and applicability for future use: Critical appraisal- Checklist for the evaluation cohort studies: Yes
Type of tool/number of criteria (questions): Checklist/24 Applicability to the study design: CohortReporting of the development: No
No Generated for therapeutic studies: YesApplicability to the studies of incidence/ prevalence: Can be appliedApplicability to the studies of risk factors: Yes
10 questions related to selection of the subjects, trends in procedures, diagnostic tests, medical technology and treatments, standardization of data collection, reliability of measurements, working with missing data.
Evaluation of level of evidence: Not evaluated
Validation: Not reportedReliability: Not reported
DuRant, 1994 [23]Goal of the tool and applicability for future use: Critical appraisal- Checklist for the evaluation cross-sectional studies: Yes
Type of tool/number of criteria (questions): Checklist/18 Applicability to the study design: Cross-sectionalReporting of the development: No
No Generated for therapeutic studies: YesApplicability to the studies of incidence/ prevalence: YesApplicability to the studies of risk factors:
14 questions related to selection of the subjects, sample size, measurements of the outcomes (validity and reliability), blinding of outcomes assessments,
Evaluation of level of evidence: Not evaluated
Validation: Not reportedReliability: Not reported
15
Author, Year, Goal Tool Type and Development
Conflict of Interest Included
Applicability Description of the Tool Ranking of the Studies Validation
Yes % of nonresponders, and adherence to the protocol
Gyorkos, 1994 [19]Goal of the tool and applicability for future use: Specific for systematic reviews: Yes
Type of tool/number of criteria (questions): Checklist/6 Applicability to the study design: CohortReporting of the development: No
No Generated for therapeutic studies: Yes Applicability to the studies of incidence/ prevalence: Unlikely Applicability to the studies of risk factors Can be applied:
Questions applicable to cohort studies about selection of the subjects control for confounding factors, valid and blind measures of the outcomes, completeness of followup, valid measures of the exposure
Evaluation of level of evidence: Not evaluated
Validation: Not reportedReliability: Not reported
Type of tool/number of criteria (questions): Checklist/4 Applicability to the study design: Cross-sectionalReporting of the development: Yes
Questions applicable to case-control studies about appropriate selection of cases and controls, control for confounding factors, blinding of observers to case/control stratus, definitions and measurements of outcomes and exposure
Evaluation of level of evidence: Not evaluated
Validation: Not reportedReliability: Not reported
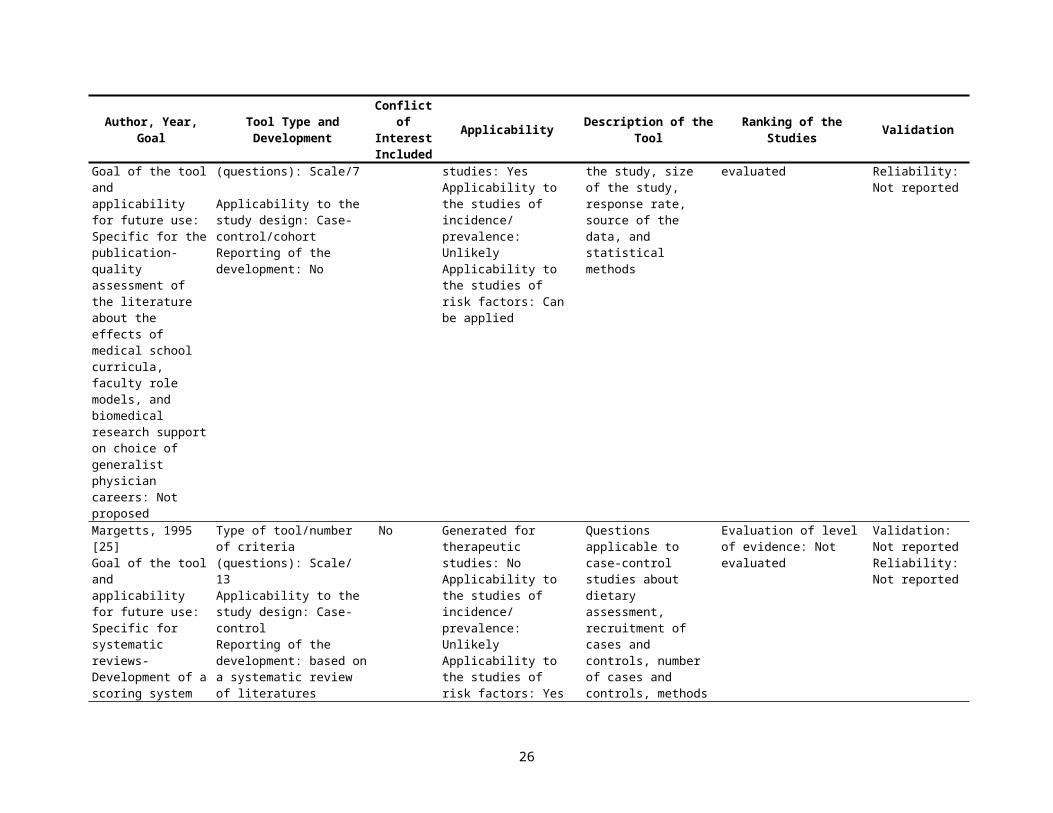
Campos. 1995 [24]Goal of the tool and applicability for future use: Specific for the publication-quality assessment of the literature about the effects of medical school curricula, faculty role models, and biomedical research support on choice of generalist physician careers: Not proposed
Type of tool/number of criteria (questions): Scale/7
Applicability to the study design: Case-control/cohortReporting of the development: No
No Generated for therapeutic studies: YesApplicability to the studies of incidence/ prevalence: UnlikelyApplicability to the studies of risk factors: Can be applied
Questions related to the type of the study, size of the study, response rate, source of the data, and statistical methods
Evaluation of level of evidence: Not evaluated
Validation: Not reportedReliability: Not reported
Margetts, 1995 [25] Type of tool/number of No Generated for Questions applicable to Evaluation of level of Validation: Not
16
Author, Year, Goal Tool Type and Development
Conflict of Interest Included
Applicability Description of the Tool Ranking of the Studies Validation
Goal of the tool and applicability for future use: Specific for systematic reviews-Development of a scoring system to judge the scientific quality of information from case-control and cohort studies of nutrition and disease: Yes
criteria (questions): Scale/ 13Applicability to the study design: Case-controlReporting of the development: based on a systematic review of literatures specific for a research question
therapeutic studies: NoApplicability to the studies of incidence/ prevalence: UnlikelyApplicability to the studies of risk factors: Yes
case-control studies about dietary assessment, recruitment of cases and controls, number of cases and controls, methods to collect the data, and control for confounding factors
evidence: Not evaluated reportedReliability: Not reported
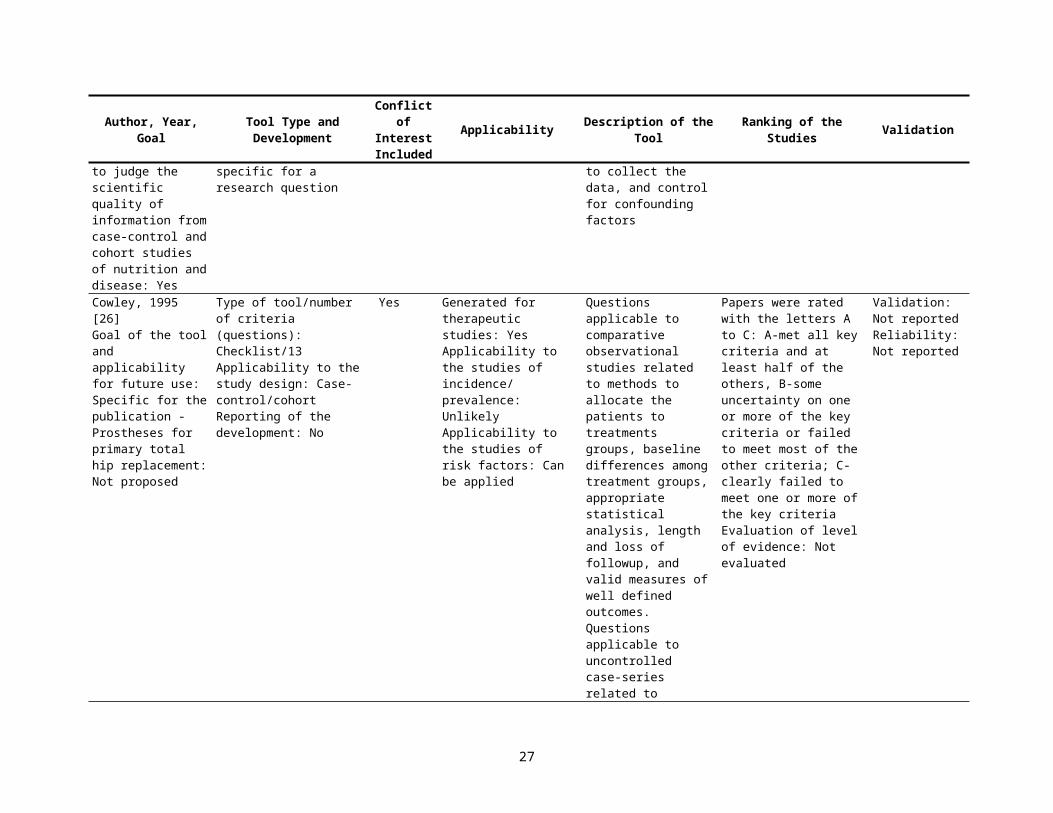
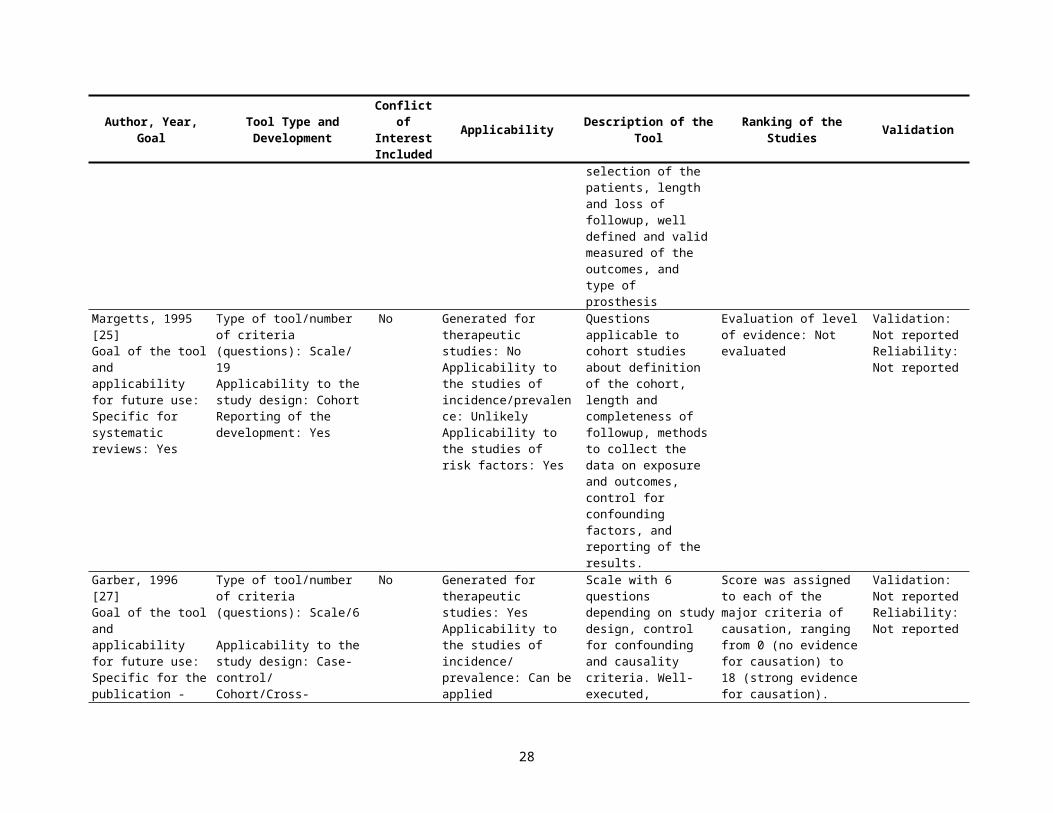
Cowley, 1995 [26]Goal of the tool and applicability for future use: Specific for the publication - Prostheses for primary total hip replacement: Not proposed
Type of tool/number of criteria (questions): Checklist/13 Applicability to the study design: Case-control/cohortReporting of the development: No
Yes Generated for therapeutic studies: YesApplicability to the studies of incidence/ prevalence: UnlikelyApplicability to the studies of risk factors: Can be applied
Questions applicable to comparative observational studies related to methods to allocate the patients to treatments groups, baseline differences among treatment groups, appropriate statistical analysis, length and loss of followup, and valid measures of well defined outcomes. Questions applicable to uncontrolled case-series related to selection of the patients, length and loss of followup, well defined and valid measured of the outcomes, and type of prosthesis
Papers were rated with the letters A to C: A-met all key criteria and at least half of the others, B-some uncertainty on one or more of the key criteria or failed to meet most of the other criteria; C-clearly failed to meet one or more of the key criteriaEvaluation of level of evidence: Not evaluated
Validation: Not reportedReliability: Not reported
Margetts, 1995 [25]Goal of the tool and applicability for future use: Specific for systematic reviews:
Type of tool/number of criteria (questions): Scale/ 19 Applicability to the study design: Cohort
No Generated for therapeutic studies: NoApplicability to the studies of incidence/prevalence:
Questions applicable to cohort studies about definition of the cohort, length and complete-ness of followup,
Evaluation of level of evidence: Not evaluated
Validation: Not reportedReliability: Not reported
17
Author, Year, Goal Tool Type and Development
Conflict of Interest Included
Applicability Description of the Tool Ranking of the Studies Validation
Yes Reporting of the development: Yes
UnlikelyApplicability to the studies of risk factors: Yes
methods to collect the data on exposure and outcomes, control for confounding factors, and reporting of the results.
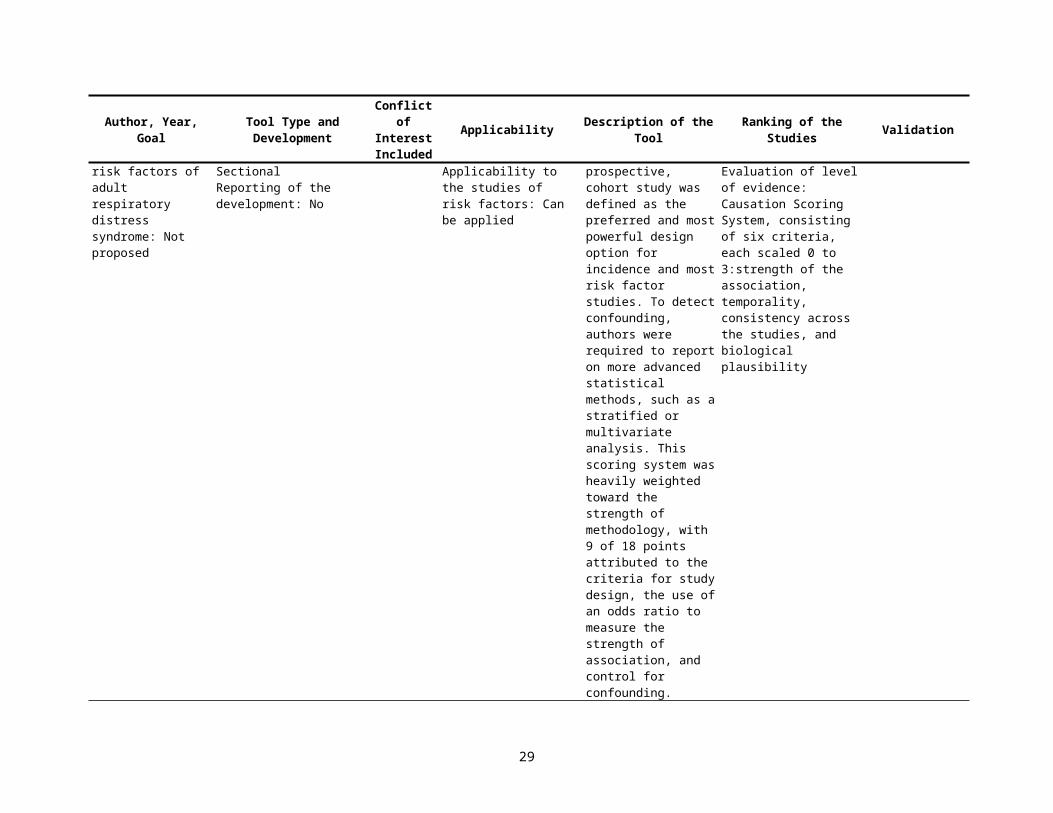
Garber, 1996 [27]Goal of the tool and applicability for future use: Specific for the publication - risk factors of adult respiratory distress syndrome: Not proposed
Type of tool/number of criteria (questions): Scale/6
Applicability to the study design: Case-control/ Cohort/Cross-SectionalReporting of the development: No
No Generated for therapeutic studies: YesApplicability to the studies of incidence/ prevalence: Can be appliedApplicability to the studies of risk factors: Can be applied
Scale with 6 questions depending on study design, control for confounding and causality criteria. Well-executed, prospective, cohort study was defined as the preferred and most powerful design option for incidence and most risk factor studies. To detect confounding, authors were required to report on more advanced statistical methods, such as a stratified or multivariate analysis. This scoring system was heavily weighted toward the strength of methodology, with 9 of 18 points attributed to the criteria for study design, the use of an odds ratio to measure the strength of association, and control for confounding.
Score was assigned to each of the major criteria of causation, ranging from 0 (no evidence for causation) to 18 (strong evidence for causation). Evaluation of level of evidence: Causation Scoring System, consisting of six criteria, each scaled 0 to 3:strength of the association, temporality, consistency across the studies, and biological plausibility
Validation: Not reportedReliability: Not reported
Anders, 1996 [28]Goal of the tool and applicability for future use: Specific for the publication - failure rates of measles vaccines: Not
Type of tool/number of criteria (questions): Scale/6
Applicability to the study design: CohortReporting of the development: No
No Generated for therapeutic studies: YesApplicability to the studies of incidence/prevalence: UnlikelyApplicability to the
The quality score added one point (0 through 6) for each of the following criteria: a community-based study; the active followup of a cohort; an accounting of dropouts;
Evaluation of level of evidence: Not evaluated
Validation: Not reportedReliability: Not reported
18
Author, Year, Goal Tool Type and Development
Conflict of Interest Included
Applicability Description of the Tool Ranking of the Studies Validation
proposed studies of risk factors : Can be applied
the documentation of disease by specified clinical criteria (acute and convalescent); and the documentation of vaccination from medical records
Hadorn,1996 [29]Goal of the tool and applicability for future use: Critical appraisal- Rating the Quality of Evidence for Clinical Practice Guidelines, from the Heart Failure Panel: Yes
Type of tool/number of criteria (questions): Checklist/24 Applicability to the study design: CohortReporting of the development: modified AHRQ checklist and Chalmers et al quality criteria for RCTs
No Generated for therapeutic studies: YesApplicability to the studies of incidence/ prevalence: UnlikelyApplicability to the studies of risk factors: Can be applied
Major and minor flaws were identified for 8 major components of quality including selection of the patients, allocation of patients to the treatment groups, therapeutic regime, study execution, withdrawals from the study, patient blinding, outcomes measurements, and statistical analysis
Evaluation of level of evidence: Yes, seven-level hierarchy based on USPTF criteria that were collapsed into three levels: “A,” “B,” and “C.” A-level evidence consisted of levels l-3 in our evidence hierarchy; B-level evidence consisted of levels 4-6, and C-level evidence (level 7) was reserved for expert opinion.
Validation: Not reportedReliability: Not reported
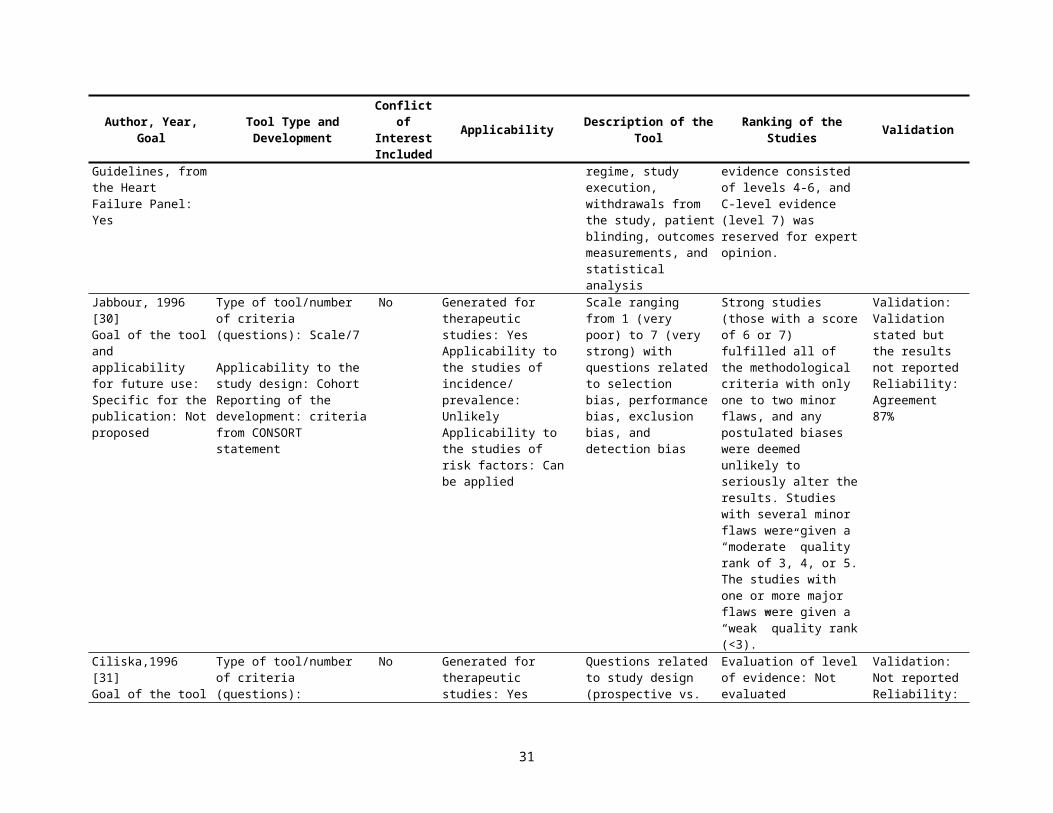
Jabbour, 1996 [30]Goal of the tool and applicability for future use: Specific for the publication: Not proposed
Type of tool/number of criteria (questions): Scale/7
Applicability to the study design: CohortReporting of the development: criteria from CONSORT statement
No Generated for therapeutic studies: YesApplicability to the studies of incidence/ prevalence: UnlikelyApplicability to the studies of risk factors: Can be applied
Scale ranging from 1 (very poor) to 7 (very strong) with questions related to selection bias, performance bias, exclusion bias, and detection bias
Strong studies (those with a score of 6 or 7) fulfilled all of the methodological criteria with only one to two minor flaws, and any postulated biases were deemed unlikely to seriously alter the results. Studies with several minor flaws were given a “moderate” quality rank of 3, 4, or 5. The studies with one or more major flaws were given a “weak” quality rank (<3).
Validation: Validation stated but the results not reportedReliability: Agreement 87%
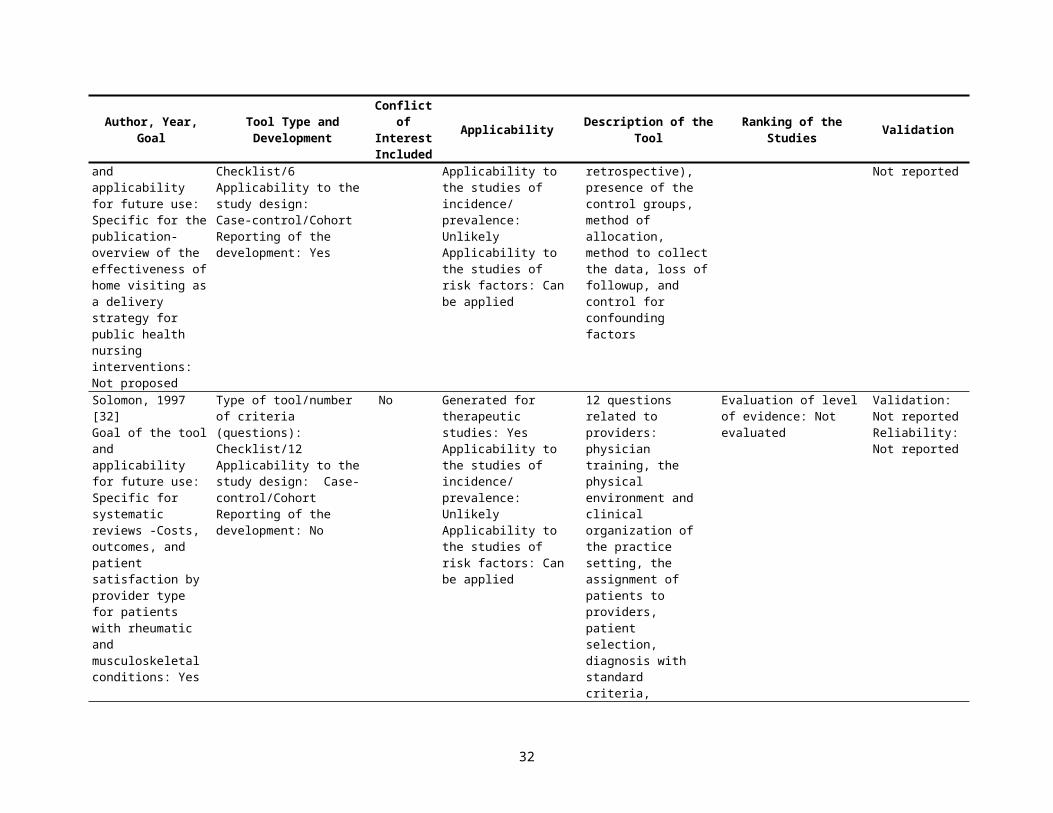
Ciliska,1996 [31]Goal of the tool and applicability for future use: Specific for the publication-overview
Type of tool/number of criteria (questions): Checklist/6 Applicability to the study design:
No Generated for therapeutic studies: YesApplicability to the studies of incidence/ prevalence: Unlikely
Questions related to study design (prospective vs. retrospective), presence of the control
Evaluation of level of evidence: Not evaluated
Validation: Not reportedReliability: Not reported
19

Author, Year, Goal Tool Type and Development
Conflict of Interest Included
Applicability Description of the Tool Ranking of the Studies Validation
of the effectiveness of home visiting as a delivery strategy for public health nursing interventions: Not proposed
Case-control/CohortReporting of the development: Yes
Applicability to the studies of risk factors: Can be applied
groups, method of allocation, method to collect the data, loss of followup, and control for confounding factors
Solomon, 1997 [32]Goal of the tool and applicability for future use: Specific for systematic reviews -Costs, outcomes, and patient satisfaction by provider type for patients with rheumatic and musculoskeletal conditions: Yes
Type of tool/number of criteria (questions): Checklist/12 Applicability to the study design: Case-control/Cohort Reporting of the development: No
No Generated for therapeutic studies: YesApplicability to the studies of incidence/ prevalence: UnlikelyApplicability to the studies of risk factors: Can be applied
12 questions related to providers: physician training, the physical environment and clinical organization of the practice setting, the assignment of patients to providers, patient selection, diagnosis with standard criteria, baseline similarities in comparison groups, adjustment for differences, power to detect the effect of interventions, and valid, blinded measurement of the outcomes. The possible responses "yes” or “no” were used to group the studies.
Evaluation of level of evidence: Not evaluated
Validation: Not reportedReliability: Not reported
Littenberg,1998 [33]Goal of the tool and applicability for future use: Specific for the publication - meta-analysis of three treatments for closed fractures of the tibial shaft: Not proposed
Type of tool/number of criteria (questions): Scale/15 Applicability to the study design: Case-control/ Cohort/Cross-Sectional Reporting of the development: No
No Generated for therapeutic studies: YesApplicability to the studies of incidence/ prevalence: UnlikelyApplicability to the studies of risk factors: Can be applied
15-point quality score to evaluate the followup measures and the research design for each study using 4 questions related to blinding of the reviewers of outcomes, >85% of followup, subjective measure of patient outcomes, prospective followup for the purpose of the
Evaluation of level of evidence: Not evaluated
Validation: Not reportedReliability: Not reported
20

Author, Year, Goal Tool Type and Development
Conflict of Interest Included
Applicability Description of the Tool Ranking of the Studies Validation
study. A response of clearly yes=3 points, probably yes=2 points, probably no=1 point, and clearly no=0 points. Research design was the final component of the quality score: a randomized, comparative study was given 3 points; a nonrandomized, comparative study was given 2 points; and a case-series report was given 0 points.
Spencer-Green, 1998 [34]Goal of the tool and applicability for future use: Specific for systematic reviews-Prediction of secondary disorder in patients with Raynaud phenomenon: Not proposed
Type of tool/number of criteria (questions): Scale/16Applicability to the study design: Case-control, Cross-Sectional Reporting of the development: modified from Mulrow et al
No Generated for therapeutic studies: NoApplicability to the studies of incidence/ prevalence: UnlikelyApplicability to the studies of risk factors: Yes
16 questions weighted for exclusion of a preexisting disease at entry, detailed description of patients at followup whose disease evolved during the period of observation, the use of classification criteria for diagnosing secondary disease (the “gold standard”), and examination of patients at entry and followup For each variable, a value of 0 (criterion not met) or 2 (criterion satisfied) was assigned and this value was multiplied by a previously assigned weighted value of 1, 3, or 5.
For each analysis, transition rates of patients were compared from the “top” half and the “bottom” half of the scale.Evaluation of level of evidence: Not evaluated
Validation: Not reportedReliability: Not reported
21
Author, Year, Goal Tool Type and Development
Conflict of Interest Included
Applicability Description of the Tool Ranking of the Studies Validation
Kreulen, 1998 [35]Goal of the tool and applicability for future use: Specific for the publication Meta-analysis of anterior veneer restorations in clinical studies: Not proposed
Type of tool/number of criteria (questions): Scale/16 Applicability to the study design: Cross-sectional reporting of the development: modified from Antczak, A. A., Tang, J. and Chalmers, T. C., Quality assessment of randomized control trials in dental research (II). Results: periodontal research. Journal of Periodontal Research1, 986, 2 1, 315-321.
No Generated for therapeutic studies: YesApplicability to the studies of incidence/ prevalence: UnlikelyApplicability to the studies of risk factors: Can be applied
Items were classified to four main fields, i.e. study methodology, dental methodology, evaluation methodology, and statistical methodology. Each item was assigned full credit, partial credit or no credit. Scores 3, 2, and 1 were attached to the credit qualifications and scores were summed. The total score of each main field was weighted by a factor that was expected to reveal the importance of that field regarding the performance of clinical studies. The total score of the studies was transferred to an 0-l scale by the factor 0.0125.
Evaluation of level of evidence: Not evaluated
Validation: Not reportedReliability: Agreement 64%
Jadad, 1998 [36]Goal of the tool and applicability for future use: Critical appraisal- Guides for reading and interpreting quality of the studies in systematic reviews: Yes
Type of tool/number of criteria (questions): Checklist/8Applicability to the study design: Systematic reviewsReporting of the development: No
Yes Generated for therapeutic studies: YesApplicability to the studies of incidence/prevalence: UnlikelyApplicability to the studies of risk factors: Can be applied
Criteria for individuals trials: (1) to answer clear and relevant clinical questions, (2) to be designed, conducted, and reported by researchers who did not have conflicts of interest, (3) to follow strict ethical principles, (4) to include all patients available, (5) to evaluate all possible interventions for all possible variations of the conditions of interest, in all possible types of patients, in all settings,
Approaches to incorporate quality assessments into systematic reviews: (1) to include or exclude trials from a review; (2) to conduct sensitivity analyses allowing comparisons between the results of trials with different quality; (3) to display graphically the results of each of the trials according to their quality (e.g., the trials are displayed in descending order, starting with the
Validation: Not reportedReliability: Not reported
22
Author, Year, Goal Tool Type and Development
Conflict of Interest Included
Applicability Description of the Tool Ranking of the Studies Validation
and using all relevant outcome measures, (6) to include strategies to eliminate bias during the administration of the interventions, during the evaluation of the outcomes, and during reporting of the results, thus reflecting the true effect of the interventions, (7) to include perfect statistical analyses, and (8) to be described in clear and unambiguous language, including an exact account of all the events that occurred during the design and conduct of the trial, individual patient data, and an accurate description of the patients who were included, excluded, and withdrawn and who dropped out.
one with the highest quality); (4) to perform cumulative meta-analyses using quality assessments as the input sequence; and (5) to weight trials according to their quality. Evaluation of level of evidence: Not evaluated
Borghouts,1998 [37]Goal of the tool and applicability for future use: Specific for the publication-prognostic factors of nonspecific neck pain: Not proposed
Type of tool/number of criteria (questions): Scale/13 Applicability to the study design: Cohort Reporting of the development: The criteria were adapted from Von Korff (1994), Sackett et al. (1991) and Cole and Hudak (1996) and modified to cover the topic of the review
No Generated for therapeutic studies: NoApplicability to the studies of incidence/ prevalence: Can be applied Applicability to the studies of risk factors: Yes
Thirteen criteria were divided into five categories according to: study population, study design, followup, outcome measures, and analysis/data presentation. Each item of a selected study which met our criteria, was assigned a “+” (positive). If the item did not meet our criteria or was insufficiently or not
Studies scoring 50% or more of the maximum attainable score were, arbitrarily, considered to be of “high quality.” All studies scoring less than 50% were rated as ‘low quality Evaluation of level of evidence: Not evaluated
Validation: Not reported Reliability: Agreement 86%
23
Author, Year, Goal Tool Type and Development
Conflict of Interest Included
Applicability Description of the Tool Ranking of the Studies Validation
described at all, a “-” was assigned.
Downs, 1998 [38]Goal of the tool and applicability for future use: Critical appraisal-methodological quality both of randomized and nonrandomized studies of health care interventions: Yes
Type of tool/number of criteria (questions): Scale/17 Applicability to the study design: Case-control/Cohort Reporting of the development: developed based on epidemiological principles, reviews of study designs (Sackett DL et al) and existing checklists for the assessment of randomized controlled trials (Standards of Reporting Trials Group)
No Generated for therapeutic studies: YesApplicability to the studies of incidence/ prevalence: NoApplicability to the studies of risk factors: Can be applied
The pilot checklist consisted of 26 items distributed between five sub-scales: 1. Reporting (9 items) 2. External validity (3 items) 3. Bias (7 items) 4. Confounding (6 items)
5. Power (1 item). Answers were scored 0 or 1, except for one item in the reporting subscale, which scored 0 to 2 and the single item on power, which was scored 0 to 5. The total maximum possible score was 31.
Evaluation of level of evidence: Not evaluated
Validation: Validated using the Standards of Reporting Trials Group, correlation 0.90Internal consistency 89%; test-retest reliability 88%; inter-rater reliability 75%
Loney, 1998 [39]Goal of the tool and applicability for future use: Critical appraisal for the studies of incidence or prevalence: Yes
Type of tool/number of criteria (questions): Scale/6 Applicability to the study design: Case-control/ Cohort/Cross-Sectional Reporting of the development: No
No Generated for therapeutic studies: NoApplicability to the studies of incidence/prevalence: YesApplicability to the studies of risk factors: No
Three clusters of the questions about study validity, applicability, and the interpretations of the results, total 8 questions. Each item was assigned a score of 1 point, making 8 the maximum score possible. Quality tables included total scores with explanation of items that lowered the score.
Evaluation of level of evidence: Not evaluated
Validation: Validation against Chalmer et al appraisalReliability: Agreement 79%
Silman, 1999 [40]Goal of the tool and applicability for future use: Critical appraisal- reporting
Type of tool/number of criteria (questions): Checklist/8Applicability to the study design: Case-control/Cohort
No Generated for therapeutic studies: YesApplicability to the studies of incidence/ prevalence: Unlikely
Checklist with 8 questions related to study design (retrospective, prospective, mixed),
Evaluation of level of evidence: Not evaluated
Validation: Not reportedReliability: Not reported
24
Author, Year, Goal Tool Type and Development
Conflict of Interest Included
Applicability Description of the Tool Ranking of the Studies Validation
requirements for longitudinal observational studies in rheumatology: Yes
Reporting of the development: No
Applicability to the studies of risk factors: Yes
case selection, sources to measure exposure and outcomes, reliability and validity of measurements, baseline differences, observer blindness to exposure status, analyses to reduce bias (missing data, loss of followup)
van Rooyen, 1999 [41]Goal of the tool and applicability for future use: CA for Assessing Peer Reviews of Manuscripts/Yes
Type of tool/number of criteria (questions): Scale/8Applicability to the study design: Case-control/Cohort Reporting of the development: based on Streiner et al and McDowell et al.
No Generated for therapeutic studies: YesApplicability to the studies of incidence/ prevalence: UnlikelyApplicability to the studies of risk factors: Can be applied
The instrument consisted of eight items, each scored on a 5-point Likert scale (1 poor, 5 excellent): Importance, Originality, Method, Presentation, Constructiveness of comments, Substantiation of comments, Interpretation of results, Global item
Evaluation of level of evidence: Not evaluated
Validation: Face validity was assessed three times—first by a consensus development group of four researchers and three editors, second by two BMJ editors, and third by 11 BMJ editors.Reliability: Not reported
Angelillo, 1999 [42]Goal of the tool and applicability for future use: Specific for systematic reviews-Residential exposure to electromagnetic fields and childhood leukemia: a meta-analysis: Not proposed
Type of tool/number of criteria (questions): Checklist/18 for any study design plus 6 for case-control or 6 for cohort studies. Applicability to the study design: Cohort, Case-control Reporting of the development: modified checklist by Chalmers et al
No Generated for therapeutic studies: NoApplicability to the studies of incidence/ prevalence: UnlikelyApplicability to the studies of risk factors: Yes
Checklist with questions related to validation of the measures, appropriate statistical testing and sample size, response and followup rate, and sampling of cases and control from the same population independent on exposure status
High quality studies with compliance to checklists above median, low quality with compliance to checklists below medianEvaluation of level of evidence: Not evaluated
Validation: Not reportedReliability: Not reported
Corrao, 1999 [43]Goal of the tool and applicability for future use: Specific for the
Type of tool/number of criteria (questions): Scale/16 Applicability to the study
No Generated for therapeutic studies: NoApplicability to the studies of incidence/
Questions related to the study design (nine questions), the alcohol consumption data
Evaluation of level of evidence: Not evaluated
Validation: Not reportedReliability: Not reported
25
Author, Year, Goal Tool Type and Development
Conflict of Interest Included
Applicability Description of the Tool Ranking of the Studies Validation
publication - dose-response relationship between alcohol consumption and the risk of several alcohol-related conditions: Not proposed
design: Case-control/CohortReporting of the development: No
prevalence: Can be appliedApplicability to the studies of risk factors: Yes
collection methods (four questions) and the data analysis (two questions). The points awarded for each question were determined according to the question specific standard scale. Maximum scores were given when methods least likely to result in bias had been used. The quality score for a study was obtained by adding up the points given for individual questions. For a perfect study, the sum of points would be 21.
Cullum, 1999 [44]Goal of the tool and applicability for future use: Critical appraisal- appraising cohort studies for causation and prognosis: Yes
Type of tool/number of criteria (questions): Checklist/4 Applicability to the study design: Cohort, Systematic reviews of Cohort studies Reporting of the development: based on Sackett et al appraisal for studies of causation and prognosis
No Generated for therapeutic studies: NoApplicability to the studies of incidence/prevalence: UnlikelyApplicability to the studies of risk factors: Yes
4 questions about baseline differences among exposed and nonexposed, validation and blinding of the methods to measure outcomes and exposure in comparison groups and length of followup.
Evaluation of level of evidence: The question contains criteria of causation including temporality, dose-response, consistency across the studies, and biological plausibility.
Validation: Not reportedReliability: Not reported
26
Author, Year, Goal Tool Type and Development
Conflict of Interest Included
Applicability Description of the Tool Ranking of the Studies Validation
Nguyen, 1999 [45]Goal of the tool and applicability for future use: Specific for the publication - relationship between sagittal distance between upper and lower incisors and traumatic dental injuries: Not proposed
Type of tool/number of criteria (questions): Scale/14 Applicability to the study design: Case-control/ Cohort/Cross-SectionalReporting of the development: No
No Generated for therapeutic studies: NoApplicability to the studies of incidence/ prevalence: Can be applied Applicability to the studies of risk factors: Yes
Methodological checklist for observational studies was developed with two categories of criterions related to internal and external validity resulting in a total score between 0 and 100.
Evaluation of level of evidence: Not evaluated
Validation: Not reportedReliability: Not reported
Cameron, 2000 [46]Goal of the tool and applicability for future use: Specific for the publication - Geriatric rehabilitation following fractures in older people: Yes
Type of tool/number of criteria (questions): Checklist and the scale/36 Applicability to the study design: Case-control/CohortReporting of the development: No
No Generated for therapeutic studies: YesApplicability to the studies of incidence/ prevalence: UnlikelyApplicability to the studies of risk factors: Can be applied
Checklist with questions related to internal and external validity criteria and the scale with 9-item quality assessment score for included trials. Selection bias was examined by allocation assignment and concealment and comparability of the treatment groups, detection/attrition bias were examined by intention to treat, losses of followup, and blinding of the treatment status, external validity was estimated by the length of followup and representativeness of the study sample.
Attribution of scores 11-14 Relevant comparative study with low risk of selection bias 5-10 Relevant comparative study with moderate to high risk of selection bias <5 Comparative study of low relevance or high risk of bias Evaluation of level of evidence: Not evaluated
Validation: Not reportedReliability: Not reported
Ariens, 2000 [47]Goal of the tool and applicability for future use: Specific for the publication - physical factors for neck pain: Yes
Type of tool/number of criteria (questions): Scale/18 Applicability to the study design: Case-controlReporting of the development: modified from Cochrane collaboration
No Generated for therapeutic studies: NoApplicability to the studies of incidence/ prevalence: Can be appliedApplicability to the studies of risk factors:
Questions related to the purpose of the study, study design, exposure measurements, outcome measurements, data analysis and
Evaluation of level of evidence: USPTSF criteria to evaluate level of evidence and criteria of causality including size and direction of the association as well as consistency in the results
Validation: Not reportedReliability: Agreement 84%
27
Author, Year, Goal Tool Type and Development
Conflict of Interest Included
Applicability Description of the Tool Ranking of the Studies Validation
back review group for spinal disorders
Yes presentation. across studies
Type of tool/number of criteria (questions): Scale/17 Applicability to the study design: CohortType of tool/number of criteria (questions): Scale/13 Applicability to the study design: Cross-Sectional
Zeegers, 2000 [48]Goal of the tool and applicability for future use: Specific for systematic reviews-the association between cigarette smoking on urinary tract cancer risk: Not proposed
Type of tool/number of criteria (questions): Checklist/16Applicability to the study design: Cohort/Case-controlReporting of the development: Yes
No Generated for therapeutic studies: NoApplicability to the studies of incidence/ prevalence: UnlikelyApplicability to the studies of risk factors: Yes
16 questions: general information—year of publication, research design (case–control study, followup study, other, unknown), and geographic area; exposure information—exposure measurement, validation of exposure measurement, and reference period; case information—source cases, histologic confirmation cases (and percentage of transitional cell tumors); Case–control study information—source controls, response rate, and blinding of case status; followup study information—source study population, years of followup, blinding of exposure status, and completeness of followup.
Evaluation of level of evidence: Not evaluated
Validation: Not reportedReliability: Not reported
28
Author, Year, Goal Tool Type and Development
Conflict of Interest Included
Applicability Description of the Tool Ranking of the Studies Validation
Zaza, 2000 [49]Goal of the tool and applicability for future use: Specific for systematic reviews -quality evaluation in the Guide to Community Preventive Services: Yes
Type of tool/number of criteria (questions): Checklist/15 Applicability to the study design: Case-control/CohortReporting of the development: Yes
No Generated for therapeutic studies: YesApplicability to the studies of incidence/ prevalence: UnlikelyApplicability to the studies of risk factors: Can be applied
26 questions related to the content and 23 questions related to execution of the study; 6 categories of major biases in validity including sampling measurements, analysis, and interpretations of the results: bias in integrity of intervention, selection bias, measurement bias, misclassification bias, attrition bias.
Evaluation of level of evidence: Not evaluated
Validation: Not reportedReliability: described but not reported
Windt, 2000 [50]Goal of the tool and applicability for future use: Specific for the publication - Occupational risk factors for shoulder pain: Not proposed
Type of tool/number of criteria (questions): Scale/20 Applicability to the study design: Case-controlScale/18 Applicability to the study design: Cohort Scale/16 Applicability to the study design: Cross-SectionalReporting of the development: Modified version of the checklists for quality appraisal designed by Ariëns et. al. and Hoogendoorn et. al.
No Generated for therapeutic studies: NoApplicability to the studies of incidence/ prevalence: Can be appliedApplicability to the studies of risk factors: Yes
Different checklists were used for the quality assessment of cross sectional studies (17 items), case-control studies (21 items), and prospective cohort studies (19 items). Each item was scored as positive, negative (potential bias), or don’t know (unclear) if the paper provided insufficient information on a specific item.
The studies were ranked according to their total score for methodological quality (as a percentage of the maximum attainable score. The median (range) method score of the cross sectional studies was 60% (43%–83%). This score of 60% was used as a cutoff point to identify studies of relatively high methodological quality. Evaluation of level of evidence: Temporal relation and prospective cohort studies provide stronger evidence for causality than case-control or cross sectional studies. Relatively high methodological quality conclusions were based on studies with a method score equal to or higher than the median method
Validation: Not reportedReliability: Agreement 83.3%
29
Author, Year, Goal Tool Type and Development
Conflict of Interest Included
Applicability Description of the Tool Ranking of the Studies Validation
score of all publications in the review. Strong association: odds or risk ratio (RR) >2.0), significant (p<0.05), or a dose-response relation is established.Consistent results: At least 75% of the studies report a strong association for the risk factor at issue.
Steinberg, 2000 [51]Goal of the tool and applicability for future use: Specific for systematic reviews-the quality of evidence underlying the National Kidney Foundation-Dialysis Outcomes Quality Initiative Clinical Practice Guidelines: Yes
Type of tool/number of criteria (questions): Checklist/24 Applicability to the study design:Case-control/CohortReporting of the development: Yes
No Generated for therapeutic studies: YesApplicability to the studies of incidence/ prevalence: UnlikelyApplicability to the studies of risk factors: Can be applied
Basic aspects of study design as potential selection bias in assignment of patients to the groups being compared and potential bias in measurement of outcomes, adequacy of sample size, and appropriateness of statistical analyses performed. The sum of the scores for those aspects of study design that applied to a given article was then divided by the number of applicable questions, yielding a methods score for the article between 0 and 1. Total scored were categorized to 1=excellent, 2=very good, 3=good, 4=fair, 5=poor.
24 aspects of study design (the exact number depended on the type of study being reviewed) were rated as being fully, partially, or not fulfilled. Overall quality of each article that underwent a methods review was rated as excellent, very good, good, fair, or poor based on a global subjective judgment made by the methods reviewer. Finally, based on the results of these ratings, each article was assigned a grade of "a," "b," or "c." An "a" grade was assigned if at least 50% of the answers to the methods review questions that applied to the article were answered "yes." A grade of "b" was assigned when less than 50% of the answers to methods review questions that applied to the article were answered "yes." A
Validation: agreement in estimated level of evidence with USPSTF Quality of Evidence Category Reliability: Not reported
30
Author, Year, Goal Tool Type and Development
Conflict of Interest Included
Applicability Description of the Tool Ranking of the Studies Validation
"c" grade was assigned to an article when at least one of the following four criteria applied to the article: (1) important demographic and/or prognostic characteristics of the enrolled sample were not described, (2) outcome measurements were not made in a similar fashion in the patient groups being compared, (3) the article received a global subjective quality rating of poor, or (4) the article was a case reportEvaluation of level of evidence: The guideline rated level of evidence based on: (1) consider the type of study design used in each study (as recommended by the USPSTF), (2) determine whether there are design flaws or biases that may have affected either the internal or external validity of the study (as recom-mended by Chalmers et al) and (3) subjectively assign a rating (good, fair, or poor) to the overall quality of the study.
Harris, 2001 [52]Goal of the tool and applicability for future use: Guideline: Methods of the U.S. Preventive Services
Type of tool/number of criteria (questions): Checklist/4 for SR and 5 for case control studiesApplicability to the study design: Case-control,
No Generated for therapeutic studies: YesApplicability to the studies of incidence/ prevalence: UnlikelyApplicability to the
For case-control studies: Accurate ascertainment of casesNonbiased selection of cases/controls with exclusion criteria
Three category rating of the internal validity of each study: “good,” “fair,” and “poor.”Evaluation of level of evidence: Evaluating the
Validation: Not reportedReliability: Not reported
31
Author, Year, Goal Tool Type and Development
Conflict of Interest Included
Applicability Description of the Tool Ranking of the Studies Validation
Task Force A Review of the Process: Yes
Systematic reviewsReporting of the development: based on Feinstain and Lohr et al
studies of risk factors: Yes
applied equally to bothResponse rateDiagnostic testing procedures applied equally to each groupAppropriate attention to potential confounding variables.
quality of evidence at three strata:1. Individual study - Internal validity- External validity2. Linkage in the analytic framework-Aggregate internal validity-Aggregate external validity-Coherence/consistency3. Entire preventive service-Quality of the evidence from Stratum 2 for each linkage in the analytic framework-Degree to which there is a complete chain of linkages supported by adequate evidence to connect the preventive service to health outcomes- Degree to which the complete chain of linkages “fit” together- Degree to which the evidence connecting the preventive service and health outcomes is “direct”.Hierarchy of observational research design:II–2 Evidence obtained from well-designed cohort or case control analytic studies, preferably from more than one center or research group.II–3 Evidence obtained from multiple time series with or without the intervention. Dramatic results in uncontrolled
32

Author, Year, Goal Tool Type and Development
Conflict of Interest Included
Applicability Description of the Tool Ranking of the Studies Validation
experiments (such as the results of the introduction of penicillin treatment in the 1940s) could also be regarded as this type of evidence.
Harbour (the Scottish Intercollegiate Guidelines Network Grading Review Group), 2001 [53]Goal of the tool and applicability for future use: Critical appraisal- grading recommendations in evidence based guidelines: Yes
Type of tool/number of criteria (questions): Checklist/% items fulfilledApplicability to the study design: Systematic reviewsReporting of the development: based on SIGN guidelines
No Generated for therapeutic studies: YesApplicability to the studies of incidence/ prevalence: UnlikelyApplicability to the studies of risk factors: Can be applied
Quality rating for individual studies (adapted from Liddle et al)+ + Applies if all or most criteria from the checklist are fulfilled; where criteria are not fulfilled, the conclusions of the study or review are thought very unlikely to alter. + Applies if some of the criteria from the checklist are fulfilled; where criteria are not fulfilled or are not adequately described, the conclusions of the study or review are thought unlikely to alter.- Applies if few or no criteria from the checklist are fulfilled; where criteria are not fulfilled or are not adequately described, the conclusions of the study or review are thought likely or very likely to alter.
Revised grading system for recommendations in evidence based guidelines Levels of evidence 1++ High quality meta -analyses, systematic reviews of RCTs, or RCTs with a very low risk of bias1+ Well conducted meta -analyses, systematic reviews of RCTs, or RCTs with a low risk of bias1- Meta-analyses, systematic reviews or RCTs, or RCTs with a high risk of bias2++ High quality systematic reviews of case control or cohort studies or high quality case control or cohort studies with a very low risk of confounding, bias, or chance and a high probability that the relationship is causal2+ Well conducted case control or cohort studies with a low risk of confounding, bias, or chance and a moderate probability that the relationship is causal2- Case control or cohort studies with a high risk of confounding, bias, or
Validation: Not reportedReliability: Not reported
33
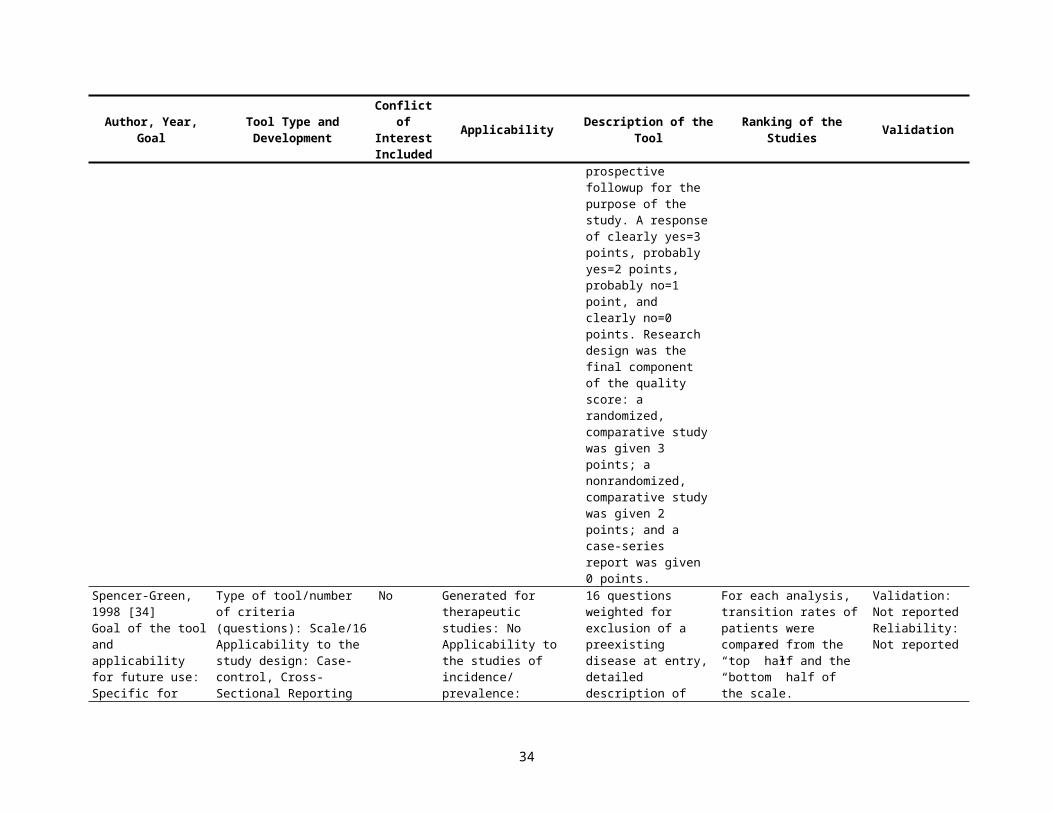
Author, Year, Goal Tool Type and Development
Conflict of Interest Included
Applicability Description of the Tool Ranking of the Studies Validation
chance and a significant risk that the relationship is not causal 3 No analytic studies, e.g. case reports, case series4 Expert opinionGrades of recommendations:A. At least one meta-analysis, systematic review, or RCT rated as 1++ and directly applicable to the target population or a systematic review of RCTs or a body of evidence consisting principally of studies rated as 1+ directly applicable to the target population and demonstrating overall consistency of resultsB. A body of evidence including studies rated as 2++ directly applicable to the target population and demonstrating overall consistency of results or extrapolated evidence from studies rated as 1++ or 1+C. A body of evidence including studies rated as 2+ directly applicable to the target population and demonstrating overall consistency of results or extrapolated evidence from studies rated as 2++D. Evidence level 3 or 4 or extrapolated evidence from studies rated as 2+
34
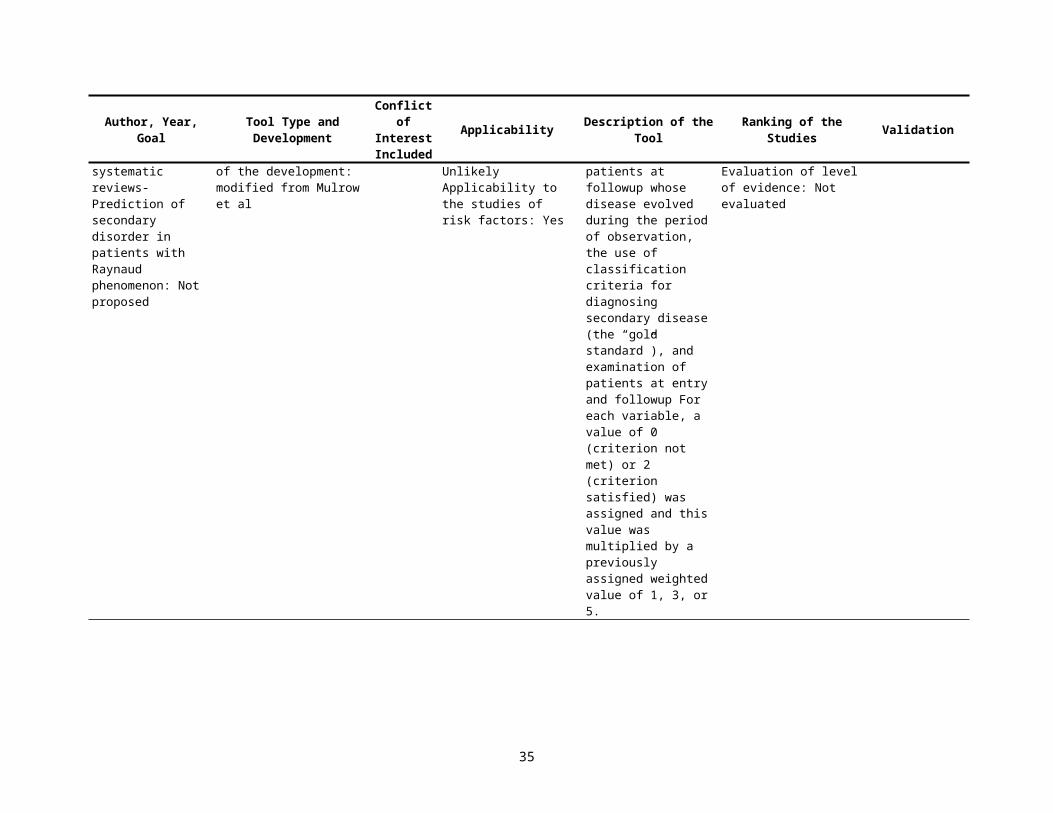
Author, Year, Goal Tool Type and Development
Conflict of Interest Included
Applicability Description of the Tool Ranking of the Studies Validation
Evaluation of level of evidence: by hierarchy of study types from the USPTF criteria
Macfarlane, 2001 [54]Goal of the tool and applicability for future use: Specific for the publication - quality assessment in SR of oro-facial pain: Not proposed
Type of tool/number of criteria (questions): Scale/6
Applicability to the study design: Case-control/ Cohort/Cross-Sectional Reporting of the development: modified Down et al
No Generated for therapeutic studies: NoApplicability to the studies of incidence/ prevalence: YesApplicability to the studies of risk factors: Yes
Scale with questions about reporting quality, judgmental external validity, and validity of the measurements. Calculation of total scores is not clear. The authors reported % of the papers classified with "Yes" response to the checklist.
Criteria of causality mentioned but not specified or included in the evaluation.Evaluation of level of evidence: Not evaluated
Validation: Not reportedReliability: Agreement 70%
Pilote, 2002 [55]Goal of the tool and applicability for future use: Critical appraisal-evaluation of practice guidelines: Yes
Type of tool/number of criteria (questions): Checklist/% of items fulfilledApplicability to the study design: Systematic reviewsReporting of the development: based on literature review
No Generated for therapeutic studies: YesApplicability to the studies of incidence/ prevalence: UnlikelyApplicability to the studies of risk factors: Can be applied
1. Can a large database be identified that contains information on practice patterns for the treatment of a condition for which practice guidelines have been developed?2. Is the database suitable for guideline evaluation in terms of the following criteria?a. Can a precise diagnosis be made using the available data?b. Can criteria be established to allow for the creation of comparison groups with different practice patterns?c. Are there data to ensure the comparability of the groups?
Specification of the model to reduce biases: selection bias, information bias, confounding bias, temporal trend bias, ecological exposure in individual level studies, sources of dataEvaluation of level of evidence: Not evaluated
Validation: Not reportedReliability: Not reported
35
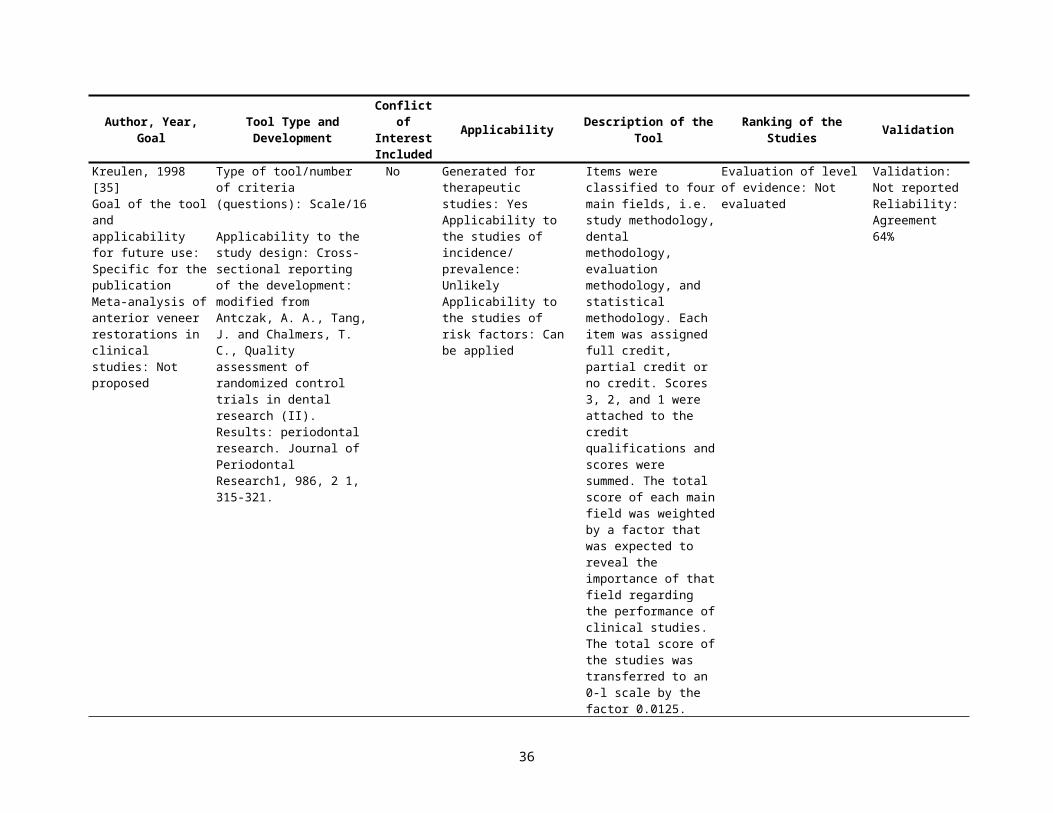
Author, Year, Goal Tool Type and Development
Conflict of Interest Included
Applicability Description of the Tool Ranking of the Studies Validation
d. Can practice patterns be measured?e. Can practice patterns be identified according to those prescribed by practice guidelines?f. Are there any data on patient, physician, and environmental factors that could explain deviations from practice prescribed by practice guidelines and that could help validate any inference made about practice patterns–outcomes associations?g. Are outcomes of interest related to the purpose of clinical guidelines to enhance the quality, appropriateness, and effectiveness of health care, available and measured with precision?h. Are the incidence rates or prevalence of the outcomes of interest large enough to allow meaningful practice patterns–outcomes associations?
Jain, 2002 [56]Goal of the tool and applicability for future use: Specific for systematic reviews-evaluation of evidence of the
Type of tool/number of criteria (questions): Checklist/9Applicability to the study design: Cohort, case-controlReporting of the development: No
No Generated for therapeutic studies: NoApplicability to the studies of incidence/ prevalence: Can be applied Applicability to the
Checklist with overall design of the study and 7 important methodological aspects (sample size, target population, quality of feeding data, control of
Evaluation of level of evidence: Not evaluated
Validation: Not reported. The authors analyzed the association within each cluster of quality and compared to
36
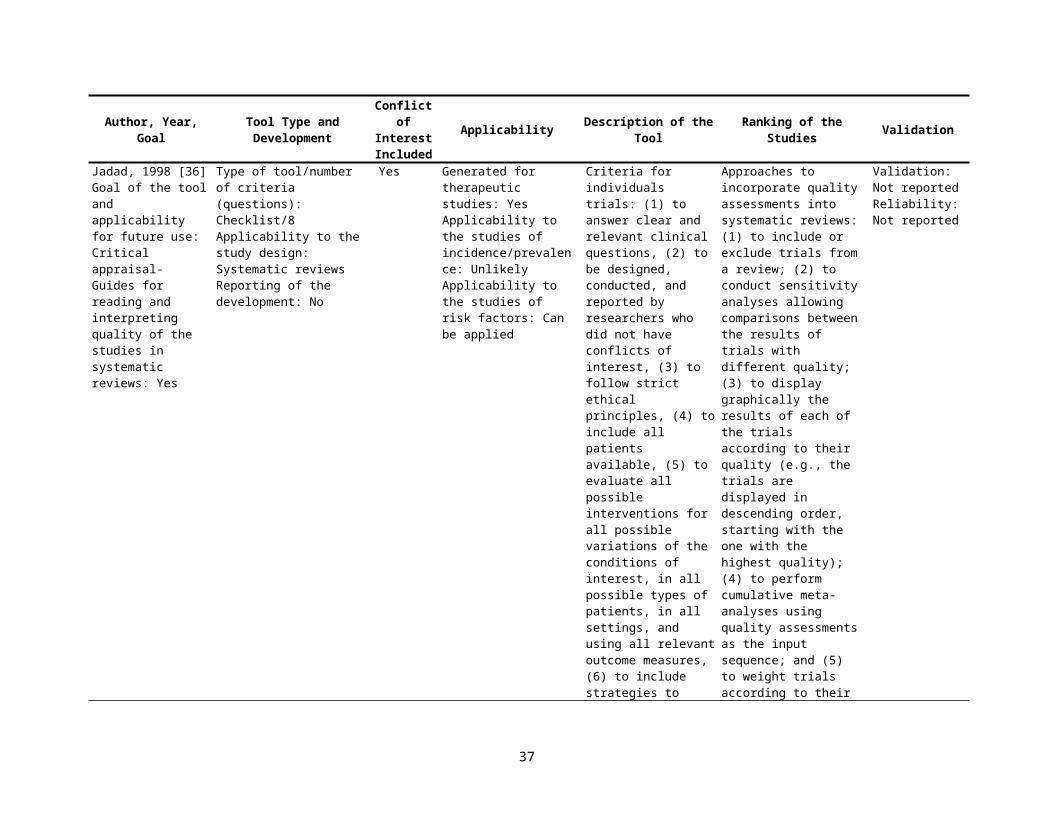
Author, Year, Goal Tool Type and Development
Conflict of Interest Included
Applicability Description of the Tool Ranking of the Studies Validation
association between breastfeeding and Intelligence: Not proposed
studies of risk factors: Yes
susceptibility bias, blinding, outcome measures, and format of results).
two studies of highest qualityReliability: Not reported
Bhutta, 2002 [57]Goal of the tool and applicability for future use: Specific for the publication - Cognitive and behavioral outcomes of school-aged children who were born preterm: Yes
Type of tool/number of criteria (questions): Scale/6
Applicability to the study design: Case-controlReporting of the development: No
No Generated for therapeutic studies: NoApplicability to the studies of incidence/ prevalence: Can be appliedApplicability to the studies of risk factors: Yes
Assessments of study quality (10-point score) based on factors thought to be good quality indicators for observational studies using a case-control design
Studies that scored 8 or higher were grouped as high quality, whereas studies scoring less than 8 were grouped as low quality for the purpose of subgroup analysisEvaluation of level of evidence: Not evaluated
Validation: Not reportedReliability: Agreement 79%
Al-Jader, 2002 [58]Goal of the tool and applicability for future use: critical appraisal for epidemiological surveys of genetic disorders: Yes
Type of tool/number of criteria (questions): Scale/5Applicability to the study design: Case-control/Cross-Sectional Reporting of the development: based on literature review and modified from Loney and Stratford
No Generated for therapeutic studies: NoApplicability to the studies of incidence/ prevalence: UnlikelyApplicability to the studies of risk factors: Yes
The questions related to five main criteria, with a total of nine dimensions and scores from 0 to 100, which was intended to be a multiple of 10. Main criteria included a degree of ascertainment, population studied, definition of cases, year(s) of study recorded, and the prevalence, and/or incidence rate recorded with 95% CI and among patient subpopulations when applicable
Evaluation of level of evidence: Not evaluated
Validation: Not reportedReliability: intra-class correlationcoefficient 0.5
Carneiro, 2002 [59]Goal of the tool and applicability for future use: Critical appraisal- appraisal of prognostic evidence: Yes
Type of tool/number of criteria (questions): Checklist/8 Applicability to the study design: Cohort Reporting of the development: No
No Generated for therapeutic studies: NoApplicability to the studies of incidence/ prevalence: UnlikelyApplicability to the studies of risk factors: Can be applied
The questions related to external (representativeness of the study sample) and internal validity (definition and blinded assessment of outcomes, control for confounding factors)
Evaluation of level of evidence: Not evaluated
Validation: Not reportedReliability: Not reported
37
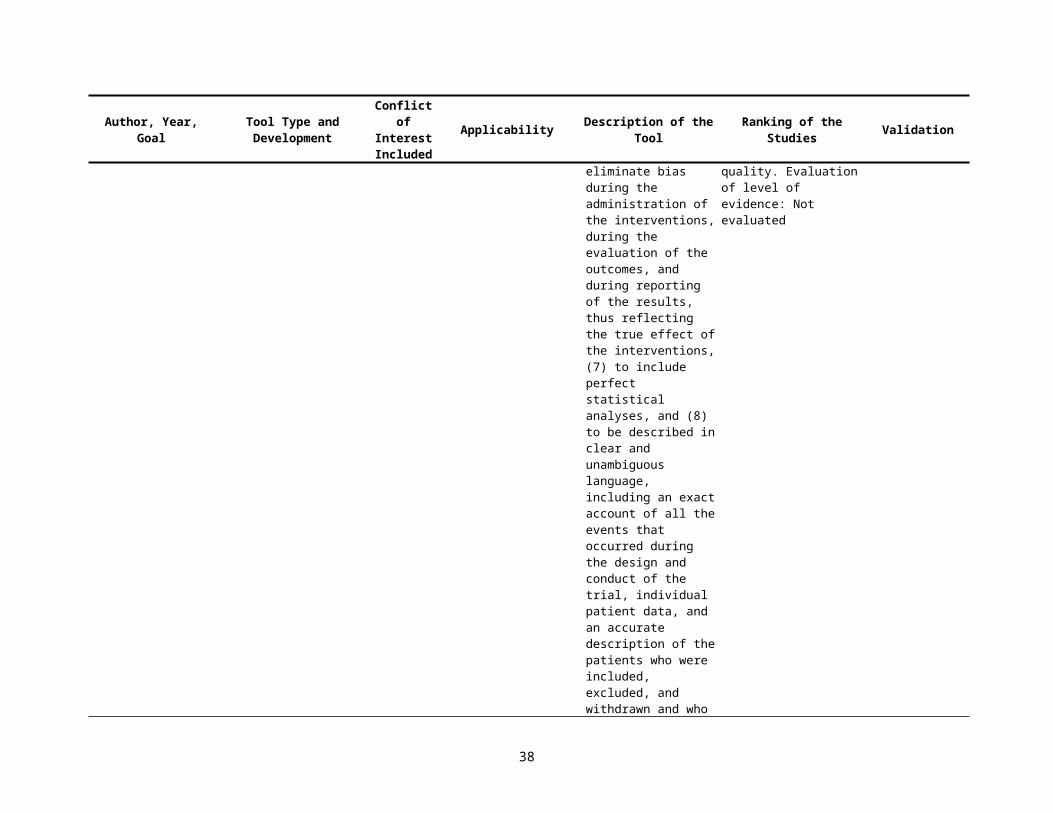
Author, Year, Goal Tool Type and Development
Conflict of Interest Included
Applicability Description of the Tool Ranking of the Studies Validation
Elwood, 2002 [60]Goal of the tool and applicability for future use: Critical appraisal- appraisal in the design of studies to detect causality: Yes
Type of tool/number of criteria (questions): Checklist/20 Applicability to the study design: Case-control/ Cohort, Systematic reviewsReporting of the development: the Australian National Cancer Control Initiative
No Generated for therapeutic studies: NoApplicability to the studies of incidence/ prevalence: Can be appliedApplicability to the studies of risk factors: Yes
20 questions related to study design, confounding assessments and adjustment, sample size, bias, response rate, and subjects selection
Criteria of causality including temporality, dose response, consistency across the studies, strength of the association Evaluation of level of evidence: Not evaluated
Validation: Not reportedReliability: Not reported
Campbell, 2002 [61]Goal of the tool and applicability for future use: Specific for the publications-genetic association studies in complex disease: Yes
Type of tool/number of criteria (questions): Checklist/13 Applicability to the study design: Case-controlReporting of the development: No
No Generated for therapeutic studies: NoApplicability to the studies of incidence/ prevalence: UnlikelyApplicability to the studies of risk factors: Yes
List of specifics for a research question quality criteria including chance, bias, and analytical strategies to reduce bias
Evaluation of level of evidence: Criteria of causality listed to apply if chance, bias, and confounding are all considered to be unlikely explanations for an observed association.
Validation: Not reportedReliability: Not reported
Manchikanti, 2002 [62]Goal of the tool and applicability for future use: Specific for the publication - Medial branch neurotomy in management of chronic spinal pain: Not proposed
Type of tool/number of criteria (questions): Scale/6
Applicability to the study design: Case-control/ Cohort/Cross-SectionalReporting of the development: modified AHRQ extensive scale to rate the strength of scientific evidence
Yes Generated for therapeutic studies: YesApplicability to the studies of incidence/ prevalence: UnlikelyApplicability to the studies of risk factors: Can be applied
Scale with questions about study population, comparability of subjects, exposure or intervention, outcome measurement, statistical analysis and funding or sponsorship
Evaluation of level of evidence: Qualitative analysis was conducted, using five levels of evidence modified from USPTF, unclear relation to the scale
Validation: Not reportedReliability: Agreement 60%
Slim, 2003 [63]Goal of the tool and applicability for future use: Critical appraisal- index for nonrandomized studies (MINORS): Yes
Type of tool/number of criteria (questions): Scale/12Applicability to the study design: Case-control/CohortReporting of the development: modified criterions proposed by Oxman and Guyatt
No Generated for therapeutic studies: YesApplicability to the studies of incidence/ prevalence: UnlikelyApplicability to the studies of risk factors: Yes
12 items: the first subscale of eight items related to non-comparative studies whereas all 12 items were relevant to comparative studies with 3-point scale from 0 to 2. For 8 items for noncomparative studies and 12 items for comparative studies
Evaluation of level of evidence: Not evaluated
Validation: Validated applying the scale for excellent RCT, scores were significantly lower for non RCTs. Credibility criteria assessed by 10 clinical methodologists
38
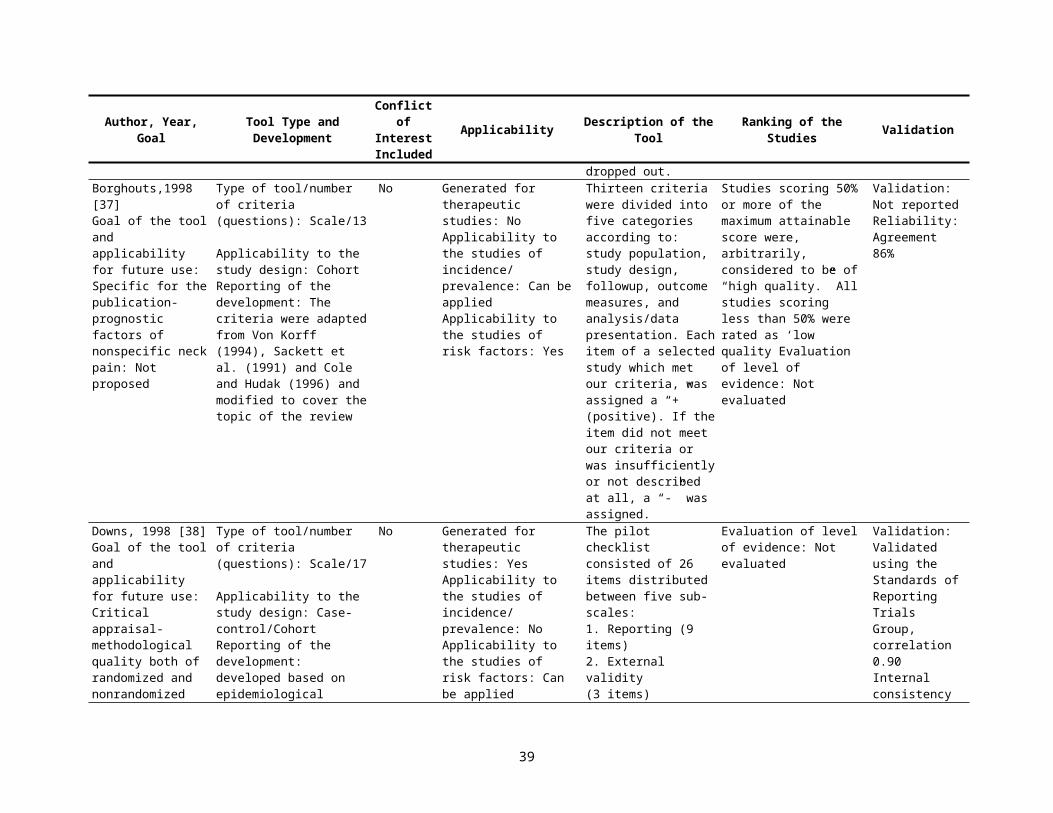
Author, Year, Goal Tool Type and Development
Conflict of Interest Included
Applicability Description of the Tool Ranking of the Studies Validation
and that the maximum item score is 2, the ideal global score would be 16 for the noncomparative studies and 24 for the comparative studies.
on a 7-point scale on 13 criteria (Feinstein)Reliability: Cronbach alfa 0.73
Scholten-Peeters, 2003 [64]Goal of the tool and applicability for future use: Specific for the publication-Prognostic factors of whiplash-associated disorders: Not proposed
Type of tool/number of criteria (questions): Scale/16Applicability to the study design: Cohort Reporting of the development: modified from Altman DG. Systematic reviews of evaluations of prognostic variables. Br Med J 2001;323:224–8.
No Generated for therapeutic studies: NoApplicability to the studies of incidence/ prevalence: Can be appliedApplicability to the studies of risk factors: Yes
16 questions related to study population, followup, treatment, prognostic factors, outcomes, and analysis. For each study a total quality score was computed by counting all positively rated items (maximum score 16 points)
A study was (arbitrarily) considered as ‘high quality’ if it satisfied at least 50% of the maximum available total quality score (>8 points)Evaluation of level of evidence: level of evidence strong if consistent findings (>80%) in at least 2 high quality; moderate if one high quality cohort and consistent findings (>80%) in one or more low quality cohorts; limited if findings of one cohort or consistent findings in one or more low quality cohorts; Inconclusive if inconsistent findings irrespective of study quality
Validation: Not reportedReliability: Agreement 80%
Rangel, 2003 [65]Goal of the tool and applicability for future use: Specific for the publication -observational studies of pediatric surgery: Not proposed
Type of tool/number of criteria (questions): Scale/15 Applicability to the study design: Cohort Reporting of the development: Yes
No Generated for therapeutic studies: YesApplicability to the studies of incidence/ prevalence: UnlikelyApplicability to the studies of risk factors: Can be applied
30 quality assessment items within 3 independent subscales for one of 3 key epidemiologic principles: clinical relevance, methodology of reporting, and the strength of stated conclusions. A
Studies having a global quality score of 15 or less were considered to be of poor quality, those with a score of 16 to 30 points were considered to be fair, and those with a score of 31 to 45 points were considered to be of good quality.Evaluation of level of
Validation: Not reportedReliability: Agreement 84.6
39
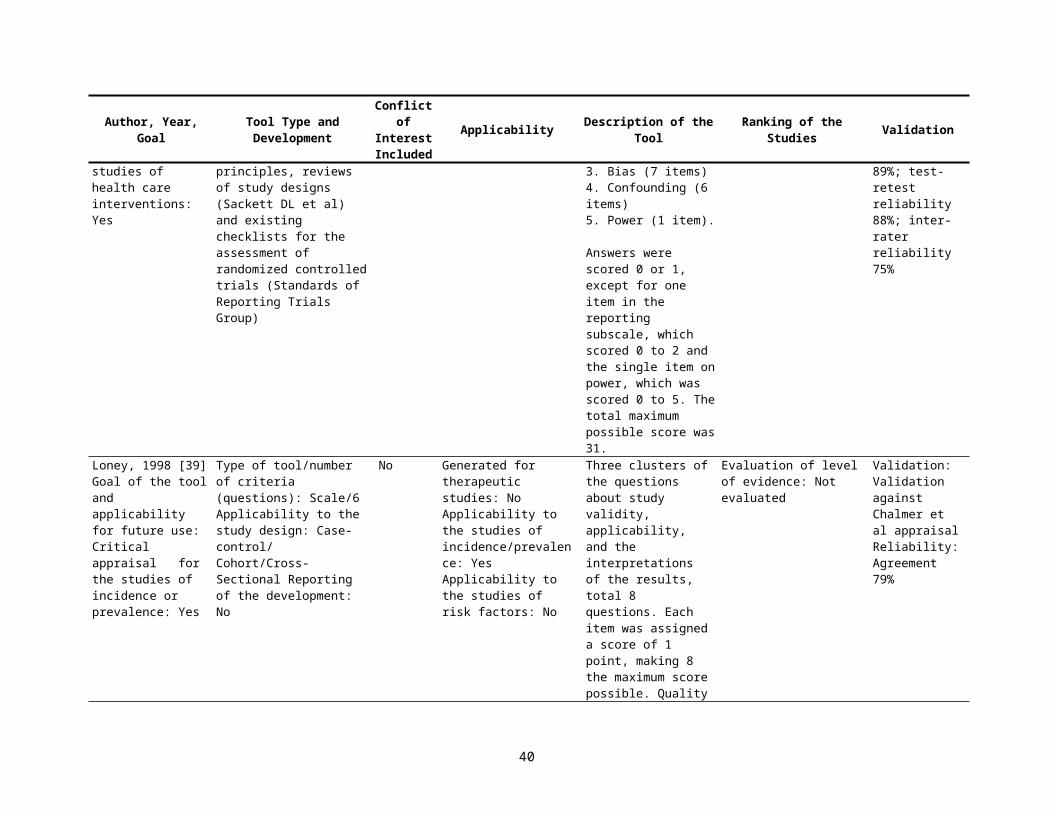
Author, Year, Goal Tool Type and Development
Conflict of Interest Included
Applicability Description of the Tool Ranking of the Studies Validation
maximum of 10 points was given for each of the subscales pertaining to clinical relevance and discussion quality, and a maximum of 25 points was given for the subscale pertaining to study methodology. The total possible score for the entire instrument was 45 points.
evidence: Not evaluated
Meijer, 2003 [66]Goal of the tool and applicability for future use: Specific for the publication - Prognostic factors in the subacute phase after stroke for the future residence: Yes
Type of tool/number of criteria (questions): Scale/9
Applicability to the study design: Cohort Reporting of the development: modified methodological criteria used by Kwakkel et al
No Generated for therapeutic studies: NoApplicability to the studies of incidence/ prevalence: Can be appliedApplicability to the studies of risk factors: Yes
A binary weight (0/1) was given to each of the 11 methodological criteria of internal, statistical, and external validity
Level of scientific evidence: A-good, B moderate, and, C- poor evidence. Studies that satisfy all items for internal and statistical validity (>8 points) received level A, studies with a total score >6, but not fulfilling the criteria for level A received level B, and studies with a total score <6 received level C.Evaluation of level of evidence: Not evaluated
Validation: Not reportedReliability: Not reported
CEBM Prog, 2004 [67]Goal of the tool and applicability for future use: Critical appraisal- Systematic Review Appraisal Sheet: Yes
Type of tool/number of criteria (questions): Checklist/5Applicability to the study design: Systematic reviewsReporting of the development: Yes
No Generated for therapeutic studies: YesApplicability to the studies of incidence/ prevalence: UnlikelyApplicability to the studies of risk factors: Can be applied
Questions related to selection and finding of the studies, consistency in the results, validity of the individual studies
Evaluation of level of evidence: Oxford Centre for Evidence-based Medicine Levels of Evidence
Validation: Not reportedReliability: Not reported
London, 2004 [68] Goal of the tool and applicability for future use: Critical appraisal- Principles for
Type of tool/number of criteria (questions): Checklist/30 Applicability to the study design: Case-control/Cohort
No Generated for therapeutic studies: NoApplicability to the studies of incidence/ prevalence: Can be
Questions related to external validity, comparability of exposed and nonexposed, blinding
Evaluation of level of evidence: Questions of the Bradford Hill criteria for judging the plausibility of causation (strength of
Validation: Not reportedReliability: Not reported
40
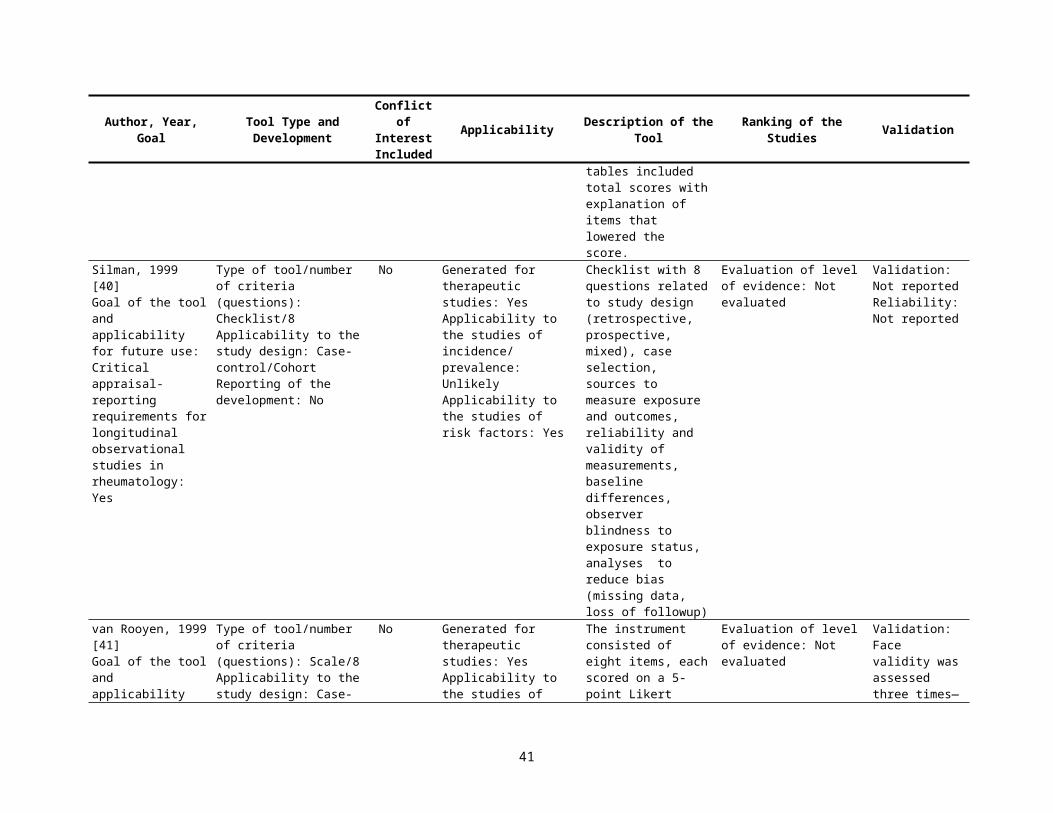
Author, Year, Goal Tool Type and Development
Conflict of Interest Included
Applicability Description of the Tool Ranking of the Studies Validation
Evaluating Epidemiologic Data in Regulatory Risk Assessment: Yes
Reporting of the development: Yes
appliedApplicability to the studies of risk factors: Yes
of assessors, response rate, attrition rate, validity of the data collected, study power, and strategies to reduce bias, with possible response as Yes; No; Not Known; and Not Applicable
association, consistency within and across studies, dose response, biological plausibility, and temporality) applied in the study
SIGN 50, 2004 [69]Goal of the tool and applicability for future use: Critical appraisal- quality assessment of observational studies and systematic reviews: Yes
Type of tool/number of criteria (questions): Checklist/22 Applicability to the study design: Case-control; Cohort, Systematic reviewsReporting of the development: modified from Appraisal of guideline for research and evaluation In Europe
No Generated for therapeutic studies: NoApplicability to the studies of incidence/ prevalence: UnlikelyApplicability to the studies of risk factors: Can be applied
Questions related to selection of cases and controls, exclusion eligible subjects, comparability of the comparison groups, absence of the outcome among controls, measures of exposure status, and control for confounding For cohort studies: questions related to selection of the subjects, comparability of the groups, length and loss of followup, presence of the outcomes at the time of enrollment, assessment of the outcomes, blinding of examiners, and control for confounding, appropriate statistical analysis. In systematic reviews: assessment of studies quality, methodology of selection and abstraction of the studies, justification on
Overall quality of the study by minimizing the risk of bias, statistical power, and applicability of the resultsEvaluation of level of evidence: Level of evidence and strength of recommendation by study design similar to USPTF criteria
Validation: Not reportedReliability: Not reported
41
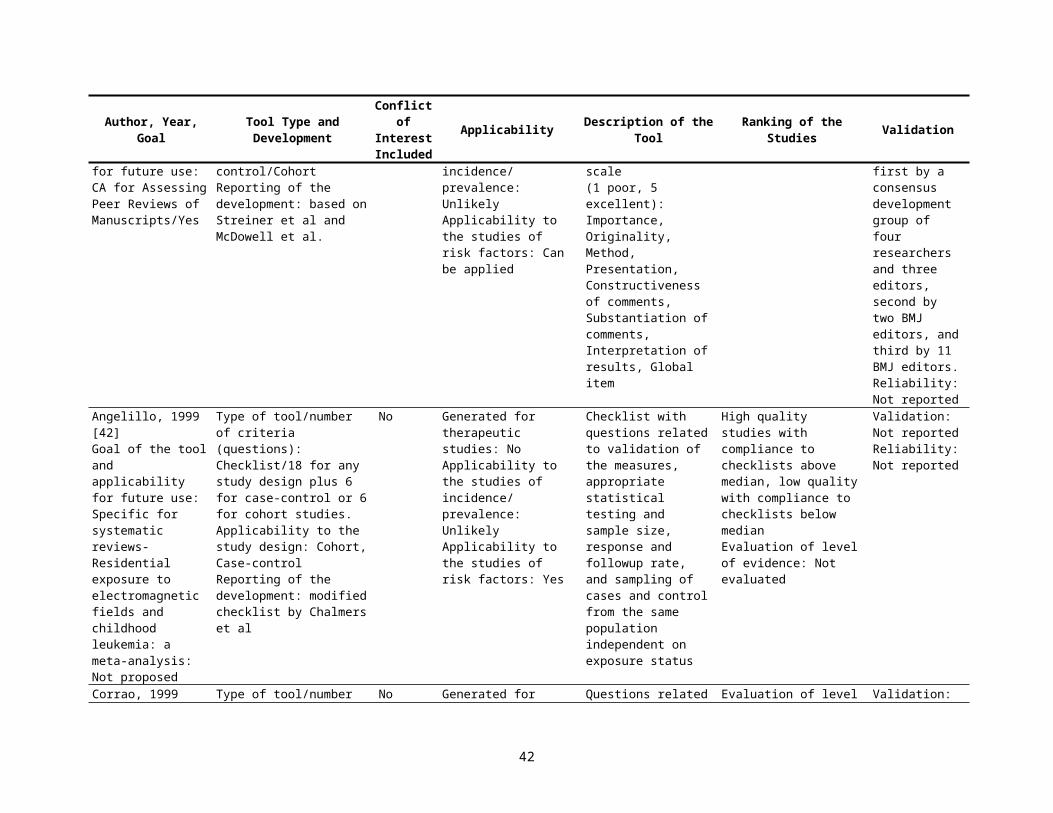
Author, Year, Goal Tool Type and Development
Conflict of Interest Included
Applicability Description of the Tool Ranking of the Studies Validation
quantitative analysisNewcastle -Ottawa, 2004 [70]Goal of the tool and applicability for future use: Critical appraisal- Quality Assessment Scales for Observational Studies: Yes
Type of tool/number of criteria (questions): Checklist/8 Applicability to the study design: Case-control, CohortReporting of the development: No
No Generated for therapeutic studies: YesApplicability to the studies of incidence/ prevalence: UnlikelyApplicability to the studies of risk factors: Can be applied
Questions related to definitions and repre-sentativeness of cases, selection and definition of controls, comparability of cases and controls, measurement of exposure for cases and controls, and nonresponse rate. For cohort studies: questions related to representativeness of the exposed cohort, selection of the nonexposed cohort, measure of exposure, assessment of the outcomes at the beginning of the study, comparability of the groups, measure of the outcomes, and adequacy of followup
Evaluation of level of evidence: Not evaluated.
Validation: Not reportedReliability: Not reported
Woodbury, 2004 [71]Goal of the tool and applicability for future use: Specific for the publication- Prevalence of pressure ulcers in Canadian healthcare settings: Not proposed
Type of tool/number of criteria (questions): Scale/ 9Applicability to the study design: Cohort/Cross-SectionalReporting of the development: modified from Loney et al
No Generated for therapeutic studies: NoApplicability to the studies of incidence/ prevalence: YesApplicability to the studies of risk factors : Can be applied
Three domains included the validity of the study design, the interpretations of the results of the study, and the applicability of the results. 9 questions about selection of the subjects, adequacy of the response rate, sample size with cut off = 200 subjects, valid methods to measure exposure and the outcomes, and applicability of the
Ranking the studies by defined flaws including detection of skin ulcers by methods other than physical skin exam, identification of pressure ulcers with not accepted as standard methods and by health care provider, responsible for patient care rather by unbiased assessors. Studies with total scores <2 were excluded from the analysesEvaluation of level of
Validation: Not reportedReliability: Not reported
42
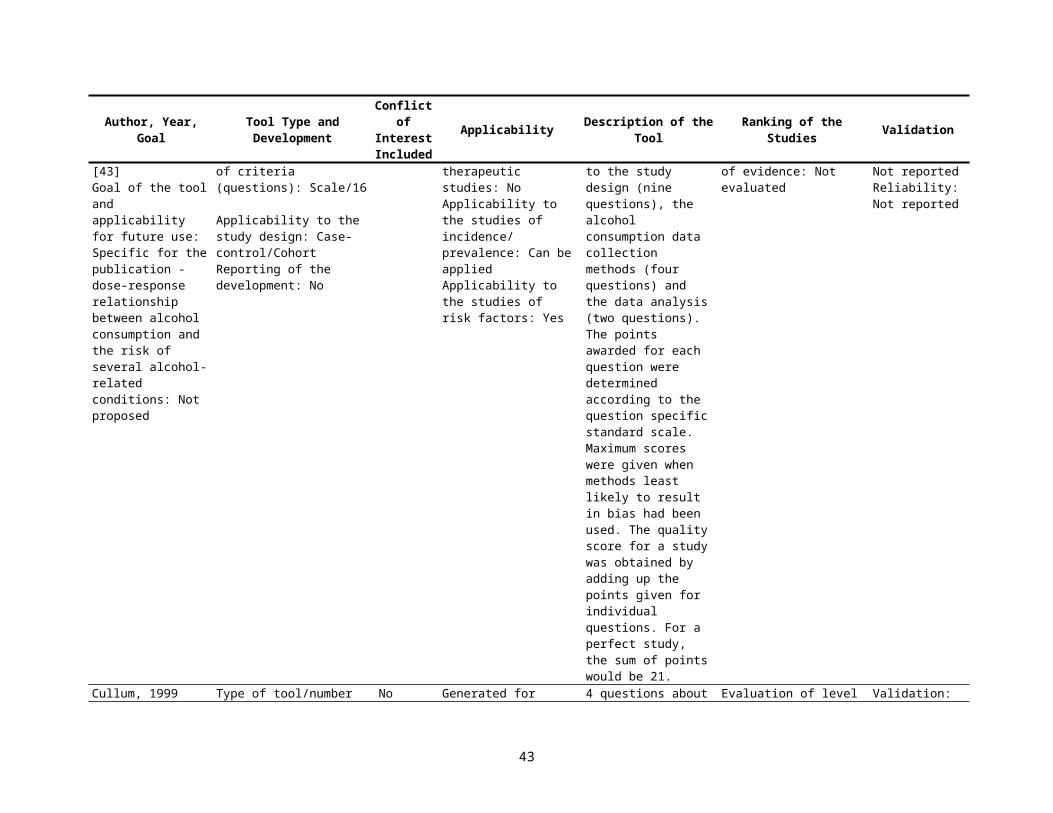
Author, Year, Goal Tool Type and Development
Conflict of Interest Included
Applicability Description of the Tool Ranking of the Studies Validation
results evidence: Not evaluated
43
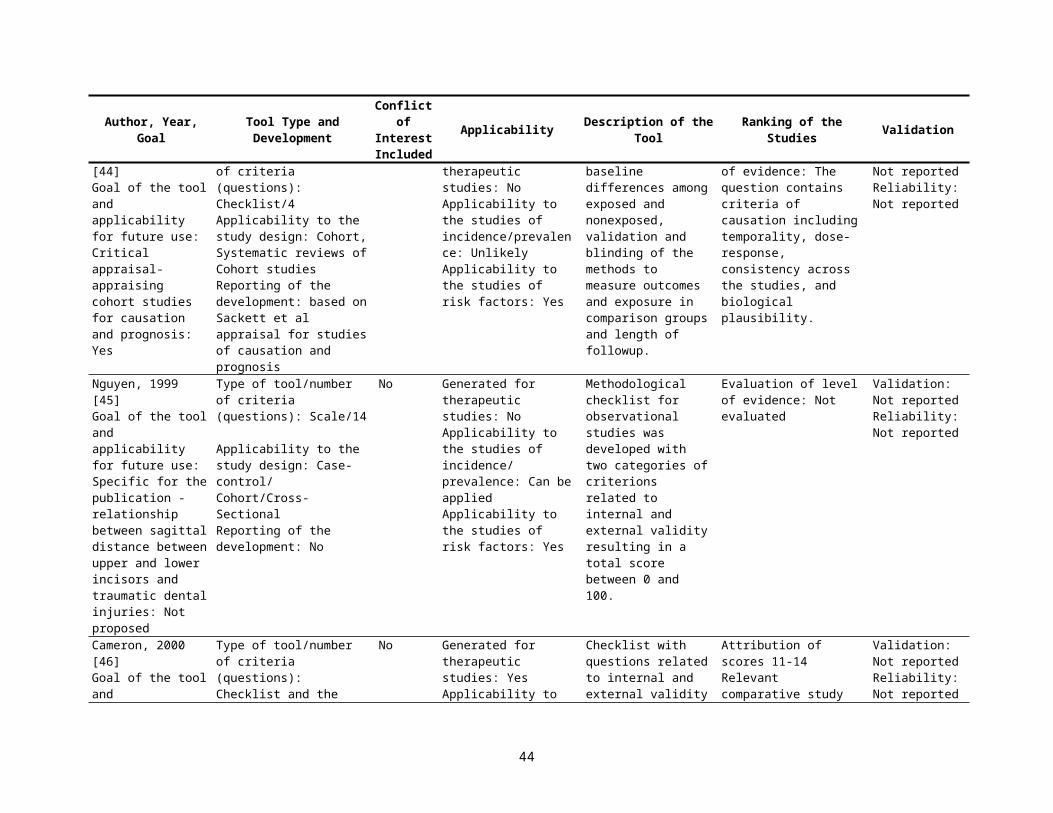
Author, Year, Goal Tool Type and Development
Conflict of Interest Included
Applicability Description of the Tool Ranking of the Studies Validation
Tooth, 2005 [72]Goal of the tool and applicability for future use: Critical appraisal- Quality of Reporting of Observational Longitudinal Research: Yes
Type of tool/number of criteria (questions): Checklist/33Applicability to the study design: Cohort, reporting qualityReporting of the development: developed after systematic review of observationallongitudinal research and quality evaluation of observational studies
No Generated for therapeutic studies: NoApplicability to the studies of incidence/ prevalence: UnlikelyApplicability to the studies of risk factors: Yes
33 criteria represent two principal categories: 1) aspects that could possibly influence effect estimates and 2) more descriptive or contextual elements are scored as reported (yes), not reported (no), or not applicable to report. To score “yes,” each criterion must be reported in enough detail to allow the reader to judge that the definition had been met. If inadequate information about a criterion was reported, it was scored “no.” If authors referred readers to another publication for specific details about the study methods (e.g., sampling or eligibility), the criterion was scored “no.” For each article, the number of criteria reported was divided by the number of relevant criteria to give a score reflecting the proportion of relevant or applicable criteria reported
Evaluation of level of evidence: Not evaluated
Validation: Not reportedReliability: Agreement 75%
44
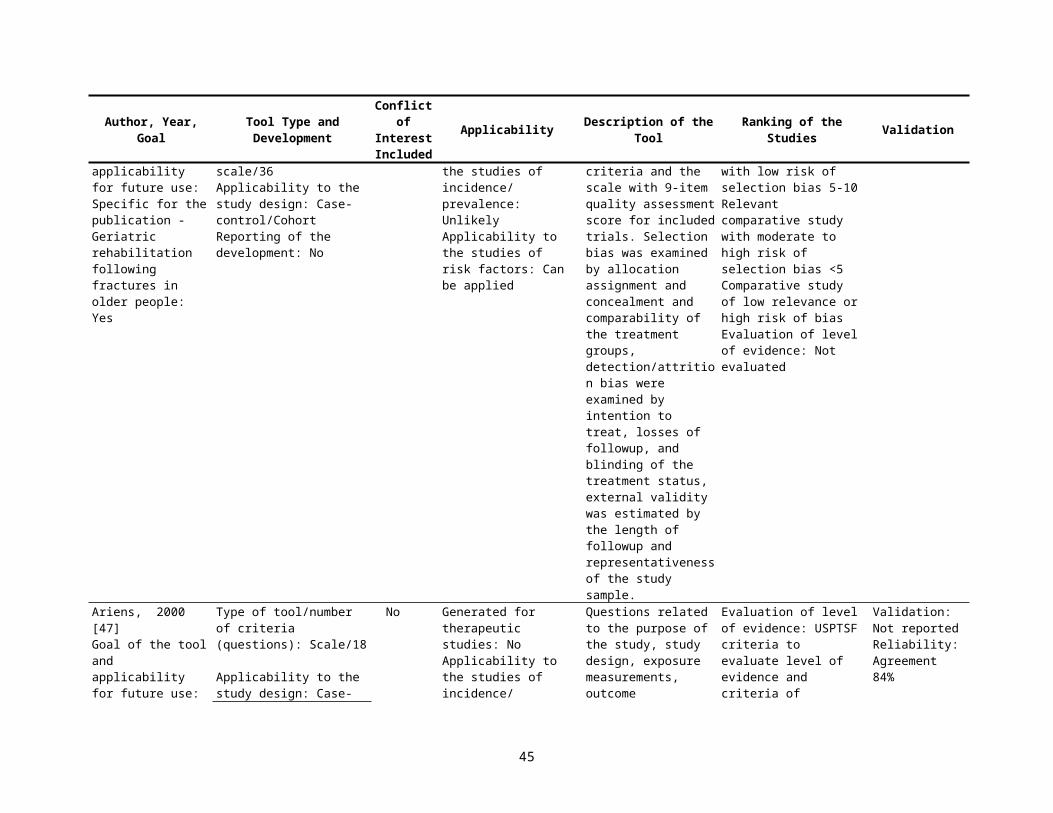
Author, Year, Goal Tool Type and Development
Conflict of Interest Included
Applicability Description of the Tool Ranking of the Studies Validation
Moja, 2005 [73]Goal of the tool and applicability for future use: Critical appraisal- Assessment of methodological quality of primary studies by systematic reviews: Yes
Type of tool/number of criteria (questions): Checklist/31Applicability to the study design: Systematic reviewsReporting of the development: based on Cochrane, CONSORT, and QUOROM statements and systematic review of quality evaluations of RCTs
No Generated for therapeutic studies: YesApplicability to the studies of incidence/ prevalence: NoApplicability to the studies of risk factors: No
Assessed the quality and how (scale or checklist, components studied, composite score) and in what way they planned to use the quality assessment (for example, as exclusion criteria, for sensitivity analysis
Evaluation of level of evidence: Not evaluated
Validation: Not reportedReliability: Agreement 94%
Pavia, 2006 [74]Goal of the tool and applicability for future use: Specific for systematic reviews -Association between fruit and vegetable consumption and oral cancer: Not proposed
Type of tool/number of criteria (questions): Scale/ 26+6 for CC or 6 for cohort studiesApplicability to the study design: Cohort/Case-controlReporting of the development: modified from Greenland et al
No Generated for therapeutic studies: NoApplicability to the studies of incidence/ prevalence: UnlikelyApplicability to the studies of risk factors: Yes
The list was composed of items felt to be important for the quality of each observational study, including the study design [selection bias; score ranging from 0 (worst) to 6 (best)], the adjustment of confounding variables (score ranging from 0 to 16, worst to best), the exposure assessment (misclassification bias; score ranging from 0 to 5, worst to best), and the data analysis (score ranging from 0 to 2.5, worst to best). Each sub score was calculated as the percentage of applicable quality criteria that were met in each study; therefore, each sub score for a study could range from 0% (lowest quality) to 100% (all the quality criteria were met). The cumulative quality score
Poor-quality studies based on individual scores above or below the median.Evaluation of level of evidence: Not evaluated
Validation: Not reportedReliability: Not reported
45
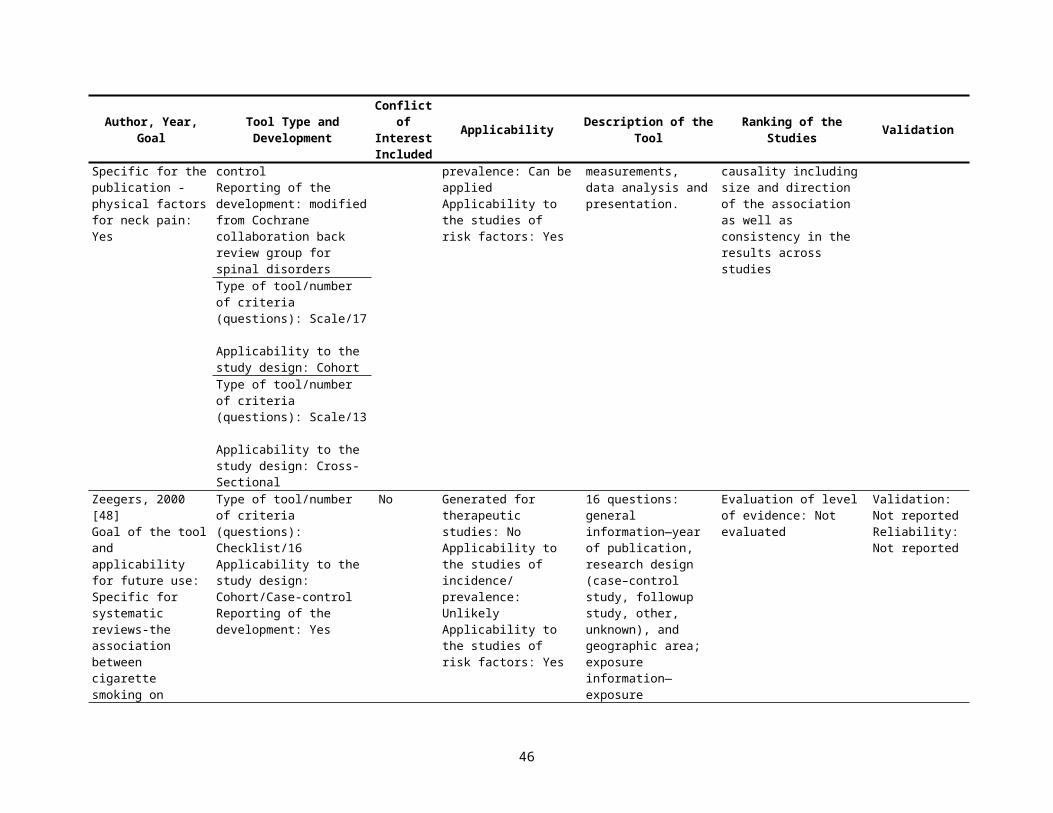
Author, Year, Goal Tool Type and Development
Conflict of Interest Included
Applicability Description of the Tool Ranking of the Studies Validation
was a weighted average of the 4 percentages
de Boer, 2006 [75]Goal of the tool and applicability for future use: Specific for systematic reviews-unemployment in adult survivors of childhood cancer; Not proposed
Type of tool/number of criteria (questions): Scale/2Applicability to the study design: Case-controlReporting of the development: No
No Generated for therapeutic studies: NoApplicability to the studies of incidence/ prevalence: UnlikelyApplicability to the studies of risk factors: Yes
Methodological quality was assessed as the inclusion of a control group and extent of loss to followup 1) the use of a control group matched on age and sex (4 points), use of a control group without matching (2 points), or no control group (0 points); 2) loss to followup 20% (2 points), 20% loss to followup (1 point), or no information on loss to followup (0 points). The points were added up to produce an overall methodological quality score (0–6 points).
Evaluation of level of evidence: Not evaluated
Validation: Not reportedReliability: Not reported
Shea, 2006 [76]Goal of the tool and applicability for future use: Critical appraisal- enhanced Overview QualityAssessment Questionnaire for systematic reviews: Yes
Type of tool/number of criteria (questions): Scale/10Applicability to the study design: Systematic reviewsReporting of the development: used modified previously validated Overview QualityAssessment Questionnaire
No Generated for therapeutic studies: SRApplicability to the studies of incidence/ prevalence: SRApplicability to the studies of risk factors: SR
The OQAQ scale measures across a continuum using nine questions (items 1–9) designed to assess various aspects of the methodological quality of systematic reviews and one overall assessment question (item 10). When the scale is applied to a systematic review, the first nine items are scored by selecting either yes, no, partial/can't tell. The tenth item requires assessors to assign an
If the “can’t tell” option is used one or more times on the preceding questions, a review is likely to have minor flaws at best and it is difficult to rule out major flaws (i.e. a score of 4 or lower). If the “no” option is used on question 2, 4, 6, or 8, the review is likely to have major flaws (i.e. a score of 3 or less, depending on the number and degree of the flaws). Evaluation of level of evidence: rate the scientific quality of the overview as Extensive/
Validation: Not reportedReliability: Not reported
46
Author, Year, Goal Tool Type and Development
Conflict of Interest Included
Applicability Description of the Tool Ranking of the Studies Validation
overall quality score on a 7-point scale
Major/Minor/Minimal flaws.
Bornhoft, 2006 [77]Goal of the tool and applicability for future use: Critical appraisal- qualitative evaluation of clinical studies focused on external validity and model validity: Yes
Type of tool/number of criteria (questions): Scale/63Applicability to the study design: Cohort reporting of the development: developed by listing the most commonly used assessment criteria for observational longitudinal research by Tooth, L. et al
No Generated for therapeutic studies: YesApplicability to the studies of incidence/ prevalence: UnlikelyApplicability to the studies of risk factors: Can be applied
The appraisal of external validity includes the questions related to study population–assessment of selection bias, assessment of performance bias, assessment of detection and attrition bias, and study design and setting. Possible responses: + Matches completely/is completely fulfilled(+) Matches incompletely but sufficiently/is only partly but sufficiently fulfilled- Does not match or matches insufficiently/is insufficiently fulfilledCannot be evaluated
Evaluation of level of evidence: Not evaluated
Validation: Stated but not reportedReliability: Not reported
Moher, 2007 [78]Goal of the tool and applicability for future use: Critical appraisal- reporting characteristics of systematic reviews: Yes
Type of tool/number of criteria (questions): Checklist/51Applicability to the study design: Systematic reviewsReporting of the development: No
Yes Generated for therapeutic studies: SRApplicability to the studies of incidence/ prevalence: SRApplicability to the studies of risk factors: SR
Evaluation of level of evidence: Not evaluated
Validation: Not reportedReliability: Not reported
Genaidy, 2007 [79]Goal of the tool and applicability for future use: Critical appraisal- appraisal of the methodological quality of existing or new
Type of tool/number of criteria (questions): Scale/43Applicability to the study design: Case-control/ Cohort/Cross-Sectional/CTReporting of the
No Generated for therapeutic studies: YesApplicability to the studies of incidence/ prevalence: UnlikelyApplicability to the studies of risk factors:
43 questions grouped into five sections (each giving a measurement scale): (a) reporting (17 items), (b) subject/ record selection (seven items), (c) measurement
The overall quality scores for the articles were: (a) good article – 1.40 (SD 0.30), (b) average article – 1.33 (SD 0.23), (c) poor article – 0.90 (SD 0.18).Evaluation of level of
Validation: The reliability testing of the Downs and Black checklist showed the following results for
47
Author, Year, Goal Tool Type and Development
Conflict of Interest Included
Applicability Description of the Tool Ranking of the Studies Validation
ergonomic epidemiological studies: Yes
development: was developed by an epidemiologist/ergonomist after reviewing epidemiological principles, study designs and existing checklists (Kleinbaum et al. 1982, Hennekens and Buring 1987, Checkoway et al. 1989, Schlesselman 1989, Monson 1990,Kelsey et al. 1996, McNeil 1996, Downs and Black 1998, Rothman and Greenland 1998,Nguyen et al. 1999, Crombie 2000, Elwood 2000, van der Windt et al. 2000, Macfarlaneet al. 2001, Bongers et al. 2002, Merlin et al. 2003, Savitz 2003, MacMahon and Trichopoulos 2005).
Yes quality; (d) data analysis (seven items), (e) generalization of results (two items). Possible response: “yes” (information is complete), “partial” (the information is partially complete), “‘no” (the information is not described but should have been provided), “unable to determine” (the information provided is unclear or insufficient to answer the question), and “Not applicable” (a means for skipping an item). The scoring is made: “yes” is given a 2, “partial” is 1, and “no” or “unable to determine” is scored as 0.
evidence: Not evaluated epidemiological studies: internal consistency – reporting (0.83), confounding (0.48), bias (0.78) and external validity (0.15); test–retest reliability – reporting (0.73), confounding (0.53), bias (0.86) and external validity (0.65); and inter-rater reliability (based on two raters) – reporting (51%), confounding (45%), bias (59%) and external validity (0%)Reliability: Agreement -79%; Kappa -80-100%
Eichler, 2007 [80]Goal of the tool and applicability for future use: Specific for the publication - Prediction of first coronary events with the Framingham score: Not proposed
Type of tool/number of criteria (questions): Checklist/9Applicability to the study design: Cohort Reporting of the development: modified from Altman DG. Systematic reviews of evaluations of prognostic variables. BMJ 2001;323:224- 8.NHS Centre for Reviews and Dissemination. CRD’s guidance for those carrying out or commissioning
No Generated for therapeutic studies: NoApplicability to the studies of incidence/ prevalence: UnlikelyApplicability to the studies of risk factors: Yes
Aspects of internal and external validity: Outcome assessment blinded, length of followup, completeness of followup, population characteristics and recruitment, definition and measurements of the exposure and the outcomes, strategies to reduce bias. Quality items grouped to the categories yes (+), no ( ), and not clear
Evaluation of level of evidence: Not evaluated
Validation: Not reportedReliability: Not reported
48
Author, Year, Goal Tool Type and Development
Conflict of Interest Included
Applicability Description of the Tool Ranking of the Studies Validation
reviews. New York7 University of York; 2001.
Hirtz, 2007 [81]Goal of the tool and applicability for future use: Specific for the publication - meta-analysis of the prevalence of neurologic disorders: Not proposed
Type of tool/number of criteria (questions): Checklist/16Applicability to the study design: Cohort/cross-sectional reporting of the development: No
No Generated for therapeutic studies: NoApplicability to the studies of incidence/ prevalence: YesApplicability to the studies of risk factors: Can be applied
Four domains with A-D responses related to time frame of the study, case-finding and sample size, case definition, and source of diagnosis
Studies were ranked by class of evidenceEvaluation of level of evidence: Class of evidence based on definition of flaws in research: Class Distribution of criteriaI: All AII: 1 or more B, no C or D III: 1 or more C, no DIV: 1 or more D
Validation: Not reportedReliability: Not reported
Tricco, 2008 [82]Goal of the tool and applicability for future use: Critical appraisal-for bias in systematic reviews: Yes
Type of tool/number of criteria (questions): Scale/10Applicability to the study design: Systematic reviewsReporting of the development: modified Oxman and Guyatt index
No Generated for therapeutic studies: YesApplicability to the studies of incidence/ prevalence: UnlikelyApplicability to the studies of risk factors: Can be applied
The SR biases were categorized as follows: 1) biases in finding all studies (sampling bias), 2) biases in selecting studies for inclusion, 3) biases in obtaining accurate data from selected studies, and 4) biases that occur when studies are combined. The components of quality was evaluated with scoring scale (total score = 7,1=extensive flaws, 2-3=major flaws, 4-5 minor flaws, and 6-7 minimal flaws):1. Search methods2. Search comprehensiveness3. Inclusion criteria4. Bias in study selection5. Criteria for validity6. Appropriate validity items7. Combining methods
Evaluation of level of evidence: Not evaluated
Validation: Validated previously index was obtainedReliability: Not reported
49
Author, Year, Goal Tool Type and Development
Conflict of Interest Included
Applicability Description of the Tool Ranking of the Studies Validation
8. Appropriate combining9. Appropriate conclusions.
Lundh, 2008 [83]Goal of the tool and applicability for future use: Critical appraisal- the instructions to authors of the 50 Cochrane Review Groups that focus on clinical interventions for recommendations on methodological quality assessment of studies: Yes
Type of tool/number of criteria (questions): Checklist/7Applicability to the study design: Case-control/CohortReporting of the development: No
No Generated for therapeutic studies: YesApplicability to the studies of incidence/ prevalence: UnlikelyApplicability to the studies of risk factors: Can be applied
Distribution of components to assess quality of the studies in Cochrane SR: generation of the randomization sequence (70%), concealment of allocation (86%), blinding of patients (84%), caregivers (66%) and outcome assessors (96%), and followup (94%).
Two groups graded the evidence for the review as a whole. The Back Group recommended using five levels of evidence (no, conflicting, limited, moderate and strong evidence) for qualitative reviews, where data were impossible or too heterogeneous to pool based on study design and overall study quality. The Musculoskeletal Group recommended four levels of evidence for both qualitative and quantitative reviews based on study design, specific areas of methodological quality and sample size (bronze, silver, gold and platinum). Evaluation of level of evidence: Quality assessment in systematic reviews: 1) The type of methodological quality assessment recommended for individual studies, i.e. a component or a scale approach.2) Areas of methodological quality and other areas recommended to be assessed.3) Recommendations for using methodological
Validation: Note that tools to assess quality do not differentiate quality of the reporting vs. quality of the studyReliability: Not reported
50

Author, Year, Goal Tool Type and Development
Conflict of Interest Included
Applicability Description of the Tool Ranking of the Studies Validation
quality assessments of individual studies in reviews, e.g. for inclusion of studies or for analytic purposes.4) Recommendations to grade the level of evidence for the review as a whole.
Conde-Agudelo, 2008 [84]Goal of the tool and applicability for future use: Specific for the publication - Maternal infection and risk of preeclampsia: No
Type of tool/number of criteria (questions): Checklist/7Applicability to the study design: Case-control/Cohort/Cross-Sectional Reporting of the development: modified from Levine et al, Downs et al, MOOSE
No Generated for therapeutic studies: NoApplicability to the studies of incidence/ prevalence: UnlikelyApplicability to the studies of risk factors: Yes
Questions related to women selection and representativeness of the sample, selection of the cases and controls from the same population, assessment of exposure and outcome, blinding of investigators to both exposure and outcome; loss to followup, exclusions and control for confounding factors.
Studies that meet >5 methodological criteria -high quality vs. those that meet <5 criteria poor quality. Evaluation of level of evidence: Two questions related to causality: temporality of the association and dose response association
Validation: Not reportedReliability: Not reported
51
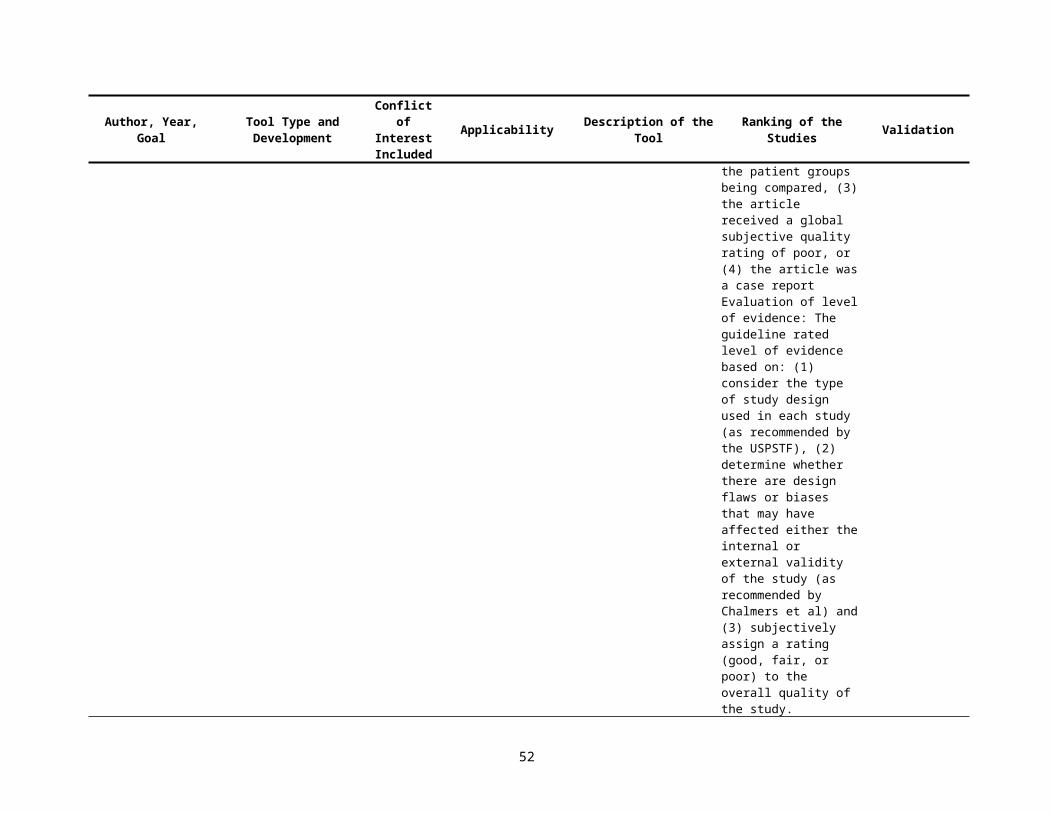
Appendix Table 3. Content of the scales and tools for quality assessment.
Horwitz, 1979 [1]
Methodologic Criteria Number of Studies in Which Compliance Was Not Applicable (NA) or Not Evaluable (NE)Positive (+) Negative (0) Uncertain (±)
1. Predetermined method2. Specification of the agent3. Unbiased data collection (IV P/I R)4. Anamnestic equivalence5. Avoidance of constrained cases6. Avoidance of constrained controls7. Equal diagnostic examination (IV R)8. Equal diagnostic surveillance(IV R09. Equal demographic susceptibility (IV R)10. Equal clinical susceptibility (IV R)11. Avoidance of protopathic bias (IV R)12. “Community control” for Berkson’s bias
A+ complied with standard0 standard was violated± standard not full compliance, but no resulting bias foundA± descriptive accounts to incomplete or ambiguous for definite ratingNE not evaluable
Department of Clinical Epidemiology and Biostatistics, Mcmaster University Health Sciences Centre, 1981 [2]Diagnostic tests for causation
1. Is there evidence from true experiments in humans? (E R)2. Is the association strong? (E R)3. Is the association consistent from study to study? (E R)4. Is the temporal relationship correct? (E R)5. Is there a dose-response gradient? (E R)6. Does the association make epidemiologic sense? (E R)7. Does the association make biologic sense? (E R)8. Is the association specific? (E R)9. Is the association analogous to a previously proven causal association? (E R)
52
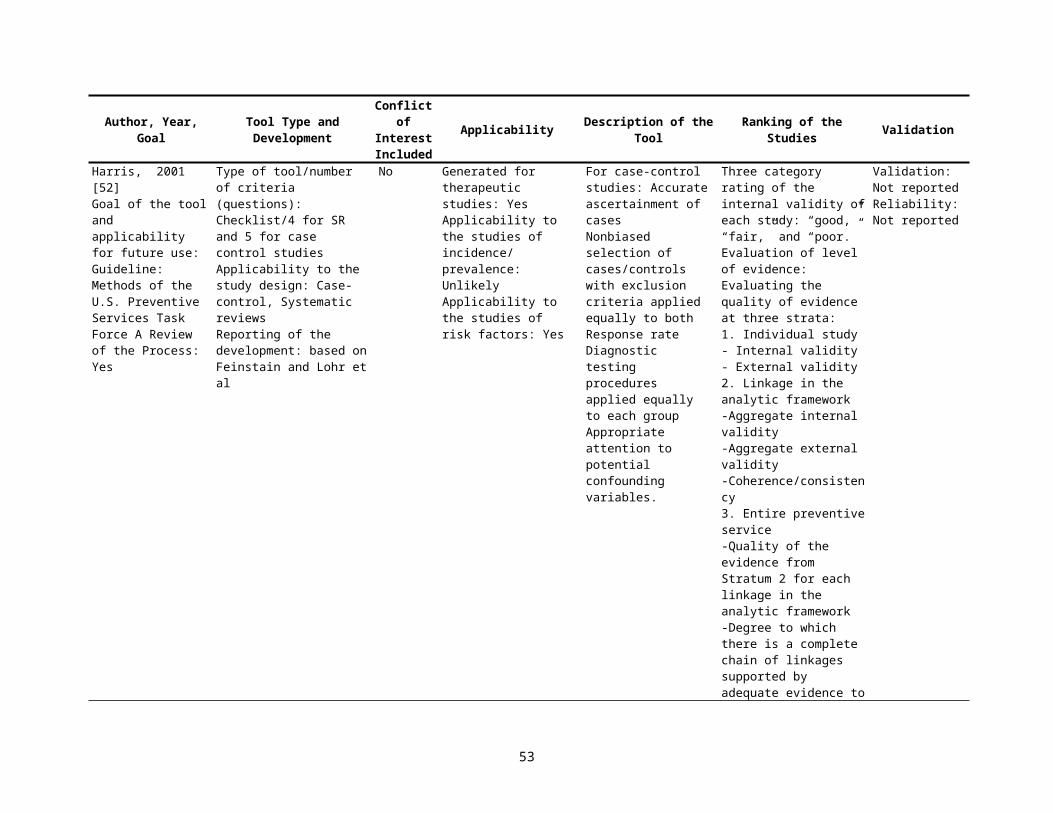
Krogh, 1985 [3]1. Look at the title, the first paragraph, and the last paragraph (or summary) at the end of the article. Could it be urgent and essential, just
from these, that you read the article? Check “yes” or “no”.2. Could it be in any way relevant to you in clinical practice?
For residents only: could it be relevant to you as a resident in this program?If the answer to any of the above is “yes”, proceed. Otherwise stop.
3. Could the summary or conclusions at the end possible follow logically from the hypotheses, introduction or plan at the beginning of the article?
4. Is there a bibliography?Does it appear current or comprehensive?If there is none, is there any indication of what the author’s sources were?
5. Has the author given you any clear reason to consider him/her an authority or particularly well informed on the topic of the article?6. Characterize it as one of the following:
a. Anecdotal-tells a little story-“How I Became a Doctor)b. Opinion-“Abortion is Wrong. Let’s Outlaw It!”c. Descriptive-“A Case of Caffeine Addiction in a Medical Student”d. Survey of the literature-“Current Treatment of Chilblains”e. Research
7. The following question applied only if this is a research article.Is a control group, appropriately matched, used if needed? (IV R)Is the population being studied clearly defined? (EV I/P R)Is this population relevant to the population at large? (EV I/P R)Is the size of the study population adequate to support conclusions? (EV I/P R)Are the conclusions explained clearly?
8. Do the reasoning and factual data lead soundly to the conclusions given? 9. Will you alter your thinking or practice because of this article?10. Is it as well written and documented as the “state of the art” allows?11. Is this article deserving of being presented to:
-our own residents at a care conference, etc.?-one or more of the faculty, for their education?-our alumni (through an alumni journal) as significant current literature?-colleagues in practice?
Please sum up the number of checkmarks in each column. This will give you some criteria for deciding whether this article is worth remembering. Please put a very (one sentence is OK) brief summary of the article and your impressions of it on the back of this sheet.
Yes or No
53
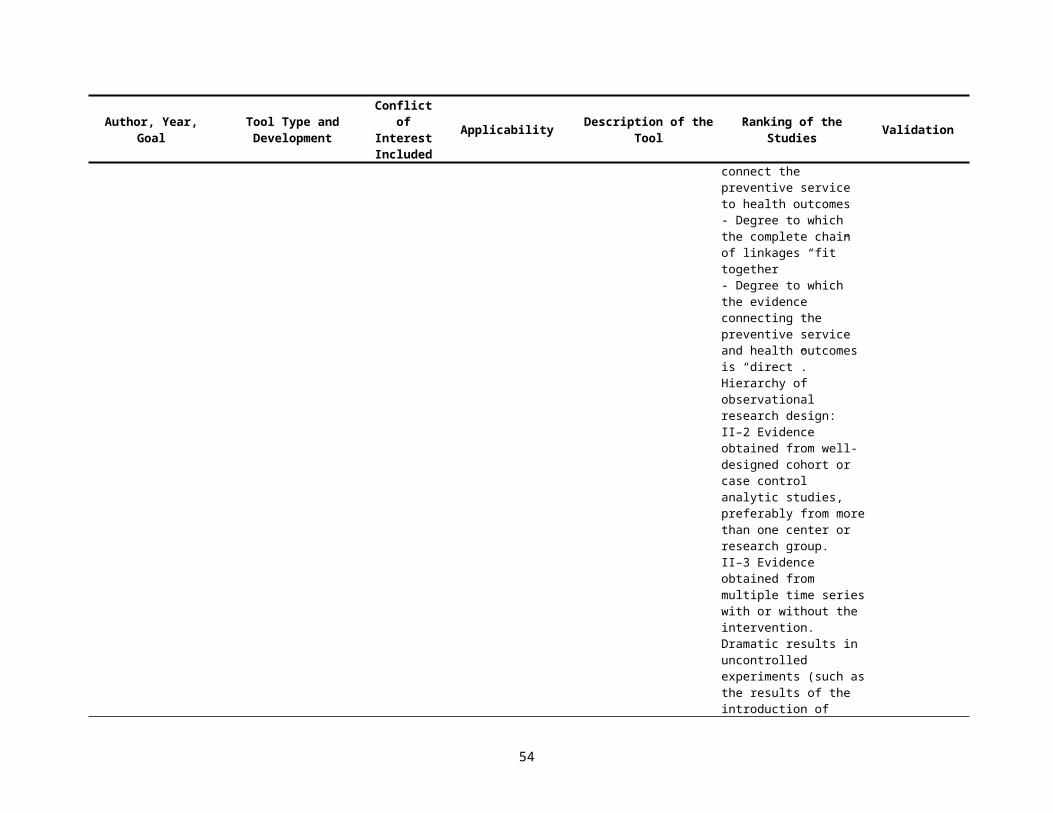
Gardner, 1986 [4]Design Features1. Was the objective of the trial sufficiently described?2. Was there a satisfactory statement given of diagnostic criteria for entry to trial? (IV) 3. Was there a satisfactory statement given of source of subjects? (EV R)4. Were concurrent controls used (as opposed to historical controls)? (IV R)5. Were the treatments well defined? (IV R)6. Was random allocation to treatment used? 7. Was the method of randomization described?8. Was there an acceptable delay from allocation to commencement of treatment?9. Was the potential degree of blindness used? (IV R)10. Was there a satisfactory statement of criteria for outcome measures? (IV R)11. Were the outcome measures appropriate? (IV P/I R)12. Was there a power based assessment of adequacy of sample size? (IV R)13. Was the duration of post-treatment follow up stated? (IV R)Commencement of Trial14. Were the treatment and control groups comparable in relevant measures? (IV R)15. Were a high proportion of the subjects followed up? (IV R)16. Did a high proportion of subjects complete treatment? 17. Were the drop outs described by treatment/control groups? (IV R)18. Were side effects of treatment reported?Analysis and Presentation19. Was there a statement adequately describing or referencing all statistical procedures used? (IV P/I R)20. Were the statistical analyses used appropriate? (IV P/I R)21. Were prognostic factors adequately considered? (IV R)22. Was the presentation of statistical material satisfactory? (IV P/I R)23. Were confidence intervals given for the main results? (IV P/I R)24. Was the conclusion drawn from the statistical analysis justified? (IV P/I R)Recommendation25. Is the paper of acceptable statistical standard for publication?26. If "No" to Question 25, could it become acceptable with suitable revision?
Yes Unclear NoYes Unclear NoYes Unclear NoYes Unclear NoYes Unclear NoYes Unclear NoYes Unclear NoYes Unclear NoYes Unclear NoYes Unclear NoYes Unclear NoYes Unclear NoYes Unclear No
Yes Unclear NoYes Unclear NoYes Unclear NoYes Unclear NoYes Unclear NoYes No
Yes Unclear NoYes Unclear NoYes NoYes NoYes Unclear No
Yes NoYes No
Mulrow, 1986 [5]Criteria were: 1. Cohort assembly (temporal reference point from which patients were diagnosed and studied) (E R)2. Referral source (population from which patients were selected) (EV P/I R)3. Diagnosis (information used to establish diagnosis of diabetes mellitus) (IV P/I R)4. Eligibility (inclusion and exclusion criteria for study patients) (EV P/I R)5. Prognostic stratification (identification of factors other than blood glucose that might affect retinopathy) (IV R)6. Outcome (definition and assessment of retinopathy) (IV P/I R)7. Masked outcome assessment (prognostic or treatment awareness of the person assessing outcome) (IV R)8. Followup (length of followup period and patients who were lost) (IV R)9. Statistical methods (tests used to correlate cohort features with retinopathy) (IV R)
54
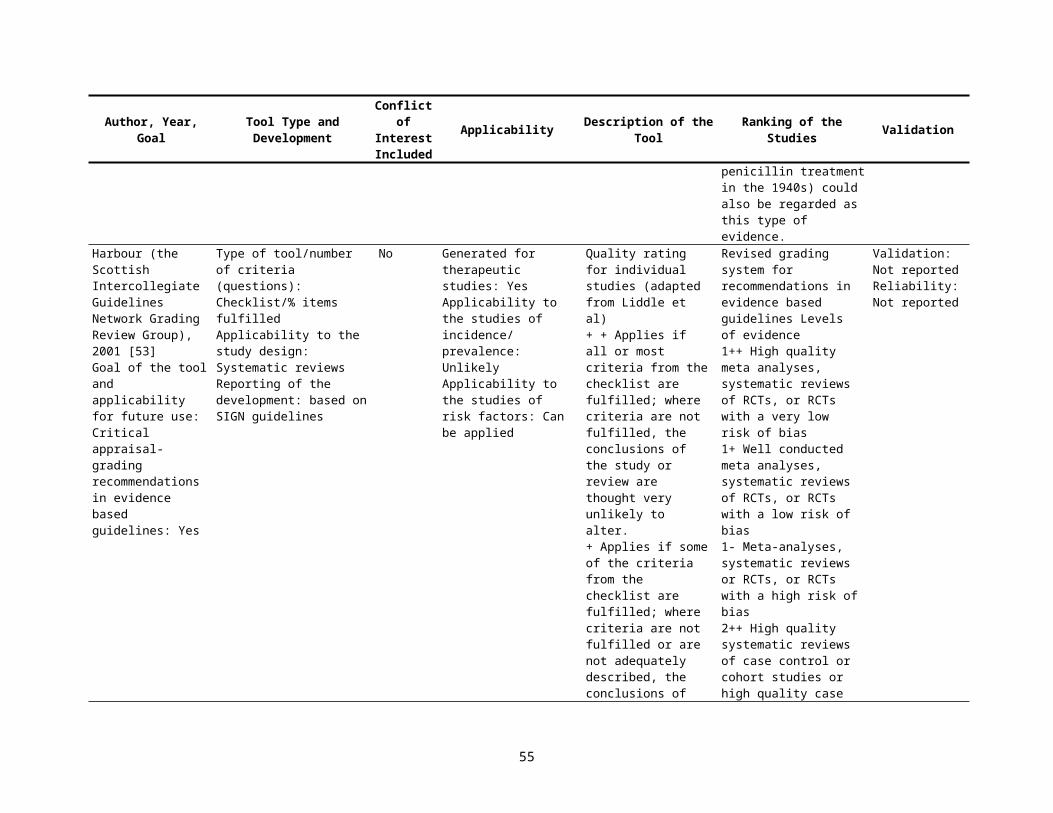
Esdaile, 1986 [6]Table 1. Framework for the assessment of the validity of a cause-effect study that for the study subjects exposed to the principle or comparative maneuver one inquire:1. Was the level of the outcome variable measured in the baseline state and was it similar for those exposed to the principal and comparative maneuvers? (IV R)2. Was their similar eligibility to the principal and comparative maneuvers? (IV R)3. Was their similar prognostic susceptibility at baseline for the outcome event? (IV R)4. Were the maneuvers and co-maneuvers applied or ascertained with similar proficiency? (IV R)5. Was the appropriate outcome variable detected and classified in a similar manner for all study subjects? (IV R)6. Was their adequate follow-up of all those enrolled or satisfactory participation by cases and controls? (IV R)
*In an etiologic study all subjects must be free of the disease of interest prior to exposure (zero time).
Lichtenstein, 1987 [7]A statement of the research questionIdentification of the source of controls (IV R)Identification of the source of cases (IV R)A statement of the conclusions reached from the data (IV R0Exclusion criteria for cases (IV R)A statement of the non-response rate (EV P/I R)Exclusion criteria for controls (IV R)Information on the matching procedure, if used (IV R)Information on the method of data collection (interviewer, self administered questionnaire, record review) (IV P/I R)Information on the presence of possible confounding variables (IV R)Information on the investigation of possible sources of bias (IV R)If an interview or record review were used, information on whether or not these observers were blinded to the status of cases and controls (IV R)Information on the methods used for dealing with confounding variables (IV R)A description of the analytic methods (IV P/I R)A description of the sampling technique (EV P/I R)Information on whether the cases are incident or prevalent (EV P/I R)Diagnostic procedure used to identify cases (IV R)Presentation of confidence limits (IV P/I R)Information on exposure (duration, intensity) (IV P/I R)A statement of whether or not the controls undergo the same diagnostic procedures as the cases (IV P/I R)
55
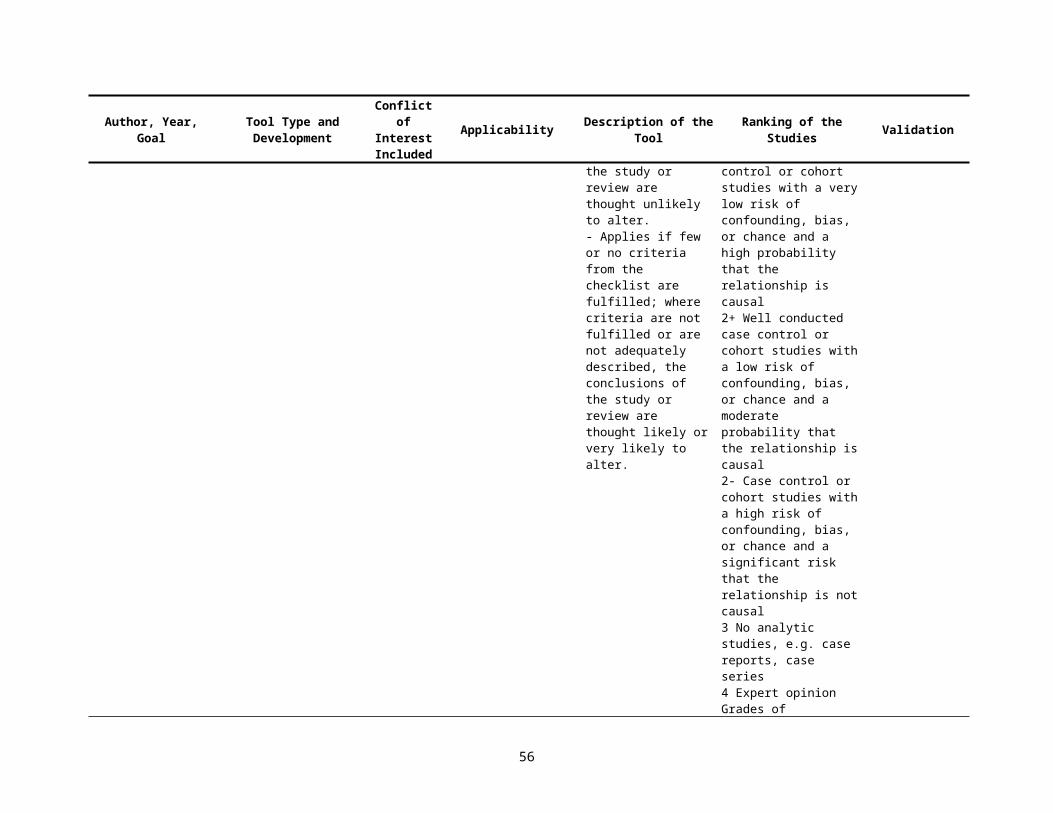
Longnecker, 1988 [8]1. Did at least 90% of hospital controls have conditions other than any of the following: cancer of the liver, oral cavity, larynx, esophagus, or large bowel;
myocardial infarction; cerebrovascular disease; trauma; fractures; peptic ulcer disease; or other conditions that involved upper gastrointestinal tract blood loss, cirrhosis, pancreatitis, alcoholism, or alcoholic hepatitis? (IV R)
2. Is it likely that the referral pattern for the control diseases was similar to the referral pattern for the case diseases? (IV R)Applied only to case-control studies with community controls
3. Was the response rate among controls at least 70% (EV R)4. Were the controls people who, had they developed the disease under study, would have been cases? (IV R)
Applied to all case-control studies 5. Were the data collected in a similar manner for cases and controls? (IV R)6. Were all cases interviewed within six months of diagnosis? (IV R)7. Was the same interview schedule used for cases and controls? (IV R)8. Was the interviewer blinded with respect to the case-control status of the person interviewed? (IV R)9. Was the time period over which cases and controls were interviewed the same? (IV R)10. Were the same exclusion criteria applied to cases and controls? (IV R)11. If the study was a matched case-control study, did the authors either conduct a matched analysis, show that an unmatched analysis was equivalent to a
matched analysis and present an unmatched analysis, or adequately account for the matching factors in an unmatched analysis? (IV R)Applied to followup studies 12. Was loss to followup independent of exposure? (IV R)13. Was the intensity of search for disease independent of exposure status? (IV R)Applied to all studies 14. Was the diagnosis of cancer histologically confirmed in at least 90% of cases? (IV P/I R)15. In the analyses, did the authors control for potential confounding by classic breast cancer risk factors in addition to age. (IV R)
Zola, 1989 [9]A.) Followup Schedules (IV R)
B.) Info on treatment adherence (compliance)
C.) Withdrawals (IV R)
D.) Analysis of withdrawals (IV R)
E.) Patients’ characteristics (IV R)
Adequate: When the paper reported on type and frequencies of different follow-up examinations (routine physical (RPE) examinations only or RPE plus other laboratory and/or diagnostic tests)Partial: When only one of the two above items was reportedInadequate: When no information was reported
Adequate: When authors reported the exact number of patients who completed the planned treatment together with the reasons for withdrawal for those who did not complete therapyPartial: when authors reported the information in a qualitative way without the exact figuresInadequate: when no information was reported
Adequate: When the article stated that no patient was lost to follow-up or gave the precise number of patients withdrawn from the analysisInadequate: When no information was reported
Adequate: When no patient was excluded from the analysis even if follow-up was incompleteInadequate: when exclusions weren’t explained
Adequate: When information on patients age, stage, diagnostic work-up, histology and tumor size was all reportedPartial: When information on age and stage only was reported
56
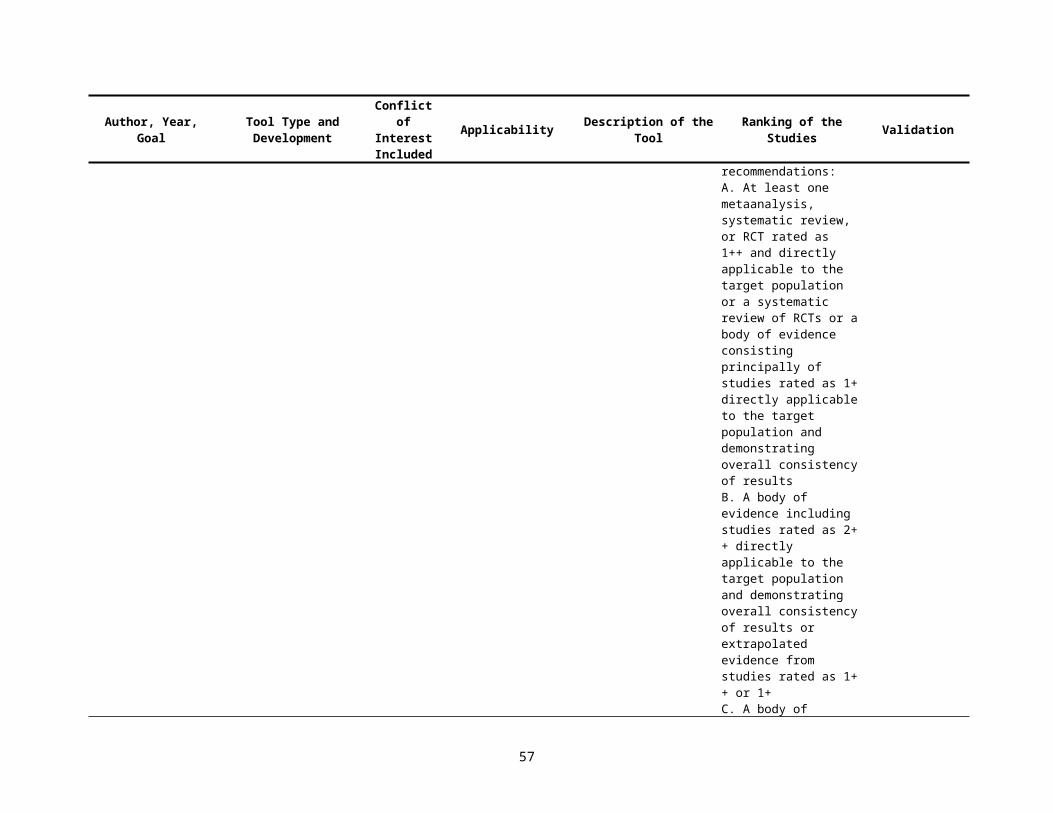
F.) List of non-eligible patients (EV P/I R)
G.) Therapeutic regimen descriptionG.1.) Surgical papers
G.2.) Radiotherapy papers
H.) Timing events (IV R)
I.) Comparison to other series (E IV R)
L.) Quality of internal comparison (IV R)
M.) Discussion of side-effects
Inadequate: When information on age and stage was missing even if other data on patients characteristics are presentedAdequate: When the paper reported information on the overall background from which patients studied were selected. Two ways of reporting were acceptable: either the authors said that “all consecutive patients were enrolled” or they reported the actually number of patients potentially eligible but no enrolledInadequate: When no information was reported
Adequate: When the operative technique(s) were described together with the extent of lymphoadenectomy Inadequate: when some of the above information was missingAdequate: When there was a full description of type of energy employed, source, times, fractioning, and fieldsInadequate: When some of the above information was missing
If followup was completed for all patients; an article was scored “adequate” when percent survival and/or disease-free at three and five years were reportedIf results were based on actuarial estimates the following rules were adopted:Adequate: when the article presented a life table with number of patients at risk at three intervals (one, three, and five years)Partial: When a survival curve without the number of patients at risk was reportedInadequate: When only survival percentages at three or five years were reported without any curve
Yes: When authors discussed their results with a view to understanding the extent to which differences in the distribution of prognostic factors accounted for differences from results in other reported seriesNo: Otherwise
Adequate: When authors discussed their results taking into account differences in the distribution of prognostic factors (i.e. lymph node involvement, tumor size, histology, etc) in different seriesInadequate: When authors did not make such analysis or did it using non relevant prognostic factors N.B. This item applied only to multiple series studies
Adequate: When the article reported on types of side-effects and number of patients who suffered themPartial: When only a qualitative evaluation was reportedInadequate: When the issue was not discussed
57

Reisch, 1989 [10]
1. PURPOSE OF STUDYA. Title consistent with purpose of the studyB. Statement of purpose givenC. Outcome variables for therapeutic effects defined prior to study D. Magnitude of difference in outcome of (T/M) groups under investigation specified prior to studyE. Sources of support for study specified
2. EXPERIMENTAL DESIGNA. Data Collection IV P/I R
1: Data collection planned prior to T/M of subjects; data collected prospectively under specified conditions (IV P/I R)
2. Data collection planned prior to T/M of subjects; data collected etrospectively by record review (IV P/I R)3. Data collection not planned prior to T/M of subjects; data collected retrospectively (IV P/I R)
B. Selection of Subjects (EV P/I R)1. Subjects selected prior to T/M and evaluated prospectively2. Subjects followed from T/M to outcome but study planned after T/M3. Subjects selected according to outcome and T/M evaluated retrospectively4. Unclear time relation of subject selection to outcome of T/M
C. Carry-over or refractory effects avoided or considered in the design of the study3. SAMPLE SIZE DETERMINATION (IV R)
A. Method1. Sample size determined by:
a. predetermined number of subjects orb. sequential experimental designorc. independent monitoring committee
2. Predetermined time period3. Specified time period From to4. No method specified5. Other (describe)
B. Total number of subjects specifiedTotal number of subjects is C. Adequate number of subjects ENROLLED to detect magnitude of T/M differences under investigation or
sufficient hazards identified to preclude further study4. DESCRIPTION AND SUITABILITY OF SUBJECTS (EV P/I R)
A. Entry criteria1. Age of subjects given 2. Race of subjects given
Y = Yes; N = No; U = Unclear or Unknown; NA = Not Applicable;T/M = Treatment or Management Method A”*” is noted beside desirable responses to the criteria considered most important.A “+“ appears beside “Not Applicable” responses to these criteria.
Y N UY* N UY* N UY* NY N U
Y N U NA
Y* N U
Y N UY N U
Y N U
Y* N U
Y N U NAY N U NA
58
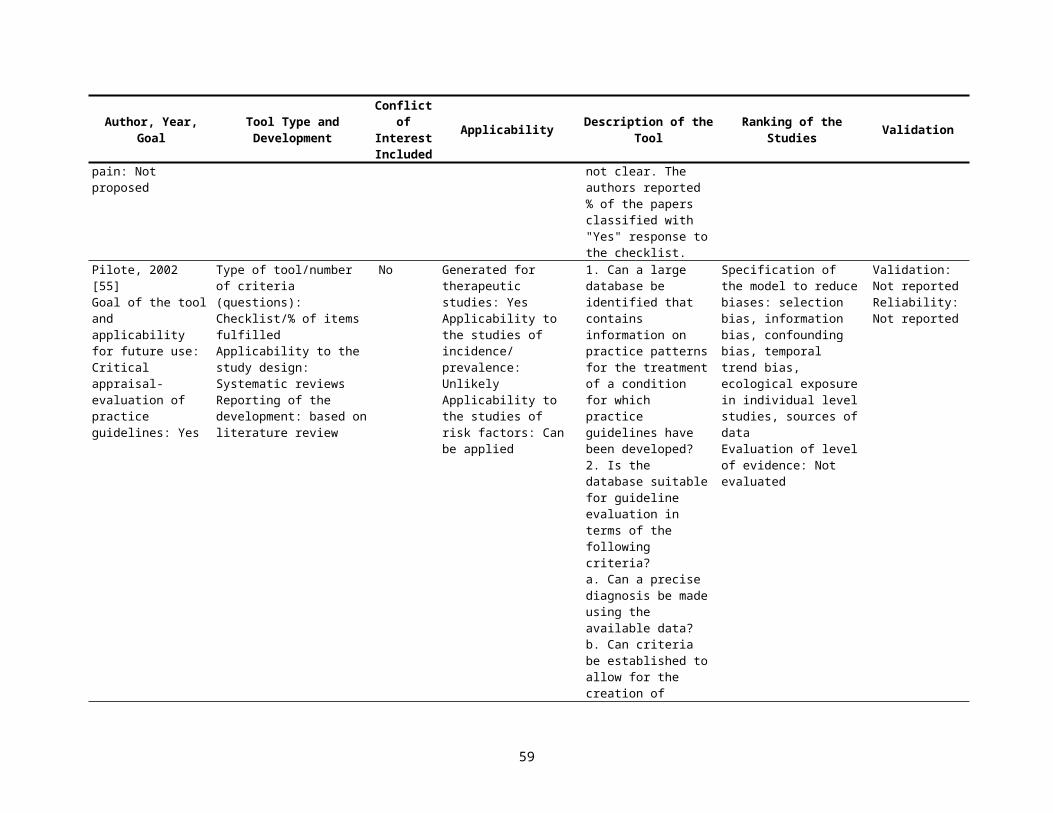
3. Sex of subjects given 4. Socioeconomic status given 5. Disease/health status of subjects given 6. Contraindications for T/M (can include other diseases or treatments)
B. Eligible subjects who refuse to participate are adequately describeC. Subjects adequately described for all appropriate criteria including those listed in 4A D. Subjects selected for this study suitable for question(s) posed by these researchers
5. RANDOMIZATION AND STRATIFICATIONA. It is possible to design a randomized study to evaluate the T/M under considerationB. Randomization claimed and documentedC. Randomization not performed and bias is likelyD. Use of either prognostic stratification prior to study entry or retrospective stratification during data analysesE. Group differences limit the interpretability of this study
6. COMPARISON GROUP(S) (CONTROL) USAGE (IV R)A. Random T/M assignment
1. Unmatched subjects with randomized TIM assignment2. Subjects as own control with T/M order randomized3. Matched by subject with T/M assignment randomized
B. No assignment method describedC. HistoricalD. Subjects matched/paired but assignment to T/M groups not randomizedE. Subjects as own control but T/M order not randomizedF. Subjects compared according to their response to the TIM procedureG. Convenience (Subjects selected for availability)H. Comparison (control) group not includedI. Other non-randomized (explain)
7. PROCEDURES FOR TREATMENT/MANAGEMENT (IV R)A. Informed consent obtainedB. Clear specification of:
1. Dosage2. Time of day administered3. Frequency4. Time to complete T/M5. Route (IV, IM, P0, etc.)6. Presentation (Tablet, syrup, etc.)7. Source for drug or equipment in T/M under investigation8. Indications for
a. Initiation of T/Mb. Modification of TIMc. Discontinuation of T/M
C. Subjects in different TiM groups appear to receive the same care other than that under investigationD. T/M adequately described for above or other appropriate criteriaE. T/M reasonable and appropriate to answer question(s) posed by these researchers
8. BLINDING (MASKING) (IV R)A. Blinding claimed and appears realistic
Y N U NAY N U NAY* N UY* N U NA+Y N U NAY* N UY* N U
Y N U NAY* N U NA+Y N U NAY* N U NA+Y N U NA
Y* N U NA
Y N U Y N U Y N U Y N U Y N U Y N U NAY N U Y N U NA
Y* N U NA+
Y N U NAY N U NAY N U NAY N U NAY N U NAY N U NAY N U NA
Y* N UY* N U NA+Y* N U NA+Y N U NAY* N UY* N U
Y* N U NA
59

B. Blinding (masking) used where feasible for important variables* by the1. investigators 2. caregivers 3. subjects (and family if appropriate)
C. Mark Y if 8Bl, B2, B3 are marked Y or NA. Mark NA + if 8B1, B2, B3 are each marked NA ı* N NA+D. Failure to use blinding likely to bias study results
-We consider a variable important only when it is clearly identified by the author(s) in the abstract or in the statement of purpose to describe differences between groups related to their treatment or management.9. SUBJECT ATTRITION (IV R)
A. Predefined procedures for excluding subjects after entryB. Specific procedures established to minimize loss of subjects from this study [Answer ‘NA’ to 9C and 9D if no
subjects or records were lost or dropped]C. Description of all subjects or their records which were lost or droppedD. Any loss of subjects or their records likely to bias the results of this study
10.EVALUATION OF SUBJECTS AND TREATMENT/MANAGEMENT (IV R)A. All important clinical information reported Y5 N U If no or unclear, explainB. Laboratory and other measurements appear standardized and consistentC. Treatment compliance assessedD. Evaluation methods adequately describedE. Evaluation methods appropriate to answer question(s) posed by investigatorsF. Prospective evaluation of important hazards or toxicityG. If use of T/M increases cost of care substantially, cost-effectiveness discussed
11.PRESENTATION AND ANALYSIS OF DATA (IV R)A. Text clearly understandable.B. All comparisons involve same number of subjects or any discrepancy is explainedC. Descriptive measures(mean, range, standard deviation, proportion, etc.) identified for all important variablesD. Computation errors or contradictions identifiedE. Statistical tests used for comparisons involving important variablesF. Reported statistical tests appear to be:
1. clearly identified2. appropriately used3. appropriately interpreted
G. Responses to items 11E, Fl, F2, F3 marked “ALL”12.RECOMMENDATIONS/CONCLUSIONS (IV R)
A. Recommendation(s) are:1. nonexistent2. unclear3. for further study4. for use of T/M5. against use of T/M method
B. Support for recommendation in 12 A [Respond to only one of the following items]1. Recommendation for use of T/M method based on a controlled, randomized prospective study (if feasible);
made only if convincing benefit is demonstrated and all important hazards assessed; and applied to subjects and conditions similar to those in this study
2. Recommendation against use of T/M method supported by data relating to cost, hazards or toxicity of T/M
Y N U NAY N Some U NAY N Some U NAY N Some U NAY* N NA+Y N U NA
Y N U NAY N U NA
Y* N U NA+Y N U NA
Y* N UY* N UY* N U NA+Y* N UY* N UY* N U NA+Y* N U NA+
Y N U Y* N U NA+All Some NoneY N* UAll Some None
All Some None U NAAll Some None U NAAll Some None U NAY* N
Y* N U
Y* N U
60
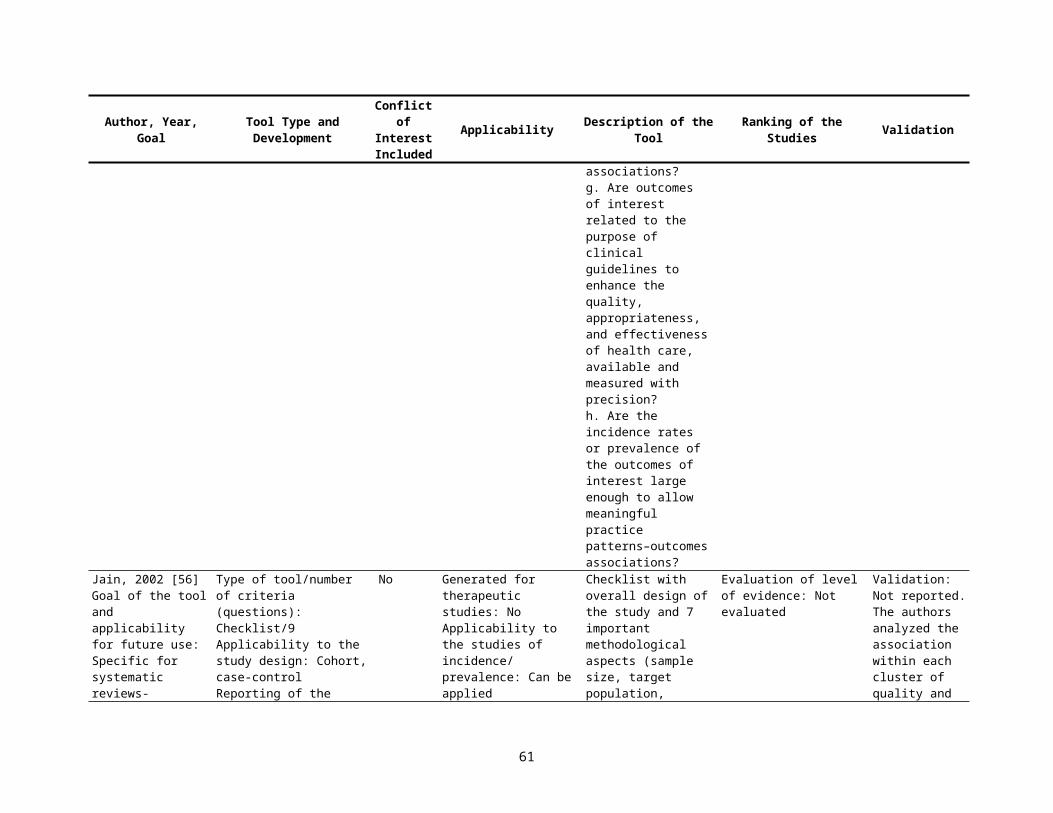
or supported by calculation or appropriate confidence intervals3. Recommendations neither for nor against use of T/M method is appropriate since criteria in 12B1 and 12B2
are not met13.SUMMARY OF ITEMS REVIEWED (IV R)The summary of starred items can be used as an assessment of study quality by calculating the ratio of the starred items marked by the reviewer to the maximum total possible. The maximum total possible is determined by subtracting the Total ‘NA+’ responses marked by the reviewer from 34. As many as 13 ‘NA+’ responses may be recorded (Section 4, 5, 6, 7, 8, 9, 10, ii). 34 - ______________(Number of NA+ Responses) = ______________(Maximum total possible)(Enter maximum total possible on line 14.)ItemNumber1 PURPOSE OF STUDY2 EXPERIMENTAL DESIGN3 SAMPLE SIZE DETERMINATION4 DESCRIPTION AND SUITABILITY OF SUBJECTS5 RANDOMIZATION AND STRATIFICATION6 COMPARISON GROUP (CONTROL) USAGE7 PROCEDURES FOR TREATMENT/MANAGEMENT8 BLINDING (MASKING)9 SUBJECT ATTRITION10 EVALUATION OF SUBJECTS AND TIM11 PRESENTATION AND ANALYSIS OF DATA12 RECOMMENDATIONS/CONCLUSIONS
LINE13 TOTAL14 Maximum Total Possible15 Ratio of total to maximum total possible
SYNOPSIS OF ITEMS REVIEWEDNo. of Starred Items Fulfilled, No. of Starred Items Possible (3,2,3,4,2,1,6,1,1,7,3,1--34 ), No. of NA+ Fulfilled
Y* N U
Spitzer, 1990 [11]APPENDIX A: Abstraction Forms Used in Evaluation of the LiteratureScientific Admissibility and Merit of Original Published ArticlesEvaluation of a Scientific Article of Project (Several Articles)Reviewer #____________ Project #______________ ______________ ______________ ______________ Article #’sProject______________________________ ______________ Date of review
61
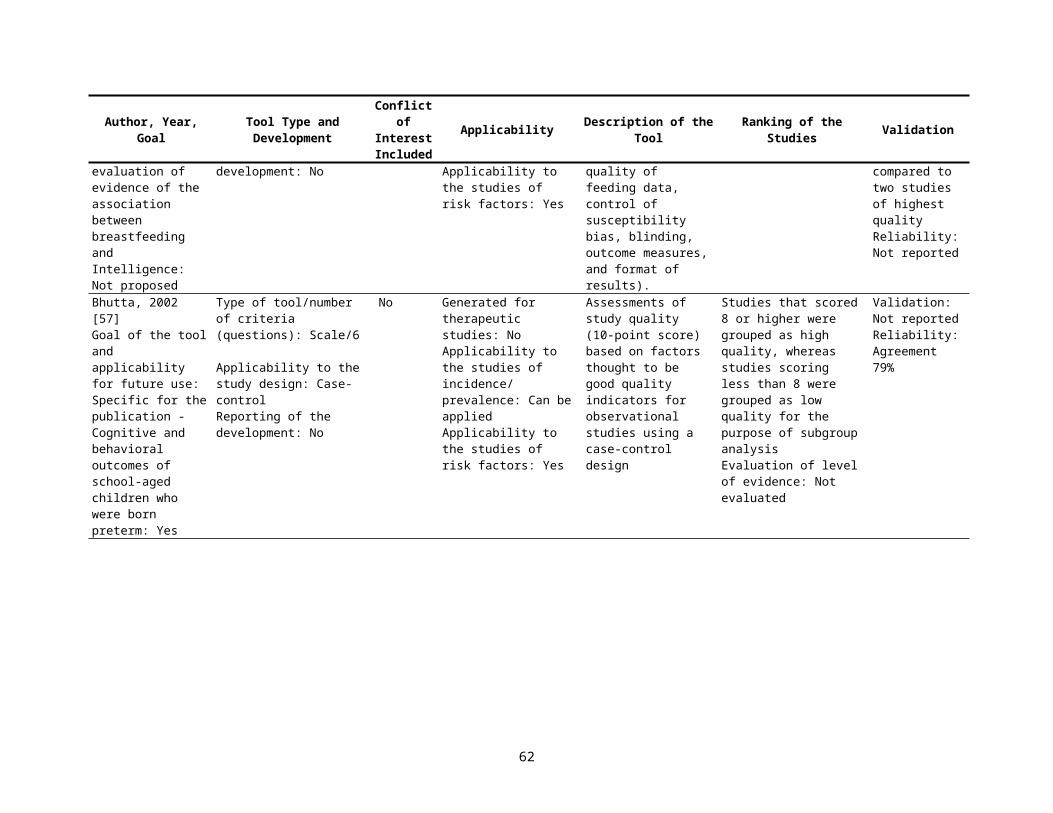
A) Author(s) and Affiliation(s)B) Title of Article(s): ______________________________________________ ______________________________________________ Journal(s): _____________________________________________________ _____________________________________________________ Volume and Page Numbers:_______________________ Year of Publication:_____________________________C.) Brief Summary of Paper: Descriptive Information Cohort Studies single cohort two or more cohorts Exposure factor(s): Outcomes ascertained (IV P/I R) Main source of subjects (EV P/I R) Main type and number of subjects (EV P/I R) Main source of data (IV P/I R) Duration of followup (IV P/I R) Other information:
Case-Control Studies matches pairs or sets design Yes No one comparison group two or more comparison groups Exposure factor(s) (IV R) Outcomes ascertained: Hospital Community Main source of subjects: cases__________ (EV R) controls__________ __________ __________ Main source of data (IV P/I R) Recall span (IV P/I R) Other information:
Cross-Sectional Studies Hospital Community Group under comparison _________________ (IV P/I R) _________________ _________________ _________________ Exposure factor(s): (IV P/I R) Outcomes ascertained: (IV P/I R) Main source of data: (IV P/I R) Recall span for exposure: (IV P/I R) Followup subsequent to cross-sectional study? Yes No (IV P/I R) Other information E:
62
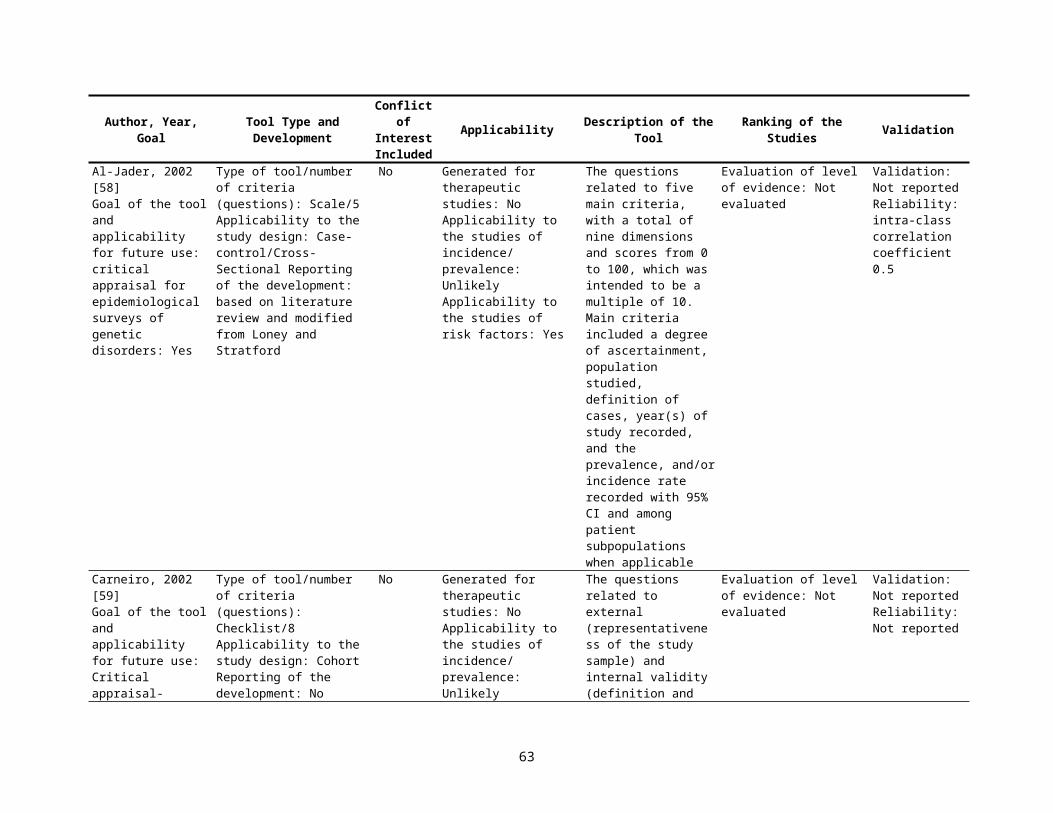
Other types of study RCT Uncontrolled series Other Further comments:
D.) Methological Critique1. Random assignment, properly done2. Suitable choice of reference group (IV R)3. Similar methods of data collection for all groups (IV R)4. Proper sampling or suitable assembly of comparison group (IV R)5. Sample size (IV R)
a. Enables adequately precise estimates of priority variables found to be significantb. Enables adequate precision in secondary variables reported (confounding variables or incidental findings)c. Power reported for nonsignificant findingsd. Power declared a priorie. Clinical or practical significance of statistically significant differences set forth or justified
6. Criteria for definition of measurement of the outcomes are objective or verifiable (IV P/I R)7. Definition of exposure; unambiguous and measurable (IV R)8. Definition of exposure; accurate and verifiable (IV R)9. Blind assessment (IV R)10. Observation bias minimized by design or accounted for in analysis (IV R)11. Selection bias accounted for (EV P/I R)12. Objective criteria for eligibility of subjects (inclusion and exclusion) (EV P/I R)13. Attrition rates (%)
a. Response rate (EV P/I R)b. Losses to follow-up (IV P/I R)c. Other
14. Known confounders accounted for (IV R)a. By designb. By analysis
15. Any methods to attempt comparability between groups, other than randomization (IV R)16. Comparability of groups under comparison demonstrated (IV R)17. Appropriate statistical analytic plan (IV R)
a. Evidence that a priori hypotheses being testedb. Correct method usedc. Adjustment made for
i. Multiple comparisonsii. Simultaneous multiple range testing
d. Display of raw data permits assessment of actual measures and adjustments or transformations made18. Conclusions supported by data presented 19. Reproducibility of method(s) 20. Generalizability of results (EV P/I R)
a. From sample(s) to parent populationb. From sample(s) to any relevant population
63

21. Other, specifyE.) Strengths of the PaperF.) Weaknesses of the PaperG.) Other CommentsH.) Author(s) Key Conclusions (including quantitative value: eg, RR, OR, CI, sample size if reported, p-value, etc.)I.) Reviewer’s Conclusions, if DifferentJ.) Assessment of the ArticleScientific merit Clinical relevance___Very Good ___Highly relevant___Good ___Relevant___Scientifically admissible ___Questionable relevance___Scientifically inadmissible ___IrrelevantReasons (E R)K.) Category: ___Human study or ___Other, specify:_______________Type of study: ___clinical trial or intervention study ___cohort study ___case-control study ___survey ___cross-sectional study (with control group) ___case-series (without control group) ___other descriptive study, specify:____________________ ___other specify:_____________________________I Randomized controlled trial conducted and interpreted properly__II-1 Controlled trial with evidence of comparability of groups__II-2 Well-designed cohort or case-control study__II-3 Case series or cohort study without controls__III Opinions of competent authorities based on clinical experience, descriptive studies, research or studies not classified in the preceding categories
I.) Recommendations Concerning Possible Additional Specialization Reviewer
Berlin, 1990 [12]Measures of activity (IV R) measurement of disease status (IV R)and epidemiologic methods (IV P/I R)
0 Unsatisfactory1 Satisfactory2 GoodSummed total to produce a score from 0 to 6
Seven separate desirable features of a physical activity measure, four desirable components of a coronary heart disease measure, and five desirable aspects of the epidemiologic methods, for a total of 16 components IV R
“.” No or uncertain“+” present (in part)“++” Yes“+” 1 point“++” 2 pointsScore range 0 to 32
64
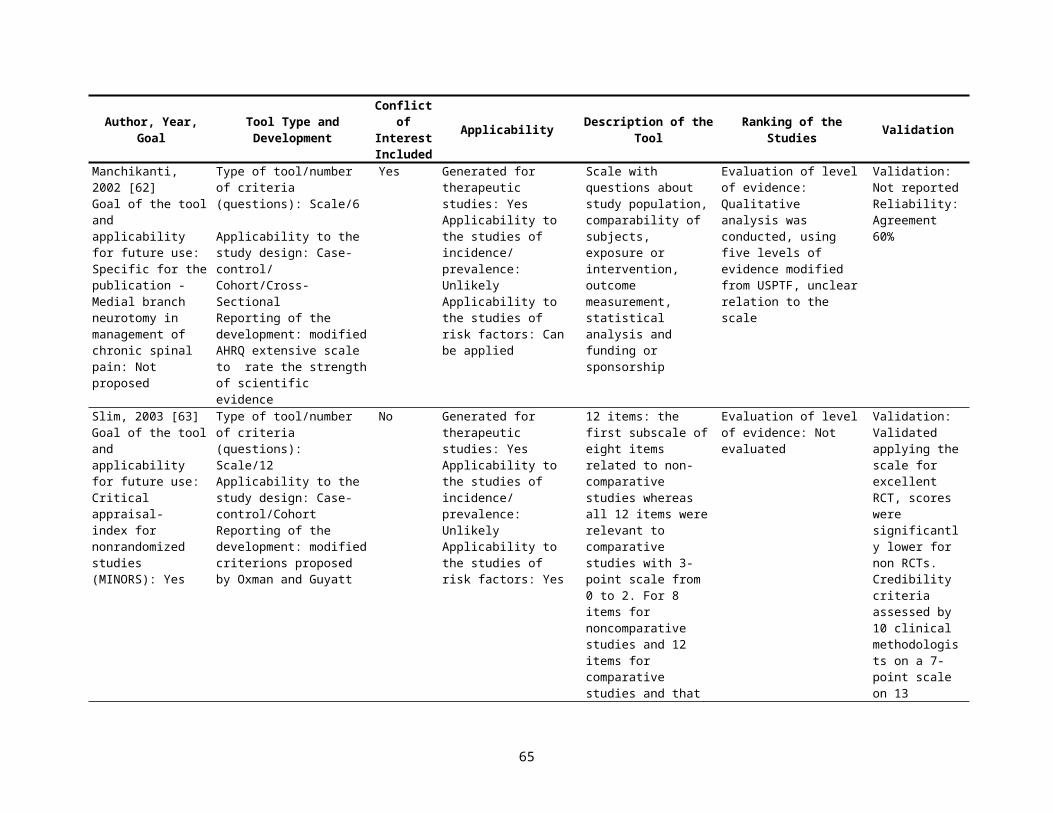
Stock, 1991 [13]APPENDIX B. Validity Assessment FormPopulation
1. Was potential for bias in selection of subjects for study group or controls avoided? (EV P/I R)3. Minimal or no flaws—all potential workers included or, if not, random method used for selection; survivor bias (healthy worker effect) avoided2. Minor flaws—blinded sample but not complete; volunteer bias possible; survivor bias possible (e.g., cross-sectional study design)1. Major flaws—selection method not reported; nonrandom selection
2. Was nonrespondent bias avoided? (EV P/I R)3. Minimal or no flaws—90% or more responded; differences in the response rate between study groups not statistically significant at P<0.12. Minor flaws—response rate 75-89%; differences in the response rate between study groups not statistically significant at P<0.11. Major flaws—response rate not reported; response rate >75%; significant differences in response rate between study groups
3. Were controls and study group comparable with respect to age, sex, socioeconomic status, ethnic origin, history of inflammatory arthritis or previous musculoskeletal injury to body part(s) studied? (If carpal tunnel is an outcome of interest was there control for diabetes, bilateral oophorectomy, use of contraceptive pills, and pregnancy?) (IV R)
3. Minimal flaws—groups comparable on all the above; if not, items were controlled for in analysis2. Minor flaws—some or all confounders measured but difference not controlled for in analysis1. Major flaws—personal confounders not reported or not measured
Exposure4. Were the following confounding exposures controlled for both controls and study group; high participation in racket sports, hand crafts, and/or playing of
instruments; frequency and duration of rest breaks; hours or work/week (including overtime); exposure to workplace stressors, to non-workplace stressors, to cold and/or to vibration? (IV R)
3. Minimal flaws—all relevant exposures measured and controlled for in analysis2. Minor flaws—some or all confounders measured but differences not controlled for in analysis1. Major flaws—exposure confounders not reported or not measured
5. Were direct and valid measures for exposure used such as repetition: frequency and/or duration of work cycle; number of work items (components assembled, pieces of meat cut, garments sewn) completed per unit time; force: weight of tool; measured force exerted; static load: EMG of relevant muscle(s); frequency of should elevations; extreme joint position: direct or video observation of angle of relevant joints; frequency and duration in extreme positions? (IV R)
3. Minimal flaws—appropriate measures of exposure used; applied to controls and study group; frequency, duration and/or intensity of exposure measured where appropriate; measures of exposure applied to each individual subject/control
2. Minor flaws—unable to measure exposure in controls with same method as study group but exposure highly unlikely; only a few subjects measured and data extrapolated to the rest
1. Major flaws—exposure measures not reported or not measured; measure of exposure inappropriateOutcome
6. Were direct and valid criteria used to measure outcome? (IV P/I R)3. Minimal flaws—relevant diagnostic entities identified as outcomes (e.g., carpal tunnel, deQuervain’s, tenosynovitis, extensor or flexor tendonitis,
trigger finger, epicondylitis, rotator cuff and bicipital tendonitis, thoracic outlet syndrome, tension neck, etc.) and for each diagnostic entity relevant and established clinical history and physical examination or other diagnostic test criteria were identified and measured; criteria for symptoms (e.g., pain) took into account duration, frequency and severity; controls evaluated in same way as study group
2. Minor flaws—relevant diagnostic entities identified as outcomes but symptoms measured without regard to frequency or duration; important criteria not included in case definition; outcome diagnosis taken from medical charts without specifying criteria for diagnosis
1. Major flaws—outcome criteria not reported or measured; no diagnostic entities as outcome7. Were the assessors/interviewers of outcome blind to whether a subject was a study group subject/case or a control? (IV R)
3. Minimal flaws—complete blinding of assessors1. Major flaws—blinding not done or not reported
65

Oxman, 1991 [14]Table 1. Criteria for assessing the scientific quality of research overviews*
1. Were the search methods reported? 2. Was the search comprehensive?3. Were the inclusion criteria reported?4. Was selection bias avoided?5. Were the validity criteria reported? IV P/I R6. Was validity assessed appropriately? IV P/I R7. Were the methods used to combine studies reported? E P/I R8. Were the findings combined appropriately?9. Were the conclusions supported by the reported data?10. What was the overall scientific quality of the overview?
*The 10 items referred to in the text are briefly summarized in this table. The complete questionnaire that was used is available from the authors
Scale of 1 to 71-instrument was not meeting goals7-goals were fully met
66
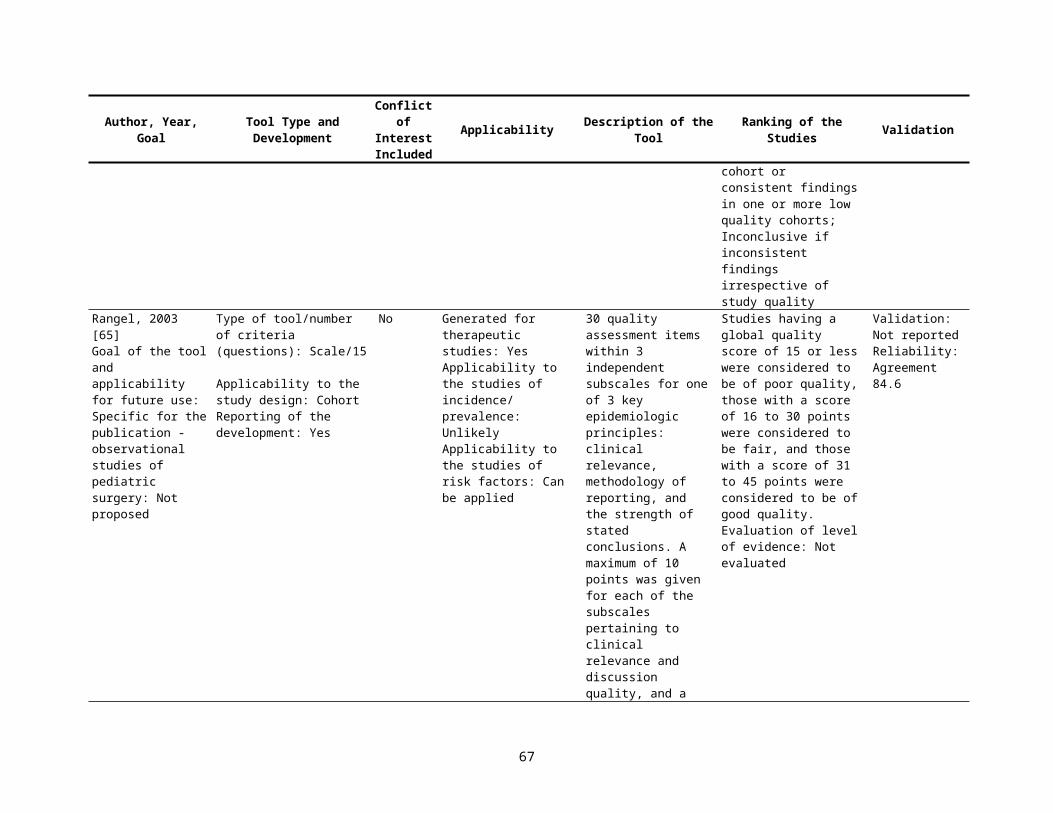
Fowkes, 1991 [15]Guidelines and checklist for appraising a medical articleGuideline (1) Study design appropriate to objectives? (E)
(2) Study sample representative? (EV P/I R)
(3) Control group acceptable? (IV R)
(4) Quality of measurements and outcomes? (IV /P/I R)
(5) Completeness? (IV R)
(6) Distorting influences? (IV R)
ChecklistObjective: Common Design:Prevalence Cross SectionalPrognosis CohortTreatment Controlled trialCause Cohort, case-control, sectional
Source of SampleSampling MethodSample SizeEntry criteria/exclusionsNon-respondents
Definition of controlsSource of controlsMatching/randomizationComparable characteristics
ValidityReproducibilityBlindnessQuality Control
ComplianceDrop outsDeathsMissing Data
Extraneous treatmentsContaminationChanges over timeConfounding factorsDistortion reduced by analysis
+ + = Major problem+ = Minor problem0 =No problemNA= Not applicable
67
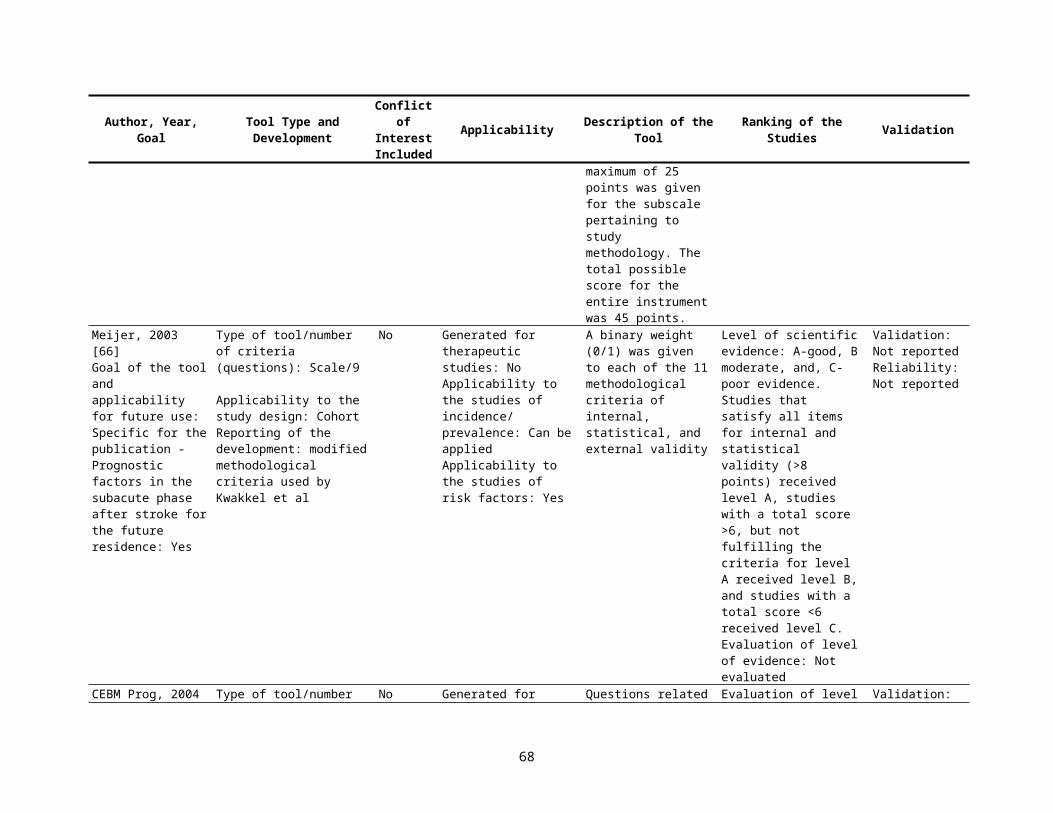
Carruthers, 1993 [16]Levels of evidence for rating review articles:
I.A) Comprehensive search for evidence B) Avoidance of bias in selection of the articles C) Assessment of validity of each cited article IV P/I RD). Conclusions supported by the data and analysis presented
II. Meets only three criteria from IIII. Meets only two criteria from IIV. Meets only one criteria from IV. Meets none of the criteria in I
Carson, 1994 [17] Evaluation Criteria and scoring scheme for prognostic studiesQuality Assessment ItemIdentification of the inception cohort (EV P/I R)
1. Was the selection process for patient enrollment specified?2. Were the patients uniformly identified at presentation (i.e. at the same stage in the disease process)?3. Were the criteria for inclusion and exclusion specified?4. Was any comparative information obtained for the patients who were not enrolled in the study?
Referral patterns 5. Was it possible to determine whether the study institution was a referral center?
Followup of subjects (IV P/I R)6. Were all the patients who were initially entered into the study accounted for in the results?7. Was the vital status of all patients reported?
Statistical methods (IV P/I R)8. Were any statistical tests used?9. Was adjustment for extraneous prognostic factors carried out?10. Were mortality rates (for different followup times periods in the study) and/or Cox proportional hazards
models used in the analysis?
No=0; yes=+1No, uncertain=0; yes=+1No=0; yes=+1No, uncertain=0; yes=+1
No=0; yes=+1
No, uncertain=0; yes=+1No=0; yes=+1
No, uncertain=0; yes=+1No, uncertain=0; yes=+1No, uncertain=0; yes=+1
68

Avis, 1994 [18]Objectives and design √√=Major Weakness
Relevance of the research question? √=Minor WeaknessDesign appropriate for the objectives? 0=No problemSubjects’ harmed or rights infringed? NA= Not Applicable
SampleAppropriate for the aim?Steps taken to ensure representativeness or typicality?Biases in sample?Non-response or exclusions leading to bias?
ControlsDrawn from same target population?Comparability?
EvidenceReliability checked?Validity established?Precautions against bias taken and maintained?Reflexivity in ethnography?Bias due to poor compliance, drop outs, missing data?
Validity of conclusionsAnalytical studies
Contamination?Co-intervention?Confounding variables?
EthnographySeparation of data from analysis?Internal and external coherence?Recognizes interactive character of social life?
AllSufficient evidence to support conclusions?Are conclusions plausible?
Gyorkos, 1994 [19]Cohort Studies (P/I R) Proper assembly of cohort (EV) Control for confounders (IV0 Soundness and completeness in
measurement of intervention/ exposure (IV)
Soundness of outcome assessment (IV)
Blinding of observers( I)V Completeness of followup (IV)
Case Control Studies ® Proper selection of cases and controls (EV) Control for confounders (IV) Blinding of observers to case/control status
(IV) Soundness and completeness in
measurement of intervention/exposure (IV) Soundness of case and control definitions
(IV)
Cross-Sectional (P/I R) Proper selection of study
population (EV) Control for confounders (IV) Soundness and completeness
in measurement of intervention/ exposure (IV)
Soundness of outcome assessment (IV)
Descriptive Studies (P/I) Adequate description of
study population (EV) Soundness of outcome
assessment (IV) Soundness of outcome
assessment (IV)
69
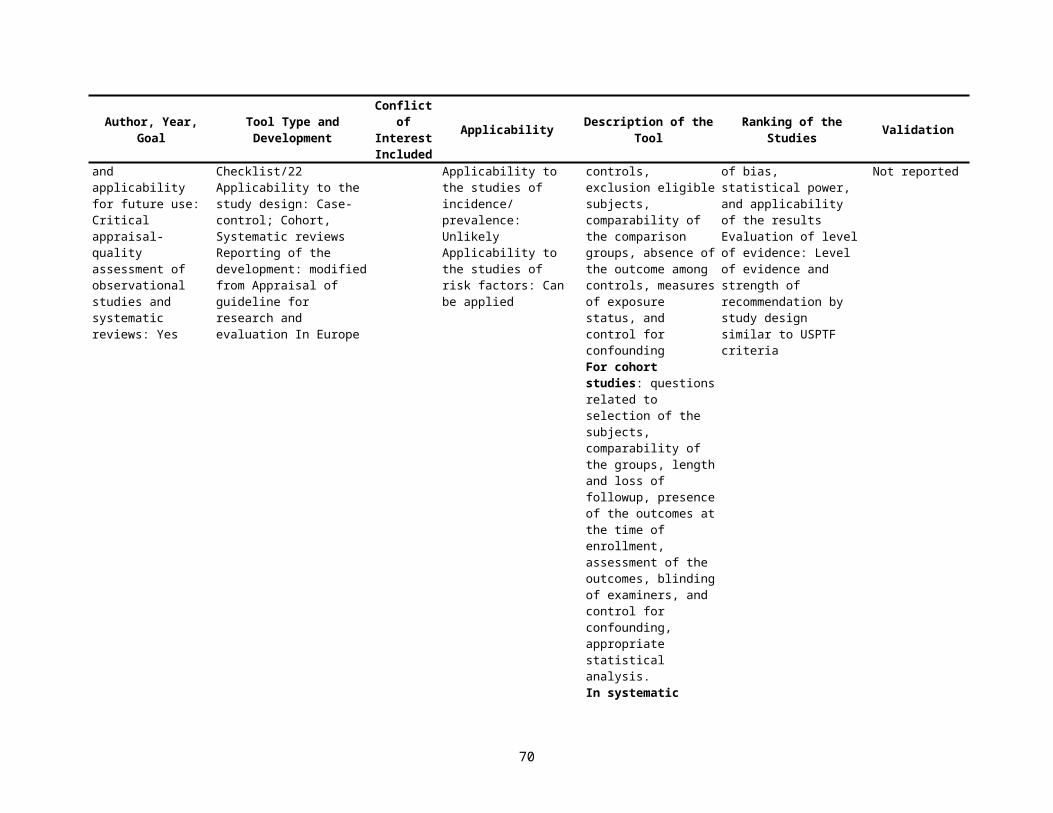
Cho 1994 [20]Table 1. Interrater Agreement of Individual Items on Pretest Methodolgic Quality Instrument
1. What was the study design? (E)2. Were both inclusion and exclusion criteria specified? (EV P/I R)3. Were subjects representative of target population? (EV P/I R)4. Were control subjects appropriate? (IV R)5. Was enough information provided to determine whether sample size was sufficient?( IV R)6. Was power declared a priori? (IV R)7. If blinding of investigators to intervention was possible, was it done? (IV R)8. If blinding of subjects to intervention was possible, was it done? (IV R)9. Was measurement bias accounted for by methods other than blinding observers or subjects? (IV R)10. Were statistical analyses appropriate? (IV P/I R)11. Were attrition of subjects and reason for attrition recorded? (IV R)12. For those subjects who completed the study, were results completely reported? (IV R)13. Were known confounders accounted for by design or by analysis? (IV R)14. Were the drug(s) for which conclusions were drawn actually tested in the study? 15. Were the population(s) for which conclusions were drawn represented by the subjects in the study? (EV P/I R)16. Did the statistical analyses used in the study supported the conclusions? (IV R)
Table 2. Final Methodologic Quality Instrument Items1. Study design (E)Experimental, randomized:
Placebo-controlled trialComparative trial, no placeboTime series trialCrossover trial
Experimental, unrandomized:Placebo-controlled trialComparative trial, no placeboTime series trialCrossover trialNatural experiment
Nonexperimental:Cohort, prospectiveCohort, retrospectiveCross-sectionalCase-controlCase reports or case series
2. What was the study question?3. Was the study question sufficiently described?4. Was the study design appropriate to answer the study question?5. Were both inclusion and exclusion criteria specified? (EV P/I R)6. For case studies only: Were patient characteristics adequately reported? (IV R)7. Were subjects appropriate to the study question? (EV R)
70
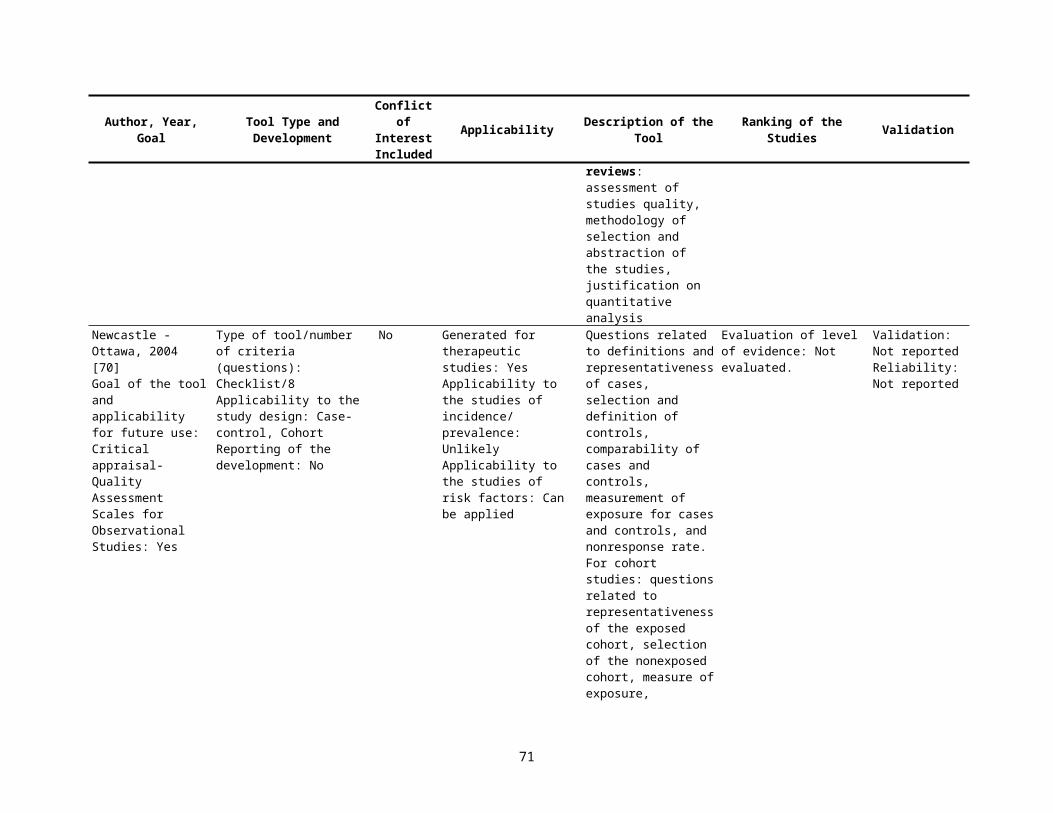
8. Were control subjects appropriate? (IV R)9. Were subjects randomly selected from the target population? (EV P/I R)10. If subjects were randomly selected, was the method of random selection sufficiently well described? (EV P/I R)11. If subjects were randomly allocated to treatment groups, was the method of random allocation sufficiently described? 12. If blinding of investigators to intervention was possible, was it reported? (IV R)13. If blinding of subjects to intervention was possible, was it reported? (IV R)14. Was measurement bias accounted for by methods other than blinding? (IV P/I R)15. Were known confounders accounted for by study design? (IV R)16. Were known confounders accounted for by analysis? (IV R)17. Was there a sample size justification before the study? (IV R)18. Were post hoc power calculations or confidence intervals reported for statistically nonsignificant results? (IV R)19. Were statistical analyses appropriate? (IV P/I R)20. Were the statistical tests stated? (IV R)21. Were exact P values or confidence intervals reported for each test? (IV R)22. Were attrition of subjects and reason for attrition recorded? (IV R)23. For those subjects who completed the study, were results completely reported?( IV R)24. Do the findings support the conclusions? (IV R)
Levine, 1994 [21]User’s Guides for an Article About HarmAre the results of the study valid?Primary Guides:
Were ther clearly identified comparison groups that were similar with respect to important determinants of outcome, other than the one of interest? (IV R)Were the outcomes and exposures measured in the same way in the groups being compared? (IV R)Was follow-up sufficiently long and complete (IV R)
Secondary Guides:Is the temporal relationship correct? (E R)Is there a dose-response gradient? (E R)
What are the results?How stroing is the association between exposure and outcome? (E R)How precise is the estimate of the risk? (E R)
Will the results help me in caring for my patients?Are the results applicable to my practice? (EV P/I R)What is the magnitude of the risk? (E R)Should I attempt to stop exposure? (E R)
71
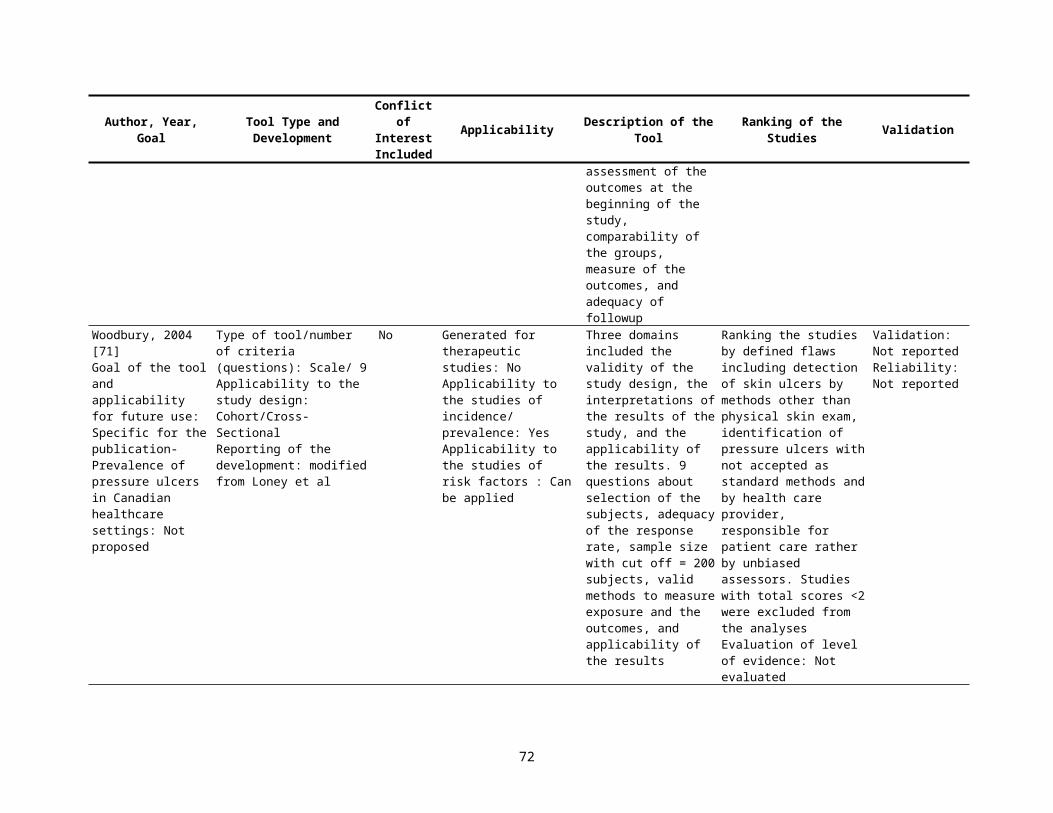
Goodman, 1994 [22]How clear are the specific aims of this study? The research question (distinguishing main from secondary) and, if appropriate, hypotheses about what will be found
1 not clear, 2, 3 somewhat clear, 4, 5 clear
How clear are the eligibility (inclusion and exclusion) criteria? (EV P/I R) 1 not clear, 2, 3 somewhat clear, 4, 5 clearFor studies in which groups are compared, is there enough information to judge the suitability of the comparison groups? How well was it reported how patients were chosen (for observational studies) or allocated (for experiments) so that readers can judge whether the researchers have compared like with like? (IV R)
1 no information, 2, 3 some information, 4, 5 all necessary information
How clear is the study design? Do you understand what the author set out to do and how they did it (the study design)? (E P/I R)
1 not clear, 2, 3 somewhat clear, 4, 5 clear, NA
How adequate is the description of the masking (i.e. blinding) procedure? Is it clear who was blinded, what blinding procedure was used, and the degree to which blinding achieved? (IV R)
1 inadequate, 2, 3 fair, 4, 5 adequate, NA
Is the operational definition of major variables clear enough so their strengths and limitations can be assessed. For example in surveys, case definitions; in cohort studies, definitions for exposure and disease status; in diagnostic studies, the test procedure; for case control studies, is it clear how cases and controls were defined? Other major variables might include important confounders, compliance, etc. (IV R)
1 not clear, 2, 3 somewhat clear, 4, 5 clear, NA
How adequate is the reporting of important side-effects? For example, what are the types and numbers? 1 inadequate, 2, 3 fair, 4, 5 adequate, NAHow complete is the information (reasons and numbers) on eligible subjects who were no included? For example, subjects might not be included because they refused to participate, their records were lost, or they were not compliant during a run-in period. Is there enough information to judge, even in a general way, the comparability of the participants and non-participants in the study? (EV P/I R)
1 no information, 2, 3 incomplete, 4, 5mplete, NA
How adequate is the description of the enrolled sample, including potential cofounders, effect modifiers, co-interventions, comorbidities and spectrum of disease? (in comparative studies, this would mean description by group.) Is there a description (a table when necessary) of the characteristics of the enrolled sample, including potentially important demographic and prognostic factors or other descriptors that would help you to evaluate the comparability of the groups and/or the generalizability of the study results. (EV IV P/I R)
1 inadequate, 2, 3 fair, 4, 5 adequate, NA
How clear are the outcomes for everyone enrolled in the study? In addition to the main outcomes of the study, how well do the authors document the number of protocol violations, dropouts, crossovers, subjects with incomplete data, subjects who died for reasons other than the main reason under the study, etc.?
(IV P/I R)
1 not clear, 2, 3 somewhat clear, 4, 5 clear, NA
Are the quantitative methods the right ones for the research questions and data? Are the methods appropriate for the unit of analysis (e.g. person, events, or clusters), sample size and type of outcome (e.g. dichotomous or continuous, time to event)? (IV R)
1 not right, 2, 3 partly right, 4, 5 right, NA
Are quantitative results reported in a manner that most of the intended audience could understand? Consider whether units are clear (particularly of regression coefficients), whether the results are in the most accessible scale (e.g., non-logarithmic), and whether there should be additional effort to interpret technical results for the reader.
1 no, 2, 3 possibly, 4, 5 yes, NA
How adequate is the reporting of denominators? For averages, percentages, rates, ratios, etc. 1 inadequate, 2, 3 fair, 4, 5 adequate, NAAre the magnitudes of effects reported? “Effects” include odds ratios, risk differences, differences between means, regression coefficients, etc. (but not P values), and should be either stated directly or readily apparent form the data presented.
1 no, 2, 3 they are omitted in some important places, 4, 5 yes, whenever appropriate, NA
In studies of diagnostic tests, how adequate is the reporting of summary statistics for test performance? Summary statistics include sensitivity, specificity, predictive value, ROC curve, or likelihood ratio.
1 inadequate, 2, 3 fair, 4, 5 adequate, NA
Are confidence intervals or standard errors reported for main outcomes? If the main outcome is a difference between groups, or within patients, the statistical precision of that difference should be reported.
1 no, 2, 3 they are omitted in some important places, 4, 5 yes, whenever appropriate, NA
72
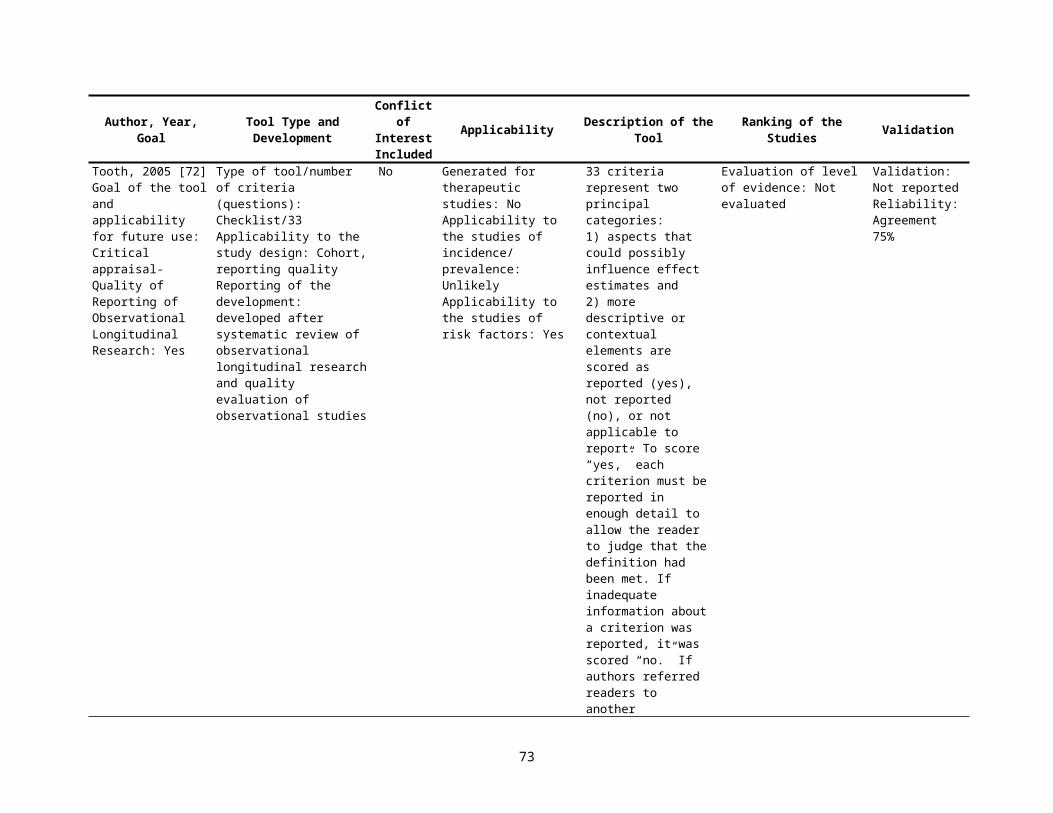
How appropriate is the balance between detail and summary results? 1 inadequate, 2, 3 fair, 4, 5 adequate, NAHow appropriately are dropouts, crossovers, or subjects with incomplete data dealt with in the analysis? Techniques to deal with these problems include intention-to-treat analyses, comparison of these groups at baseline, analyses stratified by these factors, and sensitivity analysis. (IV P/I R)
1 inadequate, 2, 3 fair, 4, 5 adequate, NA
How adequate is the method used to control or assess the effects of multiple measured variables? If multiple variables are considered only singly, should joint effects be evaluated? Is a reasonable multivariate method chosen (e.g. stratification, adjustment, regression, ANOVA)? Does the variable coding permit adequate control? (IV P/I R)
1 inadequate, 2, 3 fair, 4, 5 adequate, NA
How adequate is the reporting of analyses of multiple variables? Are we told how the initial pool of possible predictors was chosen, how the final ones were selected, the coefficients or effects (in interpretable units) of all terms in the final model, the coding of each variable, and the number of subjects with each predictor or the spread of predictor variables? (IV P/I R)
1 inadequate, 2, 3 fair, 4, 5 adequate, NA
Are clinically relevant subgroup effects explored in appropriate detail (neither too much more too little) (IV P/I R)
1 inadequate, 2, 3 fair, 4, 5 adequate, NA
Do the figures and tables effectively summarize important data? Include in your judgment whether tables and figures are accurate and clear, whether tabular data would be better presented graphically or vice-versa, and whether the balance between text and figures/tables is appropriate
1 no, 2, 3 somewhat, 4, 5 yes, NA
Is it clear what the study adds to the body of knowledge in its field? 1 unclear, 2, 3 somewhat clear, 4, 5clear, NAHow appropriate is the presentation of other supporting evidence that may be relevant to these conclusions (including theoretical reasoning, basic science results)? An appropriate presentation would be neither too detailed nor deficient.
1 inappropriate, 2, 3 fair, 4, 5 appropriate, NA
How appropriate is the discussion of study limitations? An appropriate discussion would be neither too detailed nor deficient
1 inappropriate, 2, 3 fair, 4, 5 appropriate, NA
Is it clear if the authors are generalizing? If so are these generalizations justified? For example for different patients, interventions, follow-up times, outcomes, etc.? (EV P/I R)
1 there is no acknowledgment of the generalizations, 2, 3 the generalizations are acknowledged, but not well justified, 4, 5 any generalizations are acknowledged and reasonably justified, NA
Is the strength and/or tone of the conclusion appropriate to the design and results? (E) 1 inappropriate, 2, 3 fair, 4, 5 appropriate, NAHow good is the title? For example clear, concise, and accurate? 1 poor, 2, 3 fair, 4, 5 excellent, NADoes the abstract adequately summarize the data and conclusions? 1 inadequate, 2, 3 fair, 4, 5 adequate, NAIs the manuscript concise? 1 no (the text could be tightened by >25%), 2, 3
somewhat (about 10% to 15% could be cut), 4, 5 yes, NA
How good is the organization of this report? For example are all methods in the methods section, all results in the results section?
1 poor, 2, 3 fair, 4, 5 excellent, NA
How would you describe the style of the presentation? 1 Opaque, 2, 3 Workmanlike, 4, 5 Elegant, NAHow would you describe the overall quality of this report? 1 Poor, 2, 3 Fair, 4, 5-Acceptable-6, 7, 8 Good,
9, 10 Superb
73
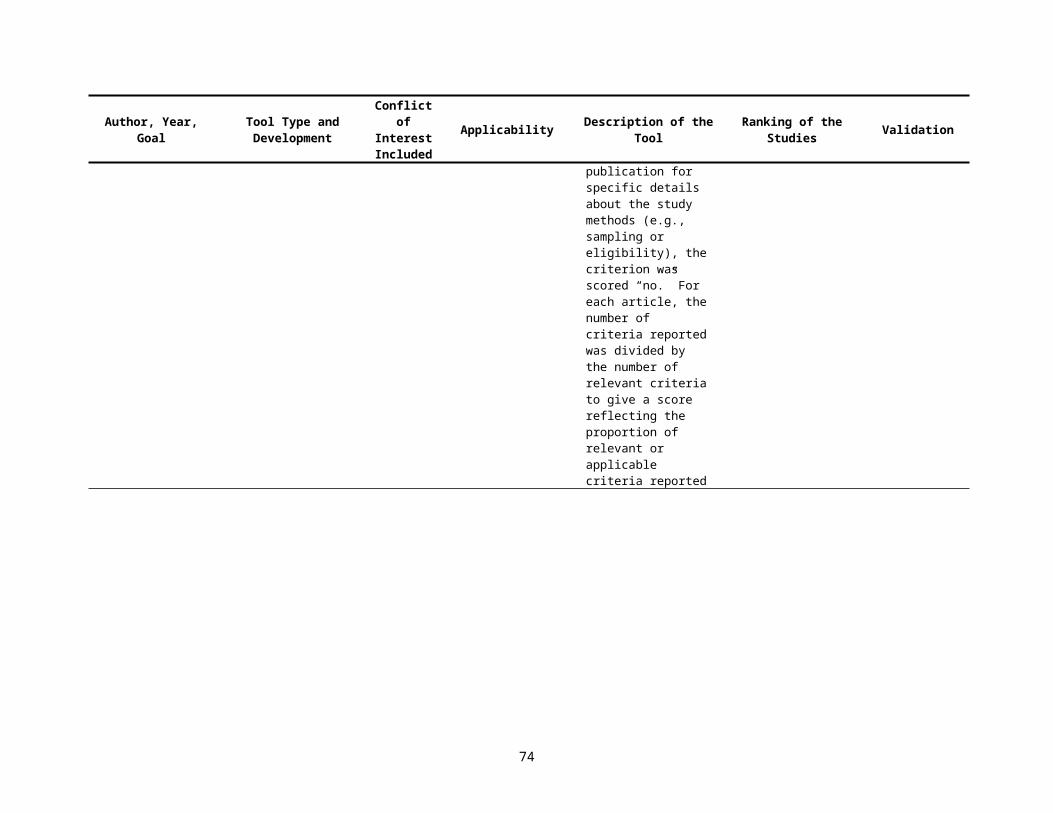
DuRant, 1994 [23]I. Introduction
a. Is the review of the previous research appropriate and sufficient? Have the relevant studies been cited and discussed?b. Is the problem to be studied clearly stated?c. Is the significance of the problem established?d. Have the authors established a theoretical framework for their study?e. Are the theoretical terms or concepts clearly described and defined?f. Are the objectives or the hypotheses clearly stated?g. Does the literature review provide a justification for the hypotheses (do the hypotheses logically flow from the literature review)?h. Do the hypotheses logically flow from the theoretical model?
II. Methods and Proceduresa. Are the methods that were selected appropriate to adequately test the hypotheses? b. Is there evidence of protection of human subjects in terms of the study being approved by an institutional review board? c. Is the study design: (E)
1. Experimental or quasi-experimental (go to III)2. Survey or cross sectional (go to V)3. Retrospective chart (Medical Record) reviews and retrospective study (go to VII)4. Case-control study (go to VIII)
III. Experimental or Quasi-Experimental Designsa. Has the study sample been clearly described in terms of sample size and demographic characteristics such as age, gender, location, socioeconomic
status, etc.? (EV P/I R)b. Do the authors describe how the subjects were selected? Were they selected randomly, haphazardly, convenience sample, clinic population, etc.? EV
P/I R)c. What were the selection-eligibility criteria? (EV P/I R)d. Were the selection-eligibility criteria applied without knowledge of the specific treatment regimens to which the patients were being assigned?e. Did the selection criteria have an impact upon the subject’s response to the treatment? For example, were subjects selected because they scored
either very high or very low on a particular scale or were patients at low risk or high risk of contracting a particular disease selected for study? (EV P/I R)
f. How were subjects assigned to experimental groups? (Any method besides random indicates that the study is a quasi-experimental design).g. If subjects were randomly assigned to treatment and control groups, how was randomization accomplished? Was a random number table used?
(Methods such as alternating assignments, coin toss, picking numbers out of a hat are not random.)h. Were individual subjects randomly assigned to treatment and control groups or were subjects assigned to treatment and control groups in blocks or
groups?i. If subjects were randomly assigned to experimental groups on an individual basis, is it possible that subjects within treatment and control groups may
have interacted, leading to a contamination of the treatment effect?j. If subjects were assigned to experimental groups en bloc, were a sufficient number of blocks included in each treatment group to insure adequate
statistical power?k. Were subjects blinded as to what experimental groups they were assigned to? (IV R)l. Was the individual measuring the outcome variable(s) blinded to the experimental group that the subject was assigned? (IV R)m. If the subjects had knowledge of which experimental group they were in, did this knowledge influence the subjects’ responses to either the treatment or
control interventions?n. If the investigator measuring the outcome variable was not blinded, was the outcome variable measured in such a way that such knowledge could bias
this measurement? (IV R)o. Do the investigators clearly describe the treatment effect or intervention? Are the outcome, independent and control variables measured with
appropriate and accurate methods? Do the operational definitions of the variables match the theoretical definitions?( IV P/I R)
74
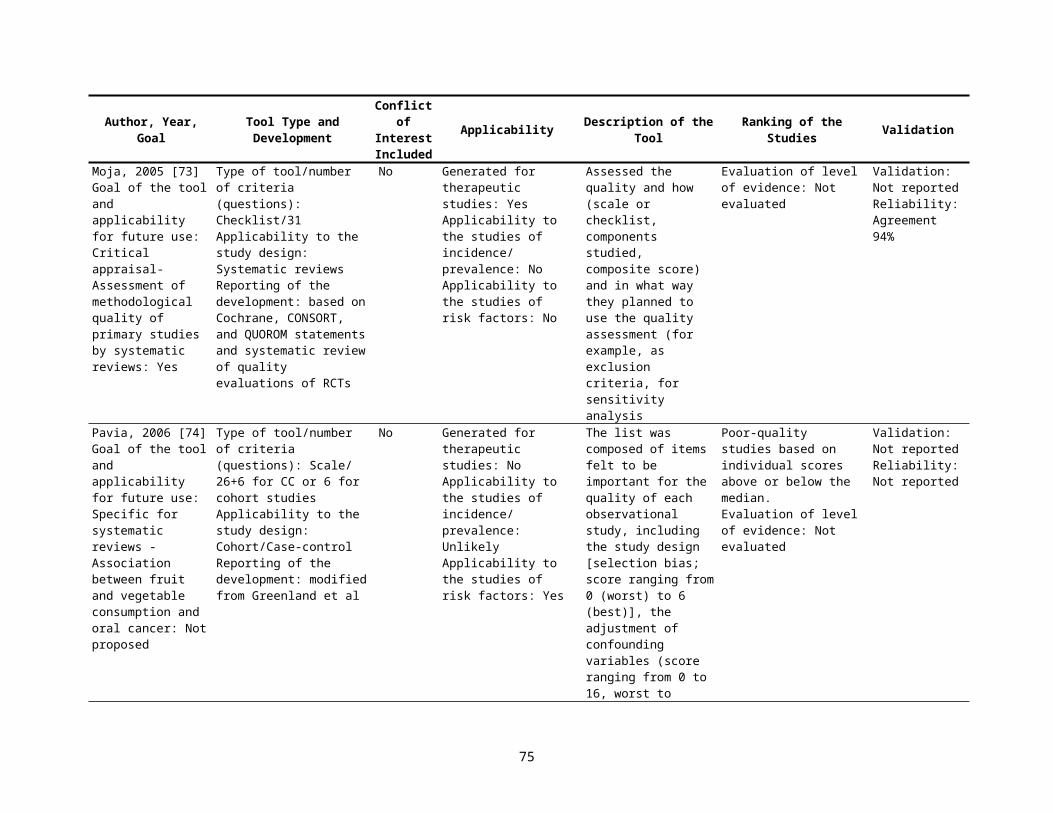
p. Have the laboratory tests, instruments and/or questionnaires used to measure the variable undergone validity and reliability testing? (IV P/I R)q. Have the procedures or methods used to measure each of the variables undergone standardization for the particular population that is being studied?
(IV P/I R)r. Did the subjects in the control or comparison group receive the exact same experimental procedures and measurements as the subjects in the
treatment group, except for the treatment intervention? (IV R)s. Was there strict adherence to the protocol? t. Were the side effects from the treatment and control interventions clearly described?u. Was compliance with the treatment and the control intervention clearly described and was compliance measured with an appropriate method?v. Was compliance different in the treatment and control groups?w. Was subject attrition discussed adequately? (IV P/I R)x. Was attrition kept to less than 10% in both groups? (IV P/I R)y. If a multi-center trial was used, what methods were used to insure that the experiment was conducted that same at all centers?z. Do the investigators compare the results from the different centers prior to pooling the data for final analysis?
IV. Statistical Analysis for Experimental Designsa. Were between group comparisons made at the pretest period and then at the posttest, or do the investigators assess the results using within group
comparisons, assessing pretest-posttest differences within each experimental group? (IV R)b. Do the investigators demonstrate a lack of statistical differences in the pretest measurements between the control and the treatment groups? If not,
was a covariance analysis used? (IV R)c. If the investigators indicate that a t-test for two independent means was used to analyze the data, were the following assumptions met: (IV R)
1. Two and only two groups are compared2. That the outcome variable is measured on a interval, ratio, or continuous level scale3. That the variances of the measurement of the outcome variable are similar for both the treatment and control group4. That the measurement of the outcome variable is normally distributed (in a bell-shaped curve), or was the sample size large enough to invoke the
central limit theorem?d. If more than two groups are compared do the investigators use an analysis of variance test? Note: the assumptions of the analysis of variance test are
the same as the t-test except that three or more groups can be compared simultaneously. (IV R)e. If an analysis of variance test is used is it followed by an appropriate multiple comparison test? (Go to IX) (IV R)
V. Survey Designs and Cross Sectional Studies a. Are the criteria for inclusion of subjects described? (EV P/I R)b. Has the study sample been clearly described in terms of sample size and demographic characteristics such as age, race, gender, location,
socioeconomic status, etc.? (EV IV P/I R)c. Is the study sample appropriate to the problem being studied or the hypotheses being tested? (IV P/I R)d. Is the study sample large enough to test the hypotheses? (IV R)e. How was the study sample selected (random, haphazard, consecutive patients presenting with a particular disease, all subjects in a particular group,
etc.)? (EV P/I R)f. Is the design of the study clearly described? g. Does the design of the study adequately test the hypothesis? (E R)h. How was random selection of subjects achieved? Was any other method besides the use of a random numbers table used? (EV P/I R)i. Have the measurement of the outcome, independent, and control variables been clearly described? (IV P/I R)j. Are the variables measured with appropriate and accurate methods? Do the operational definitions match the theoretical variables? (IV P/I R)k. Have the laboratory tests, instruments and/or questionnaires used to measure the variables undergone validity and reliability testing? (IV P/I R)l. Have the procedures or methods used to measure each of the variables undergone standardization for the particular population that is being studied?
(IV P/I R)m. Were the outcome variables measured using appropriate “blinded” methods? (IV P/I R)n. Have the number of non-respondents, refusals, and subjects lost the follow-up been kept reasonably small (less than 10%)? (EV IV P/I R)
75
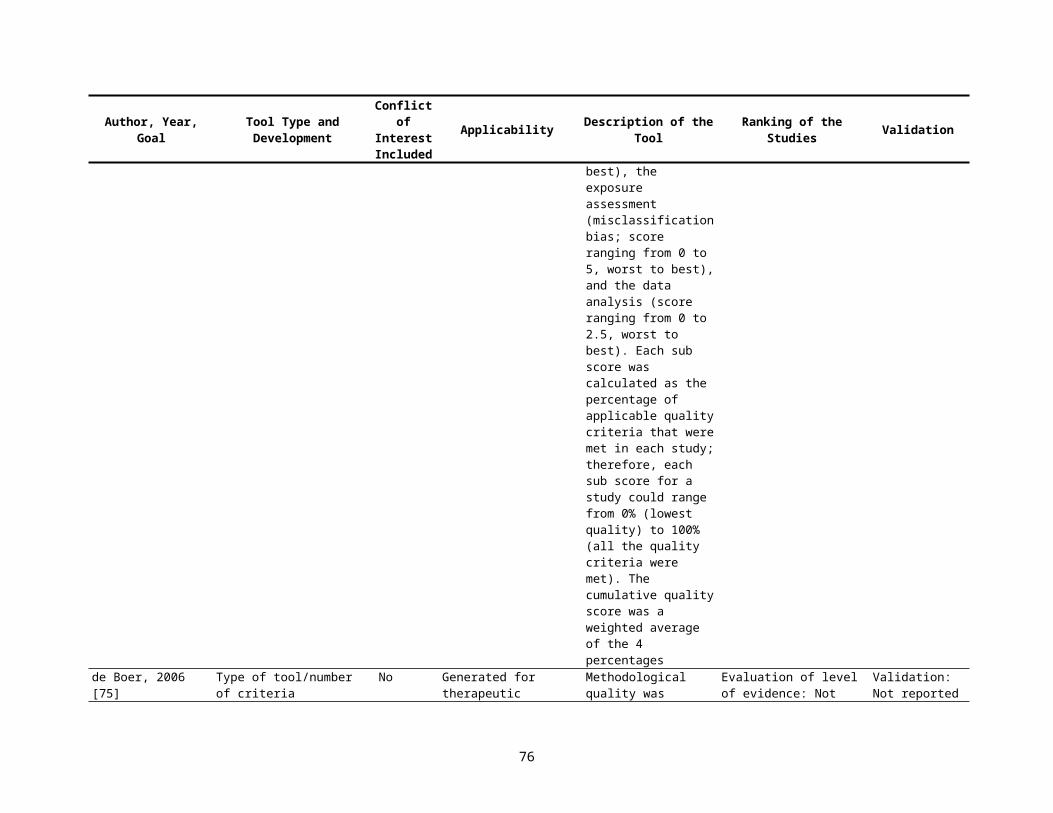
o. Was there strict adherence protocol?VI. Statistical Analysis for Survey Designs and Cross Sectional Studies (IV R)
a. Were the statistical tests chosen to analyze the data clearly described?b. Were the statistical test chosen to analyze the data appropriate in terms of
-adequately testing the hypotheses?-matching the study or research design?-meeting the statistical assumptions of the distribution of the data and the types of scales that were used to measure the outcome, independent and control variables-the manner in which the sample was selected (random vs. other),-sample size?
c. In most cases, survey designs require multivariate statistical test to adequately test the hypotheses. Examples of such tests are multiple regression analysis, multivariate analysis of variance, discriminative function analysis, logistic regression analysis and factor analysis. Were any of these tests used and were they used appropriately? (Go to IX)
VII. Retrospective Chart (Medical Record) Reviews and Retrospective Studies (IV P/I R)a. Was this study designed as a pilot study to assess the feasibility of doing a prospective study or was it designed as a definitive test of a hypothesis?b. What method was used to identify patients and their medical records? Was the total targeted population identified and measured?c. Over what time period was the record review conducted?d. Were there changes in procedures, diagnostic tests, medical technology and treatments, etc., during the timer period? How were these changes
handled?e. Did secular trends occur in cause and effect relationships during the time period (i.e. changes in diet and its relationship to heart disease)?f. Were information and data collected in a standardized manner?g. Were the definitions of disease and other variables exact, specific and clearly defined?h. How many people reviewed the medical records? Was interobserver or reviewer reliability assessed?i. Was the information in the medical records complete?j. How were missing data handledMany of the same questions asked concerning survey designs are appropriate for chart review. First answer the questions in Sections V and VI and then go to IX.
VIII. Case-Control Studies (IV R)a. Case-control studies use a retrospective design and often require the review of the cases’ and controls’ medical records. If the study includes collecting
data from the medical record first go to Section VII and answer questions a to j.b. How does the investigator control for recall bias? Are multiple methods used to measure important variables that could be influenced by recall bias?c. Does the problem or disease being studied suggest that recall bias may differ for cases and controls?d. Are the list factors found to be significantly associated with the disease or outcome specific to that disease? If several nonspecific factors are
associated with the disease does this suggest a differential recall bias for cases and controls?e. How were the comparison subjects selected?
-one control per case selected in a non random fashion-one control per case selected randomly form a matched pool of subjects-several controls per case selected randomly from a pool of subjects-several controls per case selected randomly form two or more pools of subjects
f. Were the controls appropriate for the hypothesis that was tested? Do they represent people like the general population or like people who have filtered through the health care system?
g. Were controls matched to cases?h. Were the variables chosen to match controls to cases adequate to reduce competing explanations for the outcome or disease in question?i. Did wasted matching occur, i.e. did the investigator match cases and controls on variables that have no relationship to the study?j. Did overmatching occur? Did the investigator match on possible etiological agents?
76
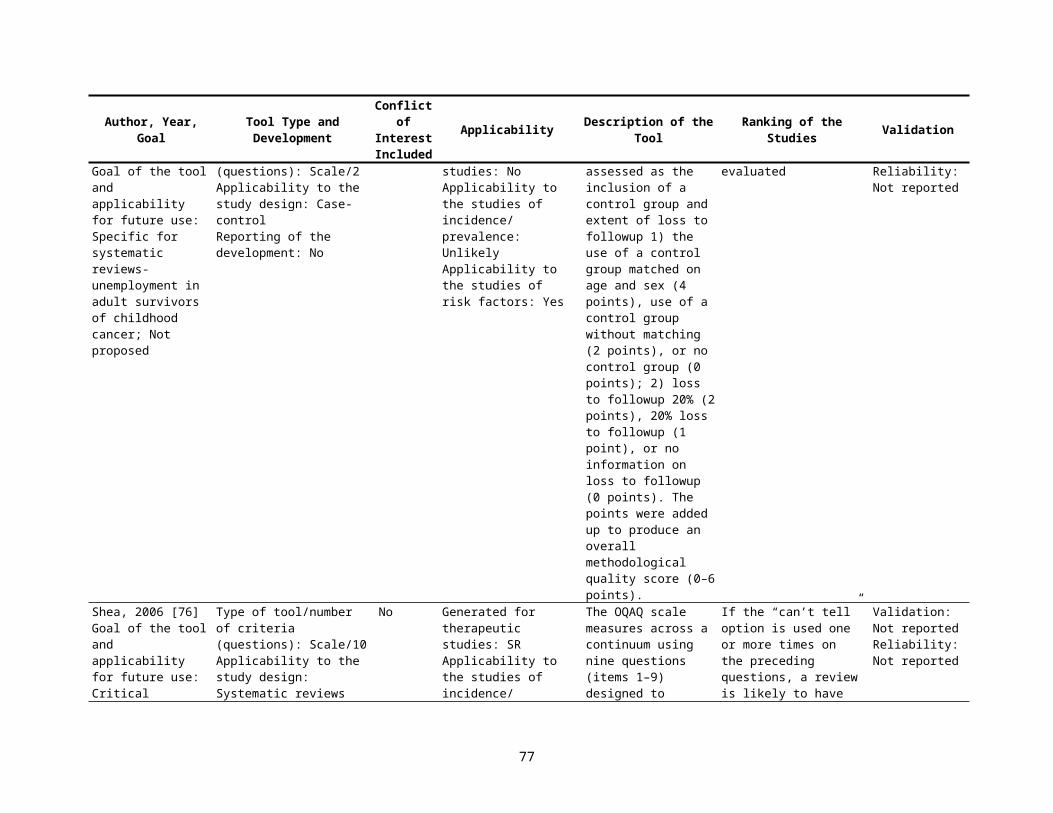
k. What kind of population do the cases represent? Are they heterogeneous representation of the disease or outcome in question or a highly selected population for whom responses have limited generalization?
l. Are other biases evident? Do we know more about cases because they have been under closer surveillance, volunteered more information, or been subjected to more extensive testing than control subjects?
(Go to Section V and answer questions d, f, i, to o, Section VI and then go to Section IX)IX. Results Section (IV R)
a. Are the findings presented clearly, objectively, and in sufficient detail to enable the reader to judge the results for himself/herself?b. Are the findings internally consistent, i.e., do the numbers add up properly , can the different tables be reconciled, etc.?c. Is there sufficient analysis to determine whether significant differences may in fact be due to the lack of comparability of the groups in sex or age
distribution, in clinical characteristics, or in other relevant variables? d. Were appropriate variables or factors controlled for or blocked during the analysis? e. Were other potentially confounding variables handled appropriately?f. Was the number of subjects studied sufficiently large to avoid concluding that no relationship exits when in fact a significant relationship may have
existed?g. Was the sample size so large that clinically insignificant results were declared statistically significant?h. Do the investigators present sufficient data in tables and in the test to adequately evaluate the reults?i. Are adequate summary data presented in the tables (i.e., are continuous level data presented as means +/- standard deviations)?j. Were appropriate probability levels (p values) used to determine statistical significance?k. Do the investigators avoid retrospective hypothesis testing?
X. Discussion Sectiona. Do the investigators consider all possible logical interpretations of their results?b. Are the conclusions clearly stated?c. Are conclusions substantiated by the data that are presented in the results section?d. Do the investigators avoid introducing new results in the discussion?e. Are the results adequately compared to previous studies in this area?f. Are the results adequately discussed in relation to the theoretical model chosen to develop the hypotheses?g. Are generalizations confined to the population from which the sample was drawn?h. Are the limitations of the study considered and are they taken into consideration when conclusions are drawn?i. Are recommendations for future research made?
77

Campos-Outcalt [24]1. Type of Study (E P/I R)
ExperimentalQuasi-experimentalCohort with controls*Cohort without controls*Case controlCross-sectionalCorrelationalCase series or case study
*2 measurements, different points in time, add 1 point; 3 measurements, different points in time, add 2 points
2. Size of study (IV R)A. Schools as subjects Number of schools12-1011-4041-7071-100>100
B. Students as subjects Number of students<100101-200201-300>300Number of schools12-10>10
3. Response Rate (EV P/I R)≤30%31-50%51-70%71-80%81-90%91-100%
4. Years studied (EV P/I R)Years data collected1
(10 points possible)108644200
(10 points possible)
0246810
2468
012
(10 points possible)0246810
(10 points possible)
0
78
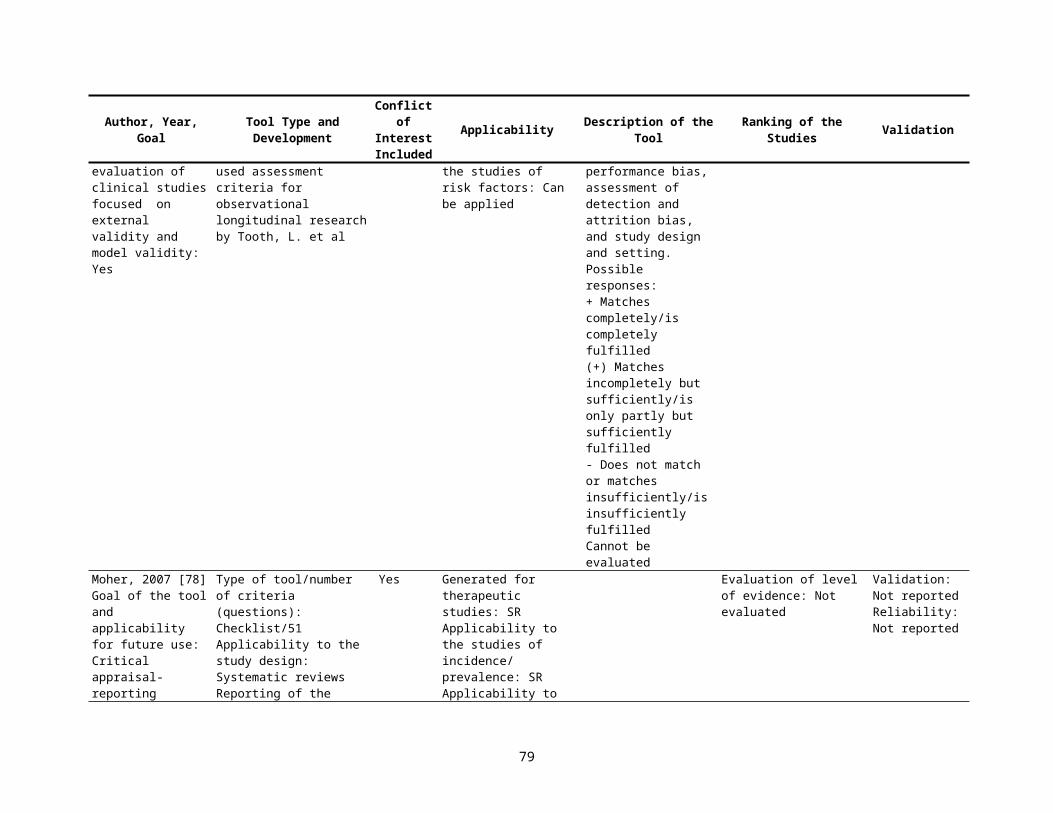
2-56-10>10Time comparisons
Comparisons of at least one class with another in 2 points in time3 points in time
5. Data Source (IV P/I R)
National data set, objective characteristics, actual behaviorQuestionnaire, objective data, or self-report, with established validity and reliabilityQuestionnaire seeking perceptions and opinions, with some validity and reliability indicesQuestionnaire seeking perceptions, opinions, and subjective characteristics, with no established validity and reliability
6. Statistical methods (IV P/I R)None or descriptive or incorrectBivariateStratification (at least 3 variables)MultivariateControl Variables1-23-4>4
7. Theoretical model (E IV R)Extensive theoretical baseSome theoretical baseHypothesis onlyAbsent
Total
246
24
(10 points possible)Predictor Variable Outcome Variables5 53 31 10 0
(10 points possible)0247
123
(10 points possible)10630
(70 points possible)
79
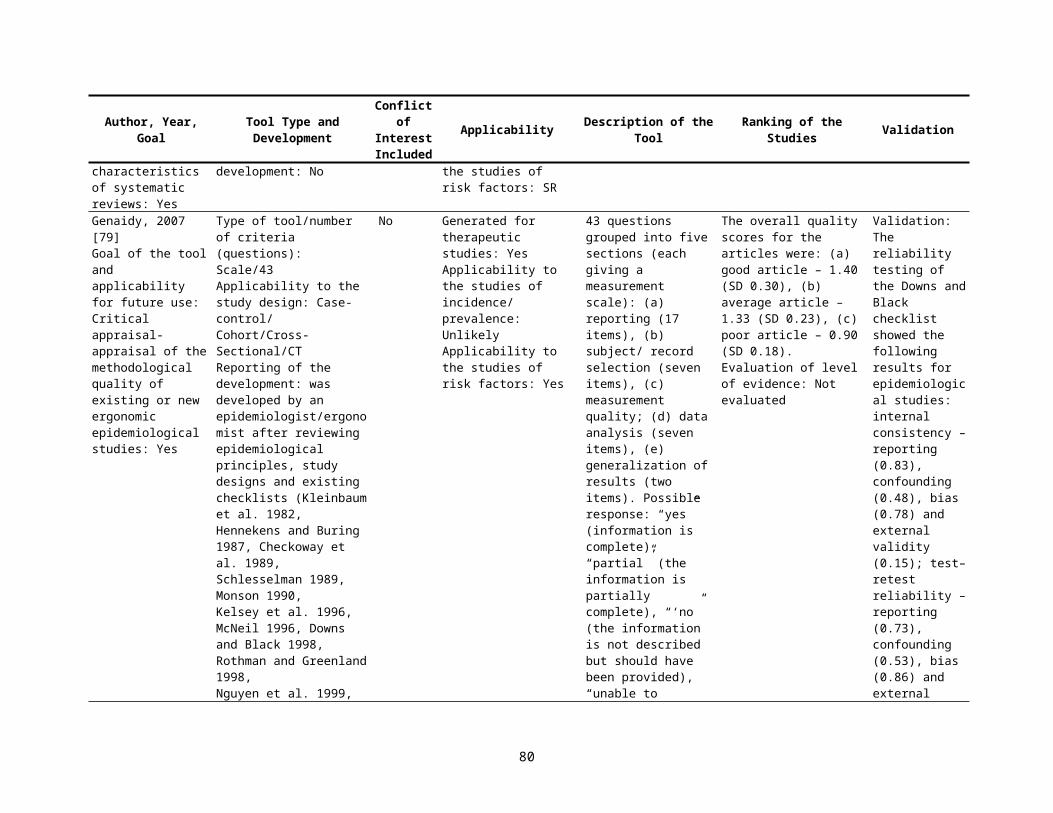
Margetts, 1995 [25]Section A. Dietary assessment: (IV P/I R)Studies without dietary data and only biochemical data were not included in the review.1) Is the method appropriate for the question being asked? (3,2,1,0)2) Is the description of the method sufficient to judge whether the method is likely to be used correctly? (1,0)3) Does the assessment cover an appropriate time frame? (1,0)4) Has the method been validated? (1,0); Is the validation appropriate (e.g., same population)? (1,0); How have the
validation results been used in analysis? (1,0)5) For studies where nutrient intakes are presented, have foods been translated to nutrient intakes appropriately (enough
information, e.g., on portion size)? (1,0); Has appropriate database been used? (1,0)The maximum score for this section is 10; if the study does not present nutrient data 9food or alcohol only), the maximum score is 8 and therefore needs to be weighted to scale up to a maximum score of 10 (score out of 8 * 10/8).
Section B. Recruitment of subjects (EV P//I R)1) Number of cases: Allocated points depending on number of cases in the study as follows: 0-49=0, 50-99=1.0, 100-
199=2.0, 200-299=2.8, 300-399=3.4, 400-499=4.0, 500-599=4.4, 600-699=4.8, 700-799=5.2, 800-899=5.6, 900-999=6.0, ≥1,000=6.4
2) Response rate: (cases and controls scored separately for each) percentage of eligible sample, excluding deaths: ≥80%, 5 points; 65-79%, 3 points; 50-64%, 2 points, <50%, 1 point; not stated or not able to be calculated, 0 points
3) Source of information: interview with subject, 3 points; self-completed by subject, but checked by interviewer, 2.5 points; self-completed, not checked, 2 points; proxy data-spouse, 1 point; other relative, 0.5 points(Divide by 2 if source is different for cases and controls. If different methods are mixed, add points for each method and divide by number of methods.)
4) Source of controls: Community, if random sample, 2 points; if uncertain, 1 point. Hospital, if appropriate, 1 point; if uncertain, 0.5 points. Hospital and community, if analyzed separately (add points above); Family controls, 0.5 points
5) Has diagnosis been confirmed: by histology/cytology/radiology, 3 points; by reference to clinical notes, 2 points; from death certificate, 1 point; unconfirmed, from subjects only, 0 points
6) Have unconfirmed cases been excluded? (1,0)Maximum score for this section is 26.4.
Section C. Analysis (IV P/I R)1) Consideration of other factors: have data been collected on other factors? (1,0); Have these factors been assessed
appropriately? (1,0); Does the study adjust for age and gender by 1) matching on controls of these variables (1,0) and using matched analysis (1,0) or 2) adjusting for these variables in the analysis? (2,0) (note for breast and cervical cancer adjusted for pre/postmenopausal instead of gender)
2) Presentation of results: Have unadjusted results been presented? (1,0); Have means or some indication of levels of dietary exposure been presented? (1,0); have odds ratios been calculated across levels of intake (thirds, e.g., rather than simple presentation of means for groups)? (1,0); Have results been adjusted for energy? (1,0); What method has been used? (1 point for description); Have results been adjusted for other factors (if relevant)? (1,0)
Maximum score for this section is 10 points
[(score in Section A + score in Section B/1.5 + score in Section C/1.2)/35.9]*100
80

Cowley, 1995 [26]Results of Appraisal of Comparative Studies of Primary Total Hip ReplacementKey CriteriaPatient groups balanced for diagnoses, age, and illness grade or indicators of activity level, sex, and/or weight, or effect of any differentness evaluated in valid statistical analysis (IV R)Patients blind to prosthesis type (IV R)Assessments of clinical outcome blind to prosthesis type; radio-graphic assessment blind, if possible (IV R)Appropriate statistical analysis undertaken (IV-R)Number of patients decreased or lost to followup reported or included in statistical analysis (IV R)Followup period, range and mean given (IV R)Prosthesis models specified (IV R)Clearly defined criteria for measuring outcomes (IV R)
Other criteriaIf retrospective, patients selected without knowledge of outcomesIn prospective studies, followup assessments blind to prosthesis type, if possible (IV R)Results given for specific models and sizes (IV R)Quantification of outcomes (IV R)Followup data compared with preoperative data (mean and range) (IV R)Independence of investigators (no vested interest) (IV R)
Garber, 1996 [27]Criteria Explanation of Score 9 of 18 points: criteria for study design
Ranging 0 (no evidence for causation), 18 (strong evidence for causation)
1. Was the type of study the strongest that could have been performed? (E P/I R)
0=case report3=prospective cohort/RCT
2. Strength of Association.Are relative risks or odds ratios both statistically and clinically significant? (E R)
0=No odds ratio3=Strong odds ratio
3. Is the temporal sequence of exposure and outcome correct? 0=Incorrect3=Strong temporal sequence
4. Is the association consistent from study to study? (E R) 0=Not consistent3=Strongly consistent
5. Does the association make biological sense? (E R) 0=No theoretical or laboratory evidence3=Strong evidence
6. Is there an analogous cause and effect relationship? (i.e., was there control for confounding? (E R)
0=No control3=Strong control
81
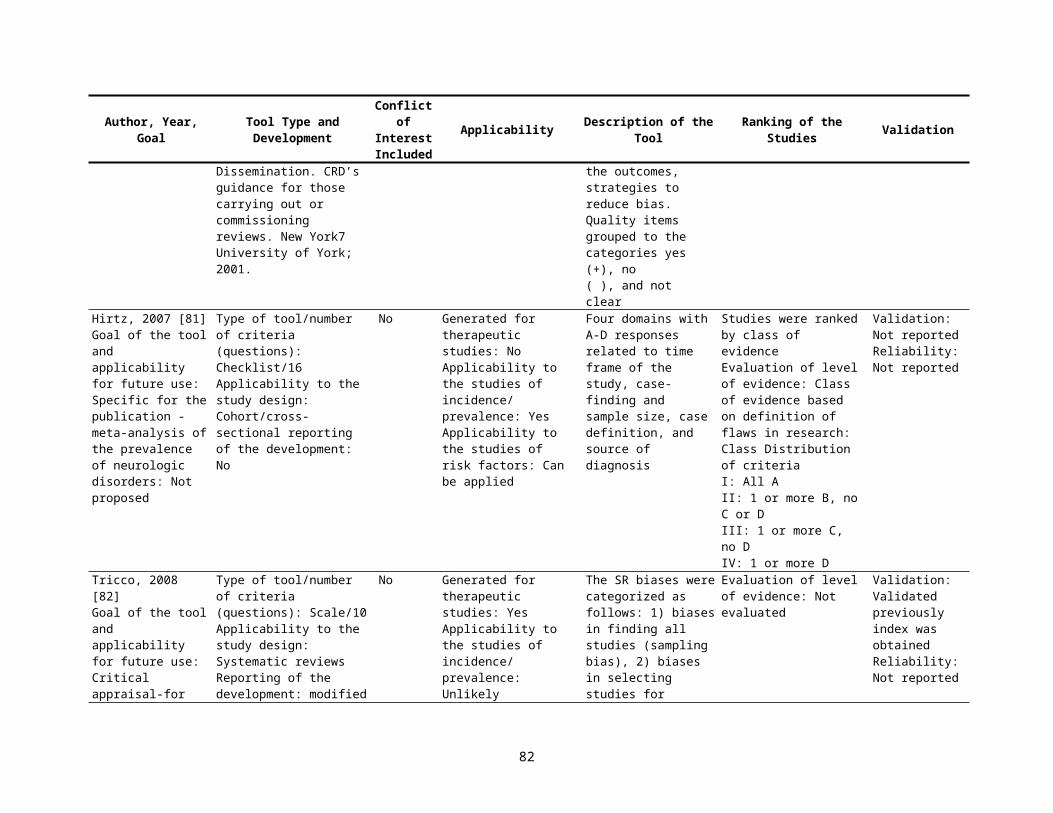
Anders, 1996 [28]A community-based study (EV R) the active followup of a cohort (IV R) an accounting of dropouts (IV R) the documentation of disease by specified clinical criteria (IV R) the documentation of disease by acute and convalescent sera (IV R) and the documentation of vaccination from medical records (IV R)
Quality score added one point for each criteria
Hadorn, 1996 [29]APPENDIX 1. QUALITY ASSESSMENT CRITERIA1. Selection of Patients (EV P/I R)MAJOR FLAWS
a. The diagnostic criteria for the disease under study were not described.b. The criteria for admission to and exclusion from the study were not specified.c. The decision regarding inclusion or exclusion from the study was sometimes made after treatment was initiated.d. The study population was not representative of the majority of patients with the condition under investigation.e. For cohort studies, the study groups were not treated concurrently.
MINOR FLAWSa. The diagnostic criteria for the disease under study were inadequately described.b. The criteria for admission to and exclusion from the study were inadequately described.c. Patients were excluded from participation in the study, but no list or table of the reasons for exclusion was given.
2. Allocation of Patients to Treatment Groups RANDOMIZED CLINICAL TRIALSMAJOR FLAWS
a. Statements in the paper suggest that patients were not randomly assigned.b. Known prognostic factors or confounders for the outcome of interest were not measured at baseline, or there was no comparison of the values for these
variables for the study groups.MINOR FLAWPatients were not allocated to the study groups in a truly randomized fashion (e.g., randomization by birth date, every other patient given placebo).COHORT OR REGISTRY STUDIESMAJOR FLAWKnown prognostic factors for the outcome of interest of possible confounders were not measured at baseline.MINOR FLAWSNone3. Therapeutic Regimen (IV R)MAJOR FLAWSNoneMINOR FLAWS
a. The mean daily dose actually taken by patients during the trial was not recorded.b. The actual dosing schedule was not described and only the total daily dose is given.c. Titration end points were not described.
4. Other therapeutic maneuvers were not described adequately enough that the study could be repeatedStudy Administration (IV R)
MAJOR FLAWS
82
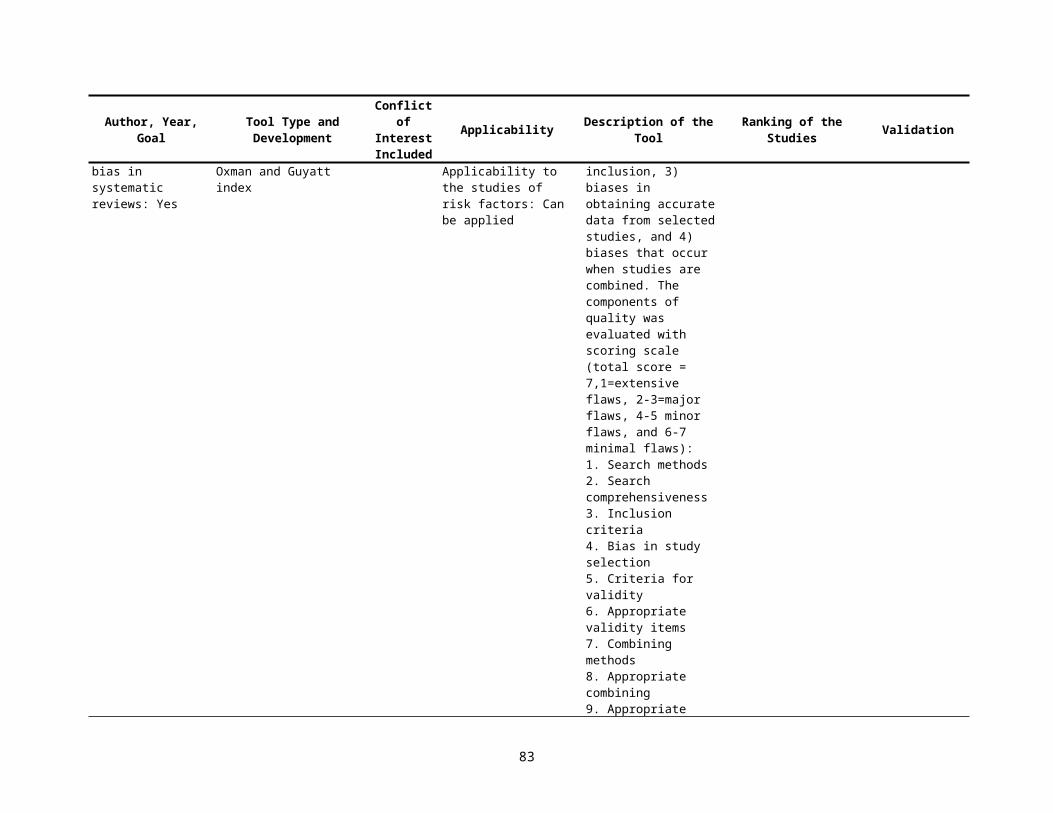
a. Patients were crossed over into the other group outside of the study design.b. Medications were used that were not part of the original study design.c. Other breaks in the study protocol occurred.
MINOR FLAWIn a multicenter study, methods of diagnosis, treatment, or outcome measurement were not identical among the participating centers.5. Withdrawals from the Study (IV R)MAJOR FLAWS
a. Patients withdrew from the study, and the reasons for withdrawal were not listed. This includes an unexplained reduction in the number of patients recorded in the tables.
b. Sensitivity analysis shows that the number of withdrawals with unknown or unlisted outcomes could significantly bias the results. For example, if three patients in the treatment group who were lost to followup or not recorded or actually died, a significant reduction in mortality in the treated group would be made insignificant.
MINOR FLAWThere was an excessive number of withdrawals regardless of the reasons: 10% for studies lasting less than 3 months or more than 15% for studies lasting for more than 3 months.6. Patient Blinding (Randomized Controlled Trials Only) MAJOR FLAWS
a. A placebo was not used for the control groupb. For a study that used patient self-reported health status or symptoms as an end point, a study that claimed, to be placebo controlled gave no description
of how the placebo was administered.MINOR FLAWS
a. For a study that used mortality as an end point, a study that claimed to be placebo controlled gave no description of how the placebo was administered.
b. For a study that used patient self-reported health status or symptoms as an end point, the physical characteristics, side effects, or method of administration of the placebo differed from that of the active drug so that it was possible for the patient to discern the treatment assigned.
7. Outcome Measurement (IV R)MAJOR FLAWS
a. For a study that required investigators to rate patient clinical status or measure clinical parameters, the investigators were not blinded to the patient treatment group. (Double-blind methodology was not used.)
b. For a study that required investigators to rate patient clinical status or measure clinical parameters, the method of administration or the effects of the study drug and the placebo differed enough that investigators were likely to guess the patient treatment. (Double-blind methodology was attempted, but it suffered from serious flaws).
MINOR FLAWSa. For a study that measured mortality, the investigators were not blinded to the patient treatment group. (Double-blind methodology was not used.)b. For a study that measured mortality, the method of administration or the effects of the study drug and the placebo differed enough that investigators were
likely to guess the patient treatment. (Double-blind methodology was attempted, but it suffered from serious flaws.)8. Statistical Analysis (IV R)MAJOR FLAWS
a. The analytical techniques described are incorrect, and there is inadequate information to perform a correct analysis.b. A significant difference was found in one or more baseline characteristics that are known prognostic factors or confounders, but not adjustment were
made for this in the analysis.MINOR FLAWS
a. The analytical techniques described are incorrect, but there is adequate information to perform a correct analysis.b. Means and tests for statistical significance are presented with no measure of variance.c. Results are presented in graphical form and tests for significance are presented without giving the actual mean values used to create the graph.
83
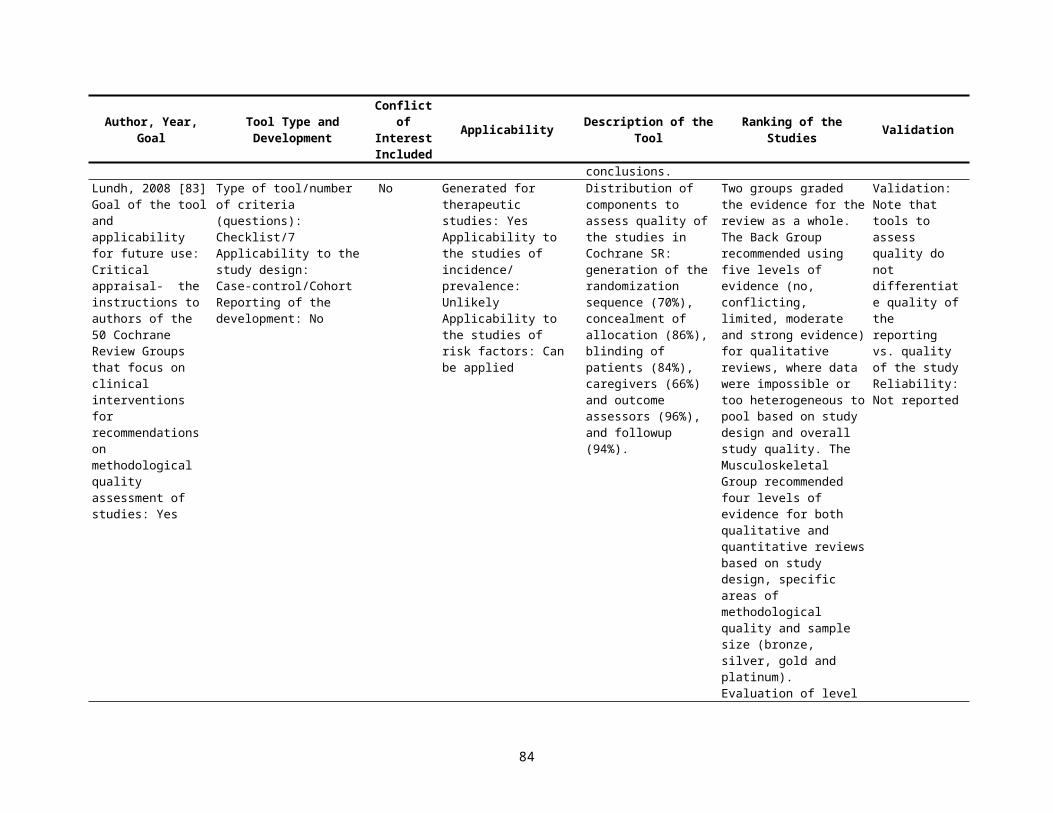
d. Withdrawals are not handled appropriately.e. Post-hoc subgroup analysis is performed.f. One-sided test are inappropriately used for testing statistical significance.
Jabbour, 1996 [30]The main items for review on the validity form were method of allocation, degree of followup (IV R)and soundness of the outcome assessments (IV P/I R)The evaluation of soundness included type of assessment (eg, patient morbidity and mortality, retention of knowledge or skills) (IV R)reliability of the outcome measures used (IV R)and whether the outcome assessment was blinded (IV R)
Validity score1 very poor1 very strong
Ciliska, 1996 [31]Relevance criteria determined whether the study
a) evaluated an intervention or program b) described an intervention within the scope of PHN practice in Canada, c) provided information on client-focused outcomes and/or cost, d) described a prospective study and e) had a control or comparison group (including before/after studies) (IV R)
Method of allocation to the study groups, level of agreement to participate in the study, control for confounders (IV R)method of data collection (pretesting of data collection tools, blinding of data collectors to group allocation of study participants) (IV P/I R)quantitative measure of effect (IV R)cost analysis and percentage of participant followup (IV R)
Pass, Moderate, Fail
Solomon, 1997 [32]Proposed Methodologic Standards to Guide Interpretation of Results of Studies that Compare Generalist with Specialist CarePractitionersWas physician training described?Were patients randomly assigned to provider type?Did the comparison groups practice in settings that were similar with regard to organization and physical environment?
PatientsWere the patients' diagnoses described by using standard criteria'? (IV P/I R)Were diagnoses similar between providers? (IV R)Were the patients similar with respect to covariates, including demographic characteristics, severity of illness, and comorbid conditions? (IV R)Did the authors adjust for differences in the analysis? (IV R)
OutcomesWere validated outcome measures used? (IV P/I R)Were the persons assessing outcomes uninvolved in the care of patients and blinded to hypothesis about provider assignment? (IV R)Were the criteria used to judge appropriateness based on evidence or consensus?
AnalysisWas the power of the study adequate to detect meaningful differences? (IV R)
84
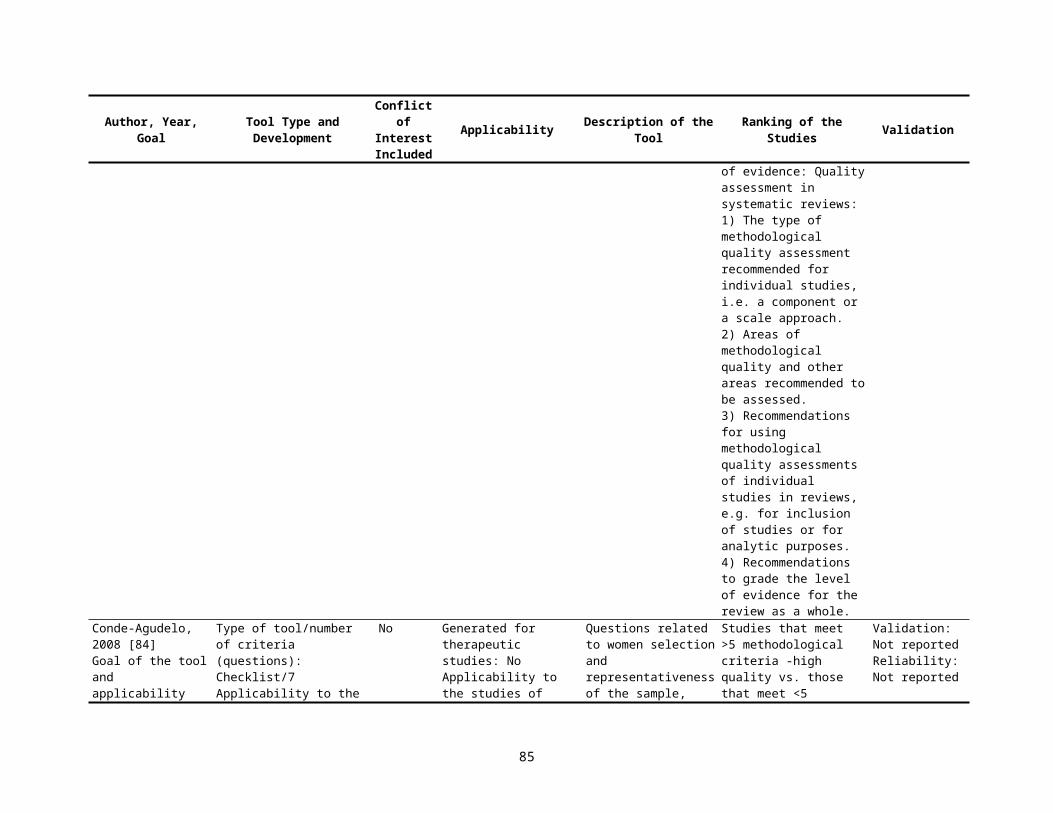
Littenberg, 1998 [33]1. Were the reviewers of outcomes blinded to the treatment? (IV R)2. Were more than 85 per cent of the patients in each treatment group followed? (IV P/I R)3. Were any subjective (patient-reported) outcomes described? (IV P/I R)4. Was followup active (meaning that patients were checked at pre-specified intervals regardless of whether they
had any complaints) rather than passive (meaning that a complaint triggered an assessment or the followup was through a review of the chart)? (IV P/I V)
15-point quality scoreClearly yes=3 pointsProbably yes=2 pointsProbably no=1 pointClearly no= 0 points
Spencer-Green, 1998 [34]Criterion WeightingBoth age and sex of patients stated 3Source of patients identified (EV P/I R) 1Clinical/laboratory measures and clinical assessments carried out independently or by blinded
investigator (IV R) 3Explicitly stated that preexisting disease was excluded by same criteria at beginning and end of
study (IV R) 5Duration of Raynaud phenomenon before study entry Stated (IV R) 3All patients seen at entry accounted for at followup (IV P/I R) 3Demographic and clinical differences between patients with and without transition at follow-up
delineated (IV R) 5Delineation of patients with indeterminate disease that did not have sufficient features to meet
classification criteria at entry and follow-up (IV R) 5Data concerning entry criteria provided in sufficient detail to allow generation of a 232 table (IV R) 3A description of or reference to published methods of parameter measured 1Classification criteria used to include/exclude secondary diseases (IV R) 5Use of prospective vs. retrospective study design (E P/I R) 3Regular and planned structured assessments of patients made (IV P/I R) 3Use of published criteria to classify Raynaud Phenomenon (IV P/I R) 1Inclusion and follow-up of a population of patients with other than primary Raynaud phenomenon
(IV P/I R) 1All patients examined both at entry and at followup to diagnose or exclude secondary disease (IV R) 5
0 (criterion not met)2 (criteria satisfied)Then multiplied by value of 1, 3, 5
85

Kreulen, 1998 [35]Item Full credit (3 points) Partial credit (2 points) No credit (1 point) Weight Max. weighted
pointsStudy methodologyType of study Comparative clinical trial Indications* for prospective
studyThree or more conditions
Indications for study cross-sectional or retrospective study
2 6
Conditions Controls, blinding, full randomization, homogeneity test for covariables, evaluation planning, premature ending described
Three or more conditions Less than 3 conditions 2 6
Representativity of the sample EV P/I R
Selection procedure described and patient characteristics (age distribution and variability, etiology, dentition (2 out of 3)) described
Selection procedure described or patient characteristics described
Not described 2 6
Followup period IV P/I R Age(s) of the VRs clearly described (distribution and variability)
Age(s) of VRs unclear but interpretation possible
Not described, or interpretation not possible
2 6
Dental methodologyTreatment protocol Step by step Roughly described Not described 1 3Materials All materials used described
and brands statedMain materials described Not described 1 3
Operators More than one operator, number and skills described
More than one operator, no description/one operator indicated
No description 1 3
Design of restoration Contact area, preparation and outline described
Preparation and contact area or preparation and outline
Obscure 1 3
Evaluation methodologyMajor endpoints/failure (IV P/I R)
Criteria described and validated, frequencies given, complications reported
Failure criteria described, not validated in M+M section
Not described 2 6
Site of VRs Described in numbers and related to the results
Described, not related to the results
Not described 2 6
Other evaluation criteria Tissue response, quality assessment and patients’ satisfaction described and reported; validated method
One or 2 items described and reported; validated
Not described or not reported
2 6
Observers (IV P/I R) Calibrated observer(s), agreement indicated, procedure described
Observer(s), calibrated (unambiguous criteria described), no agreement indicated, procedures described
Procedure not described 2 6
86

Item Full credit (3 points) Partial credit (2 points) No credit (1 point) Weight Max. weighted points
Statistical methodologyNumbers (IV R) Numbers of patients and VRs
presented, including failures, non-failures and lost-to-followup; related to time
Numbers not clearly presented but interpretation possible (failure related to time)
Only sample size and number of failures, interpretation not possible
1.5 4.5
Origin of percentage failures Stated (life table or reduced sample)
Not shown, traceable Just percentage or numbers
1.5 4.5
Statistical procedures (IV R) Explained, data handling described
Partially described, non-custom method not described
Not described 1.5 4.5
Reliability (IV P/I R) Confidence limits, covariables analyzed, power estimate, justified method
Two or more items Less than 2 items 1.5 4.5
Aim of the study Purpose clearly described results related to the aim
Not clearly described or results not related to the aim
Not described 1 2
Total 80
Jadad, 1998 [36]Criteria for individuals trials: 1) to answer clear and relevant clinical questions2) to be designed, conducted, and reported by researchers who did not have conflicts of interest3) to follow strict ethical principles4) to include all patients available (IV R) 5) to evaluate all possible interventions for all possible variations of the conditions of interest, in all possible types of patients, in all settings, and using all
relevant outcome measures (EV IV R)6) to include strategies to eliminate bias during the administration of the interventions, during the evaluation of the outcomes, and during reporting of the
results, thus reflecting the true effect of the interventions (IV R) 7) to include perfect statistical analyses (IV R)8) to be described in clear and unambiguous language, including an exact account of all the events that occurred during the design and conduct of the trial,
individual patient data, and an accurate description of the patients who were included, excluded, and withdrawn and who dropped out (IV R)
Approaches to incorporate quality assessments into systematic reviews: 1) to include or exclude trials from a review2) to conduct sensitivity analyses allowing comparisons between the results of trials with different quality3) to display graphically the results of each of the trials according to their quality (e.g., the trials are displayed in descending order, starting with the one
with the highest quality)4) to perform cumulative meta-analyses using quality assessments as the input sequence5) to weight trials according to their quality
87

Borghouts, 1998 [37]Study population (EV P/I R) A) Selection of study population +/- B) Description of inclusion and exclusion criteria +/- C) Description of potential prognostic factors (IV R) +/- Study design D) Prospective study design (E) +/- E) Study size (IV R)
a) Course cohort 100 patient-years (IV R) +/- b) Prognostic factors sub-groups 200 patients-years (IV R) +/-
Followup F) Followup 12 months (IV P/I R) +/- G) Followup IV P/I R
a) Dropouts/loss to followup <20% (IV P/I R) +/- b) Dropouts/loss to followup < 10% (IV P/I R) +/- c) Information completers versus loss to followup/dropouts (IV R) +/-
Outcome measures H) Relevant outcome measures (IV P/I R) +/- Analysis and data presentation I) Frequencies of most important outcome measures (IV P/I R) +/- J) Appropriate analysis techniques (IV R) +/-
Downs, 1998 [38]Is the hypothesis/aim/objective of the study clearly described? Yes 1, no 0Are the main outcomes to be measured clearly described in the Introduction or Methods section? If the main
outcomes are first mentioned in the Results section, the question should be answered no.Yes 1, no 0
Are the characteristics of the patients included in the study clearly described? (EV P/I R)In cohort studies and trials, inclusion and/or exclusion criteria should be given. In case-control studies, a case-definition and the source for controls should be given.
Yes 1, no 0
Are the interventions of interest clearly described? (IV R)Treatments and placebo (where relevant) that are to be compared should be clearly described.
Yes 1, no 0
Are the distributions of principal confounders in each group of subjects to be compared clearly described? A list of principal confounders is provided. (IV R)
Yes 2, partially 1, no 0
Are the main findings of the study clearly described? Simple outcome data (including denominators and numerators) should be reported for all major findings so that the reader can check the major analyses and conclusions.(This question does not cover statistical tests which are considered below).
Yes 1, no 0
Does the study provide estimates of the random variability in the data for the main outcomes? In non normally distributed data the inter-quartile range of results should be reported. In normally distributed data the standard error, standard deviation or confidence intervals should be reported. If the distribution of the data is not described, it must be assumed that the estimates used were appropriate and the question should be answered yes. (IV R)
Yes 1, no 0
Have all important adverse events that may be a consequence of the intervention been reported? This should be answered yes if the study demonstrates that there was a comprehensive attempt to measure adverse events. (A list of possible adverse events is provided).
Yes 1, no 0
88
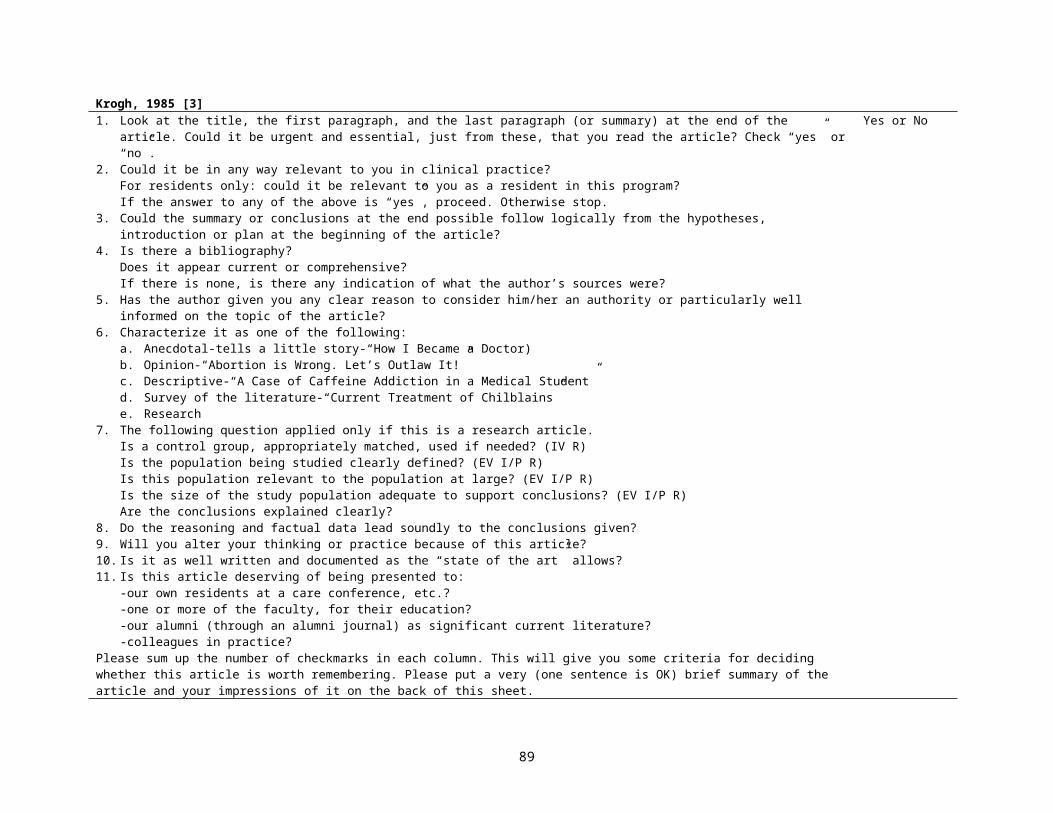
Have the characteristics of patients lost to followup been described? (IV P/I R) This should be answered yes where there were no losses to follow-up or where losses to followup were so small that findings would be unaffected by their inclusion. This should be answered no where a study does not report the number of patients lost to followup.
Yes 1, no 0
Have actual probability values been reported (e.g. 0.035 rather than <0.05) for the main outcomes except where the probability value is less than 0.001?
Yes 1, no 0
Were the subjects asked to participate in the study representative of the entire population from which they were recruited? The study must identify the source population for patients and describe how the patients were selected. Patients would be representative if they comprised the entire source population, an unselected sample of consecutive patients, or a random sample. Random sampling is only feasible where a list of all members of the relevant population exists. Where a study does not report the proportion of the source population from which the patients are derived, the question should be answered as unable to determine. (EV P/I R)
Yes 1, no 0, unable to determine 0
Were those subjects who were prepared to participate representative of the entire population from which they were recruited? The proportion of those asked who agreed should be stated. Validation that the sample was representative would include demonstrating that the distribution of the main confounding factors was the same in the study sample and the source population. (EV I/P R)
Yes 1, no 0, unable to determine 0
Were the staff, places, and facilities where the patients were treated, representative of the treatment the majority of patients receive? For the question to be answered yes the study should demonstrate that the intervention was representative of that in use in the source population. The question should be answered no if, for example, the intervention was undertaken in a specialist centre unrepresentative of the hospitals most of the source population would attend. (EV R)
Yes 1, no 0, unable to determine 0
Was an attempt made to blind study subjects to the intervention they have received? For studies where the patients would have no way of knowing which intervention they received, this should be answered yes. (IV R)
Yes 1, no 0, unable to determine 0
Was an attempt made to blind those measuring the main outcomes of the intervention? (IV R) Yes 1, no 0, unable to determine 0If any of the results of the study were based on “data dredging”, was this made clear?
Any analyses that had not been planned at the outset of the study should be clearly indicated. If no retrospective unplanned subgroup analyses were reported, then answer yes. (IV R)
Yes 1, no 0, unable to determine 0
In trials and cohort studies, do the analyses adjust for different lengths of followup of patients, or in case-control studies, is the time period between the intervention and outcome the same for cases and controls? Where followup was the same for all study patients the answer should yes. If different lengths of followup were adjusted for by, for example, survival analysis the answer should be yes. Studies where differences in followup are ignored should be answered no. (IV R)
Yes 1, no 0, unable to determine 0
Were the statistical tests used to assess the main outcomes appropriate? The statistical techniques used must be appropriate to the data. For example nonparametric methods should be used for small sample sizes. Where little statistical analysis has been undertaken but where there is no evidence of bias, the question should be answered yes. If the distribution of the data (normal or not) is not described it must be assumed that the estimates used were appropriate and the question should be answered yes. (IV P/I R)
Yes 1, no 0, unable to determine 0
Was compliance with the intervention/s reliable? Where there was non compliance with the allocated treatment or where there was contamination of one group, the question should be answered no. For studies where the effect of any misclassification was likely to bias any association to the null, the question should be answered yes.
Yes 1, no 0, unable to determine 0
Were the main outcome measures used accurate (valid and reliable)? For studies where the outcome measures are clearly described, the question should be answered yes. For studies which refer to other work or that demonstrates the outcome measures are accurate, the question should be answered as yes. (IV P/I R)
Yes 1, no 0, unable to determine 0
Were the patients in different intervention groups (trials and cohort studies) or were the cases and controls (case-control studies) recruited from the same population? For example, patients for all comparison groups should be
Yes 1, no 0, unable to determine 0
89
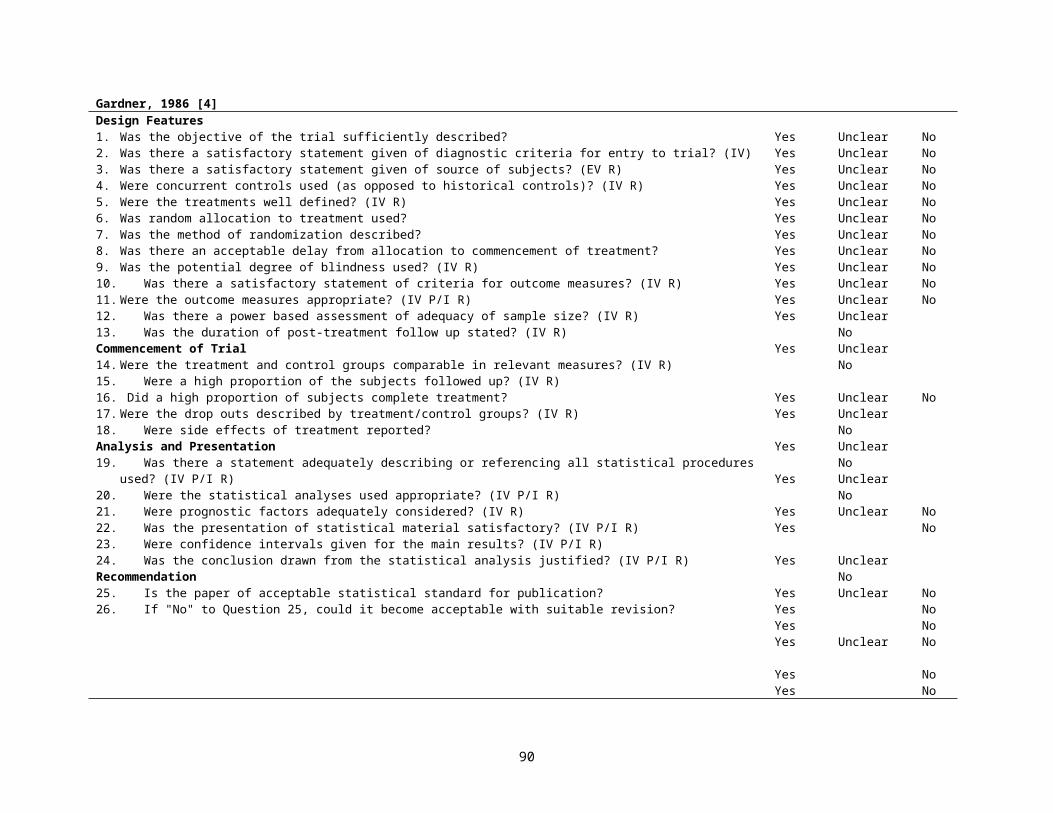
selected from the same hospital. The question should be answered unable to determine for cohort and casecontrol studies where there is no information concerning the source of patients included in the study. (EV IV R)
Were study subjects in different intervention groups (trials and cohort studies) or were the cases and controls (case-control studies) recruited over the same period of time? For a study which does not specify the time period over which patients were recruited, the question should be answered as unable to determine. (EV IV R)
Yes 1, no 0, unable to determine 0
Were study subjects randomised to intervention groups? Studies which state that subjects were randomized should be answered yes except where method of randomisation would not ensure random allocation. For example alternate allocation would score no because it is predictable.
Yes 1, no 0, unable to determine 0
Was the randomised intervention assignment concealed from both patients and health care staff until recruitment was complete and irrevocable? All non-randomised studies should be answered no. If assignment was concealed from patients but not from staff, it should be answered no.
Yes 1, no 0, unable to determine 0
Was there adequate adjustment for confounding in the analyses from which the main findings were drawn? This question should be answered no for trials if: the main conclusions of the study were based on analyses of treatment rather than intention to treat; the distribution of known confounders in the different treatment groups was not described; or the distribution of known confounders differed between the treatment groups but was not taken into account in the analyses. In nonrandomized studies if the effect of the main confounders was not investigated or confounding was demonstrated but no adjustment was made in the final analyses the question should be answered as no. (IV R)
Yes 1, no 0, unable to determine 0
Were losses of patients to followup taken into account? If the numbers of patients lost to followup are not reported, the question should be answered as unable to determine. If the proportion lost to follow-up was too small to affect the main findings, the question should be answered yes. (IV P/I R)
Yes 1, no 0, unable to determine 0
Did the study have sufficient power to detect a clinically important effect where the probability value for a difference being due to chance is less than 5%? Sample sizes have been calculated to detect a difference of x% and y%. (IV R)
Size of smallest intervention groupA <n1 0B n1–n2 1C n3–n4 2D n5–n6 3E n7–n8 4F n8+ 5
90
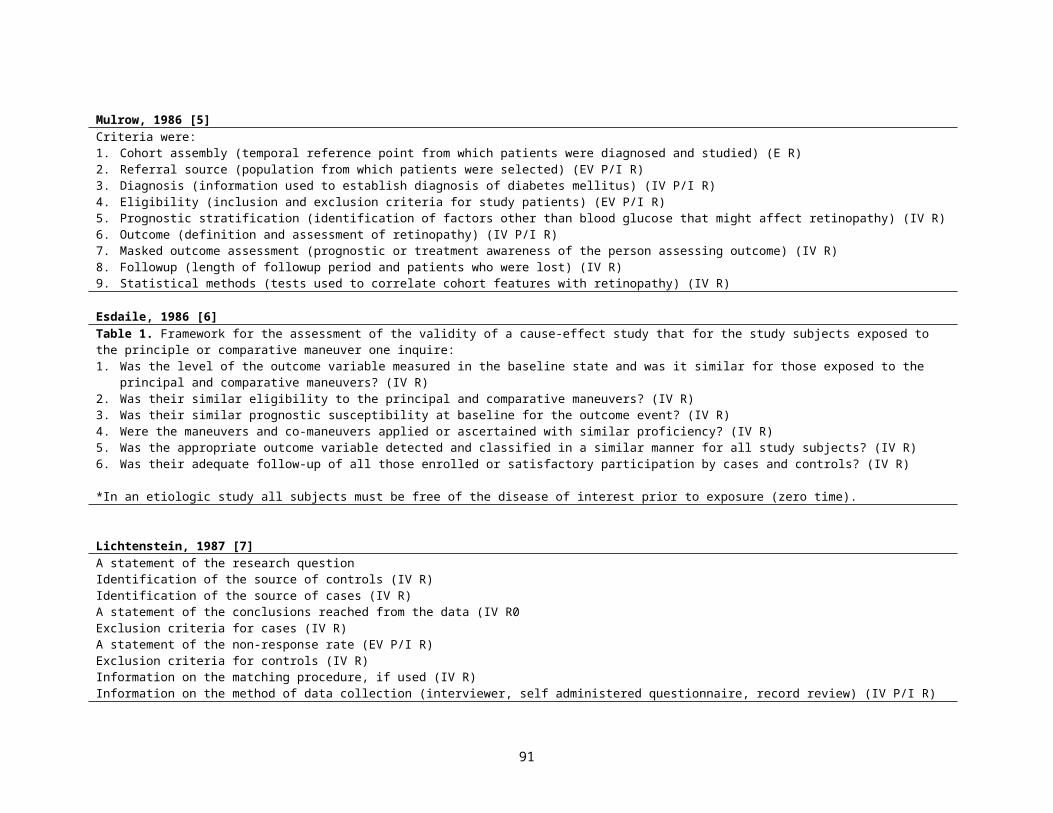
Loney, 1998 [39]Guidelines for critically appraising studies of prevalence or incidence of a health problemA. ARE THE STUDY METHODS VALID?
1. Are the study design and sampling method appropriate for the research question? (E EV P/I R)2. Is the sampling frame appropriate? (EV P/I R)3. Is the sample size adequate? (IV R)4. Are objective, suitable, and standard criteria used for measurement of the health outcome? (IV P/I R)5. Is the health outcome measured in an unbiased fashion? (IV P/I R)6. Is the response rate adequate? Are the refusers described? (EV P/I R)
B. WHAT IS THE INTERPRETATION OF THE RESULTS?7. Are the estimates of prevalence or incidence given with confidence intervals and in detail by subgroup, if appropriate? (IV P/I)
C. WHAT IS THE APPLICABILITY OF THE RESULTS?8. Are the study subjects and the setting described in detail and similar to those of interest to you? (EV P/I R)
TABLE 2Methodological scoring system used to rate studies reviewed Item
1. Random sample or whole population (EV P/I R)2. Unbiased sampling frame (i.e. census data) (EV P/I R)3. Adequate sample size ( >300 subjects) (IV R)4. Measures were the standard (IV P/I R)5. Outcomes measured by unbiased assessors (IV P/I R)6. Adequate response rate (70%), refusers described (EV P/I R)7. Confidence intervals, subgroup analysis (IV P/I R)8. Study subjects described (IV P/I R)
Score1 point1 point1 point1 point1 point1 point1 point1 pointMaximum score 8 points
Silman, 1999 [40]Core Methodological ItemsLongitudinal observational studies should include the following core items
1. Study design type: true prospective, retrospective, or mixed (E)2. Source of cases: true population-based, catchment population, consecutive series (specify clinic type), or other. (EV R)3. Timing of patient recruitment in relation to disease onset (to enable estimation of left censorship bias): cases followed from disease onset, cases followed
from first presentation, or prevalent cases.(IV R)4. Inclusion criteria: classification criteria, age range, sex. (EV P/I R)5. Demographic data collected: sex, age, socioeconomic factors, ethnic group. (EV P/I R)6. Baseline clinical data collected. Specify individual items of data collected at baseline. Distinguish between items ascertained from routine medical records
(errors or missing data probable) and items collected prospectively using a standard proforma. Specify number of observers, training requirements, and any measure of observer variability. (IV P/I R)
7. Followup data collection. Specify frequency of followup information at each individual time point and estimate potential for loss to followup bias (right censorship). Indicate means of followup data collection (clinical interview, questionnaire, mail or telephone). Report number of observers involved in prospective data collection, nature of training, and report on observer variability. Report on principal and subsidiary outcome measures chosen. Comment on observer blindness to baseline variables. (IV P/I R)
8. Analysis: specify strategies used for missing data and loss to follow-up. Indicate, in relation to person-years of follow-up, the power to detect clinically meaningful differences for the major outcomes analyzed. If a statistical model is generated, indicate performance in a validation sample. (IV P/I R)
91
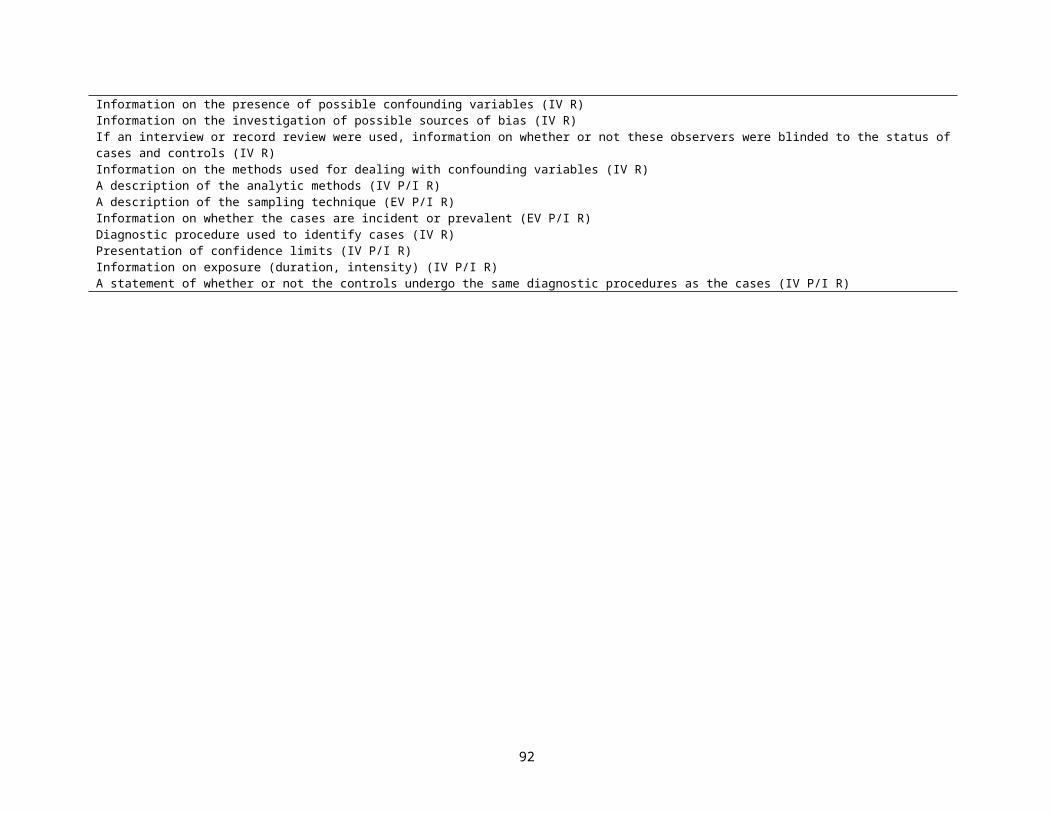
van Rooyen, 1999 [41]1. Did the reviewer discuss the importance of the research question? Not at all-1
234Discussed extensively-5
2. Did the reviewer discuss the originality of the paper? Not at all-1234Discussed extensively with references-5
3. Did the reviewer clearly identify the strengths and weaknesses of the method (study design, data collection and data analysis)?
Not at all-1234Comprehensive-5
4. Did the reviewer make specific useful comments on the writing, organization, tables, and figures of the manuscript?
Not at all-1234Extensive-5
5. Were the reviewer’s comments constructive? Not at all-1234Very constructive-5
6. Did the reviewer supply appropriate evidence using examples from the paper to substantiate their comments?
No comments substantiated-1234All comments substantiated-5
7. Did the reviewer comment on the author’s interpretation of the results? Not at all-1234Discussed extensively-5
7. How would you rate the quality of this review overall? Poor-1234Excellent-5
92
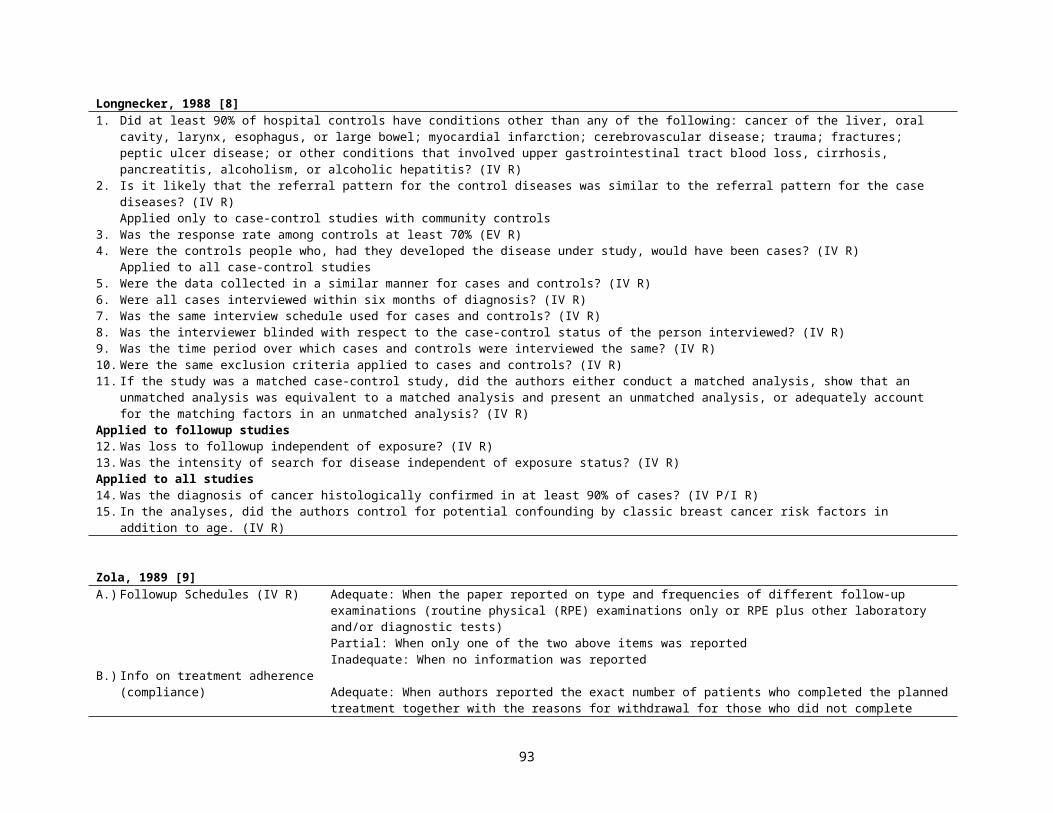
Angelillo, 1999 [42]Table 1. Items used in quality scoring for studies of the association between exposure to residential electromagnetic fields (EMF) and childhood leukemiaQuality Scoring ItemCase—Control studiesCases either randomly selected or selected to include all cases in a specific population (IV R)Cases identified without knowledge of exposure status (IV R)Response rate for identified cases >75% (EV R)Control drawn randomly from the same population of cases (IV R)No known association between control status and exposure (IV R)Response rate for identified controls >75% (EV R)
Cohort studiesInitial response rate >75% (EV P/I R)Comparison of person who did and did not participate (EV P/I R)Follow-up rate >75% (IV P/I R)Comparison of who were and were not lost to followup (IV P/I R)
Exposed/nonexposed subjects identified without knowledge of disease status (IV R)No known association between nonexposed status and disease (IV R)
All studiesSubjects unaware of specific associations of interest insofar as possible (IV R)Exposure/disease assessment made blindly with respect to the case—control/exposure status of subjects (IV R)Specific disease criteria given (IV P/I R)Disease validated by histology or other gold standard (IV P/I R)Exposure evaluations made in relation to the time of diagnosis (IV R)Differential mobility among cases and controls (or among exposed and nonexposed) considered (IV R)Age considered as potential confounder (IV R)Sex considered as potential confounder (IV R)Socioeconomic status considered as potential confounder (IV R)Indicators of air quality (e.g. traffic density) considered as potential confounders (IV R)Competing carcinogenic exposures considered as potential confounder (IV R)Demographic data listed (EV P/I R)Statistical analysis of demographic data (EV V P/I R)Power calculations performed (IV R)Precise P-values and/or confidence interval given Test statistic specified (IV R)Appropriate statistical analysis (IV R)
93
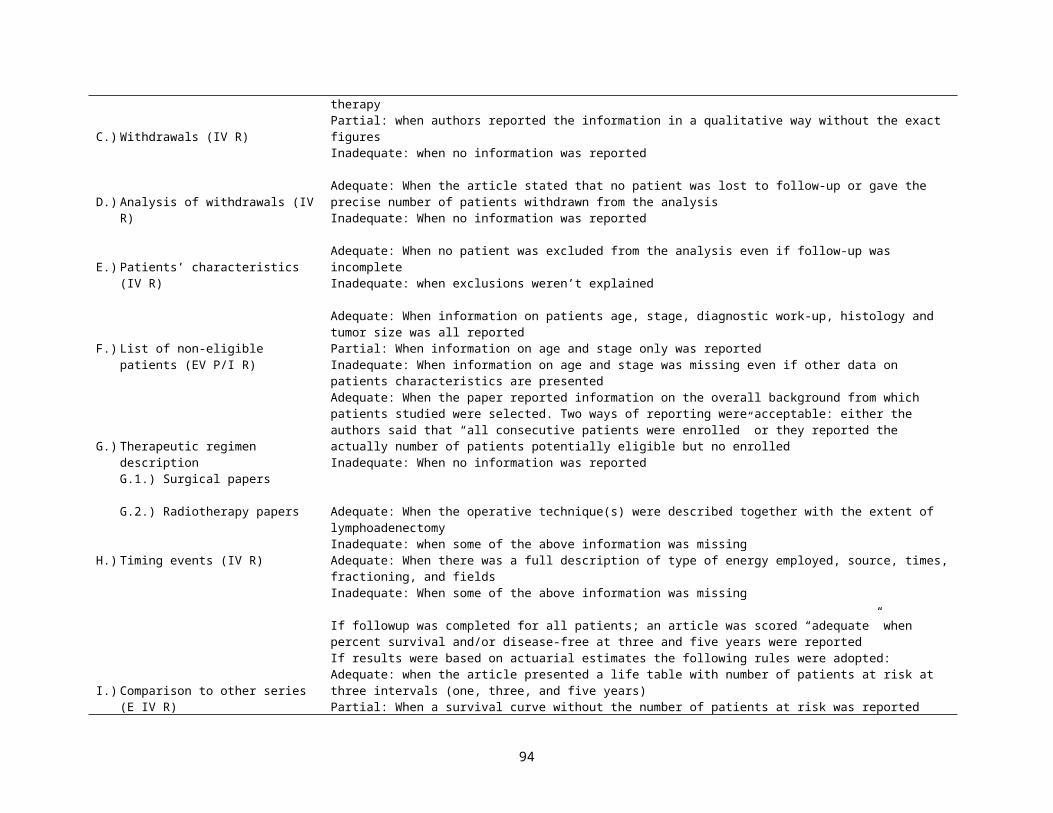
Cullum, 1999 [44]Questions to ask when assessing whether the results of a harm/aetiology study are valid (Sackett et al., 1997)
1. Were there clearly defined groups of patients, similar in all important ways other than exposure to the treatment2. Were exposures and outcomes measured in the same way in the exposed and unexposed groups? Was the assessment of outcomes either
objective (for example, death) or blinded to exposure?3. Was the followup of study participants complete and long enough4. Do the results meet at least some common-sense ‘diagnostic tests for causation’?
--Did the exposure precede the onset of the outcome?--Is there a close response gradient? (that is, does the effect get bigger, the bigger the dose?)--Does the effect disappear when exposure ceases and reappear when exposure recommences?--Is the association consistent from study to study?--Does the association make biological sense?
Nguyen, 1999 [45]Methodological assessment list--Methodological Criteria
I. Study designA. Objective DescriptionB. Description of population (EV P/I R)C. Selection criteria (EV P/I R)D. Description of potential confounders (IV R)E. Pre-investigation sample size estimation (IV R)F. Sample size (IV R)G. Type of study (maximum score=10; items cannot be randomly combined) (E)
LongitudinalMixed-longitudinalCase-controlCross-sectionalFollowup timeSubgroup comparability
II. Study conductH. Mentioning of dropouts (IV P/I R)I. Method of measurement described (IV P/I R)J. Blind measurement (IV P/I R)K. Number of examiners (IV R)L. Intra- and inter-examiner reliability described (IV P/I R)M. Level of agreement intra- and inter- examiner (IV P/I R)
III. Statistical analysisN. Dropouts included in data analysis (IV P/I R)O. Statistical method correct (IV P/I R)P. Confounders analyzed (IV P/I R)Q. Presentation of data
IV. ConclusionR. Statement referred to statistical procedure used and appropriate to objective
Maximum score
Score444624
642244
286446
61266
6100
94
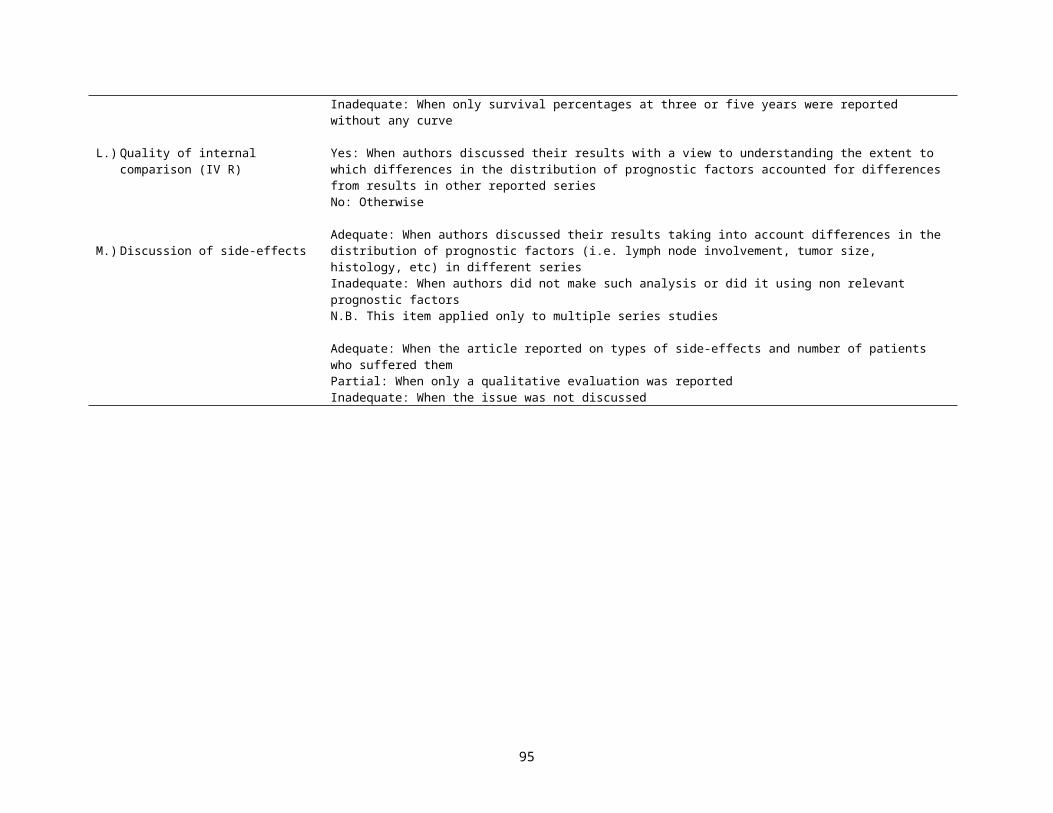
Cameron, 2000 [46]1. Was this a comparative study?2. Were all the data collected prospectively? (IV P/I R)3. If randomized: Was the method of randomization stated?4. If not randomized, was the selection method defined? (EV P/I R)5. Were study groups drawn from the same population? (EV P/I R)6. Was there a clear description of the inclusion/exclusion criteria? (EV P/I R)7. Were all participants fitting the inclusion criteria of the study included in the study? (EV P/I R)8. If study involved retrospective selection of a sub-group of eligible patients, was this done by random sampling? (EV P/I R)9. Was the study population described? (EV P/I R)10. Were all of the following baseline characteristics (gender, age, fracture type, any measure of mental status, any measure of pre-fracture functional
status) given for both groups? (EV P/I R)12. Were the study groups comparable in terms of items listed in Q9 and Q10 above? (IV R)13. Was the study population a highly non-representative sample of the standard users of the intervention (e.g. all >90; all stroke)? (EV R)14. Was the description of the intervention adequate (including study personnel)? (IV R)15. Was the description of the control adequate (including study personnel)? (IV R)16. Were participants blinded to study interventions? (IV R)17. Were treatment providers blinded to study interventions? (IV R)18. Was the level of training/motivation of staff comparable between study groups? (IV R)19. Were sufficient details provided of care programs (aside from trial or selected interventions)? (IV R)20. If yes, or explicitly stated, were care programs comparable (aside from trial or selected interventions)? (IV R)21. Were the interventions consistent (i.e. not changed) throughout the trial period? (IV R)22. Was the level of compliance to the intervention reported (or data available to determine this)? 23. Was exposure reliably ascertained and verified? (IV R)24. Were all patients accounted for (e.g. trial profile given)? (IV R)25. a. What was the participation rate (participants/eligibles)?25. b. What was the participation rate (participation/eligibles)?26. Do the results allow for an intention-to-treat analysis? (IV R)27. Number of patients lost to follow-up at final assessment (not including deaths)? (IV P/I R)28. Were dropout rates similar in both groups (i.e. within 5%)? (IV R)29. Were outcomes assessors blinded to study interventions? (IV R)30. Were any of the listed review outcomes reported?31. Did the outcomes measured provide a comprehensive summary of outcome? (IV P/I R)32. Were the methods used for key outcome measurements clearly stated? (IV P/I R)33. Were systematic methods of surveillance used? (IV P/I R)34. Were the same methods of ascertainment used for all outcomes for both groups? (IV R)35. Was the overall length of follow-up appropriate (=1 year)? (IV P/I R)36. Was the length of follow-up similar between the two groups? (IV R)
Section A. Selection bias1. Allocation to group? Individual randomization=4
Cluster randomization=3Quasi-randomization=2Not randomized=0
95
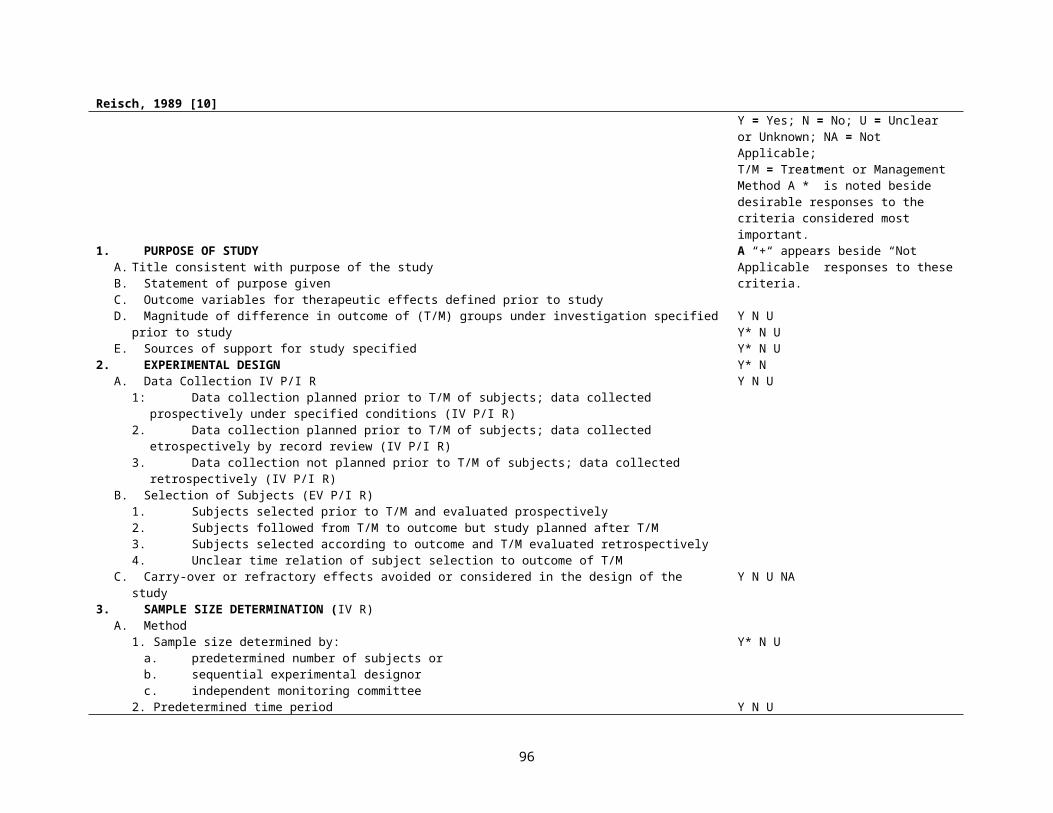
2. Allocation concealed?
3. Groups comparable on all principal baseline characteristics? (IV R)
Section B. Detection/attrition bias4. Blinding of outcome assessors? (IV R)
5. Losses during study? (IV P/I R)
6. Loss comparable in each group (within 5%) (IV P/I R)
7. Analysis by intention to treat completed or possible?
Section C. External validity8. Study population representative? (EV P/I R)
9. Length of followup >1 year (IV P/I R)
Yes=1No or not described=0Any other study type=0
Yes, in all=3In at least age, functional status=1Not described or no=0
Confirmed=1Not described or no=0
Less than 20% overall=1More than 20%=0
Yes=1Not described or no=0
Yes=1No=0
Yes=1Not described or no=0
Yes=1Not described or no=0
96
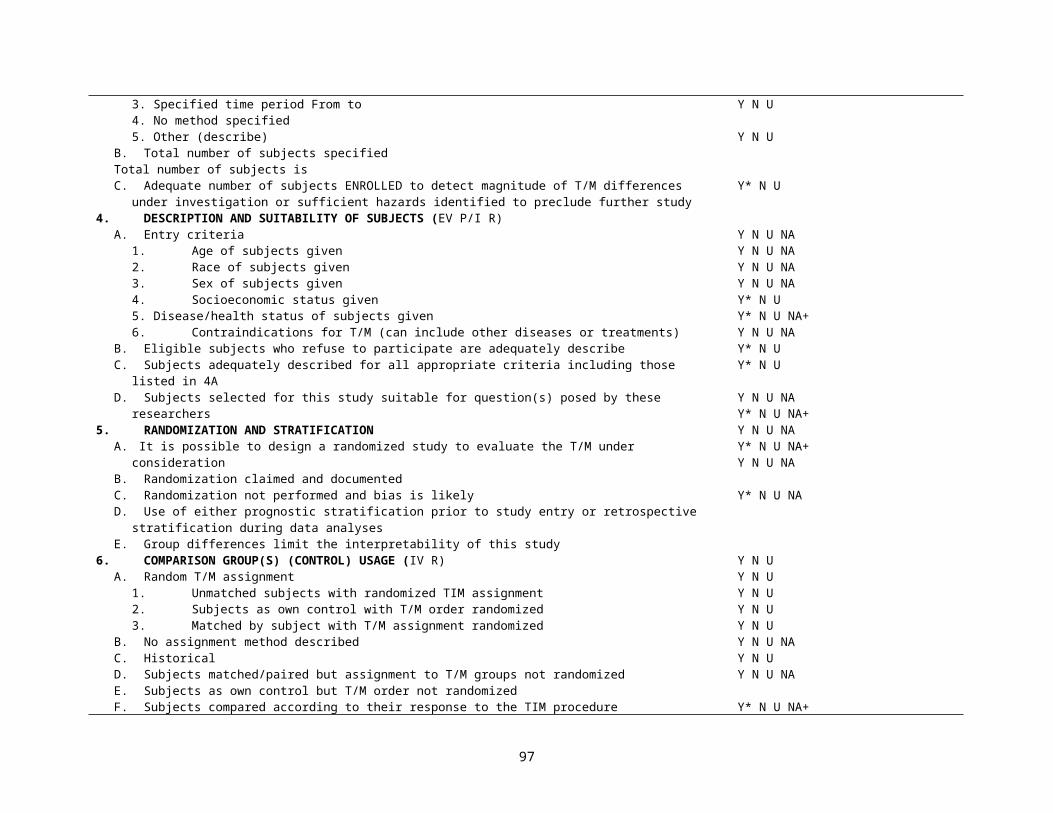
Ariens, 2000 [47]Table 1. Description of the different items in the quality assessment lists (+) positive
(-) negative(?) unclearTotal quality score calculated by counting number of items rated positively for validity of precision
Item categories with different item definitionsStudy purposeA. Positive if a specific, clearly stated purpose was describedStudy designB. Positive if the main features (description of sampling frame, distribution by age and gender) of the study population were stated.C. Positive if the participation rate at the beginning of the study was at least 80%.D. Positive if the cases and referents were drawn from the same population and a clear definition of the cases and referents was
stated. Persons with neck pain in the last 9 days had to be excluded from the reference group.Exposure measurementF. Positive if the data on physical load at work were collected and used in the analysis.G. Positive if the data on physical load at work were collected using standardized methods of acceptable quality.H. Positive if the data on psychosocial factors at work were collected and used in the analysis.I. Positive if the data on psychosocial factors at work were collected using standardized methods of acceptable quality.J. Positive if the data on physical and psychosocial factors during leisure time were collected and used in the analysis.K. Positive if the data on historical exposure at work were collected and used in the analysis.L. Positive if the data on history of neck disorders, gender, and age were collected and used in the analysis.M. Positive if the exposure assessment was blinded with respect to disease status.N. Positive if exposure was measured in an identical way among the cases and referents.O. Positive if the exposure was assessed at a time prior to the occurrence of the outcome.Outcome measurementsP. Positive if the data on outcomes were collected using standardized methods of acceptable quality.Q. Positive if the incident cases were used (prospective enrollment)R. Positive if the data on outcomes were collected for at least 1 year.S. Positive if the data on outcomes were collected at least every 3 months.Analysis and data presentationT. Positive if the statistical model used was appropriate for the outcome studied and the measures of association estimated with this
model were presented (including confidence intervals).U. Positive if the study controlled for confounding.V. Positive if the number of cases in the multivariate analysis was at least 10 times the number of independent variables in the
analysis.
97
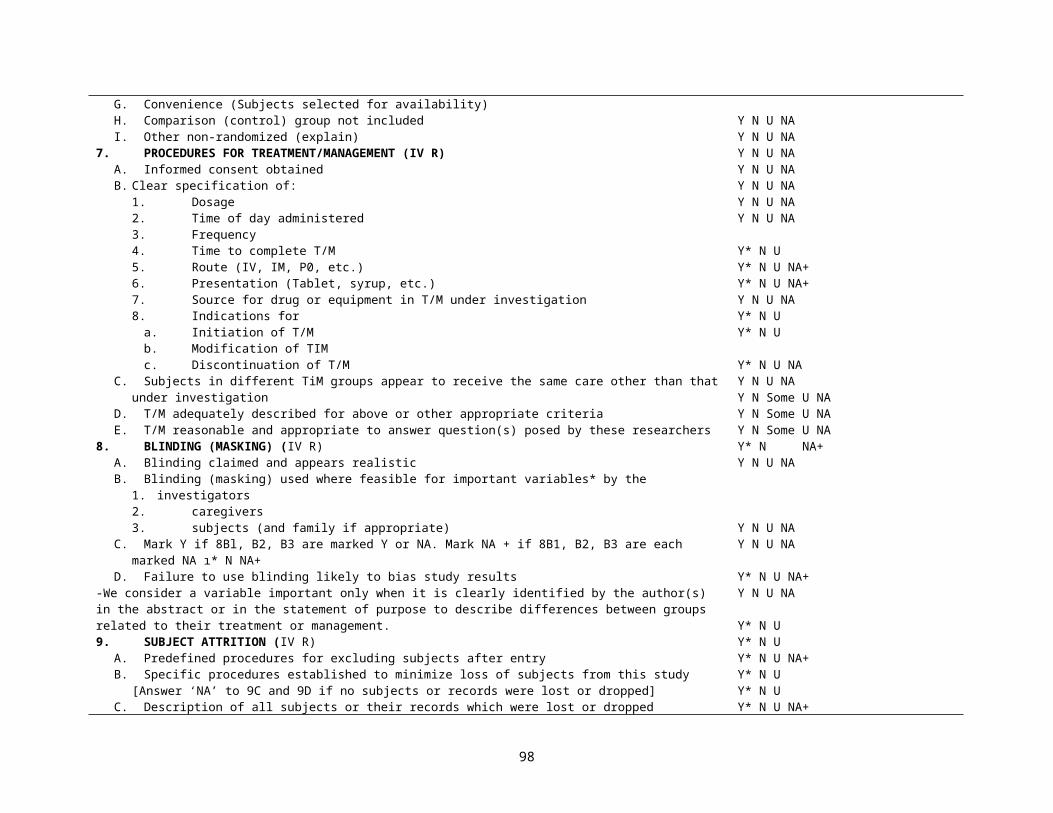
Zeegers, 2000 [48]General information—year of publicationresearch design (case–control study, follow-up study, other, unknown) (E)and geographic area (Europe, United States, Asia, Africa, unknown) (EV)Exposure information— (IV R)exposure measurement (personal interview, telephone interview, questionnaire, medical records, other, unknown)trained interviewer (yes, no, not applicable [n/a], unknown)validation exposure measurement (yes, no, unknown)and reference period (number of years, lifetime, unknown)Case information—source cases (EV R)(hospital, population, other, unknown)histologic confirmation cases (yes, no, unknown)Case–control study information— (IV R)source controls (hospital, population, neighborhood, other, n/a, unknown)response rate (percentage, n/a, unknown)and blinding of case status (yes, no, n/a, unknown)Follow-up study information—(IV R) source study population (volunteer, population, other, n/a, unknown)years of follow-up (number of years, n/a, unknown)blinding of exposure status (yes, no, n/a, unknown)and completeness of follow-up (percentage, n/a, unknown)
98
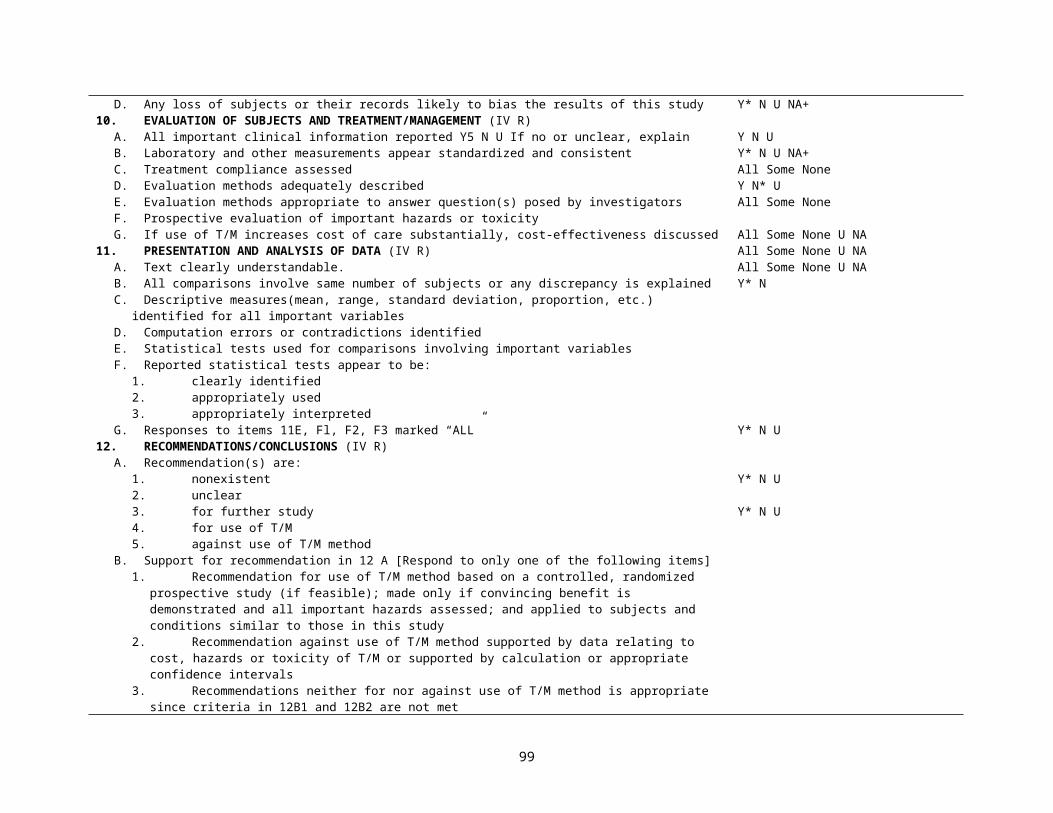
Zaza, 2000 [49]Categories Potential threats to validity addressed by the categoryDescriptionsExample: Is the intervention well described? (IV R)
Bias introduced by failure to maintain integrity of the intervention
SamplingExample: did the authors specify the screening criteria for study eligibility? (EV P/I R)
Selection bias
MeasurementExample: Were the exposure and outcome measures valid and reliable? (IV P/I R)
Measurement biases-observer/interviewer-self-report-recall-otherMisclassification bias-exposure-outcome
AnalysisExample: did the authors conduct an appropriate analysis by conducting statistical testing, controlling for repeated measures, etc. (IV R)
Analytic biases-repeated measures-differential exposure-design effects-cross-level bias-others
Interpretation of results (IV R)Example: did the authors correct for controllable confounders
Attrition biasConfoundingSecular trendsAll others
Questions from the data collection instrument, Guide to Community Preventative ServicesWere the outcome and other independent (or predictor) variables valid measures of the outcome of interest? (IV P/I R)The authors should have reported one or more of the following:
Clear definitions of the outcome variable Measurement of the outcome in different ways. Example: correlational analysis between measured outcomes to demonstrate convergent (i.e., 2 or more
measure reflect the same underlying process) or divergent validity (i.e., 2 or more measure reflect different dimensions). An example of the former is that 5 items on self-efficacy correlate highly with each other; an example of the latter is that self-efficacy measure do not correlate highly with attitude measures
Citations or discussion as to why the use of these measures is valid. Example: see above Other. Example: if authors fail to blind observers/interviewers to treatment vs. comparison group, when applicable, the answer to this question should be no
Were the outcome and other independent (or predictor) variables reliable (consistent and reproducible) measures of the outcome of interest? The authors should have reported one or more of the following: (IV R)
Measures of internal consistency. Example: see 3B Measures of the outcome in different ways. Example: see 3B and 3C (above) Considered consistency of coding scoring or categorization between observers (e.g. inter-rater reliability checks) or between different outcome measures.
Example: percent agreement, Kappa Considered how setting and sampling of study population might affect reliability. Citations or discussion as to why the use of these measures is reliable. Example: see 3B Other
Response Options Yes No N/A Related questions
99
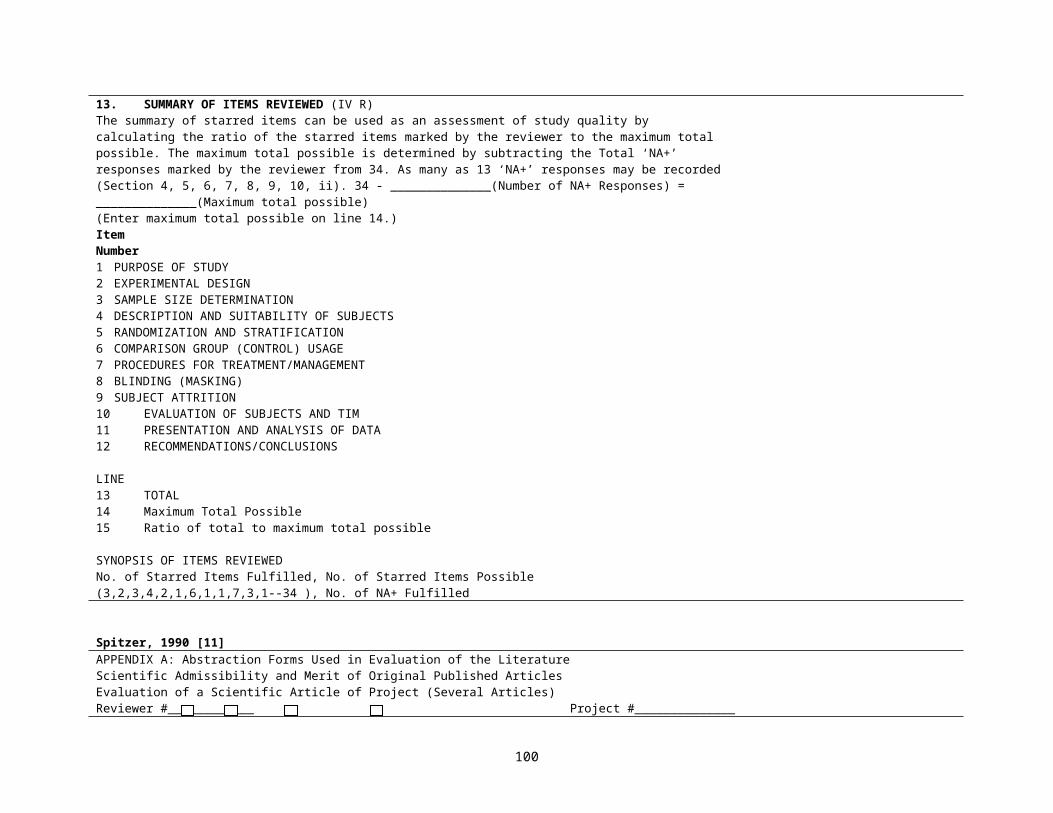
Were the outcome and other independent (or predictor) variablesValid? I/10 Reliable (consistent and reproducible) II/8,9,10,18,20
van der Windt, 2000 [50]Table 1. Standardised checklist for the assessment of methodological quality of cross sectional studies (CS), case-control studies (CC), and prospective cohort
studies (PC)Study objective1. Positive if a specific, clearly stated objective is described CS/CC/PCStudy population2. Positive if the main features of the study population are described (sampling frame and distribution of the population by age and sex) CS/CC/PC3. Positive if cases and controls are drawn from the same population and a clear definition of cases and controls was stated, and if people with
shoulder pain in the past 3 months are excluded from the controls (IV R)CC
4. Positive if the participation rate is >80% or if participation rate is 60%–80% and non-response is not selective (data presented) CS/CC/PC5. Positive if the response at main moment of follow up is >80% or if the non-response is not selective (data presented) PCExposure assessment, physical load at work (if not included in the design, not applicable (NA)) (IV R)6. Positive if data are collected and presented about physical load at work CS/CC/PC7. Method for measuring physical load at work: direct measurement and observation (+), interview or questionnaire only (−) CS/CC/PC8. Positive if more than one dimension of physical load is assessed: duration, frequency, or amplitude CS/CC/PCExposureassessment,psychosocialfactorsatwork(ifnotincludedinthedesign,NA) (IV R)9. Positive if data are collected and presented about psychosocial factors at work CS/CC/PC10.Positive if more than one aspect of psychosocial factors is assessed: work demands, job control, social support CS/CC/PCExposure assessment, other (IV R)11.Positive if data are collected and presented about physical or psychosocial exposure during leisure time CS/CC/PC12. Positive if data are collected and presented about occupational exposure in the past CS/CC/PC13.Positive if data are collected and presented about a history of shoulder disorders CS/CC/PC14.Positive if exposure is measured in an identical manner in cases and controls CC15.Positive if the exposure assessment is blinded to disease status SC/CC16.Positive if the exposure is assessed at a time before the occurrence of the disease CCOutcome assessment (IV R)17.Positive if data were collected for >1 year PC18.Positive if data were collected at least every 3 months PC19.Method for assessing shoulder pain: physical examination blinded to exposure status (+), self reported: specific questions relating to shoulder
disability or use of manikin (+), single question (−) CS/CC/PC
20.Positive if incident cases are used (prospective enrolment) CCAnalysis and data presentation (IV R)21.Positive if the appropriate statistical model is used (univariate or multivariate model) CS/PC22.Positive if a logistic regression model is used in the case of an unmatched case-control study and a conditional logistic regression model in
the case of a matched case-control study (IV R)CC
23.Positive if measures of association are presented (OR/RR), including 95% CIs and numbers in the analysis (totals) CS/CC/PC24.Positive if the analysis is controlled for confounding or effect modification is studied CS/CC/PC25.Positive if the number of cases in the multivariate analysis is at least 10 times the number of independent variables in the analysis (final model) CS/CC/PC
100
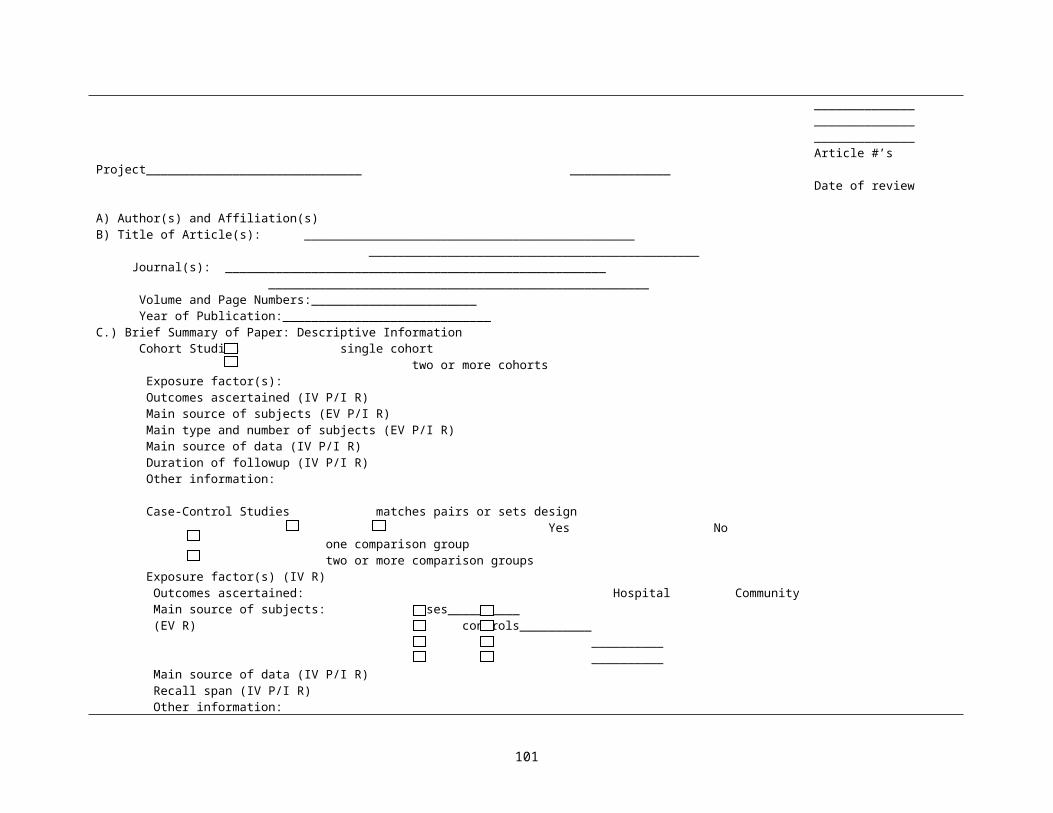
Steinberg, 2000 [51]
Question Yes Partially or Somewhat No Not Blinded N/A
1. Specific aims of study clearly stated? 1 -- 02. Both inclusion and exclusion criteria specified? (If case study, check N/A.) (EV P/I R) 1 0.5 03. In studies in which> two groups are compared, did investigators report how patients were
chosen or allocated to groups? (IV R)1 -- 0
4. If blinded study, did investigators report who was blinded? (IV R) 1 0.5 0 05. If blinded study, did investigators report blinding procedures used? (IV R) 1 0.5 0 06. If blinded study, did investigators report degree to which blinding was achieved? (IV R) 1 0.5 0 07. Did the study define major variables? 1 0.5 08. In comparative studies, were measurements made in the same way in groups being compared?
(IV R)1 -- 0
9. Did investigators provide sample size justification developed before study began? (IV R) 1 0.5 010.Was information provided on eligible subjects not included on the study? (EV P/I R) 1 0.5 011.Did investigators describe characteristics of enrolled sample, including potentially important
demographic and prognostic factors or other descriptors? (EV P/I R)1 0.5 0
12.When associations are reported, are effects of patient characteristics or prognostic factors controlled for statistically or by design? (IV R)
1 0.5 0
13.Did investigators document number of protocol violations, dropouts, crossovers, subjects with incomplete data, subjects who died for reasons other than main reason under study, etc? (IV R)
1 0.5 0
14.Does analysis deal with dropouts, crossovers, or subjects with incomplete data? (IV R) 1 -- 015.Did investigators report what kind of statistical test was used for each comparison? (IV R) 1 0.5 016.Are P values or confidence intervals reported for all tests? 1 -- 017.Are magnitudes of all main effects reported? (E R) 1 0.5 018.Did investigators discuss study limitations? 1 -- 019.Was description of the test(s) clear enough for someone else to reproduce the test? (for articles
regarding a diagnostic test)1 0.5 0
20.Are summary statistics for test's performance reported? (for articles regarding a diagnostic test) 1 -- 021. Is reproducibility of test reported for interrater reliability? (for articles regarding a diagnostic test)
(IV P/I R)1 -- 0
22. Is reproducibility of test reported for test-retest reliability? (for articles regarding a diagnostic test) (IV P/I R)
1 -- 0
23.Do investigators identify the perspective from which costs were assessed? (for articles regarding cost effectiveness)
1 -- 0
24.Do investigators report sensitivity analysis to evaluate effect of assumptions? (for articles regarding cost effectiveness) (IV R)
1 -- 0
Methods score is equal to sum of values for applicable questions divided by number of applicable questions. Possible range: 0 to 1.Abbreviations: N/A, not applicable
101
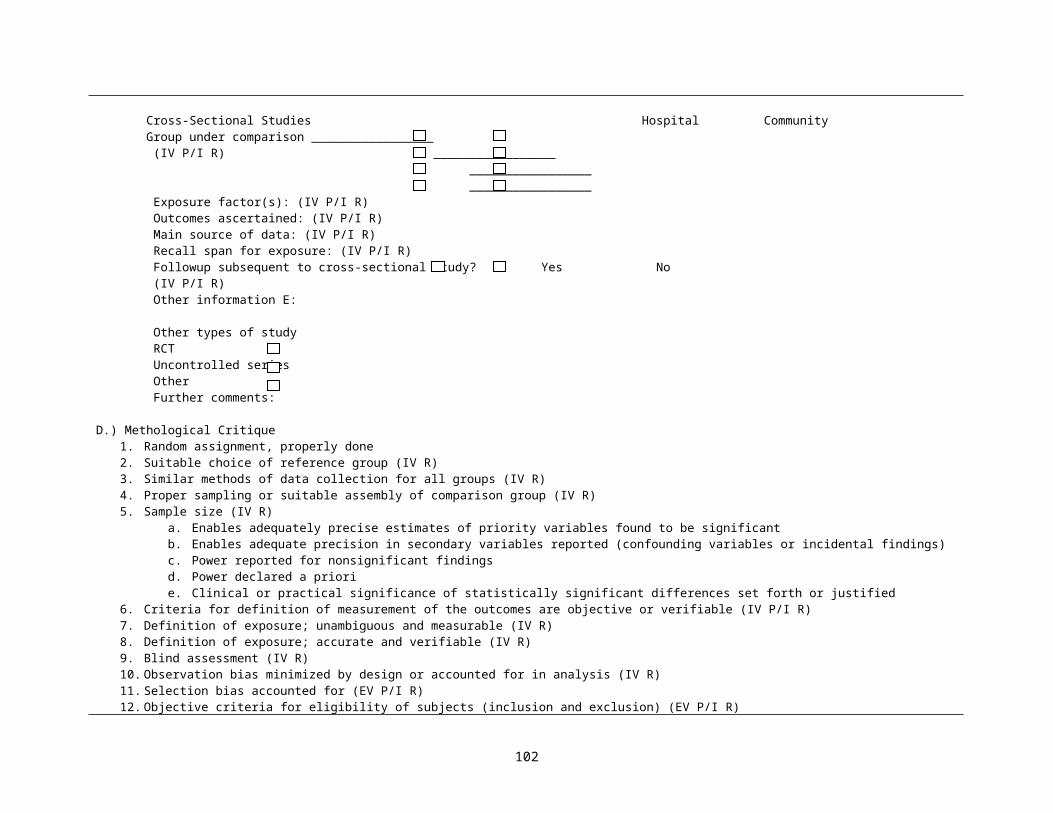
Harris, 2001 [85]Systematic reviews-Comprehensiveness of sources/search strategy used-Standard appraisal of included studies-Validity of conclusions-Recency and relevance
Case–control studies -Accurate ascertainment of cases (EV IV R)-Nonbiased selection of cases/controls with exclusion criteria applied equally to both (IV R)-Response rate (EV R)-Diagnostic testing procedures applied equally to each group (IV R)-Appropriate attention to potential confounding variables (IV R)
Evaluating the quality of evidence at three strata (E R)1. Individual study
-Internal validity-External validity
2. Linkage in the analytic framework-Aggregate internal validity-Aggregate external validity-Coherence/consistency
3. Entire preventive service-Quality of the evidence from Stratum 2 for each linkage in the analytic framework-Degree to which there is a complete chain of linkages supported by adequate evidence to connect the preventive service to health outcomes-Degree to which the complete chain of linkages “fit” together-Degree to which the evidence connecting the preventive service and health outcomes is “direct”
Scottish Intercollegiate Guidelines Network [69]Key to evidence statements and grades of recommendationsLEVELS OF EVIDENCE1++ High quality meta-analysis, systematic reviews of RCTs, or RCTs with a very low risk of bias1+ Well conducted meta-analyses, systematic reviews, or RCTs with a low risk of bias1- Meta-analysis, systematic reviews, and RCTs with a high risk of bias2++ High quality systematic reviews of case control or cohort studies
High quality case control or cohort studies with a very low risk of confounding or bias and a high probability that the relationship is casual2+ Well conducted case control or cohort studies with a low risk of confounding or bias and a moderate probability that the relationship is casual2- Case control or cohort studies with a high risk of confounding or bias and a significant risk that the relationship is not casual3 Non-analytic studies, e.g. case reports, case series4 Expert opinionGRADES OF RECOMMENDATIONNote: The grade of recommendation relates to the strength of the evidence on which the recommendation is based. It does not reflect the clinical importance of the recommendation.A At least one meta-analysis, systematic review, or RCT rated as 1++, and directly applicable to the target population; or
102
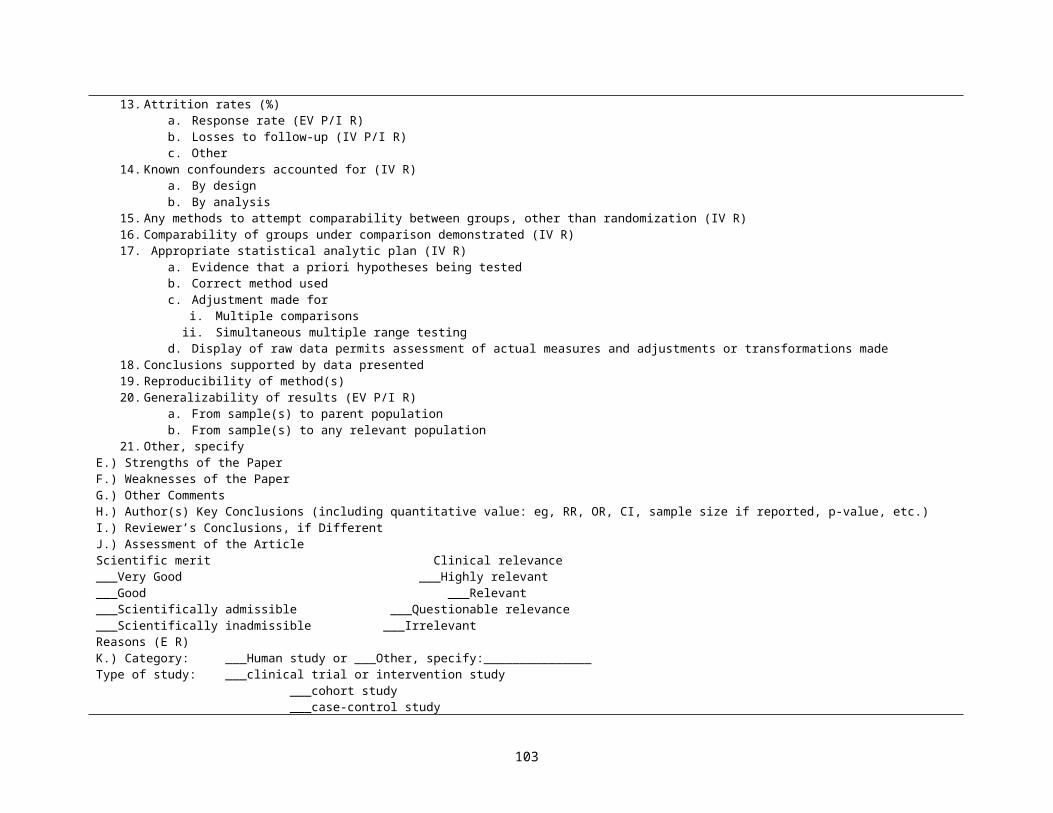
A body of evidence consisting principally of studies rated as 1+, directly applicable to the target population, and demonstrating overall consistency of results.
B A body of evidence including studies rated as 2++, directly applicable to the target population, and demonstrating overall consistency of results; orExtrapolated evidence from studies rated as 1++ or 1+
C A body of evidence including studies rated as 2+, directly applicable to the target population and demonstrating overall consistency of results; orExtrapolated evidence from studies rated as 2++
D Evidence levels 3 or 4; or Extrapolated evidence from studies rated as 2+
Methodology Checklist 1: SYSTEMATIC REVIEWS AND META-ANALYSESSECTION 1: INTERVAL VALIDITY (IV P/I R)1.1 The study addresses an appropriate and clearly focused question.
Well covered Not addressedAdequately addressed Not reportedPoorly addressed Not applicable
1.2 A description of the methodology used is included. Well covered Not addressedAdequately addressed Not reportedPoorly addressed Not applicable
1.3 The literature search is sufficiently rigorous to identify all the relevant studies. Well covered Not addressedAdequately addressed Not reportedPoorly addressed Not applicable
1.4 Study quality is assessed and taken into account. Well covered Not addressedAdequately addressed Not reportedPoorly addressed Not applicable
1.5 There are enough similarities between the studies selected to make combining them reasonable Well covered Not addressedAdequately addressed Not reportedPoorly addressed Not applicable
SECTION 2: OVERALL ASSESSMENT OF THE STUDY2.1 How well was the study done to minimize bias? (IV P/I R)
Code ++, +, -2.2 If coded as + or – what is the likely direction in which bias might affect the study results? (IV P/I R)SECTION 3: DESCRIPTION OF THE STUDY3.1 What types of study are included in the review? RCT CCT Cohort Case-control Other3.2 How does this review help to answer your key question?
Methodology Checklist 3: COHORT STUDIESSECTION 1: INTERNAL VALIDITY1.1 The study addresses an appropriate and clearly focused question. (IV P/I R)
Well covered Not addressedAdequately addressed Not reportedPoorly addressed Not applicable
1.2 The two groups being studied are selected from source populations that are comparable in all respects other than the factor under investigation. (IV R)
Well covered Not addressedAdequately addressed Not reportedPoorly addressed Not applicable
1.3 The study indicated how many of the people asked to take part did so, in each of the groups being studied. (EV P/I R)
Well covered Not addressedAdequately addressed Not reportedPoorly addressed Not applicable
1.4 The likelihood that some eligible subjects might have the outcome at the time of enrolment is assessed and taken into account in the analysis. (IV R)
Well covered Not addressedAdequately addressed Not reported
103
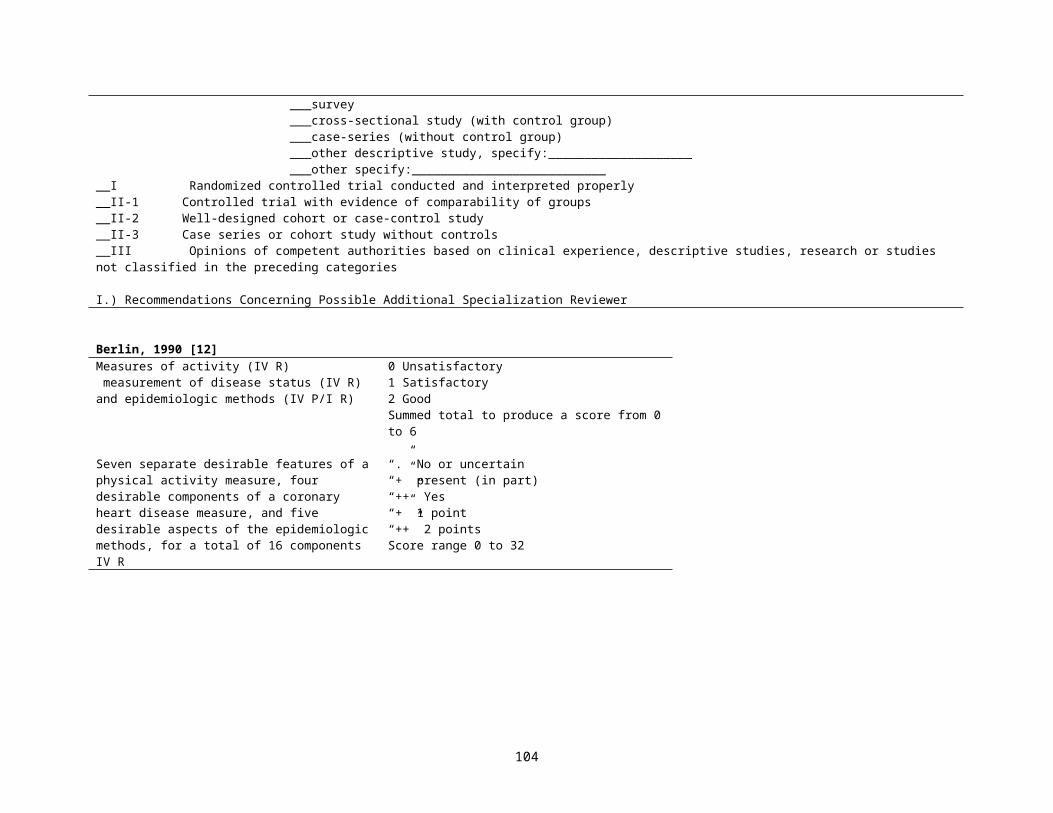
Poorly addressed Not applicable1.5 What percentage of individuals or clusters recruited into each arm of the study dropped out before the
study was completed. (IV P/I R)1.6 Comparison is made between full participants and those who lost to follow up, by exposure status. (IV
P/I R)Well covered Not addressedAdequately addressed Not reportedPoorly addressed Not applicable
1.7 The outcomes are clearly defined. IV P/I R Well covered Not addressedAdequately addressed Not reportedPoorly addressed Not applicable
1.8 The assessment of outcome is made blind to exposure status. IV R Well covered Not addressedAdequately addressed Not reportedPoorly addressed Not applicable
1.9 Where blinding was not possible, there is some recognition that knowledge of exposure status could have influenced the assessment of outcome. (IV R)
Well covered Not addressedAdequately addressed Not reportedPoorly addressed Not applicable
1.10 The measure of assessment of exposure is reliable. (IV R) Well covered Not addressedAdequately addressed Not reportedPoorly addressed Not applicable
1.11 Evidence from other sources is used to demonstrate that the method of outcome assessment is valid and reliable. (IV P/I R)
Well covered Not addressedAdequately addressed Not reportedPoorly addressed Not applicable
1.12 Exposure level or prognostic factor is assessed more than once. (IV R) Well covered Not addressedAdequately addressed Not reportedPoorly addressed Not applicable
1.13 The main potential confounders are identified and taken into account in the design and analysis. (IV R)
Well covered Not addressedAdequately addressed Not reportedPoorly addressed Not applicable
1.14 Have confidence intervals been provided?
SECTION 2: OVERALL ASSESSMENT OF THE STUDY2.1 How well was the study done to minimize the risk of bias or confounding, and to establish a causal
relationship between exposure and effect?( IV R) Code ++, +, or -2.2 Taking into account clinical considerations, your evaluation of the methodology used and the statistical
power of the study, are you certain that the overall effect is due to the exposure being investigated? (IV R)
2.3 Are the results of this study directly applicable to the patient group targeted in this guideline? (EV R)SECTION 3: DESCRIPTION OF THE STUDY3.1 How many patients are included in the study?
List the number in each group separately3.2 What are the main characteristics of the study population? (EV P/I R)
Include all relevant characteristics—for example, age, sex ethnic origin, comorbidity, disease status, community/hospital based
3.3 What environmental or prognostic factor is being investigated in this study? (IV R)3.4 What comparisons are made in this study? (IV R)
Are comparisons made between presence or absence of an environmental/prognostic factor, or different
104
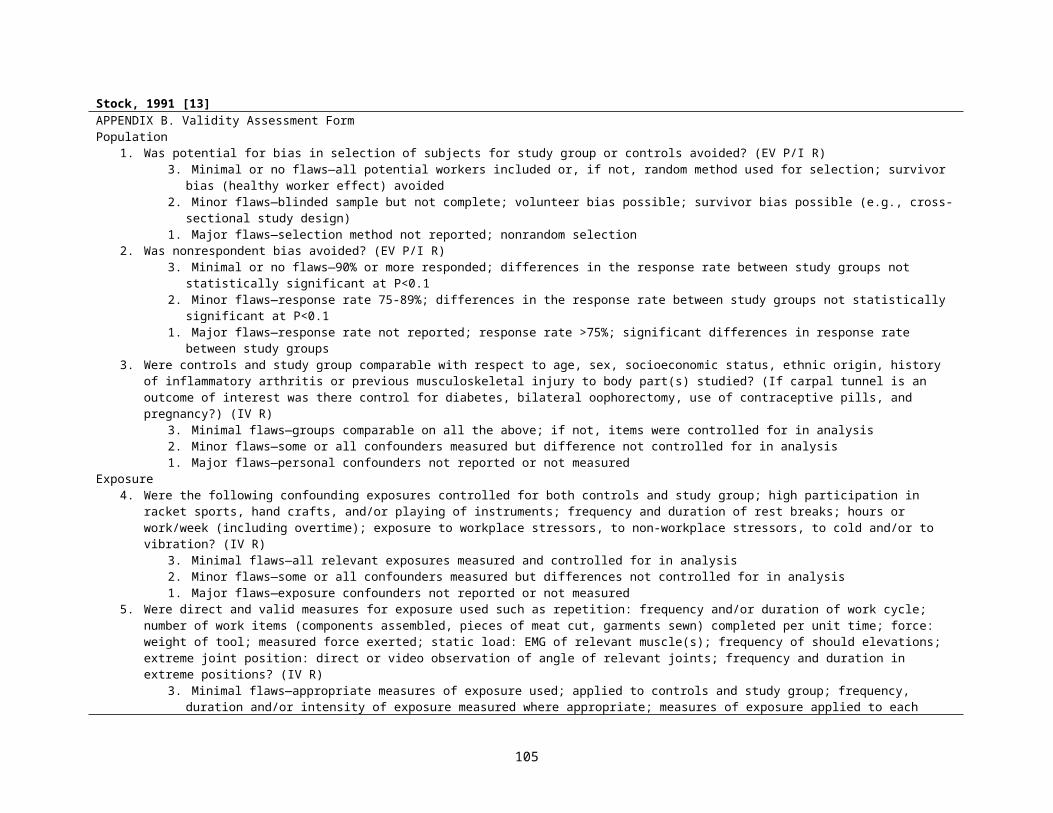
levels of the factor?3.5 How long are patients followed up in the study? (IV P/I R)3.6 What outcome measure(s) are used in this study? (IV R)
List all outcomes that are used to assess the impact of the chosen environmental or prognostic factor.3.7 Taking into account clinical considerations, your evaluation of the methodology used and the statistical
power of the study, are you certain that the overall effect is due to the exposure being investigated? (IV R)3.8 Are the results of this study directly applicable to the patient group targeted in this guideline?
(EV P/I R)3.9 Does this study help to answer your key question?
Summarize the main conclusions of the study and indicate how it relates to the key question?
Methodological Checklist 4: CASE-CONTROL STUDIESSECTION 1: INTERNAL VALIDITY1.1 The study addresses an appropriate and clearly focused question.
Well covered Not addressedAdequately addressed Not reportedPoorly addressed Not applicable
1.2 The cases and controls are taken from comparable populations. (IV R) Well covered Not addressedAdequately addressed Not reportedPoorly addressed Not applicable
1.3 The same exclusion criteria are used for both cases and controls. (IV R) Well covered Not addressedAdequately addressed Not reportedPoorly addressed Not applicable
1.4 What percentage of each group (cases and controls) participated in the study? (IV R) Cases:Controls:
1.5 Comparison is made between participants and non-participants to establish their similarities or differences. (EV R)
Well covered Not addressedAdequately addressed Not reportedPoorly addressed Not applicable
1.6 Cases are clearly defined and differentiated from controls. (IV R) Well covered Not addressedAdequately addressed Not reportedPoorly addressed Not applicable
1.7 It is clearly established that controls are non-cases. (IV R) Well covered Not addressedAdequately addressed Not reportedPoorly addressed Not applicable
1.8 Measures will have been taken to prevent knowledge of primary exposure influencing case ascertainment. (IV R)
Well covered Not addressedAdequately addressed Not reportedPoorly addressed Not applicable
1.9 Exposure status is measured in a standard, valid and reliable way. (IV R) Well covered Not addressedAdequately addressed Not reportedPoorly addressed Not applicable
1.10 The main confounders are identified and taken into account in the design and analysis. (IV R) Well covered Not addressedAdequately addressed Not reportedPoorly addressed Not applicable
1.11 Confidence intervals are provided.SECTION 2: OVERALL ASSESSMENT OF THE STUDY2.1 How well was the study done to minimize the risk of bias or confounding, and to establish a causal
relationship between exposure and effect? (IV R)
105
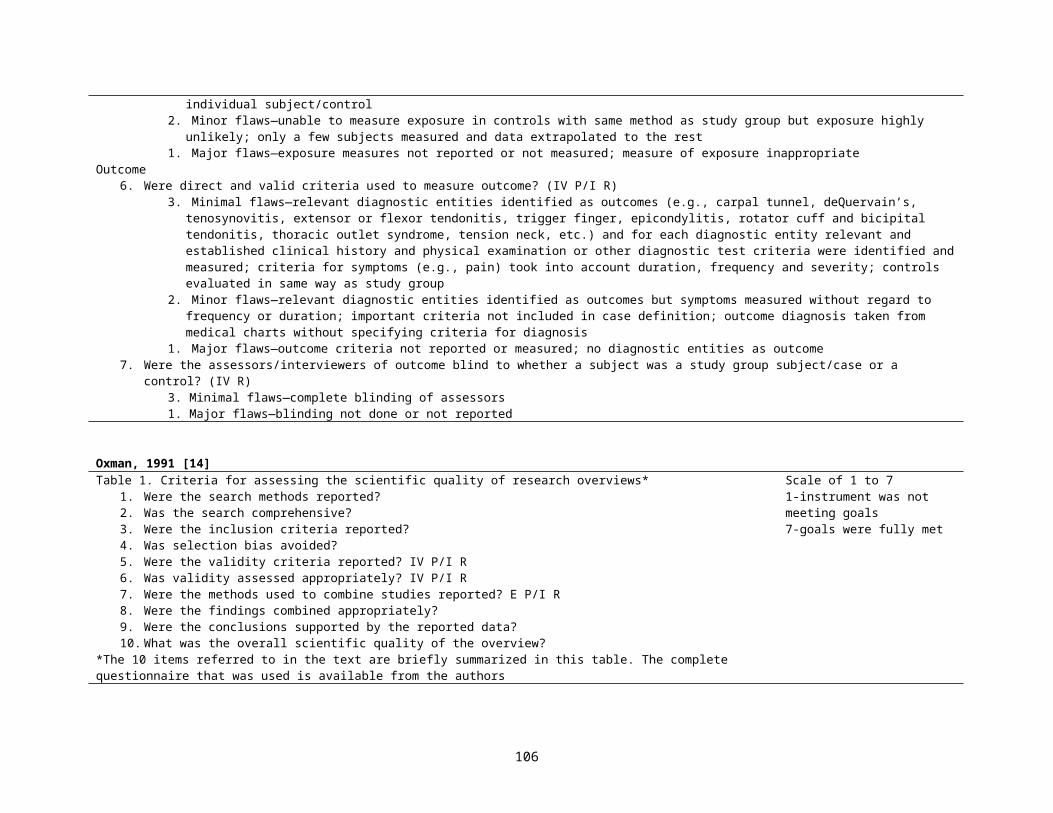
Code ++, +, or -2.2 Taking into account clinical considerations, your evaluation of the methodology used and the statistical
power of the study, are you certain that the overall effect is due to the exposure being investigated? (IV R)
2.3 Are the results of this study directly applicable to the patient group targeted in this guideline? (EV R)SECTION 3: DESCRIPTION OF THE STUDY3.1 How many patients are included in the study?
List the number in each group separately3.2 What are the main characteristics of the study population? (EV R)
Include all characteristics used to identify both cases and controls—e.g. age, sex, social status, disease status
3.3 What environmental or prognostic factor is being investigated in this study? (IV R)3.4 What comparisons are made in this study? (IV R)
Normally only one factor will be compared but in some cases the extent of exposure may be stratified—e.g. non-smokers v. light, moderate, or heavy smokers. Note all comparisons here.
3.5 For how long are patients followed-up in the study? (IV R)Length of time participant histories are tracked the study.
3.6 What outcome measures are used in the study? (IV P/I R)List all outcomes that are used to assess the impact of the chosen environmental or prognostic factor.
3.7 What size effect is identified in the study? (IV R)Effect size should be expressed as an odds ratio. If any other measures are included, note them as well. Include p values and any confidence intervals that are provided.
3.8 How was the study funded? (IV R)List all sources of funding quoted in the article, whether Government, voluntary sector, or industry.
3.9 Does this study help to answer your key questions? (IV R)Summarize the main conclusions of the study and indicate how it relates to the key question?
Macfarlane, 2001 [54]AbstractIs the hypothesis/aim/objective of the study described?Is the design of the study described?Is the source of the subjects studied stated? (EV P/I R)Is the sample size stated? (IV R)Is the participation/follow up rate stated? (IV P/I R)Are the outcomes of interest described? (IV P/I R)Are any results given?Are any conclusions stated?
PaperIs the hypothesis/aim/objective of the study clearly described?Are the main outcomes to be measured clearly described in the Introduction or Methods section?
(IV P/I R)Is the design of the study described? (E)Is the setting of the study described? (EV P/I R)Is the source of the subjects studied stated? (EV P/I R)
The maximum obtainable score for the paper was 21 points for cohort studies, 22 points for case-control studies and 20 points for cross-sectional studies. The results were expressed as percentages of the total.
106 _ __� __� "� ___ __� __� __�
"� ____� _"� _1__� __ ______� ___� __� "� ____� __� $� ____ � __� __"_�
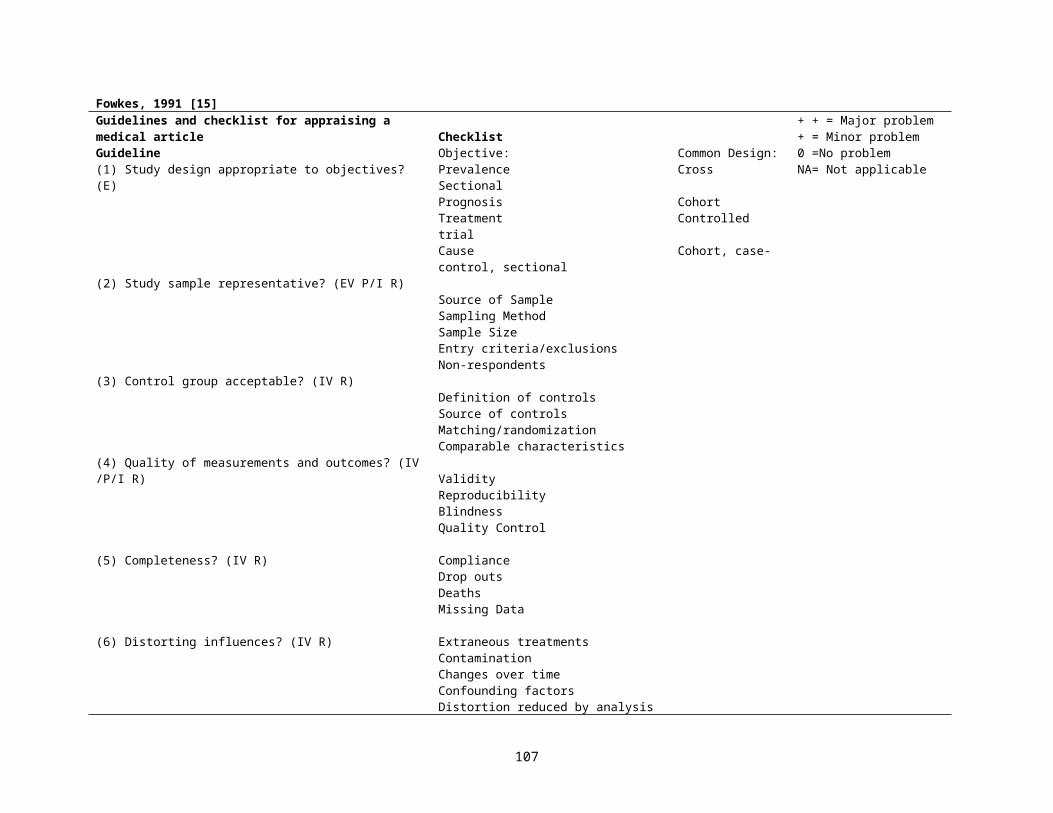
Is the distribution of the study population by age and gender described? (EV P/I R)Is the sample size stated? (IV R)Is the participation/follow up rate stated? (IV P/I R)Are non-participants/subjects lost to follow up described? (EV P/I R)Do the authors describe the effort to increase the participation/follow up rate? (EV P/I R)Are the main findings of the study described?Are the statistical methods described?Have actual probability values been reported (e.g. 0.035 rather than <0.05) for the main outcomes except
where the probability value is less than 0.001?Are confidence intervals given?Are any conclusions stated?Were the subjects asked to participate in the study representative of the entire population from which they
were recruited? (EV P/I R)Were those subjects who were prepared to participate representative of the entire population from which
they were recruited? (EV P/I R)Was the participation/follow up rate >80%? (IV P/I R)Were the main outcome measures used accurate (valid and reliable)? (IV P/I R)Was the sample size justified? (IV R)Analysis adjusts for length of follow up? (cohort only) (IV P/I R)
Checklist for submitting reports on epidemiological studiesHeading DescriptorTitle 1 Identify the study as cross-sectional (survey)/cohort (follow up, longitudinal)/case-control (E)Abstract 2 Use a structure formatIntroduction 3 State hypothesis and planned subgroup or covariate analysisMethods 4 Planned study population, together with inclusion/exclusion criteria (EV P/I R)
5 Method of population selection (simple random or design effect) (EV P/I R)6 Planned follow up (if applicable) and timing (IV P/I R)7 Outcome measures (IV P/I R)8 Sample Size (IV R)9 Statistical analysis (IV R)
Results 10 Describe participation rate (EV R)11 Describe non-participants (characteristics, reasons for non-participation) (EV R)12 Present summary data and appropriate descriptive and inferential statistics in sufficient detail to permit alternative
analysis and replication (state numbers as well as %)13 Describe confounders and any attempt to adjust for them (IV) 14 Describe protocol deviations from the study as planned, together with the reasons
Discussion 15 State specific interpretation of study findings including a discussion of bias16 State general interpretation of the data in light of the totality of the available evidence
107

Pilote, 2002 [55]Steps to evaluate practice guidelines using outcomes Research: 1. Can a large database be identified that contains information on practice patterns for the treatment of a condition for which practice guidelines have been
developed? 2. Is the database suitable for guideline evaluation in terms of the following criteria?
a. Can a precise diagnosis be made using the available data?b. Can criteria be established to allow for the creation of comparison groups with different practice patterns? (IV R)c. Are there data to ensure the comparability of the groups? (IV R)d. Can practice patterns be measured?e. Can practice patterns be identified according to those prescribed by practice guidelines?f. Are there any data on patient, physician, and environmental factors that could explain deviations from practice prescribed by practice guidelines and
that could help validate any inference made about practice patterns–outcomes associations?g. Are outcomes of interest related to the purpose of clinical guidelines to enhance the quality, appropriateness, and effectiveness of health care,
available and measured with precision? (IV R)h. Are the incidence rates or prevalence of the outcomes of interest large enough to allow meaningful practice patterns–outcomes associations?
(E IV P/I R)
Reasons for the inability of the proposed methodological framework to deal with biases in outcomes research-- Lack of control over data quality.- Lack of control over what is being collected; lack of data on practice patterns; lack of data on initial conditions; lack of data on all outcomes of interest for
guideline evaluation. (IV R)- Difficulty with the measure of correlated data. (IV R)- Limited availability of statistical methods to deal with ecological exposures in individual level studies. (IV R)- Limited number of diagnoses amenable to be studied through this method. - Outcomes research works when natural experiments can be observed. Only for a few conditions, the argument is as follows: treatments are so varied, and
the doctor’s choice so unpredictable, that database records approximate those obtained from arbitrary assignment in clinical trials.
Jain, 2002 [56]Definition of Breastfeeding (IV P/I R)Timing of Data Collection (E) Source of Feeding Data (IV P/I R)Duration of Breastfeeding (IV P/I R)Socioeconomic Status (IV P/I R)Stimulation of the Child (IV P/I R)
108
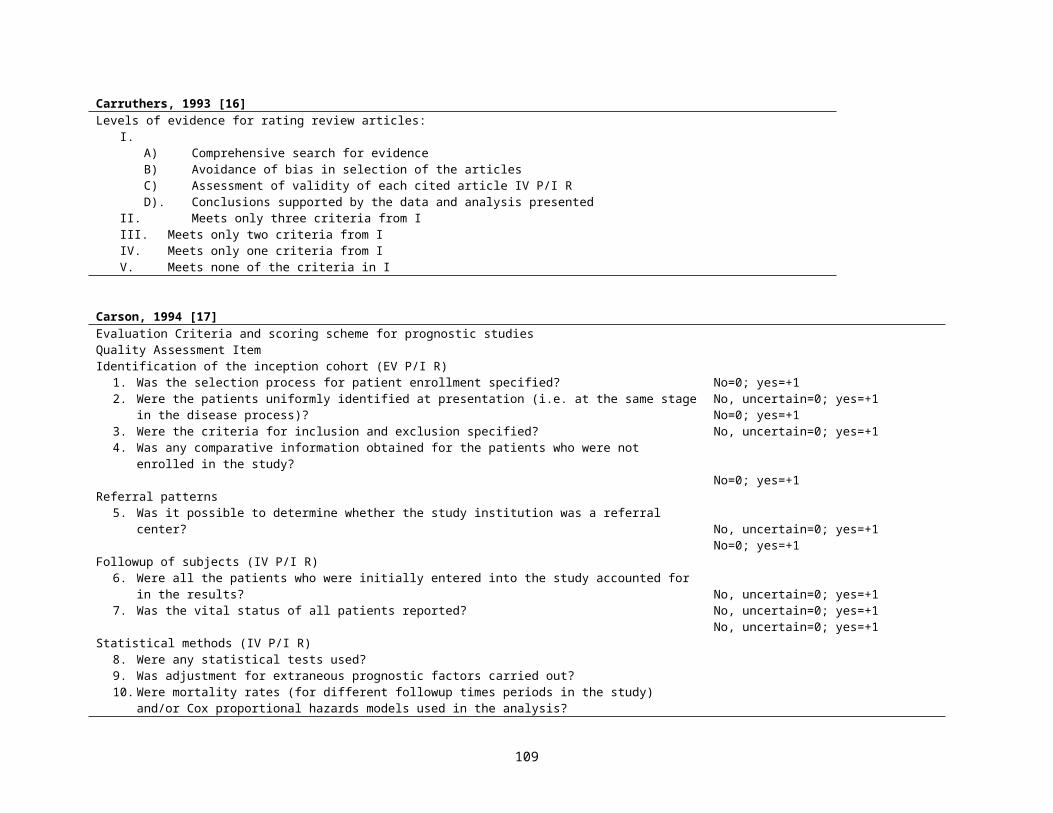
Bhutta, 2002 [57]Quality Criteria for Observational Studies*Quality ParametersPopulation sample (EV P/I R)
Study design (E)
Demographic data† (EV P/I R)
Socioeconomic data‡ (EV P/I R)
Neurological outcomes of prematurity§ (IV P/I R)
Matching of cases and controls (IV R)
*NA indicates data not available.†Gestational age at birth, sex, race, or age at evaluation.‡Family income, insurance status, maternal education, paternal education, or Hollingshead index.§Neurological deficits, blindness, deafness, cerebral palsy, or hydrocephalus.
2 1 0Defined geographic area ≥1 Hospital Convenience sample (1 clinic)
Prospective longitudinal followup
Patients contacted after neonatal intensive care unit discharge
NA
NA Complete description Inadequate
NA Adequate Inadequate
Complete Description Partial Description Inadequate
>3 Factors 1-3 Factors None
Al-Jader, 2002 [58]1. Degree of ascertainment (IV P/I R)
2. The population studied (The denominator) (EV P/I R)A population of adequate size (IV R)Its size recorded (IV R)Its ethnic composition recorded (EV P/I R)
3. The cases (the numerator) (EV IV R)
Their numbers recorded (IV R)
0-20Exhaustive=20Intermediate=10 (incomplete search for cases)Inadequate=0 (no effort was made to search for other cases e.g. recording of only patients attending genetic or outpatient clinics)
101010
0-20Fully defined=20Not fully defined=10 (no great details of the clinical description of cases)Poor=0 (no clinical description of cases, solely the name of the disorder)10
109
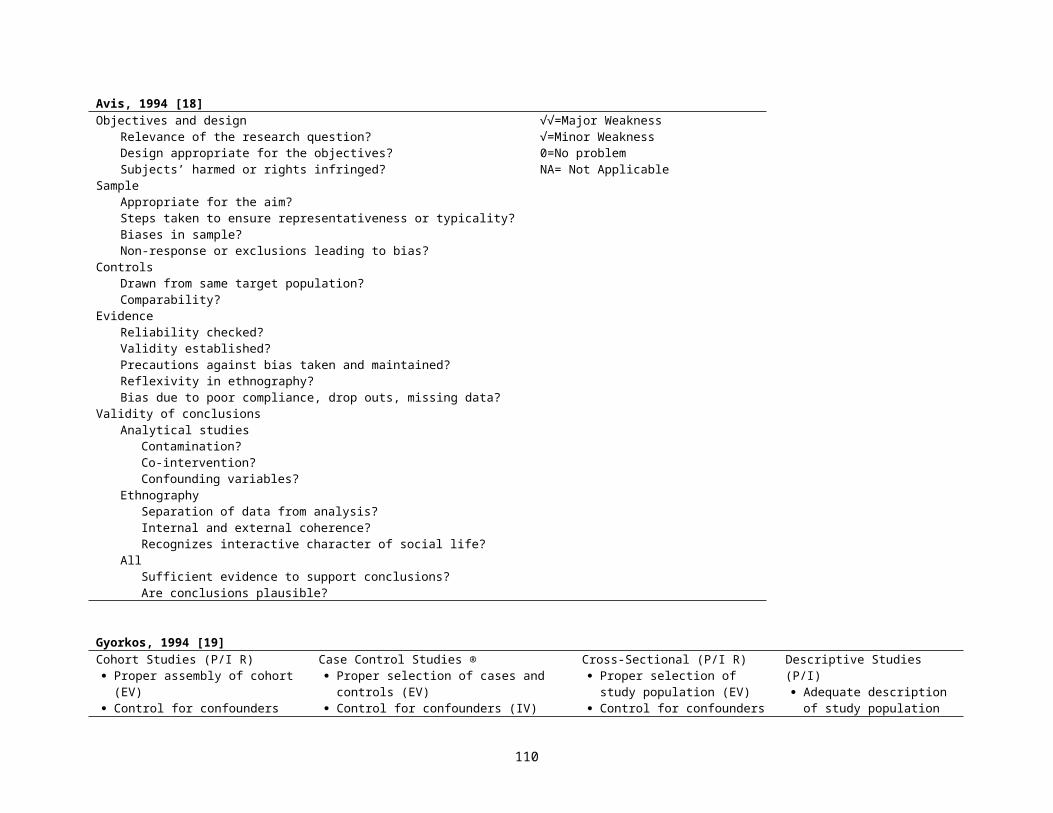
4. The year(s) of study recorded
5. The prevalence, and/or incidence rate recorded with 95% confidence interval or, age and/or sex specific, where appropriate (IV P/I)
10
10Maximum score 100
Carneiro, 2002 [59]Methodologic question in the analysis of articles on prognosisAre the results of the study valid?
Was the initial sample of patients representative? (EV P/I R) Was followup sufficiently long and complete? (IV P/I R) Were the outcome criteria objective and applied in a blinded fashion? (IV R) If different subgroups of patients were identified, was there an adjustment for the different prognostic factors, as well as prospective validation in an
independent “test group” of patients? (IV P/I R)Are the results important? (E)
How do the outcomes behave over time? (IV P/I R) How precise are the estimates of prognosis? (IV R)
What is the possibility of applying these results to my patient? Are the patients in the study similar to mine? (EV R) Can the results be used in my clinical practice? (EV R)
Elwood, 2002 [60]Application to study design1. Clear definitions required in study design (E)2. Define key outcome and document it (IV P/I R)3. Consider alternatives; justify choice? IV P/I R4. Define carefully; consider alternatives; justify choice (IV P/I R)5. Consider the interpretation of positive, negative, and neutral results (IV R)6. Consider methods to avoid bias, assess it, adjust for it; document (IV R)7. Identify potential confounders and decide on ways of controlling (IV R)8. Assess power and sample size. Consider if subgroups are important (IV R)9. When is start of exposure and of outcome? Consider latency effects. (E R)10. What strength is likely or important? (E R)11. How will dose-response be shown? (E R)12, 13. What consistencies or specificity would be useful to test or amplify the hypothesis? (E R)14. Consider response rates and how to assess representativeness (EV P/I R)15. Consider eligibility and exclusion criteria (EV P/I R)16. What groups are relevant, and will the results be applicable to them? (EV P/I R)17. What other studies are there? Can we overcome their weaknesses? evidence from studies of a similar or more powerful study design? If our results
conflict, will they be convincing? Is our study worth doing? (E) 18. Can we test any issues of specificity? 19. Can we assess or distinguish between any postulated mechanisms?20. Does this have any implications for our design?
110
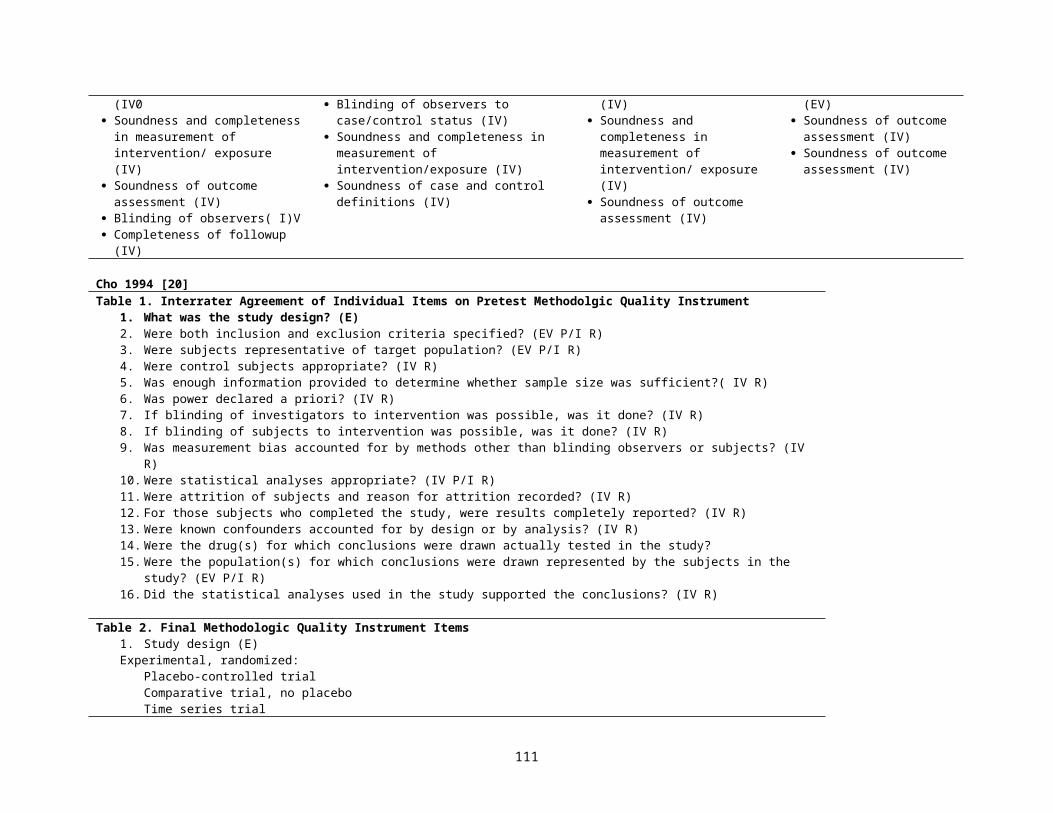
Campbell, 2002 [61]Appraisal of published associations with genetic variants: list of questions to consider in assessing validity of association (IV R)Chance
Is it clear whether reported results relate to a priori hypotheses or post hoc subgroup analyses? Is the total number of analyses (number of tests) that were carried out stated? Has an adjustment of the statistical significance level to account for multiple tests (eg), Bonneferoni or Bayes methods) been made or has interpretation of
results otherwise accounted for multiple testing? Does statistical analysis account for increased likelihood of chance association in inbred populations or, where relevant, due to cryptic relatedness in
apparently outbred populations? Where no statistically significant association was found, was the sample size large enough for adequate (eg, 80%) power to detect important/plausible effect
sizes? Bias
Were the genotype frequencies reported in the control specimens in Hardy–Weinberg equilibrium? If this was not the case, were the reasons for this explored? Could this signal the presence of bias or study artefacts?
Are the procedures for the ascertainment of cases and controls carefully described; could they have resulted in bias that could explain the results? Is the control group drawn from the same population as the cases? If ‘convenience’ controls were used (such as blood donors) is information presented on the degree to which they are representative of the population from
which the cases are drawn? Could these differences explain the results? If published control allele frequencies were used to give control data, was their appropriateness in this study population reviewed critically? Would adoption of
alternative allele frequencies alter the results? Are participation rates in cases and controls stated? If substantially different could this explain the results? Are there sufficient details of the study procedures (handling and storage of blood and DNA specimens or analysis; genotyping methods; other measurement
methods) for both case and control specimens? Were the methods valid and consistently applied? Were there any systematic differences in procedures between cases and controls? Could any differences have accounted for the results?
Confounding Were attempts made to limit any effects of confounding factors such as population stratification by
– Restriction of the study population (eg, use of family-based control approaches)– Matching on reported ethnicity or adjustment for factors in a stratified or multivariate analysis (eg, genomic control methods)
Manchikanti, 2002 [62]Observational Studies(Five Key Domains)Study QuestionStudy population (EV P/I R)Comparability of subjects (IV R)Exposure or intervention (IV R)Outcome measurement (IV P/I R)Statistical analysis (IV R)ResultsDiscussionFunding or sponsorship
A score of 3 or more to meet criteria was required.For a study to be included it had to meet 3 of 5 criteria.
111
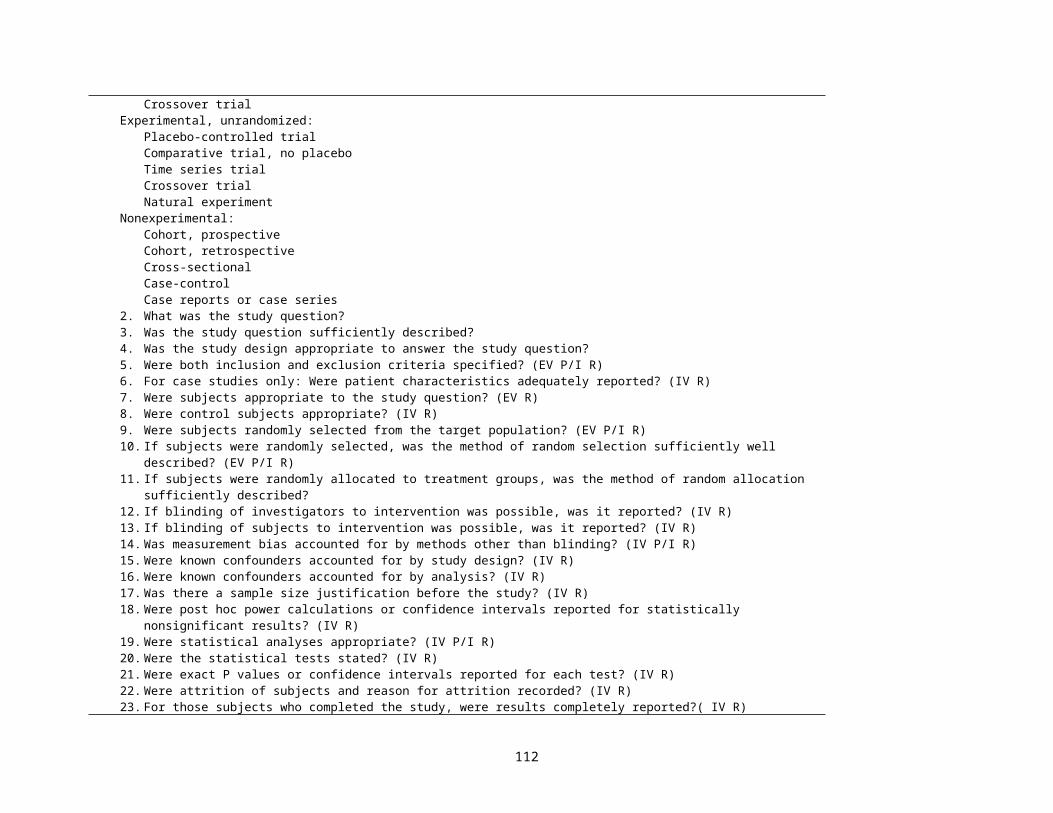
Slim, 2003 [63]Table 2The revised and validated version of MINORSMethodological items for non-randomized studies 1. A clearly stated aim
the question addressed should be precise and relevant in the light of available literature2. Inclusion of consecutive patients (EV P/I R)
all patients potentially fit for inclusion (satisfying the criteria for inclusion) have been included in the study during the study period (no exclusion or details about the reasons for exclusion)
3. Prospective collection of data:data were collected according to a protocol established before the beginning of the study
4. Endpoints appropriate to the aim of the study (IV R)unambiguous explanation of the criteria used to evaluate the main outcome which should be in accordance with the question addressed by the study. Also, the endpoints should be assessed on an intention-to-treat basis.
5. Unbiased assessment of the study endpoint (IV P/I R)blind evaluation of objective endpoints and double-blind evaluation of subjective endpoints. Otherwise the reasons for not blinding should be stated
6. Follow-up period appropriate to the aim of the study (IV P/I R)the follow-up should be sufficiently long to allow the assessment of the main endpoint and possible adverse events
7. Loss to follow up less than 5% (IV P/I R)all patients should be included in the follow up. Otherwise, the proportion lost to follow up should not exceed the proportion experiencing the major endpoint
8. Prospective calculation of the study size (IV R)information of the size of detectable difference of interest with a calculation of 95% confidence interval, according to the expected incidence of the outcome event, and information about the level for statistical significance and estimates of power when comparing the outcomes
Additional criteria in the case of comparative study9. An adequate control group (IV R)
having a gold standard diagnostic test or therapeutic intervention recognized as the optimal intervention according to the available published data
10. Contemporary groups (IV R)control and studied group should be managed during the same time period (no historical comparison)
11. Baseline equivalence of groups (IV R)the groups should be similar regarding the criteria other than the studied endpoints. Absence of confounding factors that could bias the interpretation of the results
12. Adequate statistical analyses (IV R)whether the statistics were in accordance with the type of study with calculation of confidence intervals or relative risk
0 (not reported), 1 (reported but inadequate) or 2 (reported and adequate) global ideal score being 16 for non comparative studies and 24 for comparative studies.
112
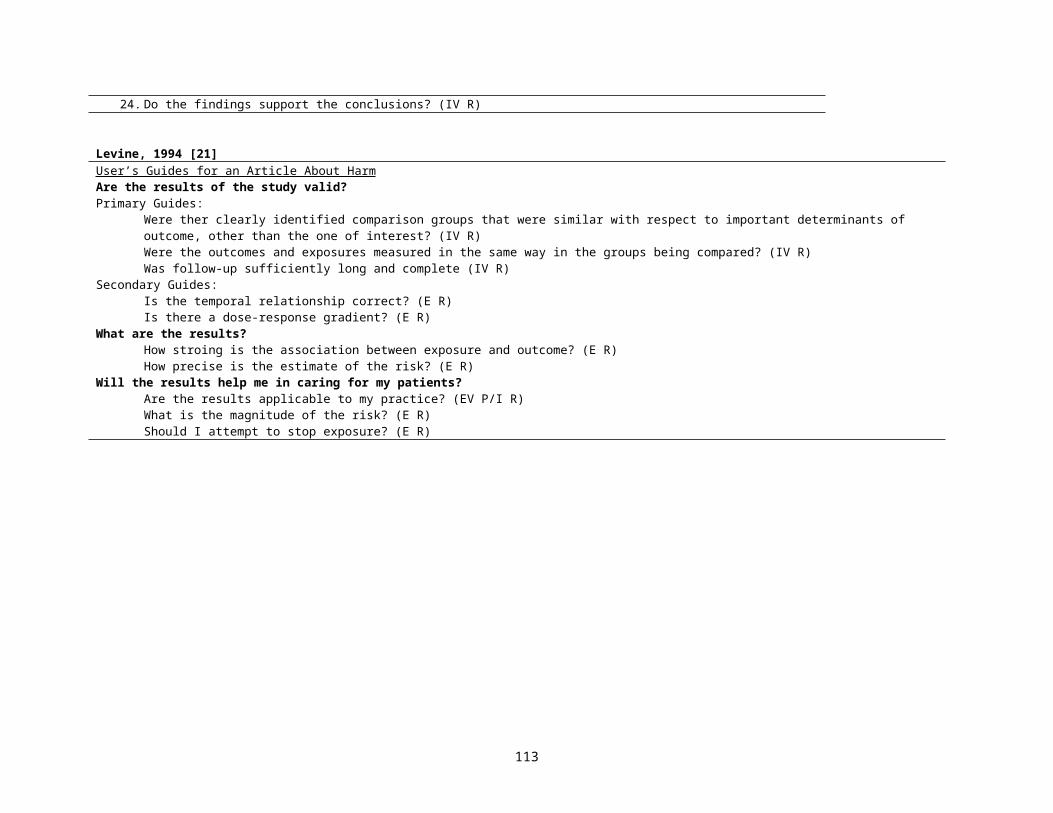
Scholten-Peeters, 2003 [64]Table 1Criteria list for the methodological assessment of studies on prognostic factors in patients with WADCriteria ScoreStudy population (EV P/I R)A. Inception cohort B. Description of source population C. Description of relevant inclusion and exclusion criteria Follow-up (IV P/I R)D. Follow-up at least 12 months E. Drop-outs/loss to follow-up < 20% F. Information completers versus loss to follow-up/drop-outs G. Prospective data collection TreatmentH. Treatment in cohort is fully described/standardized Prognostic factors (IV R)I. Clinically relevant potential prognostic factors J. Standardized or valid measurements K. Data presentation of most important prognostic factors Outcome (IV P/I R)L. Clinically relevant outcome measures M. Standardized or valid measurements N. Data presentation of most important outcome measures Analysis (IV R)O. Appropriate univariate crude estimates P. Appropriate multivariate analysis techniques
+, positive (design or conduct adequate); -, negative (design or conduct inadequate); ?, unclear (item insufficiently described)
+/-/?+/-/?+/-/?
+/-/?+/-/?+/-/?+/-/?
+/-/?
+/-/?+/-/?+/-/?
+/-/?+/-/?+/-/?
+/-/?+/-/?
(yes/no/don’t know)
113
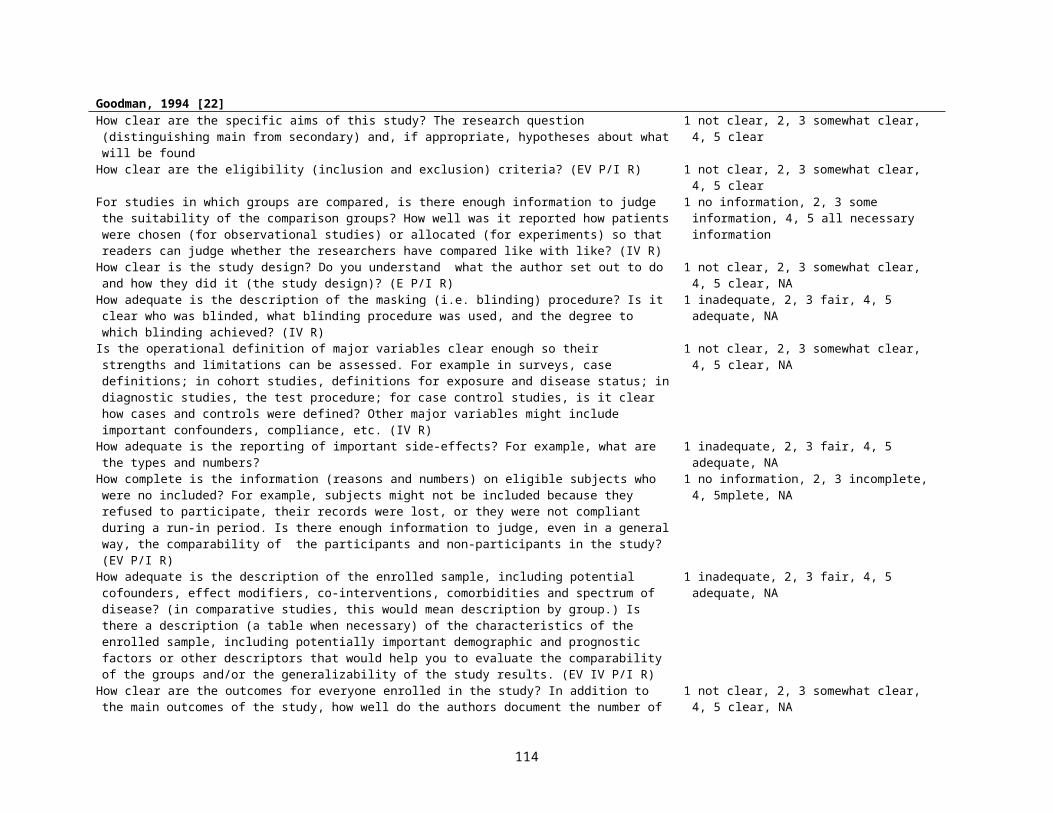
Rangel, 2003 [65]Quality Assessment Subscale Designed to Measure the Potential Clinical Relevance of a Retrospective StudySubscale 1: Potential Clinical RelevanceAuthors stated reason for publishing the report. (select one from the choices below)To simply report their experience. (No specific reason stated) To report their study as one of the first published reports of a novel technique or approach. To report their study as one of the longest follow-up experiences with a clinical problem. To report their study as one the largest experiences with a clinical problem. To report their experience in a novel cohort (or sub-cohort) of patients. To report their experience in addressing a specific side-effect, complication, or outcome. To report their experience in the context of a better comparison method than previously available. Any 2 of the above criteria. (not including simply reporting the experience) Any 3 or more of the above criteria. (not including simply reporting the experience) Total possible points for section
Points055555571010
Quality Assessment Subscale Designed to Measure the Methodology Used in Retrospective Clinical Reporting Subscale II: Quality of Study MethodologyDescription and definition of participating surgeons/institutions:Can the number of participating centers be determined? Can the practice type of participating centers be determined? Can the number of surgeons who participated in the study be determined? Can the reader determine where the authors are on the learning curve for the reported procedure? Is the timeline when all cases were performed clearly stated? Description and definition of cases (EV R)Was the patient population from which the cases were selected from adequately described? EV RAre diagnostic criteria used to identify cases clearly described when the clinical diagnosis is not obvious? IV RAre selection and/or exclusion criteria for cases clearly stated? (EV R)Is the diagnostic method clearly described for assessing outcome(s) of interest? (Select one below) (IV R)No. Yes, but uses only subjective evidence to assess outcomes when objective means are more appropriate. Yes, and uses objective evidence to assess outcomes. Description of the intervention:Is the surgical technique adequately described? (IV R)Is there any mention of an attempt to standardize operative technique? (IV R)Is there any mention of an attempt to standardize perioperative care? (IV R)Reporting methods-experimental group:Is the age mean and range given for all patients in the series? (IV R)Are outcome variables presented with appropriate statistical ranges (SD’s, SEM’s, etc.)? (IV R)Do the authors address whether there is any missing data? (IV R)Is the number and nature of complications addressed? Reporting methods-comparison groups. (If no comparison groups is used, skip the next three sections)Is the age mean and range given for patients in each group? (IV R)Were patients in each group treated along similar timelines? (IV R)Are actual numbers furnished along with %’s for ALL demographic variables? (IV P/I R)Are outcome variables presented with appropriate statistical ranges for each group (SD’s, SEM’s, etc.)?
Points11111
111
012
111
1111
11111
114
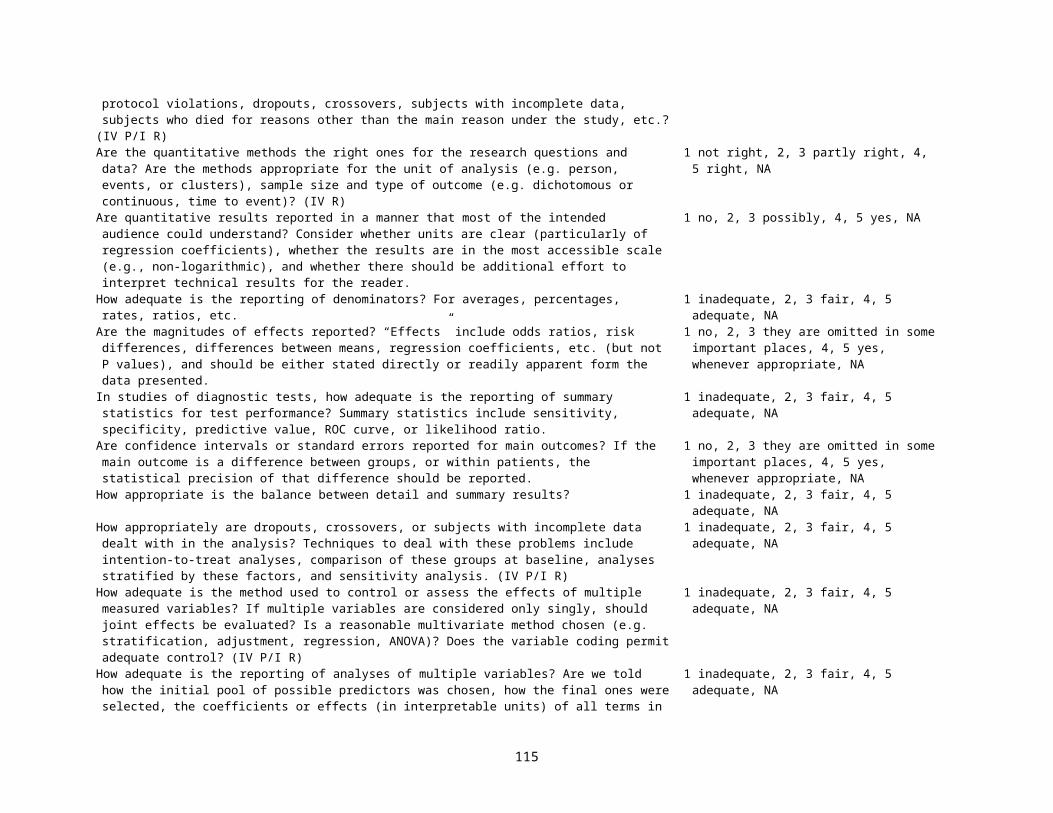
Do the authors describe how patients were chosen into each treatment group? (IV R)Use of a comparison group. (Select one choice below) (IV R)A comparison group is used but no type 1 error measurement is generated for primary outcome variables. A comparison group is used and type I error measurement are generated but exact values are not provided. A comparison group is used and exact type I error measurements are provided for all results. (Note: VERY significant, although not precisely reported, p values less than 0.01 are acceptable.)Blinding of evaluators (IV R)If comparison groups were used, was any attempt made to blind evaluators during the analysis of data? Total possible points for section
012
125
Subscale III: Quality of Discussion and Stated ConclusionsDiscussion of complications/outcomes:Are complication/adverse outcomes noted in the results section discussed in the conclusions? Do the authors offer suggestions on how to avoid complications from their own experience? Do the authors discuss complications in the context of other reports on the same technique? Do the authors discuss outcomes of interest in the context of other reported literature? Discussion of study limitations. (Choose one selection from below . . . )Authors DO NOT mention any limitations to their study design Authors mention general limitations of their study but do not discuss these in the context of their results. Authors discuss specific limitations of their study design in the context of their own results. General conclusions: (Choose one selection from below . . . )Authors suggest basing practice guidelines on their results without reservation. Authors suggest further investigation must be done (a strategy for doing so is not presented). Authors suggest further investigation must be done (and present a strategy for doing so). Authors suggest further investigation must be done and are currently involved in such a study. Total points possible for section
Points1111
012
012410
115
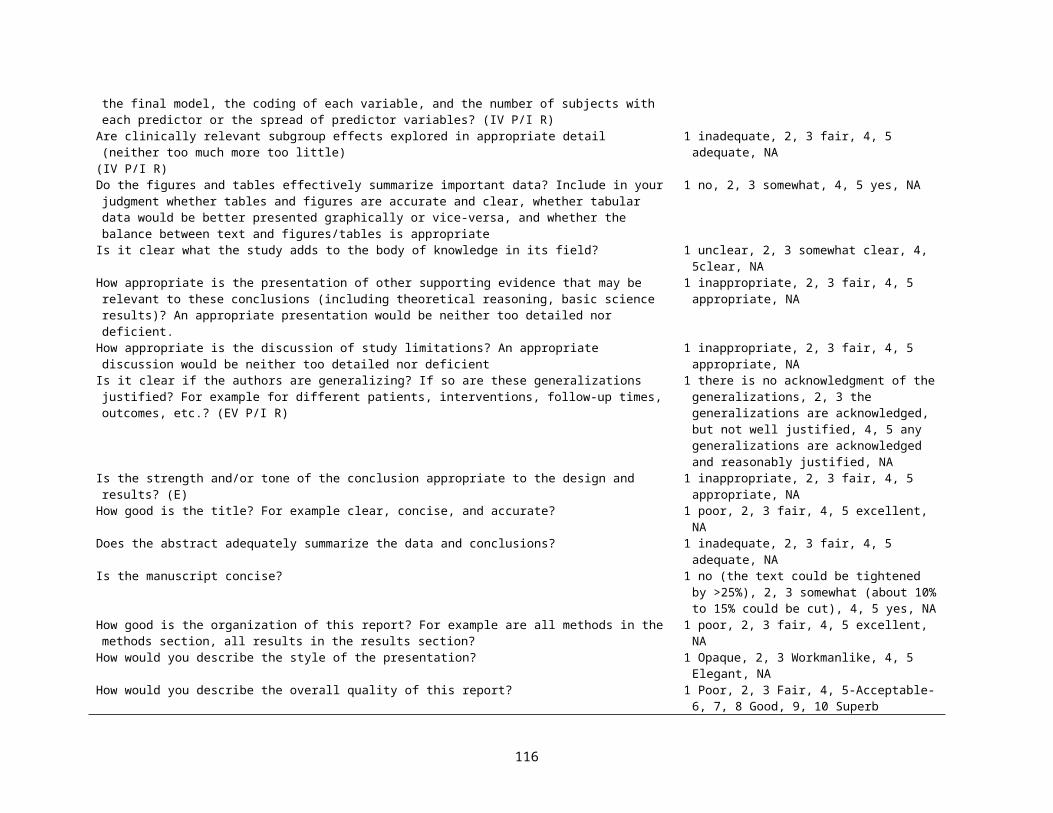
Meijer, 2003 [66]Outcome StrategiesTo evaluate internal validity Measurements reliable and valid? (IV P/I R)Dependent variable Measurements reliable and valid? (IV P/I R)Independent variable Inception cohort during observation period
(IV R)Appropriate end-points for observation? (IV P/I R)Control for dropouts? (IV P/I R)
To evaluate statistical validity Statistical validation of relationship between dependent and
independent variables? (IV R)Sample size (n) adequate in relation to the number of
determinants (K)? Control for multicollinearity? (IV R)
To evaluate external validity (EV P/I R)Specification of relevant patient characteristics? (i.e., age, type,
number and localization of stroke). Description of additional medical and paramedical interventions during observation?
Cross-validation of the prediction model in a second independent group?
Criteria
Positive, if the prognostic study tested the reliability and validity of measurements used or referred to other studies which had established reliability and validity
Positive, if observation started within 2 weeks after stroke Positive, if observation ended a minimal of 6 months after stroke Positive, if drop-outs during period of observation are specified
Positive, if relationship between dependent and independent variable is tested for statistical significance
Positive, if ratio n : K exceeds 10 : 1 Positive, if relationship between two or more independent variables
is tested in the prediction model
Positive, if age, type, localization as well as number of strokes are specified in the cohort.
Positive, if information on medical and paramedical treatment was reported
Positive, if the prediction model is validated in a second independent group of stroke patients
Criteria in Table 2
A +=1;-- = 0
B +=1;-- = 0
C +=1;-- = 0D +=1;-- = 0E +=1;-- = 0
F +=1;-- = 0
G +=1;-- = 0H +=1;-- = 0
I +=1;-- = 0
J +=1;-- = 0
K +=1;-- = 0
Maximum Score 11
Centre for Evidence Based Mental Health (Oxford England) [67]What question (PICO) did the systematic review address?F-Is it unlikely that important, relevant studies were missed?A-Were the criteria used to select articles for inclusion appropriate?A-Were the included studies sufficiently valid for the type of question asked? E IVT-Were the results similar from study to study? E
Yes, No, UnclearYes, No, UnclearYes, No, UnclearYes, No, UnclearYes, No, Unclear
116

"London Principles" [68]a. Were the objectives of the study defined and stated? b. Are the data relevant for risk assessment? c. Was the study designed to have sufficient power to detect the effect(s) of interest? (IV R)d. Were good epidemiological practices followed?e. Can the study findings be generalized for statutory regulations? (EV R)f. Were the principles enumerated below followed?
Principle A-1a. Were study subjects representative of exposed and unexposed persons (cohort study), or of diseased and non-
diseased persons (case-control study)? (EV R)b. To minimize bias, were exposed and unexposed persons comparable "at baseline" (cohort study), or were cases
similar to controls, prior to exposure, with respect to major risk factors for the disease or condition under study? (IV R)
Principle A-2a. To minimize the potential for bias, were interviewers and data collectors blind to the case/control status of study
subjects and to the hypothesis being tested? (IV R)b. Were there procedures for quality control in place for all major aspects of the study's design and implementation
(e.g., ascertainment and selection of subjects for study, methods of data collection and analysis, follow-up, etc). (IV R)
c. Were the effects of nonparticipation, a low response rate, or loss to follow-up taken into account in producing the study results? (IV P/I R)a. Were well-documented procedures for quality assurance and quality control followed in exposure measurement and assessment (e.g. calibrating instruments, repeat measurements, re-interviews, tape recordings of interviews, etc.) (IV P/I R)
b. Were measures of exposure consistent with current biological understanding of dose (e.g., with respect to averaging time, dose rate, peak dose, absorption via different exposure routes)? (IV R)
c. If there is uncertainty about appropriate exposure measures, was a variety of measures used (e.g., duration of exposure, intensity of exposure, latency)? (IV R)
d. If surrogate respondents were the source of information about exposure, was the proportion of the data they provided given, and were their relationships to the index subjects described? (IV R)
e. To improve study power and enhance the generalizability of findings, was there sufficient variation in the exposure among subjects? (IV R)
f. Were correlated exposures measured and evaluated to assess the possibility of competing causes, confounding, and potentiating effects (synergy)? (IV R)
g. Were exposures measured directly rather than estimated? If estimated, have the systematic and random errors been characterized, either in the study at hand or by reference to the literature? (IV R)
h. Were measurements of exposure or human biochemical samples of exposure made? Was there a distinction made between exposures estimated by emission as opposed to body absorption? (IV R)
i. If exposure was estimated by questionnaire, interview, or existing records, was reporting bias considered, and was it unlikely to have affected the study outcome? (IV R)
j. Was there an explanation/understanding of why exposure occurred, the context of its occurrence, and the time period of exposure? (IV R)
Principle A-4a. Was the outcome variable a disease entity or pathological finding rather than a symptom or a physiological
parameter? (IV R)b. Was variability in the possible outcomes understood and taken into account -- e.g., various manifestations of a
Yes, No, Not Known, Not ApplicableYes, No, Not Known, Not ApplicableYes, No, Not Known, Not ApplicableYes, No, Not Known, Not ApplicableYes, No, Not Known, Not ApplicableYes, No, Not Known, Not Applicable
Yes, No, Not Known, Not Applicable
Yes, No, Not Known, Not Applicable
Yes, No, Not Known, Not Applicable
Yes, No, Not Known, Not Applicable
Yes, No, Not Known, Not Applicable
Yes, No, Not Known, Not Applicable
Yes, No, Not Known, Not Applicable
Yes, No, Not Known, Not Applicable
Yes, No, Not Known, Not Applicable
Yes, No, Not Known, Not Applicable
Yes, No, Not Known, Not Applicable
Yes, No, Not Known, Not Applicable
Yes, No, Not Known, Not Applicable
Yes, No, Not Known, Not Applicable
Yes, No, Not Known, Not Applicable
Yes, No, Not Known, Not Applicable
117
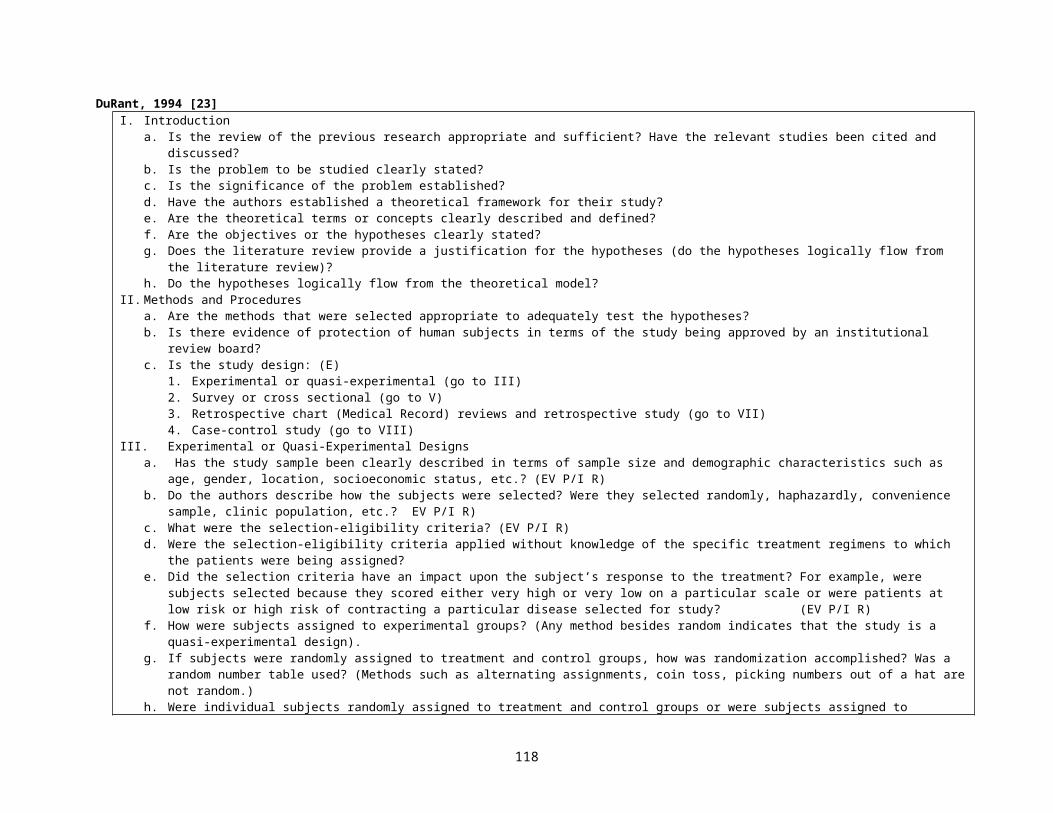
disease considering its natural history? (IV R)c. Was the method of recording the outcome variable(s) reliable -- e.g., if the outcome was disease, did the design
of the study provide for recording of the full spectrum of disease, such as early and advanced stage cancer; was a standardized classification system, such as the International Classification of Diseases, followed; were the data from a primary or a secondary source? (IV P/I R)
d. Has misclassification of the outcome(s) been minimized in the design and execution of the study? Has there been a review of all diagnoses by qualified medical personnel, and if so, were they blinded to study exposure? (IV P/I R)
Principle A-5a. Was there a well-formulated and well-documented plan of analysis? If so, was it followed?b. Were the methods of analysis appropriate? If not, is it reasonable to believe that better methods would not have
led to substantially different results? (IV R)c. Were proper analytic approaches, such as stratification and regression adjustment, used to account for well-
known major risk factors (potential confounders such as age, race, smoking, socio-economic status) for the disease under study? (IV R)
d. Has a sensitivity analysis been performed in which quantitative adjustment was made for the effect of unmeasured potential confounders, e.g., any unmeasured, well-established risk factor(s) for the disease under study? (IV R)
e. Did the report avoid selective reporting of results or inappropriate use of methods to achieve a stated or implicit objective? For example, are both significant and non-significant results reported in a balanced fashion? (IV R)
f. Were confidence intervals provided in the main and subsidiary analyses? (IV P/I R)Principle A-6
a. Were the major results directly related to the a priori hypothesis under investigation?b. Were the strengths and limitations of the study design, execution, and the resulting data adequately discussed?c. Is loss to follow-up and non-response documented? Was it minimal? Has any major loss to follow-up or migration
out of study been taken into account? (IV P/I R)d. Did the study's design and analysis account for competing causes of mortality or morbidity which might influence
its findings? (IV R)e. Were contradictory or implausible results satisfactorily explained?f. Were alternative explanations for the results seriously explored and discussed?g. Were the Bradford Hill criteria (see Appendix B) for judging the plausibility of causation (strength of association,
consistency within and across studies, dose response, biological plausibility, and temporality) applied when interpreting the results? (E R)
h. What are the public health implications of the results? For example, are estimates of absolute risk given, and is the size of the population at risk discussed?
Yes, No, Not Known, Not Applicable
Yes, No, Not Known, Not Applicable
Yes, No, Not Known, Not Applicable
Yes, No, Not Known, Not ApplicableYes, No, Not Known, Not Applicable
Yes, No, Not Known, Not Applicable
Yes, No, Not Known, Not Applicable
Yes, No, Not Known, Not Applicable
Yes, No, Not Known, Not Applicable
Yes, No, Not Known, Not ApplicableYes, No, Not Known, Not ApplicableYes, No, Not Known, Not Applicable
Yes, No, Not Known, Not Applicable
Yes, No, Not Known, Not ApplicableYes, No, Not Known, Not ApplicableYes, No, Not Known, Not Applicable
Yes, No, Not Known, Not Applicable
118
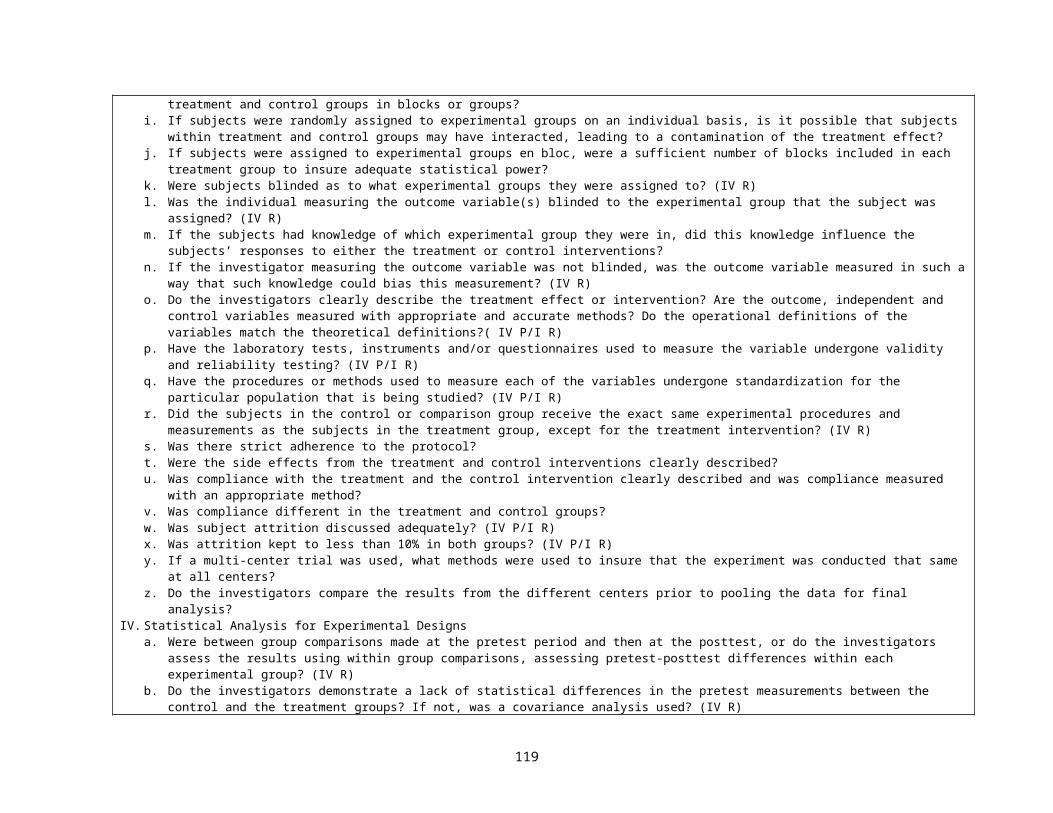
Ottawa Health Research Institute, Newcastle-Ottawa scale [70]Note: A study can be awarded a maximum of one star for each numbered item within the Selection and Exposure categories. A maximum of two stars can be given for Comparability.
Selection1) Is the case definition adequate?
2) Representativeness of the cases
3) Selection of Controls
4) Definition of Controls
Comparability1) Comparability of cases and controls on the basis of the design or analysis
Exposure1) Ascertainment of exposure
2) Same method of ascertainment for cases and controls
3) Non-response rate
Selection1) Representativeness of the exposed cohort
a) yes, with independent validation *b) yes, eg record linkage or based on self reportsc) no description
a) consecutive or obviously representative series of cases *b) potential for selection biases or not stated
a) community controls *b) hospital controlsc) no description
a) no history of disease (endpoint) *b) no description of source
a) study controls for _______________ (Select the most important factor.) *
b) study controls for any additional factor * (This criteria could be modified to indicate specific control for a second important factor.)
a) secure record (eg surgical records) *b) structured interview where blind to case/control status *c) interview not blinded to case/control statusd) written self report or medical record onlye) no description
a) yes *b) no
a) same rate for both groups *b) non respondents describedc) rate different and no designation
a) truly representative of the average _______________ (describe) in the community *
b) somewhat representative of the average ______________ in the community *
c) selected group of users eg nurses, volunteers
119
2) Selection of the non exposed cohort
3) Ascertainment of exposure
4) Demonstration that outcome of interest was not present at start of study
Comparability1) Comparability of cohorts on the basis of the design or analysis
Outcome1) Assessment of outcome
2) Was follow-up long enough for outcomes to occur
3) Adequacy of follow up of cohorts
d) no description of the derivation of the cohort
a) drawn from the same community as the exposed cohort *b) drawn from a different sourcec) no description of the derivation of the non exposed cohort
a) secure record (eg surgical records) *b) structured interview *c) written self reportd) no description
a) yes *b) no
a) study controls for _____________ (select the most important factor) *
b) study controls for any additional factor* (This criteria could be modified to indicate specific control for a second important factor.)
a) independent blind assessment *b) record linkage *c) self reportd) no description
a) yes (select an adequate follow up period for outcome of interest)*b) no
a) complete follow up - all subjects accounted for *b) subjects lost to follow up unlikely to introduce bias - small number
lost - > ____ % (select an adequate %) follow up, or description provided of those lost) *
c) follow up rate < ____% (select an adequate %) and no description of those lost
d) no statement
120
Woodbury, 2004 [71]A. Are the study methods valid? (IV P/I R) Each question is scores 0(no) or 1 (yes) to yield a methodological score 0-9
1. Is the sample random or the whole population surveyed? (EV P/I R)2. Is the study design prospective? Is s physical examination performed? 3. Is the sample size adequate? (IV R) 4. Are objective, suitable, standard methods used for measurement of
pressure ulcers? (IV P/I R)5. Is the outcomes measured in unbiased fashion? (IV P/I R)6. Is the response rate adequate? Are the refusers described? EV P/I R
B. What the interpretation of the results?7. Are the estimates of prevalence given with confidence intervals? (IV P/I)8. Are the estimates of prevalence given in detail by subgroups? (IV P/I)
C. What the applicability of the results? (EV P/I R)9. Are the study subjects and the settings described in detail and similar to
those of interest to you? (EV P/I R)
Tooth, 2005 [72]Criterion Definition1. Are the objectives or hypotheses of the study stated? 2. Is the target population defined? (EV P/I R)3. Is the sampling frame defined? (IV R)4. Is the study population defined? (EV P/I R)5. Are the study setting (venues) and/or geographic location stated? (EV P/I R)6. Are the dates between which the study was conducted stated or implicit? 7. Are eligibility criteria stated? (EV P/I R)8. Are issues of “selection in” to the study mentioned?† (EV P/I R)9. Is the number of participants justified? (IV R)10. Are numbers meeting and not meeting the eligibility criteria stated? (EV P/I R)11. For those not eligible, are the reasons why stated? (EV P/I R)12. Are the numbers of people who did/did not consent to participate stated? 13. Are the reasons that people refused to consent stated?14. Were consenters compared with nonconsenters?15. Was the number of participants at the beginning of the study stated?16. Were methods of data collection stated? (IV P/I R)17. Was the reliability (repeatability) of measurement methods mentioned? (IV P/I R)18. Was the validity (against a “gold standard”) of measurement methods mentioned? (IV P/I R)19. Were any confounders mentioned? (IV R)20. Was the number of participants at each stage/wave specified? (IV P/I R)21. Were reasons for loss to follow-up quantified? (IV P/I R)22. Was the missingness of data items at each wave mentioned? (IV R)23. Was the type of analyses conducted stated? (IV R)24. Were “longitudinal” analysis methods stated? (IV P/I R) 25. Were absolute effect sizes reported? (IV P/I R)26. Were relative effect sizes reported? (IV P/I R)
121
27. Was loss to follow-up taken into account in the analysis? (IV P/I R)28. Were confounders accounted for in analyses? (IV R)29. Were missing data accounted for in the analyses? (IV P/I R)30. Was the impact of biases assessed qualitatively? (IV P/I R)31. Was the impact of biases estimated quantitatively? (IV P/I R)32. Did authors relate results back to a target population (EV P/I R)33. Was there any other discussion of generalizability? (EV P/I R)*Sources for definitions: Rothman and Greenland (35), Last (37), Twisk (41).†Represents selection bias at the beginning of a study. Other selection biases (i.e., loss to followup, missing data items) are dealt with by other checklist criteria
Moja, 2005 [73]reviews published in paper journalsFormal:
Exclusion criteria Exploration of heterogeneitySubgroup analysisSensitivity analysisWeighting of estimatesCumulative meta-analysis
VariableQuality components:Allocation concealmentAny type of blinding IV RGeneration of allocation sequenceSimilarity of groups at baseline IV RDescription of outcomes IV P/I RIntention to treat analysisSample size IV RLosses to follow-up IV P/I RQuality scale:SchulzJadadCochrane Group
122
Pavia, 2006 [74]Case-control studiesCases either randomly selected or selected to include all cases in a specific population (EV R)Cases identified without knowledge of exposure status (IV R)Response rate for identified cases >75% (EV P/I R)Control drawn randomly from the same population of cases (IV R)No known association between control status and exposure (IV R)Response rate for identified controls >75% (IV R)Cohort studiesInitial response rate >75% (IV P/I R)Comparison of persons who did and did not participate (EV P/I R)Follow-up rate >75% (IV P/I R)Comparison of who were and were not lost to follow-up (IV R)Exposed or nonexposed subjects identified without knowledge of disease status (IV R)No known association between nonexposed status and disease (IV R)All studiesAdjustment or matching for confounders (IV R)Age SexRaceCounty of residenceSocioeconomic status or educationAlcohol useLevel of alcohol consumptionType of alcohol consumptionTobacco useSmokingFrequency of smokingDuration of smokingChewing habitsDental status, oral hygieneOccupationInfectious disease, sexual practiceTea, coffee, mateMisclassification bias (IV P/I R)Exposure assessment made blindly with respect to the case-control status of subjects (IV R)Exposure evaluations made in relation to the time of diagnosis (IV R)Method of determining the exposure (IV R)Specific disease criteria givenDisease validated by histology or other gold standardData analysis (IV P/I R)Demographic data listed (EV IV P/I R)Statistical analysis of demographic data (IV R)Power calculations performed (IV R)Precise P values or CIs given Test statistic specified (IV R)
the study design [selection bias;score ranging from 0 (worst) to 6 (best)], the adjustment of confounding variables (score ranging from 0 to 16, worst to best), the exposure assessment (misclassification bias; score ranging from 0 to 5, worst to best), and the data analysis (score ranging from 0 to 2.5, worst to best). Each subscore was calculated as the percentage of applicable quality criteria that were met in each study; therefore, each subscore for a study could range from 0% (none of the quality criterion was met) to 100% (all the quality criteria were met). The cumulative quality score was a weighted average of the 4 percentages.
123
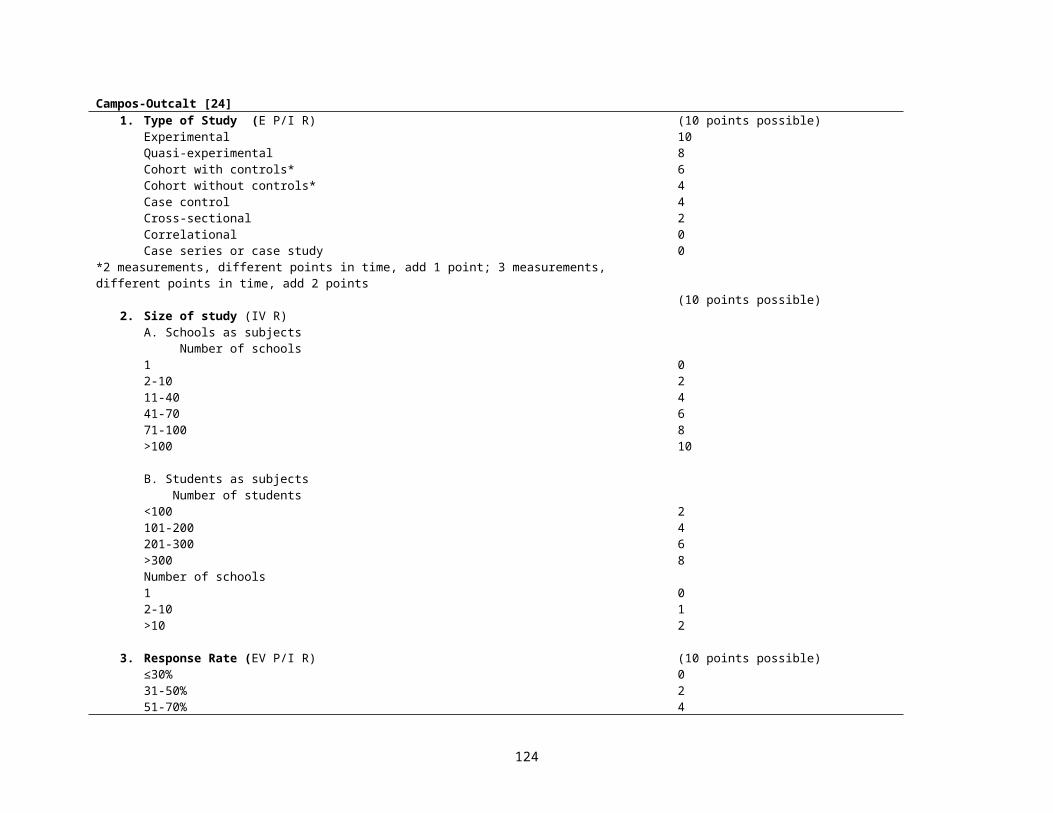
de Boer, 2006 [75]Methodologicalquality was assessed as the inclusion of a control group and extent of loss to follow-up1) the use of a control group matched on age and sex (4 points),
use of a control group without matching (2 points), or no control group (0 points); IV R
2) loss to follow-up <20% (2points), >20% loss to follow-up (1 point), or no information on loss to follow-up (0 points).
The points were added up to produce an overall methodological quality score (0–6 points). (IV P/I R)
420
210
Shea, 2006 [76]1. Were the search methods used to find evidence reported? Yes—partially—no 2. Was the search strategy for evidence reasonably comprehensive? Yes—can’ t tell—no3. Were the criteria used for deciding which studies to include in the overview reported? Yes—partially—no4. Was bias in the selection of studies avoided? Yes—can’t tell—no 5. Were criteria used for assessing validity of the included studies reported? Yes—partially—no6. Was the validity of all studies referred to in the text assessed using appropriate criteria
(either in selecting studies for inclusion or in analyzing studies that are cited)?Yes—can’t tell—no
7. Were methods used to combine the findings of relevant studies (to reach a conclusion) reported?
Yes—partially—no
8. Were findings of the relevant studies combined appropriately relative to the primary question addressed?
Yes—can’t tell—no
9. Were the conclusions made by the author (s) supported by the data and/or analysis reported in the overview?
Yes—partially—no
10. How would you rate the scientific quality of this overview? Extensive Flaws
Major Flaw
s
Minor Flaw
s
Minimal Flaws
1 2 3 4 5 6 7
124
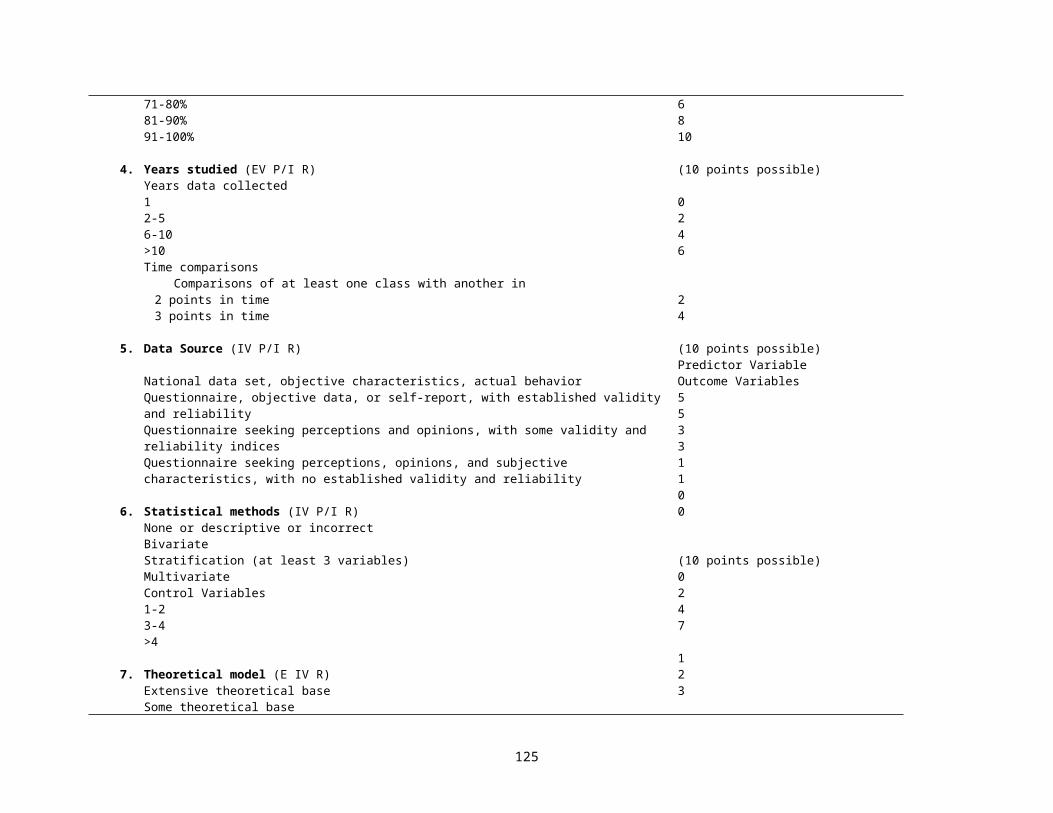
Bornhoft, 2006 [77]Table 2: Questions for assessing external validity (EV P/I R)Categories Items Study population – assessment of selection bias (related to EV)• To what extent do the inclusion and exclusion criteria (where relevant, other selection criteria) define the
"everyday or target population" of the intervention?• Does the applied diagnostic procedure reflect everyday conditions and the everyday possibilities (access,
necessity) respectively?• Are the diagnostic procedures and evaluations performed by persons with similar qualification and
experience as in everyday practice?• Does the study population reflect the everyday population in terms of:
❍ Severity of the illness❍ Duration of illness❍ Intra-individual variability❍ Age❍ Gender❍ Further socio-demographic characteristics❍ Therapy preferences and expectations❍ Symptoms of side effects of the interventions❍ Accompanying illnesses❍ Accompanying medication❍ Further prognostic or therapy relevant parameters?
• Has the structural similarity between the study and the everyday population or target population been tested?
Intervention und control –assessment of performance bias (related to EV) (IV R)• Does the preparation (medication, other medicinal products, other kind of interventions) reflect the usual
treatment?• In case of medication, does the dosage reflect the usual treatment? (Is dose modification possible?)• Does the type of administration reflect the usual treatment?• Does the intervention duration reflect the usual treatment duration?• Are the permitted accompanying treatments the usual accompanying treatments?• Does the study situation reflect the common treatment situation?• Are the interventions carried out by therapists with similar qualifications and experience as in everyday
practice?Outcome measurements, results and evaluation – assessment of detection and attrition bias (related to EV) (IV P/I R)• Are the chosen outcomes practice and patient relevant? (E.g. no surrogate parameter, are individual therapy
goals defined?)• Were the following important outcomes considered: quality of life, subjective health, patient's general
evaluations, compliance, reasons for dropout, use of accompanying treatments, rebound effect following termination of treatment (or, for example, symptom deceit)?
• Are the test procedures used in usual practice?• Are the tests and evaluations performed by persons with similar qualifications and experience as in every day
practice?
+ (+) - c.b.e.+ Matches completely/is completely fulfilled(+) Matches incompletely but sufficiently/is only partly but sufficiently fulfilled- Does not match or matches insufficiently/is insufficiently fulfilledc.b.e. Can not be evaluated
125

• Are the differences clinically relevant?• Were sufficient data collected to cover the intra-individual variability?• Do the test conditions reflect the everyday practice?• Does the dropout rate reflect everyday experience? Are the reasons for dropout registered (e.g. adverse
effects, insufficient effect), so that the significance for the everyday effectiveness can be assessed?• Is clinical relevance considered in the conclusion?Study design and Setting (related to EV) (EV P/I R)• Is the research question clinically relevant?• Does the study design ensure a high EV?• Does the study setting reflect the everyday conditions?• Are the investigators the regular contact persons (e.g. GP or relevant clinic doctor, or are they at least
comparable in terms of training, status, experience, preferences; does the number of contact people reflect the usual setting)?
• Does the doctor/therapist-patient relationship reflect the everyday conditions (e.g. frequency of contact, constant contact person)?
Table 3: Questions for assessing model validity (MV)Categories Items Study population – assessment of selection bias (related to MV) (IV P/I R)• To what extent do the inclusion and exclusion criteria and, where relevant, other selection criteria define an
optimal population with respect to the test intervention? (An optimal population will show the highest benefit from the applied intervention).
• Is the applied diagnosis and/or classification relevant for the intervention?• Are relevant subgroups considered?• Does the diagnostic procedure optimally reflect the aptitude for the intervention?• Are the diagnostic procedures performed by qualified and experienced physicians?• Does the study population reflect the ideal population in terms of:
❍ Severity of the illness❍ Duration of the illness❍ Intra-individual variability❍ Age❍ Gender❍ Further socio-demographic characteristics❍ Therapy preferences and expectations❍ Symptoms of the side effects of the interventions❍ Accompanying illnesses❍ Accompanying medication❍ Further prognostic or therapy relevant parameters? (The above listed factors can influence the
measurement of outcomes so that floor/ceiling effects may occur)• (Is the structural similarity between the study population and the ideal population for the intervention tested?
– A fairly hypothetical question)
Intervention und control – assessment of performance bias (related to MV) (IV R)• Is the investigational intervention the optimal treatment?
+ (+) - c.b.e.+ Matches completely/is completely fulfilled(+) Matches incompletely but sufficiently/is only partly but sufficiently fulfilled- Does not match or matches insufficiently/is insufficiently fulfilledc.b.e. Can not be evaluated
126
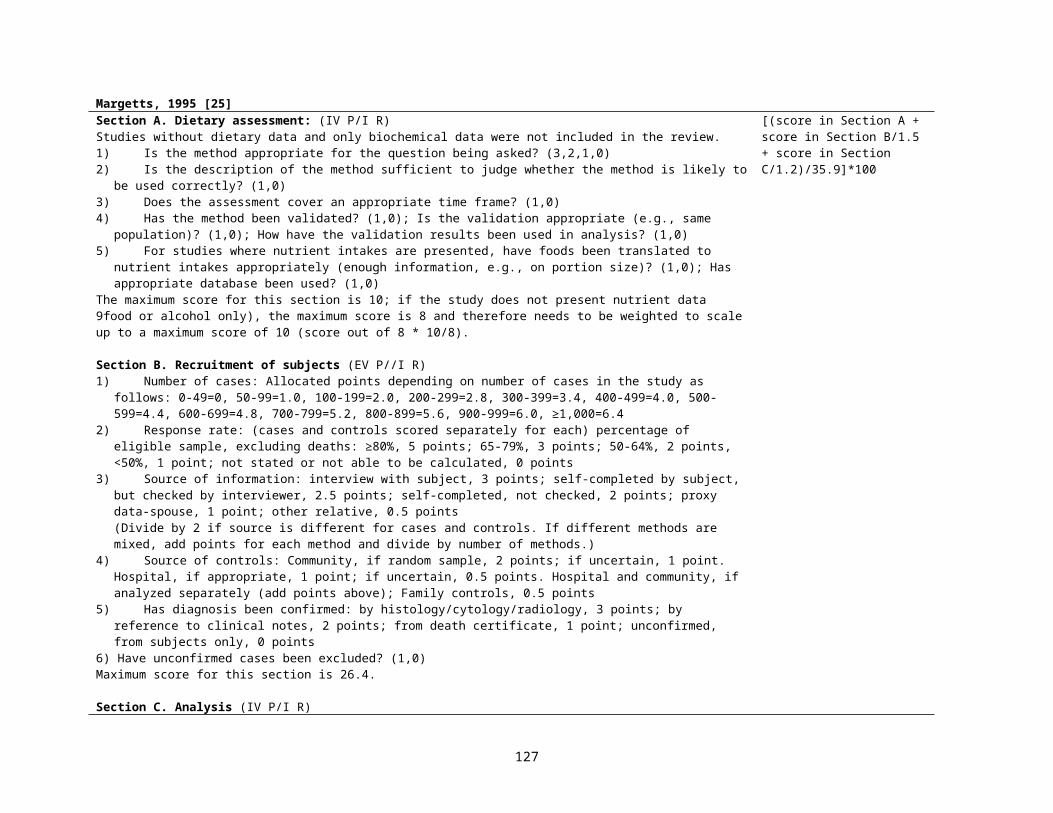
• In case of medication, is the dosage the optimal treatment?• Is the application the optimal treatment?• Is the intervention duration the optimal treatment duration? (Are there signs of marketing strategies of
pharmaceutical companies?)• Are the permitted accompanying treatments the optimal accompanying treatments?• Are the study conditions the optimal conditions for the intervention?• Are the interventions carried out by qualified and experienced therapists?Outcome measurements, results and evaluation – assessment of detection and attrition bias (related to MV) (IV P/I R)• Do the outcome parameters reflect the effects of the intervention in the best possible manner? (Also consider
here floor/ceiling effects).• Do the applied test procedures best reflect the chosen outcomes of intervention effects?• Are the test conditions appropriate to optimally evaluate the intervention efficacy?• Is the length of follow-up sufficient to detect the intervention effects (including adverse effects and rebound
effects following termination of the treatment)?• Is there an analysis carried out that considers the actually applied treatment interventions (PP analysis)?• Are tests and evaluations carried out by qualified and experienced examiners?• (Retrospectively, were optimal conditions given for the identification of the intervention efficacy?)Study design and setting (related to MV) • Does the research question reflect the optimal conditions for the intervention?• Does the study design ensure a high level of MV?• Does the study setting reflect the optimal treatment conditions?• Do the therapists/investigators have adequate experience with the intervention or the indication in question?• Do therapists/investigators and patient have a positive attitude towards the intervention?
127
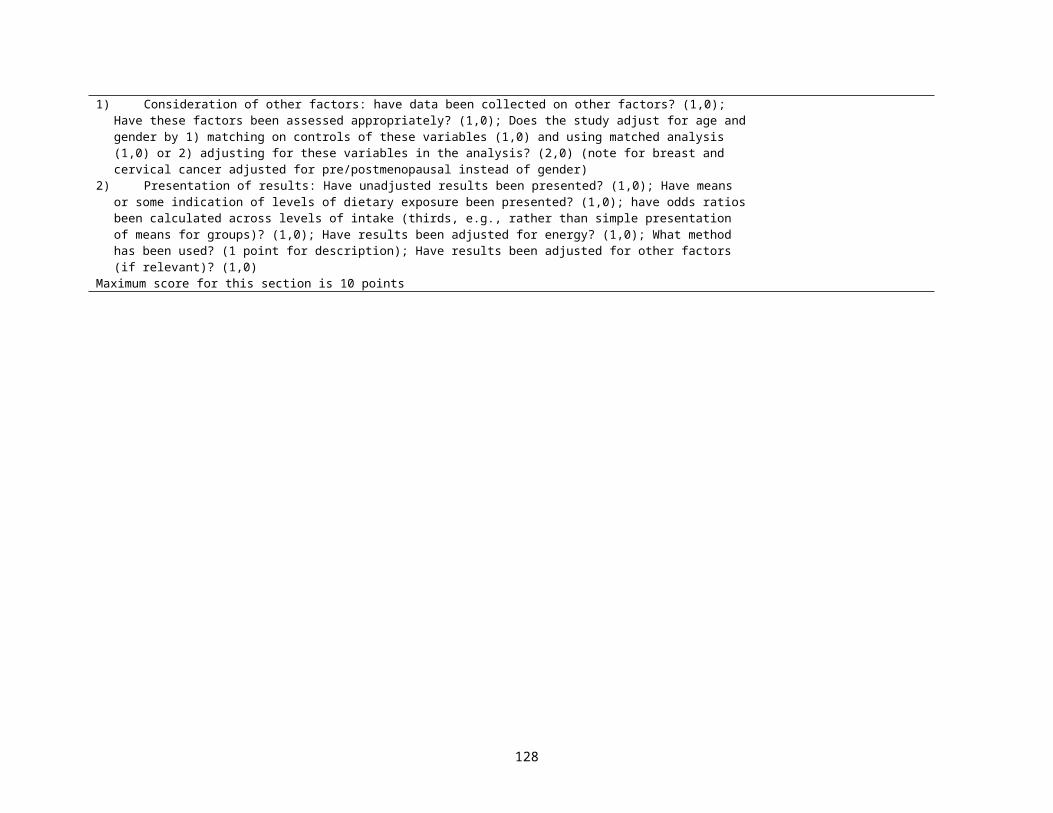
Moher, 2007 [86]Descriptive and Reporting Characteristics with Potential for Bias
Use of terms “systematic review” or ‘meta-analysis’ in title or abstractProtocol mentioned
Eligibility criteria: Eligibility criteria based on study designEligibility criteria based on publication statusEligibility based on language of report
Search: Number of databases searched, median (IQR)Number of other sources searched, median (IQR)Years of coverage were reportedSearch terms reported for one or more electronic databasesDuplicates considered
Data abstraction: One or more primary outcome(s) statedNumber of outcomes, median (IQR)Quality of primary studies assessed
Results: Review flow reportedReasons for exclusion of studies reportedGrey literature includedConsistency (i.e. heterogeneity) investigatedPublication bias assessed (or intent to assess) Significance of primary outcome if one stated
Other: Funding sources reportedFunding sources not reported
128
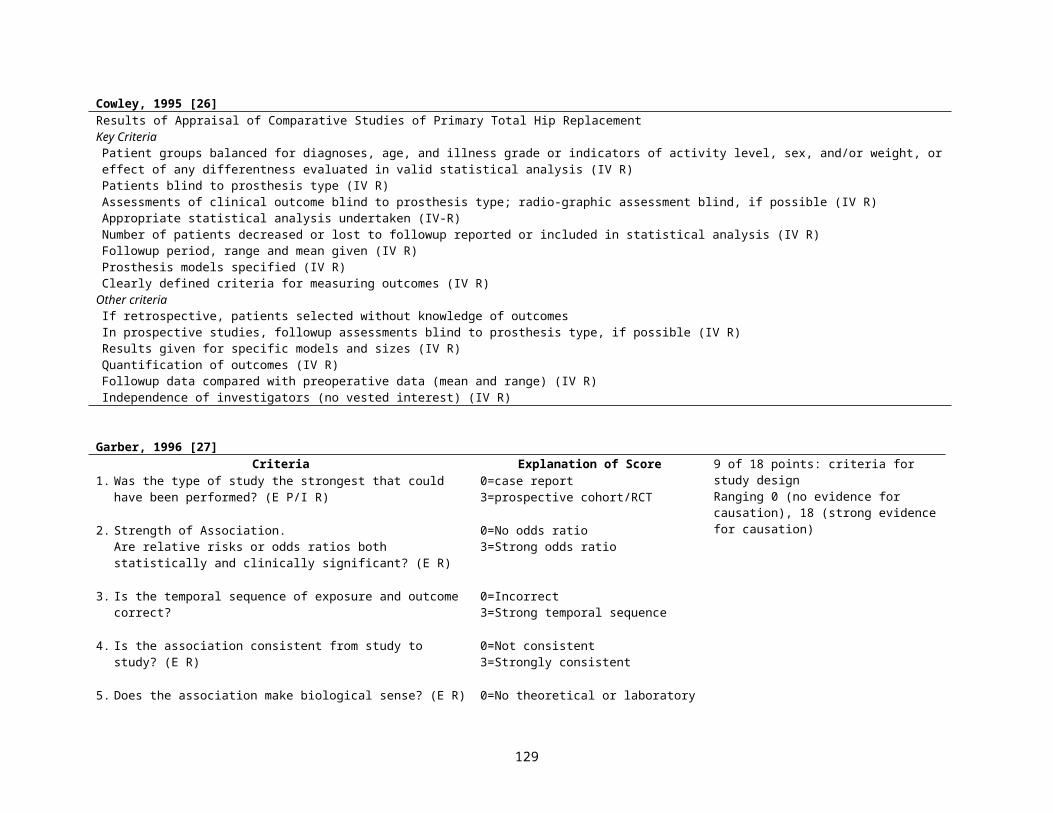
Genaidy, 2007 [79]Appendix 1 – Epidemiological appraisal instrument (EAI)1. Study Description
Hypothesis/aim/objective:1. Is the hypothesis/aim/objective of the study clearly described?Exposure (IV R)2. Are all the exposure variables/intervention(s) clearly described?Outcome (IV P/I R)3. Are the main outcomes clearly described?Study Design:4. Is the study design clearly described?Study Population:5. Is the source of subject population (including sampling frame) clearly described?6. Are the eligibility criteria for subject selection clearly described?7. Are the participation rate(s) reported? Are ascertainments of record availability described?8. Are the characteristics of study participants described?9. Have the characteristics of subjects lost after entry into the study or subjects not participating from among the eligible population
been described? Have the details of unavailable records been described?10. Have all important adverse effects been reported that may be consequences of the intervention(s)?11. Are the important covariates and confounders described in terms of individual variables?12. Are the important covariates and confounders in terms of environment variables described?Statistical Tests and Analysis Strategies IV R:13. Are the statistical methods clearly described?Results IV R :14. Are the main findings of the study clearly described?15. Does the study provide estimates of the random variability in the data for the main outcomes or exposures (i.e. confidence intervals,
standard deviations)?16. Does the study provide estimates of the statistical parameters (e.g. regression coefficients or parameter estimates such as odds
ratio)?17. Are sample size calculations performed and reported?
2. Study’s Methodological Quality2.1 Subject Selection (EV P/I R0
Group Comparability (IV R)18. is the comparison/reference group comparable to the exposed/intervention/case group?Participation Rate/ Record Availability 19. Is the participation rate adequate? Is the ascertainment of record availability adequate?Time Period20. Are the study subjects from different groups recruited over the same period of time?Subjects Losses/Unavailability of Records (IV P/I R)21. Are subject losses or unavailable records after entry into the study taken into account?Type of Cases :22. Are newly incident cases taken into account?Randomization:23. Are the study subjects randomized to groups?24. Is the randomized assignment to groups concealed from both subjects and observers until recruitment is complete and irrevocable?
YesPartialNo
129
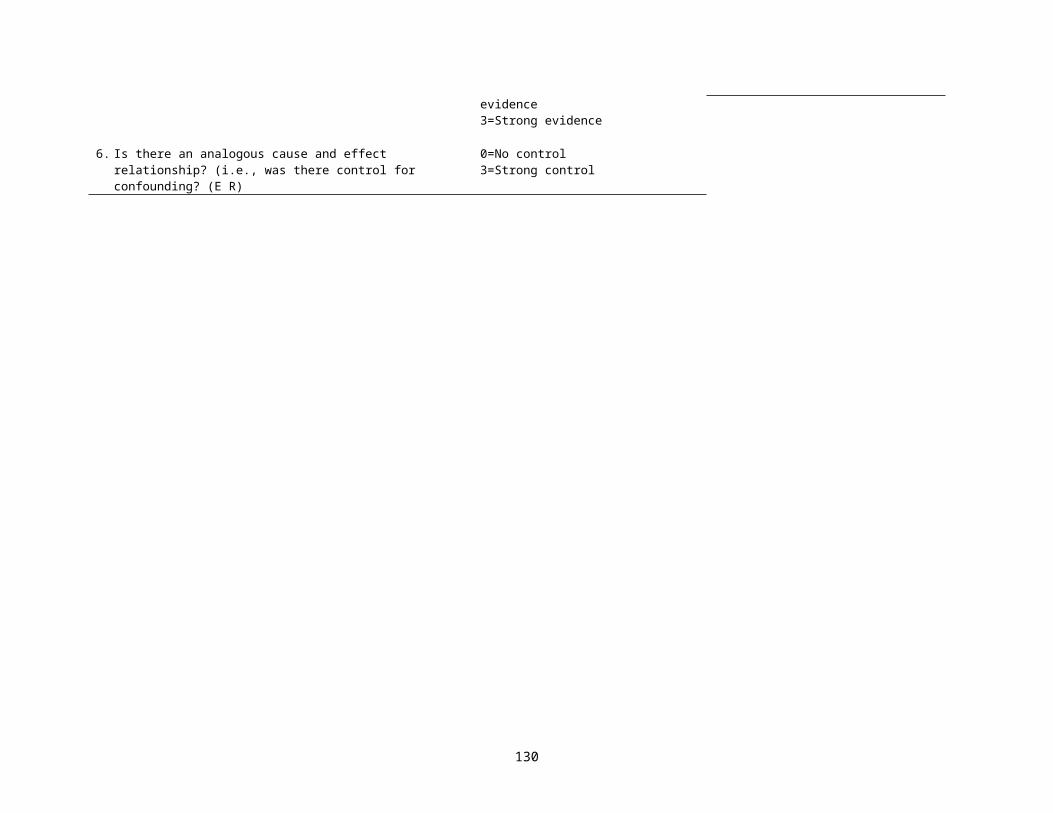
2.2. Measurement quality (IV R)Exposure:25. Are the exposure variables reliable?26. Are the exposure variables valid?27. Are the methods of assessing the exposure variables similar for each group?28. Is exposure conducted at a time prior to the occurrence of disease or symptoms?29. Are the observers blinded to: subject groupings when the exposure/intervention assessment was made or the disease status of
subjects when conducting exposure assessment?30. Are the subjects blinded to their grouping when the exposure/intervention assessment was made?Outcome IV P/I R:31. Are the main outcome measures reliable?32. Are the main outcome measures valid33. Are the methods of assessing the outcome variables standard across all groups?Observation Period:34. Are the observations taken over the same time for all groups?
2.3 Data analysisCovariates and Confounders IV R:35. Is prior history of disease and/or symptoms collected and included in the analysis?36. Is there adequate adjustment for covariates and confounders in terms of individual variables in the analyses?37. Is there adequate adjustment for covariates and confounders in terms of environment variables (other than exposure) in the
analyses?Other:38. Is the minimum followup time since initial exposure sufficient enough to detect a relationship between exposure/intervention and
outcome?39. Do the analyses adjust for different lengths of followup of subjects in cohort/intervention studies; is the time period between the
exposure and outcome the same for cases and controls?40. Are outcome data reported by levels of exposure? 41. Are the outcome/exposure data reported by subgroups of subjects?
2.4. Generalization of results42. Can the study results be applied to the eligible population?43. Can the study results be applied to other relevant populations?
130
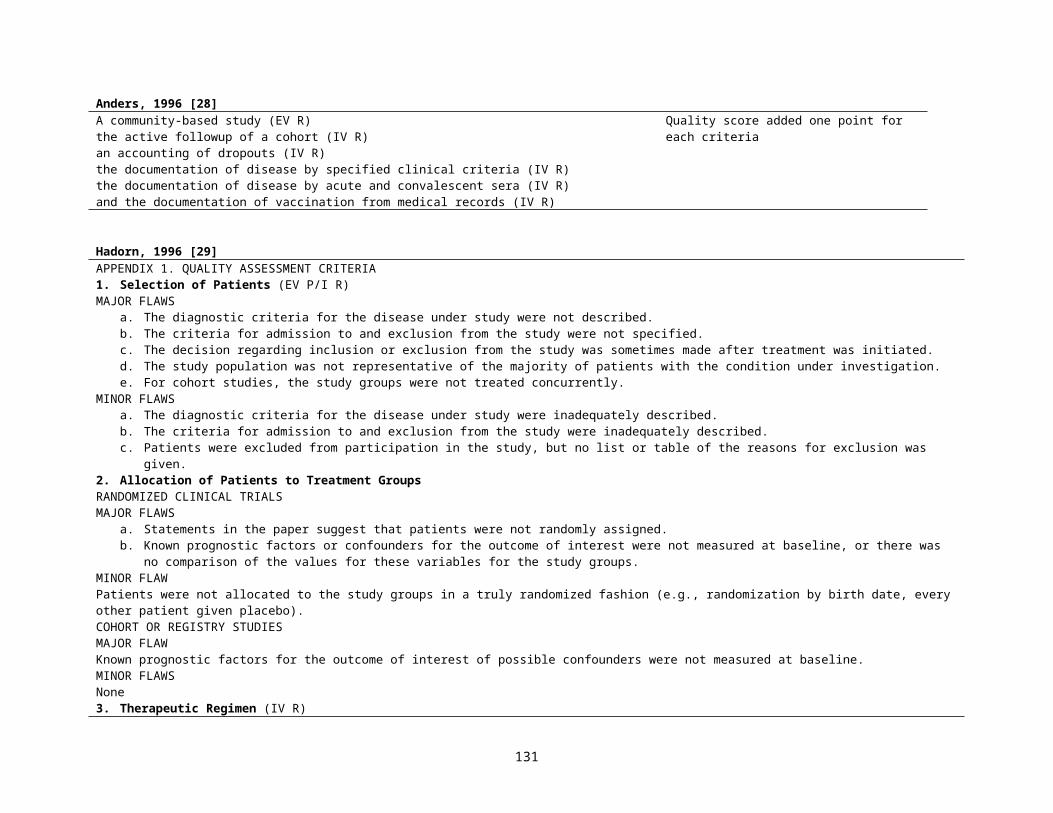
Eichler, 2007 [80]Q-item 1
(IV R)Q-item 2(IV P/I R0
Q-item 3(IV P/I R)
Q-item 4(EV P/I R)
Q-item 5(EV P/I R)
Q-item 6(EV P/I R)
Q-item 7(IV P/I R)
Q-item 8(IV P/I R)
Q-item 9(IV P/I R) Q-items
Outcome assessment:
blinded*Followup:
length†Followup:
completeness‡
Population: characteristics
§
Population: recruitment
ll
Inclusion: completeness
¶
Predictive variables: definition provided
Outcome: definition provided
Math. Techniques: description
provided
(Yes/no/not clear) #
*Assessment of outcome blinded for predictive variables: fulfilled if stated in the text or all cause mortality is the outcome.† Follow-up length in the validation cohort comparable to the follow-up time of the prediction rule: fulfilled if longer than 80% (or accounted for shorter follow-up in analysis).‡ Completeness of follow up: fulfilled if completeness z90%.§Population characteristics described in sufficient detail: fulfilled if at least data for sex, age, and morbidities are provided.ll Recruitment of population described in sufficient detail: fulfilled if qualitative description is provided.¶ Completeness of inclusion of eligible patients (participation rate): fulfilled if completeness z75%.#Q-items indicates the number of quality items grouped to the categories yes (+), no (_), and not clear (?).
Hirtz, 2007[81]Time frame
A. Data refer to time period that includes years from 1990 or laterB. Data refer to time period that includes years from 1970 to 1989 but not laterC. Data refer to 1969 or earlierD. Data refer to an undisclosed time period
Case-finding and sample size (EV IV R)A. Evaluate all eligible population members (or adequate-sized random sample) or search of all relevant referral sources, with likelihood of identifying
substantial majority of targeted casesB. Some potentially relevant case-finding sources omittedC. Case-finding strategy that may lead to an unrepresentative sample or significant over- or underascertainmentD. No information disclosed or sample size inadequate to provide confident estimate of incidence or prevalence
Case definition (IV R)A. Clearly defined and consistent with generally accepted clinical/laboratory criteriaB. Less precisely defined with minor deviations from generally accepted criteriaC. Modification or partial use of generally accepted criteriaD. Other or no criteria applied
Source of diagnosis (IV R P/I R)A. Specialist or fully validated source (including self-report) with known positive predictive valuesB. Self-report with specified criteria or partially validated sourceC. Nonvalidated but well-defined diagnostic sourceD. Self-report without specified criteria or poorly defined source
Class Distribution of criteriaI All AII One or more B; no C or DIII One or more C; no DIV One or more D
131
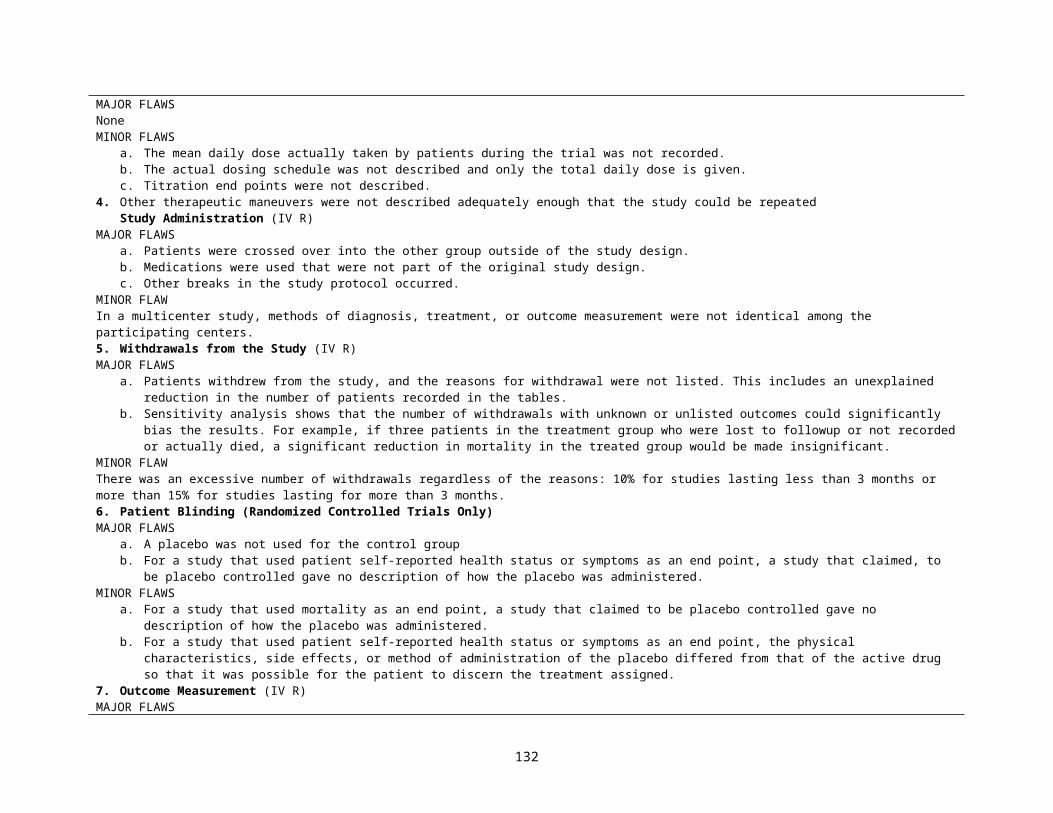
Tricco, 2008 [82]Item # Brief Description Scoring: total score is out of 7.
1=review has extensive flaws2-3=major flaws4-5=minor flaws6-7=minimal flaws
1 Search methods2 Search comprehensiveness3 Inclusion criteria4 Bias in study selection5 Criteria for validity6 Appropriate validity items7 Combining methods8 Appropriate combining9 Appropriate conclusions
Lundh, 2008 [83]Review of the guidelines for assessment of methodological quality of the primary studies included in Cochrane reviews:
1) The type of methodological quality assessment recommended for individual studies, i.e. a component or a scale approach.2) Areas of methodological quality and other areas recommended to be assessed.3) Recommendations for using methodological quality assessments of individual studies in reviews, e.g. for inclusion of studies or for analytic purposes.4) Recommendations to grade the level of evidence for the review as a whole.
Area of quality recommended: -Sequence generation-Concealment of allocation-Blinding of patients-Blinding of caregivers-Blinding of outcome assessors-Follow-up-Intention-to-treat analysis
132
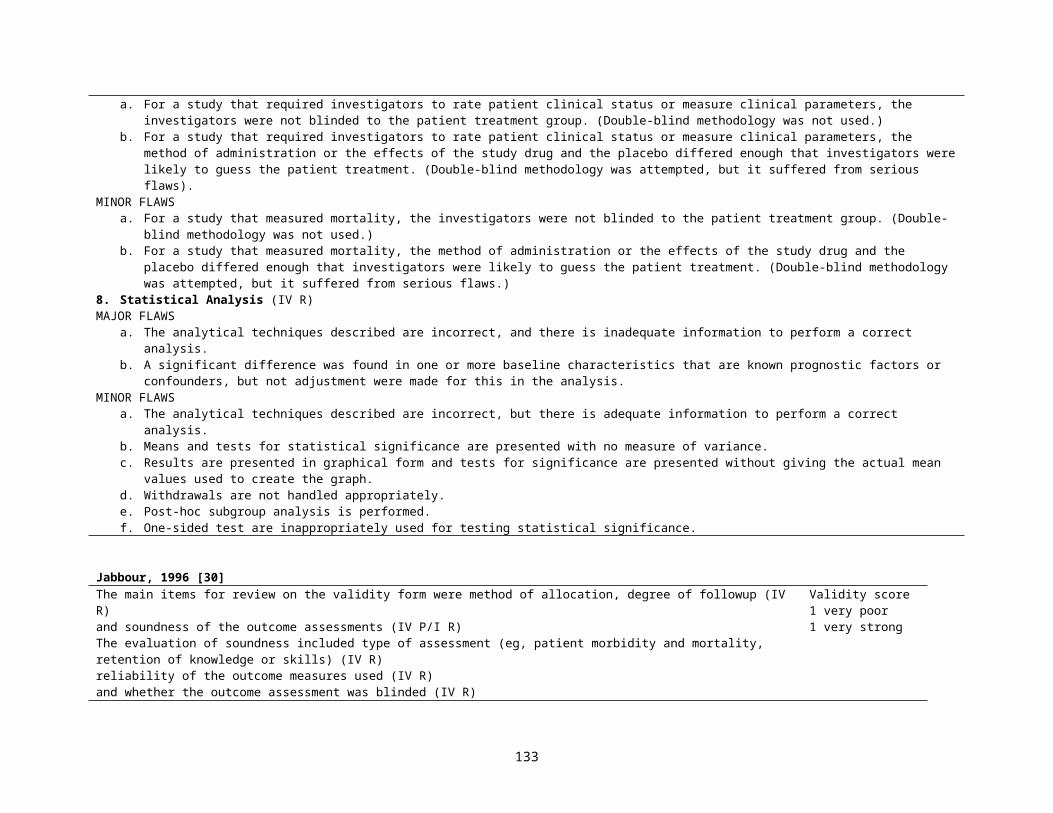
Conde-Agudelo, 2008 [87]1. Women selection (EV P/I R)
Cohort or cross sectional studies● Adequate: if women recruited were representative of the entire population (entire source population, unselected sample of consecutive women, or a
random sample). ● Inadequate: convenience sampling (arbitrary recruitment or nonconsecutive recruitment) or when selection was not random or unreported.Case-control studies● Adequate: women recruited from the same population.● Inadequate: women recruited from different sources or unreported.
2. Assessment of exposure (infection) and outcome (preeclampsia) (IV P/I R)● Adequate: ascertainment of both infection and preeclampsia by medical records or direct measurement.● Inadequate: ascertainment of both infection and preeclampsia by personal or telephone interview, or self-administered questionnaire, or unreported.
3. Blinding of investigators to both exposition and the outcome (IV R)● Adequate: measurement of both infection and preeclampsia was done while investigators were blinded.● Inadequate: not blinded or not clear from the text or unreported.
4. Loss to follow-up or exclusions and period of time for recruitment of women (IV P/I R)Cohort or cross sectional studies● Adequate: if loss to follow-up or nonvalid exclusions _10%.● Inadequate: if loss to follow-up or nonvalid exclusions _10%.Case-control studies● Adequate: case patients and control women recruited during the same period of time.● Inadequate: women recruited from different periods of time or unreported.
5. Control for confounding factors (IV R)● Adequate: if the study controlled for at least maternal age and markers of socioeconomic status.● Inadequate: if the study did not control for at least maternal age and markers of socioeconomic status, or no adjustment was performed.
6. Temporality of the association (E R)● Adequate: if diagnosis of infection was made before the clinical onset of preeclampsia.● Inadequate: if diagnosis of infection was made at or after the clinical onset of preeclampsia or not clear from the text or unreported.
7. Report of dose-response gradient (E R)● Adequate: if studies reported the relationship between severity of infection and the risk and/or severity of preeclampsia.● Inadequate: if studies did not report the relationship between severity of infection and the risk and/or severity of preeclampsia.
133
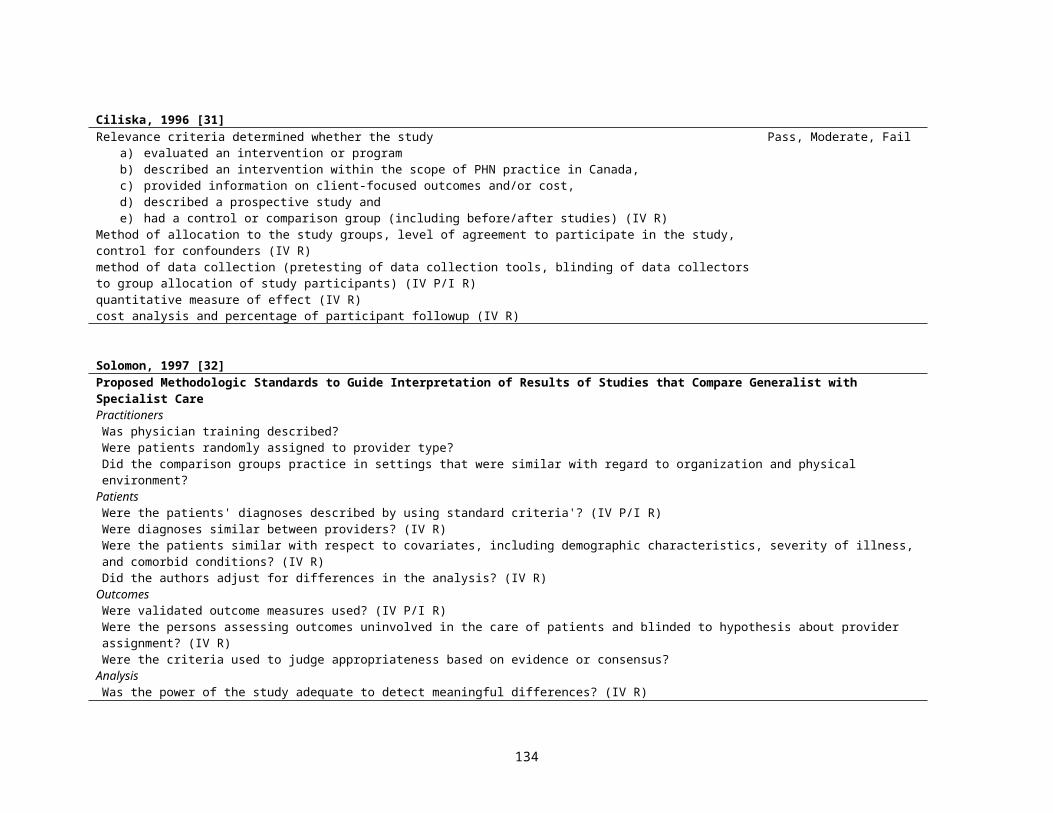
References for Appendix Tables 2 and 3
[1] Horwitz RI, Feinstein AR. Methodologic standards and contradictory results in case-control research. Am J Med. 1979 Apr;66(4):556-64.
[2] How to read clinical journals: IV. To determine etiology or causation. Can Med Assoc J. 1981 Apr 15;124(8):985-90.[3] Krogh CL. A checklist system for critical review of medical literature. Med Educ. 1985 Sep;19(5):392-5.[4] Gardner MJ, Machin D, Campbell MJ. Use of check lists in assessing the statistical content of medical studies. Br Med J (Clin
Res Ed). 1986 Mar 22;292(6523):810-2.[5] Mulrow CD, Lichtenstein MJ. Blood glucose and diabetic retinopathy: a critical appraisal of new evidence. J Gen Intern Med.
1986 Mar-Apr;1(2):73-7.[6] Esdaile JM, Horwitz RI. Observational studies of cause-effect relationships: an analysis of methodologic problems as illustrated
by the conflicting data for the role of oral contraceptives in the etiology of rheumatoid arthritis. Journal of chronic diseases. 1986;39(10):841-52.
[7] Lichtenstein MJ, Mulrow CD, Elwood PC. Guidelines for reading case-control studies. Journal of chronic diseases. 1987;40(9):893-903.
[8] Longnecker MP, Berlin JA, Orza MJ, Chalmers TC. A meta-analysis of alcohol consumption in relation to risk of breast cancer. JAMA. 1988 Aug 5;260(5):652-6.
[9] Zola P, Volpe T, Castelli G, Sismondi P, Nicolucci A, Parazzini F, et al. Is the published literature a reliable guide for deciding between alternative treatments for patients with early cervical cancer? Int J Radiat Oncol Biol Phys. 1989 Mar;16(3):785-97.
[10] Reisch JS, Tyson JE, Mize SG. Aid to the evaluation of therapeutic studies. Pediatrics. 1989 Nov;84(5):815-27.[11] Spitzer WO, Lawrence V, Dales R, Hill G, Archer MC, Clark P, et al. Links between passive smoking and disease: a best-
evidence synthesis. A report of the Working Group on Passive Smoking. Clin Invest Med. 1990 Feb;13(1):17-42; discussion 3-6.[12] Berlin JA, Colditz GA. A meta-analysis of physical activity in the prevention of coronary heart disease. American journal of
epidemiology. 1990 Oct;132(4):612-28.[13] Stock SR. Workplace ergonomic factors and the development of musculoskeletal disorders of the neck and upper limbs: a meta-
analysis. Am J Ind Med. 1991;19(1):87-107.[14] Oxman AD, Guyatt GH. Validation of an index of the quality of review articles. Journal of clinical epidemiology.
1991;44(11):1271-8.[15] Fowkes FG, Fulton PM. Critical appraisal of published research: introductory guidelines. BMJ (Clinical research ed. 1991 May
11;302(6785):1136-40.[16] Carruthers SG, Larochelle P, Haynes RB, Petrasovits A, Schiffrin EL. Report of the Canadian Hypertension Society Consensus
Conference: 1. Introduction. CMAJ. 1993 Aug 1;149(3):289-93.[17] Carson CA, Fine MJ, Smith MA, Weissfeld LA, Huber JT, Kapoor WN. Quality of published reports of the prognosis of
community-acquired pneumonia. J Gen Intern Med. 1994 Jan;9(1):13-9.
134
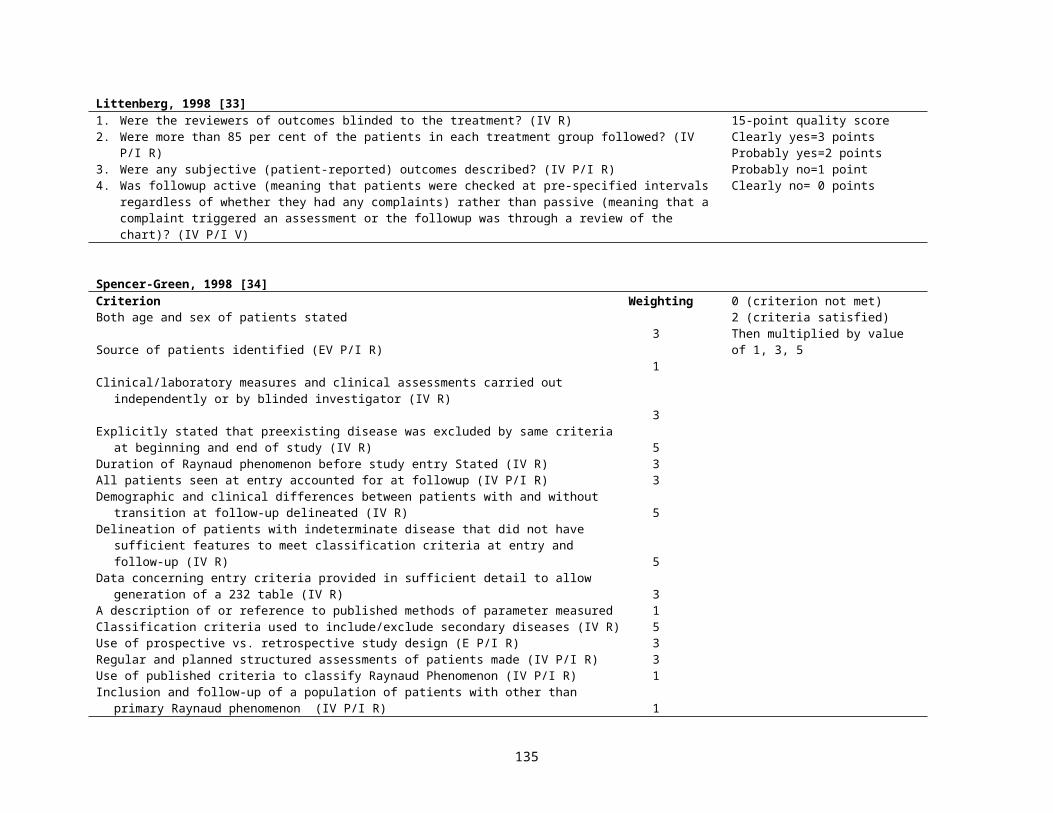
[18] Avis M. Reading research critically. II. An introduction to appraisal: assessing the evidence. J Clin Nurs. 1994 Sep;3(5):271-7.[19] Gyorkos TW, Tannenbaum TN, Abrahamowicz M, Oxman AD, Scott EA, Millson ME, et al. An approach to the development
of practice guidelines for community health interventions. Can J Public Health. 1994 Jul-Aug;85 Suppl 1:S8-13.[20] Cho MK, Bero LA. Instruments for assessing the quality of drug studies published in the medical literature. Jama. 1994 Jul
13;272(2):101-4.[21] Levine M, Walter S, Lee H, Haines T, Holbrook A, Moyer V. Users' guides to the medical literature. IV. How to use an article
about harm. Evidence-Based Medicine Working Group. JAMA. 1994 May 25;271(20):1615-9.[22] Goodman SN, Berlin J, Fletcher SW, Fletcher RH. Manuscript quality before and after peer review and editing at Annals of
Internal Medicine. Annals of internal medicine. 1994 Jul 1;121(1):11-21.[23] DuRant RH. Checklist for the evaluation of research articles. J Adolesc Health. 1994 Jan;15(1):4-8.[24] Campos-Outcalt D, Senf J, Watkins AJ, Bastacky S. The effects of medical school curricula, faculty role models, and biomedical
research support on choice of generalist physician careers: a review and quality assessment of the literature. Acad Med. 1995 Jul;70(7):611-9.
[25] Margetts BM, Thompson RL, Key T, Duffy S, Nelson M, Bingham S, et al. Development of a scoring system to judge the scientific quality of information from case-control and cohort studies of nutrition and disease. Nutr Cancer. 1995;24(3):231-9.
[26] Cowley DE. Prostheses for primary total hip replacement. A critical appraisal of the literature. Int J Technol Assess Health Care. 1995 Fall;11(4):770-8.
[27] Garber BG, Hebert PC, Yelle JD, Hodder RV, McGowan J. Adult respiratory distress syndrome: a systemic overview of incidence and risk factors. Crit Care Med. 1996 Apr;24(4):687-95.
[28] Anders JF, Jacobson RM, Poland GA, Jacobsen SJ, Wollan PC. Secondary failure rates of measles vaccines: a metaanalysis of published studies. Pediatr Infect Dis J. 1996 Jan;15(1):62-6.
[29] Hadorn DC, Baker D, Hodges JS, Hicks N. Rating the quality of evidence for clinical practice guidelines. Journal of clinical epidemiology. 1996 Jul;49(7):749-54.
[30] Jabbour M, Osmond MH, Klassen TP. Life support courses: are they effective? Ann Emerg Med. 1996 Dec;28(6):690-8.[31] Ciliska D, Hayward S, Thomas H, Mitchell A, Dobbins M, Underwood J, et al. A systematic overview of the effectiveness of
home visiting as a delivery strategy for public health nursing interventions. Can J Public Health. 1996 May-Jun;87(3):193-8.[32] Solomon DH, Bates DW, Panush RS, Katz JN. Costs, outcomes, and patient satisfaction by provider type for patients with
rheumatic and musculoskeletal conditions: a critical review of the literature and proposed methodologic standards. Annals of internal medicine. 1997 Jul 1;127(1):52-60.
[33] Littenberg B, Weinstein LP, McCarren M, Mead T, Swiontkowski MF, Rudicel SA, et al. Closed fractures of the tibial shaft. A meta-analysis of three methods of treatment. J Bone Joint Surg Am. 1998 Feb;80(2):174-83.
[34] Spencer-Green G. Outcomes in primary Raynaud phenomenon: a meta-analysis of the frequency, rates, and predictors of transition to secondary diseases. Arch Intern Med. 1998 Mar 23;158(6):595-600.
135
[35] Kreulen CM, Creugers NH, Meijering AC. Meta-analysis of anterior veneer restorations in clinical studies. J Dent. 1998 May;26(4):345-53.
[36] Jadad AR, Moher D, Klassen TP. Guides for reading and interpreting systematic reviews: II. How did the authors find the studies and assess their quality? Arch Pediatr Adolesc Med. 1998 Aug;152(8):812-7.
[37] Borghouts JA, Koes BW, Bouter LM. The clinical course and prognostic factors of non-specific neck pain: a systematic review. Pain. 1998 Jul;77(1):1-13.
[38] Downs SH, Black N. The feasibility of creating a checklist for the assessment of the methodological quality both of randomised and non-randomised studies of health care interventions. Journal of epidemiology and community health. 1998 Jun;52(6):377-84.
[39] Loney PL, Chambers LW, Bennett KJ, Roberts JG, Stratford PW. Critical appraisal of the health research literature: prevalence or incidence of a health problem. Chronic Dis Can. 1998;19(4):170-6.
[40] Silman A, Symmons D. Reporting requirements for longitudinal observational studies in rheumatology. J Rheumatol. 1999 Feb;26(2):481-3.
[41] van Rooyen S, Black N, Godlee F. Development of the review quality instrument (RQI) for assessing peer reviews of manuscripts. Journal of clinical epidemiology. 1999 Jul;52(7):625-9.
[42] Angelillo IF, Villari P. Residential exposure to electromagnetic fields and childhood leukaemia: a meta-analysis. Bull World Health Organ. 1999;77(11):906-15.
[43] Corrao G, Bagnardi V, Zambon A, Arico S. Exploring the dose-response relationship between alcohol consumption and the risk of several alcohol-related conditions: a meta-analysis. Addiction. 1999 Oct;94(10):1551-73.
[44] Cullum N. Critical appraisal. Finding and appraising cohort studies for causation and prognosis. NT Learn Curve. 1999 Sep 1;3(7):8-10.
[45] Nguyen QV, Bezemer PD, Habets L, Prahl-Andersen B. A systematic review of the relationship between overjet size and traumatic dental injuries. Eur J Orthod. 1999 Oct;21(5):503-15.
[46] Cameron I, Crotty M, Currie C, Finnegan T, Gillespie L, Gillespie W, et al. Geriatric rehabilitation following fractures in older people: a systematic review. Health technology assessment (Winchester, England). 2000;4(2):i-iv, 1-111.
[47] Ariens GA, van Mechelen W, Bongers PM, Bouter LM, van der Wal G. Physical risk factors for neck pain. Scand J Work Environ Health. 2000 Feb;26(1):7-19.
[48] Zeegers MP, Tan FE, Dorant E, van Den Brandt PA. The impact of characteristics of cigarette smoking on urinary tract cancer risk: a meta-analysis of epidemiologic studies. Cancer. 2000 Aug 1;89(3):630-9.
[49] Zaza S, Wright-De Aguero LK, Briss PA, Truman BI, Hopkins DP, Hennessy MH, et al. Data collection instrument and procedure for systematic reviews in the Guide to Community Preventive Services. Task Force on Community Preventive Services. American journal of preventive medicine. 2000 Jan;18(1 Suppl):44-74.
136

[50] van der Windt DA, Thomas E, Pope DP, de Winter AF, Macfarlane GJ, Bouter LM, et al. Occupational risk factors for shoulder pain: a systematic review. Occup Environ Med. 2000 Jul;57(7):433-42.
[51] Steinberg EP, Eknoyan G, Levin NW, Eschbach JW, Golper TA, Owen WF, et al. Methods used to evaluate the quality of evidence underlying the National Kidney Foundation-Dialysis Outcomes Quality Initiative Clinical Practice Guidelines: description, findings, and implications. Am J Kidney Dis. 2000 Jul;36(1):1-11.
[52] Harris EC, Barraclough BM. Suicide as an outcome for medical disorders. Medicine (Baltimore). 1994 Nov;73(6):281-96.[53] Harbour R, Miller J. A new system for grading recommendations in evidence based guidelines. BMJ (Clinical research ed. 2001
Aug 11;323(7308):334-6.[54] Macfarlane TV, Glenny AM, Worthington HV. Systematic review of population-based epidemiological studies of oro-facial
pain. J Dent. 2001 Sep;29(7):451-67.[55] Pilote L, Tager IB. Outcomes research in the development and evaluation of practice guidelines. BMC Health Serv Res. 2002
Mar 25;2(1):7.[56] Jain A, Concato J, Leventhal JM. How good is the evidence linking breastfeeding and intelligence? Pediatrics. 2002
Jun;109(6):1044-53.[57] Bhutta AT, Cleves MA, Casey PH, Cradock MM, Anand KJ. Cognitive and behavioral outcomes of school-aged children who
were born preterm: a meta-analysis. JAMA. 2002 Aug 14;288(6):728-37.[58] Al-Jader LN, Newcombe RG, Hayes S, Murray A, Layzell J, Harper PS. Developing a quality scoring system for
epidemiological surveys of genetic disorders. Clin Genet. 2002 Sep;62(3):230-4.[59] Carneiro AV. Critical appraisal of prognostic evidence: practical rules. Rev Port Cardiol. 2002 Jul-Aug;21(7-8):891-900.[60] Elwood M. Forward projection--using critical appraisal in the design of studies. Int J Epidemiol. 2002 Oct;31(5):1071-3.[61] Campbell H, Rudan I. Interpretation of genetic association studies in complex disease. Pharmacogenomics J. 2002;2(6):349-60.[62] Manchikanti L, Singh V, Vilims BD, Hansen HC, Schultz DM, Kloth DS. Medial branch neurotomy in management of chronic
spinal pain: systematic review of the evidence. Pain Physician. 2002 Oct;5(4):405-18.[63] Slim K, Nini E, Forestier D, Kwiatkowski F, Panis Y, Chipponi J. Methodological index for non-randomized studies (minors):
development and validation of a new instrument. ANZ J Surg. 2003 Sep;73(9):712-6.[64] Scholten-Peeters GGM, Verhagen AP, Bekkering GE, van der Windt DAWM, Barnsley L, Oostendorp RAB, et al. Prognostic
factors of whiplash-associated disorders: a systematic review of prospective cohort studies. Pain. 2003;104(1):303-22.[65] Rangel SJ, Kelsey J, Colby CE, Anderson J, Moss RL. Development of a quality assessment scale for retrospective clinical
studies in pediatric surgery. J Pediatr Surg. 2003 Mar;38(3):390-6; discussion -6.[66] Meijer R, Ihnenfeldt DS, van Limbeek J, Vermeulen M, de Haan RJ. Prognostic factors in the subacute phase after stroke for the
future residence after six months to one year. A systematic review of the literature. Clin Rehabil. 2003 Aug;17(5):512-20.[67] Centre for Evidence Based Mental Health (Oxford England). CEBMH : Critical Appraisal Forms. [S.l.]: Centre for Evidence
Based Mental Health 2000.
137
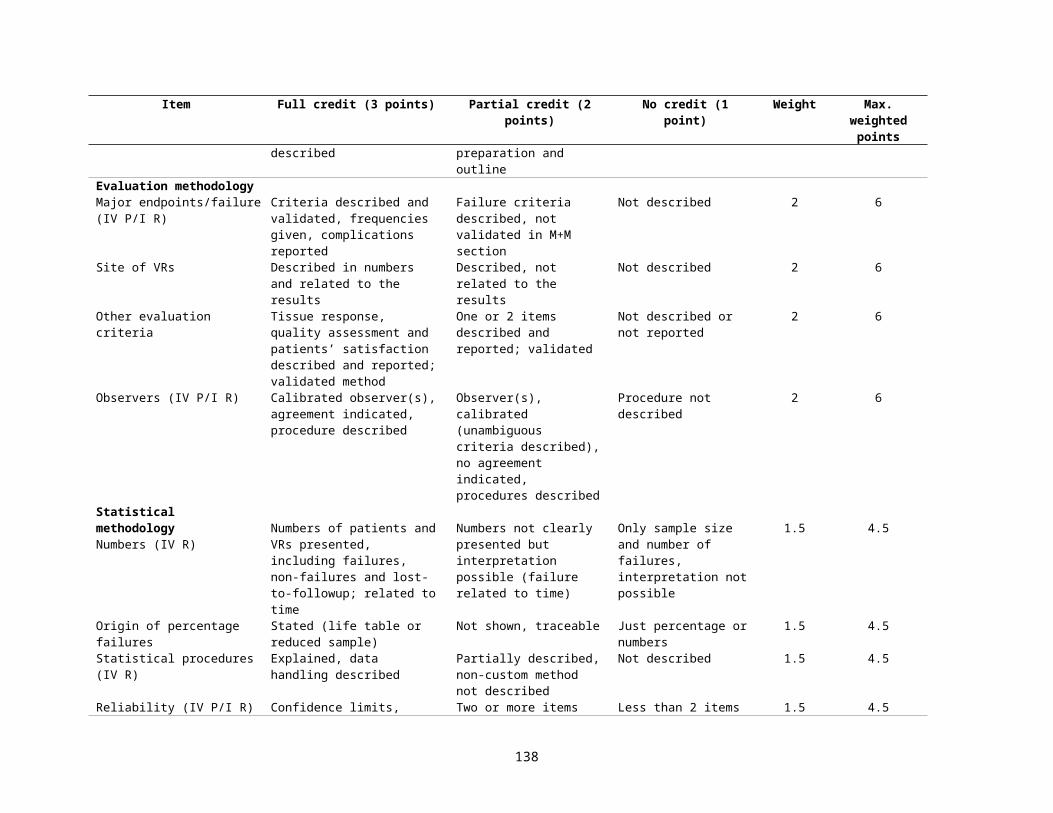
[68] Federal Focus Inc. Epidemiologic data in regulatory risk assessments : recommendations for implementing the "London principles" and for risk assessment guidance. Washington, D.C.: Federal Focus, Inc. (11 Dupont Circle, Ste. 700, DC 20036) 1996.
[69] Scottish Intercollegiate Guidelines Network, Harbour RT, Forsyth L. Sign 50. A guideline developer's handbook. Rev. ed. Ediburgh, Scotland: Scottish Intercollegiate Guidelines Network 2008:1 text file (102 p.
[70] Wells GA SB, O’Connell D, Peterson J, Welch V, Losos M,, P T. Quality Assessment Scales for Observational Studies.: Ottawa Health Research Institute 2004.
[71] Woodbury MG, Houghton PE. Prevalence of pressure ulcers in Canadian healthcare settings. Ostomy Wound Manage. 2004 Oct;50(10):22-4, 6, 8, 30, 2, 4, 6-8.
[72] Tooth L, Ware R, Bain C, Purdie DM, Dobson A. Quality of reporting of observational longitudinal research. American journal of epidemiology. 2005 Feb 1;161(3):280-8.
[73] Moja LP, Telaro E, D'Amico R, Moschetti I, Coe L, Liberati A. Assessment of methodological quality of primary studies by systematic reviews: results of the metaquality cross sectional study. BMJ (Clinical research ed. 2005 May 7;330(7499):1053.
[74] Pavia M, Pileggi C, Nobile CG, Angelillo IF. Association between fruit and vegetable consumption and oral cancer: a meta-analysis of observational studies. The American journal of clinical nutrition. 2006 May;83(5):1126-34.
[75] de Boer AG, Verbeek JH, van Dijk FJ. Adult survivors of childhood cancer and unemployment: A metaanalysis. Cancer. 2006 Jul 1;107(1):1-11.
[76] Shea B, Boers M, Grimshaw JM, Hamel C, Bouter LM. Does updating improve the methodological and reporting quality of systematic reviews? BMC medical research methodology. 2006;6:27.
[77] Bornhoft G, Maxion-Bergemann S, Wolf U, Kienle GS, Michalsen A, Vollmar HC, et al. Checklist for the qualitative evaluation of clinical studies with particular focus on external validity and model validity. BMC medical research methodology. 2006;6:56.
[78] Moher D. Reporting research results: a moral obligation for all researchers. Can J Anaesth. 2007 May;54(5):331-5.[79] Genaidy AM, Lemasters GK, Lockey J, Succop P, Deddens J, Sobeih T, et al. An epidemiological appraisal instrument - a tool
for evaluation of epidemiological studies. Ergonomics. 2007 Jun;50(6):920-60.[80] Eichler K, Puhan MA, Steurer J, Bachmann LM. Prediction of first coronary events with the Framingham score: a systematic
review. Am Heart J. 2007 May;153(5):722-31, 31 e1-8.[81] Hirtz D, Thurman DJ, Gwinn-Hardy K, Mohamed M, Chaudhuri AR, Zalutsky R. How common are the "common" neurologic
disorders? Neurology. 2007 Jan 30;68(5):326-37.[82] Tricco AC, Tetzlaff J, Sampson M, Fergusson D, Cogo E, Horsley T, et al. Few systematic reviews exist documenting the extent
of bias: a systematic review. Journal of clinical epidemiology. 2008 May;61(5):422-34.[83] Lundh A, Gotzsche PC. Recommendations by Cochrane Review Groups for assessment of the risk of bias in studies. BMC
medical research methodology. 2008;8:22.
138
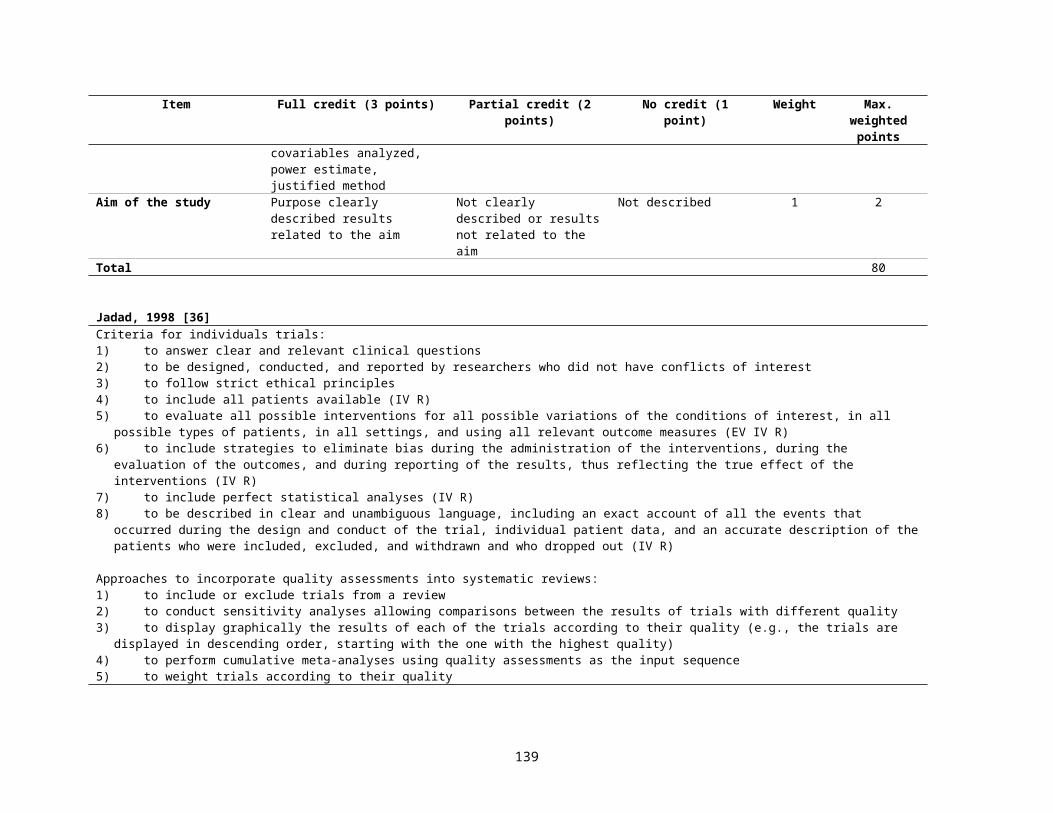
[84] Conde-Agudelo A, Rosas-Bermudez A, Kafury-Goeta AC. Effects of birth spacing on maternal health: a systematic review. Am J Obstet Gynecol. 2007 Apr;196(4):297-308.
[85] Harris RP, Helfand M, Woolf SH, Lohr KN, Mulrow CD, Teutsch SM, et al. Current methods of the US Preventive Services Task Force: a review of the process. American journal of preventive medicine. 2001 Apr;20(3 Suppl):21-35.
[86] Moher D, Tetzlaff J, Tricco AC, Sampson M, Altman DG. Epidemiology and reporting characteristics of systematic reviews. PLoS medicine. 2007 Mar 27;4(3):e78.
[87] Conde-Agudelo A, Villar J, Lindheimer M. Maternal infection and risk of preeclampsia: systematic review and metaanalysis. Am J Obstet Gynecol. 2008 Jan;198(1):7-22.
139