· web view5.4 selects and applies appropriate geographical tools 5.5 demonstrates a sense of...
TRANSCRIPT

Focus Area 5A: Investigating Australia’s Physical Environments
The unique characteristics of Australia’s physical environments and the responses of people to the challenges they present.
OutcomesA student:5.1 Identifies, gathers and evaluates geographical information5.2 Analyses, organises and synthesises geographical information5.3 Selects and uses appropriate written, oral and graphic forms to communicate geographical information5.4 Selects and applies appropriate geographical tools5.5 Demonstrates a sense of place about Australian environments5.6 Explains the geographical processes that form and transform Australian environments5.10 Applies geographical knowledge, understanding and skills with knowledge of civics to demonstrate informed and active citizenship.
Geographical tools in this focus area
Maps use various types of maps and flow charts locate features using degrees and minutes of latitude and longitude calculate the area of a feature measure bearings on a map calculate local relief
Photographs interpret satellite images
Students learn about: Students learn to:
The Australian continent
Australia’s geographical dimensions:– relative size and shape – latitude and longitude
compare Australia’s size and shape with other continents and countries
locate and recognise Australia on a world map using latitude and longitude
the origins of the continent:– Aboriginal perspective – geographical perspective
explain the origins of the continent from an Aboriginal and geographical perspective
Physical characteristics that make Australia unique
major landforms and drainage basins identify and represent Australia’s major physical features and patterns on a variety of maps
patterns of:– climate – weather
– natural resources – vegetation
describe Australia’s major physical features and patterns
explain the interrelationships that exist in the physical environment of Australia
unique flora and fauna
natural hazards in Australia including:– bushfires – droughts– earthquakes
– floods– storms– tropical cyclones
At least ONE natural hazard from the list above:
the nature of the natural hazard in Australia
the geographical processes involved
the impacts of the natural hazard:– economic – environmental– social
the responsibility and responses of individuals, groups and various levels of government to the impact of the natural hazard
explain adaptations of flora and fauna to the Australian environment
describe the range of natural hazards in Australia and their consequences
describe the geographical processes associated with the natural hazard
describe the economic, environmental and social impacts of the natural hazard in Australia
investigate responses of individuals, community-based groups and different levels of government to the hazard
Unique characteristics of Australia’s physical environments
identify the aspect of a slope construct a cross-section calculate the gradient of a slope construct a transect describe and explain relationships on a map read and interpret synoptic charts

The map above illustrates key ranges, Lake Eyre and the Great Victorian desert. It also outlines the three areas in which Australia is divided - the Eastern Highlands, Central Lowlands and the Western Plateau.
Australia’s relative size and shape

Compared to the United States Compared to the Europe
Australia’s climate
Australia is split between a tropical northern climate and a temperate southern climate
The Origins of the Continent
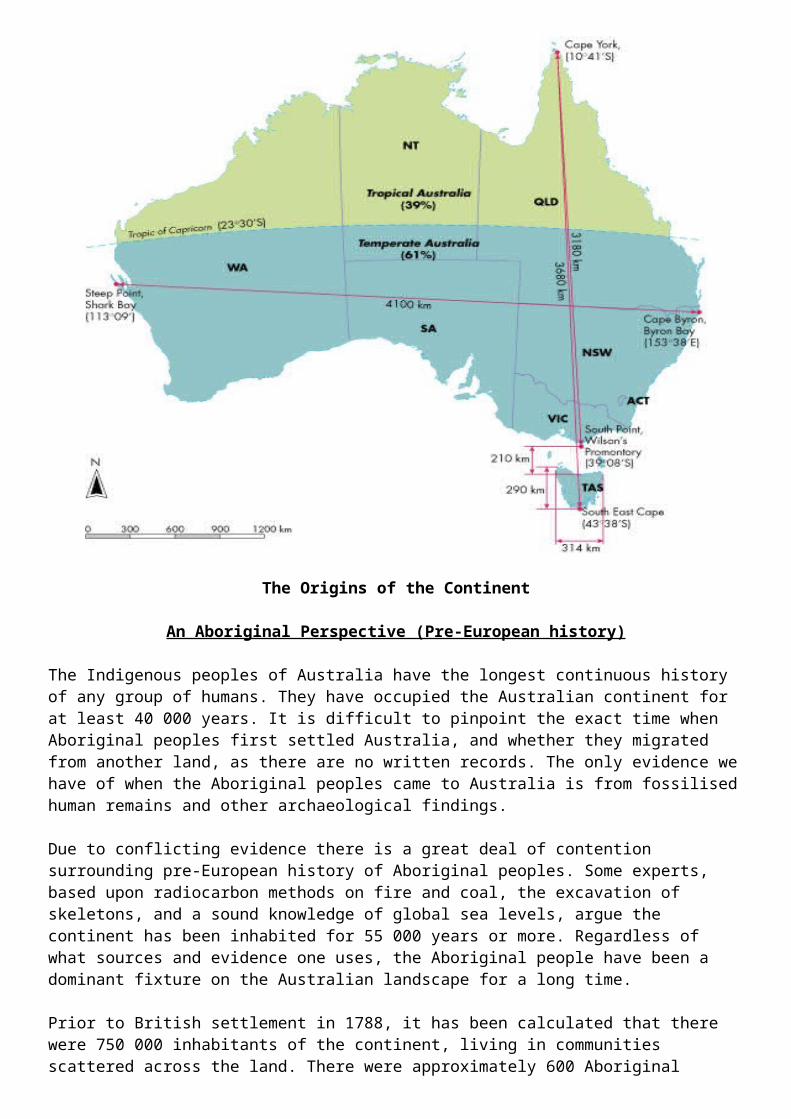
An Aboriginal Perspective (Pre-European history)
The Indigenous peoples of Australia have the longest continuous history of any group of humans. They have occupied the Australian continent for at least 40 000 years. It is difficult to pinpoint the exact time when Aboriginal peoples first settled Australia, and whether they migrated from another land, as there are no written records. The only evidence we have of when the Aboriginal peoples came to Australia is from fossilised human remains and other archaeological findings.
Due to conflicting evidence there is a great deal of contention surrounding pre-European history of Aboriginal peoples. Some experts, based upon radiocarbon methods on fire and coal, the excavation of skeletons, and a sound knowledge of global sea levels, argue the continent has been inhabited for 55 000 years or more. Regardless of what sources and evidence one uses, the Aboriginal people have been a dominant fixture on the Australian landscape for a long time.
Prior to British settlement in 1788, it has been calculated that there were 750 000 inhabitants of the continent, living in communities scattered across the land. There were approximately 600 Aboriginal communities, which were divided into smaller clans. These communities differed from each other in a number of respects. Many of the communities spoke completely different languages, used different tools and weapons, believed in different spirits and behaved in different ways. To suggest that there was one, unified, cohesive Aboriginal group would be misleading. While the various Aboriginal communities differed in a number of ways, they all used similar techniques for explaining their relationship to the land and its history.
The DreamingThe Aboriginal people made sense of the world through the stories of the Dreamtime, which were about a time referred to as the Dreaming. Each Aboriginal community had its own unique Dreamtime stories that had been nurtured and faithfully passed down to succeeding generations for thousands of years. These stories have been described as the first histories of Australia. The Dreamtime stories provide the law and custom underlying the functioning of Aboriginal society.
They relate how the people of today are descended from ancestral beings that could be of human origin, but might also be part of the natural environment - koalas, emus, kangaroos or magpies - or derived from spirits such as the rainbow snake. The experiences of these beings explain the origins of the land itself.The Dreaming legends, from all parts of the continent, indicate that almost every traditional group believed in a Supreme Being. This Great Spirit was known by different names in different areas. In some

cases, a number of different communities adhered to the same Great Spirit. Byamee, Wandjina and Nargacork were some of the most commonly worshipped Great Spirits. From the legends we learn that in the beginning, the mighty Creator was responsible for creating every aspect of the Earth's environment. The mighty Creator organised the seasons, created the sun and moon, constructed the wildlife, and finally, made men and women. It was believed that the Great Spirit lived eternally, watching and protecting his followers affectionately.
One legend that touches on the benevolence of the Great Spirit is told by the Wiradjuri people, who lived traditionally in the area now known as Brewarrina, in New South Wales. The Wiradjuri people believed that Byamee, the Great Creator, delivered them spirit helpers. These spirit helpers took the form of men and helped the Wiradjuri people to construct fish traps in the river. Whenever an abundance of fish was caught the Wiradjuri people performed a special corroboree to give thanks.
The Rainbow Serpent appears in many of the Aboriginal groups dreaming stories. Almost every group throughout the land had strong ties with this great, mysterious being from the Dreaming. Many of the groups explain the creation of the land through the Rainbow Snake. It is believed that originally the land was very flat, and remained so, until the giant Rainbow Serpent slid across the landscape constructing mountains, deep gorges, rivers and valleys. Some groups credit the Rainbow Serpent with the creation of everything, stating it gave birth to men, women and animals. Even today the Rainbow Serpent is accorded much respect. The Aboriginal people believe the Rainbow Serpent is represented by a rainbow in the sky after a downpour.
Sacred coloursFrom the legends, it is clear that some colours held great significance for certain groups. For example, the colour red was sacred to some groups in Central Australia. This belief evolved from the Dreaming legend about Marindi, the dingo. The legend states that the Aboriginal people of Central Australia were tormented by a giant lizard, which regularly caused death and destruction. The unfortunate people summoned Marindi to help rid them of the giant lizard. Marindi defeated the giant lizard in a colossal struggle, drenching the Earth in blood. In recognition of Marindi's bravery the ancestor spirits magically stained the remaining Earth a deep red colour. This explained why there is so much red ochre in the centre of the continent.
Scientific and Geographical Perspectives (Post-European history)
Australia is often referred to as an ancient land, the oldest of continents. Australia has not always had its present shape or position on the globe. Even today, it is in the process of colliding with South-East Asia. Originally, Australia was joined to a super-continent, referred to as Pangaea (meaning 'all lands' in Greek), before it separated and drifted across the Earth's surface, experiencing a variety of different climatic changes and geological events. In focusing on Australia's journey across the Earth, it is possible to gain a greater insight into the evolution of Australian landforms, soils, flora and fauna.
Origins of plate tectonic theoryPlate tectonics is a geological theory used to explain the phenomenon of continental drift, which is the tendency of landmasses to move around the Earth. This theory provides an explanation of how Pangaea was able to break up into two separate landmasses, Gondwanaland and Laurasia, which in turn broke into the seven continents that exist today. After Pangaea split into two landmasses, Australia was located on the southern super-continent of Gondwanaland. Other present-day continents which formed part of Gondwanaland are Africa, Antarctica, South America and some southern parts of the Asian continent.The existence of Gondwanaland was first discovered during the late 19th century by an Austrian geologist named Eduard Suess.

Suess named the ancient landmass after a province in Central India called Gondwana. This was after he discovered that a plant species found in Gondwana matched the fossilised remains of plants found on other continents in the southern hemisphere. Suess' findings helped to form the theory of plate tectonics.
What are plate tectonics?The Earth is made up of many layers. From the outside in, they are the crust, the mantle, the outer core and the inner core. Central to the theory of tectonic plates is the idea that the outermost part of the Earth, the crust, is composed of two layers: the lithosphere and the asthenosphere. The lithosphere is composed of the crust and the solidified uppermost part of the mantle. The asthenosphere lies underneath the lithosphere, and is made up of the inner viscous part of the mantle. The lithosphere is a more fixed, rigid, cooler substance than the hotter, mechanically weaker asthenosphere.
The plate tectonic theory hinges upon the principle that the lithosphere exists as separate, distinct tectonic plates, which float on the fluid-like asthenosphere. Volcanic activity, earthquakes, mountain building and oceanic trench formation occur at the plate boundaries, which are the areas separating the plates. The tectonic plates can be categorised as continental plates or oceanic plates. The Australian continent is located on the Indo-Australian Plate, which includes the surrounding Indian Ocean and the Indian subcontinent. The Indo-Australian Plate is subdivided into two plates along a low active boundary: the Australian Plate and the Indian Plate. The Indo-Australian plate was originally connected to Gondwanaland, and later Antarctica, before it began to drift north some 96 million years ago. As the continent moved northwards, the climate became drier. As the Australian continent drifted north it developed unique flora and fauna.The Australian Plate is drifting 35 degrees east of north at a speed of 67 millimetres a year. The easterly side of the Indo-Australian Plate is a convergent boundary with the subducting Pacific Plate. From the fusing of these two plates, whereby the Pacific Plate slides underneath the Australian Plate, the Kermedac Trench is formed. New Zealand is located at the south-eastern boundary of the plate and was part of Australia before detaching around 85 million years ago.
An old, flat continentAustralia has been described as old and flat. This is because the Australian continent has experienced a long period of geological stability, which means there has not been much volcanic or tectonic activity in the recent past. As a result, Australia has been open to the forces of weathering and erosion, which are processes that break apart and move rocks and soil around. In the distant past, however, there were volcanic eruptions and earthquakes that helped shape the face of Australia.

The shaping of the Australian Continent
The image below illustrates where continents are moving.
The shaping of the Australian Continent
The image below illustrates ocean movement around the world. Hot water moves to colder areas over the top of cold water, which is moving into warmer areas

Geographical Tools: Maps
Use various types of maps and flow charts
PhysicalPhysical maps often include much of the same data found on a political map, but their primary purpose is to show landforms like deserts, mountains and plains. Their topography style (or relief) presents an overall better picture of the local terrain.
PoliticalPolitical maps are designed to show governmental boundaries of countries, states and counties. They can also indicate the location of major cities, and they usually include significant bodies of water.

TopographicTraditional definitions require a topographic map to show both natural and man-made features. Topographic maps show contour lines, relief and a range of man-made structures like roads and buildings.
ThematicA thematic map reflects a particular theme, for example political, cultural or agricultural features of an area. Symbols, pictures and colours are used to represent whatever is being mapped.

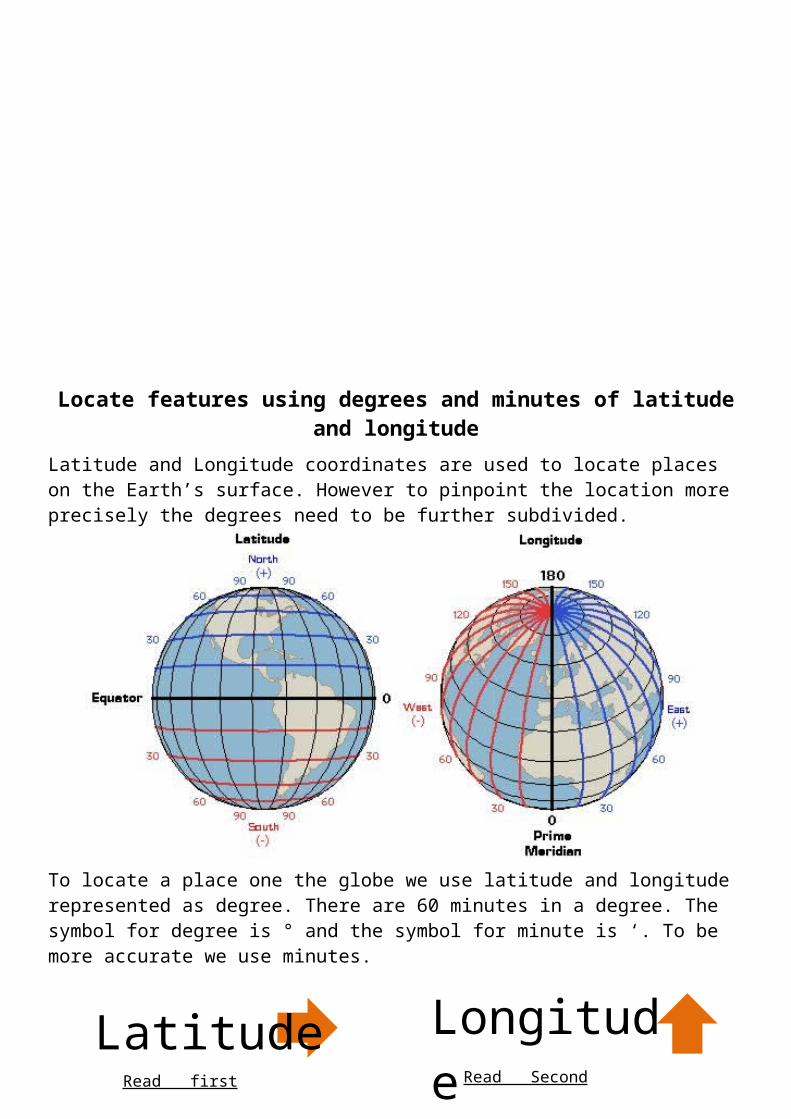
Locate features using degrees and minutes of latitude and longitudeLatitude and Longitude coordinates are used to locate places on the Earth’s surface. However to pinpoint the location more precisely the degrees need to be further subdivided.
To locate a place one the globe we use latitude and longitude represented as degree. There are 60 minutes in a degree. The symbol for degree is ° and the symbol for minute is ‘. To be more accurate we use minutes.
LongitudeLatitudeRead first Read Second

How to reference an area in the North West of the Globe
How to reference an area in the North East of the Globe
How to reference an area in the South West of the Globe
How to reference an area in the South East of the Globe
Read from this point out and across
Use the World Map above to answer the following.
1. Give the longitude and latitude of each of the following locations:
A
B
DEF
GH I
J
C

a. ___________________
b. ___________________
c. ___________________
d. ___________________
e. ___________________
f. ___________________
g. ___________________
h. ___________________
i. ___________________
j. ___________________

Use the Map above to answer the following.
1. Give the Latitude and Longitude (degrees and minutes) for each of the following

a) Hobart ___________________
b) Swansea ___________________
c) Stanley ___________________
d) Launceston ___________________
e) Port Arthur ___________________
Calculate the area of a feature
Calculating the area of a feature means that you are to measure and guess the area of something within a map. The example below is a pond dotted to highlight full squares, ¾ squares, ½ squares and ¼ squares. From the division we use a scale to measure around the feature and calculate the total area

2. Calculate the area of the Lake

Number of Squares
Multiplier Calculation
1 Square 40 x 1.00¾ Squares 9 x 0.75½ Squares 8 x 0.50¼ Squares 11 x 0.25
Direction and Bearings on a map


A
B
C
DE
F
G
H

1. Find the bearing of X to;

A. _______________
B. _______________
C. _______________
D. _______________
E. _______________
F. _______________
G. _______________
H. _______________

Calculate local relief

Identify the aspect of a slope
Aspect is the direction a slope is facing. This is important because it dictates the amount of sunlight an area of land receives. This has a big impact on its microclimate, whether it is warmer or cooler, moister or drier than surrounding areas. This is important when investigating vegetation communities or buying a block of land. In Australia, land with a northerly aspect will generally be warmer than land with a southerly aspect

Construct a cross-section
To create a cross section we need to know and understand contour lines. Contour lines connect points that are of the same elevation. They show the exact elevation, the shape of the land the steepness of the land. Contour lines never touch or cross each other.
Step 1
Step 2

Calculate the gradient of a slope
Gradient in geography is different to gradient in maths.
Essentially, the whole process looks like this…
Step 3
Step 4

It is always expressed as 1:x, ie 1:4, or 1:1.The second number in the expression is run/rise, so the way to calculate is:
Run / Rise (where the run and the rise are measured in the same units).
Tricks and traps1. Not expressing the gradient in the form 1:x2. using rise over run as in maths
With a contour map, the contours are likely to be expressed in metres (for the rise) whereas the run is likely to be measured in km. So, make sure the rise is also in km (ie 700m = 0.7km) before applying the formula. 1: run/rise
Step 1: Measure the rise (difference in height between 2 points)Step 2: Measure the run (the distance between 2 points).Step 3: Make sure that you convert the scale into metres

Types of Slopes
If a slope is not Convex (A) and Concave (B), it is then Linear (C)
Contour lines and slopes

The picture below shows you what an area would look like in real life and as contour lines on a map. Notice the closer the lines are together, the steeper the ground is.
Construct a transect
A transect is a line following a route along which a survey or observations are made. The transect is an important geographic tool for studying changes in human and/or physical characteristics from one place to another.
An urban transect, usually following a street or several streets, may show changes in land use, the nature of buildings such as houses and shops, or features such as schools, churches, community centres, and parks.
A rural transect might follow a road, section line, or stream, and show the kinds of crops in adjoining fields, farm buildings, vegetation, or changing features along a riverbank.
Transects may show features that are along the actual line selected (line transect) or, more commonly, may show what is on either side of the line (belt transect). Depending on the kinds of features being observed, transects can be a single straight line, straight line segments, or curved lines.
Next is a sample transect. It is a strip of land used to monitor plant distribution, animal populations, etc, within a given area.Transects are just long, narrow, quadrats. They show changes in vegetation communities such as down a slope or across a valley.

If you were mapping vegetation communities from the vertical aerial photograph below, an experienced veg. mapper may pick different communities at A,B,C and D. To check your accuracy you need to do a field survey to 'ground truth' your work.
You have chosen to do 3 transects going across the hill in the vicinity of A to C. You need to do a number of transects, by doing only one you may miss important plant species. Once you have selected areas which represent your different plant communities, you need to randomly select a number of transects so you do not have a biased survey.
To do this go to the map at the bottom of this page, click on the transect line and drag it to the vicinity of the transect area of A, B and C then drop the transect line without looking at the map. Record your results.
Suggestions for Students:
Planning: Select the transect route carefully and identify the start and end points. It is important to be familiar with the transect route to ensure that it passes through a variety of zones so that the completed transect will provide meaningful information.
Mapping: Once the route has been selected, it should be drawn carefully on an appropriate map of the area of interest. Then, follow the route and, on the field copy of the map, note the features that you see as you progress along the selected line. This will be the first draft of your transect. It’s a good idea to write brief notes on what you see along the way to ensure that you have all the information you will need to complete the transect.
Creating: Now it’s time to prepare the final presentation of the transect. Once back in the classroom, copy the route onto a new map and, using appropriate symbols and shading, show the features and changes along the route. Brief notes can be written in appropriate spaces on either side of the features and symbols along your transect route. Make sure that the transect presentation has a title and legend.
Analyzing: The completed transect can be used to analyze the changes and the possible relationships between physical and human features along the route. If another student has selected the same route or segment of a route, the two transects can be analyzed in terms of the similarities and differences and the varying perceptions that different people may have of the same area

Describe and explain relationships on a map

What are relationships?Relationships are interactions between the natural environment and the physical environment.
You will be expected to identify the differences within that natural environment namely: relief (mountains/hills, slopes, valleys, plains), natural vegetation cover, soils aspect, climate and drainage.You will also be expected to identify the impact that natural and physical
For exampleIdentifying the various physical characteristics such as economic and human aspects that are not natural (human landscape namely: agriculture, forestry, fishing, mining/quarrying, settlement, transport and communication.)
Identify the different human factors. See how the physical factors influence human activities.
Examples: drainage (lake) or fishing.
It should be noted that Man’s activities are largely determined by the environment.
Our relationship is a strong physical to human connection.
Human activities modify the landscape through construction, settlement, transport and communication i.e. man and land use.
This relationship is human-to-human connection.
IMPORTANT: However the relationship could be either positive or negative.
Basically there are three types of relationships to be identified.1. Physical factors influencing physical features.2. Physical factors influencing human activities.3. Human factors influencing human activities
Read and interpret synoptic charts

Synoptic charts are simply weather maps. Synoptic charts show the atmospheric conditions of a location on a particular day including rainfall, air pressure (atmospheric pressure), wind speed and wind direction
Firstly, air pressure means the weight of the air.
• Air pressure is measured in hectoPascals (hPa) and indicated by isobars which are lines joining places of equal pressure.
• High air pressure (> 1013 hPa) means the air is heavy/sinking; associated with calm conditions and fine weather; winds move in an anti-clockwise direction in the southern hemisphere.
• Low air pressure (< 1013 hPa) means the air is light/rising; associated with unstable conditions and rainy weather; winds move in a clockwise direction in the southern hemisphere.
A front is the boundary between two air masses.
A cold front is when a mass of cold air moves towards a mass of warm air pushing it upwards and is indicated by a line with spikes (think of freezing cold icicles); generally brings north or north west wind and a drop in pressure leading to falling temperatures, wind and rain but this depends on the actual temperature and water content of the air masses, which depend on the region over which the air masses originate.
A warm front is when a mass of warm air moves towards a mass of cold air pushing it downwards and is indicated by a line with bumps (think of melting icicles); moves at half the speed of a cold front; warm fronts generally occur in high latitudes and are not common in Australia
A trough is an elongated area of low pressure extending out from the centre of the pressure system.