© washington state university-20101 fundamental exam review toc philosophy segment the theory of...
Post on 21-Dec-2015
218 views
TRANSCRIPT

© Washington State University-2010 1
Fundamental Exam Review
TOC Philosophy Segment
The Theory of Constraints
[email protected]://www.engrmgt.wsu.edu/
James R. Holt, Ph.D., PEProfessor
Engineering Management

© Washington State University-2010 2
Larger ProcessInput Output
Input Process Output Input Process OutputInput Process Output
Process Theory
Input Process Output

© Washington State University-2010 3
Systems Concepts
• Organizations / Systems exist for a purpose
• That purpose is better achieved by cooperation of multiple, independent elements linked together
• Each Inter-linked event depends in some detail upon the other links.
• The system owner determines purpose

© Washington State University-2010 4
There is a “Weakest Link”
• Different link capabilities, normal variation and changing workload make it impossible to balance everything.
• One element of the system is more limited than another.
• When the whole system is dependent upon the cooperation of all elements, the weakest link determines the strength of the chain.
100

© Washington State University-2010 5
Interconnections are non-Trivial
• Every Systems have relatively few constraints The generic problem with physical systems The Five Focusing Steps The Generic Physical Solution
• Physical and Non-Physical Processes Flow systems (I, A, V, T structures / combinations) Distribution and Supply Chain Management control of these systems

© Washington State University-2010 6
Interconnections are non-Trivial
• A simple chain over simplifies reality
• Link 1 has a relationship with Link 5
• Link 5 has a different relationship with 1
1 2 3 4 5 6 7 8 9

© Washington State University-2010 7
Management of the Links Vs. Linkages
1 2 3 4 5 6 7 8 9
• Maybe the Simple Chain isn’t so simple
Link 1 and 2 can get togetherand lean on Link 3 or Link 8
Link 8 and 9 can combine to push on both Link 6 and Link 7
There are 40,000 first order effects
and 1,000,000+second and higher
order effects!

© Washington State University-2010 8
Traditional Approach:Divide and Conquer
• Division of Labor breaks down linkages complex systems into manageable chunks.
• Which is harder to manage? Left or Right?
Left Right

© Washington State University-2010 9
Complexity Simplicity
• Controlling many independent parts requires many independent control mechanisms.
• Controlling many interconnected parts only requires controlling the one part (for few parts) that determine the resulting actions of the rest of the parts (Steering, Accelerator and Brake).
• Find the Constraint to the System and Every System is Simple.

© Washington State University-2010 10
The Five Focusing Steps
Step 1. IdentifyIdentify the system’s constraint.
Step 2. Decide how to Decide how to ExploitExploit the system’s constraint.
Step 3. SubordinateSubordinate everything else to the above decision.
Step 4. ElevateElevate the system’s constraint.
Step 5. WARNING, WARNING! If a constraint is broken, go back to Step 1. But don’t allow InertiaInertia to become a constraint.

© Washington State University-2010 11
The Problem: People Measure Operational Efficiency
• Work flows from left to right through processes with capacity shown.
Process A B C D E
RM FG
CapabilityParts 7 9 5 8 6per Day
Excellent Efficiency--Near 100%Chronic Complainer
Too Much Overtime
MarketRequest
11
© Washington State University-2010 12
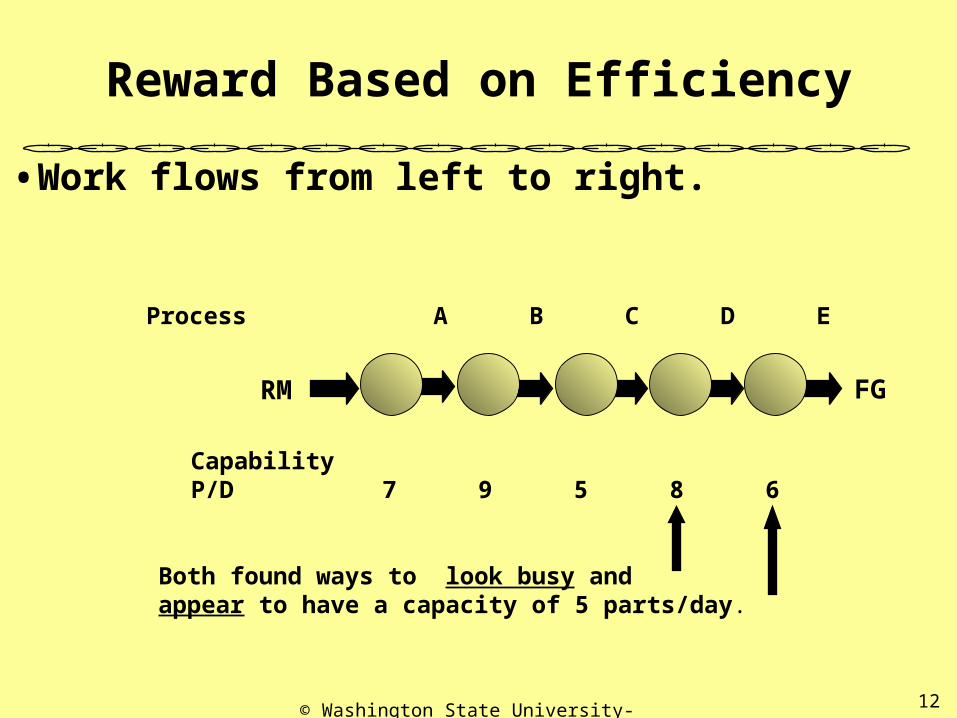
Reward Based on Efficiency
• Work flows from left to right.
Process A B C D E
CapabilityP/D 7 9 5 8 6
Both found ways to look busy and appear to have a capacity of 5 parts/day.
RM FG

© Washington State University-2010 13
What Happens In Reality...
Process A B C D E
PotentialP/D 7 9 5 8 6
Reality 5 5 5 5 5
• Processes A and B won’t produce more than Process C for long.
RM FG

© Washington State University-2010 14
Then, Variability Sets In
• Processing times are just AVERAGE Estimates
Process A B C D E
Reality 5+/-2 5+/-2 5+/-2 5+/-2 5+/-2
RM FG

© Washington State University-2010 15
What’s an Average? 50%
Process A B C D E
Reality 5+/-2 5+/-2 5+/-2 5+/-2 5+/-2Probability 0.5 0.5 0.5 0.5 0.5
• Half of the time there are 5 or more per day at each process--Half the time less
• Probability of being 5 or more on the same day:
Two at a time: 0.25 0.25
Over all: 3% Chance of 5 per day
RM FG

© Washington State University-2010 16
Traditional Solution: Add Inventory
WIP 5 5 5 5 5 Total 25ProcessA B C D E
Variable 5+/-2 5+/-2 5+/-2 5+/-2 5+/-2Process
• Put a day of inventory at each process!
RM FG
© Washington State University-2010 17
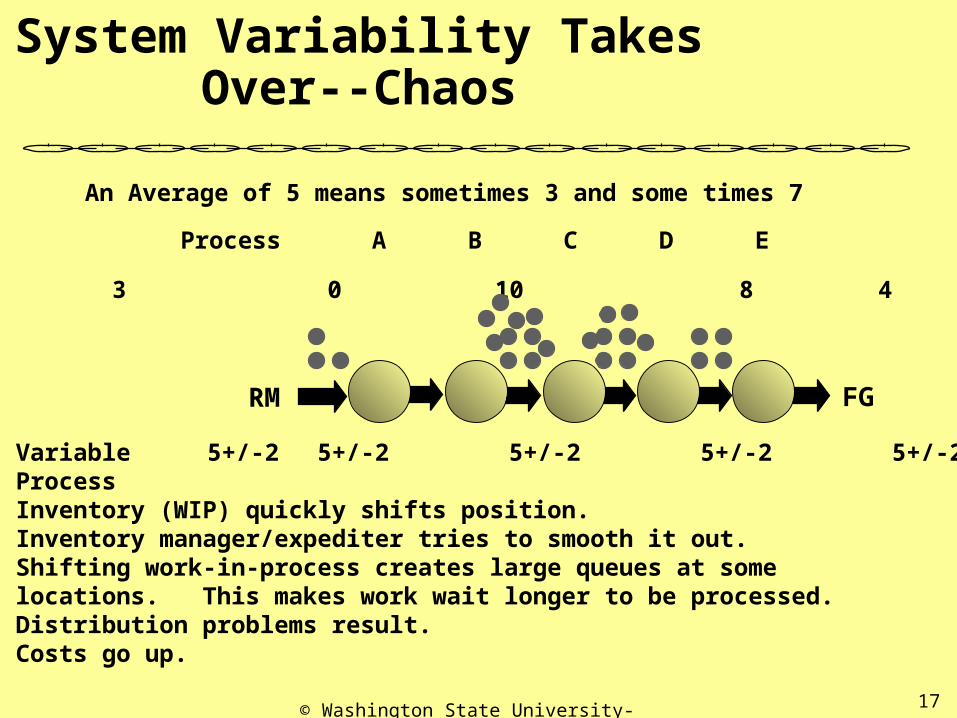
System Variability Takes Over--Chaos
WIP 3 0 10 8 4 Total 25
Variable 5+/-2 5+/-2 5+/-2 5+/-2 5+/-2ProcessInventory (WIP) quickly shifts position.Inventory manager/expediter tries to smooth it out.Shifting work-in-process creates large queues at somelocations. This makes work wait longer to be processed. Distribution problems result.Costs go up.
RM FG
An Average of 5 means sometimes 3 and some times 7
Process A B C D E

© Washington State University-2010 18
System Variability Leads to Starvation
WIP 3 0 10 8 4 Total 25
Variable 5+/-2 5+/-2 5+/-2 5+/-2 5+/-2ProcessSome workstations can be starved for work. Management hates to pay for idle resources.So...
RM FG
Process A B C D E

© Washington State University-2010 19
Starvation Leads to More Inventory
WIP 3 5 10 8 4 Total 25
Variable 5+/-2 5+/-2 5+/-2 5+/-2 5+/-2ProcessSo… Management Helps! Management puts in more work(Inventory) to give everyone something to do! Result: It takes longer and longer from time of releaseuntil final shipping. More and more delay!
RM FG
Process A B C D E
X 30

© Washington State University-2010 20
Attempts to Control WIP
WIP 5 5 5 5 5 Total 25ProcessA B C D E
Variable 5+/-2 5+/-2 5+/-2 5+/-2 5+/-2ProcessJust-In-Time uses Kanban Cards to limit the queuesbuilding in the system. No more than 5 parts are allowed at any station.Looks good, but is it?
• Put a Lid on It-Use Kanban Cards-JIT
RM FG

© Washington State University-2010 21
Effects of Inventory Limits on Production
WIP 5 5 5 5 5 Total 25ProcessA B C D E
Variable 5+/-2 5+/-2 5+/-2 5+/-2 5+/-2Process
• What does a Kanban card of 5 Mean?
RM FG
5+/-2Average = 5
BeforeKanban
5+/-2Average = 3.5
Can’t exceed
5
AfterKanban

© Washington State University-2010 22
Operation’s Dilemma
Injection: Put a large inventory where its needed and low inventory everywhere else!
Manage productioneffectively
Produce a lot
Costs & delivery in
control
Increase work-in- process
Decrease work-in-process
Assumption:
We can’t both increase WIP and decrease WIP at the same time.

© Washington State University-2010 23
The Five Focusing Steps
Step 1. IdentifyIdentify the system’s constraint.
Step 2. Decide how to Decide how to ExploitExploit the system’s constraint.
Step 3. SubordinateSubordinate everything else to the above decision.
Step 4. ElevateElevate the system’s constraint.
Step 5. WARNING, WARNING! If a constraint is broken, go back to Step 1. But don’t allow InertiaInertia to become a constraint.

© Washington State University-2010 24
The Five Focusing Steps Applied to Flow Operations
A B C D E
7 9 5 8 6
WIP Total
Step 3. Subordinate Everything Else (Rope)
Step 4. Elevate the Constraint ($?)
X 5.5
Step 5. If the Constraint Moves, Start Over
XXX7
Five Focusing Steps
RM
Step 1. Identify the Constraint (The Drum)
FG
Step 2. Exploit the Constraint (Buffer the Drum)
12 12

© Washington State University-2010 25
FG
Understanding Buffers
A B C D E
7 9 5 8 6
RM
• The “Buffer” is Time! • In general, the buffer is the total time from work release
until the work begins work at the constraint.• Contents (positions of the WIP) in the buffer ebb and flow
over time.• If different items spend different time at the constraint, then
number of items in the buffer changes depending upon product mix.
• But, the “Time in the buffer remains constant”“Time in the buffer remains constant”.
WIP Total 12/5=2.5 Days

© Washington State University-2010 26
We need more than one Buffer
FG
A B C D E
7 9 5 8 6
RM
There is variability in the Constraint. To protect our delivery to our customer we need a finished goods buffer.
Finished Goods Buffer
There is variability in our suppliers.We need to protect ourselves from unreliable delivery.
Raw Material Buffer

© Washington State University-2010 27
Buffer Time is Constant-Predictable
FG
A B C D E
7 9 5 8 6
RM
Finished Goods Buffer
Constraint Buffer
2.5 Days
Raw Material Buffer
Finished Goods Buffer1 Day
Processing Lead Time is Constant!
Raw Material Buffer2 Days

© Washington State University-2010 28
FG
Capacity Constrained Resource Buffer Management
A B C D E
7 9 5 8 6
RM
Constraint Buffer WIP Total 12/5=2.5 Days
Time until Scheduled at Constraint
0 2.5 Days
WO17
WO14WO15WO16
WO10WO11WO12WO13
WO18WO19
• The Constraint is scheduled very carefully
• Buffer Managed by location• Individual activities in the
buffer are not scheduled
WO21WO20

© Washington State University-2010 29
A B C D E
FG
Problem Identification
7 9 5 8 6
RM
Time until Scheduled at Constraint
02.5 Days
WO10
WO20 WO12WO13WO21
WO15WO16WO17
WO18
WO19Delayed
PartsWO11
WO14WO19
WO19 OK (GreenGreen)
Watch WO14 (YellowYellow))
Constraint schedule is in jeopardy!
(RedRed Zone Hole)
RM

© Washington State University-2010 30
The TOC Approach to Solving Problems
• The Five Focusing Steps are a Subset of the Three Main Questions What to Change?
• This question deals with finding the Constraint of the System.
What to Change to?• This question deals with what is needed to solve the
problems. How to Cause the Change?
• The emphasis on the last question is ‘cause’. What few actions will we do to cause the system to change itself.

© Washington State University-2010 31
Conflict Management
• Conflicts Exist. They are evidence improvement is needed (conflicts are problems). What to change? What to change to? How to cause the Change?
• A well worded Conflict is half the Battle.
• Conflict is based upon a mutually desirable Goal
• Conflict is based upon different Needs requiring different Actions
• The different Actions are opposites (The Conflict)

© Washington State University-2010 32
The Evaporating Cloud
A. The Goal
B. My Need
C. Other’s Need
D. What I Want
D’. What the
Others Want

© Washington State University-2010 33
Creating the Evaporating Cloud
D. What I Want
1. What is it that I Want (that I’m having trouble getting)?

© Washington State University-2010 34
Creating the Evaporating Cloud
D. What I Want
D’. What the
Others Want
1. What is it that I Want (that I’m having trouble getting)?
2. What is it that the Others Want (that I don’t want them to have)?

© Washington State University-2010 35
Creating the Evaporating Cloud
B. My Need
D. What I Want
D’. What the
Others Want
1. What is it that I Want (that I’m having trouble getting)?
2. What is it that the Others Want (that I don’t want them to have)?
3. Why do I want what I want? What Need am I trying to fulfill?

© Washington State University-2010 36
Creating the Evaporating Cloud
B. My Need
C. Other’s Need
D. What I Want
D’. What the
Others Want
1. What is it that I Want (that I’m having trouble getting)?
2. What is it that the Others Want (that I don’t want them to have)?
3. Why do I want what I want? What Need am I trying to fulfill?
4. Why do the Others want what they want? What Need do they have?

© Washington State University-2010 37
Creating the Evaporating Cloud
A. The Goal
B. My Need
C. Other’s Need
D. What I Want
D’. What the
Others Want
1. What is it that I Want (that I’m having trouble getting)?
2. What is it that the Others Want (that I don’t want them to have)?
3. Why do I want what I want? What Need am I trying to fulfill?
4. Why do the Others want what they want? What Need do they have?
5. What Goal do we mutually share? Why are we still arguing?
Reading the Cloud:In order to <point> I must have <tail>.

© Washington State University-2010 38
Let’s Do Some Examples
A. We all are ready for the Fundamental
Exam
B. Learn a lot about
what I wnat
C. Get through all the topics
D. I want to ask a lot of questions
D’. Depack doesn’t take
over.

© Washington State University-2010 39
The Approach to Solving Problems
• There are Three Main Questions What to Change?
• This question deals with finding the Constraint of the System.
What to Change to?• This question deals with what is needed to solve the
problems. How to Cause the Change?
• The emphasis on the last question is ‘cause’. What few actions will we do to cause the system to change itself.

© Washington State University-2010 40
Communicating the Evaporating Cloud
A. The Goal
B. My Need
C. Other’s Need
D. What I Want
D’. What the
Others Want
5. And you WANT to meet your Need as well.
3. Acknowledge the Other side Wants to act on meeting their Need.
4. Point out that you also have a significant Need.
2. Recognize you understand the Other’s Need must be meet to reach the Goal.
1. Start the Mutual Goal. It is common ground. Both interested.
Reading the Cloud:In order to <point> I must have <tail>.

© Washington State University-2010 41
Evaporating the Evaporating Cloud
A. Manage Production Effectively
B. Produce a
Lot
C. Keep Costs and Delivery
in Control
D. Increase the Work-In-
Process
D’. Decrease
the Work-In-Process
Assumption: We are measured upon our Production Level
Assumption: All machines must be keep busy all the time.
Assumption: We can’t increase WIP and Decrease WIP at the same time.
Assumption: WIP is expensive. High WIP delays flow time.
Assumption: Our profits are not high. Customers demand on-time delivery.

© Washington State University-2010 42
Jobs Process Flow
Projects Are Handled the Same Way
A B
C D
Type I A->B->C->D
Type III A->B->B->DType IV C->B->A->B
Resources A, B, C, D each receive work as it flows in different patterns
Each Job type has four days of processing for the four resources.Hum? Release one job per day and every body is busy. Right?
Type II C->A->B->D

© Washington State University-2010 43
TDD=Effectiveness in DeliveryIDD =Effective use of resources (and tracking improvements)
Projects Are Handled the Same
Jobs Process FlowA B
C D
Type I A->B->C->DType II C->A->B->DType III A->B->B->DType IV C->B->A->B
There are 16 processes on the 4 job times but 6 of them go through B. C and D only have 3 processes.
Internally, B is the constraint. We can treat it just like the product line

© Washington State University-2010 44
Projects are Balancing Acts
Quality andScope
Timing andSchedule
BudgetedCosts

© Washington State University-2010 45
Then things Combine
Precedence Structure
Statistical Variation
HumanBehavior
Quality andScope
Timing andSchedule
BudgetedCosts

© Washington State University-2010 46
And Reality Sets In
Quality andScope
Timing andSchedule
BudgetedCosts
Precedence
Structure
Statistical Variation Human
Behavior
Bumpy Road of Reality

© Washington State University-2010 47
The Project Dilemma
• There is Always a Trade-Off
Meet Original Commitments
Meet Commitment
in Danger
Compensate for Early Mis-
Estimates
Not Jeopardize
Other Original Commitments
Not Compensate for Early Mis-
estimates

© Washington State University-2010 48
Resolving Project Problem Options
Meet Original Commitments
Meet Commitment in
Danger
Compensate for Early Mis-Estimates
Not Jeopardize Other Original Commitments
Not Compensate for Early Mis-
estimates
Add more time&money and decrease scope
Use our Safety Buffer Correctly

© Washington State University-2010 49
Consider the Aspects of Projects
Good Statistics
Central Limit Theorem(add enough things together and everything looks normal)

© Washington State University-2010 50
Typical Activity Duration
Mean
Standard Deviation
Normal Duration Time
Mean50% Probable
85% Probable
Project Task Duration Time

© Washington State University-2010 51
So, what is the Behavior?
•Engineering Pessimism:Estimate a safe value (85%)
Assigned Date
Time-->
•Parkinson's Law: WorkExpands to full the time available (Just keep tweaking! More is better!)
•Engineering Optimism:I’m good, I can beat 50%.
Level of Effort
•Student Syndrome: “Why start now? It isn’t due until Friday?” (There is more urgent work/parties.) •Empirical evidence
shows most tasks complete on or after the due date

© Washington State University-2010 52
Engineering Perpetual Motion (overtime)
Assigned Date
Time-->
Level of Effort
NormalWork Load
Actual Work Load

© Washington State University-2010 53
The result is Bad Multi- Tasking
A1
A2A3
B1
B2B3
Ten Days Each Task
Project Manager A
Project Manager B

© Washington State University-2010 54
Politically Correct Schedule
A1 A2 A3
B1 B2 B3
10 20 30 40
30 Days Flow
50

© Washington State University-2010 55
More Like Actual Schedule
A1 A2 A3
B1 B2 B3
10 20 30 40
40 Days Flow
50

© Washington State University-2010 56
Elements of the Project Management Solution
• Prioritize
• Don’t Schedule Conflicts
• Avoid Bad Multi-Tasking
• Don’t Release Too Early/Too Late
• Buffer Critical Chain Buffers: Project / Feeding / Resources
• Schedule 50% Estimate Completion
• Communicate “Time Remaining”
• Negotiate Capability Not Dates
• No Milestones

© Washington State University-2010 57
TOC Flow Time
A1 A2 A3
B1 B2 B3
10 20 30 40
20 Days Flow
50

© Washington State University-2010 58
Don’t Schedule Conflict
Before
After TOC Leveling

© Washington State University-2010 59
Buffer the Project and NOT Individual Activities
Before with 85% Estimates
TOC Aggregated Buffer of Activities
Task Task Task Task Buffer
Task Buffer
Actual 50% Estimates with Individual Buffers

© Washington State University-2010 60
Protect the Critical Chain
Project Buffer
Feeding Buffer

© Washington State University-2010 61
Buffer Resources on the Critical Chain
Project Buffer
Feeding Buffer
Lt. Green be readyBuffer
Blue be ready
Green be ready
Cyan Resource be ready

© Washington State University-2010 62
The Simple Line Diagram Was Too Simplistic
RM FG
Aircraft assembly is more of an “A” Plant
RMRM
RMRM
RM
RM
RMRM
RM
FG

© Washington State University-2010 63
The “A” Plant Has Some Long Duration Processes
RMRM
RMRM
RM
RM
RMRM
RM
FG

© Washington State University-2010 64
Pull Tight the Longest Path (and Shake)
RM
RM
RM
RM
RMRM
RM
FG
RM RM
Fastest Possible Flow Time (Critical Path)
Critical Assembly Joins

© Washington State University-2010 65
How Could we Fairly Measure Feeder Chains?
RM
RM
RM
RM
RMRM
RM
FG
RM RM
TDD-On Missed Delivery to main line
IDD-On Effective Use of Resources (and monitoring improvements) Hum? Could this also
apply to suppliers?

© Washington State University-2010 66
There is an Injection for Every Conflict
• Arrow Assumption Injection
• ABProductive Deliver Max Capacity
• ACCost Effective Price on Value
• BDBusy Machines Keep Constraint 100%
• CD’ Expensive WIP Throughput Focus
• D/D’ Can’t do Both Buffer Constraint only
Chosen Injection:Focus on the Capacity Constrained Resource. Release work to the system at the rate of the Capacity Constrained Resource a Buffer Time in Advance (no sooner, no later).Use Buffer Management to improve the system.

© Washington State University-2010 67
The Key Points of TOC Solutions
• TOC only accepts Win-Win Solutions Win-Lose, Lose-Win, Lose-Lose are
unacceptable.
In the Evaporating Cloud, The Goal is achieved! Usually, both sides needs are met.
Everyone is happy.• Stake Holders, Employees, Customers, Economy,
Ecology, Behaviors, Friendships (even competitors benefit).

© Washington State University-2010 68
Sometimes TOC Solutions Are Counter Intuitive
• DBR: To get more out, put less in.
• CCPM: To finish project sooner, delay the Start.
• CCPM: To be safer, remove the safety.
• Replenishment: To get your products quicker to the customer, store them farther away.
• To Solve the Conflict, Ignore the conflict.
• To Make More Money, Sell at below Cost.
If you can’t find an injection, then just do what is opposite of what everyone else is doing (and do whatever it takes to make it work).
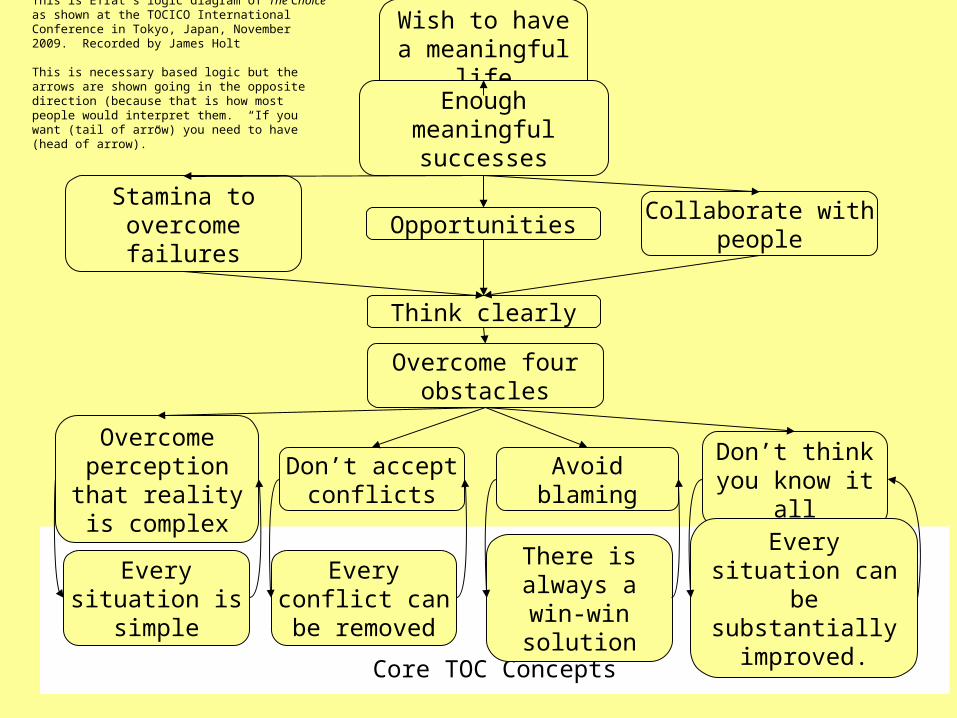
Core TOC Concepts
Wish to have a meaningful life
Enough meaningful successes
Stamina to overcome failures
OpportunitiesCollaborate with
people
Think clearly
Overcome four obstacles
Don’t accept conflicts
Overcome perception that
reality is complex
Don’t think you know it all
Avoid blaming
Every conflict can be removed
Every situation is simple
Every situation can be substantially
improved.
There is always a win-win solution
This is Efrat’s logic diagram of The Choice as shown at the TOCICO International Conference in Tokyo, Japan, November 2009. Recorded by James Holt
This is necessary based logic but the arrows are shown going in the opposite direction (because that is how most people would interpret them. “If you want (tail of arrow) you need to have (head of arrow).”

© Washington State University-2010 70
Next Topics
• TOC Thinking Processes
• TOC Applications Operations Project Management Replenishment
• TOC Finances and Measures
• Some TOC Philosophy will be blended into these additional topics.