~~. :: ,voffendersadmitted to … j i ,-----offenders admitted to wisconsin adult correctional...
TRANSCRIPT
- -----J...', >~:,~.~,-}.~,":, .. ". '"7': ,'." :
:'. ·,'hi;'_-f.,..J ;~' -
. ~'
"'~~." ::........ .... ;': ". ".
\ i" . '" .'. " .... ..... . ....... :. ",vOFFENDERSADMITTED TO ADULICORRECTJONAL l TITUTIONS" .'
CALENDAR~
'0
. DEPARTMENT OF HEALTH ANDSOGIAL SERVICES
DivISION OF CORRECTIONS . .
OFFICE OF INFORMATION MANAGEMENT [.', '. , ~.~
,MADISON,," WISCONSIN 53707
I ' •• ,
STATISTICALBULLETINC-53 JULY 1980 '0 .
"
If you have issues viewing or accessing this file, please contact us at NCJRS.gov.

i '. I •
# If "
'. , , S TA IE 0 F <J ~f I S CO NS IN
t)
lIPARTIVE!~T OF HEALTH.AND SOCIAL SERVICES,
lliNALD E. PERCY, SECRETARY "
. DIVISIONOF'CORRECnONS (,
ELMER O.CADv, ADMINIsTRATOR
LEE ROY 13LAC«)·PH;D., DEPlITYAnMINlsTRATOR
\V ~', STEVE H, KRONZER, Assl STANT I\nMI N I STRATOR
, DFFI CE OF INFOf<ri\l\TI ON . f>1ANAEHtfNT "
PAutH, KUSUDA) INTERIM DIRECTOR , ' " ~ .
.' . I'. . .
TED . H. JOHNSON, ·SYSTEMS ANn f~GEMENTANALYSIS SEcn ON
'.' CARL .F. SAM) OPERATIONS St:CTlONS
. {I
,',,'
, I
. )
Ij ~ ,I , j 1

fA! C .. ./ 1~ ~ -"
AUG 19 . .. 1980
TABLE OF CONTENTS
1979 Highlights, Admissions 1
Table 1 Admission Status, Residents First and Rea~mitted 7
Table 2 Type of Commitment, Residents First and Readmitted 8
Table 3 Offense, Residents First and Readmitted 9
Table 4 Length of Sentence, Residents First and Readmitted 12
Table 5 Plea and Sentencing, Residents First and Readmitted 13
Table 6 County of Commitment, Residents First and Readmitted 14
Table 7 Age, Residents First and Readmitted 16
Table 8 Race, Residents First and Readmitted 17
Table 9 Marital Status, Residents First and Readmitted 18
Table 10 Previous Felony Convictions, Residents First Admitted 19
Table 11 Previous Penal Experience, Residents First Admitted 19
Table 12 Juvenile Institution Experience, Residents First Admitted 20
Table 13 Grade Completed, Residents First Admitted 20
Table 14 Achievement Tests, Residents First Admitted 21
Table 15 Intelligence Estimates, Residents First Admitted 21
Table 16 Average (Mean) Length of Sentence for Selected Offenses 22
dw/5
j

I
,-----------------------------------
Offenders Admitted to
Wisconsin Adult Correctional Institutions
Calendar Year 1979
HIGHLIGHTS
Admission Status: About 80 percent of all admissions were first admissions,
representing 1,248 offenders. Males represented 93.9 percent of those first
admitted or 1,172 persons, while 6.1 percent were females (76 offenders).
About 63 per.cent of the first admissions were offenders with a ne.w sentence and
were not probation violators. Another 30 P"-.':-('.ent were probation violators <lith
new sentences. A smalJ proportic:n, 5.2 per('ent, was re.ported as probation
violators without new sentences.
All but 7 of the 304 readmissions (97.7 percent) were meuo About 21 percent
were parole violators without a new sentence, 36 percent were mandatory relense
violators without a new sentence, 16 percent, parole violators with a new
sentence, and 22 percent, mandatcry release violators with a new sentence.
Type of Commitment: Adult felony commitments constj_tuted 98~5 percent of the
first admissions and 96.4 percent of the readmissions. Only one ease was
reported as a sex crimes commitment.
Offense: Burglary was the most common offense category for first and readmitted
men. Forgery was the most common offense among women. First admissions were
made up of 30 percent person offenses (murder, assaults, robbery, etc.), 7
percent sex-related offenses (sexual assaults, sexual perversion, etc.); 6
percent drug related offenses, and 57 percent property-related offenses
(burglary, auto theft, arson, etc.).
Length of Sentence: Sentences of less than two years were received by 15.1
percent of total first admissions; of two years, less than three, by 25.4
percent; of three years, less than four, by 20.7 percent; of four years, less
1

2
than six, by 20.4 percent; and of six years, less than life, by 16.1 percent.
The median sentence was 35.9 months for all first admissions. The median for
men was 36.0 months and for women, 30.9 months.
The average (mean) sentence was 50.1 months for all first admissions, men having
a 50.8 month average and women, 38.8 months. (The average was computed after
deleting data for offenders with an offense of first degree murder and the
temporary admissions.)
Among readmissions, 9.6 percent received sentences of less than two years; 15.1
percent, two years, less than three; 18.8 percent, three years, less than four;
29.6 percen~ four years, less than six; and 24.6 percent, six years, less than
life. The median sentence was 59.5 months for mp.T! and 63.0 months for women.
The average (mean) sentence was 48.0 months for men and 39.0 months for women.
Plea and Sentencing: Over 77 percent of the first admissions entered guilty
pleas. About 49 percent received a single sentence; 24 percent, concurrent
sentences; and 4 percent, consecutive sentences.
Six of the Seven readmitted women and 86 percent of the readmitted men pleaded
guilty; 25 percent received a single sentence, and 56 percent, concurrent
sentences.
County of Commitment: Milwaukee County accounted for 42.5 percent of all
admissions in 1979 with 659 commitments (520 first admissions and 139
readmissions). By region, Milwaukee (Region III) accounted for 41.7 percent of
the first admissions and 45.8 percent of the readmissions. Region I (Southern
Region), containing 12 counties, accounted for 12.3 percent of the first
admissions and 12.8 percent of the readmi$sions.
Region II (Southeastern Region), containing six counties, had 16.3 percent of
the first admissions and 16.1 percent of the readmissions.
Region IV (Eastern Region), representing 16 counties and the Menominee
Reservation, had 13.9 percent of the first admissions and 11.5 percent of the
readmissions.
>\ <:~ ;' ~:~ ~ . ':.:1- -,'.~

3
Region V (Western Region), representing 19 counties, had 7.5 percent of the
first admissions and 8.9 percent of the readmissions.
Region VI (Northern Region), with 17 counties, had 8.3 percent of the first
admissions and 4.9 percent of the readmissions.
Age: The majority of first-admitted men were under the age of 25, with 23.5
percent under 20 and 39.1 between 20 and 24. An additional 17.2 percent fell
between the ages of 25 and 29. The 20 through 24 year category was the largest
for women also, accounting for 40.8 percent of the first admissions. About: i3
percent of the women \o,Tere aged 19 or under ~ 18.4 percent were 25 thro~~gh 29, dud
9.2 percent were 30 through 34. Only 6.9 percent of those first-admit"Ced :;nd
10.9 percent of these readmitted were 40 or IWI,'r..
About three-fifths of the readmitted men were 29 and younger with most, about 35
percent, 20 through 24 years, and 24.6 percent aged 25 through 29. About 20
percent of the readmissions were men aged 30 through 340
The average (mean) age for first admissions was 25.1 for men and 27.1 for. women.
The average for readmissions was 29.1 for men and 27.0 for women.
Race: Total first admissions were comprised of 60.8 per~ent White, 3.0 percent
White of Mexican origin, 36.2 percent Black, and 3.3 percent Native American
offenders. Whites (including 3.3 percent of Mexican origin) constituted 56.6
percent of the readmissions; Blacks, 39.1 percent; and Native Americans, 3.6
percent.
A larger proportion of the female first admissions was Non-White than reported
for males (51.3 percent compared to 35.2 percent). Black women constituted 48.7
percent of the first admissions and 57.1 percent of the readmissions.
Marital Status: About 84 percent of first-admitted men were single. Of those,
69 percent were never married, 10 percent were divorced, 4 percent were
separated, and almost one percent were widowed. Nearly 54 percent of the women
were never married; 16 percent, divorced; 1 percent, separated; and almost 4
percent, widowed.

4
Among readmissions, 83 percent of the men and 72 percent of the women were
single.
Previous Felony Convictions: Of the first-admitted men, 50.7 had no recorded
previous felony conviction, 26.1 percent had one previous conviction, 13.3
percent had two, and 9.0 percent had three or more. About 79 percent of the
first-admitted women had no previous conviction.
Previous Penal Experience: Over 62 percent of first-admitted men had no
previous penal experience. About 37 percent had previous penal experience, most
(17 -percent) in a Wisconsin correctional institution. A, additional 8.6 percent
had been ir, prisons or reformatories in other states. OnL .. '>.2.4 percent of the
WOmen had previous penal experience, 14.5 percent haVing been in a Wisconsin
correctional institution.
Juvenile Institution Expeti:./2.!!~: About one-fourth of first-admitted men had
juvenile institution experience--23.9 percent in Wisconsin institutions and 2.2
percent in institutions in other states. Only 13.1 percent of the women had
juvenile institution experience--l1.8 percent in Wisconsin and 1.3 percent in
another state.
Grade Completed: About 30 percent of the first-admitted adults had completed
high school or post-high school grade3. Those completing ninth grade comprised
13.1 percent of the first admissions; tenth grade, 19.8 percent; and eleventh
grade, 21.7 percent. The proportion of women who completed high school waS
slightly higher than for men.
Achievement Test: Approximately one-fourth of the first admissions (25.1
percent of the men and 19.7 percent of the women) scored at the 9.S grade level
or better on achievement tests. Test Scores between 7.5 and 9.5 grade levels
were registered by 22.3 percent of the men and 25.0 percent of the women.
Scores at 7.4 and below on achievement tests were registered by 38.1 percent of
the men and 30.3 percent of the women. About 14 percent of the first admissions
were not tested during the admissions process.

5
Intelligence Estimate: About 41 percent of the first admissions were not tested
for intelligence estimates. For the total group, most men (39.3 percent) and
women (32.9 percent) were estimated to be of average or normal intelligence.
Another 11. 6 percent of the men and 9.2 percent of women Were estimated at dull
normal, while 5.1 percent of men and 3.9 percent of women were considered bright
normal.
Prepared by: Stephen M. Puckett, Planning Analyst
Office of Policy, Planning and Budget
dw/1
For: Office of Information Management
Division of Corrections
P~O. Box 7925
Madison, Wisconsin 53707

7 I Preceding page blank
TABLE 1 ADMISSION STATUS
Residents First and Readmitted to Wisconsin Adult Correctional Institutions in 1979
- . - .
FACILITIES TOTAL FOR MEN
ADMISSION STATUS NUMBER PERCENT NUMBER PERCENT
FIRST ADMISSIONS 1,248 lQ,O.O 1,172 100.0
Youthful Offenders 17 1.4 16 1.4 New Commitment (1) (0.1) (1) (0.1) Probation Violator (16) (1.3) (15) (1.3 )
New Sentence Only 781 62.6 739 63.0 New Sentence Probation Violator 371 29.7 342 29.1 New Adult Sent., Aftercare Violator 1 0.1 1 0.1 New Adult Sent., YO Parole Violator 2 0.2 2 0.2
Adult Probation Violator Only 65 5.2 64 5.5 Probation Violator Pending Revocation* 11 0.8 8 0.7
RE-ADMISSIONS 304 lQQ,Jl 121 100.0
Youthful Commitment Parole Violator 2 0.7 2 0.7 New Sentence Parole Violator 48 15.7 48 16.1 New Sent. Mandatory Release Violator 67 22.0 67 22.6
Parole Violator Only 65 21.4 62 20.9 Mandatory Release Violator Only 110 36.2 107 36.0 Youthful Offender Parole Violator 3 1.0 3 1.0 Replacement, Adult Parole Commitment 1 0.3 1 0.3 Replacement, Adult MR Commitment 2 0.7 2 0.7 Pending Revocation, Adult Parole* 2 0.7 2 0.7 Pending Revocation, Adult MR* 4 1.3 3 1.0
FACILITIES FOR WOMEN
NUMBER PERCENT
76 lQQ..&
1 1.3 (- ) (- ) (1) (1. 3)
42 55.3 29 38.2 - -- -
1 1.:.1 3 3.9
1 }oo.o
- -- -- -
3 42.9 3 42.9
- -- -- -- -
1 14.2
* Noted as "Not Reported" as to category in Tables 2, 3, 4, 5, 10, 11, 12, 13, 14, and 15.
/k
I
I I ! J

TYPE OF
FIRST ADMISSIONS
Adult Felony Adult Misdemeanor
Not Reported
RE-ADMISSIONS
Sex Deviate Adult Felony Adult Misdemeanor Not Reported
/k
8
TABLE 2 TYPE OF COMMITMENT
Residents First and Readmitted to Wisconsin Adult Correctional Institutions in 1979
FACILITIES TOTAL FOR HEN
COMMITMENT NUMBER PERCENT NUMBER PERCENT
1,248 100.0 1,172 100.0 -- --
1,229 98.5 1,156 98.6 8 0.6 8 0.7
11 0.9 8 0.7
304 100.0 297 100.0 --- -- -- --1 0.3 1 0.3
293 96.4 288 97.0 4 1.3 3 1.0 6 2.0 5 1.7
FACILITIES FOR WOMEN
NUMBER PERCENT
76 100.0 - -~
73 96.1 - -3 3.9
7 100.0 - .--- -
5 71.4 1 14.3 1. 14.3
I
'1 I
J

OFFENSE
TOTAL
Murder
First Degree <1 Second Degree Third Degree
A.ttempted Murder Manslaughter Negligent Homicide
Robbery
Unarmed Armed
Assault/Battery Aggravated Assault/Battery Injury by Conduct Regardless of Life I nj ury by Neg II gent Use of Weapon
Burglary
Armed Unarmed
TABLE 3
OFFfNSE '. ~~, ~~, ' ' ~1 Residents First ~nd Re~g~Jt~.to,
vlisconsin Adult Correctional InstfltUt'lons In t979 , It! "'!
FIRST ADMISSIONS "
FACll.ITIES FACILITIES TOTAL FOR MEN FOR WOr.£N . TOTAL
NUf'.flER P.ERCENT NUM3ER . PERClEI'tT >~M9E~ .PERCENT NUM3ER PERCENT .
1,248 100.0 1,172 100.0 :::--==;=.
7'6 100.0 304 100.0
'. 42 3.3 39 .3'.4 3 3.9 7 2.3
(21 ) (1 .6) (20) (1 .7) (I) (1.3} (4) (1, .3)
( 19) (1 .5) (7) (1.5 ) (2) (2.6) (3) (1.0) (2) (0.2 ) (2) (0.2 ) (-) (-) (-) (-)
3 0.2 2 0.2 1 1.3 - -, 12 1.0 9 0.8 3 3.9 2 0.7
9 0.7 9 0.8 - - .. -
219 17 .5 211 )8.2 8 10.5 54 17.7
(113) (9.0) (109) (9.4 ) (4) (5.3) I (34) (II./)
(106) (8.5) (102) (8.8) (4 ) (5.:n (20) (6.6)
59 4.7 55 4.7 4 5.3 14 4.6
7 0.6 (I 0.5 1 1.3 8 2.6
17 1.4 15 1.3 2 2.6 3 1.0
2 0.2 2 0.2 - - - -
362 29.0 353 30.3 9 11.9 93 30.5
(2) (0.2) I (2) (0.2) (-) (-) (2 ) (0." ) (360) (28.8) (351 ) (30.1 ) ! (9) (11.9 ) I (91) (29.8)
RE-ADMISSIONS FACILITIES FACILITIES
FOR f'vEN FOR WOMEN N~M3ER PERCENT NUMBER PERCENT
297 100.0 1: 100.0 ,hp ..
6 2.0 1 14.3
(4) (1.3) (-) (-)
(2) (0.7> (1) ( 14.3) (-) (-) (-) (-)
- - - -2 0.7 - -- - - -
53 17 .9 1 14.3
(34) (11.5) (-) H (19) (6.4 ) (1) (14.3 )
13 4.4 1 14.3
8 2.7 - -3 1.0 - -- - - -
93 31.4 - -
(2) (0.7) (-) (-)
(91) (30.7) (-) (-)

OFFENSE
Entry Into LOCked Vehicle Theft (Except Auto) ReceIvIng Stolen Property Auto Theft
Fraud Transfer of Incumbered Property Forgery I ssue of Worth l.ess Checks
Rape AttemfJted Rape 1st Degree Sexual Assault 2nd Degree Sexual Assualt 3rd Degree'Sexual Assualt 4th Degree.Sexual Assault Statutory Rape
Incest Sexual Perversion Lewd and Lascivious Behavior Indecent BehavIor With a Child
Uniform Control led Substance
Act and Other Drug VIolations
Concealed Weapon Escape Attempt (Except Murder and Rape) Arson Conspiracy Extortion
TABLE 3 (CONTINUED)
FIRST ADMISSIONS
TOTAL NUM3ER PERCENT
1 83 14 75
6 1
88 6
7 3
20 30 10 1
80
2 9
4 18
2
0.1 6.6 1 •. 1 6.0
0.5 0.1 7.1 0.5
0.6 0.2 1.6 2.3 0.8 0.1
0.1 0.1 0.1
0.2 0.7 0.3 1.4 0.1 0.2
FACiLITIES FACILITIES FOR MEN FOR WOMEN.
NUMBER PERCENT .NUMBER PERCENT
1 76 14 75
1 1
73 6
7 3
20 30 10 1
74
2 9
4 17 1 2
0.1 6.6 1.2 6.5
0.1 0.1 6.3 0.5
0.6 0.3 1.1 2.7 0.9 0.1
0.1 0.1 0.1
6.4
0.2 0.8 0.3 1.5 0.1 0.2
7 9.2
5 6.6
15 19.8
6 7.9
TOTA:" NUM3ER PERCENT
1 24
3 30
16
3
6
3
12
1 2
1 3
0.3 7.9 1.0 9.9
0.3
5.3 1.0
2.0
0.3
0.3
1.0
3.9
0.3 0.7 0.3 1.0
Rt:-ADMISSIONS FACILITIES
FOR !'-EN NUMBER .PERCENT
1 23
2 30
16 2
6
3
12
I 2 1 3
0.3 7.7 0.7
10.1
0.3
5.4 0.7
2.0
0.3
0.3
1.0
4.0
0.3 0.7 0.3 1.0
FACILITIES FOR WOMEN
NUM3ER PERCENT
14.3 14.3
14.3
OFFENSE
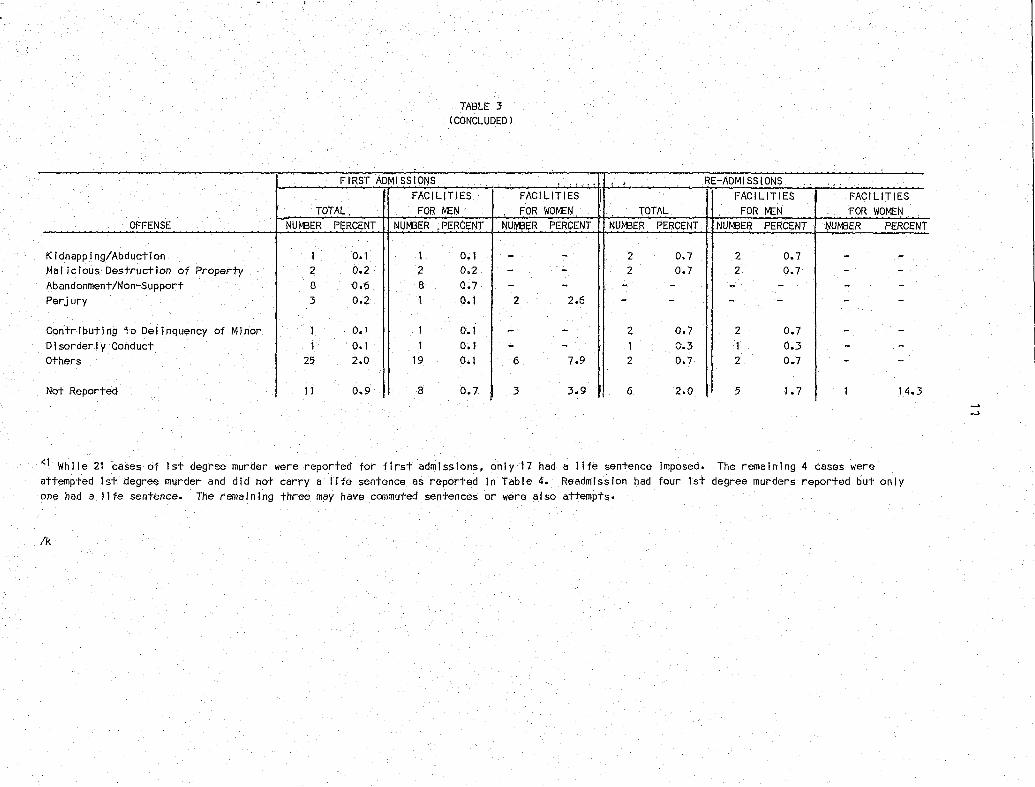
Kidnapping/Abduction Malicious Destruction of Property Abandonment/Non-Support Perjury
Contr lbut! ng '10 Del j nquency of Minor Disorderly Conduct Others
Not Reported
TABLE 3 (CONCLUDED)
FIRST ADMISSIONS , , , ,
FACILITIES FACILITIES TOTAL, FOR MEN FOR \o{DM:r:J
NUM3ER PERCI;NT NUM3ER ,PERCE:NT NU1YeER PERCENT
1 0.1 1 0.1 - -2 0.2 2 0.2 - -8 0.6 8 0.7 - -3 0.2 1 0.1 2 2.6
1 D.! 1 0.1 - -1 0.1 1 0.1 - -
25 2.0 19 0.1 6 7.9
11 0.9 8 D.7 3 3.9
, , ,RE-ADMISSIONS " '
I FACILITIES FACILITIES TOTAL FOR !';EN FOR WOMEN
NUM3ER PERCJ;NT NUMBER PERCENT ~UM3ER PERCENT
2 0.7 2 0.7 - -2 0.7 2 0.7 - -- - - - - -- - - - - -
2 0.7 2 0.7 - -1 <>.3 1 0.3 - -2 0.7 2 0.7 - -
6 2.0 5 1.7 1 14.3
<1 While 21 cases of 1st degree murder were reported for first admissions, only 17 had a life sentence imposed. The remaining 4 cases were attempted 1st degree murder and did not carry a life sentence as reported In Table 4. Readmission had four 1st degree murders reported but only one had a life sentence. The rema I n I ng three may haVe commuted sentences or were a J so \'lttempts.
/k

LENGTH OF SENTENCE
TOTAL
Less than I year 1 Year less than 2 2 Years less than 3 3 Years less than 4 4 Years less than 5
5 Years less than 6 6 Years less than 7 7 Years less than 8 8 Years less than 9 9 Years les$ than 10
10 Years less than 15 15 Years less than 20 20 Years less than 25 25 Years less than 11 fe
Life <1 Not Reported
Mean (In months) <2
Median (in months)
<1 See footnote in Table 3.
TABLE 4 LENGTH OF SENTENCE
Residents FIrst and ReadmItted to WJsconsln Adult Correctional InSTitutions In 1979
. ,
FIRST ADMISSIONS, . . .. FACILITIES FACILITIES
,TOTAL FOB MEN F.OR WOM::N TOTAL NUtvBER PERCENT NUMBER PERCENT NUMBER PERCENT NUMBER PERCENT
1,248 100.0 1,172 100.0 76 100.0 304 100.0 = =
- - - - - - 6 2.0 188 15.1 179 15.3 9 11.9 23 7.6 317 25.4 289 24.7 28 36.9 46 15.1 259 20.7 247 2 t .1 12 15.8 57 18.8
99 7.9 91 7.8 8 10.5 40 13.2
156 12.5 145 12.3 11 14.5 50 16.4 39 3.1 38 3.2 1 t.3 15 4.9 32 2.6 32 2.7 - - 12 3.9 27 2.2 26 2.2 1 1.3 5 1.6 7 0.6 7 0.6 - - - -
53 4.2 52 4.4 1 1.3 27 8.9 20 1.6 19 1.6 1 1.3 10 3.3 9 0.7 9 0.8 - - 4 1.3
14 1.1 14 1.2 - - 2 0.7
17 1.4 16 1.4 1 1.3 1 0.3 11 0.9 8 0.7 3 3.9 6 2.0
50.l 50.8 38.8 59.5 35.9 36.0 30.9 48.0
RE-:-ADMISS1ONS : FACILITIES
FOR /.EN NUMBER PERCENT
297 100.0
6 2.0 22 7.4 45 15.2 55 18.5 40 13.5
50 16.8 15 5.1 11 3.7 5 1.7
- -
27 9.1 9 3.0 4 1.3 2 0.7
1 0.3 5 1.7
59.5 48.0
<2 The mean or average sentence does not Include persons whose offense was reported as 1st degree murder or not reported.
Ik
FACILITIES .FOB WO/.EN
NUMBER PERCENT
J. 100.0
- -1 14.3 1 14.3 2 28.5 - -
- -- -1 J 4.3 - -- -
- -1 14.3
- -- -
- -1 14.3
63.0 I 39.0

13
TABLE 5 PLEA AND SENTENCING
Residents First and Readmitted to Wisconsin Adult Correctional'Institutions in 1979
FACILITIES FACILITIES TOTAL ! FOR MEN FOR WOMEN
PLEA AND SENTENCING NUMBER PERCENT 1 NUMBER PERCENT NUMBER PERCENT
FIRST ADMISSIONS 1,248 100.0 ! 1,172 100.0 76 100.0 -- -- -I' -- --- -- --
Guilty 962 77 .1 895 76.3 67 88.2 -- -- 1 - -- - --, Single Sentence 608 48.7
I
i 566 48~3 42 55.3 Concurrent Sentence 300 24.1 ; 277 23.6 23 30.3 Consecutive Sentence 54 4.3 52 4.4 2 2.6
~ : , Not Guilty 275 22.0 I; 269 23.0 I 6 7.9 -- -- - -- - --
Single Sentence 179 14.3 i 173 14.8 ,
6 7.9 Concurrent Sentence 66 5.3 I,
1, 66 5.6 - -Consec uti ve Sentence 30 2.4 i 30 2.6 - -1 : - ..
Not Reported 11 0.9 I.
8 0.7 3 3.9 j: - -- " - - --i:
RE-ADMISSIONS 304 100.0 II 297 100.0 7 100.0 -- -- -- ._- - --. Guilty 262 86.2 !. 256 86.2 6 85.7 -- --- " -- -- - --
.'
Single Sentence 75 24.7 ;: 71 23.9 4 57.1 Concurrent Sentence 169 55.6 , 167 56.2 2 28.6 Consecutive Sentence 18 5.9 j' ,! 18 6.1 - -
I' Not Guilty 36 1l.8 .j 36 12.1 - -- -- ii - -- ; - -
Single Sentence 12 3.9 12 4.0 - -Concurrent Sentence 21 6.9 21 7.1 - -1 Consecutive Sentence 3 1.0 ii 3 1.0 I - -
I
Not Reported 6 I I
14.3 2.0 5 1.7 1 - -- - - - --
/k

--------------------------------- -
COUNTY
JOTAL
Adams Ashland Barron Bayfield Brown Buffalo Burnett Calumet Chippewa Clark Columbia Crawford Dane Dodge Door Douglas Dunn Eau Claire Florence Fond du Lac Forest Grant Green Green Lake Iowa Iron Jackson Jefferson Juneau Kenosha Kewaunee La Crosse Lafayette Langlade Lincoln Manitowoc Marathon Marinette Marquette Menominee Milwaukee Honroe
14
TABLE 6 COUNTY OF COMMITMENT
RESIDENTS FIRST AND REAm-fITTED TO WISCONSIN ADULT CORRECTIONAL INSTITUTIONS IN 1979
FIRST ADMISSIONS READMISSIONS FACILITIES FACILITIES FACILITIES
TOTAL FOR MEN FOR WOMEN TOTAL FOR MEN If % It % II % If % 11 %
1248 100.0 1172 lQQ,Jl l§, 100.0 ]04 100.Q 297 .100 • 0 -- = = 8 0.6 5 0.4 3 4.0 - - - -2 0.2 2 0.2 - - - - - -4 0.3 4 0.3 - - 4 1.3 4 1.4 2 0.2 2 0.2 - - - - - -
40 3.2 38 3.2 2 2.6 4 1.3 4 1.4 2 0.2 2 0.2 - - 1 0.3 1 0.3 7 0.6 7 0.6 - - - - - -1 0.1 1 0.1 - - - - - -3 0.2 3 0.3 - - 1 0.3 1 0.3 1 0.1 1 ' 0.1 - - - - - -
17 1.4 16 1.4 1 1.3 3 1.0 3 1.0 4 0.3 4 0.2 - - - - - -
36 2.9 33 2.8 3 4.0 13 4.3 13 4.5 8 0.6 8 0.7 - - 5 1.7 5 1.7 8 0.6 8 0.7 - - - - - -
12 1.0 12 1.0 - - 1 0.3 1 0.3 1 0.2 3 0.3 - - 2 0.7 2 0.7
18 1.4 17 1.5 ~ 1.3 2 0.7 2 0.7 1 0.1 1 0.1 - - - - - -
19 1.5 18 1.5 1 1.3 5 1.7 5 1.7 3 0.2 3 0.3 - - 1 0.3 1 0.3
16 1.3 16 1.4 - - 4 1.3 4 1.4 7 0.6 7 0.6 - - - - - -
'3 0.2 3 0.3 - - - - - -4 0.3 4 0.2 - - 1 0.3 1 0.3 - - - - - - - - - -5 0.4 5 0.4 - - - - - -6 0.5 6 0.5 - - 1 0.3 1 0.3 6 0.5 6 0.5 - - 2 0.7 2 0.7
92 7.3 89 7.6 3 4.0 18 5.9 18 6.1 - - - - - - - - .. -
11 0.9 10 0.9 1 1.3 5 1.7 5 1.7 - - - - - - - - - -3 0.2 3 0.3 - - 1 0.3 1 0.3 9 0.7 9 0.8 - - - - - -5 0.4 5 0.4 - - - - - -
26 2.1 25 2.1 1 1.3 7 2.4 6 2.0 9 0.7 8 0.7 1 1.3 - - - -5 0.4 5 0.4 - - - - - -- - - - - - - - - -
520 41.6 480 41.0 40 52.6 139 45.7 135 45.5 6 0.5 6 0.5 - - 1 0.3 - -
FACILITIES FOR WOMEN
II %
1 100.0 --- -- -- -- -- -- -- -- -- -- -- -- -- -- -- -- -- -- -- -- -- -- -- -- -- -- -- -- -- -- -- -- -- -- -- -- -1 14. 3 - -- -- -4 57.1 1 14.3

i
l r I I I
i
i r
Oconto Oneida Outagamie Ozaukee Pepin Pierce Polk Portage Price Racine Richland Rock Rusk St. Croix Sauk Sawyer Shawano Sheboygan Taylor Trempealeau Vernon Vilas Walworth Washburn Washington Waukesha Waupaca Waushara Winnebago Wood
dw/5
I
TOTAL II %
2 0.2 6 0.5
15 1.2/ 8 0.6 2 0.2 • 7 0.6
1
2 0.2 6 0.5 3 0.2
52 4.2 4 0.3
42 3.4 1 0.1
14 1.1 8 0.6 2 0.2
10 0.8 19 1.5 - -- -2 0.2
11 0.9 18 1.4
2 0.2 12 1.0 22 1.8
9 0.7 3 0.2
25 2.0 9 0.7
TABLE 6 - (Concluded)
FIRST ADMISSIONS FACILITIES FACILITIES
FOR MEN FOR TVOMEN TOTAL II % II % if
2 0.2 - - -6 0.5 - - 1
12 1.0 3 4.0 5 7 0.6 1 1.3 1 2 0.2 - - -7 0.6 - - 2 2 0.2 - - 2 4 0.2 2 2.6 1 3 0.3 - - -
47 4.0 5 6.6 20 3 0.3 1 1.3 1
38 3.2 4 5.3 9 1 0.1 - -. -
14 1.2 - - 4 8 0.7 - - -2 0.2 - - 1
10 0.9 - - 4 19 1.6 - - 11 - - - - -- - - - 1 2 0.2 - - 2
11 0.9 - - 1 17 1.5 1 1.3 -
2 0.2 - - -12 1.0 - - 1 22 1.9 - - 9 8 0.7 1 1.3 ' -3 0.3 - - -
25 2.1 - - 6 8 0.7 1 1.3 1
t'
READMISSIONS FACILITIES FACILITIES
FOR MEN FOR WOMEN % It % It %
.- - - - -0.3 1 0.3 - -1.7 5 1.7 - -0.3 1 0.3 - -- - - .. -
0.7 2 0.7 - -0.7 2 0.7 - -0.3 1 0.3 - -- - - - -
6.6
J
20 6.7 - -0.3 1 0.3 - -3.1 I 9 3.0 - -- - - - -
1.3 4 1.4 - -- - - - -
0.3 1 0.3 - -1.3 4 1.4 - -3.6 11 3.7 - -- - - - -0.3 1 0.3 - -0.7 2 0.7 - -0.3 1 0.3 - -- - - - -- - - - -
0.3 1 0.3 - -3.1 9 3.0 - -- - - - -- - - - -
1.7 5 1.7 1 14.3 0.3 1 0.3 - -

TOTAL --Under 20 yrs
16 11 18 19
20 to 24 yrs 20 21 22 23 24
25 to 29 yrs 25 26 27 28 29
30 to 34 yrs
35 to 39 yrs
40 to 44 yrs
45 to 49 yrs
50 to 54 yrs
55 to 64 yrs
65 and Over
MEAN MEDIAN
16
TABLE 7 AGE
RESIDENTS FIRST AND READMITTED TO WISCONSIN ADULT CORRECTIONAL INSTITUTIONS IN 1979
FIRST ADMISSIONS READMISSIONS FACILITIES FACILITIES FACILITIES
TOTAL FOR MEN FOR WOMEN TOTAL FOR MEN It % If % It % II % if %
1248 100.0 1172 100.0 76 100.0 304 100.0 297 100.0 = = -- - - -- - --
285 22.9 275 23.5 10 13.2 2 0.7 I 2 0.7 -2 "0:"2 -2 0":2 - -- - -:-1 - -- - - - -
21 1.7 21 1.8 - - - - I - -104 8.3 100 8.5 4 5.3 - - - -
I
158 12.7 152 13.0 6 7.9 2 O. 7 I 2 O. 7
489 458 I
39.2 39.1 31 40.8 108 35.5 I 105 35.3 133 10.7 126 10.8 7" 9:2 14 14 -z;-:y 4.6 f
114 9.1 108 9.2 6 7.9 23 7.6 ! 23 7.7 98 7.9 90 7.7 8 10.5 30 9.8 I 28 9.4 S9 4.7 54 4.6 5 6.6 25 8.2 ' 24 8.1 85 6.8 80 6.8 5 6.6 16 5.3 16 5.4
215 17.3 201 17.2 lA 18.4 76 25.0 73 24.6 51 ""-"4.T 47 4.0 4 5:3 2I 6:9 19 6:4
46 3.7 42 3.6 4 4.3 13 4.3 13 4.4 47 3.8 44 3.8 3 3.9 14 4~ 6 14 4.7 41 3.3 40 3.4 1 1.3 17 5.6 17 5.7 30 2.4 28 2.4 2 2.6 11 3.6 10 3.4
, 124 9.9 117 10.0 7 9.2
• « 19.7 '. (if) 20.4 ... .-;',J - - - -- - - - -- - --48 3.8 43 3.6 5 6.6 25 8.2 25 8.4 - - -- - - -~~ - - -33 2.6 28 2.4 5 6.6 16 5.3 15 5.0 - - - - - - - - - -22 1.8 21 1.9 1 1.3 9 3.0 9 3.0 - - - - - - - - - -19 1.5 16 1.2 3 3.9 5 1.6 5 1.6 - - - - - - - - - -9 0.7 9 0.8 - - 2 0.7 2 0.7 - - - - - - - - - -4 0.3 4 0.3 - - 1 0.3 1 0.3 - - - - - - - - - -
25.3 25.1 27.1 29.0 29.1 22.4 22.4 23.9 27.1 27.2
FACILITIES FOR WOMEN
11 %
7 100.~ -:::
- -- -- -- -- -- -3 42.9 -- -- -2 28.6 1 Ith3 - -3 42.~ 2: 28.6 - -- -- -1 14.3
- -- -1 14.2 -
- -
- -
- -- -
27.0 24.8
- ",~.-,
~
.~
, ~·'·~Ia " .. ; .,
".,. l ... ~
,;.;~"'
,'~":"7~ 1"'::

i .' RACE
FIRST ADMISSIONS
White
White (Mexican Origin)
Nan-White
Black Native American Other
RE-ADMISSIONS
White
White (Mexican Origin)
Non-White
Black Native American Other
/k
"
I'
17
TABLE 8 RACE
Residents First and Readmitted to Wisconsin Adult Correctional Institutions in 1979
FACILITIES TOtAL FOR MEN
NUMBER PERCENT NUMBER PERCENT
1,248 100.0 1,172 100.0
759 60.8 723 .§l:2 - -- -37 3.0 36 3.1 - -
452 36.2 413 35.2 - -- .-405 32.5 368 31.4
41 3.3 39 3.3 6 0.5 6 0.5
304 100.0 297 100.0 -,-162 53.3 159 53.5' - -- - ..... ,-
10 3.3 10 3.4 - - -132 43.4 128 4301 -- -119 39.1 115 38.7
11 3.6 11 3.7 2 0.7 2 0.7
FACILITIES FOR WOMEN
NUMBER PERCENT--76 100.0 - = 36 47.4 -
1 1.3 -39 51.3 ...-
37 48.7 2 2.6 - -7 100.0
-= = 3 42.9 - -- -- -4 57.1 - -4 57.1 - -- -

MARITAL
FIRST ADMISSIONS
Single
Never Marrted Divorced Separated Widowed
Married
RE-ADNISSIONS =:::--=-~:::.~-:::::- ...
Single
Never Married Divorced Separated Widowed
Married
/k
18
TABLE 9 MARITAL STATUS
Residents Firl~ t and Readmitted to Wisconsin Adult Correctional Institutions in 1979
FACILITIES TOTAL FOR MEN
STATUS NUH.BER PERCENT NUMBER PERCENT
1,248 100.0 1,172 lQ£,Jl
1,041 83.4 984 84.0 - --853 68.3 812 69.3 134 10.7 122 10.4 42 3.4 41 3.5 12 1.0 9 0.8
207 16.6 188 16.0 - -- - -304 lQQ,J!, 297 100.0 -250 82.2 245 82.5 -- - --188 61.8 185 62.4
51 16.8 50 16.8 10 3.3 9 3.0 1 0.3 1 0.3
54 17.8 52 17.5 - -- - --
FACILITIES FOR WOMEN
NUMBER PERCENT
1i 100.0 = 57 74.9 - --41 53.9 12 15.8 1 1.3 3 3.9
19 25.1 - --1 100.-2,
5 71.5 -3 42.9 1 14.3 1 lA.3 - -2 28.5 -
-- ---- -----~-----------~

19
TABLE 10 PREVIOUS FELONY CONVICTIONS Residents First Admitted to
Wisconsin Adult Correctional Institlltions in 19i9
FACILITIES TOTAL FOR MEN
PREVIOUS FELONY CONVICTIONS NUMBER PERCENT NUMBER PERCENT
TOTAL 1,248 100.0 1,172 100.0 -- -- ---- -- -_. .--None Recorded 655 52.5 595 50.7 -- -- --PX'evious Convictions 580 46.5 567 ~ -- --
One 316 25.3 306 26.1 Two 158 12.7 156 13.3 Three or more 106 8.5 105 9.0
Not Reported 13 1.0 10 0.9 - - - -
TABLE 11 PREVIOUS PENAL EXPERIENCE Residents First Admitted tJ
Wisconsin Adult Correctional Institutions in 1979
FACILITIES TOTAL FOR HEN
PREVIOUS PENAL EXPERIENCE NUMBER PERCENT NUMBER PERCENT
TOTAL 1,248 100.0 1,172 100.0 -- -- --.-- -- --None Recorded . 785 62.9 729 62.2 -- -- -- --~revious Correctional lnst. Experience 450 36.1 433 36.9 -- -- -- --
At Wis~onsin Correctional Institution 211 16.9 200 17.0 Other prisons or reformatories 101 8.1 101 8.6 Jail sentence 138 11.1 132 11. 3
Not Reported 13 1.0 10 0.9 - -- - -/k
FACILITIES FOR WOMEN
NUMBER PERCENT
76 100.0 -- ~ 60 78.9 - --13 17.1 - --10 13.2
2 2.6 1 1.3
3 4.0 - -
FACILITIES FOR WOMEN
NUMBER PERCENT
76 100.0 - --- --56 73.7 - --17 22.4 - --11 14.5 - -6 7.9
3 3.9 -

20
TABLE 12 Juvenile Institution Experience
Residents First Admitted to Wisconsin Correctional Institutions in 1979
TOTAL FACILITIES
FOR MEN Juvenile Institution Ex erience Number Percent Number Percent
TOTAL 1,248 =
100.0 1,172 100.Q
None Recorded 919 73-.6 856 73.0
At Wisconsin Institutions 289 23.2 280 23.9 Juvenile Traininr . School 210 16.8 204 17.4 Juvenile Trainin' School and
Wisconsin Chilu Center 2 0.2 2 0.2 Wi3conGin Child Genter 25 2.0 25 2.1 Other Institutions in Wisconsin 52 4.2 49 4.2
Ch:i.1dr<~,! I s Institution in Other States 17 2.2 25 2.2 -,",,,,,,-.,,--..
Not Reported 13 1.0 10 0.9
501lT
TABLE 13 Grade Completed
Residents First Admitted to Wisconsin Adult Correctional Institutions
FACILITIES TOTAL FOR MEN
~- - ~----- ---~ ------- -----....
FACILITIES FOR WOMEN
Number
76
63
9 6"
3
1
3
Percent
83.0
3.9
1.3
FACILITIES FOR WOMEN
.'~ ." ..
Grade Completed Number Percent Number Percent Number Percent
TOTAL 1,248 100.0 1,172 100.0 76 100.0
Less than fourth 15 1 • .2 15 1.2 Fourth 6 0.5 5 0.4 1 1.3 Fifth 13 1.0 .1.3 1.1 Sixth 13 1.0 13 1.1
Seventh 33 2.6 32 2.7 1 1.3 Eighth 80 6. L~ 77 6.6 3 3.9 Ninth 163 13.1 152 13.0 11 11, • .5 Tenth 246 19.8 235 20.0 11 14.5
Eleventh .01 21. 7 255 21.8 16 21.1 Twelfth or more 369 29.6 343 29.3 26 34.2 Unknown 26 2.1 22 1.9 4 5.3 Not Reported 13 1.0 10 0.9 3 3.9
SOl/T

---------------------------------~-- ~ - ---~-----
r
21
TABLE 14 Achievement Test
Residents First Admitted to Wisconsin Adult Correctional Institutions in 1979
Achievement Test
_TOTAL
Less than 3.5 Grade Level 3.5 to 4.4 4.5 to 5.4 5.5 to 6.4
6.5 to 7.4 7.5 to 8.4 8.5 to 9.4 9.5 to 10.4
10.5 to 11.4 1l.5 or more Not Tested Not Reported
501/T
TOTAL Number Percent
1,248 100.0
81 6.5 72 5.8 78 6.3 95 7.6
143 1l.5 143 1l.5 138 11.1 131 10.5
69 5.5 110 8.7 175 14.0
13 1.0
TABLE 15 Intelligence Estimates
Residents First Admitted to
FACILITIES FOR MEN
Number Percent
1,172 lill1l2
79 6.7 69 5.9 77 6.6 90 7.7
131 11. 2 134 11.4 128 10.9 125 10.7
66 5.5 104 8.9 159 13.6
10 0.9
Wisconsin Adult Correctional Institutions in 1979
- FACILITIES TOTAL FOR MEN
Intelligence Estimate Number Percent Number Percent
TOTAL 1,248 100.0 .hill ~ Superior and Above 3 0.2 3 0.3 Bright Normal 63 5.0 60 5.1 Average or Normal 486 38.9 461 39.3
Dull Normal 143 11.6 136 11.6 Borderline 25 2.0 21 1.8 Defective 8 0.6 8 0.7
Not Tested 507 40.7 LI73 40.3 Not Reported 13 1.0 10 0.9
I 50l/T
FACILITIES FOR WOMEN
~-
Number Percent
l§, 100.0 = 2 2.6 3 3.9 1 1.3 5. 6.6
12 15.9 9 11.8
10 13.2 6 7.9
3 3.9 6 7.9
16 21.1 3 3.9
FACILITIES FOR WOMEN
Number Percent
76 100.Q,
-- --3 3.9
25 32.9
7 9.2 4 5.3
-- --34 44.8
3 3.9

22
TABLE 16 Average (Mean) Length of Sentence in Months for
Selected Offenses for Residents First And Readmitted to Wisconsin Adult Correctional Institutions in 1979 Il
FIRST ADMISSIONS READMISSIONS FACILITIES FACILITIES FACILITIES FACILITIES
FOR MEN FOR WOMEN FOR MEN FOR WOMEN Offense Number Mean Number Mean Number Mean Number
2nd Degree Murder 17 231.5 Manslaughter 9 70.0 Negligent Homicide 9 50.0
Robbery 211 73.8 Unarmed (l09) (73.8) 34 94.1 Armed (102) (73" 8) 19 90.3
Assault/Battery 55 34.5 13 33.8 Aggravated Assault/Battery 6 24.3 8 58.5 Injury by Conduct Regardless
of Life 15 77.6
Burglary (Unarmed) 351 40.7 9 29.0 91 55.9 Theft except Auto 76 33.3 7 28.3 23 36.0 Receiving Stolen Property llf 33.4 Auto Theft 75 24.5 30 29.3 Forgery 73 42.2 15 37.2 16 43.5
\'iorthless Checks 6 24.0 Rape 7 241.1 6 149.0 Sexual Assault 1st Degree 20 63.0 Sexual Assault 2nd Degree 30 70.1 Sexual Assault 3rd Degree 10 37.2
Drugs 74 34.3 6 32.0 12 44.8 Escape 9 19.7 Arson 17 55.1 Abandonment/Non-Support 8 18.0 Fraud -- -- 5 40.8
Il Only those offenses h~ving five or more cases reported had a mean length of sentence calculated.
501/T
Mean

......