) trace minerals vjith 0;.'a1. axd implanted 1i0rm0::es in
TRANSCRIPT

^ .
UREA m\) TRACE MINERALS VJITH 0;.'A1. AXD
IMPLANTED 1I0RM0::ES IN LEEF CATTl.E
by
JIM̂ IY RAY JENKINS, B.S. in A;,.
A THESIS
IK
ANIMAL NUTRITION
Submitted to the Graduate Faculty of Texas Technological College in Partial Fulfillment of
the Requirements for the Degree of
MASTER OF SCIENCE
Approved
Accepted
August, 1969

rie r 9o^
//o ? ̂ y Lc»/C. r ACKN0V7LEDGMENTS
I am sincerely thankful for the guidance of Dr. Robert C. Albin,
in the preparation and direction of the research project from which
this thesis was prepared. Gratitude is also expressed to Dr. D. W.
Zinn and Dr. Frank Hudson for their review, suggestions and helpful
criticisms of this thesis.
ii

TABLE OF CONTENTS
ACKNOWLEDGMENTS ii
LIST OF TABLES iv
CHAPTER INTRODUCTION
CHAPTER II REVIEW OF LITERATURE,
CHAPTER III, EXPERIMENTAL PROCEDURE
CHAPTER IV. RESULTS AND DISCUSSION 11
CHAPTER V. SUMMARY 28
LITERATURE CITED 30
ill

LIST OF TABLES
Table No. Page
1. Physical Composition of Rations (Air-Dry Basis, Pounds) 8
2. Hormonal Implant Treatments 8
3. Ration Effects Unon Mean Animal Performance and Carcass Characteristics During the Feeding Trial . 12
4. Hormone Implant Effects Upon Mean Animal Performance and Carcass Characteristics During the Feeding Trial 14
5. Mean Daily Gains by Ration and Hormone Treatments on a Pen Basis (Pay Weight Basis) 15
6. Mean Efficiencies of Feed Utilization by Ration and Hormone on a Pen Basis (Pay Weight Basis) . . . 15
7. Standard Deviation of Average Daily Gains (Pay Weight Basis) 15
8. Analysis of Variance for Daily Gain on a Pay Weight Basis 16
9. Analysis of Variance for Gain on an Adjusted Pay Weight Using a 61 Dressing Percentage 16
10. Analysis of Variance for Daily Gain on a Shrunk Weight Basis 16
11. Mean Dressing Percentages by Ration and Hormone Treatments on a Pen Basis . 18
12. Mean U.S.D.A. Grades by Ration and Hormone Treatments on a Pen Basis 18
13. Mean U.S.D.A. Marbling Scores by Ration and Hormone Treatments on a Pen Basis 18
14. Mean Back-Fat Thickness and Hormone Treatments on a .Pen Basis (Millimeters) 19
iv
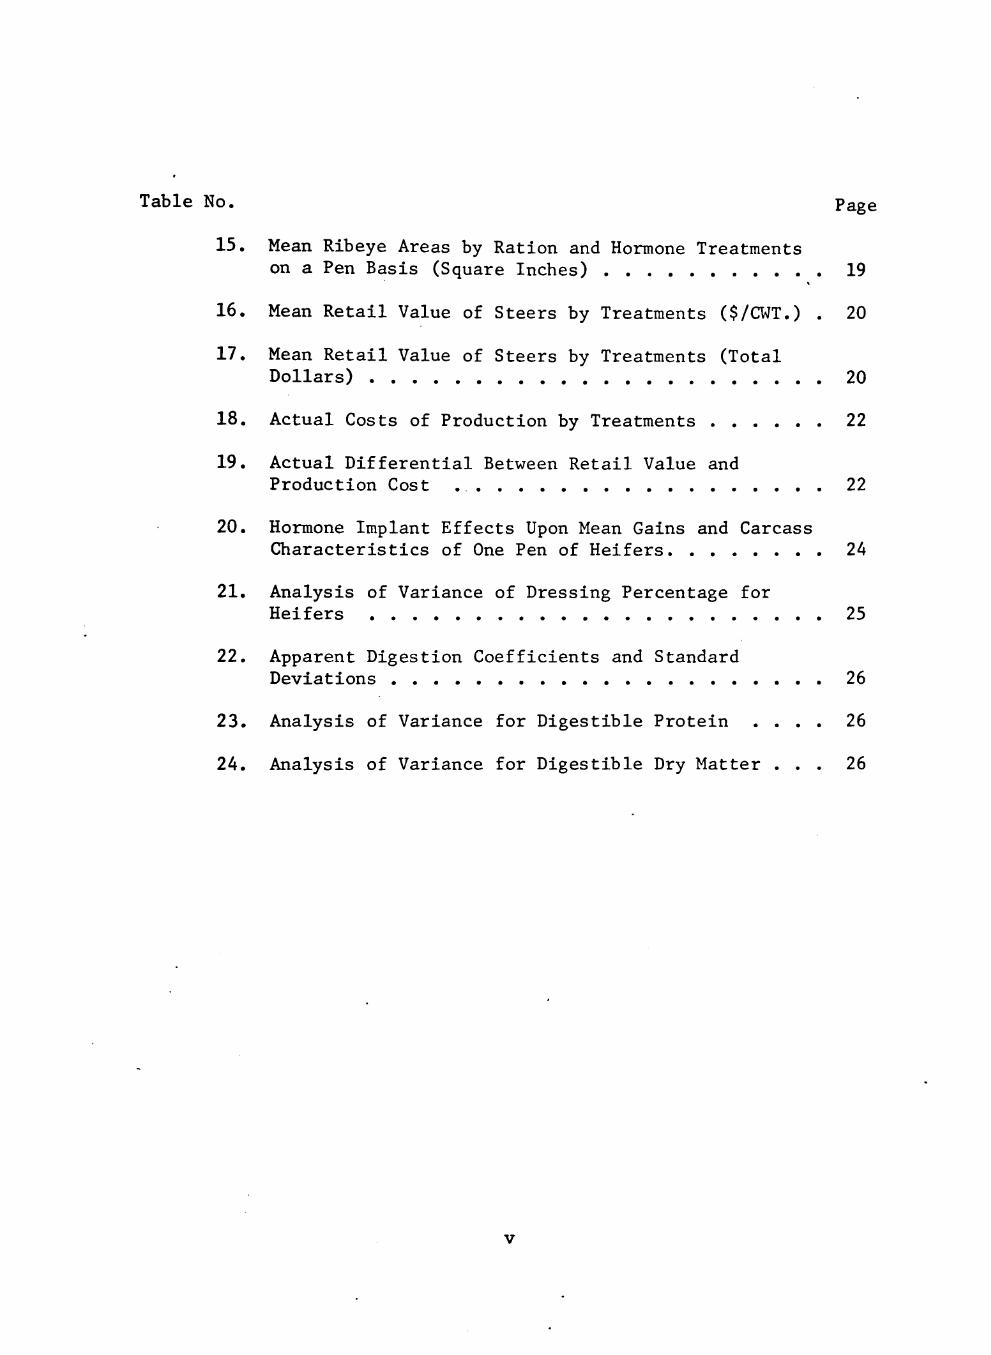
Table No. Page
15. Mean Ribeye Areas by Ration and Hormone Treatments on a Pen Basis (Square Inches) 19
16. Mean Retail Value of Steers by Treatments ($/CWT.) . 20
17. Mean Retail Value of Steers by Treatments (Total Dollars) 20
18. Actual Costs of Production by Treatments 22
19. Actual Differential Between Retail Value and Production Cost 22
20. Hormone Implant Effects Upon Mean Gains and Carcass Characteristics of One Pen of Heifers 24
21. Analysis of Variance of Dressing Percentage for Heifers 25
22. Apparent Digestion Coefficients and Standard Deviations 26
23. Analysis of Variance for Digestible Protein . . . . 26
24. Analysis of Variance for Digestible Dry Matter . . . 26
CHAPTER I
INTRODUCTION
The use of urea as a protein source for fattening beef cattle
is receiving much attention in the livestock industry. Urea is a
relatively economical source of nitrogen when compared with plant and
animal protein sources. Due to the rapid expansion of the feedlot
industry in the Southwest, and the cost-price squeeze the cattle
feeder is facing, it seems certain that urea will be used more
extensively in fattening rations. Directly in line with economical
beef production, is the use of hormones, either oral or implanted,
to increase the rate of gain in fattening cattle. However, most of
the work has been limited to the individual use of either oral or
implanted hormones in cattle feeding.
The evaluation of feeding trials has been primarily restricted
to the performance of the beef animal as expressed in terms of average
daily gain and efficiency of feed utilization. While these criteria
are valuable tools for evaluation purposes, it is felt that a digestion
study would aid the final appraisal of most feedlot data.
The end product of a cattle feeding trial is the beef carcass.
Items, such as carcass weight and grade, ribeye area, fat cover, and
kidney fat are of prime importance to the producer, packer, and retailer,
When the carcass characteristics of the animal are determined and re
tail values are applied to these characteristics, the entire retail

value of the carcass can be predicted. When the retail carcass
value is compared to the costs of production, feedlot performance,
digestion and carcass data, research findings can be clearly
evaluated.
The specific objectives of this study were to determine the
effects of three feeding treatments in conjunction with two methods
of hormone administration upon (a) daily gains and efficiency of
feed utilization, (b) carcass characteristics, (c) digestion
coefficients for dry matter and crude protein, and (d) retail values
and production costs.

CHAPTER II
REVIEW OF LITERATURE
Urea and Trace Minerals
Urea as a nitrogen source in the fattening ration of beef
cattle is not a new idea. Armsby (1911) stated the possibilities
of urea as a source of nitrogen for maintenance and growth. Hart
£t al. (1938, 1939), Wegner £t al. (1941), Harris £t al. (1941),
Johnson etal. (1942), and Archibald et al. (1941, 1943) indicated
that urea usage in the ruminant diet resulted in growth. The
results of these early workers were reviewed and summed by Jennings
(1952) who stated, "From an economic standpoint, the experiments
upon which the tentative conclusions are based are too few and have
too great a variation in results to be entirely conclusive. More
research work on feeding beef cattle and milk cows, especially in
regions where urea appears to have the greatest economic advantages,
would help to sharpen the answers on questions of costs and returns."
Relative to the economic advantages of urea. Wise et^ jl. (1965)
and Oltjen ̂ £l. (1965) pointed out the fact that urea was more
efficiently utilized when employed in rations with high amounts of
readily available energy. A review by Ellis (1965) indicated that
grain sorghum (milo) provided a readily available energy source when
used in all-concentrate rations for fattening beef cattle. Durham

e_t al. (1963), Durham (1966), Kercher and Bishop (1963), Pope £t al.
(1963), and Albin and Durham (1967) demonstrated the use of milo in
all-concentrate rations with favorable results. Concurrently, the
relative abundance of milo and the scarcity of sources of roughage
in the High Plains and Southwest have indicated the economical ad
vantages to be gained by feeding all-concentrate rations to fattening
beef cattle.
Furr and Carpenter (1967) and Furr and Sherrod (1967) reported
that milo was subject to protein and mineral variations due to factors
such as soil fertility, grain variety, soil conditions, and irrigation
techniques. Further research (Furr £t ^ . 1967) indicated that milo
in an all-concentrate ration, when combined with balanced mineral
supplementation and urea as a nitrogen source, resulted in favorable
average daily gains and efficiency of feed utilization over conventional
rations in the fattening of beef cattle. While the results were not
significantly different, they were extremely promising. Furr et al.
(1967) stated; 1. "Urea can be effectively utilized as the sole source
of supplemental nitrogen in high grain sorghum (all-concentrate)
finishing rations." 2. "In high grain sorghum (all-concentrate)
rations supplemented with urea, mineral supplementation and balance
would appear to warrant special attention."
Oral and Implanted Hormones
Advantages of the oral administration of diethylstilbestrol
(DES) in beef cattle rations have been the subject of considerable

research. Perry £t al. (1955), Burroughs £t al. (1956), Beeson
et al. (1956), Ogilvie et al. (1960), Wallentine et £l. (1961) are
some of those who have shown a significantly favorable increase in
average daily gains by the use of DES. Perry et̂ al (1955) and"
Beeson £t al, (1956) reported an increase in feed utilization of up
to 11 percent by oral administration of DES. Likewise, DES implants
have produced similar results as indicated by Andrews £t ̂ . (1954) ,
Clegg and Cole (1954), Klosterman e;t al. (1955), Cahill e^ £l. (1956),
Roubicek (1960), Woods (1962), and Wilson (1963). As a summary,
Ogilvie (1960) stated; "Increased rate of body weight gain and improved
feed efficiency of steers receiving stilbestrol either implanted or
fed orally, has been demonstrated repeatedly." It should be noted
that the vast majority of research dealing with stilbestrol has been
either in implant or oral form, whereas a combination of the two forms
of administration has resulted in inconsistent behavior and has not
been approved for feedlot use by the Food and Drug Administration.
The male hormone, testosterone, has been used as a growth
stimulant in ruminants; however, results have been inconsistent.
Andrews et_ jl. (1949) indicated that implantation of wether lambs
with testosterone resulted in increased gain. Dinusson et al. (1950)
reported no significant increase in the gain of yearling steers by
the use of implanted testosterone propionate. O'Mary et al. (1956)
reported favorable gains with injected levels of testosterone but
no response was found by implantation in ewes or lambs. Burris et al.

(1953) showed favorable response in average daily gains of both
steer and heifer calves by the use of intramuscular injections of
testosterone, whereas Beeson et aJ^, (1956) reported an increase in
both growth response and feed efficiency in beef steers as a result
of oral administration of methyl testosterone.

CHAPTER I I I
EXPERIMENTAL PROCEDURE
The exper iment was conducted a t the Animal Sc ience f e e d l o t ,
Texas T e c h n o l o g i c a l C o l l e g e , Lubbock, T e x a s . The f e e d l o t pens were
equipped w i t h Clay , bowl - type c i r c u l a t i n g w a t e r e r s and 1,000 pound
c a p a c i t y s e l f - f e e d e r s . Each pen was 4 0 ' x 4 0 ' , s u r f a c e d wi th
c o n c r e t e , fenced wi th c a b l e , and s loped to the sou th a t t he r a t e of
seven and four t e n t h s p e r c e n t .
One hundred e i g h t "number one Okie" s t e e r s were randomly
a l l o t t e d t o n i n e pens of twelve head each by we igh t and b r e e d ,
and p l a c e d i n a 3 x 3 f a c t o r i a l arrangement of t r e a t m e n t s . Three
f eed ing t r e a t m e n t s (shown i n t a b l e 1) were randomly a l l o t t e d to
t h r e e pens e a c h . Each of t h r e e hormonal implant t r e a t m e n t s (shown
i n t a b l e 2) were randomly a l l o t t e d to one pen i n each of t h e t h r e e
f eed ing t r e a t m e n t s . Each s t e e r r e c e i v e d o r a l d i e t h y l s t i l b e s t r o l a t
t he r a t e of t e n mg. d a i l y . Twelve h e i f e r s were p l a c e d i n one
a d d i t i o n a l pen , fed the c o n t r o l r a t i o n ( t a b l e 1 ) , and randomly
d i v i d e d i n t o two groups by weigh t and b reed t o r e c e i v e t h e hormonal
t r e a t m e n t s shown i n t a b l e 2 . Af t e r 116 days on f eed , a l l an imals
were s l a u g h t e r e d a t a l o c a l pack ing p l a n t . A f t e r a 24 hour c h i l l ,
c a r c a s s d a t a were o b t a i n e d .
Each animal was s t a r t e d on feed by t h e method r e p o r t e d by

8
TABLE 1
PHYSICAL COMPOSITION OF RATIONS (AIR-DRY BASIS, POUNDS)
Ration Ingredients Control Adaptation^ Urea
Milo, dry-rolled 1,840 " 1,920
Cottonseed meal 100 " - -
Premix T-351^ 60 " - - '
Premix T-352^ " 60
Premix T-353*̂ • - -• " 20
Total 2,000 2,000 2,000
Crude protein, % . . : 11.8 ': 11 .8 ::: : ' . llVS"
ihe cattle were fed the cottonseed meal ration for 10 days; then gradually adapted to the urea ration over the next 50 days.
Supplied per pound of ration; 2,500 I.U. of vitamin A, 0.5 mg of diethylstilbestrol, and 3.5 mg. of chlortetracycline.
^Contained urea. \]0'^ ^ ^ ^ ' ^ \
Contained Mn, Zn, Fe, Cu, I, Mg, K, S, Ca.
V
TABLE 2
Item
No. of animals
Dosage
HORMONAL
No Implant
36
0
IMPLANT TREATMENTS
Dibestrol ( (DES)
36
2-15 mg Pellets
Treatments C Testosterone ]
+ DES
36
144 mg. Testosterone plus 24 mg. DES in polyglycolic paste.
Heifer Pen
12
6 head 2-15 mg. Pellets DES
6 head 144 mg.
Testosterone + 24 mg. DES in polyglycolic paste.

9
Albin and Durham (1967). Ind iv idua l i d e n t i f i c a t i o n of each animal
was accomplished by ea r -no tch ing , and in add i t i on , each h e i f e r was
f reeze-branded. Each animal was t r e a t e d with Neguvon for grub
c o n t r o l , and vaccinated for Black- leg , malignant edema, a P a s t u r e l l a
type mixed b a c t e r i n , and for in fec t ious bovine r h i n o t r a c h e i t i s .
I n d i v i d u a l weights of animals were taken i n i t i a l l y , and at 28, 63 , 94,
and 116 days t h e r e a f t e r . Ind iv idua l weights were recorded on two
b a s e s , pay weight and shrunk weight .
The r e t a i l value of each s t e e r was est imated by using the
following equat ion (Bre iden t s t in et_ sil. , 1955) :
Y = 47 .88 - . 0 0 8 X T + .49X_ - .93X^3 - 2.65X, - .47X^ where : 1 2 3 4 5
Y = r e t a i l va lue /cwt . of carcass
X̂ = carcass weight
Xj = area of the r ibeye
X^ = percent kidney fat X, = sum of three fat measures taken over the carcass 4
X(. = Federal g rade .
Exact product ion cos ts of each animal were computed with these
f i g u r e s : i n i t i a l pay weight (? $26.50 cwt. and yardage per ton of
feed @ $6.00.
The r a t i o n costs were computed at current p r i c e s for the Lubbock-
West Texas a rea , w i t h : milo Q $2.00/cwt. and cot tonseed meal @ $4.35/cwt
Costs for the v i tamin-minera l supplements were: T-351 (? $4 ,40 /cwt . ;
T-352 (§ $4 .00 /cwt . ; and T-352 (? $4.10/cwt.
10
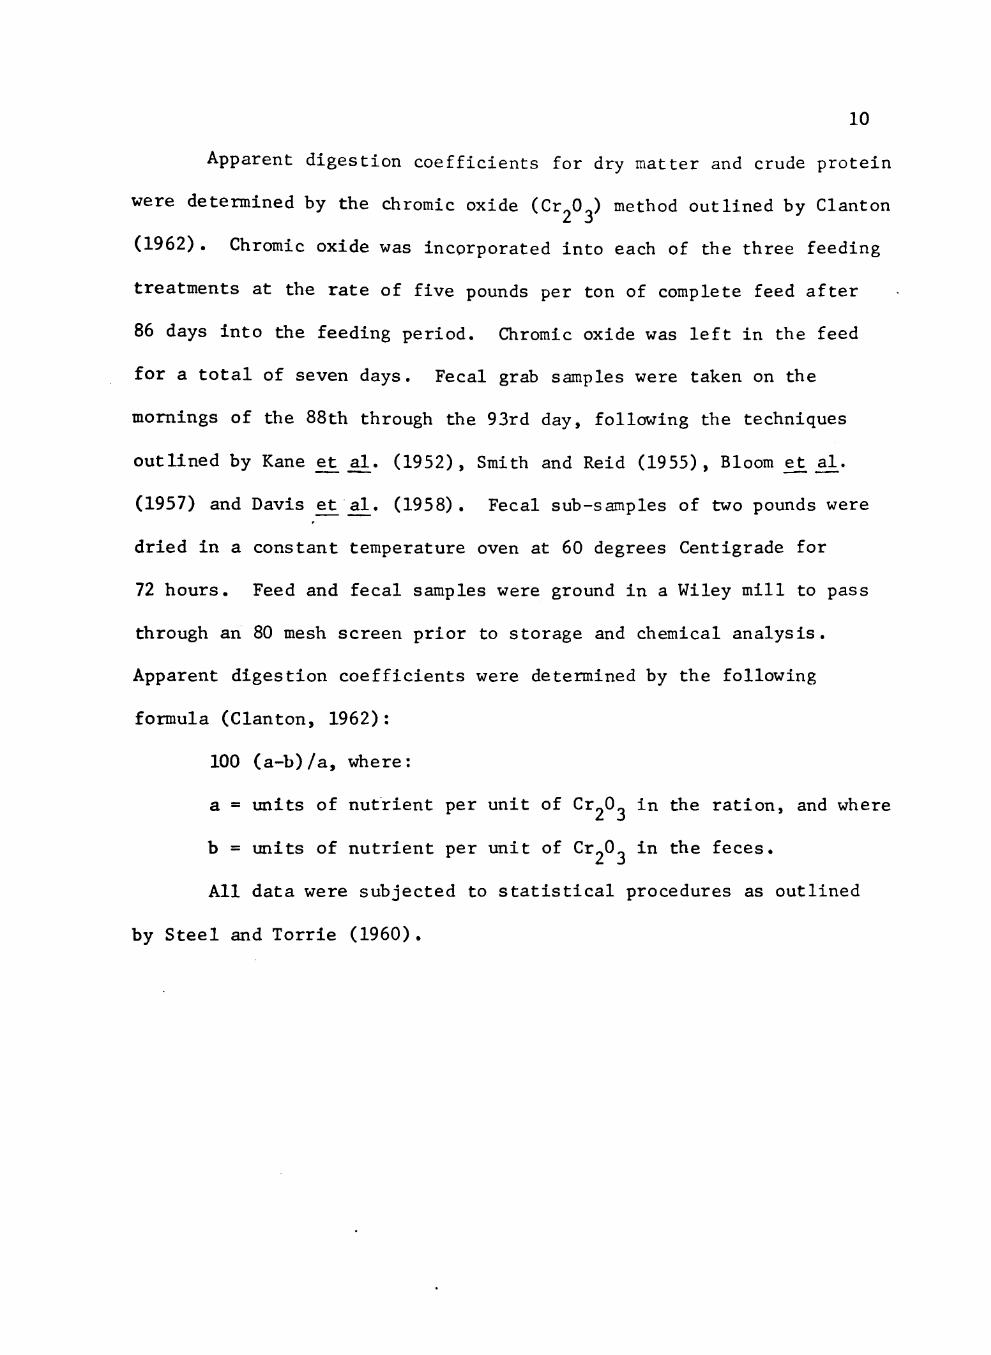
Apparent digestion coefficients for dry matter and crude protein
were determined by the chromic oxide (Cr 0 ) method outlined by Clanton
(1962) . Chromic oxide was incorporated into each of the three feeding
treatments at the rate of five pounds per ton of complete feed after
86 days into the feeding period. Chromic oxide was left in the feed
for a total of seven days. Fecal grab samples were taken on the
mornings of the 88th through the 93rd day, following the techniques
outlined by Kane £t al. (1952), Smith and Reid (1955), Bloom et al.
(1957) and Davis £t_ al. (1958), Fecal sub-samples of two pounds were
dried in a constant temperature oven at 60 degrees Centigrade for
72 hours. Feed and fecal samples were ground in a Wiley mill to pass
through an 80 mesh screen prior to storage and chemical analysis.
Apparent digestion coefficients were determined by the following
formula (Clanton, 1962):
100 (a-b)/a, where:
a = units of nutrient per unit of Cr_0^ in the ration, and where
b = units of nutrient per unit of Cr^O^ in the feces.
All data were subjected to statistical procedures as outlined
by Steel and Torrie (1960).

CHAPTER IV
RESULTS AND DISCUSSION
Steer Feeding Trial and Carcass Characteristics
The feedlot data in terms of animal response were presented
on three bases: pay weights, which correspond to commercial feedlot
operators' records; pay weights adjusted to a common dressing
percentage; and shrunk weights, which animal scientists tend to
use. The final live weights were taken on two consecutive mornings,
averaged, and arithmetically shrunk 4.percent.
The results of animal performance and carcass characteristics
as affected by rations are presented in table 3. The rations were
significantly different (P<.01) in that the animals receiving the
control ration containing cottonseed meal gained faster than animals
receiving the adaptation or the urea rations. While animals receiving
the adaptation ration gained faster than those receiving urea, differ
ences were not significant. No statistical significance was observed
in efficiency of feed utilization; however, efficiency favored the
control animals, followed in order by the adaptation and urea fed
steers. The adaptation ration was initially the same composition as
the control ration, and by a series of incremental changes it was
shifted to the same composition as the urea ration. However, in view
of the results, it is difficult to explain whether the cottonseed meal
11

TABLE 3
RATIOLl EFFECTS UPON MEAN ANIMAL PERF0PvMA^XE AND CARCASS CHARACTERISTICS DURING THE FEEDING TRIAL
12
Item Control 1
No. of animals
Animal response, pay weight basis, lb.
b
36
Initial wt. Final wt.c Daily gain Daily feed
intake Feed/lb. gain
Animal response, pay weight basis: adjusted to 61% dressing percentage: lb.
Initial wt. Final wt. Daily gain Feed/lb. gain
Animal response, shrunk weight basis, lb.
Initial wt.<̂ Final wt.*̂ Daily gain Feed/lb. gain
628 .1 940 .8
2.70
19.92 7.38
628 .1 934.8
2.64 7.55
588.2 940 .8
3.04 6.55
Carcass data
Dressing ^ e
percent ^ U.S.D.A. grade U.S.D.A. marbling
scored No. of abscessed
livers
60.58 8.6
7.9
Ration Adapt
2 35a
630.4 912.4 2.43
18.32 7.54
630.4 913.5 2.44 7.48
589.6 912.4 2.78 6.59
61.13 8.2
6.7
3
Urea 3
Significant Difference
36
623.8 899.3 2.38
18.76 7.88
P2,3'
ns ns
623.8 894.2 2.33 8.07
583.8 899.3 2.72 6.90
60.59 8.2
7.2
2
-
1>2,3 ns
1>2,3 ns
ns ns
ns
•̂
One steer died of undetermined cause.
Purchase weight before hauling 300 miles to Lubbock.
Arithmetically shrunk 4%.
On feed v/eight, after 300 mile haul.
Chilled carcass basis; 2% shrink of warm carcass weights.
Good = 8, Good + = 9, and choice - = 10.
^Slight - = 6, Slight = 7, and Slight + = 8.
^P<.01.

13
or the incremental adaptation technique caused the adaptation steers to
gain slightly faster than the steers on the urea ration. Daily feed in
take of the steers was not statistically different among the three
feeding treatments.
Analysis of carcass characteristics revealed no significant
differences among the treatments. Dressing percentage favored the
adaptation fed steers over the control and the urea fed cattle, whereas
animals on the control ration graded slightly higher and produced a
higher marbling score than either the adaptation or urea fed animals.
Results of animal performance and carcass characteristics as
affected by hormone implantation are presented in table 4. No signif
icant differences were observed in either animal response or carcass
characteristics. Daily gain and efficiency of feed utilization favored
the animals that received the DES implantation while response between
animals that received no implant and those that received testosterone
+ DES were virtually identical. Lack of significance between treatments
can possible be explained by the animal variation within treatments.
Table 5 shows mean daily gains per treatment and table 6 shows efficien
cies of feed utilization. Table 7 shows the standard deviation within
treatments, indicating the degree of variation of animals within
treatments. Animal variation is also shown in tables 8, 9, and 10
which reveal a large error term, but a t-test indicates a significant
difference for among rations. No statistical difference in efficien
cy of feed utilization was observed. Daily feed intake was not
statistically different.

14
TABLE 4
HORMONE IMPLANT EFFECTS UPON MEAN ANIMAL PERF0R:-IiV\CE A:;D CARCASS CHARACTERISTICS DURING THE FEEDING TRIAL
Hormone Implan t s Item None , DES Testosterone S i g n i f i c a n t
+ DES Di f ference
No. of animals 36 35^ 36
Animal response , pay weight b a s i s , l b .
I n i t i a l wt .^ 623.4 627.5 631.3 Final w t . ^ 9 0 9 . 1 925.7 918 .1 Dai ly gain 2.46 2 .58 2.47 Dai ly feed intake 19 .18 19.10 18 .73
ns ns
F e e d / l b . gain 7.80 7.43 7.58 ns
Animal response , pay weight b a s i s ; adjusted to 61% dress ing percentage: lb
Initial wt. Final wt. Daily gain Feed/lb. gain
623.4 902.5 2.40 7.97
627.5 928.5 2.60 7.34
631.3 911.6 2.41 7.79
—
—
ns ns
Animal response , shrunk weight b a s i s / l b .
Initial wt. Final wt.^ Daily gain Feed/lb. gain
Carcass data e
Dressing percent U.S.D.A. grade U.S.D.A. marbling
e score
No. of abscessed livers
582.9 909.1 2.81 6.83
60.53 8.5
7.8
1
587.0 925.7 2.92 6.54
61.23 8.2
6.8
2
591.7 918 .1
2 .81 ns 6.67 ns
60.55 ns 8 .3 ns
7 .3 ns
^One s t e e r died of undetermined cause , b.
c
Purchase weight before hauling 300 miles to Lubbock.
Arithmetically shrunk 4%.
On feed weight, after 300 mile haul.
^Chilled carcass basis; 2% shrink of warm carcass weights.
Good = 8, Good + = 9, and Choice - = 10.
^Slight - = 6, Slight = 7, and Slight + = 8.

15 TABLE 5
MEAN DAILY GAINS BY RATION AND HOP::ONE TREATMENTS ON A PEN BASIS (PAY WEIGHT BASIS)
Ration
• Control Adaptation Urea
None 2.73 2.29 2.37
Hormone
DES 2.59 2.53 2.59
Implants
Testosterone + DES 2.77 2.48 2.17
TABLE 6
MEAN EFFICIENCIES OF FEED UTILIZATION BY RATION AND HORMONE ON A PEN BASIS (PAY WEIGHT BASIS)
Ration
Control Adaptation Urea
None 7.56 7.78 8.06
Hormone
DES 7.37 7.59 7.37
Implants
Testosterone + DES 7.25 7.25 8.36
TABLE 7
STANDARD DEVIATION OF AVERAGE DAILY GAINS (PAY WEIGHT BASIS)
Ration
Control Adaptation Urea
None 0.42 0.60 0.65
Hormone
DES 0.29 0.50 0.34
Implants
Testosterone + DES 0.38 0.43 0.55

TABLE 8
ANALYSIS OF VARIANCE FOR DAILY GAIN ON A PAY WEIGHT BASIS
16
Source of Variation
Total
Pen
Ration
Implant
R X Imp.
Animal/ R X Imp.
ANALYSIS
Source of Variation
Total
Pen
Ration
Implant
R X Imp.
Animal/ R X Imp.
Degrees of Freedom
107
8
2
2
4
99
OF VARIANCE USING A 61
Degrees of Freedom
107
8
2
2
4
. 99
Mean F Square
3,339.785
6,365.875 2.0565
14,080.500 2.9170
1,729.000 .3582
"4,827.000 1.5596
3,095.2525
TABLE 9
FOR GAIN ON AN ADJUSTED PAY DRESSING PERCENTAGE.
Mean F Square
4,081.6729
7,028.1250 1.8258
12,062.0000 2.4179
6,073.5000 1.3175
4,988.5000 1.2978
3,843.5757
Significant Difference
ns
ns
ns
ns
WEIGHT
Significant Difference
ns
ns
ns
ns
TABLE 10
ANALYSIS OF VARIANCE FOR DAILY GAIN ON A SHRUNK WEIGHT BASIS
Source of Variation
Total
Pen
Ration
Implant
R X Imp.
Animal/ R X Imp.
Degrees of Freedom
107
8
2
2
4
99
Mean Square
3,031.11
6,215.62
13,914.00
1,708.00
4,620.00
2,773.78
F
2.2408
3.0117
.3697
1.6656
Significant Difference
ns
ns
ns
ns

17
Carcass characteristics were not significantly different with
respect to hormone administration. Table 11 shows dressing percentages
on a pen basis. While the results were not statistically different,
the DES steers showed a strong favorable increase in dressing percent
age over the other hormone treatments. Tables 12, 13, 14, and 15,
give the remaining carcass data on a pen basis. A large error factor
and insignificant F values indicated more variation within treatments
than between them.
Pr6je(:tion of Retail Values
Retail values for ration and hormone treatments were determined
by an analysis and an equation of carcass characteristics projected
into a retail formulation value. Production costs were based on
actual animal performance and actual costs associated with the animals.
Table 16 gives the retail value of the steers by hundred weight
(cwt.) of carcass, whereas table 17 gives the total retail value based
on carcass weight. It is noted that on a hundred weight basis, the
urea ration produced the highest carcass value of the feeding treat
ments, but when applied to a total carcass value (table 17), the
control ration animals produced a substantially higher value, although
not statistically significant. When retail values were applied to
the hormone treatments, virtually no differences were noted on a cwt.
basis, but when the retail value was applied to the total carcass, DES
produced a substantially higher carcass value.

18
TABLE 11
MEAN DRESSING PERCENTAGES BY RATION AND HORMONE TREATMENTS ON A PEN BASIS
— ~ i — I — I 1 I _
Ration
Cont ro l Adapta t ion
None 59 .88 60.92
Hormone
DES 61.99 61.32
Imp lan t s
T e s t o s t e r o n e + PES 59.85 61.17
TABLE 12
MEAN U.S.D.A. GRADES BY RATION AND HORMONE TREATMENTS ON A PEN BASIS
Ration
Control Adaptation
None 8.9 8.3
Hormone
DES 8.3 7.7
Implants
. . . . . . Testosterone + DES 8.6 8.7
TABLE 13
MEAN U.S.D.A. MARBLING SCORES BY RATION AND HORMONE TREATMENTS ON A PEN BASIS
Ration
Control Adaptation
None 9.3 6.6
Hormone
DES 6.6 5.9
Implants
.....•;. Testosterone + DES 7.7 7.7
Urea
60.79
60.38
60.61
Urea
8.4
8.5
7.8
Urea
7.5
7.8
6.4

Hormone
Implants
Hormone
Implants
TABLE 14
MEAN BACK-FAT THICKNESS AND HOKMONE TREATMENTS ON A PEN BASIS (MILLIMETEP5)
Ration
19
Control Adaptation Urea
None 18.1 18.0 18.2
DES 19.2 14.3 16.4
Testosterone + DES 18.6 15.8 14.6
TABLE 15
MEAN RIBEYE AREAS BY RATION AND HQRl̂ ONE TREATMENTS ON A PEN BASIS (SQUARE INCHES)
R a t i o n
Control Adaptation Urea
None 11.4 11.7 11.3
DES 12.0 12.6 11.9
Testosterone + DES 11.3 11.9 11.4
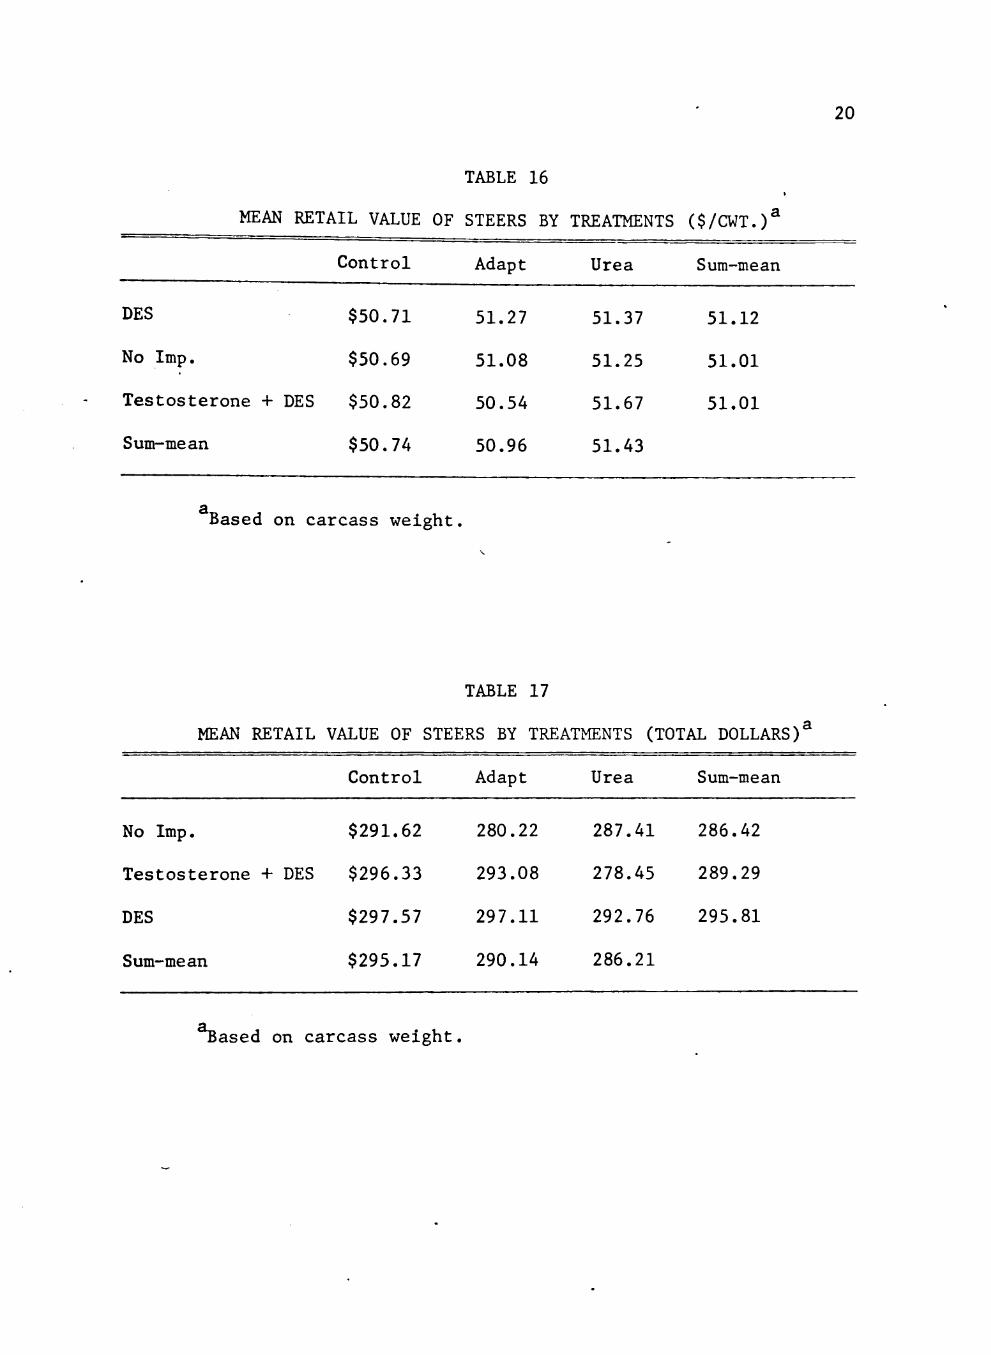
TABLE 16
20
MEAN RETAIL VALUE OF STEERS BY TREATMENTS ($/CWT.)'
DES
No Imp.
Sum-mean
Control
$50.71
$50.69
$50.82
$50.74
Adapt
51.27
51.08
50.54
50.96
Urea
51.37
51.25
51.67
51.43
Sum-mean
51.12
51.01
51.01
Based on carcass weight.
TABLE 17
MEAN RETAIL VALUE OF STEERS BY TREATMENTS (TOTAL DOLLARS)'
Control Adapt Urea Sum-mean
No Imp. $291.62 280.22 287.41 286.42
Testosterone + DES $296.33 293.08 278.45 289.29
DES $297.57 297.11 292.76 295.81
Sum-mean $295.17 290.14 286.21
cased on carcass weight.

21
Costs of production are presented in table 18. It is noted
that the control animals had a higher cost of production than the
adaptation or urea fed animals, however no statistical differences
were observed. No major differences were observed when costs were
applied to hormone treatments.
Table 19 gives the differential between retail value and
production costs. Carefully note that the adaptation ration gives
the highest margin over cost than either the control or urea fed
animals. Although not statistically different, this result is
surprising since the control animals performed much better when
evaluating only performance data. Also notice that the DES hormone
treatment had a significant (P<.01) difference over no implant, and
a difference (P<.10) over the animals implanted with testosterone
+ DES; yet, recall that no significance was observed in animal
response by hormone treatments.
The carcass retail values can be explained in this manner. Urea
treatment value per cwt. was highest of the feeding treatment values.
Yet the animals on the urea ration were lowest in performance. The
higher retail value per cwt. can be explained by fat deposition on the
animals. The urea fed cattle simply had less fat and less waste
per cwt. However, when this is applied to the total retail value, the
control animals, even while carrying more fat, produced a carcass that
was substantially higher in total retail value, due to the heavier
weight of the control animals. Note also the total retail value of
the DES implanted cattle and remember that the use of DES in steers

22
TABLE 18
ACTUAL COSTS OF PRODUCTION BY TREATMENTS
Control Adapt Urea Sum-mean
No Imp. $225.16 213.26 219.16 219.19
Testosterone + DES $225.34 220.56 214.28 220.06
DES $221.39 221.08 217.95 220.14
Sum-mean $223.96 218.30 217.13
TABLE 19
ACTUAL DIFFERENTIAL BETWEEN RETAIL VALUE AND PRODUCTION COST
Control ^ Adapt Urea Sum-mean
No Imp. $66.46
Testosterone + DES $70.99
DES $76.18
Sum-mean $71.21
a
66.96
72.52
76.03
71.84
68.25
64.17
74.81
69.08
67.23
69.23
75.67
^ o implant < DES (P<.01). Testosterone + DES < DES (P<.10).

23
tends to add more muscle instead of fat deposition. These observations
are based upon data obtained of the projection equation (Breidenstein
et _al., 1955).
It is felt that the optimum in carcass retail value, on either
a cwt. or total value basis, would be to feed animals having the
genetic potential to market at heavy weights but without extremes in
fat deposition. In short, feed larger animals. The retail value data
supports this statement.
Heifer Response - One Pen
Twelve heifers were used in a pilot study to observe response
differences to DES and testosterone + DES implants. The results are
presented in table 20. Significant differences were not detected for
daily gain. Dressing percentage favored the DES implanted group at
the (P<.10) level, although an F-test revealed no significance.
Using the pay weight and shrunk weight basis for evaluating animal
response, the testosterone + DES implanted heifers tended to show
favorable daily gains over the DES group. However, when pay weights
were adjusted to a common dressing percentage, daily gain favored the
DES group of heifers. Two heifers receiving the testosterone + DES
implant were pregnant at the time of slaughter, however their dressing
percentages were not indicative of this factor. Ribeye area and back-
fat thickness values were not significantly different between the two
groups. U.S.D.A. grade and marbling scores were not statistically
different. The analysis of variance for heifer dressing percentages
is presented in table 21.

24
TABLE 20
HORMONE IMPLANT EFFECTS UPON MEAN WEIGHT GAINS AND CARCASS CHARACTERISTICS OF ONE PEN OF HEIFERS
Item Hormone Implants
DES Testosterone + DES
Significant Difference
No. of animals
Animal response, pay weight basis, lb.
Initial wt. Final wt. Daily gain
Animal response, adjusted pay weight to 61% dressing percentage
Final wt. Daily gain
Animal response, shrunk weight basis, lb.
581.3 866.7 2.46
582.0 888.8 2.64
862.5 2.42
855.7 2.36
ns
ns
Initial wi. Final wt. Daily gain
Carcass data
Dressing percent U.S.D.A. grade ^ U.S.D.A. marbling score No. of abscessed livers Fetus at slaughter
Group performance, lb.
Daily feed intake Feed/lb. gain (pay wt.) Feed/lb. gain (adjusted
wt.) Feed/lb. gain (shrunk wt
549.3 866.7 2.74
60.78 8.7 7.8 0 0
19.68 7.72
8.23 .) 6.97
550.2 888.8 2.92
58.67 8.3 8.0 1 2
-
-
ns
(P<.10) ns ns —
^Purchase weight before hauling 300 miles to Lubbock.
Arithmetically shrunk 4%.
^On feed weight, after 300 mile haul.
Chilled carcass basis; 2% shrink of warm carcass weight.
®Good = 8 and Good + = 9.
Slight = 7 and Slight + = 8.

25
TABLE 21
ANALYSIS OF VARIANCE OF DRESSING PERCENTAGE FOR HEIFERS
Source of Degrees of Mean F Significant Variation Freedom Square Difference
Total 11 4.2727
Treatments 1 11 3.0555 ns
Error 10 3.6
Digestion Coefficients for Ration Treatments
Chromic oxide (Cr̂ Oj.) was used in the feeding treatments as an
Indicator to determine the relative digestibility of crude protein
and dry matter. Clanton (1962) indicated that the Cr^O^ method of
determining digestibility provided a valuable tool for ration compar
ison. Two rations were studied, the urea ration and the control ration.
The cattle had been on feed 86 days prior to the digestion study and
the adaptation ration had been changed to urea. Apparent digestion
coefficients are presented in table 22. Notice that the urea ration
provided more digestible protein than the control ration. However,
when one takes into account the standard deviation for each coefficient,
it is obvious that the digestibility was more variable than the control.
This was to be expected, based on the variability shown by the animals
throughout the feeding trial. The coefficients for dry matter were
similar between the two ration groups; however, dry matter digestibility
was more variable in the urea treatments. No statistical differences

26
were indicated between digestibility coefficients for the rations
shown in tables 23 and 24.
TABLE 22
APPARENT DIGESTION COEFFICIENTS AND STANDARD DEVIATIONS
Ration Ingredient Digestion Coefficient Standard Deviation
Urea
Digestible protein
Digestible dry matter
Control
Digestible protein
•Digestible dry matter
59.57
62.445
54.86
62.365
+ 9.21
+ 13.16
+ 4.90
+ 6.14
TABLE 23
ANALYSIS OF VARIANCE FOR DIGESTIBLE PROTEIN
Source of Variation
Degrees of Freedom
Mean Square
Significant Difference
Total
Rations
Observations/ ration (error)
11
1
10
55.585
66.6000
54.4840
1.2223 ns
TABLE 24
ANALYSIS OF VARIANCE FOR DIGESTIBLE DRY MATTER
Source of Variation
Degrees of Freedom
Mean Square
Significant Difference
Total
Rations
Observations/ ration (error)
11
1
10
90.4209
0.1100
99.4520
0.0011 ns

27
General Observations
The feeding period commenced on July 21, 1967, and concluded
116 days later on November 14, 1967. Environmental conditions were
favorable throughout the trial, with few extreme temperatures.
Health of all animals was excellent with the exception of one death
early in the feeding period and one steer becoming lame in the hind
quarters toward the end of the feeding period. Bloat and founder were
not encountered.
Daily observation revealed some "bulling" or "riding" in the
steer and heifer pens but this was not excessive and also no treat
ment patterns were indicated.
Animal response was recorded on three bases, pay weights,
adjusted pay weights to a common dressing percentage, and shrunk
weights. No significant differences in the recording systems were
revealed. However, pay weights tend to correlate more realistically
with a commercial feeding operation, whereas shrunk weights tend to
reveal animal response with more favorable results. On a strictly
comparative basis between feeding or hormonal treatments, the methods
revealed the same results. The adjustment of pay weights to a common
dressing percentage tends to be of useful value provided there are
major differences in the dressing percentages of animals between
treatments.

CHAPTER V
• SUMMARY
One hundred eight steers were used in a 3 x 3 factorial
arrangement to determine the effects of three feeding treatments
and three hormonal implantation treatments upon animal feedlot
response and carcass characteristics. Twelve heifers were used to
determine the effects of two hormonal treatments upon feedlot
response and carcass characteristics. Retail values based on the
carcass characteristics of the steers in each feeding and hormone
treatment were predicted. A digestion study using chromic oxide
as an indicator was used to compare digestibility of crude protein
and dry matter in the feeding treatments.
A difference (P<.01) was revealed in mean daily gains
favoring the plant-protein supplemented ration over the plant-
protein to urea adaptation ration and the urea ration. Efficiency
of feed utilization favored the plant-protein supplemented ration
over the adaptation and urea rations. Dressing percentage favored
the adaptation ration over the plant-protein and urea rations.
Animal response and carcass characteristics among the
hormonal treatments revealed no statistical differences. Daily gain,
efficiency of feed utilization, and dressing percentage favored the
animals receiving the diethylstilbestrol implant. Variation among
animals within treatments accounted for much of the variability in
28

29
the experiment.
Animal response and carcass characteristics among the hormone
treatments in the heifer pen revealed a difference (P<.10) in dressing
percentage for the diethylstilbestrol implanted heifers over the
testosterone-diethylstilbestrol implanted heifers. Mean daily gains
favored the testosterone-diethylstilbestrol heifers when response
was computed on a pay weight and a shrunk weight basis. On an adjusted
pay weight basis, the diethylstilbestrol heifers were favored.
The prediction of retail values and the computation of produc
tion costs associated with feeding and hormonal treatments revealed
a difference (P<.01) favoring diethylstilbestrol implants over no
implants in respect to a differential between retail value and
production costs. A difference (P<.10) was also indicated favoring
diethylstilbestrol over the testosterone-diethylstilbestrol implant.
Differences were accounted for by an analysis of the carcass
characteristics of the respective hormonal treatments which indicated
that the diethylstilbestrol treatments yielded higher retail carcasses.
Apparent digestion coefficients revealed no statistical
differences between the plant-protein supplemented ration and the urea
ration with respect to crude protein and dry matter. Standard
deviation computations indicated more variance in digestibility among
cattle fed the urea treatment.

LITERATURE CITED
Albin, Robert C. and Ralph Durham. 1967. Restricted feeding and use of dehydrated alfalfa meal and beef tallow in an all-concentrate ration for fattening steers. J. Animal Sci. 26:85.
Andrews, F. N., W. M. Beeson and Claude Harper. 1949. The effect of stilbestrol and testosterone on growth and fattening of lambs. J. Animal Sci. 8:578.
Andrews, F. N., W. M. Beeson and F. D. Johnson. 1954. The effects stilbestrol, dienestrol, testosterone and progesterone on the growth and fattening of beef steers. J. Animal Sci. 12:99.
Archibald, J. G. 1941. A study of urea as a partial substitute for protein in the ration of dairy cows. Mass. Agri. Exp. Sta. Bull. 278:21.
Archibald, J. G. 1943, Feeding urea to dairy cows. Mass. Agri. Exp. Sta. Bull. 406.
Armsby, H. P. 1911. The nutritive value of the non-protein of feeding stuffs. U.S.D.A. Bureau of Animal Industries Bull. 139:49.
Beeson, W. M., F. N. Andrews, Martin Stob and T. W. Perry. 1956. The effects of oral estrogens and androgens singly and in combination on yearling steers. J. Animal Sci. 14:679.
Bloom, S., N. L. Jacobson, R. S. Allen, L. D. McGilliard and P. G. Homeyer. 1957. Effects of various hay: concentrate ratios on nutrient utilization and production responses of dairy cows. II. Observations on ration digestability and on the excretion pattern of chromic oxide. J. Dairy Sci. 40:240.
Breidenstein, B. C , S. Ball, R. M. Forbes and J. R. Stouffer. 1955. Comparative evaluations of techniques used in estimating beef carcass quality. J. Animal Sci. 14:1227.
Burris, M. J., R. Bogart and A. W. Oliver. 1953. Alteration of daily gain, feed efficiency and carcass characteristics in beef cattle with male hormones. J. Animal Sci. 12:740.
30

31
Burroughs, W., C. C. Culbertson, E. Cheng, W. H. Hale and P. Homeyer. 1955. The influence of oral administration of diethylstilbestrol to beef cattle. J. Animal Sci. 14:1015.
Cahill, V. R., L. E. Kunkle, E. W. Klosterman, F. E. Deatherage and E. Wierbicki. 1956. Effect of diethylstilbestrol implantation on carcass composition and the weight of certain endocrine glands of steers and bulls. J. Animal Sci. 14:701.
Clanton, Donald C. 1962. Variation in chromic oxide methods of determining digestibility of hand-fed beef cattle rations. J. Animal Sci. 21:214.
Clegg, M. T. and H. H. Cole. 1954. The action of stilbestrol on the growth response in ruminants. J. Animal Sci. 13:108.
Davis, C. L., J. H. Beyers and L. E. Luber. 1958. An evaluation of the chromic oxide method for determining digestibility. J. Dairy Sci. 41:152.
Dinusson, W. E., F. N. Andrews and W. M. Beeson. 1950. The effects of stilbestrol, testosterone, thyroid alteration and spraying on the growth and fattening of beef heifers. J. Animal Sci. 9:321.
Durham, R. M., F. G. Harbaush, R. Stovell and G. F. Ellis. 1963. All-concentrate versus post roughage rations using milo as the grain for fattening cattle. Texas Tech College Livestock and Feeders Day Rpt. p. 5.
Durham, R. M., G. F. Ellis and R. C. Albin. 1966. Milo-meal byproduct and urea-aureomycin combination in all-concentrate rations for beef cattle. Pro. West. Sect. Am. Soc. Animal Sci. 17:289.
Ellis, G. F., Jr. 1965. All-concentrate feeding research. Grain Sorghum Research and Utilization Conf. Grain Sorghum Producers Ass*n. Amarillo, Tex. p. 21.
Furr, R. D., Keith Hansen, James A. Carpenter, Jr. and L. B. Sherrod. 1968. Effect of different nitrogen sources antibiotics and mineral supplements in all-concentrate finishing rations. Research Farm Reports p. 57.
Furr, R. D., and L. B. Sherrod. 1968. Variation in protein and mineral content of grain sorghum. T.T.R.F. Special Report 68-2.

32
Harris, L. E., and H. H. Mitchell. 1941. The value of urea in the synthesis of protein in the paunch of the ruminant. In Maintenance. J. Nutrition. 22:167-82.
Hart, E. B., G. Bohstedt, H. J. Geobald and M. I. Wegner. 1938. The utilization of the nitrogen of urea by growing calves. Proc. Am. Soc. An.
Hart, E. B., G. Bohstedt, H. J. Geobald and M. I. Wegner. 1938. The utilization of simple nitrogenous compounds such as urea and
• ammonium bicarbonate by growing calves. J. Dairy Sci. 22:785-98.
Jennings, Ralph D. 1952. Economic consideration in use of urea for feeding beef and dairy cattle. U. S. Dept. Agr. Econ. F. M. 98.
Johnson, B. Connor, Tom S. Hamilton, H. H. Mitchell and Willard B. Robinson. 1942. The relative efficiency of urea as a protein substitute in the ration of ruminants. J. Animal Sci. 1:236-45.
Kane, E. A., W. C. Jacobson and L. A. Moore. 1952. Diurnal variation in the excretion of chromium oxide and lignin. N. Nutr. 47:263.
Kercher, C. D. and D. V. Bishop. 1963. The influences of all-concentrate feeding on the growth and carcass characteristics of beef cattle. J. Animal Sci. 22:839. (Abst.).
Klosterman, Earle W., V. R. Cahill, L. E. Kunkle and A. L. Moxon. 1955. The subcutaneous implantation of stilbestrol in fattening bulls and steers. J. Animal Sci. 14:1050.
Ogilvie, M. L., E. C. Faltin, E. R. Hauser, R. W. Bray and W. G. Hoekstra. 1960. Effects of stilbestrol in altering carcass composition and feedlot performance of beef steers. J. Animal Sci. 19:991.
Oltjen, R. R., R. E. Davis and F. L. Hiner. 1965. Factors affecting performance and carcass characteristics of cattle fed all-concentrate rations. J. Animal Sci. 24:192.
0*Mary, C. C , A. L. Pope, G. D. Wilson, R. W. Bray and L. E. Casida. 1952. The effects of diethylstilbestrol, testosterone and progesterone on growth and fattening and certain carcass characteristics of Western lambs. J. Animal Sci. 11:656.
Perry, T. W., W. M. Beeson, F. N. Andrews and Martin Stob. 1955. The effect of oral administration of hormones on growth rate and deposition in the carcass of fattening steers. J. Animal Sci. 14:329.

33
Pope, L. S., L. E. Walters, G. R. Waller and W. D. Campbell. 1963. Fattening cattle on all-concentrate rations based on steam rolled milo. Okla. M. P. 70:82.
Roubicek, C. B., E. S. Erwin, G. E. Nelms and Bruce Taylor. 1960. Response of beef steers to multiple stilbestrol implants, pre-weaning, weaning, grazing and feedlot. J. Animal Sci. 19:966. (Abst.).
Smith, A. M. and J. T. Reid. 1955. Use of chromic oxide as an indicator of fecal output for the purpose of determining the intake of pasture herbage by grazing cows. J. Dairy Sci. 38:515.
Steel, Robert G. D. and James H. Torrie. 1960. Principles and Procedures of Statistics. McGraw-Hill Book Company, Incorporated, New York.
Wallentine, M. V., J. J. Drain, G. H. Wellington and J. I. Miller. 1961. Some effects on beef carcasses from feeding stilbestrol. J. Animal Sci. 20:792.
Wegner, M. I., A. N. Booth, G. Bohstedt and E. B. Hart. 1941. The utilization of urea by ruminants as influenced by the level of protein in the ration. J. Dairy Sci. 24:835-44.
Wilson, L. L., C. A. Dinkel, D. E. Ray and J. A. Minyard. 1963. Beef • carcass composition as influenced by diethylstilbestrol. J, Animal Sci. 22:699-701.
Wise, M. B., T. N. Blumer and E. R. Barrick. 1965. Influence of urea, fat and alfalfa meal on performance of steers fed all-concentrate rations. J. Animal Sci. 22:849.
Woods, Walter. 1962. Effect of implantation followed by feeding of stilbestrol on steer performance and carcass characteristics. J. Animal Sci. 21:533-536.