- the - changing landscape of legal education
TRANSCRIPT

LSSSEU N D E R S T A N D I N G L E G A L E D U C A T I O N
2020 SPECIAL REPORT
- The -CHANGING LANDSCAPE OF LEGAL EDUCATION
A 15-YEAR LSSSE RETROSPECTIVE

The Law School Survey of Student Engagement (LSSSE) is part of
Indiana University’s Center for Postsecondary Research (CPR),
a research center in the School of Education devoted to studying
the student experience. In addition to LSSSE, CPR houses the
National Survey of Student Engagement (NSSE) and the NSSE
Institute, the Faculty Survey of Student Engagement (FSSE), and
the Beginning College Survey of Student Engagement (BCSSE).
ADVISORY BOARDBryant G. Garth, Chair Distinguished Professor of Law Emeritus Co-Director, Center for Empirical Research on the Legal Profession University of California, Irvine School of Law
Richard A. Matasar Senior Vice President for Strategic Initiatives and Institutional Effectiveness Tulane University
Ajay K. Mehrotra Executive Director & Research Professor American Bar Foundation Professor of Law & History Northwestern University, Pritzker School of Law
Rachel F. Moran Distinguished Professor of Law University of California, Irvine School of Law
Camille A. Nelson Dean and Professor of Law University of Hawai‘i at Mānoa, William S. Richardson School of Law
Lauren K. Robel Provost and Executive Vice President Indiana University, Bloomington
Kellye Y. Testy President and CEO Law School Admissions Council
LSSSE STAFFMeera E. Deo LSSSE Director Professor of Law Thomas Jefferson School of Law William H. Neukom Fellows Research Chair in Diversity and Law American Bar Foundation
Chad Christensen LSSSE Project Manager
Jacquelyn Petzold LSSSE Research Analyst
CENTER FOR POSTSECONDARY RESEARCHAllison BrckaLorenz Project Manager, FSSE
Jennifer Brooks Project Services Manager
James S. Cole Project Manager, BCSSE
Kevin Fosnacht Research Analyst
Robert M. Gonyea Associate Director, Research & Data Analysis
Marilyn Gregory Finance Manager
Jillian Kinzie Associate Director, NSSE Institute
Sarah Martin Publications Coordinator
Alexander C. McCormick Director, NSSE
Angie Miller Research Analyst
Thomas F. Nelson Laird Director
Hien Nguyen Webmaster
Katie Noel Senior Office Administrator
Shimon Sarraf Assistant Director, Survey Operations & Project Services
Rick Shoup Research Analyst
Barbara Stewart Office Coordinator
2020 LSSSE SPECIAL REPORT 2

DEO, M.E., CHRISTENSEN, C., PETZOLD, J. (2020, DECEMBER). THE CHANGING LANDSCAPE OF LEGAL EDUCATION: A 15-YEAR LSSSE RETROSPECTIVE, LSSSE SPECIAL REPORT. BLOOMINGTON, IN: INDIANA UNIVERSITY CENTER FOR POSTSECONDARY RESEARCH
Table of Contents
4 FOREWORD
5 DIRECTOR’S MESSAGE
6 INTRODUCTION
9 CONSISTENT JOB EXPECTATIONS
10 DRAMATIC DEBT INCREASES
12 POSITIVE LEARNING OUTCOMES
13 HIGH LEVELS OF SATISFACTION
16 CONCLUSION
2020 LSSSE SPECIAL REPORT 3

ForewordBRYANT G. GARTHDistinguished Professor of Law Emeritus; Co-Director, Center for Empirical Research on the Legal Profession UNIVERSITY OF CALIFORNIA, IRVINE SCHOOL OF LAW
I am pleased to introduce the LSSSE report on “The Changing Landscape of Legal Education.” This is one of the first LSSSE reports to take advantage of the wealth of longitudinal data now available from the fifteen years of LSSSE surveys. The comparisons over time are meaningful, since the numbers are large and the pool of schools taking advantage of the survey annually is comparable over time, even though the specific schools change. I mainly want to applaud this report and the use of the longitudinal data. I will highlight a few of the rich set of findings that are especially notable.
One question is how law schools are doing in attracting the most elite and highly qualified undergraduates. The report shows a decline. It may be that the reluctance of the most selective law schools to utilize the survey means that the report undercounts the number of high LSATs within the full universe of law schools, but the decline that is reported for the LSSSE schools is likely still meaningful. It echoes the findings of other studies, such as the Before the JD study undertaken by the AALS.1 The steady increase in the number of women, while reflecting progress in gender equality, is also consistent sociologically with a relative decline in status of a profession relative to other elite careers, such as investment banking.
On the other hand, there is much to suggest that law school has made
1 Association of American Law Schools, Before the J.D.: Undergraduate Views on Law School (2018).2 Aaron N. Taylor, Robin Hood, in Reverse: How Law School Scholarships Compound Inequality, 47 J.L. & Educ. 41 (2018). 3 Yves Dezalay and Bryant G. Garth, Law as Reproduction and Revolution: An Interconnected History (forthcoming 2021).
some gains as a path to upward mobility. In terms of jobs, the general picture is that substantially more students in the study feel that they will gain positions in relatively large law firms, perhaps as a result of contractions in law school enrollments. Minority enrollment is slowly trending up. The larger number of respondents with the lowest LSATs and grades is also likely a sign that more disadvantaged students are enrolling, even if the number of first-generation college students seems to be steady. But as the report emphasizes, the debt story belies the story of opportunity. More students graduate with no debt, but we know those are likely results either of familial resources or merit scholarships, or a combination. Black and Latinx students, especially women, are by far the most indebted. The competition driven reliance on merit scholarships continues to be a policy of “reverse Robin Hood.”2
Law schools are succeeding in improving their teaching and overall commitment to helping students “understand people of other racial and ethnic backgrounds,” and encouraging students to “develop a personal code of values and ethics.” Students tend to value the services law schools provide more than in the past. There are issues of race and gender here as elsewhere, including within the overall positive satisfaction with law school, but law schools are for the most part getting better at satisfying their
consumers in this highly competitive world. Competition is helping students get personal guidance. Unfortunately, it is also contributing to the deplorable debt situation.
The hyper-competition and market orientation of US law schools was once unique to the United States. US legal academics, with good reason, believe that our law schools are the best in the world, with practical clinics, strong student services, engaged teaching from full-time teacher-scholars, and students looking toward prestigious positions. Faculties of law and law schools elsewhere in the world, as Yves Dezalay and I show in our forthcoming book,3 are increasingly emulating these characteristics and competing for global rankings biased toward US models of excellence. Yet this emulation goes with some version of “meritocracy,” as in the US, which stratifies schools, jobs, and incomes according to measured merit that corresponds to inherited social class. Those at the relatively few top-ranked schools abroad, which now have much higher tuitions than in the past, mainly come from advantage while those who attend the mass of more accessible law schools do not. And, as in the US, the more accessible schools are criticized for the lack of merit of their students and even closed down. Our unsolved legal education issues at home are becoming unsolved issues abroad.
2020 LSSSE SPECIAL REPORT 4

It is my distinct pleasure to celebrate fifteen years of data collected through LSSSE with publication of this special longitudinal report. Legal education has been the site of significant change over time. More people of color—especially Black and Latinx students—are enrolling in law school today than at any time in our nation’s history. However, along with increasing student diversity are skyrocketing debt levels, which are also at higher rates than ever before. Students report improvements in overall learning outcomes, whether considering their understanding of people from diverse backgrounds, ability to problem-solve, or development of professional values. Today, students engage in sustained interaction with faculty, staff, and classmates and report higher levels of satisfaction than in years past with academic advising, career counseling, personal counseling, and job search assistance. While the majority of students reported positive levels of overall law school satisfaction fifteen years ago, they have continued to report at those high levels in the intervening years and remain highly satisfied with their legal education today.
Yet data from the past indicate that we have considerable work still ahead. While some things have changed, significant challenges remain. The very increases in
student diversity we rightly applaud are tempered by the sky-high debt many students of color accrue to complete their law school education. Non-traditional students who borrowed at the highest levels a decade ago continue to do so now as racial/ethnic debt disparities widen. Although law schools have become more student-centered, students retain significant stress and anxiety yet remain reluctant to participate in personal counseling sessions at the same rate as they accept academic advising, career counseling, or job search assistance. Even a celebration of the high levels of overall satisfaction with law school over fifteen years is mitigated by raceXgender effects showing Black women consistently report lower satisfaction levels than their classmates from other backgrounds.
This special longitudinal report on the changing landscape of legal education defines where law schools have been and what we must prioritize to make tomorrow’s law schools more accessible, diverse, inclusive, equal, and welcoming for all students. We must continue the upward trajectory of adding diversity to the student body, increasing learning outcomes, and making both faculty and staff members available and approachable. In addition, administrators must consider gaps
in the data and opportunities for improvement: our most vulnerable students should not carry the highest debt loads, all those who could benefit from personal counseling should feel comfortable seeking out that help, and students of color should be as satisfied with their law school experience as their white classmates. How can we achieve these goals? LSSSE is here to help. By working in partnership with participating law schools, we amplify the student experience and make recommendations to improve legal education. Let’s make that our collective priority for the next fifteen years.
Director’s MessageMEERA E. DEO DIRECTOR , LSSSE
2020 LSSSE SPECIAL REPORT 5

PARTICIPATING LAW SCHOOLSSince 2004, 203 law schools in the U.S., Canada, and Australia have administered the LSSSE survey, eliciting over 380,000 student responses.
OBJECTIVESLSSSE provides data to law schools to improve legal education and inform decision-making and compliance efforts, enhance student success, facilitate internal assessment and analysis, and support research on legal education.
SURVEYThe LSSSE survey is administered online to all students at participating law schools. Each participating student takes approximately 15-20 minutes to complete the survey.
DATA SOURCESLSSSE data include survey responses and comments from JD and LLM students enrolled at participating law schools.
AUDIENCELSSSE's audience includes law school administrators and faculty, current and prospective law students, alumni, advisory boards, trustees, institutional researchers, accrediting organizations, and researchers studying legal education.
IntroductionOver the past fifteen years, LSSSE has
documented dramatic changes in legal education.
From 2004 to 2019, the changing landscape of law
school was punctuated by increasing diversity
among students, rising debt levels, relative
consistency in job expectations, and
improvements in various learning outcomes. In
spite of many challenges, law students
nevertheless report relatively constant positive
levels of satisfaction with legal education overall.
This LSSSE special report shares longitudinal
findings on select metrics as well as demographic
differences within variables to catalog how legal
education has changed over time. Looking at the
past can also help prepare us for our future.
Trends presented in this Report are based on
responses from more than 72,692 students at 248
law schools that participated in LSSSE in four
survey years: 2004, 2009, 2014, and 2019. The
number of law schools per year ranged from 42
(2004) to 70 (2019). The law schools participating in
LSSSE closely resemble ABA-approved law schools
overall in terms of enrollment size and affiliation
(public/private). Each year the average response
rate was over 50%.
Quick Facts
2020 LSSSE SPECIAL REPORT 6

1% 0.3% 0.3%1%1% 1%3%
4%
1% 1% 0.3%
There have been interesting demographic changes in legal education over the past fifteen years. Today, there are higher percentages of students of color than in 2004, and a commensurate decrease in the percentage of white students. Similarly, while women have been the slight majority of law students since at least 2004, by 2019 women had increased their share to 56%.4
4 LSSSE began collecting data on those who identify as neither male nor female but “another gender identity” in 2016; there were 1% in that category in 2019.
Disaggregating further, white men have consistently comprised the largest share of law students of any raceXgender group though that dropped from 86% in 2004 to 74% in 2019. The percentage of Black male law students doubled from 3% to 6% in fifteen years; while Black women have not seen similar gains, they did report a slight spike in 2014.
Shifting Demographics
Race, by Year Gender, by Year
raceXgender, by Year
ASIAN AMERICAN WHITEBLACKNATIVE AMERICAN LATINXMULTIRACIAL
2004
2019
MEN WOMEN
44%
49%
MALE MALE FEMALEFEMALE
2004 2019
2004 2019
83%
86%
6% 6%8%
5%7%
8%
6%
9%10%
7%7%
4%
74%
70%
80% 67%
6%6%
4% 8%6%
7%
9% 51%
56%
2020 LSSSE SPECIAL REPORT 7

The average age of law students has shifted slightly from 29 in 2004 to 27 in 2019. Although only 1% of those who took the LSSSE survey in 2004 were under 23 years old, the share of our youngest law students had risen to 9% by 2019. The majority of law students remain between 23-30 years old. While LSSSE did not collect data on sexual orientation in 2004, there is a decrease in students identifying as heterosexual between 2009 (96%) and 2019 (91%).5
There have also been variations in both LSAT scores and Undergraduate Grade Point Average (UGPA) for law students. In 2004, only 7% of law students had LSAT scores below 146 while those students comprise 12% of current LSSSE respondents. Most law students over the past fifteen years have fallen into the 151-160 range. The overall share of students with the highest LSAT scores dropped between 2004 and 2019, as did UGPAs. Those who earned under a 2.5 were only 2% of law students in 2004 but have risen to 4% now. Still, the vast majority of law students for every year measured earned at least a 3.0 in college. The middle years (2009 and 2014) saw a spike in those who had earned a 3.5 or above to roughly half of all law students. The overall percentage of first-gen students—those who are the first in their families to earn a college degree—has been relatively constant since 2014, the year LSSSE began collecting that data.
5 LSSSE began collecting data on those who identify as “bisexual,” “gay or lesbian,” and “heterosexual” in 2006 and added “another sexual orientation” as a response option in 2016, which captures roughly 1% of students.
Age, by Year
Sexual Orientation, by Year
LSAT Score, by Year Undergraduate Grade Point Average, by Year
<23
BISEXUAL
2004 20042019 2019
23–25
GAY OR LESBIAN
26–30
HETEROSEXUAL
31–40 >40
38%
>161 3.50 AND ABOVE
3.00-3.49
150–160
2.50-2.992.49 AND BELOW
<150
9%5%
43%28%
91%
14%
37%
96%
17%7%
1%
3% 4%1% 5%
2004
2009
2019
2019
26% 34%14%
42%
42% 40%
38%
17%
53%51%
21% 15%
2% 5%
2020 LSSSE SPECIAL REPORT 8

Since its inception in 2004, the LSSSE survey has asked students to report on their expected work environments after graduation. There are not dramatic shifts over time in this arena. Roughly half of all LSSSE participants have expected to join private firms upon graduation in a consistent fashion from 2004 (49%) through 2019 (45%). Similarly, expectations for work in government (including agencies, judicial clerkships, legislative offices, military, prosecutor’s office, and public defender’s office) has remained between 25% (2004) to 29% (2019) with little variation in the intervening years (28%). While there was a slight dip in 2009 (9%) in expectation for a future job related to business and
industry (likely due to the recession), there has been very little change between 2004 (11%) and 2014 or 2019 (both 12%). Expectations to work in public interest careers has also remained constant over fifteen years.
One interesting exception is the size of private firms students expect to join. While in 2004, 17% of students expected to join private firms with under 10 lawyers, that number has shrunk to only 8% with the majority of that change occurring between 2014 and 2019. On the opposite end, the share of students expecting to join large firms of over fifty attorneys has grown from just 13% in 2004 to 22% in 2019.
Consistent Job Expectations
Expected Future Work Environments, by Year
Private Firm Size
GOVERNMENT AGENCY
PUBLIC INTEREST GROUP
BUSINESS AND INDUSTRY
PRIVATE FIRM
<10 ATTORNEYS
10–50 ATTORNEYS
>50 ATTORNEYS
OTHER
26%
49%
45%
12%
10%
11%
9%5%
6%
27%
17%
19%
13%
8%
15%
22%
2004
2019
2020 LSSSE SPECIAL REPORT 9

In 2004, only 18% of all LSSSE respondents expected to owe more than $100,000 in student loan debt (including 5.1% for public law schools and 22% for private law schools). By 2019 that number had skyrocketed to 39% (27% public and 46% private). We see a significant shift between 2004 and 2009, when the percentage of students owing over $120,000 jumped from 6.4% to 24%. While 11% of law students carried no law school debt in 2004, that has grown to 18%. Even more problematic: while only 6.0% of law students accrued over $120,000 in debt fifteen years ago, that has climbed sharply to 29% of all students as of 2019. Overall, law school debt has increased significantly over time which means today’s law students are graduating with more debt burdens than ever before and carrying these into their first jobs and future careers.
Higher percentages of students from every racial/ethnic background owe higher amounts today than they did fifteen years ago. In 2004, 18% of white students expected to graduate with over $100,000 in law school loans, compared to 35% in 2019.
Student debt increases are even more troubling for students of color. While 21% of students of color expected to graduate owing over $100,000 in 2004, today roughly half (49%) of all students of color have over $100,000 in law school loans.
Dramatic Debt Increases
Students Expected to Owe Over $100K, by Year and Race
Expected Student Debt, by Year
200411%
200912%
201414%
201918%
$0/NO DEBT MORE THAN $100,000
18%
40%
43%
39%
2004 2009 2014 2019
ASIAN AMERICAN WHITE
LATINX
BLACK
NATIVE AMERICAN
22% / 22%21%
53%48% 55%
58%
38%
18%
35%
40%
40%
36%
36%
39% / 39%
14%
40%
34%
56%
2020 LSSSE SPECIAL REPORT 10

17%
39%
38%
32%
18%
41%
42%
37%
While the percentage of students owing over $100,000 peaked in 2014, it also declined at different rates for different racial/ethnic groups by 2019. The percentage owing over $100,000 declined for white students in 2019 (35%) to below 2009 levels (40%) and was the same for both years for Asian American students (36%). However, the percentage of Black students owing over $100,000 jumped from 38% in 2009 to an appalling 58% in 2014 and has decreased only slightly to 56% now. Over half of Latinx law students today are also borrowing over $100,000 to complete law school. Incorporating a raceXgender variable makes debt increases even more troubling. Past LSSSE research has found that Latinas and Black women are more likely to borrow over $200,000 than men of the same race/ethnicity or women from any other background.6 Longitudinal data show that this raceXgender disparity is also consistent over time.
6 Meera E. Deo and Chad Christensen, LSSSE 2019 Annual Report: The Cost of Women’s Success, Indiana University Center for Postsecondary Research (2019) (16% of Latinas and 14% of Black women borrow over $200,000 to pay for law school, compared to smaller percentages from every other raceXgender group).
ASIAN AMERICAN
WHITE WOMENBLACK
LATINX MEN
Students Expecting to Owe Over $100K, by Year and raceXgender
2004
2009
2014
2019
19% 20%
38%
55%
48%
38%
60%
60%
34%
35%
36%
24% 21% 23%
47%
52%
50%
22%
50%
57%
54%
39%
41%
36%
2020 LSSSE SPECIAL REPORT 11

According to LSSSE data, law schools contributed to increases in a variety of perceived learning outcomes from 2004 to 2019; collectively, these point toward progress in terms of how students measure their own skills and likely in terms of actual practice-readiness of graduates. In 2004, only 23% of students saw their schools as doing “quite a bit” or “very much” to help them understand people of other racial and ethnic backgrounds; because of steady increases over the next fifteen years, especially between 2009 and 2014, almost half (45%) of students today see their schools as doing “quite a bit” or “very much” to prepare them to interact with racially diverse colleagues and clients.
In addition, schools have increased their emphasis on professional responsibility in the past fifteen years. While even in 2004 a full 43% of students saw their schools as doing “quite a bit” or “very much” to encourage them to develop a personal code of values and ethics, that number has now grown to 58%.
Schools were already prioritizing complex problem solving fifteen years ago, and students see institutional support for this skill growing over time as well. While in 2004, 12% of students believed their law schools contributed “very much” to their ability to solve “complex real-world problems,” that percentage has doubled over fifteen years so that now almost a quarter (24%) of students agree.
Law schools are also encouraging students to focus on developing career goals and aspirations. In 2004, almost a quarter (23%) of all law students saw their schools doing “very little” to contribute to their developing clearer career goals; by 2019 those statistics dropped to 14%. On the flip side, while only 11% saw their schools doing “very much” in this regard in 2004, that number has risen steadily reaching 22% in 2014 and remaining there in 2019.
Understanding People of Other Racial/Ethnic Backgrounds, by Year
Solving Complex Real-World Problems, by Year
Developing a Personal Code of Values and Ethics, by Year
Developing Clearer Career Goals, by Year
Positive Learning Outcomes
2004
2004 2004
2004
2009
2009 2009
2009
2014
2014 2014
2014
2019
2019 2019
2019
23% 43%
37%45%
34% 49%
47%55%
41% 55%
54%60%
45% 58%
54%60%
School Contributed to Student...
2020 LSSSE SPECIAL REPORT 12

High Levels of Satisfaction Over the past fifteen years, students consistently have reported very high levels of overall satisfaction with law school. Furthermore, if we consider student satisfaction with a number of different encounters—including academic advising, career counseling, personal counseling, and job search help—we see a consistent pattern of improvement over fifteen years. When students were asked, “How would you evaluate your entire educational experience at your law school?” they reported remarkably similar results over the past fifteen years. Over eighty percent of all law students rate their experience as at least “good” with roughly one-third of all students saying they have enjoyed an “excellent” law school experience.
While over half (53%) of students who sought out academic support were “satisfied” or “very satisfied” with advising and planning in 2004,
that number grew to almost three-quarters (71%) of all students by 2019. Interestingly, there are also more students using academic advising and planning today than in years past: a full 94% of students used those services last year.
Students also appreciate how the significant investment of career counselors improves their professional prospects. While fifteen years ago, 51% of students were satisfied with career counseling (and 9.9% of these were “very satisfied), satisfaction has grown steadily over time with 60% satisfied in 2009, 64% in 2014, and a remarkable 69% satisfied in 2019 (with 22% of those noting they are “very satisfied”). As with academic advising, higher percentages of students are taking advantage of career counseling—only 8.0% of students in 2019 did not use this service (compared to 15% in 2004).
Satisfaction with Academic Advising, by Year
Satisfaction with Personal Counseling, by Year
Satisfaction with Career Counseling, by Year
Satisfaction with Job Search Help, by Year
2004
2004 2004
2004
2009
2009 2009
2009
2014
2014 2014
2014
2019
2019 2019
2019
61% 51%
49%57%
67% 60%
56%65%
68% 64%
60%67%
71% 69%
66%68%
Satisfaction with Law School, by Year
82%
84%
83%
81%
2004
2009
2014
2019
Percentage rating their overall experience as “Excellent” or “Good”
2020 LSSSE SPECIAL REPORT 13
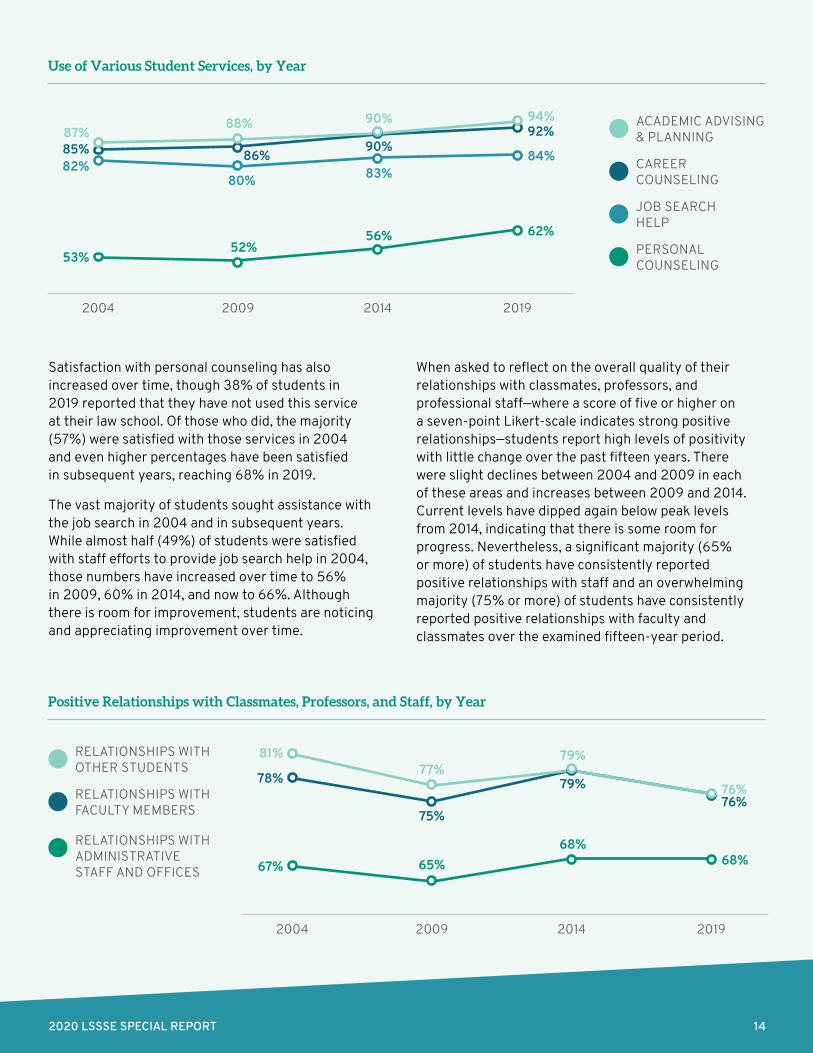
Satisfaction with personal counseling has also increased over time, though 38% of students in 2019 reported that they have not used this service at their law school. Of those who did, the majority (57%) were satisfied with those services in 2004 and even higher percentages have been satisfied in subsequent years, reaching 68% in 2019.
The vast majority of students sought assistance with the job search in 2004 and in subsequent years. While almost half (49%) of students were satisfied with staff efforts to provide job search help in 2004, those numbers have increased over time to 56% in 2009, 60% in 2014, and now to 66%. Although there is room for improvement, students are noticing and appreciating improvement over time.
When asked to reflect on the overall quality of their relationships with classmates, professors, and professional staff—where a score of five or higher on a seven-point Likert-scale indicates strong positive relationships—students report high levels of positivity with little change over the past fifteen years. There were slight declines between 2004 and 2009 in each of these areas and increases between 2009 and 2014. Current levels have dipped again below peak levels from 2014, indicating that there is some room for progress. Nevertheless, a significant majority (65% or more) of students have consistently reported positive relationships with staff and an overwhelming majority (75% or more) of students have consistently reported positive relationships with faculty and classmates over the examined fifteen-year period.
Use of Various Student Services, by Year
Positive Relationships with Classmates, Professors, and Staff, by Year
2004
2004
2009
2009
2014
2014
2019
2019
CAREER COUNSELING
RELATIONSHIPS WITH FACULTY MEMBERS
PERSONAL COUNSELING
RELATIONSHIPS WITH ADMINISTRATIVE STAFF AND OFFICES
JOB SEARCH HELP
ACADEMIC ADVISING & PLANNING
RELATIONSHIPS WITH OTHER STUDENTS
62%
68%
53%
67%
52%
65%
56%
68%
84%82%
80% 83%
92%
76%
85%
78%
86%
75%
90%
79%
94%
76%
87%
81%
88%
77%
90%
79%
2020 LSSSE SPECIAL REPORT 14

While overall satisfaction rates look surprisingly constant over time, there are nevertheless disparities and differences. Once we disaggregate the data by race, gender, and raceXgender, clear patterns emerge. Even in 2004, a smaller percentage of Black women (19%) than any other raceXgender group rated the overall quality of their educational experience in law school as “excellent” while much larger percentages of white men (34%) and Latinx men (35%) did. Higher percentages of men than women within each racial/ethnic group of color also saw their overall law school experience as “excellent” in 2004. While those results have varied somewhat over time, whites as a whole consistently have the highest rates of overall satisfaction. White women tend to be more satisfied with their law school experience than any other raceXgender group while Black women have been consistently least satisfied.
ASIAN AMERICAN WHITE WOMENBLACK LATINX MEN
Satisfaction with Law School, by Year and raceXgender
2004 2019
77% 79%84% 83% 84%82%85%
75%77%73% 70%
83% 84% 84%78%79%
Percentage rating their overall experience as “Excellent” or “Good”
2020 LSSSE SPECIAL REPORT 15

ConclusionThe past fifteen years represent a changing landscape within legal education, as documented by LSSSE data collected between 2004 and 2019. While white men remain the largest raceXgender demographic, there are now higher percentages of women as well as students of color—especially Black and Latinx students—than in previous years. Metrics for incoming students dropped slightly between 2004 and 2019, as measured by both LSAT scores and UGPAs, though the vast majority of law students had earned at least a 3.0 in college. Expectations for future jobs have also remained relatively constant, with roughly half of all law students between 2004 and 2019 expecting to join private law firms of various sizes upon graduation.
The most disturbing negative change over time has been the dramatic rise in law school debt incurred by graduates. These increases are even more troubling when we consider that the highest debt burdens are carried by students of color—especially Black and Latinx students and more specifically Black women and Latinas. Previous LSSSE reports have documented how tuition discounts and merit-based scholarships have perpetuated inequalities for students of color over the years.7 In this report, we place those challenges in the broader context of shifts in legal education more generally.
On a more positive note, LSSSE data has documented real growth in terms of institutionally-supported learning outcomes between 2004 and 2019. Students report increases in school contributions to their understanding of people of different racial/ethnic
7 Aaron N. Taylor and Chad Christensen, LSSSE 2016 Annual Report: Law school Scholarship Policies: Engines of Inequality, Indiana University Center for Postsecondary Research (2017); Aaron N. Taylor, Chad Christensen, and Louis M. Rocconi, LSSSE 2015 AnnualReport: How a Decade of Debt Changed the Law Student Experience, Indiana University Center for Postsecondary Research (2016).
8 Meera E. Deo and Chad Christensen, LSSSE 2020 Annual Report: Diversity & Exclusion, Indiana University Center for Postsecondary Research (2020).
backgrounds, developing a personal code of values and ethics, complex problem solving, and developing clearer career goals. Taken together, these signal that students are more prepared than ever to enter a diverse workforce and manage the professional responsibilities that will be relevant to their various career paths.
Perhaps because of these gains, overall satisfaction rates have remained high throughout the past fifteen years. Law students report high rates of satisfaction with academic advising, career counseling, personal counseling, and job search help. In addition, roughly two-thirds of students have consistently reported that they have positive relationships with administrative staff while an impressive three-quarters report strong relationships with faculty. Similarly, over three-quarters of all law students between 2004 and 2019 reported positive relationships with classmates. This signals the impressive job that administrators, staff, and faculty have done engaging with students even in difficult times.
Yet, when considering race, gender, and raceXgender effects, there are consistent ongoing disparities even with regard to overall satisfaction. Whites have uniformly had the most positive law school experience, followed by Latinx students. Additionally, white women have been most satisfied with law school over the past fifteen years, while Black women are the least likely of all raceXgender groups to rate their overall experience as “good” or “excellent”. The positive gender dynamic of white women enjoying law school at the highest levels is
tempered by the racial reality that law school is not nearly as affirming for their Black women classmates.
Together these trends demonstrate a number of interesting points. First, and perhaps most importantly, even during challenging times legal education has managed to weather the storm with few tumultuous changes. Even during what was roundly considered a crisis in legal education, there are few demonstrated dramatic peaks or valleys over the past fifteen years. Second, students as a whole are graduating more prepared for their future careers than at any time in the past fifteen years, whether considering their understanding of diversity, personal ethics, problem-solving skills, or career goals. Yet there are troubling trends too. While many will rightly applaud documented growth in the percentages of Black and Latinx students entering legal education, that enthusiasm should be mitigated by the fact that these increases coincide with a dramatic rise in law school debt—carried largely by these same non-traditional students. Finally, while students from all backgrounds have very high levels of satisfaction with their overall law school experience, students of color—especially Black women—have been consistently least likely to rate their experience as positively as classmates from other backgrounds. This represents a troubling pattern that may reflect the devaluing and resulting lack of belonging of Black women students that have been documented elsewhere.8 Administrators and educators should continue to study the longitudinal changes shared here not only to understand trends over time from the past, but to consider which metrics to prioritize as we move into the future.
2020 LSSSE SPECIAL REPORT 16

INDIANA UNIVERSITY CENTER FOR POSTSECONDARY RESEARCH
201 N. ROSE AVEBLOOMINGTON, IN 47405-1006PHONE: 812-856-5823E-MAIL: [email protected]: LSSSE.INDIANA.EDU
LSSSEU N D E R S T A N D I N G L E G A L E D U C A T I O N
2020 SPECIAL REPORT