· table of contents i . introduction . background .................... scope of study...
TRANSCRIPT


Tim e Differ entia t e d A c c o u n t ing Cost and Short Run Marginal cost Study
Empire District Electric Company
December 1982

TABLE OF CONTENTS
I . INTRODUCTION . Background . . . . . . . . . . . . . . . . . . . . Scope of Study . . . . . . . . . . . . . . . . . . Overview of the Results Obtained for EDECo . . . . Organization of Report . . . . . . . . . . . . . .
I1 . A GENERAL METHODOLOGY FOR ALLOCATING GENERATION COSTS ON A TIME-OF-DAY BASIS . . . e
Background . . . . . . . . . . . . . . . . . . . . Determination of Accounting Costs on a Time-of-Use Basis . . . . . . . . . . . . . . . .
Operating Costs . . . . . . . . . . . . . . . Maximum Usage Allocation Method . . . . . . . Peak Hour Allocation Method . . . . . . . . . Modified Peak Hour Allocation Method . . Seldom Used Units . . . . . . . . . . . . . .
Capital Costs . . . . . . . . . . . . . . . .
Customer Class Allocation Methodology . . . . . . Energy Allocation . . . . . . . . . . . . . . Demand Allocation . . . . . . . . . . . . . .
Methodology for Short Run Marginal Costs . . . . . Concept of Short Run Marginal Cost . . Determination of Short Run Marginal Cost of Production on a Time-of-Use Basis .
Choice of Costing Periods . . . . . . . . . . . . Introduction . . . . . . . . . . . . . . . . Determination If There Are Significant
Cost Differences . . . . . . . . . . . . . Significant Cost Differences . . . Determination of Costing Periods Based on
Page
1-1
1-1
1-2
1-2
1-2
11-1
11-1
11-3
11-3 11-5 11-6 11-7 11-8 11-9
11-9
11-10 11-10
11-1 1
11-1 1
11-1 1
11-12
11-12
11-13
11-14

TABLE OF CONTENTS (Cont'd)
Page
111. APPLICATION OF THE EMBEDDED TIME-OF-USE COST METHODOLOGY TO EMPIRE DISTRICT ELECTRIC COMPANY. 111-1
Analysis of Operating Costs . . . . . . . . . . . 111-1
Selection of Hourly Loads. Treatment of Outages . . . . . . Treatment of Sales and Purchases Choice of Fuel Prices. . . . Unit Specific Input. . . . Hydro Generation . . . . . . Numerical Results from EBCOST. EBCOST Output.
. . . e * *
. . . e . . . . . . . . . . . . . .
. . . . . e . . . . . * . . . . . .
. . . e . .
111-2 111-2 111-3 111-4 111-4 111-7 111-7 111-7
Analysis of Capital Costs . . . . . . . . . . . . 111-10
Introduction . . . . . . . . . . . . . . . . 111-10 Inputs to the Method . . . . . . . . . . . . 111-10 Results of the Capital Cost Allocation Analysis . . . . . . . . . . . . . . . . 111-14
Average Total Costs . . . . . . . . . . . . . . . 111-15
Selection of Costing Periods for the Analysis of Embedded Costs by Time of Use. . . . . . . . . 111-20
Cost Separation. . . . . . . . . . . . . . . 111-20 Weighted Average Cost by Period. . . . . . . 111-22
Allocation of Production Costs to Customer Classes . . . . . . . . . . . . . . . . . . . . . 111-29
IV. SHORT RUN MARGINAL COSTS FOR EMPIRE DISTRICT 1v-1 ELECTRIC COMPANY . . . . . . . . . . . . . . . . . . .
Introduction. . . . . . . . . . . . . . . . . 1v-1
Short Run Marginal Costs. . . . . . . . . . . 1v-1
Determination of the Breakpoint . . . . . . . . . 1v-1
Selection of Optimal Costing Periods. . . . . . . 1v-4

TABLE OF CONTENTS (Cont'd)
Page
Summary of Short Run Marginal Cost by Optimal Costing Period. . . . . . . . . . . IV-8
Selection of Appropriate Rating Periods . . . . IV-8
Summary of Short Run Marginal Cost by Rating Period . . . . . . . IV-11
APPENDIX A: DESCRIPTION OF EBCOST . . . . . . . . . A- 1
APPENDIX B: CAPITAL COST ALLOCATION TO TIME-OF-USE. B-1

I. INTRODUCTION
BACKGROUND
On November 9 , 1978, t h e P u b l i c U t i l i t y Regu la to ry P o l i c i e s Act
of 1978 (PURPA) became law. Under S e c t i o n 133 (Ga the r ing I n f o r m a t i o n on
C o s t s of S e r v i c e ) , Congress r e q u i r e d t h a t each covered e l e c t r i c u t i l i t y
would p e r i o d i c a l l y g a t h e r and r e p o r t i n f o r m a t i o n n e c e s s a r y t o de t e rmine the
c o s t of p r o v i d i n g e l ec t r i c s e r v i c e . To c a r r y ou t t h i s o r d e r , Congress
i n s t r u c t e d t h e F e d e r a l Energy Regu la to ry Commission (FERC) t o " p r e s c r i b e
t h e methods, p rocedure , and format t o be used by e l e c t r i c u t i l i t i e s i n
g a t h e r i n g the i n f o r m a t i o n . . ." In r e sponse t o t h e s e i n s t r u c t i o n s , FERC i s s u e d F i n a l Regu la t ion
(Order No. 48) on September 28, 1979. Subsequen t ly , two amendments t o
Order No. 48 were i s s u e d .
The p o r t i o n of t h e r e g u l a t i o n s p e r t i n e n t t o t h i s r e p o r t i s
SUBPART E-CALCULATED COSTS, i n which the r u l e s are s t a t e d f o r r e p o r t i n g
a c c o u n t i n g c o s t s ( P a r a . 290.501) by c o s t i n g pe r iod and marg ina l c o s t s
( P a r a . 290.502) by c o s t i n g pe r iod . These c o s t s should a l s o be r e p o r t e d by
customer group and v o l t a g e l e v e l , and demand, ene rgy , and customer cha rges
s h o u l d be s e p a r a t e l y i d e n t i f i e d .
In o r d e r to meet t h e s e c o s t - o f - s e r v i c e r e p o r t i n g r equ i r emen t s ,
Empire Distr ic t Electric Company (EDECo.) engaged E r n s t C Whinney t o
p r o v i d e t e c h n i c a l a s s i s t a n c e .
1-1

SCOPE OF STUDY
E r n s t & Whinney a s s i s t e d EDECo. i n t h e performance of two c o s t
a n a l y s e s . These i n c l u d e d a t i m e d i f f e r e n t i a t e d p r o d u c t i o n accoun t ing c o s t
s t u d y t o t h e customer c lass l e v e l and a s h o r t run marg ina l g e n e r a t i o n c o s t
Study.
The time d i f f e r e n t i a t e d a c c o u n t i n g c o s t s t u d y c o n s i s t e d of
d e t e r m i n i n g ave rage embedded a c c o u n t i n g p r o d u c t i o n c o s t s by hour f o r t he
t e s t year ( A p r i l 1, 1980 - l l a r ch 30, 1981) and then u s i n g t h e s e c o s t s t o
e s t a b l i s h c o s t i n g p e r i o d s based on c o s t homogeneity. Embedded accoun t ing
c o s t s c o n s i s t of ene rgy r e l a t e d c o s t s ( o p e r a t i n g c o s t s ) and demand r e l a t e d
c o s t s ( c a p i t a l c o s t s ) . The methodologies employed are d i s c u s s e d i n t h e
n e x t c h a p t e r .
OVERVIEW OF THE RESULTS OBTAINED FOR EDECo.
The resu l t s a t t h e system l e v e l fo r t h e time d i f f e r e n t i a t e d
a c c o u n t i n g c o s t s t u d y and f o r t h e s h o r t run marg ina l c o s t s t u d y are shown
i n E x h i b i t 1-1. T h i s e x h i b i t i d e n t i f i e s t h e peak and off-peak p e r i o d s f o r
e a c h s t u d y and shows t h e a s s o c i a t e d weighted ave rage p r o d u c t i o n c o s t s f o r
e a c h pe r iod . The p r e s e n t a t i o n of c o s t s by p e r i o d does no t imply t h a t time
d i f f e r e n t i a t e d rates based on t h e s e c o s t s would be b e n e f i c i a l . Moreover,
c h a r g i n g rates e q u a l t o t h e s h o r t run marg ina l c o s t s would not s a t i s f y t h e
revenue r equ i r emen t s .
ORGANIZATION OF REPORT
The remainder of t h e r e p o r t i s d i v i d e d i n t o t h r e e c h a p t e r s and -
two appendices. Chapter I1 describes the methodologies we used to estimate
time d i f f e r e n t i a t e d a c c o u n t i n g c o s t s and s h o r t run marg ina l c o s t s .
1-2

Peak
EXHIBIT 1-1 EMPIRE DISTRICT ELECTRIC COMPANY
AVERAGE AND SHORT RUN MARGINAL COSTS BY COSTING PERIOD (S/MWH)
Energy Cost Demand Cost
T o t a l
Off -Peak
Energy Cost Demand Cost
T o t a l
T o t a l Year
Energy Cost Demand Cost
T o t a l
Average C o s t s
J u n e 1 - September 30 1O:OO a.m. - 9:OO p.m.
18.24 14.16 32.40
A l l o t h e r hour s
14.99 10.68 25.67
15.68 11.45 27.12
S h o r t Run Margina l C o s t s
J u n e 1 - September 30 11:OO a.m. - 1O:OO p.m.
21.97
21.97
All o t h e r h o u r s
11.39
11.39 -
13.66 - 13.66
1-3

Chapter 111 c o n t a i n s t h e r e s u l t s of t h e a p p l i c a t i o n of t h e s e methodologies
t o EDECo. The r e s u l t s of t h e s h o r t r u n marg ina l c o s t a n a l y s i s are
p r e s e n t e d i n Chapter I V . Appendix A d e s c r i b e s EBCOST, t h e u n i t commitment
model used t o r e d i s p a t c h EDECo .' s g e n e r a t i n g u n i t s . F i n a l l y , Appendix B
d e s c r i b e s t h e c a p i t a l c o s t a l l o c a t i o n models.
1-4

11. A GENERAL METHODOLOGY FOR ALLOCATING GENERATION COSTS ON A TIME-OF-DAY BASIS
BACKGROUND
The allocation of the costs of producing electricity is a
controversial topic. Traditionally, the allocation process has been
directed toward allocating costs to different customer classes. To this
end, many different methods have evolved, including allocation of capital
costs based on contribution to coincident peak, contribution to
noncoincident peak, contribution to average monthly peak, etc. The reason
for the variety of methods stems from the many different interpretations of
cost causality. The early economic considerations in this area focused on
the jointness of production; i.e., utility plant was used to jointly
produce electricity for residential, commercial, and industrial customers.
Thus, these customers have to share the costs. Unfortunately, no one
allocation procedure has been shown to be theoretically superior. This
study concerns both jointness over time and customers.
In some ways, allocating costs to time periods is relatively
straightforward. For example, system dispatch models and/or
production-costing models are common to the industry. Many of these models
allow the user to determine the least cost combination of equipment from
the generation mix owned by the utility to meet the load on an hourly
basis. The least cost combination is based on the variable c o s t s of
11-1

o p e r a t i o n and i g n o r e s t h e c a p i t a l component i n t h e t o t a l c o s t s . S ince
t h e s e programs i n c o r p o r a t e t h e major e n g i n e e r i n g f e a t u r e s and c u r r e n t f u e l
p r i c e s t h a t a f f e c t machine u s e , t h e r e s u l t s from t h e s e programs a r e
g e n e r a l l y r e p r e s e n t a t i v e . The o u t p u t s from t h e a n a l y s i s a r e t h e h o u r l y
l o a d i n g s of each u n i t and t h e ave rage v a r i a b l e c o s t s of p roduc t ion .
The p rope r method f o r t h e a l l o c a t i o n of t h e embedded c a p i t a l
c o s t s t o t ime p e r i o d s is n o t a s obv ious . S i n c e t h e ma jo r c o s t s o f
g e n e r a t i o n equipment occur whether t h e equipment i s used a t a p a r t i c u l a r
t ime o r n o t , an a l l o c a t i o n s t r i c t l y on kWh may be i n a p p r o p r i a t e ,
a l l o c a t i o n of a l l c a p i t a l c o s t s t o t h e peak pe r iod i s q u e s t i o n a b l e s i n c e
t h i s f a i l s t o r ecogn ize t h a t t h e a c t u a l g e n e r a t i n g mix , hence embedded
c o s t s , i s based on t h e shape of t h e e n t i r e load cu rve a s wel l a s t h e peak
l o a d . The l o s s of load concept can be used , b u t i t s a p p l i c a t i o n r e q u i r e s
n o t on ly knowledge of t h e loss of load p r o b a b i l i t y , b u t a l s o knowledge o f
t h e v a l u e of t h e economic l o s s of s o c i e t y i f t h e load is not met. S ince
t h e l a t t e r p i e c e of i n f o r m a t i o n i s v e r y d i f f i c u l t t o o b t a i n , t h i s approach
i s of l i m i t e d v a l u e .
L ikewise ,
E r n s t & Whinney h a s deve loped t h r e e d i f f e r e n t methods t o a l l o c a t e
c a p i t a l c o s t s . These methods a r e d e s c r i b e d and t h e r e s u l t s o b t a i n e d from
a p p l y i n g s e v e r a l of them are r e p o r t e d .
I n t h i s c h a p t e r we w i l l d i s c u s s t h e E r n s t & Whinney method of
d e t e r m i n i n g t h e a c c o u n t i n g c o s t s of g e n e r a t i o n on a time-of-use b a s i s .
T h i s w i l l i n c l u d e a d e s c r i p t i o n of t h e a l l o c a t i o n of v a r i a b l e o r o p e r a t i n g
c o s t s on a time-of-use b a s i s a s w e l l as t h e methods of a l l o c a t i n g c a p i t a l
c o s t s . Secondly , t h e method of d e t e r m i n i n g shor t - run margina l c o s t s w i l l
b e d i s c u s s e d . I n a d d i t i o n , t h e c h a p t e r w i l l p r e s e n t a d i s c u s s i o n - o f t h e
s e l e c t i o n of c o s t i n g p e r i o d s . F i n a l l y , t h e method used t o a l l o c a t e t h e
11-2

t ime d i f f e r e n t i a t e d p r o d u c t i o n accoun t ing c o s t s t o customer c l a s s e s w i l l be
d i s c u s s e d .
DETERMINATION OF ACCOUNTING COSTS ON A TIME-OF-USE BASIS
O p e r a t i n g C o s t s
T h i s s e c t i o n p r o v i d e s an overv iew of t h e methodology employed
t o de t e rmine o p e r a t i n g c o s t s on an h o u r l y b a s i s .
d e s c r i p t i o n of t h e E r n s t C Whinney approach i s g i v e n i n Appendix A .
A m o r e d e t a i l e d
Hour ly o p e r a t i n g c o s t s a r e de te rmined on t h e b a s i s of a t e s t
y e a r , whish can be an h i s t o r i c a l y e a r , a f u t u r e y e a r , o r a combina t ion of
t h e two. Sys em s p e c i f i c d a t a such a s monthly peak and e n e r g y , h o u r l y load
d a t a , month ly n e t i n t e r c h a n g e f lows and c o s t s , and f u e l c o s t i s o b t a i n e d
from t h e u t i 1 t y . G e n e r a t i o n u n i t i n f o r m a t i o n m u s t a l s o be provided by t h e
company, i n c l u d i n g :
Un i t name and number
Mi nimurn and maximum c a p a c i t y
Fuel c o s t s
Minimum load MBtu's
Minimum up and down t imes
Type of u n i t (must run , peaker , e t c . )
V a r i a b l e main tenance c o s t
Response r a t e
Increment a1 h e a t r a t e cu rve
S t a r t - u p c o s t s .
These d a t a p rov ide t h e b a s i s f o r t h e q u a n t i f i c a t i o n o f t h e i n p u t s r e q u i r e d
f o r our g e n e r a t i o n c o s t i n g model, EBCOST.
11-3

EBCOST, a computer model which s i m u l a t e s system o p e r a t i o n ,
produces an h o u r l y s c h e d u l e f o r n e t g e n e r a t i o n which minimizes t h e t o t a l
o p e r a t i n g c o s t of t h e sys t em. T h i s o b j e c t i v e i s t h e same a s t h a t of
d i s p a t c h p e r s o n n e l , so t h a t EBCOST o u t p u t s do , i n f a c t , c l o s e l y match t h e
a c t u a l system o p e r a t i o n . The EBCOST sys tem schedu le c o n s i s t s of s t a r t - u p
and shutdown times f o r a l l u n i t s , p l u s d i s t r i b u t i o n of h o u r l y g e n e r a t i o n
r e q u i r e m e n t s o v e r a l l u n i t s on l i n e t o meet each h o u r l y load . Adequate
s p i n n i n g and f a s t s t a r t r e s e r v e s a r e ma in ta ined and o t h e r c o n s t r a i n t s s u c h
a s must-run u n i t s a r e r ecogn ized . T h i s model can a l s o c o n s i d e r scheduled
n e t i n t e r c h a n g e c o n t r a c t d e l i v e r i e s , pu rchase c o n t r a c t s w i t h a s s o c i a t e d
demand c o s t s , u n i t main tenance s c h e d u l e s i n c l u d i n g p a r t i a l d e r a t i o n s , and
minimum down time and minimum up time c o n s t r a i n t s .
EBCOST employs s i n g l e d imens ion forward dynamic programming
t e c h n i q u e s which pe rmi t an i n v e s t i g a t i o n of a l l s t a r t - u p and shutdown
a l t e r n a t i v e s , g i v e n t h e i n i t i a l sys tem s t a t u s . The program e v a l u a t e s t h e
c o s t , i n c l u d i n g s t a r t - u p c o s t s and purchase demand c o s t s , of d i s p a t c h i n g a
g roup of u n i t s which have been s e l e c t e d by s t a r t - u p p r i o r i t y o r d e r .
A f t e r t h e program e v a l u a t e s a l l of t h e i n p u t s , i t de t e rmines t h e
sys t em d i s p a t c h f o r each hour of t h e s t u d y pe r iod such t h a t t h e t o t a l c o s t
for t h e e n t i r e p e r i o d i s minimized. For each h o u r , t h e program c a l c u l a t e s
t o t a l , a v e r a g e , and marg ina l ( sys tem lambda) o p e r a t i n g c o s t s .
System ave rage v a r i a b l e c o s t s f o r each hour a r e c a l c u l a t e d by
summing a l l o p e r a t i n g c o s t s ( f u e l , ma in tenance , purchased power, e t c . ) and
d i v i d i n g them by t h e t o t a l number of megawatt h o u r s produced. System s h o r t
run marginal costs are d e t e r m i n e d by c a l c u l a t i n g t h e c o s t of producing t h e
next MWh from t h e p l a n t mix t h a t is a v a i l a b l e .
11-4

Capi t a1 C o s t s
The goal of r e g u l a t i o n i s t o approximate t h e p r i c e and p r o f i t
c o n d i t i o n s t h a t would e x i s t i f f r e e and c o m p e t i t i v e marke t s could be used
t o set p r i c e s , d e t e r m i n e o u t p u t l e v e l s and r e s o u r c e usage , and p rov ide a
f a i r and e q u i t a b l e r e t u r n t o t h e e q u i t y h o l d e r s .
s h o u l d be b u i l t around t h i s g o a l , bu t s t r i c t a p p l i c a t i o n of t h i s approach
would i g n o r e t h e f a c t t h a t t h e c a p i t a l c o s t s used f o r r e g u l a t o r y purposes
art? t h e embedded, no t t h e o p p o r t u n i t y c o s t s . For t h i s r e a s o n , a s h o r t r u n
approach t h a t r e c o g n i z e s t h e e x i s t e n c e of t h e embedded p l a n t and u s e s
embedded c o s t s i s a p p r o p r i a t e f o r d e t e r m i n i n g embedded c o s t s on a
t ime-of-use bas i s .
Any a l l o c a t i o n method
E r n s t & Whinney uses t h e f o l l o w i n g c r i t e r i a f o r s e l e c t i n g a
method f o r a l l o c a t i n g c a p i t a l c o s t s on a time-of-use b a s i s :
I .
2 .
3 .
4 .
A l l who b e n e f i t from t h e use of p l a n t and equipment should b e a r some of t h e c o s t s .
P e r i o d s d u r i n g which a g e n e r a t i n g u n i t i s used more i n t e n s e l y ( i . e . , a t a h i g h e r kW r a t e ) should b e a r r e l a t i v e l y more c o s t s t h a n d u r i n g p e r i o d s of l e s s e r u s e s i n c e , a t a m i n i m u m , more o f t h e investment i n t h e u n i t is be ing used.
The a l l o c a t i o n method s h o u l d , t o some d e g r e e , r e f l e c t t h e r equ i r emen t t h a t some c a p i t a l c o s t s are i n c u r r e d whether t h e u n i t i s used or no t ( i . e . , t h e r e a d i n e s s t o s e r v i c e concept t h a t s a y s i f t h e machine w i l l s e r v e , t hen users should pay a s h a r e o f " s t and by" c o s t ) .
The a l l o c a t i o n method shou ld no t be c o n t r a d i c t o r y wi th t h e economic t h e o r y of s h o r t run c o s t s .
I n t h e f o l l o w i n g s e c t i o n s we d e s c r i b e t h e t h r e e c a p i t a l c o s t a l l o c a t i o n
methods t h a t were c o n s i d e r e d i n t h i s s t u d y . The t h r e e methods, Maximum
Usage A 1 l o c a t i o n , Peak Hour A1 l o c a t i o n , and Modified Peak Hour A1 l o c a t i o n ,
a r e r e l a t i v e l y complex, and o n l y an overview is p r e s e n t e d i n t h e t e x t .
Appendix A p r o v i d e s a d e t a i l e d d e s c r i p t i o n of each of t h e s e methods.
11-5

Maximum Usage A l l o c a t i o n Method
T h i s is t h e f i r s t of t h r e e methods t h a t w e have developed t h a t
a l l o c a t e s c a p i t a l c o s t s on a measure of t h e kW-usage p a t t e r n of t h e
g e n e r a t i n g u n i t s o v e r t h e y e a r . This method and t h e two methods d i scussed
below a r e d e s c r i b e d i n d e t a i l i n Appendix B . Here we p r e s e n t an overview
o f t h e r a t i o n a l e s u p p o r t i n g t h e method and a b r i e f d e s c r i p t i o n of i t s
o p e r a t i o n .
The r a t i o n a l e f o r t h e Maximum Usage Method i s t h a t t h e u t i l i t y
owns a mix of g e n e r a t i n g c a p a c i t y t h a t must b e used t o meet t h e demands
p l aced on t h e system by i t s cus tomers . Thus t h e r a t e p a y e r s a s a whole must
pay f o r t h e u s e of t h e u t i l i t y ' s c a p a c i t y . T h i s can be done i n a number of
ways. The one we u s e h e r e i s based on t h e paradigm t h a t r a t e p a y e r s can
p e r i o d i c a l l y " r en t " c a p a c i t y from t h e u t i l i t y and t h a t t h e amount and t y p e
o f c a p a c i t y t h a t i s r e n t e d a r e based on u n i t l oad ings de te rmined by EBCOST.
The paradigm f u r t h e r assumes t h a t t h e amount of c a p a c i t y of any g e n e r a t i n g
u n i t t h a t i s r e n t e d w i l l e q u a l t h e maximum l o a d i n g p l u s r e s e r v e on t h a t
u n i t d u r i n g t h e t ime p e r i o d . The annual c a p i t a l c o s t s of each u n i t can
t h e n be a l l o c a t e d t o t i m e p e r i o d s based on t h e amount of t h e u n i t ' s
c a p a c i t y r e n t e d i n any s i n g l e t ime pe r iod r e l a t i v e t o t h e s u m of t h e s e
r e n t a l s ove r a l l time p e r i o d s w i t h i n a y e a r .
The Maximum Usage A l l o c a t i o n Method d i v i d e s t h e y e a r i n t o 1 ,248
(52x24) t ime p e r i o d s co r re spond ing t o t h e 24 d a i l y h o u r s i n each of t h e 52
weeks. T h u s , for t h e f i r s t week, t h e seven 1 a.m. hour s c o n s t i t u t e a t ime
p e r i o d , t h e seven 2 a.m. hour s c o n s t i t u t e a second t ime p e r i o d , e t c . , u n t i l
t h e r e a r e 24 h o u r l y p e r i o d s for each of t h e 52 weeks. Each of t h e s e w i l l
b e c a l l e d an hour-week. Note t h a t o t h e r t i m e p e r i o d s cou ld have been used .
For example, 288 hour-months (12x24) cou ld have been used a s t h e t i m e
p e r i o d s .
11-6

T h i s method t a k e s a s i t s b a s i c premise t h a t c a p i t a l c o s t s i n each
hour-week t ime p e r i o d shou ld be based on t h e maximum usage of each u n i t
d u r i n g t h e t ime p e r i o d s i n c e t h i s i s t h e amount of c a p a c i t y frum t h a t u n i t
r e q u i r e d by cus tomers i n t h e hour-week. Thus, u s i n g t h e u n i t l oad ings
produced by t h e EBCOST d i s p a t c h , t h e maximum l o a d i n g for each g e n e r a t i n g
u n i t i n each hour-week is determined by scann ing t h e seven l o a d s f o r each
u n i t d u r i n g t h e week a t t h a t hour . Maximum u n i t l oad ings f o r d i f f e r e n t
u n i t s may come from d i f f e r e n t days w i t h i n t h e hour-week. T h i s is done f o r
e a c h of t h e 24 h o u r s i n t h e week and t h e n f o r a l l of t h e 52 weeks i n t h e
y e a r . The r e s u l t o f t h i s p r o c e s s i s t o have 1 ,248 l o a d i n g l e v e l s f o r each
g e n e r a t i n g u n i t .
t h e maximum u n i t l o a d i n g i n t h a t hour-week d i v i d e d by t h e sum of t h e 1 ,248
maximum u n i t l oad ings throughout t h e y e a r . C l e a r l y t h e sum of t h e
a l l o c a t i o n f a c t o r s i s one. M u l t i p l i c a t i o n of t h e u n i t ' s hour-week
a l l o c a t i o n f a c t o r by t h e annual c a p i t a l c o s t of t h a t u n i t y i e l d s t h e t o t a l
c o s t a l l o c a t e d t o t h a t hour-week f o r t h a t u n i t . To o b t a i n t h e t o t a l
c a p i t a l c o s t f o r each hour-week, t h e a l l o c a t e d c a p i t a l c o s t s f o r each u n i t
a r e summed. The ave rage c a p i t a l c o s t f o r t h e hour-week is o b t a i n e d by
d i v i d i n g t h e sum by t h e t o t a l kWh produced d u r i n g t h e seven h o u r s t h a t
c o n s t i t u t e t h e hour-week.
The a l l o c a t i o n f a c t o r f o r each u n i t fo r each hour-week i s
Peak Hour A l l o c a t i o n Method
T h i s method of a l l o c a t i n g c a p i t a l c o s t s is s i m i l a r t o t h e Maximum
Usage Method i n s e v e r a l ways. F i r s t , i t d i v i d e s t h e y e a r i n t o t h e same
1 , 2 4 8 s e p a r a t e t i m e p e r i o d s co r re spond ing t o t h e hour-weeks. Second, t h e
a l l o c a t i o n f a c t o r s f o r each g e n e r a t i n g u n i t fo r each hour-week a r e de r ived
from t h e u n i t l o a d i n g s de te rmined i n EBCOST. Thi rd , the c o s t s f o r each
11-7

u n i t i n each t ime p e r i o d a r e o b t a i n e d by m u l t i p l y i n g t h e a l l o c a t i o n f a c t o r
b y t h e u n i t ' s annual c a p i t a l c o s t and t o t a l c o s t i n any t ime p e r i o d i s t h e
sum of t h e a l l o c a t e d c a p i t a l c o s t s i n t h a t t i m e pe r iod f o r a l l g e n e r a t i n g
u n i t s . F i n a l l y , ave rage c a p i t a l c o s t s i n a t ime p e r i o d equa l t o t a l c a p i t a l
c o s t s a l l o c a t e d t o t h a t p e r i o d d i v i d e d by t h e kWh s o l d i n t h e p e r i o d .
The d i f f e r e n c e a r i s e s i n what u n i t l o a d s from EBCOST a r e s e l e c t e d
t o u s e i n t h e c a l c u l a t i o n of t h e a l l o c a t i o n f a c t o r s . T h i s method s e l e c t s
t h e u n i t l o a d i n g s t h a t occu r on t h e hour of h i g h e s t system load d u r i n g t h e
hour-week. Thus, i f t h e maximum 7 a.m. system load i n week 1 occur s on
T u e s d a y , t h e l o a d i n g s u s e d i n c a l c u l a t i n g t h e a l l o c a t i o n f a c t o r s f o r each
u n i t i n t h a t hour-week a r e t h e Tuesday 7 a.m. l o a d i n g s . I f t h e maximum 8
a.m. system load d u r i n g week 1 o c c u r s on F r i d a y , t h e n t h e F r i d a y 8 a.m.
u n i t l o a d i n g s a r e u s e d . Thus, t h i s method u s e s t h e u n i t l o a d i n g s t h a t
occu r a t t h e t ime of h i g h e s t system load (peak load ) d u r i n g t h a t t ime
p e r i o d .
The r a t i o n a l e f o r t h i s approach i s t h a t c a p i t a l c o s t s should be
a l l o c a t e d on t h e b a s i s of maximum system load s i n c e i f c a p a c i t y i s
a v a i l a b l e t o meet t h i s peak , or maximum l o a d , d u r i n g t h e time p e r i o d , t h e r e
w i l l be s u f f i c i e n t t o t a l c a p a c i t y t o meet t h e load a t o t h e r h o u r s . Th i s
d i f f e r s from t h e Maximum Usage Method which r e q u i r e s c a p a c i t y of each
i n d i v i d u a l u n i t t o be l a r g e enough t o meet i t s own maximum l o a d i n g d u r i n g
t h e week.
Modif ied Peak Hour A l l o c a t i o n Method
This a l l o c a t i o n method d i f f e r s from t h e p r e v i o u s one i n t h a t t h e
u n i t l o a d i n g s t h a t a r e used i n c a l c u l a t i n g t h e a l l o c a t i o n f a c t o r s a r e
o b t a i n e d by f i r s t d e t e r m i n i n g t h e peak load d u r i n g each w e e k . Then, t o
o b t a i n t h e h o u r l y u n i t l o a d i n g s , t h e 12-hour p e r i o d immediately preceding
11-8

t h e peak load and t h e 11-hour pe r iod immediately fo l lowing t h e peak hour
a r e i d e n t i f i e d . The u n i t l o a d i n g s i n each of t h e s e h o u r s a r e t h e load ings
t h a t a r e used f o r each of t h e 24 hour-weeks i n t h e week. Th i s i s done f o r
a l l 5 2 weeks t o o b t a i n t h e 1,248 l o a d i n g s f o r each u n i t . The a l l o c a t i o n
f a c t o r s f o r each u n i t a r e s imply t h e u n i t ' s d e s i g n a t e d load i n t h e
hour-week d i v i d e d by t h e sum of t h e u n i t ' s d e s i g n a t e d l o a d s over 1,248
hours-weeks. T h i s m o d i f i c a t i o n r e c o g n i z e s and t a k e s account of t h e
e n g i n e e r i n g c o n s t r a i n t s , such a s ramp t i m e , t h a t govern t h e u n i t l oad ings
o v e r t h e c o n t i g u o u s 24-hour p e r i o d c e n t e r e d a t t h e peak h o u r .
Seldom Used U n i t s
If a u n i t i s not r u n o f t e n , t h e l a s t f o u r a l l o c a t i o n p rocedures
w i l l r e su l t i n a sma l l number of h o u r s w i t h v e r y l a r g e ave rage c a p i t a l
c o s t s . T h i s i s due t o t h e f a c t t h a t t h e s e methods w i l l a l l o c a t e a l l of t h e
c a p i t a l c o s t of such a u n i t i n t o t h a t sma l l number of hour s i t i s on ( o r
needed f o r c a p a c i t y ) . In o r d e r t o more e q u i t a b l y d i s t r i b u t e t h e s e c o s t s ,
we sp read t h e c a p i t a l c o s t s of a u n i t which h a s a c a p a c i t y f a c t o r of l e s s
t h a n 3 p e r c e n t e q u a l l y ove r a l l h o u r s .
CUSTOMER CLASS ALLOCATION METHODOLOGY
Once g e n e r a t i o n c o s t s have been a s s i g n e d t o c o s t i n g p e r i o d , t h e
r ema in ing s t e p i s t o a l l o c a t e t h o s e c o s t s by pe r iod and by type ( i . e . ,
demand and ene rgy) t o customer c l a s s e s and v o l t a g e l e v e l . EDECo. has
t h i r t e e n b a s i c customer c l a s s g roups . These a r e r e s i d e n t i a l g e n e r a l ,
r e s i d e n t i a l w a t e r h e a t i n g , r e s i d e n t i a l t o t a l e l e c t r i c , commercial s e r v i c e ,
commercial t o t a l e l e c t r i c , t o t a l e l e c t r i c b u i l d i n g , g e n e r a l power, feed
m i l l and grain e l evator , e l e c t r i c furnace, power t r a n s m i s s i o n , A t l a s ,
L j n d e , and L i g h t i n g .
11-9

The s e l e c t i o n of t h e customer c l a s s a l l o c a t i o n methodology was
made w i t h t h e c o n s i d e r a t i o n o f two c r i t e r i a . One, t h e method should t ake
advan tage of t h e t ime of use c o s t i n f o r m a t i o n g e n e r a t e d by t h e embedded
t i m e of use s t u d y . Second, t h e a l l o c a t i o n methodology shou ld not be
i n c o n s i s t e n t w i t h t h a t used by EDECo. i n r a t e proceedings t h a t have been
approved by s t a t e r e g u l a t o r y a u t h o r i t i e s .
Energy A l l o c a t i o n
The a l l o c a t i o n of ene rgy r e l a t e d c o s t s t o customer c l a s s e s i s
t r a d i t i o n a l l y made on a pe r MWh b a s i s . That is, t h e p e r c e n t a g e of MhTh o f a
p a r t i c u l a r customer c l a s s i n t h e t e s t pe r iod t o t h e t o t a l system MWh i n t h e
p e r i o d s i s t h e p e r c e n t a g e of t o t a l ene rgy r e l a t e d c o s t s t h a t should be
a l l o c a t e d t o t h a t customer c l a s s . I n a t ime of u s e framework, t h e on ly
m o d i f i c a t i o n t o be made i s t h a t peak d o l l a r s should be a l l o c a t e d on t h e
p e r c e n t a g e of peak MWh and off-peak d o l l a r s shou ld be a l l o c a t e d on t h e
p e r c e n t a g e of off-peak MWh t h a t a g iven c l a s s accoun t s f o r .
Demand A I 1 oc a t i o n
Once t h e t ime of use a n a l y s i s h a s been performed, i t i s possible
t o g roup c o s t s by month by c o s t i n g p e r i o d . Thus, i f i t i s determined t h a t
t h e peak p e r i o d i s from 6:OO a.m. t o 6:OO p.m. i n t h e months o f J u l y and
August , i t i s p o s s i b l e t o g roup c o s t s by t h o s e i n t h e peak p e r i o d i n J u l y ,
t h o s e i n t h e peak p e r i o d i n August , t h o s e i n t h e off-peak p e r i o d i n J u l y ,
t h o s e i n t h e off-peak p e r i o d i n August, and t h o s e i n each of t h e o t h e r
months which a r e off-peak i n t h e i r e n t i r e t y . These c o s t s can t h e n be
a l l o c a t e d t o customer c l a s s e s u s i n g any t r a d i t i o n a l a l l o c a t i o n method such
a s peak and a v e r a g e , 12-cp, e t c . The d o l l a r s a l l o c a t e d i n t h e s e s e p a r a t e
a l l o c a t i o n s can then summed by c o s t i n g p e r i o d .
11-10

METHODOLOGY FOR SHORT R U N MARGINAL COSTS
ConceDt of Shor t Run Mara ina l Cost
S h o r t run margina l c o s t i s an economic concept t h a t can b e s t be
e x p l a i n e d by d e f i n i n g two terms--short run and margina l c o s t . The s h o r t
r u n i n economics r e f e r s t o t h a t time p e r i o d d u r i n g which a t l e a s t one of
t h e i n p u t s used i n p r o d u c t i o n is f i x e d and cannot be v a r i e d . This is i n
c o n t r a s t t o t h e long run i n which a l l i n p u t s a r e v a r i a b l e . Marginal c o s t
i s t h e change i n t o t a l c o s t a t t r i b u t a b l e t o a u n i t change i n ou tpu t (MWh or
number of cus tomers s e r v e d ) . Combining t h e s e t w o d e f i n i t i o n s , s h o r t run
m a r g i n a l c o s t i s t h e change i n t o t a l c o s t a t t r i b u t a b l e t o a u n i t change i n
o u t p u t when a t l e a s t one of t h e i n p u t s remains c o n s t a n t .
De te rmina t ion of Shor t Run Margina l Cost of P roduc t ion on a Time-of-Use B a s i s
I n t h e c a s e of e l e c t r i c p r o d u c t i o n , s h o r t run margina l c o s t i s
t h e change i n t o t a l c o s t s when an a d d i t i o n a l MWh i s produced, h o l d i n g t h e
p r e s e n t p l a n t and equipment mix c o n s t a n t . Given t h i s d e f i n i t i o n , t h e
d e t e r m i n a t i o n of t h e s h o r t run marg ina l c o s t of p roduc t ion on an hour-by-
hour b a s i s fo l lows e a s i l y from t h e above a n a l y s i s of embedded c o s t s on a
t ime-of-use b a s i s .
t h a t t h e p l a n t and equipment remain f i x e d , t h e c a p i t a l c o s t s w i l l no t
change a s p r o d u c t i o n i s i n c r e a s e d . Thus, any change i n t o t a l c o s t
r e s u l t i n g from t h e g e n e r a t i o n of an a d d i t i o n a l MWh w i l l r e s u l t s o l e l y i n a
change i n t h e v a r i a b l e o p e r a t i n g expenses . F u r t h e r , i n most c a s e s t h e
a c t u a l magni tude o f s h o r t run marg ina l c o s t w i l l depend on t h e s p e c i f i c
h o u r of t h e y e a r i n which t h e MWh i s g e n e r a t e d , on t h e amount and _ p r i c e of
f u e l required, and on the variable o p e r a t i n g and main tenance expense . In
terms of t h e EBCOST d i s p a t c h o u t p u t , t h e s h o r t run margina l c o s t is t h e
S i n c e t h e a n a l y s i s of s h o r t run marg ina l c o s t s r e q u i r e s
11-11

expec ted c o s t of mee t ing a d d i t i o n a l load i n t h e most c o s t e f f e c t i v e manner
s u b j e c t t o t h e s y s t e m ' s o p e r a t i n g c o n s t r a i n t s . T h i s c o s t i s c a p t u r e d by
t h e system lambda produced by EBCOST.
CHOICE OF COSTING.PERIODS
I n t r o d u c t i o n
The p r i n c i p l e gove rn ing t h e c h o i c e of c o s t i n g p e r i o d s f o r
t ime d i f f e r e n t i a t e d a c c o u n t i n g c o s t s and s h o r t r u n marginal c o s t s i s t h a t
such a pe r iod should c o n s i s t of a se t of con t iguous h o u r s of s i m i l a r c o s t s .
T h i s p r i n c i p l e is we l l e s t a b l i s h e d . It i s i n t h e a p p l i c a t i o n of t h i s
p r i n c i p l e t h a t many of t h e t ime-of-use c o s t i n g methods f a l t e r . Some
a n a l y s t s have chosen t o u s e load l e v e l s a s a proxy f o r c o s t s where h i g h e r
l oad l e v e l s a r e assumed t o be a s s o c i a t e d w i t h h i g h e r c o s t s . While t h i s
co r re spondence may sometimes e x i s t , i t i s not p r e c i s e enough t o use i n t h e
s e l e c t i o n of c o s t i n g p e r i o d s . System c o n s t r a i n t s can cause load l e v e l s and
c o s t l e v e l s t o d e v i a t e s u b s t a n t i a l l y from a d i r e c t l y p r o p o r t i o n a l
r e l a t i o n s h i p with each o t h e r . Thus, t o be c o n f i d e n t t h a t t h e c o s t i n g
p e r i o d s a r e c o s t based t h e a n a l y s t should f i r s t have o r deve lop t h e
n e c e s s a r y c o s t i n g i n f o r m a t i o n and t h e n s e l e c t c o s t i n g p e r i o d s on t h e b a s i s
o f c o s t s i m i l a r i t i e s . While o b v i o u s , i t i s worth r e p e a t i n g t h a t , i f
s i g n i f i c a n t c o s t d i f f e r e n c e s do not show up i n t h e c o s t a n a l y s i s , t h e r e is
no need t o perform a c o s t i n g p e r i o d a n a l y s i s , and c e r t a i n l y no r eason t o
d e v e l o p t ime-of-use r a t e s based on t h e s e c o s t s .
Assuming t h e r e a r e s i g n i f i c a n t d i f f e r e n c e s , t h e c h o i c e of c o s t i n g
p e r i o d s w i l l u s u a l l y s t i l l r e q u i r e some s u b j e c t i v e judgments. For example,
one m u s t s t i l l d e c i d e how b i g a d i f f e r e n t i a l should e x i s t b e f o r e a peak and
of fpeak p e r i o d can be c l a imed . Af te r t h i s d e c i s i o n is made, t h e analyst
11-12

shou ld a t t empt t o make a s few e r r o r s a s p o s s i b l e i n a s s i g n i n g hour s t o
c o s t i n g p e r i o d s , where an e r r o r i s d e f i n e d a s e i t h e r p l a c i n g an hour i n t h e
peak pe r iod when i t s c o s t s a r e a t an o f f p e a k l e v e l (we w i l l c a l l t h i s a
Type 1 e r r o r ) a n d / o r i n c l u d i n g a s an o f f p e a k h o u r , an hour i n which t h e
c o s t s a r e a t a peak l e v e l ( a Type 2 e r ro r ) . Development of c o s t i n g p e r i o d s
c a n t h e n be done on an o b j e c t i v e b a s i s by u s i n g a "minimizat ion of e r r o r "
c r i t e r i o n .
De te rmina t ion I f There Are S i g n i f i c a n t Cost D i f f e r e n c e s
E r n s t & Whinney h a s developed t h r e e s t a t i s t i c a l methods t h a t can
be used t o de t e rmine p o s s i b l e b r e a k p o i n t s between peak and o f f p e a k c o s t
l e v e l s . The f i r s t method, c a l l e d t h e ANOVA C r i t e r i o n , r e f l e c t s t h e concept
t h a t a b r e a k p o i n t between peak and o f f p e a k c o s t l e v e l s should s e p a r a t e t h e
c o s t s so t h a t ( i ) t h e v a r i a t i o n of c o s t s w i t h i n t h e p e r i o d s i s a s small a s
p o s s i b l e ; and ( i i ) t h e v a r i a t i o n of c o s t s between t h e p e r i o d s is a s g r e a t
a s p o s s i b l e . T h i s p rocedure w i l l d e f i n e a set of c o s t i n g p e r i o d s , each of
which is r e l a t i v e l y homogeneous w i t h i n i t s e l f and, a t t h e same t ime, i s a s
d i s t i n c t a s p o s s i b l e from o t h e r c o s t i n g p e r i o d s . A s t a t i s t i c a l t echn ique
t h a t u s e s t h e same p r i n c i p l e s a s one-way a n a l y s i s of v a r i a n c e de t e rmines a
b r e a k p o i n t t h a t minimizes t h e v a r i a t i o n w i t h i n t h e c o s t g roups wh i l e
s i m u l t a n e o u s l y maximizing t h e v a r i a t i o n between t h e c o s t groups.
The second method, c a l l e d t h e Equal Var i ance C r i t e r i o n , u ses t h e
f a c t t h a t t h e v a r i a n c e of c o s t i s a measure of i t s homogeneity. The
s m a l l e r t h e v a r i a n c e , t h e more homogeneous t h e c o s t v a l u e s a r e . By
e x t e n s i o n , i f a b reakpo in t i s chosen so t h a t t h e v a r i a n c e s of c o s t i n t h e
peak and o f f p e a k p e r i o d s a r e e q u a l , t h e c o s t s i n t h o s e p e r i o d s w i l l be
e q u a l l y homogeneous. Thus, by a r r a y i n g c o s t s i n numerical o r d e r [ ; .e. ,
c r e a t i n g a c o s t d u r a t i o n c u r v e ) and s u c c e s s i v e l y moving t h e b r e a k p o i n t , a
11-13

v a l u e of cost can be found t h a t e q u a l i z e s t h e v a r i a n c e s between peak and
o f f p e a k c o s t s .
A t h i r d method, c a l l e d t h e Minimax C r i t e r i o n , min imizes t h e
maximum d i f f e r e n c e between c o s t s i n each p e r i o d . That i s , t h i s method
s e l e c t s a b reakpo in t t h a t min imizes t h e d i f f e r e n c e between t h e h i g h e s t and
lowes t c o s t s i n b o t h t h e peak and o f f p e a k p e r i o d . The r a t i o n a l e f o r t h i s
approach i s s t r a i g h t f o r w a r d : by minimiz ing t h e d i f f e r e n c e s between t h e
h i g h e s t and lowes t c o s t i n each p e r i o d , we a r e c r e a t i n g p e r i o d s of s i m i l a r
c o s t s .
While a l l of t h e s e methods p rov ide u s e f u l i n fo rma t ion i n
s e l e c t i n g t h e b r e a k p o i n t , t h e y have f a u l t s . Thus, i n t h e s e l e c t i o n of a
b r e a k p o i n t , t h e a n a l y s t should no t b l i n d l y adopt t h e r e s u l t s of u s ing t h e s e
t e c h n i q u e s , bu t should u s e t h e i n f o r m a t i o n ob ta ined a s one of s e v e r a l
i n p u t s i n t h e decis ion-making p r o c e s s .
De te rmina t ion of C o s t i n g P e r i o d s Based on S i g n i f i c a n t Cost D i f f e r e n c e s
The purpose of s e l e c t i n g c o s t i n g p e r i o d s is t o group t o g e t h e r
p e r i o d s of t i m e when c o s t s a r e approx ima te ly t h e same. T h i s r e q u i r e s t h a t
c o s t s be a s s o c i a t e d wi th each hour i n t h e y e a r and t h e n ana lyzed t o see i f
t h e r e a r e con t iguous h o u r s t h a t r e f l e c t t h e c o s t s i m i l a r i t y . Thus, c o s t s
a r e i d e n t i f i a b l e by t ime-of-use. Assuming t h e r e a r e s i g n i f i c a n t c o s t
d i f f e r e n c e s , an a t t empt i s made i n t h e t ime-per iod s e l e c t i o n p rocess t o be
a s p r e c i s e a s p o s s i b l e . U n f o r t u n a t e l y , i t i s no t p o s s i b l e t o q u a n t i f y
e v e r y a s p e c t involved i n d e t e r m i n i n g c o s t i n g p e r i o d s f o r time-of-use r a t e s .
The f i r s t s t e p i n d e t e r m i n i n g t h e c o s t i n g p e r i o d s i s t h e s e l e c t i o n of
b r e a k p o i n t s which i d e n t i f y t h e peak , s h o u l d e r , and o f f p e a k p e r i o d s .
P r o c e d u r e s t o do t h i s were d e s c r i b e d i n t h e p rev ious s e c t i o n .
11-14

Having de termined t h e b r e a k p o i n t , t h e next s t e p i s t o de te rmine
t h e e x a c t h o u r s t h a t f a l l i n t h e c o s t i n g p e r i o d s . F i r s t , r e c a l l t h e two
t y p e s of e r r o r d e f i n e d above: a Type 1 e r r o r o c c u r s i f an hour is i nc luded
i n a p a r t i c u l a r c o s t i n g pe r iod w h i l e t h e c o s t i n d i c a t e s t h a t i t should not
h a v e been c l a s s i f i e d i n t o t h a t c o s t i n g p e r i o d ; a Type 2 e r r o r occur s i f an
hour is not i nc luded i n a c o s t i n g pe r iod w h i l e t h e c o s t i n d i c a t e s t h a t i t
shou ld have been i n c l u d e d . We s p e c i f y t h e fo l lowing o b j e c t i v e f u n c t i o n and
minimize i t s v a l u e , E :
E = I (T1 + T 2 ) / ( P 1 + P2)] x 100
where :
TI i s t h e number of times a Type 1 e r r o r i s committed g iven the d e f i n i t i o n of t h e r e l e v a n t c o s t i n g p e r i o d .
T2 i s t h e number of times a Type 2 e r r o r i s committed g iven t h e d e f i n i t i o n of t h e r e l e v a n t c o s t i n g p e r i o d .
P1 i s t h e p o t e n t i a l number of times a Type 1 e r r o r could be committed g i v e n t h e d e f i n i t i o n of t h e r e l e v a n t c o s t i n g p e r i o d .
P 2 i s t h e p o t e n t i a l number of times a Type 2 e r r o r cou ld be committed g i v e n t h e d e f i n i t i o n of t h e r e l e v a n t c o s t i n g p e r i o d .
Note t h a t each e r r o r t y p e i s weighted t h e same. A l so , d i v i s i o n
by t h e maximum p o t e n t i a l number of e r r o r s removes any b i a s i n f avor of a
s m a l l number of days f o r each c o s t i n g p e r i o d . The m u l t i p l i c a t i o n by 100
m e r e l y p u t s t h e r e s u l t s i n pe rcen tage terms.
The s t a r t i n g and end ing h o u r s of each c o s t i n g pe r iod a r e t h o s e
which minimize E . F u r t h e r , i f any set of beg inn ing and end ing hour s
r e s u l t s i n an E v a l u e g r e a t e r t h a n 50% (more e r r o r s a r e made than a r e
a v o i d e d ) , t h e c o s t i n g p e r i o d i s r e j e c t e d a s not be ing v a l i d .
Although not e n t i r e l y s p e c i f i c t o t h i s methodology, two problems
o c c u r i n t h e s e l e c t i o n of c o s t i n g p e r i o d s chosen on a time-of-use b a s i s .
F i r s t , w h i l e t h i s p rocedure measures t h e e r r o r a s s o c i a t e d wi th a g iven
11-15

c o s t i n g p e r i o d , t h e r e is no g u a r a n t e e t h a t a l l hour s i n a y e a r w i l l be
c l a s s i f i e d a t t h e a p p r o p r i a t e c o s t l e v e l . Second, because c o s t s a r e
t e m p e r a t u r e s e n s i t i v e and t h e c o s t s t u d y is done on a t es t yea r b a s i s ,
t h e r e i s no g u a r a n t e e t h a t a l l h o u r s w i l l be r e p o r t e d a t t he a p p r o p r i a t e
c o s t i n f u t u r e y e a r s . D e s p i t e t h e s e sho r t comings , t h e procedure j s well
d e f i n e d , u s e s a c t u a l d a t a , c a n be r e p e a t e d by any r e s e a r c h e r , and p rov ides
a measure of t h e deg ree t o which " i n c o r r e c t " c o s t s i g n a l s (however d e f i n e d )
a r e c o n t a i n e d i n a c o s t i n g p e r i o d .
11-16

111. APPLICATION OF THE EMBEDDED TIME-OF-USE COST METHODOLOGY TO EMPIRE DISTRICT ELECTRIC COMPANY
Chapter I1 d e s c r i b e s t h e g e n e r a l methodology t h a t can be used t o
d e t e r m i n e t h e embedded a c c o u n t i n g c o s t s on a time-of-use b a s i s f o r any
e l e c t r i c u t i l i t y .
t h i s methodology t o Empire Dis t r ic t . The remainder of t h i s c h a p t e r i s
d i v i d e d i n t o f o u r s e c t i o n s :
T h i s c h a p t e r c o n t a i n s t h e r e s u l t s of t h e a p p l i c a t i o n of
a A n a l y s i s of Opera t ing Cos t s
a A n a l y s i s of C a p i t a l Cos t s
a Average T o t a l Embedded Cos t s
0 S e l e c t i o n of Cos t ing P e r i o d s
0 A l l o c a t i o n t o Customer Classes.
ANALYSIS OF OPERATING COSTS
Chap te r I1 and Appendix A d e s c r i b e t h e g e n e r i c a p p l i c a t i o n of
EBCOST t o produce o p e r a t i n g c o s t s on an h o u r l y b a s i s . Before t h e g e n e r a l
methodology can be employed, however, t h e r e are c e r t a i n o t h e r f a c t o r s t o
c o n s i d e r i n t h e development of t h e a n a l y s i s . These i n c l u d e :
0 S e l e c t i o n of t h e h o u r l y l o a d s t o be used
0 Treatment of planned and f o r c e d ou tages
Treatment of sa le and purchase r evenues
0 Choice of f u e l p r i c e s .
111-1

S e l e c t i o n of Hourly Loads
A n a l y s i s of time-of-use a c c o u n t i n g c o s t s r e q u i r e s t h a t we
i n i t i a l l y d e c i d e t h e l o a d s whose a s s o c i a t e d c o s t s we want t o d e t e r m i n e ,
s i n c e i t i s p o s s i b l e t o de t e rmine c o s t s f o r s e v e r a l d i f f e r e n t l o a d s , e.g. ,
t o t a l systems l o a d s , r e t a i l l o a d s , etc. We b e l i e v e t h e most a p p r o p r i a t e
s e t of l o a d s t o use are t h o s e l o a d s f o r which t h e u t i l i t y h a s a c o n t i n u i n g
f i r m o b l i g a t i o n . T h i s s e t of l o a d s i n c l u d e s r e t a i l s a l e s and sales t o
mun ic ipa l u t i l i t i e s and r u r a l e l ec t r i c c o o p e r a t i v e s ( n a t i v e system l o a d )
p l u s long-term f i r m sales. We have excluded t h e l o a d s a s s o c i a t e d wi th
economy sales , emergency sales , and shor t - t e rm f i r m sales because of t h e
u n c e r t a i n t y r e g a r d i n g t h e t iming of t h e s e loads . The method we use t o
a c c o u n t f o r t h e v a l u e of t h e s e t r a n s a c t i o n s i s d i s c u s s e d subsequen t ly .
Treatment of Outages
The e f f e c t of o u t a g e s ( b o t h planned and f o r c e d ) i s t o ra ise t h e
c o s t of s u p p l y i n g e l e c t r i c i t y d u r i n g the ou tage pe r iod . Costs i n c r e a s e
because t h e power t h a t would have been provided by t h e u n i t t h a t i s ou t now
must be o b t a i n e d e l s e w h e r e , u s u a l l y a t a h i g h e r c o s t . S i n c e o u t a g e s occur
and t h e r e l a t e d expenses must be cove red , t h e s e o u t a g e s must be accounted
f o r i n t h e t o t a l c o s t s . We b e l i e v e t h e s e c o s t s should be sp read over a l l
power t h a t i s s o l d , r a t h e r t han o n l y ove r t he power t h a t i s s o l d d u r i n g t h e
time of t h e ou tage , f o r two r easons . F i r s t , p lanned o u t a g e s f o r mainte-
nance are done f o r t h e b e n e f i t of a l l customers se rved throughout t h e yea r .
That is, a g e n e r a t i n g u n i t i s ma in ta ined so t h a t i t w i l l be a v a i l a b l e t o
p r o v i d e s e r v i c e t o t h e u t i l i t y ' s cus tomers throughout t h e year . To assign
t h e a d d i t i o n a l c o s t s a s s o c i a t e d wi th planned maintenance t o t h e pe r iod when
t h e maintenance i s performed r e s u l t s i n a misna tch of c o s t and the
111-2

r e s u l t i n g b e n e f i t s . Second, t h e t iming of f o r c e d o u t a g e s i s u s u a l l y not
p r e d i c t a b l e no r do o u t a g e s normally occur i n a d i s c e r n i b l e p a t t e r n . Even
i f t hey d i d , i t i s d o u b t f u l t h a t a p p l i c a t i o n of t h e c o s t c a u s a l i t y
p r i n c i p l e would r e s u l t i n t he assignment of t h e s e c o s t s t o t h e time of t h e
ou tage . T h e r e f o r e , t h e assignment of t h e c o s t s a s s o c i a t e d w i t h t h i s t ype
of ou tage should a l s o be sp read over a l l t h e ene rgy t h a t i s s o l d i n t h e
year.
Treatment of S a l e s and P u r c h a s e s
The demand and energy components of long-term f i r m sales and
pu rchases are e x p l i c i t l y r ecogn ized i n t h e a l l o c a t i o n of a c c o u n t i n g c o s t s
t o t ime-of-use, w i t h f i r m sales be ing i n c l u d e d i n t h e l o a d s and f i r m
purchases be ing t r e a t e d a n a l o g o u s l y t o g e n e r a t i n g u n i t s . Other pu rchases
and sales are made t o p rov ide needed ene rgy a n d / o r t o reduce the c o s t of
power t o t h e r a t e p a y e r s . The assignment of t h e s e c o s t s and revenues can be
hand led i n e i t h e r of two ways. The "as i n c u r r e d " embedded s t u d y
( a s s ignmen t method 1 ) would a s s i g n t h e s e revenues and c o s t s t o t h e hour s i n
which they occur red . With r e s p e c t t o t h e " r e p r e s e n t a t i v e " embedded s t u d y
( a s s ignmen t method 2 ) , i f ev idence were a v a i l a b l e showing t h a t t h e h o u r l y
p a t t e r n o c c u r r i n g i n t h e t e s t y e a r was t y p i c a l , t h e n t h i s p a t t e r n could be
r e f l e c t e d i n t h e r e p r e s e n t a t i v e tes t year . I f , on t h e o t h e r hand, no
p a t t e r n was e v i d e n t , t h e n t h e s e c o s t s and revenues should be sp read over
a l l hours. An argument s u p p o r t i n g t h e second method of ass ignment i s t h a t
c o l l e c t i v e l y a u t i l i t y ' s r a t e p a y e r s pay f o r t h e u t i l i t y ' s p l a n t , and t h a t
a l l r a t e p a y e r s should b e n e f i t when t h e p l a n t t hey are paying f o r can be
economica l ly used t o produce r evenues from the sale of power t o o t h e r
u t i l i t i e s . We have no ev idence conce rn ing t h e p a t t e r n of nonfirm -
s a l e s / p u r c h a s e s so a l l b e n e f i t s from t h e s e t r a n s a c t i o n s were sp read t o a l l
111-3

hours on a kWh-basis. Net r evenues from off-system t r a n s a c t i o n s were
a l l o c a t e d t o t i m e p e r i o d s on a kWh-basis.
Choice of F u e l P r i c e s
Many a l t e r n a t i v e {uel p r i c e s can be used i n a r e d i s p a t c h .
Average annua l as burned, monthly as burned, and monthly replacement are
a l l u s e f u l f o r c e r t a i n a p p l i c a t i o n s . The f u e l p r i c e s used i n t h i s s t u d y
a re annua l as burned.
Unit S p e c i f i c I n p u t
E x h i b i t 111-1 l i s t s t h e c a p a c i t i e s , minimum up time, minimum down
time, ramp time (number of h o u r s r e q u i r e d t o go from minimum g e n e r a t i o n t o
maximum g e n e r a t i o n ) , s t a r t - u p c o s t s , v a r i a b l e maintenance c o s t s , and f u e l
c o s t s f o r each the rma l u n i t i n t h e Empire system.
E x h i b i t 111-2 shows t h e i n c r e m e n t a l h e a t ra te c u r v e s f o r the
Empire u n i t s . A h e a t ra te is s imply t h e MBtu's of h e a t r e q u i r e d per
megawatt of o u t p u t . An i n c r e m e n t a l h e a t ra te cu rve r e p r e s e n t s t h e MBtu's
r e q u i r e d t o g e n e r a t e t h e n e x t megawatt of o u t p u t a t any l e v e l of o u t p u t .
Also shown i n t h i s e x h i b i t are t h e MblBtu's per hour n e c e s s a r y t o o p e r a t e
t h e u n i t a t minimum load .
It can a l s o be seen t h a t R ive r ton 3 and R i v e r t o n 4 a p p e a r as
" R i v e r t o n 3 4 " . The Company i n d i c a t e d t h a t t h e s e u n i t s are normally run
c o n c u r r e n t l y so t h e o p e r a t i n g c h a r a c t e r i s t i c s of t h e s e u n i t s were combined.
The h e a t ra te c u r v e f o r R i v e r t o n 7 h a s been a d j u s t e d t o t a k e i n t o
accoun t t h e e f f i c i e n c i e s a s s o c i a t e d wi th running R i v e r t o n 7 and R i v e r t o n 9
i n a combined c y c l e . Running t h e s e u n i t s t o g e t h e r u t i l i z e s waste h e a t
which a l l o w s f o r more e f f i c i e n t g e n e r a t i o n than i f t h e y were run
Independen t ly . S i n c e t h e r e i s no way t o i n c o r p o r a t e t h i s phenomenon
111-4

HI n i u m Capac 1 ty
(W
4sbury 80
I a t en'' 30
Rlvewton 8 20
Rlvcttog 7 19
alvctton 9 8
Rlvctton 6 I 2
Cneray Ctr I 30
Energy C t r 2 30
Rlvcrton 3 4 4 8
Maximum Capac i ty (W
I90
80
47
3 3
I 3
30
90
90
20
I
EXHIBIT 111-1 CENERATTNC [IN IT CHAMCTERTSTTCS
EMPIRE DISTRlCT FXECTRIC COMPANY
Hiniaum up-t ine (hours)
1 0 0
1 0 0
100
100
4
4
4
4
4
Minimum Down-t ine
(hours)
48
48
48
48
4
4
4
4
4
Ramp T l m e
(hotr re)
3
3
2
2
I
1
1
1
I
S tatt-up Vat~ablc Ha i n tenancc
($/atart-up) coet($/m) Coste
2526 0.356
94 80 0 . 5 3 3
2170 1'. 039
1438 1.039
60 0.089
513 I .039
721 6.810
727 6.810
-_ I .039
h e 1 Cost
(S/HBtu)
0.9653
I. I 6 7 0
I . 5039
1.4963
2.01 I5
2.0339
2.5242
2.5242
2.0339

1
MN-L nP: i 836 2: 265 256 141 2 3 4t5 4t: 238
t . . . *
RU.B/KUH BO 9196 36 8602 23 9404 24 1136 8 9733
14 UE2b 50 7930 30 7930 8 19250
EXHIBIT 111-2 HWlMM LOAD m t u ’ s AND IN CRREVI . ALBLATRATES
PIPIRE DISTRICT ELECTRIC COFPANY
0 0 t t 0 IMMnRnAL m1 R4ns t
nu. B/W MI. I/UUH I IY * B/UW 110 9461 140 9845 170 10178
48 8780 (4 9060 72 9470 28 10Xb n 10Z4 SB 10Y4 31 11526 37 11713 0 0 10 10650 14 13802 0 0 28 16877 0 0 0 0 40 8509 60 9150 0 0 40 8500 60 9150 0 0 12 2 4 5 0 1b 3500 19 30000
RU,I/KUM W*WRM 195 10!?8 0 0 84 9970 0 0 43 12107 49 14320
0 0 0 0 0 0
. N L B/KW 0 0 0 0 0 0 0 0 0 0 0 0 0 0 0 0 0 0
)w.S/KuH 0 0 0 0 0 0 0 0 0 0 0 0 0 0 0 0 0 0
111-6

d i r e c t l y i n t o EBCOST, we have b u i l t t h e i n c r e a s e d e f f i c i e n c y i n t o the h e a t
r a t e cu rve f o r R ive r ton 7 .
Hydro G e n e r a t i o n
The g e n e r a t i o n f r o n the hydro f a c i l i t y a t h a r k Beach was modeled
as i n t e r c h a n g e and t h u s s u b t r a c t e d f r o n t h e n a t i v e l o a d s t o be met wi th t h e
res t of t h e s y s t e m on an "as i n c u r r e d " basis. T h i s was done s i n c e t h e
Ozark Beach s t a t i o n i s a run -o f - r ive r f a c i l i t y . It r u n s whenever t h e r e i s
water and does no t e n t e r t h e d i s p a t c h o r d e r .
however, r e p r e s e n t s an amount of power t h a t t h e rest of t h e EDECo. system
does no t need t o g e n e r a t e .
The g e n e r a t i o n o b t a i n e d ,
EBCOST Out pu t
E x h i b i t 111-3 i s a page of EBCOST o u t p u t r e p r e s e n t i n g t h e l a s t 1 2
h o u r s of August 13. It g i v e s t h e u n i t l o a d i n g s , t o t a l g e n e r a t i o n , a c t u a l
s p i n n i n g and f a s t s tar t r e s e r v e s , t h e system lambda, s t a r t - u p , demand,
e n e r g y c o s t s and t o t a l v a r i a b l e c o s t s of p r o d u c t i o n , t h e system ave rage
c o s t , and s y s t e m marg ina l c o s t ( lambda) f o r each hour and f o r t h e e n t i r e
12-hour pe r iod .
Numerical R e s u l t s from EBCOST
E x h i b i t 111-4 i s c o s t d u r a t i o n cu rve (CDC) f o r a l l 8 , 7 3 6 h o u r l y
a v e r a g e runn ing c o s t s . Each p o i n t on t h e c u r v e r e p r e s e n t s t h e number of
h o u r s where t h e a v e r a g e c o s t e q u a l s o r exceeds t h e c o s t i n $/ElWh s p e c i f i e d
on t h e v e r t i c a l axis. Thus, o n l y one hour e q u a l s o r exceeds $22.62/MWh,
which i s t h e h i g h e s t c o s t hour f o r t h e year. Conversely, a l l 8,736 h o u r s
e q u a l or exceed t h e lowes t c o s t hour fo r t h e y e a r , $13.90/MWh. The running
c o s t CDC f o r Empire is f l a t over most of i t s range. The s l o p e d o e s
I n c r e a s e n o t i c e a b l y , however, a t approx ima te ly t h e 1050 hour p o i n t . "ttese
111-7

EXHIBIT 111-3 SAHPLE EBCOST RESULTS AUGUST 13, 1980, P.H.
p(PSRE DISTRICT ELTCTRIC COPPANP
SPJDT PERIOD 8/1380- VlSrBO SCHEDUU Fofi 8/13/80 ED. STMTXNG AT I PH
WJF DOING- mIT WRE PH 1
hsmr 1 IaTM 1 RIMRTON e R I i!€R T ON 7
TUTAL Q.WUTI0II
1w1 80 17 33 13 12 Si 0 0
426
51 42
2
190 80 47 33 13 12 Is 0 0
4SO
33 18
3
190 80 47 33 13 12 7s 0 0
4
190 80 47 33 13 12 82 0 0
S
190 BO 47 33 13 12 71 0 0
4 190 80
13 12 s9 0 0
8
7
190 80 47 33 13 12 39 0 0
150 457 444 434 414
33 26 37 M 49 18 11 22 34 54
29.17 51.14 31.11 51.71 30.81 29.82 28.11 0 0 0 0 0 0 0 0 0 0 0 0 0 0
7167 7891 7891 8111 7747 7443 (823
71b7 n91 7891 tlll 7747 7403 16.82 170% 17.34 17.75 17.41 t7.M 11.48
8
190 80 41 29
8 I? 30 0 0
9
190 80 40 2b 8
12 30 0 0
10
190 BO 39 19
so 0 0
I!
11 190 BO 40 27
8 0 0 0 0
12 liHR TOT 190 ? f B O 80 960
s10
0 123 0 1:o 0 9 2 0 0 0 0
8 351
1L18 17.96 17.57 11*01 14eSl 24084
0 0 0 0 0 0 0 0 0 0 0 0
4271 b199 4072 US1 3612 79SE
4271 blW 6472 US1 3612 7953
16108 16t06 Ut06 l2.61 11.U 0.00
111-8

EXHIBIT 111-4 AVERACE HOURLY ENERCY-RELATED COST DVRATION mVE
PIPIRE OISfRXcT a E c T R 1 C COMPANY
1 210 420 630 840
1050 1240 1470 1689 1613 2100 231C 2520 3 3 0 2940 3150 33LO 3570 3780 3990 4200 441C 4620 4850 5040 5250 5450 5670 5860 60PC LJGO 6510 6720 6930 714c 7350 FA0 7770 798G 8190 8400 8610 8736
111-9

h i g h e r c o s t s are g e n e r a l l y a s s o c i a t e d wi th t h e r e l a t i v e l y h i g h l o a d , sunner
hour s .
ANALYSIS OF CAPITAL COSTS
I n t r o d u c t i o n
I n Chapter I1 we p r e s e n t e d f i v e methodologies f o r a l l o c a t i n g
c a p i t a l c o s t s . The methods range from an e q u a l a l l o c a t i o n of t h e s e c o s t s
t o each time pe r iod t o a d e t a i l e d examina t ion of t h e h o u r l y l o a d i n g s of t h e
i n d i v i d u a l g e n e r a t i n g u n i t s as a b a s i s f o r a l l o c a t i n g c a p i t a l c o s t s . The
l a t t e r methods f u l l y r e c o g n i z e t h a t t h e mix of g e n e r a t i n g u n i t s owned by
t h e u t i l i t y , which de te rmine embedded c a p i t a l c o s t s , i s g r e a t l y i n f l u e n c e d
by load shape as w e l l as t h e peak l o a d . In t h e f o l l o w i n g s e c t i o n s , we
d i s c u s s t h e i n p u t s used i n making t h e c a p i t a l c o s t a l l o c a t i o n i n c l u d i n g t h e
a n n u a l c o s t of each g e n e r a t i n g u n i t , t h e a l l o c a t i o n f a c t o r s , and t h e
t r e a t m e n t of r e s e r v e c a p a c i t y .
a l l o c a t i o n Methods do not meet a l l f o u r c r i t e r i a s p e c i f i e d i n Chapter 11,
t h e y w i l l not be used i n t h e a n a l y s i s . The p r e s e n t a t i o n of t h e r e s u l t s of
a p p l y i n g t h e o t h e r methodologies conc ludes t h e s e c t i o n .
S ince t h e Equal A l l o c a t i o n and On/Off
I n p u t s t o t h e Method
A l l of t h e c a p i t a l c o s t a l l o c a t i o n ne thods r e q u i r e t h r e e t y p e s of
i n f o r m a t i o n :
8 Annual c a p i t a l c o s t of each g e n e r a t i n g u n i t
e Level of c a p a c i t y of e a c h u n i t used i n time pe r iod
9 Amount of r e s e r v e c a p a c i t y .
Once t h i s i n f o r m a t i o n i s known, c a p i t a l c o s t s can be a l l o c a t e d on a
time-of-use basis.
111-10

Annual Capital Cost of Generating Units. The company calculated
the annual capital cost of production equipment based on a test year ended
March 31, 1981. Per book amounts were adjusted to reflect the effects of
the stipulated agreement in the company's Missouri Case No. ER-81-209.
Production function capital costs were developed based upon the
functionalization and classification methodology used by the Company in the
cost of service study submitted in Missouri Case No. EO-82-40. The
capital costs associated with production were assigned t o generating units
on a basis consistent with the functionalization.
Exhibit 111-5 reflects the total adjusted cost of service, the
portion functionalized to production capacity cost, and the capacity cost
derived f o r Riverton, Unit 418. Production costs have been reduced by the
cost of fuel, the energy component of purchased power and other production
costs that vary with levels of production. These costs are considered
operating costs. The capital costs by generating unit that are utilized in
our allocation to time-of-use are summarized in Exhibit 111-6.
We have reviewed all capital cost data as submitted to us by the
company. The procedures used by the company t o generate the data are
consistent with standard industry practice. The data provided is
consistent with these procedures, and a review indicates that the data is
reasonable and consistent with the company's FERC Form-1 data adjusted as
noted above. The methods of assigning and/or allocating the capacity costs
to units appear to be reasonable.
Level of Capacity and Operating Reserve Capacity. The capacity
of each unit that is used f o r each hour-week is the sum of its designated
load in that period plus any required reserve. As shown in Exhibit 111-4,
EBCOST determines the hourly loading f o r each machine fo r each hour. Thus,
111-1 1

EXHIBIT 111-5 PRODUCTION COSTS
EMPIRE DISTRICT ELECTRIC COMPANY 12 MONTHS ENDED MARCH 31, 1981
Missouri Tot a1 Jurisdictional Company Asbury
Return
Income Taxes
Deferred 6 ITC - Normalizing Taxes Other Than Income Property Related
Labor Related
Depreciation and Amortization
Operation & Maintenance Production
Administrative & General Property Related
Labor Related
Revenue Credits Total Production Capital Costs
Energy Costs
Total Production Costs
$ 7,858,378 $ 9,799,925 $2,426,355
2,564 , 288 3 , 635 , 629 900 , 181
1,958,534
160 , 519
3 , 593,682
3,614,938
303 , 92 1
1,070,308
2,378 , 136 588,162
213,368 69,558
4,433,769 1,153,224
4,739,665 1,545,131
382 , 524 99 , 522
1,413,632 460 , 844
( 1 20,807 1 ( 1 60,610 1 ( 5 2 , 3 5 8 ) $21,003,761 $26,836,038 $7,190,619
28,644,825
$49 , 648 , 586
36,797,308
$63,633,346
111-1 2

EXHIBIT 111-6 ANNUAL PRODUCTION C A P I T A L COSTS BY GENERATING U N I T
EMPIRE D I S T R I C T ELECTRIC COMPANY 12 MONTHS ENDED MARCH 31 , 1981
Generating Unit
Asbury
Ia tan
Riverton 8
Riverton 7
Riverton 9
Riverton 6
Energy Center 1
Energy Center 2
Riverton 3 & 4
Total System
Capi ta l Co6t
$ 7,190,619
8,356,690
1,809,039
1,364,960
442,430
444,688
3,280,589
3,659,019
288,004
$26,836,038
111-13

by scann ing t h e h o u r l y l o a d i n g s , t h e r e l e v a n t l o a d i n g s f o r each hour-week
f o r each u n i t c a n be de t e rmined . Taking t h e r e q u i r e d o p e r a t i n g r e se rve
( s p i n n i n g p l u s f a s t s t a r t ) t o be 6 percen t of l o a d , t h e a c t u a l o p e r a t i n g
r e s e r v e r e q u i r e m e n t s f o r E D E C o . , t h e o p e r a t i n g r e s e r v e c a p a c i t y i s e a s i l y
d e t e n n i n e d . l / - e a c h runn ing u n i t p r o p o r t i o n a l t o i t s u s e . For example, i f an a b b r e v i a t e d
To t h e e x t e n t p o s s i b l e , r e s e r v e c a p a c i t y i s provided by
l o a d i n g i s :
Asbury 1 I a t a n 1 R i v e r t o n 8
150 MW 50 MW 40 MW
240 MW
t h e n 6 p e r c e n t of l o a d i n g s o r 14 .4 MW o f r e s e r v e must be a v a i l a b l e . Adding
6 p e r c e n t t o each l o a d i n g r e s u l t s i n t h e f o l l o w i n g :
Asbury 1 I a t a n 1 R i v e r t o n 8
159 MW 53 Mw
42 .4 MW 254.4 MW
I n t h i s i l l u s t r a t i v e c a s e , each g e n e r a t i n g u n i t can r e s e r v e i t s e l f s i n c e
t h e l o a d i n g s , i n c l u d i n g r e s e r v e s , d o n o t exceed t h e c a p a c i t y of any of t h e
u n i t s . O the rwise , r e s e r v e i s provided by a n o t h e r u n i t w i t h s i m i l a r c o s t
and o p e r a t i n g c h a r a c t e r i s t i c s .
R e s u l t s of t h e C a p i t a l Cost A l l o c a t i o n A n a l y s i s
I n t r o d u c t i o n . In t h i s s e c t i o n , we b r i e f l y d i s c u s s and p r e s e n t
g r a p h i c a l l y t h e r e s u l t s o b t a i n e d from app ly ing t h r e e c a p i t a l c o s t
a l l o c a t i o n me thodo log ie s . The Equal A l l o c a t i o n Method and t h e On/Off
Method were not used because t h e y do no t c o n s i d e r t h e runn ing p a t t e r n of
- 1/ I f a c o n s t a n t l e v e l of o p e r a t i n g r e s e r v e c a p a c i t y i s r e q u i r e d , t h i s can be used r a t h e r t h a n a pe rcen tage .
111-14

t h e u n i t s . A s no ted i n Chap te r 11, c a p i t a l c o s t s of u n i t s
t h a t had c a p a c i t y f a c t o r s o f less t h a n 5 pe rcen t i n t h e EBCOST d i s p a t c h
were sp read e q u a l l y ove r a l l h o u r s .
Maximum Usage A l l o c a t i o n Method. The a l l o c a t i o n of c a p i t a l c o s t s
t h a t r e s u l t s from use of t h i s method i s shown g r a p h i c a l l y i n E x h i b i t 1 1 1 - 7 .
The minimum and maximum a l l o c a t i o n s t o an hour-week a r e $ 8 . 4 2 / M t o
$18.15/MWh r e s p e c t i v e l y .
Peak Hour A l l o c a t i o n Method. T h i s method y i e l d e d i d e n t i c a l
r e s u l t s t o t h e Maximum Usage Method.
Modif ied Peak Hour A l l o c a t i o n Method. Use of t h i s method
r e s u l t e d i n t h e c a p i t a l c o s t d u r a t i o n c u r v e i l l u s t r a t e d i n E x h i b i t 111-8.
The minimum c o s t was $7.88/MWh and t h e maximum was $20.82/Mh%.
Summary. The c o s t d u r a t i o n c u r v e s i n E x h i b i t 111-7 and 111-8
show t h a t & h e d i s t r i b u t i o n of c a p i t a l c o s t s i s s i m i l a r r e g a r d l e s s of which
o f t h e t h r e e c a p i t a l a l l o c a t i o n methods i s used. There i s , however, a
s i g n i f i c a n t amount of v a r i a t i o n i n t he c a p i t a l c o s t s by time-of-use
r e g a r d l e s s of which o f t h e a l l o c a t i o n methods i s used .
AVERAGE TOTAL COSTS
The ave rage t o t a l c o s t s a r e & h e sum of t h e time-of-use o p e r a t i n g
c o s t s and c a p i t a l c o s t s . E x h i b i t s 111-9 and 111-10 p r e s e n t & h e ave rage
t o t a l c o s t d u r a t i o n c u r v e s t h a t r e s u l t from adding t h e o p e r a t i n g c o s t s and
t h e a l l o c a t e d c a p i t a l c o s t s unde r t h e Maximum Usage and Modi f i ed -Peak Hour
methods . For EDECo., t h e Maximum Usage method r e s u l t s i n a minimum c o s t of
$22.53/MWh and a maximum c o s t of $39.05/MWh. The Modif ied Peak Hour method
g e n e r a t e s a low h o u r l y c o s t o f $22.87/MWh and a h igh o f $42.46/MWh.

1 30 60 90
120 150
240 270 300 330 360 390 420 450 480 510 540 570 600 630 669 690 720 750 780 810 84 0 870 900 930 960 990
1020 1050 1080 1110
1200 1230 1248
!!oo
#I
EXHIBIT 111-7 AVERAGE CAPITAL COST DURATION CURVE
lt4XIHl.M USAGE WETHOD WIRE DISTRICT ELECTRIC COMPANY
a i * * * * * * a * * a * * * * * a t * * * * * * * * a * * * * * * * t * * a * * * * e * * a * * 453 907 1361
111-1 6

1
i 120 150 180 210 240 -
270 300 330 360 390 420 450 400 510 540 570 600 ;;i 720 750 780 810 640 870 900 930 960 990 1020 1050 lo80 1110 1140 1170 1200 1230 1248
EXHIBIT 111-8 AVERACE w ITAL-COST DURATION CURVE
MODIFIED P U K EOUR " X O D
MIRE DISTRICT ELECTRIC COHPANY
t - t ----I------- ,,*,,** *********tt****,,*,..*,,,*i*a,,,****,,****.t.****,**.,**.**.f
0 520 1041 lsbl 2082
111-1 7

1 210 420 630 840 1050 1260 1470 l4SO l89G 2100 2310 a20 2730 2940 3150 3360 3570 3780 3990 4200 4410
71 i o
7980 8190 8400 8610 8734
EXHIBIT 111-9 TQTU PER l4UH PRODUCTION COST D W T I O N CURVE
WPNM USAGE METHOD WIRE DISTRICT ELECTRIC COHPANY
111-18

.
1 4 6 8
10 11 14 16 1E 21 21 z 27 29 31 33
35 42 44 46 48 50 52 54 sd sa 64 a 65 4’1 69 71 73
w
B e1 84 84 07
EXHIBIT 111-10 TOTAL PER WH PRODUCTION COST DURATIoaJ CURVE.
W D I F I E D Pw( EOUR HETBOD
PZPIRE DISTRICT ELECTRIC CODBANY
111-19

SELECTION OF COSTING PERIODS FOR THE ANALYSIS OF EMBEDDED COSTS BY TIME OF U S E
The s e l e c t i o n of v i a b l e c o s t i n g p e r i o d s i n v o l v e s two s t e p s :
0 Cost f i g u r e s m u s t be s e p a r a t e d i n t o a h igh c o s t c a t e g o r y and low c o s t c a t e g o r y .
0 On t h e b a s i s of t h i s s e p a r a t i o n , c o n t i g u o u s t ime p e r i o d s of h i g h c o s t s and low c o s t s m u s t be i d e n t i f i e d .
S i n c e t h e p a t t e r n of c o s t s was s i m i l a r a c r o s s t h e t h r e e c a p i t a l c o s t
a l l o c a t i o n me thodo log ie s , t h e g e n e r i c p rocedures f o r d e t e r m i n i n g r a t i n g
p e r i o d s d i s c u s s e d i n Chap te r 11 were a p p l i e d t o on ly t h e t o t a l c o s t s
o b t a i n e d w i t h t h e Maximum Usage Method. The weighted ave rage c o s t f o r each
p e r i o d i s then c a l c u l a t e d . The resu l t s of t h i s a n a l y s i s a r e p r e s e n t e d i n
t h i s s e c t ion.
Cost SeDara t ion
The s e l e c t i o n of homogeneous c o s t i n g p e r i o d s r e q u i r e s t h a t a c o s t
b r e a k p o i n t be determined t h a t s e p a r a t e s c o s t s i n t o h i g h c o s t and low c o s t
p e r i o d s . To choose t h i s two-period b r e a k p o i n t , t h e t h r e e a l t e r n a t i v e
c r i t e r i a p r e s e n t e d i n Chap te r I1 were a p p l i e d t o t h e c o s t d a t a with t h e use
o f t h e program BREAK. R e s u l t s of t h e BREAK a n a l y s i s f o r t h e c o s t s o b t a i n e d
w i t h t h e Maximum Usage c a p i t a l a l l o c a t i o n method a r e reproduced i n
E x h i b i t 111-11.
Using t h e program WENLD, t h e t o t a l c o s t s o b t a i n e d w i t h t h e
Maximum Usage c a p i t a l c o s t a l l o c a t i o n method were s o r t e d i n t o a peak group
c o n s i s t i n g of c o s t s of $ 2 9 . 5 2 p e r MWh and o v e r and an o f f p e a k g roup
c o n s i s t i n g of c o s t s of l e s s t h a n $ 2 9 . 5 2 p e r MWh. Output from t h i s r u n
i n d i c a t e s t h a t i n 7494 h o u r s t h e c o s t s a r e o f f p e a k , w h i l e t h e remaining
1 2 4 2 h o u r s had c o s t s t h a t a r e c o n s i d e r e d peak. The program CALDR was then
111-20

.
EXHIBIT 111-11 BREAKPOIKf ANALYSIS
PIPIRE DISTRICT ELECTRIC COMPANY
R E S U L T S FOR T H E TWO-FEfiIOD CASE:
-_-----_-- ONE-WAY A N O U A C R I T E R I O N - - - - - - - - - - - THE IHF'LIED BREAKPOINT IS 2952 e 00 TOTAL SAHF'LE V A R I A T I O N IS 958446390.05 V A R I A T I O N BETWEEN THE GROUPS IS 785750421.55 V A R I A T I O N W I T H I N THE GROUPS IS 172695968.50 tiEAN ( S E T O N E ) I S 2521 e 8 7 MEAN ( S E T T W O ) IS 3380 6 5
111-21

used t o i d e n t i f y t h e t imes o f t h e y e a r when t h e h igh c o s t h o u r s occur .
r e s u l t s of t h i s run a r e d i s p l a y e d i n E x h i b i t 111-12. A s t h e CALDR l i s t i n g
The
i n d i c a t e s , c o n t i g u o u s days of h igh c o s t i n c i d e n c e f a l l i n t o t h e pe r iod
J u n e 24 t o September 22 w i t h s p o r a d i c h o u r s i n Februa ry . T h u s , a summer
p e r i o d i n c l u d i n g June-September c a n be c o n s i d e r e d .
Having i d e n t i f i e d t h e weekly t i m e f rame, i t was n e c e s s a r y t o
i d e n t i f y which set of c o n t i g u o u s h o u r s m i s c l a s s i f i e s t h e fewes t number of
h o u r s a s e i t h e r h igh o r low c o s t . To do t h i s , t h e program GLRATE was r u n
on t h e s e t of peak c o s t h o u r s t o c a l c u l a t e t h e v a l u e of t h e e r r o r f u n c t i o n
E f o r t h e a l t e r n a t i v e h o u r l y r anges . R e s u l t s of t h e s e c a l c u l a t i o n s f o r t h e
Maximum Usage d a t a , shown i n E x h i b i t 111-13, i n d i c a t e t h a t t h e E f u n c t i o n
i s minimized f o r t h e June 24 t o September 22 b l o c k when t h e peak hour s a r e
r e s t r i c t e d t o t h e p e r i o d from 1 O : O O a.m. t o 1 O : O O p.m. T h i s p e r i o d
c o i n c i d e s w i t h t h e p e r i o d o f h igh t e m p e r a t u r e s occur ing d u r i n g t h e summer
o f 1980. S i n c e , i n t h e p a s t , t h e summer h i g h t empera tu res have occur red a t
v a r i o u s t i m e s between June and September , i t was dec ided t o ex tend t h e peak
p e r i o d from June 1 t o September 30. The r e s u l t i n g GLRATE r u n i s shown i n
E x h i b i t 111-14. The h o u r l y r ange minimiz ing t h e E f u n c t i o n is 1O:OO a.m.
t o 9 : O O p.m. Off-peak c o n s i s t s of a l l o t h e r hour s .
Weighted Average Cost by P e r i o d
Given t h e peak and o f f p e a k p e r i o d s , t h e average weighted c o s t by
p e r i o d was c a l c u l a t e d w i t h t h e program COST52. R e s u l t s of t h i s run f o r t h e
Maximum Usage d a t a , shown i n E x h i b i t 111-15, i n d i c a t e weighted average
c o s t s f o r t h e peak pe r iod of $32 .40 p e r MWh, $25.87 p e r MWh f o r t h e
of f -peak p e r i o d w i t h an annual ave rage embedded c o s t of $27.12 p e r Mh'h, or
. 2 7 . 1 2 m i l l s p e r kWh. These ave rage c o s t s a r e a l s o s e p a r a t e d i n t o t h e i r
demand and ene rgy components.
111-22

EXHIBIT 111-12 LIST OF RIcEf COST EOURS
EHPIRE DISTRICT ELECTRIC COFPANY
6 1 2 4 - 9 I 1 2 J O 2 0 6 / 25 - 11 T O 22 6 / 2 6 - 9 T O 2 2 o 6 / 2 7 - 9 1 0 2 2
6 / 29 - 12 TO 20 e
6 / 30 - 12 TO 22 r
7 1 1 - 9 1 0 2 3 . 7 1 2 - 9 T O 2 3 0 7 / 3 - 9 T O 2 2 , 7 1 4 - 1 1 T O 2 1 r 7 / 5 - 11 T O 22 7 1 6 - 1 l T 0 2 2 r 7 1 7 - 9 T O 2 3 e 7 / 8 - 9 1 0 2 3 0 7 1 9 - 9 T O 2 3 r 7 / 1 0 - 9 T O 2 3 * 7 / 11 - 10 T O 22 o
7 / 12 - 11 T O 22 r
7 / 13 - 1 1 T O 22 7 / 1 4 - 9 T O 2 3 0 7 / 1 5 - 9 1 0 2 3 0
7 / 1 6 - 9 1 0 2 3 7 / 1 7 - 9 T 0 2 3 0 7 / 1 8 - 9 1 0 2 3 * 7 / 19 - 10 T O 23 o
7 / 20 - 10 T O 22 r
7 / 2 1 - 9 T O 22 * 7 / 2 2 - 1 1 0 2 1 0
7 / 2 3 - 1 1 0 2 2 7 / 2 4 - 1 T O 2 2 7 / 2 5 - 1 1 0 2 2 . 7 / 26 - 1 T O 9 I 1 4 T O 19 7 / 2 7 - 1 T O 9 t 1 4 T O 1 9 0 7 / 2 8 - 1 1 0 2 2 * 7 1 2 9 - 9 T O 2 3 7 1 3 0 - 9 T O 2 3 r
7 / 3 1 - 9 T O 2 3 o
8 / 1 - 9 1 0 2 3 * 8 / 2 - 1 1 1 0 2 2 0 e / 3 - 1 l T O 2 2 r 8 / 4 - 9 T O 2 2 r 8 1 5 - 9 1 0 2 2 o
6 / 28 - 11 TO 21 o

* .
EXHIBIT 111-12 (Cont.) LIST OF RICH COST HOURS
( C d h t e )
8 / 6 - 9 T O 2 2 , E / 7 - 9 T O 2 3 e 8 / 8 - 9 T 0 2 3 e 8 / 9 - 1 1 T O 2 2 * 8 / 10 - 11 T O 22 8 / 1 1 - 9 T O 2 2 * 8 / 12 - 10 TO 22 8 / 13 - 10 T O 22 8 / 1 4 - 12 TO 22 8 / 15 - 10 TO 22 8 / 16 - 10 TO 2 2 8 / 17 - 11 T O 21 8 / 18 - 11 T O 2 2 8 / 1 9 - 1 T O 2 2 + 8 / 2 0 - 1 T O 2 2 8 / 2 1 - 1 T O 9 1 1 I T O 2 0 * 8 / 2 2 - 1 T O 9 1 1 1 T O 2 1 0
8 / 2 3 - 1 T 0 9 I 1 2 T O 2 2 o
8 / 2 4 - 1 T O 9 9 1 2 T O 2 2 , 8 / 2 5 - 1 T O 2 2 8 / 26 - 11 TO 21 8 / 27 - 11 TO 21 8 / 28 - 11 TO 20 o
8 / 29 - 11 T O 21 8 / 30 - 12 T O 2 1 o
8 / 3 1 - 13 T O 20 9 / 1 - 1 3 T O 2 0 0 9 / 2 - 1 4 T O 1 7 e 9 / 3 - 1 4 T O l 8 ~ 2 0 e 9 / 4 - 1 1 T O 20 9 / S - l l T O 2 0 0 9 / 6 - 1 1 T O 2 0 e 9 / 7 - 1 3 T O 2 0 0 9 / 8 - 11 TO 20 9 / 9 - 1 2 T O 1 7 0 9 / 12 12 TO 18 o
9 / 13 - 12 TO 15 o
111-24
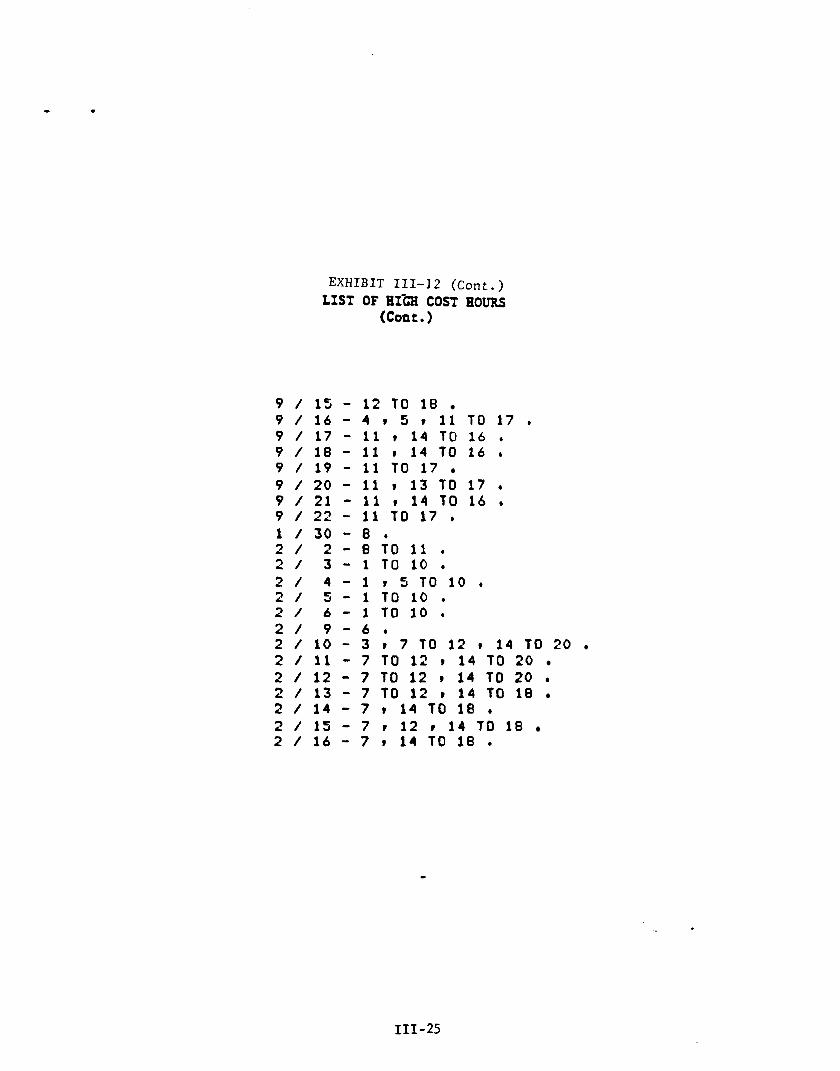
EXHIBIT 111-12 (Cont.) LIST OF HI-a COST EOURS
(Cont .I
9 / 15 - 12 T O 18 9 / 1 6 - 4 ~ 5 ~ 1 1 T O 1 7 0 9 / 17 - 11 9 1 4 T O 16 o
9 / 18 - 11 9 14 T O 16 o
9 / 19 - 11 T O 17 9 / 20 - 11 v 13 T O 17 t
9 / 21 - 11 9 1 4 T O 16 t
9 / 22 .. 11 TO 17 1 / 3 0 - 8 0 2 / 2 - 8 T 0 1 1 0 2 / 3 - 1 T O 1 0 0 2 / 4 - 1 9 5 T O 1 0 0 2 / C J - l T O l O * 2 / 6 - 1 T 0 1 0 . 2 / 9 - 6 0 2 / 10 - 3 9 7 TO 12 9 1 4 T O 20 2 / 11 - 7 T O 12 9 1 4 T O 20 2 / 12 - 7 T O 12 9 1 4 TO 20 * 2 / 13 - 7 T O 12 v 1 4 T O 18 2 / 1 4 - 7 t 1 4 T O l B e 2 / 15 - 7 I 12 P 1 4 TO 18 2 / 1 6 - 7 ~ 1 4 T O l B o
111- 25

.
RhNGE
9-17 9-18 9-19 9 - 2 0 9-21 9-22 9-23 10-17 10-18 10-19 10-20 10-21 10-22 10-23 11-17 11-18 11-19 11-20
-----
N U M B E R OF TYF'E 1
E R R O R S
155 167 182 198 226 263 335 105 117 132 148 176 213 285
35 67 82 98
----_---
EXHIBIT 111-13 SELECTION OF OPTRUL PEAK COSTING PERIOD
WIRE DISTRICT ELECT2IC COPIPANY
FOTENTIAL TYFE 1
ERRORS
810 900 990 1080 1170 1260 1350 720 810 9 0 0 990 1080 1170 1260 630 720 810 9 0 0
----*----_
NUHPER OF FOTENTIAL TYFE 2 TYPE 2
E R R O R S ERRORS
474 2094 396 2004 321 1914 247 1824 185 1734 132 1644 114 1554 514 2184 436 2094 361 2004 287 1914 225 1824 172 1734 154 1644 554 2274 476 2184 401 2094 327 2004
-__------- ------
VALUE OF O B J E C T I V E FUNCTION
21 b7 1 9 . 4 17.3 15.3 14*2 13.6 15.5 21.3 19eO 17.0 15.0 1308 13*3 lStl 21 * o 18.7 16.6 14.6
---_-----
11-21 126 990 265 1914 , 13.5
11-23 235 1170 194 1734 1 4 e 8 - 22 163 1080 212 1824 12.9)
12-17 12-18 12-19 12-20 12-21 12-22 12-23 13-17 13-18 13-19 13-20 13-21 13-22 13-23 14-17 14-18 14-19 14-20 14-21 14-22 14-23
35 47 62 78 106 143 215 22 34 49 69 9 3 130 202 13 25 40 56 84
121 193
540 624 630 546 720 471 810 397 900 335 990 282 1080 264 450 701 540 623 630 548 720 474 eio 412 900 359 990 341 360 782 450 704 540 629 630 555 720 493 810 440 900 422
111-26
2364 2274 2184 2094 2004 1914 1824 2454 2364 2274 2184 2094 2004 1914 2544 2454 2364 2274 2184 2094 2004
22.7 20.4 18.4 16.4 15.2 14e6 16.5 24.9 22.6 20.6 18.6 17.4 16.8 18.7 2 7 * 4 25.1 23.0 21 b o
19.9 19.3 21.2

RANGE
9-17 9-18 9-19 9-20 9-21 9-22 9-23
10-17 10-18 10-19 10-20 10-21 10-22 10-23 11-17 11-18 11-19
-----
N U H B E R OF TYPE 1
E R R O R S
4 3 4 477 d i 3 570 629 697 800 3'53 396 4 4 2 489 548 616 719 272 315 361
--------
=9
EXHIBIT 111-14 SELECTION OF SUHHER PEAK COSTING PERIOD
PIPIRE DISTRICT ELECTRIC COMPANY
FDTENTIAL NUHEEF: OF FOTEN T IAL V A L U E OF TYFE 1 TYF'E 2 T Y P E 2 OBJECTIVE
E R R O R S E R R O R S E R k D R S F U N C T I O N --_------- -c-__----- ------ --------- 1089 474 1815 31.3 1210 396 1694 , ' 3 0 * 1 1331 321 1573 29 .1 1452 247 1452 2 8 . 1
28.0 1694 132 1210 2 8 . 5 1815 1 1 4 1089 31.5
968 514 1936 2949 1089 436 1815 28 .7 1210 361 1694 27 .7 1331 287 1573 2647 1452 225 1452 26 .6 1573 172 1331 2 7 . 1 1694 154 1210 3 0 . 1
847 554 2057 2 8 . 9 968 476 1936 27 .2
1089 401 1815 26 .2
1573 185 1331
11-20 4 0 8 1210 327 1694 2 5 . 3
11-22 535 1452 212 1452 25 .7 111-21 467 1331 265 1573 2 5 . 2 1 11-23 12-17 12-18 12-19 12-20 12-21 12-22 12-23 13-17 13-18 13-19 13-20 13-21 13-22 13-23 14-17 14-18 14-19 14-20 14-21 14-22 14-23
638 221 264 310 357 416 4 8 4 587 177 220 266 313 372 4 4 0 543 137 180 226 273 3 3 2 400 5 0 3
1573 726 847 968
1089 1210 1331 1452 605 726 847 968
1089 1210 1331
484 605 726 847 960
1089 1210
194 624 546 4 7 1 397 335 282 264 7 0 1 6 2 3 548 474 412 339 3 4 1 78 2 704 629 555 493 440 422
1331 2178 2057 1936 1815 1694 1573 1452 2299 2178 2057 1936 1815 1694 1573 2420 2299 2178 2057 1936 1815 1694
2847 2941 2749 26 .9 2 6 . 0 2 5 . 9 2 6 * 4 2 9 . 3 3 0 * 2 2940 2 8 . 0 2 7 . 1 27.0 27.5 3 0 4 4 3a.4 30 .4 29 .4 2845 28.4 2849 31 6 9
111-27

EXHIBIT 111-15 TOTAL SYSTEM PRODUCTION COST AND MWH BY COSTING PERIOD
EMPIRE DISTRICT ELECTRIC COMPANY
Mwh Dollars /Mwh - Dollars
Peak - June 1 - September 30 - 1O:OO a.m. - 9 : 0 0 p.m.
Energy Cost 9 , 1 7 9 , 9 7 6 - 18.24 Capital Cost 7 , 1 2 6 , 6 3 4 - 14.16
Total 1 6 , 3 0 6 , 6 1 0 503 , 2 75 32.40 -
Off Peak - A l l other hours
Energy Cost 2 7 , 6 2 1 , 7 5 1 Capital Cost 1 9 , 7 00 , 1 3 5
Total 47,321,886
Total Year - A l l hours
Energy Cost 36,801,727 CapiFil Cost 2 6 ; 8 2 6 ; 7 6 9
6 3 , 6 2 8 , 4 96 Total
- 1 , 8 4 3 , 2 4 4
2 , 3 4 6 ,S 19
14 9 9 10 .68 25 67 -
15.68
111-28

ALLOCATION OF PRODUCTION COSTS TO CUSTOMER CLASSES
System p r o d u c t i o n e n e r g y - r e l a t e d and demand-related c o s t s were
a l l o c a t e d t o customer c l a s s e s by t h e method d e s c r i b e d i n Chapter 11.
System demand-related c o s t s were summarized by month and by c o s t i n g pe r iod
and a l l o c a t e d t o customer c l a s s e s u s i n g a peak and ave rage approach.
System energy c o s t s f o r each monthly p e r i o d were a l l o c a t e d on a kWh b a s i s .
E x h i b i t 111-16 i l l u s t r a t e s t h e t h i r t e e n customer c l a s s e s and t h e c o s t s
a l l o c a t e d t o each c l a s s f o r t h e peak p e r i o d , t h e off-peak p e r i o d , and t h e
whole y e a r . E x h i b i t 111-17 r e p r e s e n t s t h e s e d o l l a r s on a p e r MWh b a s i s .
These c l a s s c o s t s a r e t y p i c a l c o s t s f o r Empire 's customers i n t h e
s t a t e of M i s s o u r i . Loss and load i n f o r m a t i o n s u f f i c i e n t for purposes of
a l l o c a t i n g p roduc t ion demand and ene rgy c o s t s was not a v a i l a b l e f o r t h e
t e s t y e a r f o r customers i n o t h e r j u r i s d i c t i o n s . We b e l i e v e t h e s e average
c o s t s a r e r e p r e s e n t a t i v e for customers i n o t h e r j u r i s d i c t i o n s .
111-29

E X H I B I T 111-16 CLASS ALLOCATION OF TIME DIFFERENTIATED
EMPXRE DISTRICT E L E C T R I C COMPANY PRODUCTION COSTS
S U f l H E R FEAE;
CLASS P R O D ENERGY $
RES. GEN, R E S , U/H R E S + T I E , COHM, SEkV COHM, T I E , GEN, POWER T e E e B L I l G e PWER TRAN, FEED H I L L ATLAS L I NIlE
L I G H T I N G TOTAL
ELECe FUR,
OFF PEAK
1990074 42'5009 665566 715241 156752 * 1828063, 445217, 282248, 3661
449683, 153698, 26813, 4127e
7146152.
CLASS PROD ENERGY
RES, GEN, R E S , W/H RES t 1 *E e
COHH, SEkV COMH, T I E *
GEN, POWER T I E * E L D G , PWER TRANI FEED HXLL ATLAS L I N D E ELECe FUR, L I G H T I N G T O T A L
s
4527408 1394200, 2700866 1742180e 383470t
5270700 11 3932% 937540, 16657,
2221071 700415e 96324 +
351800, 21'502156,
1865324, 327433. 5389806 606625 e
120915. 1226887. 304932 e
15981 1 + 5737 *
321221 * 77842 210151 1583,
'5577805
P R O D DEHAN D $
3108653* 1001648, 215611l* 1331756e 329613,
3906183, 1017776. 61 1756
18950 . 1228381 413563, 843'58
209934 e
15418702 6
TOT, F R O D * s
3855398 752444 * 1204046* 1321864 277667 6
3054950 750147, 442059
9397 770904 231542, 47828 5708
12723954 e
TOT, F R O D * $
7636061 2395846, 48'56977. 3073938 * 713084 *
9176802, 2177104e 154929'1
35608 . 3449453 11 13975. 190881 561754.
36920860 .

EXHIBIT 111-16 (Cont.)
TOTAL Y E A R
C L A S S FRO11 ENERGY S
R E S . GEN, R E S 0 W/H R E S , TeE, COHH, SERV C O t I i l , T I E * GENI POWER T * E * E L D G o PWER T R A N o F E E D M I L L A T L A S L I N D E ELEC, FUR0 L I GHT I NG TOTAL
6517482. 1819209 0 3366432, 2457421
540222 7098763, 1604542, 3219788,
20318, 2670754
8541130 123337, 355927 *
28648308 0
4973977, 1329081 0
2694591 1938381
450528 5133070. 1322708 e
771567. 24687,
1549602 9
491405, 105373. 211537,
20996507
11491459, 3148290 6061023, 4395802,
990751 12231832
2927251 e
1991354, 45005 *
4220337 1345517,
228709 567464 0
49644814
111-31

EXHIBIT 111-17 AVERAGE PRODUCTION COSTS BY TIME PERIOD
EMPIRE DISTRICT ELECTRIC COMPANY
SUMMER PEAK
C L A S S
RLS, GENe RES W/'H RCSe T * E * COHM, SER'J COHH, TIE, GtNe POWER T , E * BLDG, PWEk T R A N , FEED HILL A T L A S L I N U E
L J GHTING T O T A L
OFF PEAK
C L A S S
ELEC, FUR,
RES+ G E N , RES, U / H RES, T * E i C O H l i e SEKU COHH, T I E , GEN, POWER T * E * ELIlG, PWER T R A N , F E E f i HILL A ~ L A S L I NDE ELECI FUR, L I G H T IN6 T O T A L
AUEa ENERGY A V E , IlEHANXl
19 903 19 ,878 1 9 , 7 5 0 19 ,824 19 ,779 19.440 1 9 , 7 2 5 1 9 , 3 8 0 18 .397 I ? * 974 19,409 19 ,262 1 9 , 5 5 9 19 ,715
A V E * ENERG $/WWH
1'1*465' 151334 15 ,294 151364 151276 15,272 151251 15 ,227 15 366 15 * 269 15 ,301 156210 15 e 436 15 327
$/HWH
18,655 15,314 151979 161814 15 ,257 134047 1 3 , 5 1 0 101973 28 829 14 .268
9 830 15,097
7 502 15 ,388
/E 9 DEM .... D $/HUH
101622 11,016 12e209 111745 1 3 , 1 3 1 116318 13 ,389
9 e 936 176482
86445 9 034
13 ,293 91212
101991
AWE, P R O D * S/HWH
38 558 3 5 , 1 9 2 35 ,729
35 037
33 * 23s 30 353 47 ,221 3 4 , 2 4 3 29 ,239 34 , 359 27 052 35.103
36 638
32 487
A V E I F R O X I * $/HWH
1 6 . 0 9 1 26 9 350 27 1503 27,109 28 e 407 26 ,590 28 * 640 25,164 32 849 2 3 , 7 1 3 24 * 335 28 303 24,648 26 ,318
111-32

EXHIBIT 111-17 (Cont.)
TOTAL YEAR
C L A S S
RES, GEN, RES+ W/H RES. T , E * COHiY, SERV COf lH , T I E + GEN, POWER T I E * ELDG, FWER T R A N . F E E D HILL A tLAS L f N I l E E L E C I FUR. LIGHTING T O T A L
AUEe ENERGY AWE, DEWANLI $/HWH $/flWH
lbe59B 16,199 1 6 t 0 0 8 1 6 , 9 4 1 16 a 357 16t164 16 .275 16.022 15,836 15.900 15,907 15,939 151474 16,228
12.667 11,835 1 2 , 8 1 3 12,968 1 3 , 6 4 1 11.688 1 3 , 4 1 7 10.134 19.242
9 , 2 2 5 9 , 1 5 2 13,618
9 , 196 11.894
29.265 . 28,034 28.821 29 ,409 29 , 9 9 8 27 * 853 29 692 2 6 , 3 5 6 35 078 25,125 25 * 059 2 9 * 357 24 670 28 . 122
I11 -33

I V . SHORT RUN MARGINAL COSTS FOR EMPIRE DISTRICT ELECTRIC COMPANY
I N T R O D U C T I O N
In t h i s c h a p t e r we deve lop and p r e s e n t t h e resul ts o b t a i n e d from
a n a l y z i n g EDECo.'s s h o r t run marg ina l c o s t s (SRMC's). In t h e f o l l o w i n g
s e c t i o n s of t h i s c h a p t e r we p r e s e n t t h e s h o r t run marg ina l c o s t s , t h e
d e t e r m i n a t i o n of t h e b r e a k p o i n t between h i g h c o s t s and low c o s t s , t h e
s e l e c t i o n of c o s t i n g p e r i o d s , and a summary of t h e SRMC by p e r i o d .
SHORT RUN M R G I N A L COSTS
The s h o r t run marg ina l c o s t s f o r Empire were determined us ing the
EBCOST d i s p a t c h model d e s c r i b e d p r e v i o u s l y . They r e p r e s e n t t h e system
lambdas f o r t h e 8736 h o u r s i n t h e t e s t yea r . The SRMC r e s u l t s o b t a i n e d
from t h e model are d e p i c t e d g r a p h i c a l l y i n t h e c o s t d u r a t i o n cu rve shown i n
E x h i b i t IV-1 . The h i g h e s t c o s t hour i n t h e y e a r was $35.27/MWh and t h e
lowes t was $9.24/MWh.
DETERMINATION OF THE BREAKPOINT
The d e t e r m i n a t i o n of a b r e a k p o i n t between t h e h i g h and low SRVC
v a l u e s i s made i n acco rdance w i t h t h e methods d e s c r i b e d i n Chapter 11. 'Ihe
a p p l i c a t i o n f o l l o w s t h e s a m e s t e p s t h a t were used t o de t e rmine t h e
b r e a k p o i n t f o r t h e ave rage t o t a l embedded c o s t s . E x h i b i t IV-2 p r e s e n t s t h e
a n a l y s i s f o r t h e s e l e c t i o n of t h e b r e a k p o i n t between h i g h and low c o s t .
IV-1

EXHIBIT IV-1 EMPIRE DISTRICT ELECTRIC COMPANY
SHORT RUN MARGINAL COST DURATION CURVE
IV-2

EXHIBIT IV-2 EMPIRE DISTRICT ELECTRIC COMPANY
BREAKPOINT ANALYSIS
ON E - W G Y k N i! V A C K I T E Fi I 0 N----- - -- - - - ) - - - - - - - - - THE I H F ' L I E D B R E A t \ P D I N T IS 19E2 , G O 7 0 T k L SAMF'LE V A R I A T I O N IS 2247623353,75
V A F \ ' I A T I O N W I T H I N THE G F ; O U F S IS JJJ470271.15 MEAN ( S E T ONE) 15 11 2:'. c, ' I
MEAN ( S E T TWO) IS 2813+2.1
V A R I A T I O N FETWEEN THE GKOUF'S I S l t 7 4 2 1 X i ' 2 + 6 0 c c e
T U T A L SAMPLE V A R I A T I O N IS V A R I A T I O N BETWEEN THE Gli:OCII'S IS V A R I A T I O N W I T H I N THE GROUF'S IS MEAN ( S E T ONE) IS MEAN ( S E T TWO) I S MEAN ( S E T T H R E E ) IS S T O P
IV-3

Using t h e ANOVA C r i t e r i o n , a b reakpo in t of $19.82/MWh was de te rmined .
Based on t h i s b r e a k p o i n t , t h e program WENLD was run. T h i s program creates
two f i l e s - -one f i l e c o n s i s t i n g of a l l hour s when c o s t s e q u a l o r exceed the
s p e c i f i e d b r e a k p o i n t of $19.82/MWh and a second f i l e c o n s i s t i n g of a l l
h o u r s i n which c o s t s are less t h a n $12.95/MWh. Using t h i s b r e a k p o i n t , 639
h o u r s were c l a s s i f i e d as h i g h c o s t h o u r s and t h e remaining 8097 a s low c o s t
h o u r s . SELECTION OF OPTIMAL COSTING PERIODS
The 639 h i g h c o s t hour s are i d e n t i f i e d u s i n g t h e program CALDR.
E x h i b i t IV-3 p r e s e n t s a l i s t i n g of t h e s e hours . Looking f i r s t a t t h e
s u m e r p e r i o d , we see t h a t beginning J u n e 24 a p a t t e r n of h i g h c o s t hour s
on w e k d a y s beg inn ing i n t h e l a t e morning and c o n t i n u i n g u n t i l t h e l a t e
e v e n i n g emerges. T h i s p a t t e r n c o n t i n u e s i n t o September w i t h weekends
i n c l u d e d .
Examinat ion of E x h i b i t I V - 3 f o r a w i n t e r p e r i o d shows on ly a few
i s o l a t e d h i g h c o s t hour s i n Janua ry and February. No a p p r o p r i a t e w i n t e r
peak can be determined from t h e s e hours .
The h o u r l y bounds d e f i n i n g t h e summer peak p e r i o d are determined
u s i n g t h e program GLRATE. E x h i b i t IV-4 shows t h e r e s u l t s of t h i s a n a l y s i s
f o r t h e summer peak p e r i o d . The e r r o r f u n c t i o n i s minimized f o r t h e peak
p e r i o d i f t h e h o u r l y bounds f o r t h e peak p e r i o d are 1 1 : O O a.m. t o 1 O : O O
p.m. f o r t h e p e r i o d beg inn ing on June 24 and ending on August 25. As can
be seen from t h i s E x h i b i t , 10.1 p e r c e n t of t h e hour s are m i s c l a s s i f i e d .
IV -4

EXHIBIT IV-3 EMPIRE DISTRICT ELECTRIC COMPANY
H I G H COST HOURS
6 / 1 C - 1 6 1 1 7 + 6 / 2 4 - 12 I 14 T O 18 I 2 1 I 2 2 + 6 / 25 - 13 T O 20 +
4 / 27 - 11 T O 20 I 22 + 6 / 28 - 14 TO 19 I 2 2 +
6 / 29 - 17 T O 13 +
6 ,' 30 - 15 T O 2 0 + 7 / 1. - 1 1 TO 22 e
7 / 2 - 1 O T O 2 2 e 7 / 3 - 11 TO 20 + 7 / 4 - 1 4 ~ 2 0 r 7 / 5 - 14 T O 19 I 22 + 7 / 6 - 1 6 T O 1 9 1 2 1 1 2 2 + 7 / 7 - 1 1 TO 2 2 + 7 1 8 - 1 0 T O 2 2 + 7 / 9 - 1 1 T O 22 + 7 / 10 - 1 1 TO 2 2 +
7 / 11 ... 11 T O 2 2 + 7 / 12 - 13 T O 23 + 7 / 13 13 T O 2 1 + 7 / 14 - 11 TO 2 2 + 7 / 15 - 10 T O 2 3 t
7 / 16 - 10 TO 23 + 7 / 17 - 10 T O 22 +
6 / 2 6 - 11 TO 21 .
7 / 18 - 10 T O 22 +
7 / 19 - 11 T O 2 2 t
7 / 20 -. 1 4 T O 23 + 7 / 2 1 - 10 T O 2 1 +
7 / 22 - 13 T O 20 +
7 / 23 - 15 T O 19 + 7 / 24 - 1 4 TO 20 I 22 +
7 / 25 -. 13 TO 20 + 7 / 28 - 14 T O 2 0 + 7 / 2 9 - 12 T O 23 + 7 / 30 - 1 1 T O 2 2 + 7 / 3 1 - 1 1 TO 23 8 / 1 - 1 1 T O 2 1 * 8 / 2 - 1 5 1 1 6 , 2 1 + 8 / 3 - 1 4 T O 1 8 ~ 2 0 + 8 / 4 - 1 1 T O 2 1 e 8 / 5 - 1 2 T O 2 3 + 8 / 6 .- 11 T O 23 + 8 / 7 - 1 1 T O 2 2 e 8 / 8 - 11 T O 23 + 8 / 9 - 1 2 T O 2 1 . 8 / 10 - 1 4 T O 2 1 + 8 / 11 - 11 TO 2 1 r
IV-5

EXHIBIT IV-3 EMPIRE DISTRICT ELECTRIC COMPANY
HIGH COST HOURS
8 / 1 2 - 12 TO 8 / 13 - 12 TO 8 / 14 - 15 T O 8 / 15 - 11 T O 8 / 16 - 12 P
22 * l Q c
19 I
2 1 * 3 r
8 / 1 7 - 1 7 I 18 4
8 / 18 - 1 4 T O 19
(Cont.)
22 *
7 TO
8 / 19 - 12 T O 2 1 . 8 / 2 0 - 11 TO 2 2 + 8 / 21 - 13 9 It P 19 +
8 / 2 2 - 1 8 I 13 + 8 / 25 - 1 4 T O 2 2 , 8 / 26 - 13 T O 20 I 22 + 8 / 27 - 12 T O 21 , 8 / 28 - 13 T O 18 , 8 / 29 - 15 T O 20 , 6 / 3 0 - 1 8 . 9 / 1 - 1 6 T O 1 8 ,
9 1 5 - 1 4 T O 2 1 , 9 / 6 - 1 3 ~ 1 9 , 9 1 7 - 1 0 , 9 1 8 - 1 3 T O l 8 I 2 0 ? / 9 - 1 4 T 0 1 6 , 9 / 15 - 17 I 19 9 20 9 / 16 - 1 4 TO 17 9 / 1 9 -. 15 9 / 2 2 - 1 6 , 1 / 5 - B t 1 0 . 1 1 1 2 - 8 ~ V * 2 / 2 - 1 2 r 1 ? + 2 1 4 - 9 , 2 / 5 - 9 7 1 0 , 2 / 1 0 - 1 2 1 1 3 , 2 1 1 1 - 9 , 2 / 1 3 - 9 ,
9 1 4 - 1 4 T O 1 8 ,
9 , 2 2 +
IV -6

EXHIBIT IV-4 EMPIRE DISTRICT ELECTRIC COMPANY
SELECTION OF OPTIMAL SHORT-RUN MARGINAL COSTING PERIOD
f ' i 1
IV -7

S h o r t run margina l c o s t s , weighted by MWh, were c a l c u l a t e d f o r
e a c h pe r iod . The weighted SRMC v a l u e s f o r t h e summer peak and base p e r i o d s
a re shown i n E x h i b i t IV-5, a l o n g wi th t h e o v e r a l l average SRMC. As shown,
t h e peak weighted SRMC i s $26.26/MWh, t h e off-peak weighted SRNC i s
$11.84/MWh, f o r an o v e r a l l ave rage of $13.66/MWh.
SELE,CTION OF APPROPRIATE RATING PERIODS
In the l a s t c h a p t e r , t h e r a t i o n a l e f o r n o t s e l e c t i n g t h e op t ima l
c o s t i n g p e r i o d s f o r embedded t i m e of use c o s t s was given . A similar
argument h o l d s f o r d e s i g n i n g r a t i n g p e r i o d s based on s h o r t run marg ina l
c o s t s . The l e v e l of c o s t i n t h e h igh c o s t hour s i s be ing d r i v e n by l o a d s
r e s u l t i n g from high t empera tu res . The i n c r e a s e i n l o a d s due t o t h e h igh
t e m p e r a t u r e r e q u i r e s t h e o p e r a t i o n of t h e Energy Center u n i t s , which d r i v e
t h e marg ina l energy c o s t i n t o the $30/MWh range and h ighe r . S ince t h e s e
h i g h t empera tu res can and do occur anywhere w i t h i n t h e June-September
months, r a t i n g p e r i o d s should be des igned t o i n c o r p o r a t e t h e s e e n t i r e
months. 'In a d d i t i o n , a pe r iod s t a r t i n g a t t h e beginning of a month and
end ing a t t h e end of a month i s a d m i n i s t r a t i v e l y e a s i e r and less confus ing
t o a customer.
T h e r e f o r e , t h e program GLRATE was r e r u n f o r t h e p e r i o d June 1 t o
September 30. The r e s u l t s are shown i n E x h i b i t IV-6. As t h i s e x h i b i t
I l l u s t r a t e s , t h e b e s t h o u r l y peak p e r i o d i n t h i s d a i l y range is 2:OO p.m.
t o 6: 00 p.m., which results i n a m i s c l a s s i f i c a t i o n of 20.3 p e r c e n t of a l l
h o u r s i n t h e range.
IV-8

EXHIBIT IV-5 EMPIRE DISTRICT ELECTRIC COMPANY
SHORT-RUN MARGINAL COST AND ENERGY BY OPTIMAL COSTING PERIOD
Unit Cost Period (S/MWH)
Peak 26.26
Off -Peak 11.84
Total Year 13.66
Total Cost ($ )
7,784,870
24 ,266 ,179
32 ,051 ,049
296,432
2 ,050 ,087
2 ,346 ,519
IV -9

EXHIBIT IV-6 EMPIRE DISTKICT ELECTRIC COMPANY SELECTION OF SHORT-RUN MARGINAL
COST RATING PERIOD
I ... -. ...... - - .........
_ i l
. . . . . * , . . .
L_
. -., . . - . _ A - _' - _. . . . . . . . . . . . . . . . . .-. . . . ;
'5 , 7 L. I ,
IV-10

T h i s peak p e r i o d , however, i s mis lead ing . The o p t i m a l p e r i o d s
d i s c u s s e d i n t h e l a s t s e c t i o n , as w e l l as t h e v a r i o u s a l t e r n a t i v e d a i l y
s t a r t and s t o p p o i n t s examined, a l l i n d i c a t e d a l o n g e r h o u r l y range of
1 1 : O O a.m. t o 1 O : O O p.m. By e x t e n d i n g our d a i l y p e r i o d t o t h e f o u r summer
months f o r t h e r e a s o n s l i s t e d above, t h e h o u r l y range has been b i a s e d due
t o t h e a d d i t i o n a l m i s c l a s s i f i c a t i o n of hours . S ince a d u r a t i o n of h i g h
t e n p e r a t u r e s c a u s e s a c o s t p a t t e r n w i t h a l o n g e r peak, t h e pe r iod of
1 1 : O O a . m . t o 1O:OO p.m. i s more a p p r o p r i a t e f o r r a t i n g p e r i o d s e l e c t i o n .
The s e l e c t i o n of t h e p e r i o d of 1 1 : O O a.m. t o 1 O : O O p.m. June th rough
September r e s u l t s i n a m i s c l a s s i f i c a t i o n of 27.4 p e r c e n t of hours .
SWMARY OF SHORT RUN MARGINAL COST BY RATING PERIOD
E x h i b i t IV-7 c o n t a i n s t h e M - w e i g h t e d c o s t s f o r t h e peak and
off-peak p e r i o d s .
weighted off-peak !XMC i s $11.39/MWh, while t h e weighted t o t a l yea r SRMC i s
$13.66/MWh.
As i s shown, t h e weighted peak S R l C i s $21.97/MWh, t h e
IV-11

EXHIBIT IV-7 EMPIRE DISTRICT ELECTRIC COMPANY
SHORT-RUN MARGINAL COST AND ENERGY BY RATING PERIOD
Unit Cost Total Cost MWH Period ($/MWH) ($1 -
Peak 21.97 11,064,313 503,640
O f f -Peak 11.39 20,986,727 1,842,879
Total Year 13.66 32,051,040 2,3,46,5 19
IV-12

A P P E N D I X A
D E S C R I P T I O N OF E B C O S T
I N T It0 DUC T I ON
Th i s appendix d e t a i l s t h e s p e c i f i c a t i o n s , a p p l i c a t i o n s , and d a t a
r e q u i r e m e n t s of t h e E r n s t & Whinney Embedded Cost Model ( E B C O S T ) . The
model p r o v i d e s t h e c a p a b i l i t y of de t e rmin ing , on a n hour-by-hour b a s i s , t h e
mas!: economical u n i t commitment-economic d i s p a t c h i n g schedu le and t h u s t h e
h o u r l y o p e r a t i n g ave rage and i n c r e m e n t a l p r o d u c t i o n c o s t s of e l e c t r i c i t y ,
r e c o g n i z i n g such f a c t o r s as minimum l o a d i n g , s t a r t u p c o s t s , main tenance
o u t a g e s , and u n i t d e r a t i o n s .
MODZL METHODOLOGY
EBCOST d e t e r m i n e s t h e h o u r l y n e t g e n e r a t i o n schedu le ove r a t i m e
h o r i z o n of up t o 168 hours . The schedu le c o n s i s t s of t h e s t a r t u p and
shutdown of a l l u n i t s p l u s t h e d i s t r i b u t i o n of hour ly g e n e r a t i o n
r e q u i r e m e n t s ove r a l l u n i t s on-l ine. The program m a i n t a i n s adequa te
s p i n n i n g and f a s t - s t a r t r e s e r v e s i n a manner t h a t minimizes t h e t o t a l
o p e r a t i n g c o s t of t h e sys t em. E B C O S T c o n s i d e r s scheduled n e t i n t e r c h a n g e
c o n t r a c t d e l i v e r i e s , pu rchase c o n t r a c t s w i t h a s s o c i a t e d demand c o s t s , u n i t
main tenance s c h e d u l e s i n c l u d i n g p a r t i a l d e r a t i o n s , and minimum downtime and
minimum upt ime c o n s t r a i n t s .

i t s a v e r a g e , r a t h e r t h a n i t s i n c r e m e n t a l o p e r a t i n g , c o s t . However, t h e
d e s i g n a t i o n of a g a s t u r b i n e i s a t t h e d i s c r e t i o n of t h e use r . If a gas
t u r b i n e i s a s s i g n e d a p r i o r i t y and s t a r t u p c o s t , i t may be t r e a t e d as a
normal u n i t .
SPECIAL SYSTEM CONSTRAINTS HANDLING PROCEDURES
S p e c i a l c o n s t r a i n t s are t r e a t e d w i t h e i t h e r t h e u n i t commitment
o r economic
0
0
0
0
0
d i s p a t c h phases. These i n c l u d e :
U n i t s on Outage. During t h e p e r i o d of o u t a g e , t h e u n i t ' s i n c r e m e n t a l c o s t c h a r a c t e r i s t i c s a re mod i f i ed so t h a t t h e economic d i s p a t c h b a s e y i e l d s z e r o power.
P a r t i a l l y Dera t ed Un i t s . An e n t r y i n t h e i n c r e n e n t a l c o s t t a b l e is modi f i ed t o l i m i t power o u t p u t t o no more t h a n d e r a t e d c a p a c i t y .
Minimum Downtime and Uptime. The p rocedure i s r e s t r i c t e d t o n o t a l l o w s t a r t u p o r shutdown of any u n i t i f t h i s a c t i o n would v i o l a t e a minimum downtime or uptime c o n s t r a i n t .
U n i t s Which Become A v a i l a b l e During t h e Study Pe r iod . U n i t s which are i n i t i a l l y on ou tage but which become a v a i l a b l e f o r d i s p a t c h i n g d u r i n g t h e s t u d y p e r i o d r e q u i r e s p e c i a l c o n s i d e r a t i o n . During t h e u n i t commitment phase, t h e u n i t may be s t a r t e d as soon as it becomes a v a i l a b l e . A t t h e c o n c l u s i o n of t h e u n i t commitment phase , t h e model examines t h e r e s u l t i n g u n i t commitment s c h e d u l e and t r ies a v a r i e t y of a l t e r n a t i v e s c h e d u l e s t o e n s u r e t h a t t h e lowes t c o s t s o l u t i o n r e s u l t s .
T ransmiss ion Loss. T ransmiss ion system l o s s e s may be approximated by u s i n g a n i n p u t p e n a l t y f a c t o r f o r each u n i t .
P r i o r i t y Order. The program r e q u i r e s t h a t t h e p r i o r i t y o r d e r i n which u n i t s are s t a r t e d be s p e c i f i e d as a n i n p u t t o t h e program. This p r i o r i t y o r d e r i s f i x e d f o r a g i v e n e x e c u t i o n of t h e program.
P l a n t R e l a t e d S t a r t u p L imi t s . An a d d i t i o n a l module of t h e node1 i s employed t o e n s u r e t h a t o n l y one u n i t p e r p l a n t i s s t a r t e d i n any hour.
A-5

INPUT DESCRIPTION
The i n p u t d a t a f o r t h e EBCOST program c a n be grouped i n t o t h r e e
c a t e g o r i e s . The t h r e e c a t e g o r i e s are based on d i f f e r e n c e s i n d a t a sou rces .
The f i r s t c a t e g o r y of d a t a i s semi-permanent d a t a such as number of
g e n e r a t i n g u n i t s , i n c r e m e n t a l h e a t ra tes , e t c . The second c a t e g o r y of d a t a
i s time dependent d a t a which, o v e r time, w i l l be c o n t i n u a l l y r e v i s e d by t h e
u s e r of t h e program. Data i tems of t h i s t ype i n c l u d e f u e l c o s t , h o u r l y
l o a d s , etc. The l a s t c a t e g o r y of d a t a belongs t o run c o n t r o l and
i n i t i a l i z a t i o n d a t a . Details of each d a t a c a t e g o r y fol low.
Category I: Semi-permanent Data
0 For each f u e l t y p e used , t h e f o l l o w i n g d a t a i s r e q u i r e d :
--Fuel t ype name --Units f o r t h e f u e l type
0 For each u n i t i n t h e system, t h e f o l l o w i n g d a t a i s r e q u i r e d :
- -Plant name --Unit number ( i f u n i t i s a g a s t u r b i n e , t h e u n i t number must
- -S ta r tup p r i o r i t y --Unit t y p e : Must-run, c y c l i n g , g a s t u r b i n e --Unit performance f a c t o r used t o ad j u s t d e s i g n h e a t r a t e s
- -Transmission l o s s p e n a l t y f a c t o r - -S ta r tup c o s t c o e f f i c i e n t s --?linimun uptime c o n s t r a i n t ( h o u r s ) --Minimum downtime c o n s t r a i n t ( h o u r s ) - -Variable maintenance c o s t ($/MWh) --Incremental h e a t rates (Btu/kWh and a s s o c i a t e d MW l o a d i n g ) --Energy r e q u i r e d t o b r i n g a u n i t up t o minimum gross
--Minimum and maximum o u t p u t (MW) --Primary f u e l t ype --Secondary f u e l t y p e ( i f a c o n v e r t i b l e u n i t ) --Target burn of secondary f u e l t ype ( i f a c o n v e r t i b l e u n i t )
be n e g a t i v e )
based on a c t u a l o p e r a t i n g e x p e r i e n c e
g e n e r a t i o n (MBTu/hr)
A-6

Category 11: Time Dependent Data
0 For each hour of t h e s t u d y , t h e f o l l o w i n g d a t a i s r e q u i r e d :
--System load f o r e c a s t (MW) --Net i n t e r c h a n g e f o r e c a s t (MW) --Spinning r e s e r v e r equ i r emen t : - o n - l i n e r e s e r v e (MW)
- f a s t - s t a r t r e s e r v e (MW)
a p p l i c a b l e --Unit maintenance s c h e d u l e i n c l u d i n g u n i t d e r a t i o n s if
--Btu c o n v e r s i o n f a c t o r f o r t h e f u e l t ype --Fuel c o s t ( d / B t u x 10) --Purchase type --Demand c o s t ( i f u n i t i s a pu rchase r e p r e s e n t e d as a u n i t ) .
Category 111: Run C o n t r o l Data
0 The f o l l o w i n g d a t a i s needed t o i n i t i a l i z e u n i t s t a t u s and d e f i n e t h e s t u d y p e r i o d :
- - S t a r t and s t o p s t u d y t i m e d a t a - -S ta tus of a l l u n i t s a n hour p r i o r t o t h e s t a r t u p of s t u d y
( i . e . , number of hour s o f f - l i n e s i n c e l a s t o p e r a t i o n o r number of hour s on - l ine s i n c e s t a r t u p f o r each u n i t ) .
INPUT VERIFICATION
E x t e n s i v e i n p u t d a t a v e r i f i c a t i o n r o u t i n e s are provided w i t h t h e
EBCOST model. The p r o c e s s i n g of i n p u t d a t a c o n t i n u e s as long as p o s s i b l e ,
even though e r r o r s may have been encoun te red which would p r e c l u d e e x e c u t i o n
of t h e l o g i c (e.g. , n e g a t i v e f u e l c o s t ) . I n t h i s way, most d a t a e r r o r s o r
o m i s s i o n s a re i d e n t i f i e d a t one t i m e .
A- 7

mix t h a t i s now i n p l a c e and has agreed t o a c o n t r a c t t h a t permits t h e
company t o recover c o s t s i n c l u d i n g t h e al lowed r e t u r n . In t u r n , t'le
r a t e p a y e r s can use t h e equipment f o r s p e c i f i e d t i m e p e r i o d s and i n g iven
amounts de r ived from t h e t o t a l load p laced on t h e sys tem. Thus, t h e
r a t e p a y e r s r e n t c a p a c i t y f o r s u c c e s s i v e p e r i o d s throughout t h e yea r . We
a l s o assume t h a t cus tomers a r e n o t a b l e t o r e n t c a p a c i t y beyond t h e l i m i t s
o f t h e e x i s t i n g g e n e r a t i o n p l a n t . For example, i f t h e u t i l i t y c u r r e n t l y
h a s a 150 MW c o a l u n i t , i t i s al lowed t o r e n t , on a p e r i o d i c b a s i s , no more
t h a n 150 MW of t h i s u n i t and s a y , no less than 7 5 MW, i f t h e u n i t can be
c y c l e d down t o no lower than 50% of c a p a c i t y . The " r e c o n t r a c t i n g - f o r -
c a p a c i t y " assumption i m p l i e s t h a t t h e amount of c a p a c i t y t h a t cus tomers
r e n t and have a v a i l a b l e t o meet t h e i r l oad changes over time.
A q u e s t i o n f o r which few, i f any , g u i d e s e x i s t i s , "How o f t e n
should r e c o n t r a c t i n g t ake p l a c e ? " Consider two extremes. F i r s t , suppose
i t i s once a year . In t h i s c a s e , r a t e p a y e r s m u s t r e n t s u f f i c i e n t c a p a c i t y
t o meet t h e i r annual peak demand p l u s r e s e r v e s and noth ing has been ga ined
s i n c e t h i s does no t change t h e problem from what i t was b e f o r e t h e
r e c o n t r a c t i n g procedure was i n t r o d u c e d , i .e., c a p i t a l c o s t s would s t i l l be
a l l o c a t e d on an annual b a s i s . A t t h e o t h e r extreme, suppose r e c o n t r a c t i n g
o c c u r s hour ly . Customers would r e n t c a p a c i t y i n such a way as t o e x a c t l y
meet t h e i r hour ly l o a d s p l u s have t h e n e c e s s a r y r e s e r v e s . I f c o s t s were
t h e n a l l o c a t e d f o r each g e n e r a t i n g u n i t , on t h e b a s i s of t h e kW r e n t e d i n
e a c h hour , t h e r e s u l t i n g c o s t a l l o c a t i o n would be i d e n t i c a l t o ( exc lud ing
r e s e r v e s ) a l l o c a t i n g c a p i t a l c o s t s on a s t r i c t l y kWh b a s i s . While we
c o n s i d e r t h i s a l l o c a t i o n procedure p r e f e r a b l e t o a peak r e s p o n s i b i l i t y
method, i t can be c r i t i c i z e d because i t comple te ly i g n o r e s t h e f a c t t h a t
c a p i t a l c o s t s are i n c u r r e d whether or no t a g e n e r a t i n g u n i t
B -2

produces e l e c t r i c i t y . Note, however, t h a t t h i s method s a t i s f a c t o r i l y meets
t h e f i r s t two c r i t e r i a govern ing t h e c h o i c e Df a time-of-use c o s t i n g
method. l / -
g e n e r a t i n g equipment would be charged f o r i t s u s e , and s i n c e cha rges pe r
machine i n c r e a s e w i t h usage , consumers d u r i n g t h e t ime p e r i o d s of h i g h use
would bear a r e l a t i v e l y g r e a t e r c o s t t han consumers du r ing p e r i o d s of lower
use .
That i s , t h o s e who b e n e f i t from t h e use of a p i e c e of
Consider now p e r i o d i c r e c o n t r a c t i n g f o r i n t e r m e d i a t e pe r iods .
M u l t i p l e p o s s i b i l i t i e s occur . For example, we could r e c o n t r a c t f o r
c a p a c i t y d a i l y , o r weekly, o r monthly, bu t t o adopt any one of t h e s e as our
p e r i o d would rule out t h e most impor t an t f e a t u r e of ou r analysis--changes
i n c o s t o c c u r r i n g throughout a day and over weeks as l o a d s move from base
l e v e l s , th rough shou lde r l e v e l s , p o s s i b l y i n t o peak l e v e l s and then down
a g a i n t o the base l e v e l s of demand f o r e l e c t r i c i t y . To accommodate t h e
d i f f e r e n t t ime d imens ions , we w i l l adopt f o r t h i s s tudy r e c o n t r a c t i n g on a
weekly b a s i s f o r each of t h e 24 h o u r s i n t h e day.z/
The r e c o n t r a c t i n g procedure would work as fo l lows . On t h e l a s t
day of each week t h e customer would c o n t r a c t w i th t h e u t i l i t y t o r e n t
equipment f o r t h e fo l lowing week. Th i s would c o n s i s t of 24 s e p a r a t e
agreements--one f o r each hour i n a day. n u s , t h e customer w u l d c o n t r a c t
w i t h t h e u t i l i t y f o r c a p a c i t y f o r t h a t same hour f o r each day i n t h e week.
A s a s i m p l e example of t h i s , suppose t h e r e are on ly two g e n e r a t i n g u n i t s ( A
and B) from which t o o b t a i n c a p a c i t y . The r e s u l t s of t h e c a p a c i t y
c o n t r a c t s could look l i k e t h e schedu le shown i n Table B-1. These
- 1 / It a l so s a t i s f i e s t h e f o u r t h c r i t e r i o n , bu t t h i s i s n o t obvious;
- 2 / The d e s c r i p t i o n and arguments i n suppor t of u s ing w e k s would suppor t t h e use of months, s e a s o n s , o r bi-monthly a s wel l .
B -3

TABLE B-1
SCHEDULE OF WEEKLY CONTRACTED CAPACITY I N MW
Hour - a.m. 12-1
1-2 2-3 3-4 4 -5 5-6 6-7 7 -8 8-9 9-1 0 10-1 1 11-12
p.m. 12-1 1-2 2-3 3-4 4-5 5-6 6-7 7-8 8-9 9-1 0 10-1 1 11-12
Unit A
70 65 64 63 65 73 80 85 91 98 98 98 103 108 114 121 129 129 130 125 120
85 75
100
Unit B
170 170 170 170 170 174 180 184 190 197 2 06 214 225 240 2 50 262 275 277 28 0 27 0 260 220 184 175
B-4

c a p a c i t i e s by machine would be what i s a v a i l a b l e t o g e n e r a t e e l e c t r i c i t y
f o r t h e s p e c i f i e d hours throughout t h e f i r s t week. On t h e l a s t day of t h e
week, r e c o n t r a c t i n g would t ake p l a c e f o r t h e nex t week. While r e t a i n i n g
t h e i d e a of d i f f e r e n t c o n t r a c t s f o r each hour i n the day, we b e l i e v e t h e r e
i s t h e real p o s s i b i l i t y t h a t a s e a s o n a l r e c o n t r a c t i n g pe r iod o r a monthly
r e c o n t r a c t i n g per iod may be a p p r o p r i a t e f o r sone u t i l i t i e s .
p e r i o d w i l l depend on t h e n a t u r e of t h e u t i l i t y ' s l oads .
The l e n g t h of
The q u e s t i o n arises: how would t h e cus tomers know bow much
c a p a c i t y t o c o n t r a c t f o r ? A c t u a l l y i t i s n o t a q u e s t i o n t h a t r e q u i r e s
s p e c u l a t i o n . S ince t h i s i s an embedded g e n e r a t i o n c o s t s t u d y , we are
concerned wi th a r e t r o s p e c t i v e s i t u a t i o n r ega rd ing c a p a c i t y usage. That
i s , i n r e t r o s p e c t we know w i t h p e r f e c t knowledge what t h e maximum c a p a c i t y
needs f o r t h a t hour over t h e week a r e f o r t h e u t i l i t y ' s Customers, and
hence what t he u t i l i t y ' s cus tomers would have c o n t r a c t e d f o r . Th i s would
be t h e maximum l o a d , i n c l u d i n g s a l e s and pu rchases , p l u s t h e r e s e r v e t h e
u t i l i t y would m a i n t a i n on each u n i t . With an embedded s t u d y , we know t h e
p a s t w i t h c e r t a i n t y .
I n a d d i t i o n t o t h e r e c o n t r a c t i n g procedure f o r a s s i g n i n g c o s t s ,
t h i s method has one o t h e r major f e a t u r e t h a t d i s t i n g u i s h e s i t i n
a p p l i c a t i o n f r o n some o t h e r s . Whereas some methods lump a l l c a p i t a l c o s t s
t o g e t h e r and then a l l o c a t e t h e t o t a l , t h i s method a l l o c a t e s on a
machine-by-machine b a s i s t h e c a p i t a l c o s t of each machine.
i n c o n s i d e r a b l y g r e a t e r p r e c i s i o n i n a s s i g n i n g t h e c o s t s of u n i t s t o those
who b e n e f i t from t h e i r use. T h i s , of c o u r s e , would be more n o t i c e a b l e f o r
u t i l i t i e s w i th bo th o l d and new u n i t s where t h e o r i g i n a l c o s t s a r e
c o n s i d e r a b l y d i f f e r e n t .
Th i s can r e s u l t
One major advantage t h a t r e s u l t s from us ing a weekly
r e c o n t r a c t i n g pe r iod r a t h e r t han a bi-monthly o r monthly pe r iod i s t h a t a
B -5

peak pe r iod could beg in , s a y t h e second or t h i r d week of June r a t h e r than
June 1 o r J u l y 1. Use of a monthly pe r iod would r e q u i r e t h a t t h e summer
peak begin e i t h e r June 1 o r J u l y I , bu t n o t June 15. Thus, use of weekly
p e r i o d s resul ts i n being a b l e t o more f i n e l y choose t h e peak p e r i o d .
Implementat ion P rocedure
To implement t h i s procedure t h e fo l lowing s t e p s were t a k e n :
1. Run EBCOST f o r each week t o o b t a i n t h e hour ly l o a d i n g f o r e a c h g e n e r a t i n g u n i t . As was desc r ibed i n Appendix A, t h e EBCOST a n a l y s i s deve lops t h e op t ima l d i s p a t c h of t h e s y s t e n a f t e r t a k i n g i n t o account t h e e n g i n e e r i n g c o n s t r a i n t s and t h e r e l e v a n t c o s t s .
2. Determine t h e maximum load ing by u n i t f o r each hour throughout each week f o r a l l weeks, e.g., t h e maximum load f o r t h e 7 : O O - 8:OO a.m. hour f o r a p a r t i c u l a r u n i t f o r each week.
3. Take 115% of each number (assuming 15% i s t h e r e s e r v e margin) t o f i n d t h e hour ly amounts of c a p a c i t y t h a t a r e r e n t e d e a c h week f o r each u n i t . l / -
4. Find the t o t a l amount of c a p a c i t y r e n t e d by summing t h e s e numbers f o r each u n i t . There w i l l be 5 2 x 2 4 numbers t o add f o r each g e n e r a t i n g u n i t .
5. Divide t h e i n d i v i d u a l number f o r each u n i t f o r each hour-week (de te rmined i n S tep 3 ) by t h e t o t a l (de te rmined i n S tep 4 ) f o r t h a t u n i t t o o b t a i n t h e a l l o c a t i o n f a c t o r f o r t h a t hour o f t h a t week f o r each g e n e r a t i n g u n i t .
6 . Mul t ip ly t h e a l l o c a t i o n f a c t o r s by t h e annual embedded c a p i t a l c o s t of each u n i t t o o b t a i n t h e c o s t of each u n i t i n e a c h hour of a l l weeks.
7. For each hour , sum a c r o s s u n i t s t o o b t a i n t h e t o t a l c a p i t a l c o s t i n each hour of each week.
8. Divide t h i s c a p i t a l c o s t by t h e number of kwh s o l d by t h e u t i l i t y i n t h a t hour-week t o o b t a i n t h e ave rage embedded c a p i t a l c o s t s on a time-of-use b a s i s .
- I / I f t h i s exceeds u n i t c a p a c i t y , t h e remaining c a p a c i t y i s r e n t e d f r o m a n o t h e r u n i t which i s running and most s i m i l a r i n c o s t c h a r a c t e r i s t i c s .
B-6

9. Add t h i s t o t h e ave rage running c o s t s ( o b t a i n e d from EBCOST) t o o b t a i n t h e s y s t e m ave rage t o t a l g e n e r a t i n g c o s t on a t ime-of- u s e b a s i s .
PEAK HOUR ALLOCATION METHOD
ConceDtual B a s i s of t h e Method
The Peak Hour A l l o c a t i o n Method s a t i s f i e s t h e c r i t e r i a
e s t a b l i s h e d i n t h e t e x t f o r t h e a l l o c a t i o n of c a p i t a l c o s t s t o time-of-use.
The method d i f f e r s from t h e Maximum Usage Method by u s i n g t h e l o a d s on each
u n i t a t t h e time of system maximum load d u r i n g each time p e r i o d t o
d e t e r m i n e t h e a l l o c a t i o n f a c t o r s . The c o n c e p t u a l b a s i s f o r t h i s d i f f e r e n c e
i s t h e b e l i e f t h a t t h e a l l o c a t i o n of c o s t s should t i e t o t h e l o a d i n g s of
t h e u n i t s a t t h e p o i n t i n t h e t i m e p e r i o d when system l o a d s a r e a t t h e
maximum l e v e l . Th i s may more a c c u r a t e l y r e f l e c t t h e way t h e system o p e r a t e s
t h a n t h e Maximum Usage Method which l o o k s f o r t h e maximum usage of a n
i n d i v i d u a l u n i t d u r i n g t h e time p e r i o d .
Implementa t ion P rocedure
The n i n e s t e p s se t f o r t h under t h e Maximum Usage bkthod should be
fo l lowed except S tep 2 which should be changed t o read as f o l l o w s :
I d e n t i f y t h e hour d u r i n g each hour-week time pe r iod of maximun demand and de te rmine t h e u n i t l o a d i n g s for a l l u n i t s d u r i n g t h e s e hours . The r e s u l t w i l l be 1248 l o a d i n g l e v e l s f o r each of t h e i n d i v i d u a l g e n e r a t i n g u n i t s .
I n a d d i t i o n , t h e word " r e n t a l " i n S teps 3 a n d 4 can be changed t o "assumed
t o be used."
MODIFIED PEAK HOUR ALLOCATION METHOD
Concep tua l B a s i s of t h e Method
The b d i f i e d Peak Hour A l l o c a t i o n Method i s des igned t o t r a c e t h e
p a t t e r n of g e n e r a t i n g u n i t usage over a week. To do t h i s , t h e peak
B -7

l oad d u r i n g t h e week i s i d e n t i f i e d and becomes t h e midpoin t of t h e t i m e
p e r i o d over which h o u r l y u n i t l o a d i n g s are recorded . By u s i n g a con t iguous
24-hour p e r i o d , i t i s hoped t h a t t h e f a c t o r s t h a t a f f e c t u n i t o p e r a t i o n ,
s u c h as ramping time, minimum up and down times, etc. , w i l l be cap tu red .
T h i s method has t h e a d d i t i o n a l s t e p of u s i n g con t iguous hours . Th i s
p rocedure i s no t used under t h e Peak Hour A l l o c a t i o n Method.
Xmplementation P rocedure
The n i n e s t e p s se t f o r t h under t h e Maximum Usage Method should be
fo l lowed excep t S tep 2, which should be changed t o read as f o l l o w s :
I d e n t i f y t h e hour of peak demand d u r i n g t h e week. Determine t h e u n i t l o a d s f o r t h e 12-hour pe r iod immediately p reced ing t h e peak hour and t h e 11-hour p e r i o d immediately f o l l o w i n g i t . Th i s s e t o f l o a d s f o r each u n i t compose t h e hour-week l o a d s f o r t h a t week f o r each u n i t . Th i s must be done f o r a l l 52 weeks t o o b t a i n t h e 1248 l o a d i n g l e v e l s f o r each g e n e r a t i n g u n i t .
SA!!PLE APPLICATION OF THE CAPITAL COST ALLOCATION METHODS
As o u t l i n e d i n t h e p rev ious s e c t i o n s , t h e p rocedures f o r t h e
v a r i o u s c a p i t a l c o s t a l l o c a t i o n methods i n v o l v e n i n e b a s i c s t e p s . Th i s
s e c t i o n w i l l d e t a i l a numer i ca l a p p l i c a t i o n of e a c h s t e p of t h e p rocedures
f o r each a l l o c a t i o n method.
S t e p 1: Opt imal U n i t Loadings
For t h i s example, a se t of h y p o t h e t i c a l u n i t l o a d i n g s cove r ing
seven days , t h r e e hour s and two g e n e r a t i o n u n i t s h a s been c r e a t e d . Unit A
i s c a p a b l e of g e n e r a t i n g 50 t o 150 MW, w h i l e Uni t B can g e n e r a t e 30 t o 100
MW. The sample l o a d i n g s d i s p l a y e d i n Table B-2 w i l l be used as t h e
s t a r t i n g p o i n t f o r a l l a l l o c a t i o n methods.
B -8

Hour 1
Uni t A l o a d
Un i t B l o a d
System load
Hour 2
Un i t A l o a d
Un i t B l o a d
System load
Hour 3
Un i t A l o a d
Un i t B l o a d
System load
TABLE B-2
EXAMPLE UNIT AND SYSTEM LOADS
DAY
I
14 0
30
1 7 0
15 0
50
2 00
110
30
14 0
L
15 0
50
200
15 0
70
220
15 0
30
18 0
14 O*
80
220
14 O*
10 0
240
14 O*
50
19 0
4
15 0
60
210
15 0
95
2 4 5
15 0
50
2 00
15 0
50
2 00
15 0
60
210
150
30
18 0
6
110
0
110
13 0
0
130
90
0
90
7
10 0
0
10 0
110
0
110
80
0
80
* Derate f o r 1 day.
B- 9
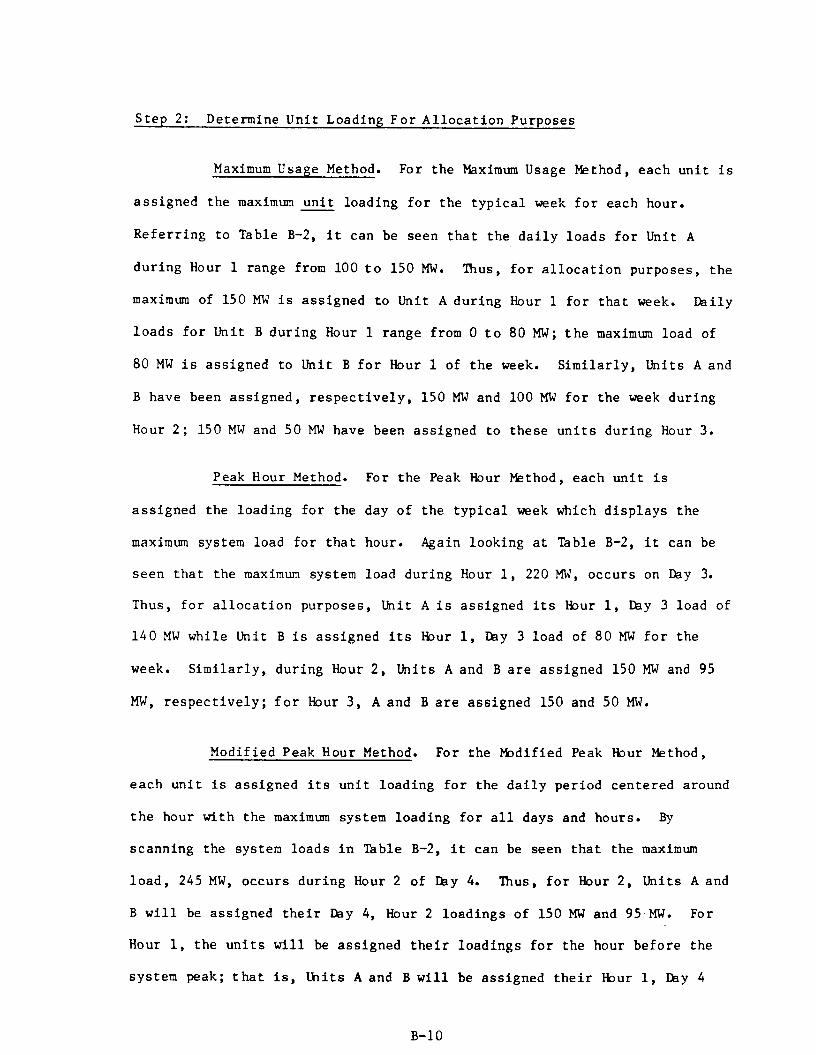
S t e p 2: Determine U n i t Loading F o r A l l o c a t i o n Purposes
Maximum Usage Method. For t h e Maximum Usage Method, e a c h u n i t i s
a s s i g n e d t h e maximum u n i t l o a d i n g f o r t h e t y p i c a l week f o r each hour.
R e f e r r i n g t o Table B-2, i t can be seen t h a t t h e d a i l y l o a d s f o r U n i t A
d u r i n g Hour 1 range from 100 t o 150 MW.
maximum of 150 MW i s a s s i g n e d t o Un i t A d u r i n g Hour 1 f o r t h a t week.
l o a d s f o r U n i t B d u r i n g Hour 1 range from 0 t o 80 MW; t h e maximum load of
80 MW i s a s s i g n e d t o U n i t B f o r Hour 1 of t h e week.
B have been a s s i g n e d , r e s p e c t i v e l y , 150 MW and 100 MW f o r t h e week d u r i n g
Hour 2 ; 150 MW and 5 0 MW have been a s s i g n e d t o t h e s e u n i t s d u r i n g Hour 3.
Thus, f o r a l l o c a t i o n pu rposes , t h e
Da i ly
S i m i l a r l y , Units A and
Peak Hour Method. For t h e Peak Hour k t h o d , e a c h u n i t i s
a s s i g n e d t h e l o a d i n g f o r t h e day of t h e t y p i c a l week which d i s p l a y s t h e
maximum system load f o r t h a t hour. Again l o o k i n g a t Table B-2, i t can be
s e e n t h a t t h e maximun system load d u r i n g Hour 1, 220 MW, o c c u r s on Day 3.
Thus, f o r a l l o c a t i o n pu rposes , Unit A i s a s s i g n e d i t s Hour 1, Day 3 l o a d of
1 4 0 MW w h i l e U n i t B i s a s s i g n e d i t s Hour 1, k y 3 l o a d of 80 MW f o r t h e
week. S i m i l a r l y , d u r i n g Hour 2 , U n i t s A and B are a s s i g n e d 150 MW and 95
MW, r e s p e c t i v e l y ; f o r Hour 3 , A and B a re a s s i g n e d 150 and 50 MW.
Modif ied Peak Hour Method. For the Modified Peak Hour Method,
e a c h u n i t i s a s s i g n e d i t s u n i t l o a d i n g f o r t h e d a i l y p e r i o d c e n t e r e d around
t h e hour w i t h t h e maximum system l o a d i n g f o r a l l days and hours . By
s c a n n i n g t h e system l o a d s i n Table B-2, i t can be seen t h a t t h e maximum
l o a d , 245 MW, o c c u r s d u r i n g Hour 2 of m y 4 . Thus, f o r Hour 2 , Units A and
B w i l l be a s s i g n e d t h e i r k y 4 , Hour 2 l o a d i n g s of 150 MW and 95 MW. For
Hour 1, t h e u n i t s w i l l be a s s i g n e d t h e i r l o a d i n g s f o r t h e hour b e f o r e t h e
sys t em peak; t h a t i s , U n i t s A and B w i l l be a s s i g n e d t h e i r Hour 1, k y 4
B-10

l o a d i n g s of 150 and 60 MW, r e s p e c t i v e l y . For Hour 3 , t h e u n i t s w i l l be
a s s i g n e d t h e i r l o a d i n g s f o r t h e hour a f t e r t h e 245 MW peak; t h a t i s , Uni t s
A and B w i l l be a s s igned t h e i r Hour 3 , IBy 4 l o a d i n g s of 150 and 50 MW,
r e s p e c t i v e l y .
S t e p 3: Summing C a p a c i t y Loadings by U n i t
For each a l l o c a t i o n method, t h e p rocess i s r e p e a t e d f o r a l l
weeks. Assume t h e r e are two weeks i n our h y p o t h e t i c a l yea r as shown by t h e
l o a d i n g s i n Table B-3 and t h a t we perform a similar a n a l y s i s f o r t h e second
week.
weeks. For example, t a k i n g Unit A f o r t h e Maximum Usage Method, and
The u n i t l o a d i n g s as determined by any method are summed a c r o s s a l l
assuming t h e maximum u n i t l o a d i n g f o r Hour 1 i n t h e second week was
determined t o be 140 MW, t h e sum m u l d be 290 MW f o r t h e s e two hour-weeks.
S i m i l a r l y , assuming t h e maximum load ing of Unit B w a s 50 MW i n Hour 1 of
t h e second week, t h e analogous t o t a l would be 80 MW + 50 MW = 130 MW.
These hour-year t o t a l s a r e then summed a c r o s s a l l hours on a un i t -by -un i t
b a s i s t o o b t a i n t h e t o t a l usage f o r each g e n e r a t i n g u n i t .
S t e p s 4 , 5 , and 6: A l l o c a t i n g T o t a l C a p i t a l C o s t s t o Hours
For t h i s a n a l y s i s , i t w i l l be assumed t h a t t h e t o t a l c a p i t a l c o s t
i s $200 f o r U n i t A and $100 f o r Unit B. S t a r t i n g wi th U n i t A, i t s c o s t i s
a l l o c a t e d t o each hour by m u l t i p l y i n g t h e $200 by t h e a l l o c a t i o n f a c t o r f o r
t h e hour i n ques t ion . Th i s f a c t o r i s developed by d i v i d i n g t h e h o u r l y
l o a d i n g f o r each hour-week by t h e t o t a l a l l o c a t i o n u n i t s f o r Unit A f o r t h e
p a r t i c u l a r a l l o c a t i o n method. For example, t h e a l l o c a t i o n f a c t o r f o r Hour
1 f o r t he Maximum Usage Method i s t h e 150 MW h o u r l y l o a d i n g d iv ided by t h e
S t e p 3, hit A t o t a l of 885 MW, o r 16.95%. Ihe development of t h e
B-11

TABLE B-3
EXAMPLE OF UNIT LOADS FOR TWO WEEKS
DAY
1 2 3 4 5 6 7
Week 1
Hour 1
Uni t A l o a d Un i t B l o a d Sys tem load
Hour 2
Un i t A l o a d Un i t B l o a d System load
Hour 3
Uni t A l o a d U n i t B l o a d System load
Week 2
Hour 1
Un i t A l o a d Un i t B l o a d System load
Hour 2
Un i t A l o a d Un i t B l o a d System load
140 150 140 150* 150 110 100 30 50 80** 60 50 0 0
170 200 220 210 200 110 10 0
150 150 140 150* 150 130 110 50 70 loo** 95 60 0 0
200 220 240 245 210 130 110
110 150 140 150* 150 90 80 30 30 50 50"" 30 0 0
140 180 190 200 180 90 80
130 135 140* 135 125 120 100 30 30 40 50** 45 45 25
160 165 180 185 170 165 125
135 145 145 150* 140 130 110 40 55 65 80** 70 55 50
175 200 210 230 210 185 160
Hour 3
Un i t A l o a d 125 130 135 145" 135 120 110 Uni t B l o a d 20 35 50** 40 20 1 5 10 System load 145 165 185 185 155 135 120
* T h i s i n d i c a t e s t h e r e l e v a n t hour-week l o a d i n g l e v e l f o r Unit A u s i n g t h e Maximum Usage Method.
** T h i s i n d i c a t e s t h e r e l e v a n t hour-week l o a d i n g l e v e l f o r Uni t B u s i n g t h e Maxirnun Usage Method.
n-13

a l l o c a t i o n f a c t o r s is shown i n Table B-4. The a l l o c a t i o n f a c t o r of .1695
i s m u l t i p l i e d by t h e $200 t o o b t a i n t h e $33.90 t h a t has been a l l o c a t e d t c
Hour 1 f o r Week 1 f o r Unit A. ?he same procedure has been r e p e a t e d t o
o b t a i n t h e d o l l a r a l l o c a t i o n s f o r t h e o t h e r hour s i n t h e twoweek -
p e r i o d f o r t h e Maximum Usage Method. S i m i l a r l y , t h e a l l o c a t i o n f a c t o r s f o r
Uni t B have been developed t o sp read t h e $100 over a l l hours. Unit h o u r l y
c o s t a l l o c a t i o n s and t o t a l c a p i t a l c o s t c a l c u l a t i o n s f o r t h e Maximum Usage
method f o r bo th weeks a r e p r e s e n t e d i n Table B-5. The c o s t a l l o c a t i o n s f o r
e a c h hour have been summed a c r o s s t h e u n i t s t o de t e rmine t h e t o t a l c a p i t a l
c o s t a l l o c a t i o n f o r t h e hour. These t o t a l s a r e a l s o p r e s e n t e d f o r each
method i n Table B-5.
S t e p s 7 and 8: Determining C a p i t a l C o s t p e r MWh
Given t h e h o u r l y a l l o c a t e d c o s t s , c a p i t a l c o s t s per kwh are
de te rmined by s i m p l y d i v i d i n g t h e c o s t from Table B-5 by t h e sys tem load
f o r t h e co r re spond ing hour-week - 1/ from Table B-3. For Hour 1 of Week 1
f o r Maximum Usage, t h e c o s t pe r MWh would be $53.41 d i v i d e d by 1210, o r 4 4
m i l l s pe r MWh. The o t h e r a l l o c a t e d ave rage t ine-of -use c a p i t a l c o s t s a r e
shown i n Table B-6.
S t e p 9: Determining T o t a l Average C o s t s
To de te rmine t o t a l ave rage c o s t s , t h e ave rage c a p i t a l c o s t i n any
hour-week i s a s s i g n e d t o each of t h e days i n t h a t week t o a r r i v e a t 8736
a v e r a g e capi ta l c o s t s and t h e s e would be added t o t h e h o u r l y ave rage
runn ing c o s t s .
-- 1 / For the s i m p l i c i t y of c a l c u l a t i o n , t h e Step 7 " f a c t o r i n g up" f o r r e s e r v e s has been omi t t ed . However, i n an a c t u a l c o s t c a l c u l a t i o n , s u c h " f a c t o r i n g up" must be performed.
B-13

TABLE B-4
ALLOCATION FACTOR - MAXIMUM USAGE METHOD
T o t a l Usage
Unit A: 150 + 150 + 150 + 140 + 150 + 145 = 885 Uni t B: 80 + 100 + 50 + 50 + 80 + 50 = 410
Time-Of -U s e A l l o c a t i o n F a c t o r s
Week 1, Hour 1
Week 1, Hour 2
Week 1, Hour 3
Week 2 , Hour 1
Week 2 , Hour 2
Week 2 , Hour 3
Uni t A
150/885 = .1695
150/885 = .1695
150/885 = .1695
140/885 = .1582
150/885 = .1695
145/885 = .1638
Unit B
80/410 = - 1 9 5 1
100/410 = .2439
50/410 = .1220
50/410 = .1220
80/410 = -1951
50/410 = . 1220
B-14

TABLE B-5
HOURLY TOTAL CAPITAL COSTS
U n i t A Uni t B T o t a l
Week 1, Hour 1 ( .1695)(200) = 33.90 ( .1951)(100) = 19.51 53.41
Week 1, Hour 2 ( .1695)(200) = 33.90 ( .2439)(100) = 24.39 . 58.29
Week 1, Hour 3 ( .1695)(200) = 33.90 ( .1220)(100) = 12.20 46.10
Week 2, Hour 1 ( .1582)(200) = 31.64 ( .1220)(100) = 12.20 43.84
Week 2, Hour 2 ( .1695)(200) = 33.90 ( .1951)(100) = 19.51 53.41
Week 2, Hour 3 ( .1638)(200) = 32.76 ( .1220)(100) = 12.20 44.96
B-15

TABLE B-6
AVERAGE TIME-OF-USE CAPITAL COSTS
Week 1, Hour 1: 53.41/1210 = 44.14 mills/kWh
Week 1, Hour 2: 58.29/1355 = 43.66 mills/kWh
Week 1, Hour 3: 46.10/1060 = 43.49 mills/kWh
Week 2, Hour 1: 43.84/1150 = 38.12 mills/kWh
Week 2, b u r 2: 53.41/1370 = 38.99 mills/kWh
Week 2, Hour 3: 44.96/1090 = 41.25 mills/kWh
B-16

APPENDIX A
DESCRIPTION OF EBCOST
INTRODUCTION
Th i s appendix d e t a i l s t h e s p e c i f i c a t i o n s , a p p l i c a t i o n s , and d a t a
r e q u i r e m e n t s of t h e E r n s t & Whinney Embedded Cost Model (EBCOST).
model p r o v i d e s t h e c a p a b i l i t y of de t e rmin ing , on a n hour-by-hour b a s i s , t h e
most economical u n i t commitment-economic d i s p a t c h i n g schedu le and t h u s t h e
h o u r l y o p e r a t i n g ave rage and i n c r e m e n t a l p r o d u c t i o n c o s t s of e l e c t r i c i t y ,
r e c o g n i z i n g such f a c t o r s as minimum l o a d i n g , s t a r t u p c o s t s , main tenance
o u t a g e s , and u n i t d e r a t i o n s .
The
MODEL METHODOLOGY
EBCOST d e t e r m i n e s t h e h o u r l y n e t g e n e r a t i o n schedu le ove r a t i m e
h o r i z o n of up t o 168 hours . The schedu le c o n s i s t s of t h e s t a r t u p and
shutdown of a l l u n i t s p l u s t h e d i s t r i b u t i o n of h o u r l y g e n e r a t i o n
r equ i r emen t s ove r a l l u n i t s on-l ine. The program m a i n t a i n s adequa te
s p i n n i n g and f a s t - s t a r t r e s e r v e s i n a manner t h a t minimizes t h e t o t a l
o p e r a t i n g c o s t of t h e system. EBCOST c o n s i d e r s scheduled n e t i n t e r c h a n g e
c o n t r a c t d e l i v e r i e s , pu rchase c o n t r a c t s w i t h a s s o c i a t e d demand c o s t s , u n i t
main tenance s c h e d u l e s i n c l u d i n g p a r t i a l d e r a t i o n s , and minimum d o e t i m e and
minimum uptime c o n s t r a i n t s .
A- 1

The EBCOST model employs a two-phase computa t iona l procedure . In
Phase I a u n i t commitment s chedu le i s developed.
t h e s t u d y EBCOST d e t e r m i n e s which u n i t s w i l l be on l i n e ( i . e . , c a p a b l e of
producing e l e c t r i c i t y ) . Phase 11 t a k e s t h e u n i t commitment s chedu le of
Phase I and de te rmines e x a c t u n i t l oad ings ( i . e . , o u t p u t (MW) of each u n i t
each hour )
That is, f o r each hour of
Var ious noneconomic c o n s t r a i n t s imposed on t h e schedu le are
e x p l i c i t l y modeled w i t h i n t h i s t echn ique t o a s s u r e a r ea l i s t i c schedule .
S e v e r a l of t h e key sub-routines/modules/constraints used i n t h e program are
d i s c u s s e d i n t h e f o l l o w i n g pages.
Un i t Commitment
The s o l u t i o n t echn ique used t o o b t a i n t h e u n i t commitment
s c h e d u l e i s based upon dynamic programming. Dynamic programming p rov ides
a n approach f o r s o l v i n g problems i n which a d e c i s i o n t a k e n a t t h e p r e s e n t
time (e.g. , whether t o use a u n i t ) a f f e c t s t h e behav io r of t h e sys t em a t a
f u t u r e t i m e . The s o l u t i o n i s a sequence of d e c i s i o n s over t h e e n t i r e
d u r a t i o n of t h e s t u d y p e r i o d and no t j u s t a d e c i s i o n a t t h e p r e s e n t t i m e .
A s i n g l e v a r i a b l e dynamic program is employed. A s mentioned
above , t h i s v a r i a b l e i s t h e number of u n i t s on l i n e a t any hour and d e f i n e s
t h e s t a t u s of t h e g e n e r a t i o n system. The model r e q u i r e s t h a t u n i t s be
committed i n accordance w i t h a prede termined p r i o r i t y o rde r . Th i s
p rede te rmined o r d e r means t h a t i f u n i t 6 i s on i n hour 10, t h e n t h e f i r s t
f i v e u n i t s i n t h e s t a r t u p o r d e r are a l l on l i n e i n hour 10. The on ly
e x c e p t i o n i s a u n i t which i s ou t on maintenance d u r i n g a l l o r p a r t of t h e
s t u d y per iod . Thus, t h e s t a t e of t h e sys tem i n any hour i s t h e number of
u n i t s on l i n e i n t h a t hour and t h e c o s t of moving from one s t a t e t o a n o t h e r
s t a t e i s s imply t h e s t a r t u p ( o r shutdown) c o s t a s s o c i a t e d w i t h t h e
t r a n s i t i o n .
A-2

The s o l u t i o n of t h e u n i t commitment problem i s t h e u n i t
commitment s chedu le which minimizes t h e t o t a l sys tem o p e r a t i n g c o s t ( f u e l
c o s t p l u s s t a r t u p and purchase demand c o s t s ) o v e r t h e e n t i r e p e r i o d of
s tudy . This u n i t commitment s chedu le de t e rmines which u n i t s are on i n any
h o u r ; i n t h e nex t phase of t h e model, t h e economic d i s p a t c h module i s used
t o de t e rmine i n d i v i d u a l u n i t l oad ings .
Economic Di spa tch Module
A s noted above, t h i s phase of t h e a n a l y s i s de t e rmines i n d i v i d u a l
u n i t l oad ings .
and t h e a t t e n d a n t g e n e r a t i o n c o s t f o r each hour , p r e d i c a t e d upon t h e
f o l l o w i n g v a r i a b l e s :
The economic d i s p a t c h module de t e rmines t h e s e u n i t l o a d i n g s
System l o a d (MW)
Number of g e n e r a t i n g u n i t s on l i n e ( u n i t commitment s chedu le deve loped i n Phase I)
Minimum c a p a b i l i t y of each u n i t
Maximum c a p a b i l i t y of each u n i t
Inc remen ta l h e a t ra te c h a r a c t e r i s t i c s f o r each u n i t
Fue l c o s t f o r each u n i t
T ransmiss ion l o s s p e n a l t y f a c t o r f o r each u n i t
V a r i a b l e main tenance c o s t f o r each u n i t .
The economic d i s p a t c h r o u t i n e de t e rmines t h e o u t p u t f o r each u n i t
which minimizes t h e combined system f u e l and v a r i a b l e maintenance c o s t
w h i l e s a t i s f y i n g t h e sys tem load.
Pu rchases
Three t y p e s of pu rchases , r e p r e s e n t e d as u n i t s , are modeled; t h e y
d i f f e r by t h e form of t h e i r demand c o s t . The t h r e e t y p e s are:
A-3

0 No demand c o s t
0 Fixed demand c o s t ($ /DAY)
0 V a r i a b l e demand c o s t ($/MW/DAY). The t o t a l demand c o s t i s based on t h e maximum demand scheduled d u r i n g t h e day.
Pu rchases r e p r e s e n t e d as u n i t s are i n p u t as must-run u n i t s w i t h a
minimum c a p a c i t y of zero . The i n c r e m e n t a l h e a t - r a t e cu rve and f u e l c o s t
are c a l c u l a t e d t o r e f l e c t t h e c o s t of t h e power i n $/MWh. Purchases of any
t y p e do no t c o n t r i b u t e t o e i t h e r s p i n n i n g o r f a s t - s t a r t r e se rve .
Reserve Reauirements
The r e s e r v e r equ i r emen t s are modeled by t h e fo l lowing p o l i c i e s :
0 The h o u r l y MW s p i n n i n g and f a s t - s t a r t r e s e r v e r equ i r emen t s must be provided as i n p u t .
0 A l l a v a i l a b l e but n o t committed g a s t u r b i n e s are used as f a s t - s t a r t r e s e r v e .
0 Excess s p i n n i n g r e s e r v e may be used t o s a t i s f y f a s t - s t a r t r e s e r v e , bu t no t v ice-versa .
0 Purchases do no t c o n t r i b u t e t o s a t i s f y i n g e i t h e r r e s e r v e requi rement .
Base Loaded U n i t s
Those a v a i l a b l e u n i t s i d e n t i f i e d a s base loaded u n i t s ( i . e . ,
must-run u n i t s ) are loaded t o a t l eas t t h e i r minimum c a p a c i t y a t a l l times.
Any ove r -gene ra t ion by t h i s p r a c t i c e i s f l a g g e d by t h e model.
Gas Turb ines
Gas t u r b i n e s are n o t s t a r t e d i n a f i x e d p r i o r i t y sequence. T h e i r
o p e r a t i o n i s de termined s t r i c t l y on t h e b a s i s of economics and a v a i l a -
b i l i t y . I f a g a s t u r b i n e i s committed, i t is loaded t o i t s maximum
c a p a c i t y . The d e c i s i o n t o operate a gas t u r b i n e u n i t is made c o n s i d e r i n g
A-4

i t s a v e r a g e , r a t h e r t h a n i t s inc remen ta l o p e r a t i n g , c o s t . However, t h e
d e s i g n a t i o n of a gas t u r b i n e i s a t t h e d i s c r e t i o n of t h e user .
t u r b i n e i s a s s i g n e d a p r i o r i t y and s t a r t u p c o s t , i t may be t r e a t e d as a
If a gas
normal u n i t .
SPECIAL SYSTEM
Spec
CONSTRAINTS HANDLING PROCEDURES
a1 c o n s t r a i n t s are t r e a t e d w i t h e i t h e r t h e u n i t commitm n t
o r economic d i s p a t c h phases . These i n c l u d e :
0 U n i t s on Outage. During t h e p e r i o d of ou tage , t h e . u n i t ’ s i n c r e m e n t a l c o s t c h a r a c t e r i s t i c s are modi f ied so t h a t t h e economic d i s p a t c h b a s e y i e l d s z e r o power.
0 P a r t i a l l y Dera ted Un i t s . An e n t r y i n t h e i n c r e m e n t a l c o s t t a b l e i s modi f ied t o l i m i t power o u t p u t t o no more t h a n d e r a t e d c a p a c i t y .
0 Minimum Downtime and Uptime. The procedure i s r e s t r i c t e d t o n o t a l l o w s t a r t u p o r shutdown of any u n i t i f t h i s a c t i o n would v i o l a t e a minimum downtime o r uptime c o n s t r a i n t .
0 U n i t s Which Become A v a i l a b l e During t h e Study Per iod . U n i t s which are i n i t i a l l y on ou tage bu t which become a v a i l a b l e f o r d i s p a t c h i n g d u r i n g t h e s t u d y p e r i o d r e q u i r e s p e c i a l c o n s i d e r a t i o n . During t h e u n i t commitment phase , t h e u n i t may be s t a r t e d as soon as it becomes a v a i l a b l e . A t t h e c o n c l u s i o n of t h e u n i t commitment phase , t h e model examines t h e r e s u l t i n g u n i t commitment s chedu le and tr ies a v a r i e t y of a l t e r n a t i v e s c h e d u l e s t o e n s u r e t h a t t h e lowes t c o s t s o l u t i o n r e s u l t s.
0 Transmiss ion Loss. T ransmiss ion sys tem l o s s e s may be approximated by us ing a n i n p u t p e n a l t y f a c t o r f o r each u n i t .
0 P r i o r i t y Order. The program r e q u i r e s t h a t t h e p r i o r i t y o r d e r i n which u n i t s are s t a r t e d be s p e c i f i e d as an i n p u t t o t h e program. of t h e program.
T h i s p r i o r i t y o r d e r i s f i x e d f o r a g iven e x e c u t i o n
0 P l a n t Re la t ed S t a r t u p L i m i t s . An a d d i t i o n a l module of t h e model i s employed t o e n s u r e t h a t on ly one u n i t p e r p l a n t i s s t a r t e d i n any hour.
A-5

INPUT DESCRIPTION
The i n p u t d a t a f o r t h e EBCOST program can be grouped i n t o t h r e e
c a t e g o r i e s . The t h r e e c a t e g o r i e s are based on d i f f e r e n c e s i n d a t a sources .
The f i r s t c a t e g o r y of d a t a i s semi-permanent d a t a such a s number of
g e n e r a t i n g u n i t s , i n c r e m e n t a l h e a t rates, etc. The second c a t e g o r y of d a t a
i s t i m e dependent d a t a which, ove r time, w i l l be c o n t i n u a l l y r e v i s e d by t h e
u s e r of t h e program. Data items of t h i s t ype i n c l u d e f u e l c o s t , hour ly
l o a d s , etc. The l a s t c a t e g o r y of d a t a be longs t o run c o n t r o l and
i n i t i a l i z a t i o n d a t a . Deta i l s of each d a t a c a t e g o r y fo l low.
Ca teeo rv I: Semi-permanent Data
e For each f u e l t y p e used , t h e fo l lowing d a t a i s r e q u i r e d :
--Fuel t ype name --Units f o r t h e f u e l type
0 F o r each u n i t i n t h e system, t h e fo l lowing d a t a i s r e q u i r e d :
- -Plant name --Unit number ( i f u n i t i s a gas t u r b i n e , t h e u n i t number must
- -S tar tup p r i o r i t y --Unit t ype : Must-run, c y c l i n g , g a s t u r b i n e --Unit performance f a c t o r used t o ad j u s t d e s i g n h e a t rates
--Transmission l o s s p e n a l t y f a c t o r - -S tar tup c o s t c o e f f i c i e n t s --Minimum upt ime c o n s t r a i n t ( h o u r s ) --Ninimum downtime c o n s t r a i n t (hour s ) - -Variable main tenance c o s t ($/MWh) - - Incrementa l h e a t rates (Btu/kWh and a s s o c i a t e d Mw l o a d i n g ) --Energy r e q u i r e d t o b r i n g a u n i t up t o minimum g r o s s
g e n e r a t i o n (MBTu/hr) --?4inimun and maximum o u t p u t (MW) --Primary f u e l t y p e --Secondary f u e l t ype ( i f a c o n v e r t i b l e u n i t ) --Target burn of secondary f u e l t ype ( i f a c o n v e r t i b l e u n i t )
b e n e g a t i v e )
based on a c t u a l o p e r a t i n g e x p e r i e n c e
A-6

Category 11: Time Dependent Data
a For each hour of t h e s t u d y , t h e fo l lowing d a t a i s r e q u i r e d :
--System load f o r e c a s t ( M W ) --Net i n t e r c h a n g e f o r e c a s t (MW) --Spinning r e s e r v e requi rement : - on- l ine r e s e r v e (MW) - f a s t - s t a r t r e s e r v e (MW)
a p p l i c a b l e --Unit main tenance schedu le i n c l u d i n g u n i t d e r a t i o n s if
--Btu conve r s ion f a c t o r f o r t h e f u e l t ype --Fuel c o s t (k /B tu x l o ) --Purchase type --Demand c o s t ( i f u n i t i s a pu rchase r e p r e s e n t e d as a u n i t ) .
Category 111: Run C o n t r o l Data
0 The fo l lowing d a t a i s needed t o i n i t i a l i z e u n i t s t a t u s and d e f i n e t h e s t u d y pe r iod :
- -S ta r t and s t o p s tudy t i m e d a t a - -S ta tus of a l l u n i t s a n hour p r i o r t o t h e s t a r t u p of s t u d y
(i.e., number of hours o f f - l i n e s i n c e last o p e r a t i o n o r number of hour s on- l ine s i n c e s t a r t u p f o r each u n i t ) .
INPUT VERIFICATION
Ex tens ive i n p u t d a t a v e r i f i c a t i o n r o u t i n e s are provided w i t h t h e
EBCOST model. The p r o c e s s i n g of i n p u t d a t a c o n t i n u e s as long as p o s s i b l e ,
even though e r r o r s may have been encountered which would p rec lude e x e c u t i o n
of t h e l o g i c (e.g. , n e g a t i v e f u e l c o s t ) . I n t h i s way, most d a t a e r r o r s o r
omiss ions are i d e n t i f i e d a t one t i m e .
A- 7

APPENDIX B
C A P I T A L COST ALLOCATION TO T I M E - O F - U S E
INTRODUCTION
I n t h i s appendix we d e s c r i b e i n d e t a i l t h e cap i ta l c o s t
a l l o c a t i o n methods we have d e r i v e d and a p p l i e d .
d i f f e r i n concep t , many of t h e implementa t ion procedures are t h e same.
Thus, whi le t he r a t i o n a l e f o r each method i s d e s c r i b e d , t h e d e t a i l e d
implementa t ion procedures w i l l be developed only once. " h e r e a f t e r t h e
d e v i a t i o n s / c h a n g e s w i l l be noted f o r each method.
Although t h e methods
MAXIMUM USAGE ALLOCATION METHOD
Conceptua l Basis of t h e Method
To develop a capi ta l c o s t a l l o c a t i o n method t h a t s a t i s f i e s t h e
f o u r c r i t e r i a p re sen ted i n t h e t e x t , a model r e q u i r i n g s e v e r a l assumptions
was c o n s t r u c t e d . The assumpt ions are c o n s i s t e n t w i t h t h e g e n e r a l concept
o f t h e a n a l y s i s , i.e., examining t h e a l l o c a t i o n of embedded c o s t s on a
t ime-of-use b a s i s . The key assumpt ion i s t h a t t h e r a t e p a y e r s can r e n t
c a p a c i t y from t h e u t i l i t y w i t h i n t h e l i m i t s of t h e c u r r e n t i n -p l ace
equipment ( i n c l u d i n g firm purchased power) on
p e r i o d i c r e c o n t r a c t i n g between r a t e p a y e r s and
" ren t ing" of c a p a c i t y from the u t i l i t y is the
a p e r i o d i c b a s i s . The
t h e u t i l i t y t h a t a l lows t h e
basis f o r the a l loca t ion
method. We s t a r t w i th t h e f a c t t h a t t h e u t i l i t y owns t h e e x a c t c a p a c i t y
B -1

mix t h a t i s now i n p l a c e and has agreed t o a c o n t r a c t t h a t permits t h e
company t o recover c o s t s i n c l u d i n g t h e al lowed r e t u r n . In t u r n , t'le
r a t e p a y e r s can use t h e equipment f o r s p e c i f i e d time p e r i o d s and i n g iven
amounts d e r i v e d from t h e t o t a l load p l aced on t h e system. n u s , t h e
r a t e p a y e r s r e n t c a p a c i t y f o r s u c c e s s i v e p e r i o d s throughout t h e year .
a l s o assume t h a t cus tomers are no t a b l e t o r e n t c a p a c i t y beyond t h e l i m i t s
o f t h e e x i s t i n g g e n e r a t i o n p l a n t . For example, i f t h e u t i l i t y c u r r e n t l y
h a s a 150 MW c o a l u n i t , it i s al lowed t o r e n t , on a p e r i o d i c b a s i s , no more
t h a n 150 MW of t h i s u n i t and say , no less t h a n 75 MW, i f t h e u n i t can be
c y c l e d down t o no lower than 50% of c a p a c i t y . The " r e c o n t r a c t i n g - f o r -
c a p a c i t y " assumption i m p l i e s t h a t t h e amount of c a p a c i t y t h a t customers
r e n t and have a v a i l a b l e t o meet t h e i r l oad changes ove r time.
We
A q u e s t i o n f o r which few, i f any , g u i d e s exis t i s , "How o f t e n
shou ld r e c o n t r a c t i n g t a k e p l a c e ? " Consider two extremes. F i r s t , suppose
i t is once a year . I n t h i s c a s e , r a t e p a y e r s must r e n t s u f f i c i e n t c a p a c i t y
t o meet t h e i r annual peak demand p l u s r e s e r v e s and noth ing has been gained
s i n c e t h i s does no t change t h e problem from what i t was b e f o r e t h e
r e c o n t r a c t i n g procedure was i n t r o d u c e d , i.e., c a p i t a l c o s t s would s t i l l be
a l l o c a t e d on an annual b a s i s . A t t h e o t h e r extreme, suppose r e c o n t r a c t i n g
o c c u r s hour ly . Customers would r e n t c a p a c i t y i n such a way as t o e x a c t l y
meet t h e i r hour ly l o a d s p l u s have t h e n e c e s s a r y r e s e r v e s . I f c o s t s were
t h e n a l l o c a t e d f o r each g e n e r a t i n g u n i t , on t h e b a s i s of t h e kW r e n t e d i n
e a c h hour , t h e r e s u l t i n g c o s t a l l o c a t i o n would be i d e n t i c a l t o ( exc lud ing
r e s e r v e s ) a l l o c a t i n g c a p i t a l c o s t s on a s t r i c t l y kWh b a s i s . While we
c o n s i d e r t h i s a l l o c a t i o n procedure p r e f e r a b l e t o a peak r e s p o n s i b i l i t y
method, i t can be c r i t i c i z e d because i t comple te ly i g n o r e s t h e fact t h a t
c a p i t a l c o s t s are i n c u r r e d whether o r no t a g e n e r a t i n g u n i t
B -2

produces e l e c t r i c i t y .
t h e f i r s t two c r i t e r i a govern ing t h e c h o i c e Df a time-of-use c o s t i n g
method. l / -
g e n e r a t i n g equipment would be charged f o r i t s u s e , and s i n c e cha rges pe r
machine i n c r e a s e w i t h usage , consumers du r ing t h e t i m e p e r i o d s of h i g h use
would bear a r e l a t i v e l y g r e a t e r c o s t t han consumers du r ing p e r i o d s of lower
u s e
Note, however, t h a t t h i s method s a t i s f a c t o r i l y meets
That i s , t h o s e who b e n e f i t from t h e use of a p i e c e of
Cons ider now p e r i o d i c r e c o n t r a c t i n g f o r i n t e r m e d i a t e pe r iods .
M u l t i p l e p o s s i b i l i t i e s occur . For example, we could r e c o n t r a c t f o r
c a p a c i t y d a i l y , o r weekly, o r monthly, bu t t o adopt any one of t h e s e as our
p e r i o d would r u l e out t h e most impor t an t f e a t u r e of our analysis--changes
i n c o s t o c c u r r i n g throughout a day and over weeks as l o a d s move from base
l e v e l s , th rough shou lde r l e v e l s , p o s s i b l y i n t o peak l e v e l s and then down
a g a i n t o t h e base l e v e l s of demand f o r e l e c t r i c i t y . To accommodate t h e
d i f f e r e n t t i m e d imensions, we w i l l adopt f o r t h i s s tudy r e c o n t r a c t i n g on a
weekly b a s i s f o r each of t h e 24 h o u r s i n t h e day.2/ - The r e c o n t r a c t i n g procedure would work as fo l lows . On t h e l a s t
day of each week t h e customer would c o n t r a c t w i t h t h e u t i l i t y t o r e n t
equipment f o r t h e fo l lowing week. This would c o n s i s t of 24 s e p a r a t e
agreements--one f o r each hour i n a day. Thus, t h e customer would c o n t r a c t
w i t h t h e u t i l i t y f o r c a p a c i t y f o r t h a t same hour f o r each day i n t h e week.
AS a s i m p l e example of t h i s , suppose t h e r e are only two g e n e r a t i n g u n i t s ( A
and B) from which t o o b t a i n c a p a c i t y . The r e s u l t s of t h e c a p a c i t y
c o n t r a c t s could look l i k e t h e schedu le shown i n Table B-1. These
- 1/ It a l s o s a t i s f i e s t h e f o u r t h c r i t e r i o n , bu t t h i s i s no t obvious.-
- 2 / The d e s c r i p t i o n and arguments i n suppor t of us ing wtleks would suppor t t h e use of months, s e a s o n s , o r bi-monthly as w e l l .
B -3

TABLE B-1
SCHEDULE OF WEEKLY CONTRACTED CAPACITY I N MW
Hour - a.m. 12-1
1-2 2-3 3-4 4-5 5-6 6-7 7 -8 8-9 9-1 0
10-1 1 11-1 2
p.m. 12-1 1-2 2-3 3-4 4-5 5-6 6-7 7-8 8-9 9-10
10-1 1 11-12
Unit A
70 65 64 63 6 5 7 3 80 85 91 98 98 9 8
103 108 114 121 129 129 130 125 120, 100 8 5 75
Unit B
170 170 170 170 170 174 180 184 190 197 2 06 214 225 240 250 262 275 27 7 28 0 270 260 220 184 175
B-4