jntes...prof. ejub dzaferovic – international university of sarajevo (bosnia-herzegovina) prof....
TRANSCRIPT

Hanna V. KOSHLAK, Andrii O. CHEILYTKO
THE 1 KW STIRLING ENGINE FOR SOLAR POWER SYSTEM WITH PARABOLIC CONCENTRATOR AND ELECTRIC GENERATOR . . . . . . . . . . . . . . . . . . . . . . . . . . . . . . . . . . . . . . . . . . . . . . . . . . . . . . . . . . . . . . . . . . . 153
INFLUENCE OF OPERATING FACTORS ON SAVING FUEL EXPENDITURE BY MOBILE STEAM GENERATOR UNITS OIL AND GAS INDUSTRY . . . . . . . . . . . . . . . . . . . . . . . . . . . . . . . . . . . . . . . . . . . . . . . . . . . . . . . . . . . . . . . . . 132
Valerii DESHKO, Iryna SUKHODUB, Olena YATSENKO
INVESTIGATION OF EFFECTIVE THERMAL CONDUCTIVITY IN POROUS METALLIC MATERIALS . . . . . . . . . . 112
INTERMITTENT HEATING SYSTEM OPERATION MODES FOR RESIDENTIAL SPACES . . . . . . . . . . . . . . . . . . . 139
CONVERSION OF DIESEL ENGINE TO ALTERNATIVE BIO-ALCOHOL FUEL . . . . . . . . . . . . . . . . . . . . . . . . . . . . . 123
Anastasiia PAVLENKO
Ivan M. BOHATCHUK, Bohdan V. DOLISHNIY, Ihor B. PRUNKO, Myhailo I. BOHATCHUK
CALCULATION OF PROCESSES OF MELTING METAL PARTICLES (INOCULATOR) IN A ONE-DIMENSIONAL PROBLEM STATEMENT . . . . . . . . . . . . . . . . . . . . . . . . . . . . . . . . . . . . . . . . . . . . . . . . . . . . . . . . . . . . . . . . . . . . . . . . 149
Victor P. STOUDENETS, Dmitry V. DUDARCHUK
Yevstakhii І. KRYZHANIVSKYI, Sviatoslav І. KRYSHTOPA, Liudmyla І. KRYSHTOPA, Maria M. HNYP, Ivan М. MYKYTII
Valerii I. DESHKO, Taras Y. OBORONOV, Antonina M. TEREZYUKDETERMINATION OF PRIMARY ENERGY CONSUMPTION FOR RESIDENTIAL PREMISES HEATING NEED . . . . . . . . . . . . . . . . . . . . . . . . . . . . . . . . . . . . . . . . . . . . . . . . . . . . . . . . . . . . . . . . . . . . . . . . . . . . . . . . . . . . . . . . 105
CONTENTS
jntesJOURNAL OF NEW TECHNOLOGIESIN ENVIRONMENTAL SCIENCENo. 3 Vol. 3 ISSN 2544-7017 www.jntes.tu.kielce.pl Kielce University of Technology
20193

- 104 -
Editor‐in‐Chief:
prof. Anatoliy PAVLENKO – Faculty of Environmental, Geomatic and Energy Engineering, Kielce University
of Technology (Poland)
AssociateEditors:
prof. Lidia DĄBEK – Faculty of Environmental, Geomatic and Energy Engineering, Kielce University
of Technology (Poland)
prof. Łukasz ORMAN – Kielce University of Technology (Poland)
SecretaryoftheEditorBoard:
prof. Hanna KOSHLAK – Ivano-Frankivsk National Technical University of Oil and Gas (Ukraine)
InternationalAdvisoryBoard:
prof. Jerzy Z. PIOTROWSKI – Kielce University of Technology (Poland)
prof. Lidia DĄBEK – Kielce University of Technology (Poland)
prof. Alexander SZKAROWSKI – Koszalin University of Technology (Poland)
prof. Jarosław GAWDZIK – Kielce University of Technology (Poland)
prof. Mark BOMBERG – McMaster University (Canada)
prof. Jan BUJNAK – University of Źilina (Slovakia)
prof. Łukasz ORMAN – Kielce University of Technology (Poland)
prof. Wiesława GŁODKOWSKA – Koszalin University of Technology (Poland)
prof. Ejub DZAFEROVIC – International University of Sarajevo (Bosnia-Herzegovina)
prof. Hanna KOSHLAK – Ivano-Frankivsk National Technical University of Oil and Gas (Ukraine)
prof. Ladislav LAZIĆ – University of Zagreb (Croatia)
prof. Andrej KAPJOR – University of Zilina (Slovakia)
prof. Ibragimow SERDAR – International University of Oil and Gas (Turkmenistan)
prof. Valeriy DESHKO – National Technical University of Ukraine “Igor Sikorsky Kyiv Polytechnic Institute” (Ukraine)
prof. Zhang LEI – Faculty of Thermal Engineering, CUPB University of Oil and Gas (China)
prof. Vladymir KUTOVOY – Harbin Institute of Technology (China)
prof. Milan MALCHO – University of Žilina (Slovakia)
prof. Anton GANZA – National Technical University of Ukraine “Kharkiv Polytechnic Institute” (Ukraine)
prof. Klas ENGVALL – KTH Royal Institute of Technology (Sweden)
prof. Jacek PIEKARSKI – Koszalin University of Technology (Poland)
prof. Alexander GRIMITLIN – Saint Petersburg State University of Architecture and Civil Engineering, Association „ABOK NORTH-WEST” Saint-Petersburg (Russia)
prof. Malik G. ZIGANSHIN – Kazan State Power Engineering University (Russia) www.jntes.tu.kielce.pl
The quarterly printed issues of Journal of New Technologies in Environmental Science are their original versions.
The Journal published by the Kielce University of Technology.
ISSN 2544-7017
© Copyright by Wydawnictwo Politechniki Świętokrzyskiej, 2019

– 105 –
Valerii I. DESHKO
Taras Y. OBORONOV
Antonina M. TEREZYUK
National Technical University of Ukraine "Igor Sikorsky Kyiv Polytechnic Institute", Kyiv, Ukraine
DETERMINATIONOFPRIMARYENERGYCONSUMPTIONFORRESIDENTIALPREMISESHEATINGNEED
Abstract: In thisarticle, the calculationofenergy characteristicsof residentialpremisesand the resultsofcalculations and experiment considered the expediency of installing a controller in the individual heatingsystemofresidentialpremises.
Keywords:energydemandforheating,energysaving,individualheatingsystem,controller,energyefficiency.
Introduction
Heating of buildings consumes about 70% of the total energy consumption in Ukraine with specific characteristics of annual consumption of 100 kW∙h/m2 per year. The construction of multi-apartment houses with individual heat supply systems has become widespread. When newly built and modernized, meeting the issues of current energy efficiency standards faces the problems of a general low level of financing and cheapening the cost of housing [1, 2].
Energy saving and energy efficiency today are the most important issues. In general, the energy efficiency of buildings is aimed at achieving comfortable conditions using less energy [3]. It should be noted that today in Ukraine there is limited practice of providing an individual heating system by controllers from the developer, and therefore specialists and residents do not know enough about such an opportunity of energy saving. Today in Ukraine the regulatory base has become active to provide energy efficiency of buildings [2, 4], implemented method for determining the power consumption calculation which is based on European standards, namely, "Method for calculating energy consumption in heating, cooling, ventilation, lighting and hot water supply" [5].
Thepurposeandobjectivesofthestudy
The main objective are to determine the energy requirement for heating the living space and compare the calculation results with the actual data provided by the heating needs in the system with and without the controller installed during one heating period and to analyze the feasibility of installing the controller.
Researchmaterialandresults
The object of the study was a residential space, namely a one-room apartment, with a total area of 48 m2. The apartment is located in the city of Kiev and has an east-west orientation.
The main characteristics of the layers of the outer wall structure agreed with [6]:
internal plaster with thickness δ = 0.015 m and thermal conductivity λ = 0.93 W/(m·K);
brick laying on a cement-sand solution with a thickness δ = 0.38 m and thermal conductivity λ = 0.81 W/(m·K);

– 106 –
heater extruded polystyrene foam with thickness δ = 0.1 m and thermal conductivity λ = 0.037 W/(m·K);
external facade plaster thickness δ = 0.01 m and thermal conductivity λ = 0.6 W/(m·K).
The area of the walls in the study apartment is 85 m2, and the area of the windows 7.36 m2.
The heating system of this apartment is an individual heating system with a two-circuit gas boiler (capacity 24 kW and efficiency of 0.9) and the installed controller.
This controller allows you to regulate the operation of the boiler, namely the mode of switching on/off, depending on the internal temperature in the room and the specified temperature mode in the controller. This system allows reducing the actual demand for heating and natural gas consumption by reducing the number (period) of switching on the boiler, and also allows the consumer to control the indoor temperature in the room and achieve comfortable conditions.
Also in this article the results of the same heating system are considered, for a similar object of research, but without a controller. In this system, the regulation of comfortable conditions in the room is carried out by the consumer mechanically directly in the boiler, namely the regulation of the temperature of the coolant in the heating circuit. The mode of boiler activation is carried out in the normal mode of the boiler, namely approximately every 3 minutes after the shutdown (when the coolant temperature has decreased by the set value in the boiler).
According to [7] we will calculate the energy demand for heating for this apartment.
The calculation is made for each month of the heating period.
The energy demand for heating the room is calculated by the formula:
, , , ,H nd H ht H gn H gnQ Q Q (1)
where:
,H htQ – total heat transfer in heating mode, Wh;
,H gnQ – total heat transfer in heating mode, Wh;
,H gn – is the dimensionless revenues use rate.
Total heat transfer in heating mode is determined by:
,H ht tr veQ Q Q (2)
where:
trQ – total heat transfer by transmission, Wh;
veQ – total heat transfer by ventilation, Wh.
The total heat transfer by the transmission is determined by:
, int, ,tr tr adj set H eQ H t (3)
where:
,tr adjH – the total heat transfer coefficient of the zone transmission, W/K;
int, ,set H – the temperature of the building zone for heating, С;
e – average monthly temperature of the environment, С;
t – duration of the month for which the calculation is made, h.

– 107 –
The total heat transfer coefficient of transmission is calculated by the formula:
,tr adj tr i i i i i iH b A U l n x (4)
where:
trb – the correction factor, we accept equal to 1;
iA – area of the i-th element of the shell of the room, m2;
iU – the reduced heat transfer coefficient of the i-th shell element of the building, W/(m2K), which is 𝑈 1/𝑅∑пр ;
𝑅∑пр – the resistance of the heat transfer of the i-th element of the shell of the building is reduced, m2K/W.
We calculate the transmission costs by formula (3) for each month and enter the results in table 1.
Calculation of total heat transfer by ventilation.
, int, , , ve ve adj set H z eQ H t (5)
where:
,ve adjH – total heat transfer coefficient by ventilation, W/K;
int, , ,set H z – the temperature of the zone of the building for heating, С;
e – average monthly temperature of the environment, С;
t – duration of the month for which the calculation is made, h.
Finding the total heat transfer coefficient by ventilation:
, , , , ve adj a a ve k ve k nmH c b q (6)
where:
a ac – he heat capacity of the air unit of volume, is equal to 0.33 Wh/(m3K);
, ,ve k nmq – average and sometimes air flow from k-th element, m3/h;
,ve kb – temperature correction factor for k-th element of air flow, we assume equal to 1.
Averaged over time, the air flow rate of the k element of the air flow , ,ve k nmq , m3/h, is calculated by the
formula:
, , inf, ve k nm mnq n V (7)
where:
inf,mnn – multiplicity of air exchange (we accept 0.7 h-1, since multiplicity of air exchange is provided
by natural ventilation); V – building volume, m3.
We calculate the ventilation costs according to formula (5) for each month and enter the results to table 1.

– 108 –
TABLE1.Totaltransmissionandventilationheatlossesofpremises.
Month ,Θe °C t,h ,intΘ ,set,H °C ,tr,adjH W/K ve,adjH , W/K ,trQ kWh veQ , kWh
October 8.1 372
20 33.54 29.94
148.48 132.53
November 1.9 720 437.10 390.15
December -2.5 744 561.46 501.16
January -4.7 744 616.36 550.16
February -3.6 672 531.92 474.79
March 1 744 474.12 423.20
∑ 2769.44 2471.97
Consequently, the total heat loss for the heating period is 5241.41 kWh
The heat from internal heat sources in the area of the considered building, Qint, Wh, for a given month is calculated by the formula:
int int, ,mn k fQ Ф A t (8)
where:
int, ,mn kФ – the time averaged flux from the k-th internal source, W/m, is determined according to
table 6 of [7];
fA – conditioned area of the building, m2;
t – the duration of the use period, expressed in hours per month.
Solar heat revenues are determined by the formula:
, ,sol sol mn kQ Ф t (9)
where:
, ,sol mn kФ – the time-averaged heat flux from the k source of solar radiation, W, includes the thermal
flux of translucent (windows) and opaque (wall) elements of the building; t – the length of the month under consideration is expressed in hours.
We calculate the internal and solar heat transfer according to formulas (8), (9) and enter the results to table 2 and table 3, respectively.
TABLE2.Totalinternalheatrevenues
Month t,h A,m2 ,intФ W/m ,intQ kWh
October 372
48 3.91
69.88
November 720 135.24
December 744 139.75
January 744 139.75
February 672 126.23
March 744 139.75
∑ 750.6
– 109 –
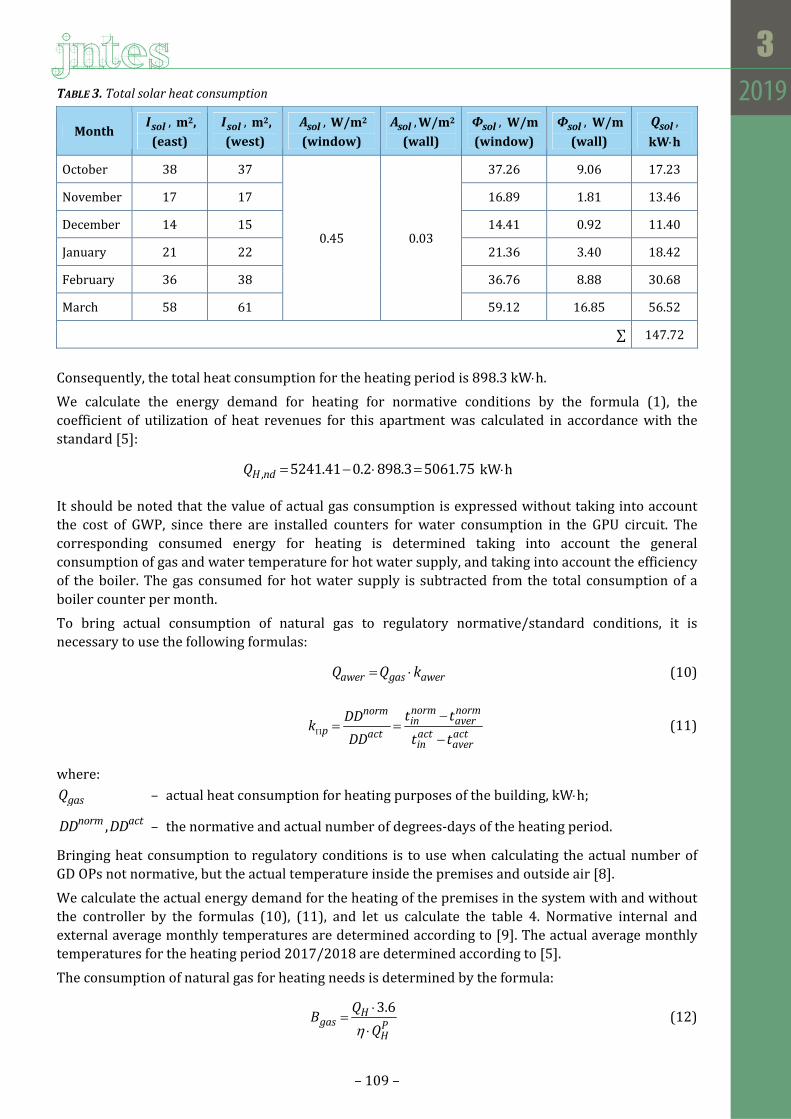
TABLE3.Totalsolarheatconsumption
Month,solI m2,
(east),solI m2,
(west),solA W/m2
(window),solA W/m2
(wall),solФ W/m
(window),solФ W/m
(wall)
,solQ
kWh
October 38 37
0.45 0.03
37.26 9.06 17.23
November 17 17 16.89 1.81 13.46
December 14 15 14.41 0.92 11.40
January 21 22 21.36 3.40 18.42
February 36 38 36.76 8.88 30.68
March 58 61 59.12 16.85 56.52
∑ 147.72
Consequently, the total heat consumption for the heating period is 898.3 kWh.
We calculate the energy demand for heating for normative conditions by the formula (1), the coefficient of utilization of heat revenues for this apartment was calculated in accordance with the standard [5]:
, 5241.41 0.2 898.3 5061.75H ndQ kWh
It should be noted that the value of actual gas consumption is expressed without taking into account the cost of GWP, since there are installed counters for water consumption in the GPU circuit. The corresponding consumed energy for heating is determined taking into account the general consumption of gas and water temperature for hot water supply, and taking into account the efficiency of the boiler. The gas consumed for hot water supply is subtracted from the total consumption of a boiler counter per month.
To bring actual consumption of natural gas to regulatory normative/standard conditions, it is necessary to use the following formulas:
awer gas awerQ Q k (10)
norm normnormin aver
р act act actin aver
t tDDk
DD t t
(11)
where:
gasQ – actual heat consumption for heating purposes of the building, kWh;
, actnormDD DD – the normative and actual number of degrees-days of the heating period.
Bringing heat consumption to regulatory conditions is to use when calculating the actual number of GD OPs not normative, but the actual temperature inside the premises and outside air [8].
We calculate the actual energy demand for the heating of the premises in the system with and without the controller by the formulas (10), (11), and let us calculate the table 4. Normative internal and external average monthly temperatures are determined according to [9]. The actual average monthly temperatures for the heating period 2017/2018 are determined according to [5].
The consumption of natural gas for heating needs is determined by the formula:
3.6Hgas Р
Н
QB
Q
(12)

– 110 –
where:
HQ – energy consumption for heating, kWh;
– total efficiency of heating system and boiler;
РНQ – the calorific value of natural gas, which according to [10] is 31.8 MJ/m3.
TABLE4.Theactualenergyconsumptionofpremisesbroughttoregulatoryterms
Month 𝑫𝑫𝒏𝒐𝒓𝒎 𝑫𝑫𝒂𝒄𝒕Systemwithcontroller Systemwithoutacontroller
Bgas,m3 Qgas,kW·h Qawer,kW·h Bgas,m3 Qgas,kW·h Qawer,kW·h
October 11.9 14 68 540.60 459.38 93 739.35 628.27
November 18.1 19.1 122 969.90 918.86 167 1327.65 1257.79
December 22.5 20.5 140 1113.00 1221.24 208 1653.60 1814.42
January 24.7 24.4 169 1343.55 1359.69 216 1717.20 1737.83
February 23.6 25.9 168 1335.60 1216.65 228 1812,59 1651.17
March 19 24.1 129 1025.55 808.30 171 1359.45 1071.47
∑ 5985.63 ∑ 8160.94
As can be seen from the calculations, the system with the controller provides less natural gas consumption and reduces actual energy demand for heating the premises to the level of the calculated one. In figure 1 shows how different the actual gas consumption for heating with and without the controller from the calculated.
FIGURE1.ComparisonofthemonthlycalculatedandactualgasconsumptionW.
Conclusion
According to the results of the study, the energy demand for heating for a residential area of 48 m2 was determined in accordance with [5], which is 5061.75 kWh. Much of the needs are total heat loss by transmission and ventilation. To reduce the latter, it is possible to install a recuperator that will reduce heat loss through natural ventilation and will allow maintaining comfortable microclimate conditions,
0,00
50,00
100,00
150,00
200,00
250,00
October November December January February March
W, m
3
month
estimated consumption ofnatural gas
the actual consumption ofnatural gas in the system withcontroller
the actual consumption ofnatural gas in the systemwithout controller

– 111 –
such as humidity and indoor temperature. Also, the actual value of the energy demand for heating was brought to the comfortable normative values in accordance with [6]. These calculations have shown that the heat consumption in the system with the controller is 26% lower than in the heating system without it and is close to the calculated value of energy demand. This is explained by the fact that the system without a controller operates in the normal mode of manual adjustment of the provision of comfort conditions and has a frequent activation of the boiler, namely the start of the boiler is carried out approximately every 3 minutes after the shutdown, which results in more natural gas consumption and increases the actual energy demand for heating the premises. Therefore, according to the results of the study, installing the controller into an individual heating system has received quantitative performance indicators.
References
[1] Doroshenko Y.I., Reviewofmodernheatingsystemsandthemethodofinvestigationoftemperaturemodesonefficiencyoftheiroperation intheconditionsoftheruralplasticpoint. Exploration and development of oil and gas fields. 2014, No. 1(50), ISSN 1993-9973.
[2] Novitsky M.I., Bozhenko M.F., Hightly effectiveheating systemofbuildings. III International Scientific and Technical Conference of Young Scientists and Students. Current problems of modern technologies, Ternopil November 19-20, 2014. pp. 237-238.
[3] Crawley D.B., Hand J., Kummert M., Griffith B.T., Contrastingthecapabilitiesofbuildingenergyperformancesimulationprograms. Building and Environment, 2008, 43 (4), pp. 661-673. ISSN 0360-1323.
[4] Harish V.S.K.V., Kumar A., Areviewonmodelingandsimulationofbuildingenergysystems. Renewable and Sustainable Energy Reviews, 56 (2016) 1272–1292129223.
[5] DSTU B A.2.2-12: 2015 Energy efficiency building. Method of calculating energy consumption for heating, cooling, ventilation, lighting and hot water supply, K.: Minregionbud, 2015, 140 p.
[6] DSTU-N B V.1.1- 27:2010 Construction Climatology, K.: Minregionbud, 2010, 132 p.
[7] DSTU B V.2.6-189:2013 Methods of choosing insulation material for insulation of buildings, K.: Minregionbud, 2014, 48 p.
[8] Horvat I., Dovic D., Dynamic modeling approach for determining buildings technical system energyperformance. Energy Conversion Manage, 2016, pp. 1-12.
[9] Climatology. – URL: https://www.rp5.ua/
[10] URL: https://104.ua/ru/gas/natural/id/jakist-prirodnogo-gazu-8250.
– 112 –
Hanna V. KOSHLAK
Kielce University of Technology, Poland
Ivano-Frankivsk National Technical University of Oil and Gas, Ukraine
Andrii O. CHEILYTKO
Zaporizhzhya state engineering academy, Ukraine
INVESTIGATIONOFEFFECTIVETHERMALCONDUCTIVITYINPOROUSMETALLICMATERIALS
Abstract:Inthisarticle,ananalysisofimpactoftheform,sizeandlocationofporesontheeffectivethermalconductivity coefficient of porous metallic materials is presented. It is shown the influence of porosityparametersseparatelyontheelectronicandphonon;convectiveandradiationcomponentofeffectivethermalconductivity.Thedistributionoftheheat flowandtemperature intheexperimentalsampleswereanalyzed.Form and location of pores,which give opportunity to reachedminimum electronic and phonon thermalconductivity,andalsothemostsignificantfactor(porosityparameter),whichinfluenceontheelectronicandphonon thermal conductivity are found. The previously expressed hypothesis about the impact on theconvectivemotionsbynotonlyporessize,butalsotemperature isconfirmed.Dependenceofconvectiveandradiationheatconductivityfromtheporessizeintheporousmetalmaterialwasobtained.
Keywords: effective thermal conductivity, phonon thermal conductivity, radiation thermal conductivity,convectionthermalconductivity,porousparameters,allocationofheatflow
Introduction
The metals porosity, which reduces the mechanical properties and tightness of the material, has been perceived only as a negative factor for a long time. For preventing and blocking the negative effects of porosity in metals, a lot of scientific works were dedicated; some of them are used in present time [1-3].
Despite the negative impact of porosity, porous metal materials found use in various fields: in the aerospace industry as titanium and aluminum sandwich panels; in medicine as implants in humans [4]; in shipbuilding as a body for passenger vessels; in the automotive industry as structural elements [5-7]. Prevalence of porous metallic materials is caused by their unique physical and mechanical characteristics such as high stiffness in combination with a very low density (low specific gravity) and/or high gas permeability combined with a high/low thermal conductivity [8]. Such materials can be globally divided into three types: porous metals [9]; metallic foams [10, 11] and cellular metals [12, 13]. Each category has its unique porosity parameters and methods of production.
In spite of the unique characteristics and prevalence of porous metal materials, the unified theory of dependence of the effective thermal conductivity from the parameters of porosity (pores location, pores form, their size, etc.) is still lacking without mentioning the influence of these parameters on the electronic and phonon, convective and radiation parts of effective thermal conductivity [13].

– 113 –
Themainpartofresearch
Electronicthermalconductivityinphysicalmetallicsamples
For research of electronic thermal conductivity, Wiedemann-Franz law was chosen. This law is based on the thermo-electrical analogy and can be used only for metallic materials. After numerous changes finite equation, which characterizes the Wiedemann-Franz law, is
22
3Вk Те
where 22
3В Lkе
– Lorenz number, WK-2.
Theoretically Lorenz number for all metals is equal to 2.44∙10-8 W∙Ω∙K-2. But on practice it is not true. Because in real metallic materials, there are a lot of impurities, which provoke the additional scattering of electrons on impurity atoms.
That is why, it was decided to use the following formula to calculate Lorenz number
LT
where: – coefficient of thermal conductivity, W/(m∙K); T – temperature, at which coefficient of thermal conductivity was taken, K; – coefficient of specific electrical conductivity, S/m.
Since we know the material from which sample is made, there is only one unknown variable – coefficient of specific electrical conductivity, which can be found by the following formula
1
v
l I lR S U S
where: I – current intensity, A; U – electric potential difference, V; l – sample length, m; S – cross sectional area of sample, m2.
For finding current intensity and electric potential difference, experimental installation was made, circuitry of which can be seen in figure 1.
As experimental samples, stainless steel plates and copper plates were chosen. In the plates, perforation was carried out with different diameters: for stainless steel plates 3.2-15 mm; for copper plates 4-20 mm. To explore the influence of pores location on the electronic thermal conductivity, in-line and staggered location of holes was used. Stainless steel plates with in-line and staggered location of holes can be seen in figure 2.
Data obtained during the experiments on stainless steel and copper samples were presented in table 1, where: λl – coefficient of thermal conductivity for samples with in-line location holes, λs – for samples with staggered location holes.
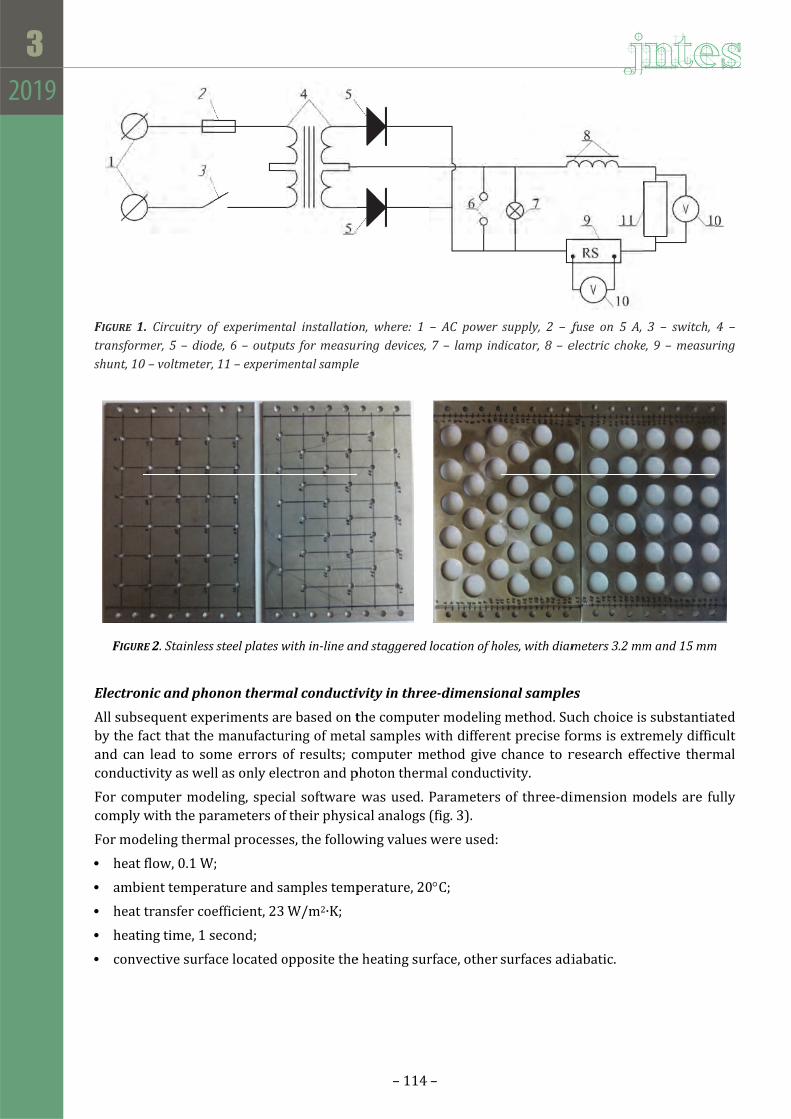
FIGURE 1transformshunt,10
FIGUR
Electron
All subsby the faand canconduct
For comcomply
For mod
heat
ambi
heat
heati
conv
. Circuitry ofmer,5–diod0–voltmeter,
RE2.Stainless
nicandpho
equent expefact that the n lead to somtivity as wel
mputer modwith the par
deling therm
flow, 0.1 W;
ient tempera
transfer coe
ing time, 1 s
vective surfa
f experimentde,6–outpu11–experim
steelplatesw
onontherma
eriments armanufactur
me errors ol as only ele
eling, speciarameters of
mal processe
;
ature and sa
efficient, 23
second;
ace located o
al installatiots formeasurmentalsample
within‐linean
alconducti
e based on tring of metaof results; cectron and p
al software f their physic
es, the follow
amples temp
W/m2∙K;
opposite the
– 114
on,where: 1ringdevices,e
ndstaggered
ivityinthre
the computeal samples wcomputer mphoton therm
was used. cal analogs
wing values
perature, 20
e heating sur
–
– AC power7– lamp ind
locationofho
ee‐dimensio
er modelingwith differenethod give
mal conduct
Parameters(fig. 3).
were used:
0C;
rface, other
supply, 2 – fdicator,8–e
oles,withdiam
nalsample
g method. Sunt precise fochance to r
tivity.
of three-di
surfaces adi
fuse on 5 A,electric choke
meters3.2mm
es
uch choice isorms is extrresearch eff
imension m
iabatic.
3 – switch,e,9–measur
mand15mm
s substantiaremely difficfective therm
odels are fu
4 –ring
m
ted cult mal
ully

Becuof cal
whl Q
1T
S
Daprco
In mecopstefur
FoweciridepaAll
FIGURE3.
efore modelibic grid, sizheating andlculated by n
here: – samp– heat f
2,T – tempe
– cross
ata obtainedesented in efficient of t
figures 4 anethod. Differpper is higheel. Also thirther resear
r researchinere made wrcle. Cross-sentical pororameters folocation of t
Three‐dimen
ing of therme of one sucd opposite snext formul
le length, mflow, W; eratures of h
sectional ar
d during thetable 2. By
the holes dia
nd 5, we canrence of res
her and phons results sh
rches.
ng the influewith the foll
ectional areosity in all saor thermal mtemperature
nsionalmodel
mal process,ch element wsurfaces in ta
m;
heating and
rea of sampl
e experimeny results frameter were
n see that gesults in coppnon therma
how us that
ence of the powing perfo
ea for each hamples. Likemodeling wee is shown in
–
lsofstainless
every protowas 0.0004 the last mom
opposite su
le, m2.
nts on stainrom tables e built (figs.
eneral charaper samplesl conductivicomputer m
pores form ooration formhole was thee in previousere the samn figures 6 a
– 115 –
steelsamples
otype had bm. After fin
ment of tim
2 1
Q lT T S
urfaces, K;
nless steel a1 and 2, d 4, 5).
acter of depes is caused bity begins tomethod give
on the thermms: hexagone same and s experimen
me. Stainlessand 7.
swithdiamet
been dividednishing proc
me. Thermal
and copper dependence
endence is eby the fact to increase we truly infor
mal conductin, equilaterequaled 1.1
nt, holes loca steel was c
ersofholes5
d by ~250 0cess, we hav
conductivit
three-dimes of the th
equal for comthat the ther
with lower termation and
ivity, three-dal triangle,
13094∙10-4 mation was inchosen as m
5mmand15m
000 elementve had tempty coefficien
ension modhermal cond
mputer and rmal conducemperatured can be use
dimensionasquare, ell
m2, this stepn-line and stmaterial for
mm
ts with a peratures nt can be
els were ductivity
physical ctivity of s than in ed in the
al models ipse and
p gave us taggered, samples.

FIGUR
FI
RE4.Depende
FIGURE5.Depe
enceoftheth
endenceofthe
ermalconduc
ethermalcon
– 116
ctivitycoeffici
nductivitycoef
–
ientoftheho
efficientofthe
lesdiameterf
eholesdiamet
forstainlesss
terforcopper
steelsamples
rsamples

Obresaccinfconconbybetraim
Eff
Toweaccsam
FIGURE7.T
btained resusults. For elcepted, andfluence of pnfidently asnductivity t
y using the etween the
ansferred bymportant for
ffectivether
o investigateere created acount the rmple grid w
FIGU
Thermalcond
ults were prllipse 1, the
d for ellipse ores form ossert that p
than their loelliptic formpores, whicy the condudeveloping
rmalconduc
e the changas before, bu
radiation anwith air in th
URE6.Temper
ductivitycoeff
resented in e case when
2 – when pon electronipores form
ocation (at thm pores with
ch causes muction electporous met
ctivityinth
ges of effecut this time
nd convectivhe holes. Th
–
raturealloca
ficientsforthr
table 3. In n a large diperpendiculc and phon make greahe same por
h in-line locamaximum htrons. All prtallic materi
ree‐dimens
ctive thermawith the pre
ve componehe number o
– 117 –
tioninthethr
ree‐dimensio
figure 6, weiagonal of thlar to the hon thermal ater impactrosity). Theation. The re
heat dissipatrevious resuials.
sionalsamp
al conductivesence of aients of therof elements
ree‐dimension
nalmodelsw
e can see dihe ellipse is
heat flow. Dconductivit
t on the el lowest thereason of thition (amonults show u
ples
vity coefficir in the hole
rmal conducs was about
nalmodels
ithdifferentp
iagram whics parallel toiagram showty. After analectronic anrmal conducs result is thg all other
us that pore
ient three-des, that will activity. In fi
550 000. T
perforationfo
ch was builo the heat fws us mainalyzing datand phonon ctivity was ahe shortest samples), w
es form is t
dimensionalallow us to tigure 8, weThe number
orms
lt by this flow was n laws of a, we can
thermal achieved distance which is the most
l models take into can see
r of units

was moelementconstruccorrespo
Obtaineheat, sitemperatempera
Convect
Based ofrom thewas foun
In figurefor poreholes bo
Allocatiois shown
FIGURE9.three‐dim
λ (ko
nv.+
rad.
) / λ
eff.,%
re than twots. The valuction is autond to stain
d data are pnce heat caatures at thatures of sam
tiveandrad
n obtained e effective thnd by deduc
e 8, we can es with in-lioundaries.
on of the hean in figure 9
.Dependencymensionalmo
0
5
10
15
20
25
30
35
40
45
0
o million. Cuue of smootomatic me
nless steel, th
FIGURE8.Par
presented inapacity of he ends of mples with a
diationther
data (tableshermal condcting the elec
clearly see ine and stag
at flow in thr9.
yofconvectivodels
2 4
ubic mesh woth and re
echanical whe material
rtofmeshoft
n table 4. It air is twicesamples w
adiabatic su
rmalcondu
s 3 and 4), dductivity wactron and ph
the differenggered loca
ree-dimensi
veandradiati
4 6
– 118
was taken welevance of
with complicin the holes
three‐dimens
should be ne higher th
with consideurfaces in th
uctivityinth
dependency as built (fig. honon comp
nce betweeation. This is
onal sample
ionthermalc
8
–
with automatcenters el
cated paralls is air.
sionalmodels
noted, that than heat caering convee holes.
hree‐dimens
of convectiv9). Convecti
ponent from
n radiation s due to var
es with air in
conductivityf
y = 14.845lR² = 0
y = 1
10
tic choice ofements is el construc
withairinth
the air in hoapacity of tection and r
sionsample
ve and radiave and radiathe effective
and convecrious chang
n the pores (
fromtheeffec
n(x) ‐ 1.49590.9894
4.324ln(x) ‐ 0.R² = 0.9472
12 1
f proximity average. T
ction. Therm
heholes
oles create ethe metal. Tradiation a
es
ation thermation therme heat condu
ctive thermages of temp
(diameter of
ctivethermal
.0521
14 16
and curvatuhe method
mal propert
extra outletsTherefore, re lower th
al conductivmal conductiv
uction.
al conductiverature on
f holes is 8 m
conductivity
d, mm
Δλs, %
Δλl, %
ure of
ties
s of the han
vity vity
vity the
mm)
yfor
%

Asresshthedir
FI a)
FIGb)
Figin incexpmoderemin
we can sesistance is gortest distae samples wrection of he
IGURE10.Allo
GURE 11. Allotemperature
gure 11b shothe holes 8
creases the pressed hypotions. Analpendences mained the copper 14%
e in figure growing, thence betwee
with staggereat flow (fig
cationofthe
ocation of thinsamplewit
ows us that 8 mm, air fa
thermal repothesis abological comof convectsame. In pe
% (with hole
10, the lowe heat flow n the poresred location. 11a).
heatflowint
he: a) heatthin‐lineloca
temperaturcilitates tra
esistance (cout the impa
mputer modive and rad
ercentage, coes 15 mm) d
–
west heat flodecreases. T
s, this will bn holes, con
three‐dimensi
flow in samatedholes(dia
re of air in thnsferring thonvection iact of not oneling was mdiation theronvective anue to the hig
– 119 –
ow is obserThe maximube increasinnvection in
ionalsamples
b)
mple with stameteris8m
he holes is ahe heat (by s very low nly pores simade with rmal condund radiationgh thermal c
rved in the um temperag the convethe holes w
swithairinth
taggered locamm)
allocated eveconvection)or absent)
ze, but also copper an
uctivity on n part of theconductivity
holes withature gradie
ction in thiswill be maxi
hepores,diam
ated holes (d
enly; at temp) and at low. This confitemperaturd aluminumeffective th
e thermal coy of copper.
h air. When ent is directes direction. imum at 45
meterofholes
(diameter is
peratures ower temperairms the prre on the com samples. hermal condonductivity i
thermal ed to the Thus, in
5 to the
sis8mm
15 mm);
ver 31C atures, it reviously onvective
General ductivity is lowest

– 120 –
Resultsofresearch
TABLE1.Electronthermalconductivitycoefficientsforthestainlesssteelandcoppersamples
d,mm λl,W/(m∙K) λs,W/(m∙K)
Stainless steel
3.2 14.137 14.158
4 13.926 13.969
5 13.592 13.607
6 13.055 13.107
8 11.891 11.971
10 10.560 10.532
12 8.842 8.803
15 6.294 6.314
Copper
4 358.8480 346.0934
6 340.0536 338.5800
8 315.8059 315.4422
10 294.6443 288.6011
12 259.4194 260.4277
16 196.4911 190.8948
20 139.0258 127.1524
TABLE2.Electronandphononthermalconductivitycoefficientsforthestainlesssteelandcopperthree‐dimensionalmodels
d,mm T1,С T2,С λl,W/(m∙K) T1,С T2,С λs,W/(m∙K)
Stainless steel
3.2 40.906 45.281 14.2857 40.91 45.284 14.2889
4 40.907 45.371 14.0009 40.914 45.375 14.0103
5 40.91 45.515 13.5722 40.92 45.524 13.5751
6 40.913 45.699 13.0589 40.928 45.711 13.0671
8 40.922 46.204 11.8326 40.949 46.232 11.8304
10 40.938 46.947 10.4010 40.982 47.002 10.3820
12 40.962 48.042 8.8276 41.028 48.155 8.7694
15 41.04 50.924 6.3233 41.146 51.28 6.1673
Copper
4 55.135 55.467 377.2666 55.135 55.467 377.2666
6 55.135 55.482 360.9583 55.136 55.483 360.9583
8 55.137 55.505 340.3601 55.137 55.506 339.4377
10 55.138 55.537 313.9161 55.139 55.539 313.1313
12 55.141 55.58 285.3133 55.142 55.584 283.3768
16 55.151 55.715 222.0789 55.151 55.728 217.0754
20 55.176 55.99 153.8729 55.171 56.035 144.9682
– 121 –
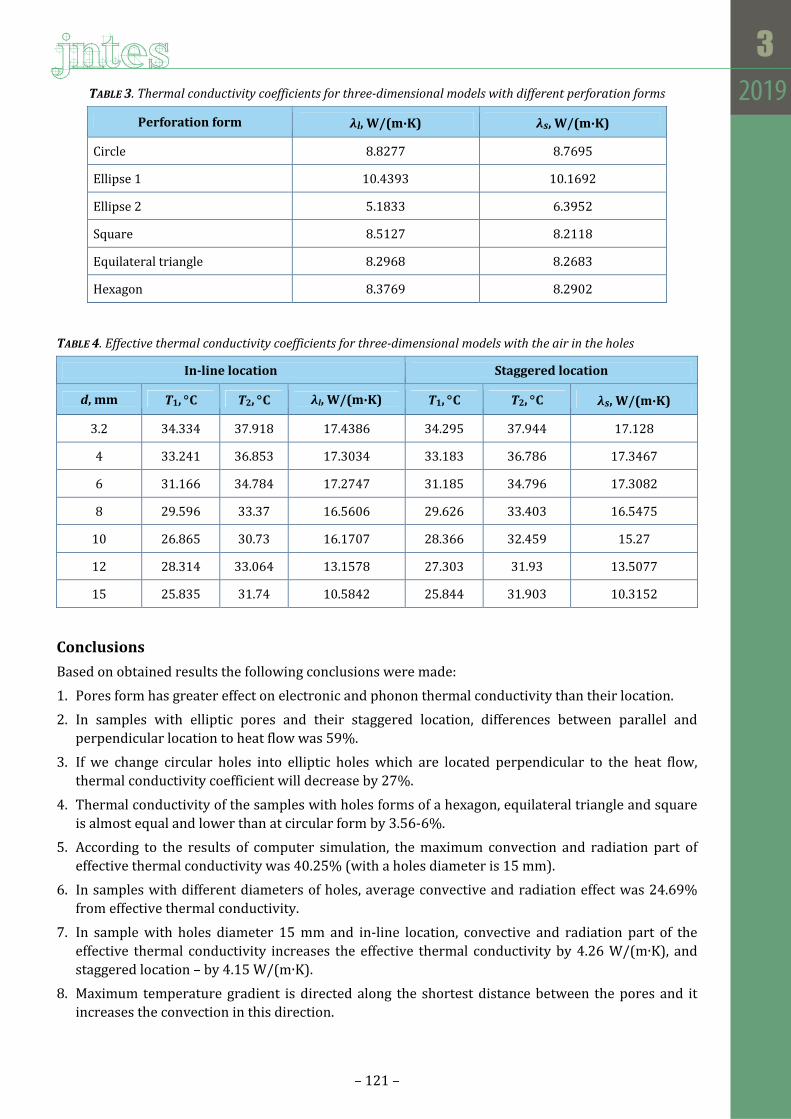
TABLE3.Thermalconductivitycoefficientsforthree‐dimensionalmodelswithdifferentperforationforms
Perforationform λl,W/(m∙K) λs,W/(m∙K)
Circle 8.8277 8.7695
Ellipse 1 10.4393 10.1692
Ellipse 2 5.1833 6.3952
Square 8.5127 8.2118
Equilateral triangle 8.2968 8.2683
Hexagon 8.3769 8.2902
TABLE4.Effectivethermalconductivitycoefficientsforthree‐dimensionalmodelswiththeairintheholes
In‐linelocation Staggeredlocation
d,mm T1,С T2,С λl,W/(m∙K) T1,С T2,С λs,W/(m∙K)
3.2 34.334 37.918 17.4386 34.295 37.944 17.128
4 33.241 36.853 17.3034 33.183 36.786 17.3467
6 31.166 34.784 17.2747 31.185 34.796 17.3082
8 29.596 33.37 16.5606 29.626 33.403 16.5475
10 26.865 30.73 16.1707 28.366 32.459 15.27
12 28.314 33.064 13.1578 27.303 31.93 13.5077
15 25.835 31.74 10.5842 25.844 31.903 10.3152
Conclusions
Based on obtained results the following conclusions were made:
1. Pores form has greater effect on electronic and phonon thermal conductivity than their location.
2. In samples with elliptic pores and their staggered location, differences between parallel and perpendicular location to heat flow was 59%.
3. If we change circular holes into elliptic holes which are located perpendicular to the heat flow, thermal conductivity coefficient will decrease by 27%.
4. Thermal conductivity of the samples with holes forms of a hexagon, equilateral triangle and square is almost equal and lower than at circular form by 3.56-6%.
5. According to the results of computer simulation, the maximum convection and radiation part of effective thermal conductivity was 40.25% (with a holes diameter is 15 mm).
6. In samples with different diameters of holes, average convective and radiation effect was 24.69% from effective thermal conductivity.
7. In sample with holes diameter 15 mm and in-line location, convective and radiation part of the effective thermal conductivity increases the effective thermal conductivity by 4.26 W/(m∙K), and staggered location – by 4.15 W/(m∙K).
8. Maximum temperature gradient is directed along the shortest distance between the pores and it increases the convection in this direction.

– 122 –
References
[1] Gunasegaram D.R., Farnsworth D.J., Nguyen T.T. (2009), Identificationofcriticalfactorsaffectingshrinkageporosity inpermanentmoldcastingusingnumerical simulationsbasedondesignofexperiments. Materials Processing Technology. Vol. 209, pp. 1209-1219.
[2] Spasskij A.G. (1950), Osnovylitejnogoproizvodstva [Fundamentals of foundry]. Moscow, Metallurgizdat. 318 p.
[3] Impregnationimprovescastingquality. Vacuum. 1953. Vol. 3, No. 1, pp. 94.
[4] William van Grunsven (2014), Porousmetal implants for enhanced bone ingrowth and stability. Thesissubmitted to the University of Sheffield for the degree of Doctor of Philosophy. Department of Materials Science and Engineering. September 2014.
[5] Reglero J.A., Rodriguez-Perez M.A., Solorzano E., de Saia J.A. (2011), Aluminiumfoamsasafillerforleadingedges:Improvementsinthemechanicalbehaviorunderbirdstrikeimpacttests. Materials and design. Vol. 32, No. 2, pp. 907-910.
[6] Lepeshkin I.A., Ershov M.Ju. (2010), Vspenennyj aljuminij v avtomobilestroenii [Foamed aluminum in automobile industry]. Avtomobil'naja promyshlennost' [Automobile industry]. No, 10, pp. 36-39.
[7] Krupin Ju.A., Avdeenko A.M. (2008), Sil'noporistye struktury – novyj klass konstrukcionnyh materialov [Highly porous structure as a new class of structural materials]. Tjazheloe mashinostroenie [Heavy mechanical engineering]. No. 7, pp. 18-21.
[8] Krushenko G.G. (2012), Poluchenie i primenenie poristyhmetallicheskihmaterialov v tehnike [Production and application of porous metal materials in engineering]. Vestnik Sibirskogo gosudarstvennogo ajerokosmicheskogo universiteta imeni akademika M. F. Reshetneva. Tehnologicheskie processy i materialy [Bulletin of Siberian State Aerospace University. Technological processes and materials], pp. 181-184.
[9] Tang H.P. (2012), Fractal dimension of pore‐structure of porousmetalmaterialsmade by stainless steelpowder. Powder Technology. Vol. 217, pp. 383-387.
[10] Banhart J. (2000), Manufacturingroutesformetallicfoams. Journal of Metals. Vol. 52, pp. 22-27.
[11] Nielsen H., Hufnagel W., Ganoulis G. (1974), Aluminium – Zentraie Düsseldorf. 1054 p.
[12] Saenz E., Baranda P.S., Bonhomme J. (1998), Porous and cellular materials for structural applications. Materials of Symp. Proc. Vol. 521, 83 p.
[13] Pavlenko A., Koshlak H. (2015), Productionofporousmaterialwithprojectedthermophysicalcharacteristics. Metallurgical and Mining Industry. No 1, рp. 123-127.

– 123 –
Yevstakhii І. KRYZHANIVSKYI, Sviatoslav І. KRYSHTOPA
Liudmyla І. KRYSHTOPA, Maria M. HNYP
Ivan М. MYKYTII
Ivano-Frankivsk National Technical University of Oil and Gas, Ukraine
CONVERSIONOFDIESELENGINETOALTERNATIVEBIO‐ALCOHOLFUEL
Abstract: Research has been carried out on feasibility of using biomethanol as a fuel in diesel enginesconverted forworkonspirits,compared tousageofdiesel fuelofpetroleumorigin.Forrealizationof thesetasksatDepartmentofAutomobileTransport in IFNTNGwas converted forworkonmethanolautomobiledieselengineofmodelX17DTLOPEL.Toconvert thedieselengine tomethanolcompressionstrengthof theenginewasreduced to14.1by installingofadditionalgasketsunder theheadofcylinderblock,anoriginalmicroprocessor DIS ignition system of own design was installed, and engine management system wasoptimized. Experimental dependences of effective power and specific fuel consumption on the crankshaftrotational speed for the original diesel engine and converted for methanol diesel engine have beeninvestigated. It is established that transferringdiesel engine forworkonmethanol it ispossible toachievepower indexes of original one. Analysis of exhaust gases during transferring of diesel engine towork onmethanolshowsthatinallmodesofenginethereisasignificantreductioninemissionsofnitrogenoxidesandcarbonmonoxide.
Keywords:dieselengine,biofuels,biomethanol,algae,ecologicalindicatorsofICE.
Introduction
One of the major problems faced by automobile transport professionals today is provision of cars with non-oil-fired altogether fuels. Existing explored oil fields are approaching their exhaustion which will inevitably lead to gradual increasing of oil prices and correspondingly for motor fuels generated by oil refining. At the same time, the global problem of humanity is protection of the environment from harmful emissions from the exhaust gases of internal combustion engines. This issue is especially relevant for cars with diesel engines. Gradually, more and more European cities move to prohibit or restrict usage of cars with diesel engines. In connection with the increased carcinogenicity of cars with diesel engines, a number of world automobile concerns have already announced the curtailment of programs for production of cars with diesel engines.
Thus, in Ukraine, and in the world today there is an urgent multifaceted problem of providing of demand for an automobile transport in a cheap and environmentally friendly non-oil source. It should be noted that in the world today a large number of diesel-powered cars and diesel engines in spite of petrol are characterized by a much higher cost and resource. Therefore, a rational step would be to use both alternative and cheaper and environmentally friendly fuels for prospective diesel engines and diesel engines that are currently in operation, compared with diesel fuel of petroleum origin.
One of the main directions for solving this problem is usage of renewable energy sources from plant biomass. At the same time, it should be noted that the rapid growth of production and consumption of biofuels from vegetable oils of food intended in many countries of the world led to disturbance of the balance in the structure of agro-industrial production and began to generate social, environmental,

– 124 –
and ethical problems in society. This is largely due to usage of agricultural production for biofuel production while at present, according to various estimates, about 20% of humanity is starving.
One of the promising further ways of developing biofuels is using of instead of biomass from agricultural areas of biomass of algae and aquatic plants (third generation biomaterials) which, as a source of energy, exceeds traditional raw bioreursives (biomaterials of the first and second generations) as their energy resources. However, biofuels from algae and aquatic plants are being hampered by the wide introduction in road transport of inadequate research on the use of biofuels in automotive engines that are made from these third generation bio materials. Therefore, research of usage of biofuels in automotive engines, created from a large range of existing algae and aquatic plants is very timely and relevant.
Analysisofrecentresearchandpublications
Performed analysis of scientific works shows that researchers are increasingly come to a consensus about the gradual refusal to use petroleum fuels [1] and the feasibility of using renewable energy sources from plant biomass [2].
It should be noted that technologies for production of biofuels from vegetable oils followed by its usage in engines of motor vehicles are developed at a sufficiently deep level [3]. Mostly from oilseed cultures oil is extracted by squeezing and further purified by various methods including neutralization, freezing or filtration.
At production of biodiesel fuel various types of vegetable oils such as canola, flax, sunflower, palm, and others are used [4]. In this case, biofuel from different vegetable oils has a number of distinct physical and chemical characteristics. Such signs include: lower heat of combustion, viscosity, density, filtering, temperature of freezing, coking, cetane number, etc.
The fuel potential of oilseeds when compared to 1 ton of raw material is much greater than other crops. Calculations show that rape seed costs are about 17.700 MJ/kg, 700 MJ/kg for oil, while the energy derived from oil is 22.200 MJ/kg. In connection with the foregoing, one can conclude that the energy gain per hectare of rape sown is 3800 MJ (corresponding to 110 litters of petroleum diesel fuel at its energy value) [5].
Biofuels from terrestrial crops (rape, sunflower, etc.) are successfully used in existing engines, extending the life of engines and having a high cetane number [6]. Usage of biofuels as a bio Additive to petroleum diesel can improve the environmental and anti-wear properties of fuels [7].
Using of algae and aquatic plants biomaterials for the production of motor fuels have a number of advantages [8]: algae and aquatic plants absorb 80-90% of carbon dioxide in oxygen uptake during growth; sewage and saline water can be used to cultivate algae and aquatic plants; algae and aquatic plants, unlike terrestrial plants, grow year-round. However, it has been established that the bioavailability and content of lipids in algae depends on the intensity of light [9].
Low mixing of water intensifies heat and mass transfer processes in algae promotes movement of cells into the area of illumination and increases the bio productivity of algae [10]. It has been established that the concentration of carbon dioxide [11] has a significant effect on the yield of algae and aquatic plants. Therefore, according to increasing concentration of carbon dioxide from 4% to 22% biomass yield of algae will increase at four or five times.
An important place among promising alternative fuels for diesel engines is taken by alcohols [12]. Their number in the first place includes: methyl alcohol (methanol), ethyl alcohol (ethanol), n-butyl alcohol (butanol), and others. Alcohols can be produced from almost any raw material that contains carbon. Alcohols on a number of physical and chemical properties are significantly different from standard diesel fuels making it difficult to use them in diesel engines.
The most promising for today in the diesel engines is a monatomic primary alcohol – methyl (methanol) CH3OH. Methanol is the simplest alcohol it is a poisonous liquid with a weak alcohol smell.

– 125 –
Among the positive moments of methyl alcohol for use in diesel engines, it is possible to note the presence of oxygen atoms in its molecules which makes it possible to use methanol as oxygenates (oxygen-containing components) which contribute to the reduction of soot and carbon monoxide emissions both in gasoline engines and in diesel engines [13].
Formationofthepurposesofthearticle
Algae and aquatic plants are one of the oldest and most resistant organisms on the Earth and live in fresh and salty water, in soil and even in snow. Diversity of existing algae and water plants the authors of the research was chosen Elodea – the family of perennial water plants from the family of watercolours (Hydrocharitacea). The water plant is extremely adapted to any aquatic environment is extremely unpretentious and has an extremely high rate of biomass increase: up to 5% per day.
This water plant has created a major problem for Europe and Ukraine because of its rapid spread and negative impact on ecosystems, fishing and even shipping with each year the extent of pollution of the surface of the water is significantly increasing. The most effective way to clean the reservoirs is to use the Elodea as fuel.
Therefore, the purposes of this article are experimental studies:
changes in the power characteristics of automobile diesel engines when used in these engines of methanol, which is obtained from Elodea;
changes in environmental performance of automotive diesel engines using in these engines methanol which is obtained from Elodea.
Presentationofthemainresearchmaterial
In comparison with other alternative fuels cost of methyl alcohol is low [14] in addition with usage of methanol as a fuel for diesel engines, it is possible to significantly reduce emissions of soot particles and nitrogen oxides.
This is due to the fact that the combustion of methanol in the diesel cylinder does not form intermediate products that promote the formation of acetylene and aromatic hydrocarbons which lead to the formation of soot [15]. Therefore, the subject of research on economic and environmental points of view was the use of methanol derived from Elodea in a diesel engine.
Table 1 presents comparative physical and chemical properties of methanol and diesel fuel [16].
Disadvantages of methanol include lower values of lower calorific value compared to diesel (table 1). In this regard, in order to maintain strong diesel performance, a 2.2-fold cyclic flow was increased.
Bad lubricating properties [17] as a consequence of increased elasticity of vapours cause large cavitations cracks and the appearance of steam cavities in the system at low pressure of fuel pumps, which reduce the uniformity of fuel supply, and also have a negative effect on the stability of the portion of injected fuel. In order to ensure the efficiency of the fuel equipment during the experiments, 1% castor oil was added to methyl alcohol. During combustion of methyl alcohol in cylinders of diesel there is a problem of its ignition. Engaging methanol in a diesel engine is possible by means of [18]:
feeding the inflammable portion of diesel fuel into the combustion chamber;
use of catalysts, which help reduce the temperature of ignition of methyl alcohol and accelerate the process of combustion;
additionally installed ignition system.
– 126 –
TABLE1.Comparativecharacteristicsofmethanolanddieselfuel
CharacteristicQuantity
Dieselfuel Methanol
Essential composition, kg/kg: carbon hydrogen oxygen
0.870 0.130
–
0.375 0.125
0.5
Viscosity at 20°C, mm2/s, (cSt) 3.0 – 6.0 0.55
Mixing with hydrocarbon fuels good bad
Flash point, °С 40 11
Heat of combustion, kJ/kg 42500 19700
Cetane number, unit 45 3
Boiling point, °С 170 – 380 64.7
Theoretical amount of air required for complete combustion 1 kg of fuel, kg of air kg of fuel
14.35
6.52
Density at 20°C, kg/m3 860 792
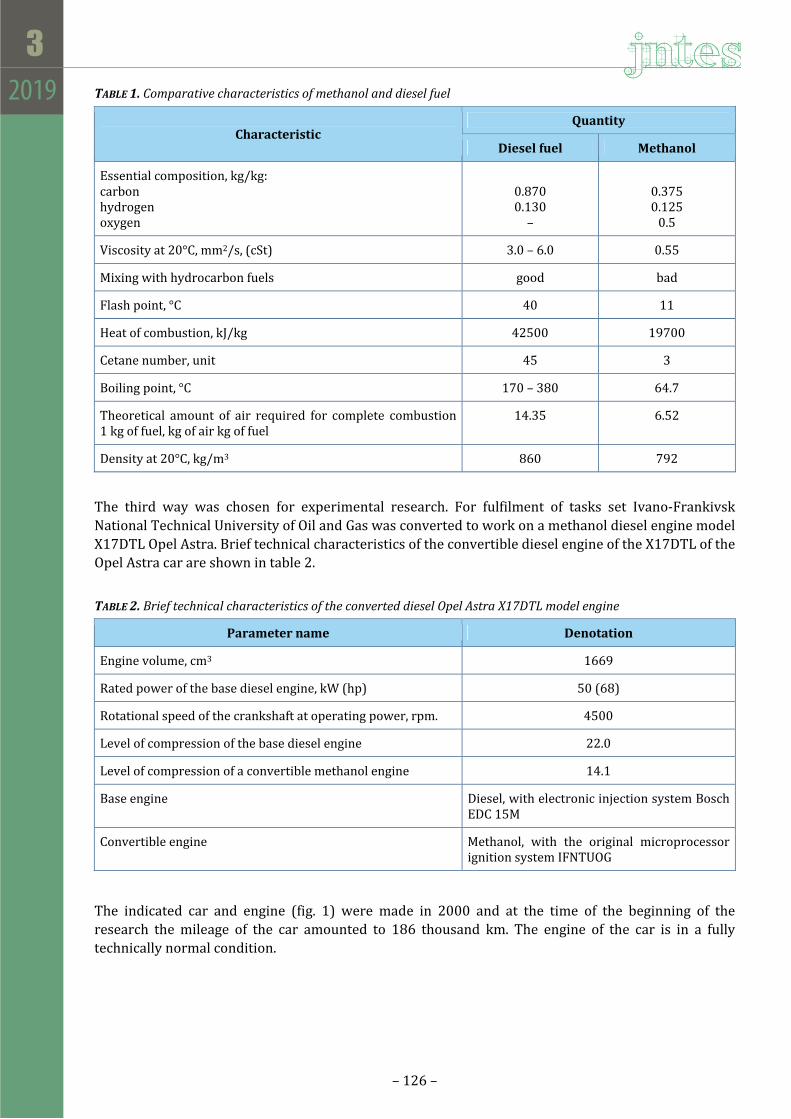
The third way was chosen for experimental research. For fulfilment of tasks set Ivano-Frankivsk National Technical University of Oil and Gas was converted to work on a methanol diesel engine model X17DTL Opel Astra. Brief technical characteristics of the convertible diesel engine of the X17DTL of the Opel Astra car are shown in table 2.
TABLE2.BrieftechnicalcharacteristicsoftheconverteddieselOpelAstraX17DTLmodelengine
Parametername Denotation
Engine volume, cm3 1669
Rated power of the base diesel engine, kW (hp) 50 (68)
Rotational speed of the crankshaft at operating power, rpm. 4500
Level of compression of the base diesel engine 22.0
Level of compression of a convertible methanol engine 14.1
Base engine Diesel, with electronic injection system Bosch EDC 15M
Convertible engine Methanol, with the original microprocessor ignition system IFNTUOG
The indicated car and engine (fig. 1) were made in 2000 and at the time of the beginning of the research the mileage of the car amounted to 186 thousand km. The engine of the car is in a fully technically normal condition.
а)
c)
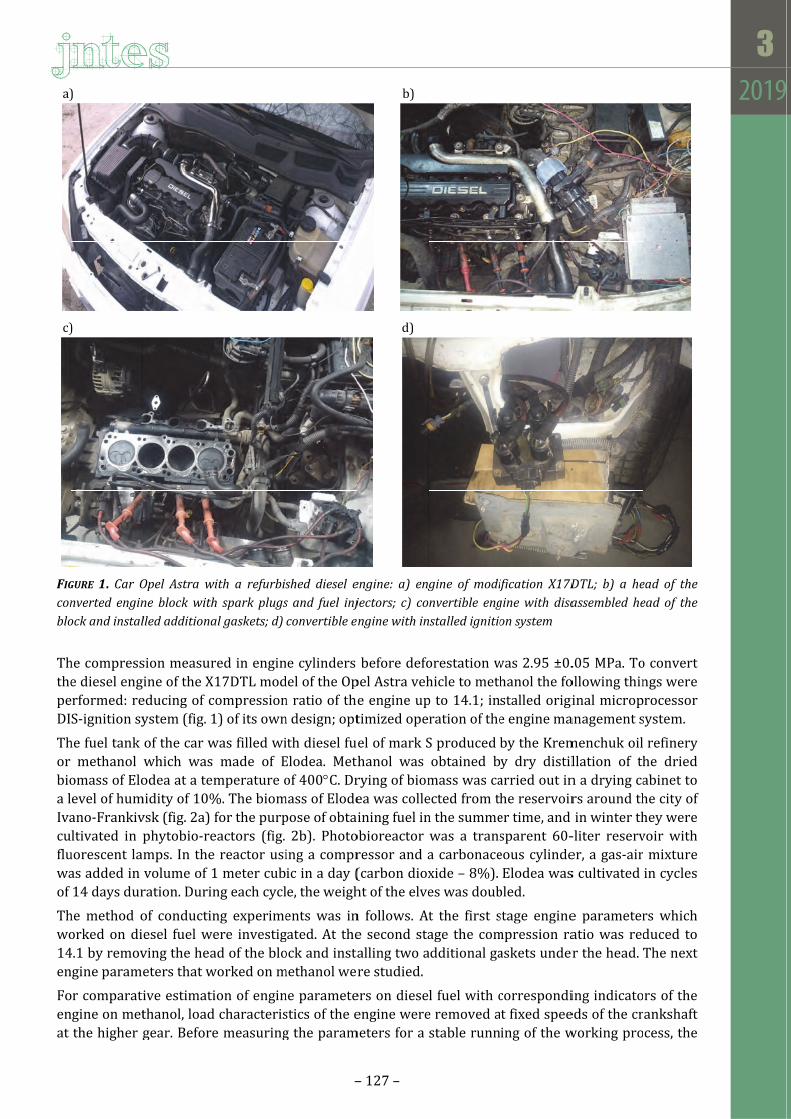
FIGconblo
ThthepeDI
Thor bioa lIvacufluwaof
Thwo14en
Foenat
)
)
GURE 1. CarOnverted enginockandinstal
he compresse diesel engrformed: reS-ignition sy
he fuel tank methanol
omass of Eloevel of humano-Frankivltivated in p
uorescent laas added in 14 days dur
he method oorked on di
4.1 by removgine parame
r comparatigine on metthe higher g
OpelAstrawneblockwithlledadditiona
sion measurine of the X
educing of cystem (fig. 1
of the car wwhich was odea at a tem
midity of 10%vsk (fig. 2a) phytobio-remps. In thevolume of 1
ration. Durin
of conductinesel fuel weving the heaeters that w
ive estimatithanol, loadgear. Before
ith a refurbish sparkplugsalgaskets;d)
red in engin17DTL modompression
1) of its own
was filled wimade of E
mperature o%. The biomfor the purp
eactors (fig. reactor usi
1 meter cubng each cycl
ng experimeere investigad of the blo
worked on m
ion of engin characteris
e measuring
–
shed diesel esand fuel injconvertiblee
ne cylinders del of the Opn ratio of then design; opt
ith diesel fuElodea. Methof 400C. Dr
mass of Elodepose of obtai
2b). Photoing a compric in a day (e, the weigh
ents was ingated. At theock and insta
methanol wer
ne parametestics of the eg the param
– 127 –
b)
d)
engine: a) engjectors; c) conginewithin
before defopel Astra vehe engine uptimized ope
el of mark Shanol was rying of biomea was colleining fuel in
obioreactor ressor and a(carbon dioxht of the elve
n follows. Ate second staalling two are studied.
ers on dieseengine were
meters for a
gine ofmodifnvertible engstalledignitio
orestation whicle to methp to 14.1; inration of the
S produced obtained b
mass was caected from thn the summewas a transa carbonacexide – 8%). es was doub
t the first sage the com
additional ga
l fuel with ce removed astable runn
ification X17Dginewithdisaonsystem
was 2.95 ±0.hanol the fostalled origie engine ma
by the Kremy dry distil
arried out inhe reservoirer time, and sparent 60-eous cylinde
Elodea wasbled.
stage enginempression raaskets under
correspondit fixed speeing of the w
DTL; b) a heassembledhe
.05 MPa. Toollowing thininal microp
anagement s
menchuk oilllation of th
n a drying cars around thin winter th
-liter reserver, a gas-airs cultivated
e parameteratio was redr the head. T
ing indicatoeds of the crworking pro
ead of theeadof the
o convert ngs were rocessor
system.
refinery he dried abinet to he city of hey were voir with mixture in cycles
rs which duced to The next
rs of the ankshaft cess, the

engine economthe engi
а)
FIG
The effeloss in tmeasureby the st
Volumetrange ofthe meathe meacarbon temperapotentio
For a corelevantrotation
To measfrom thiof fuel wdetermicranksh
Results
The moengine acalculateffectivehourly fAstra ca
Figure 3variatioto expe
warms up mical indicato
ine operatio
GURE2.Sourc
ective enginethe transmied using Potand – 1.0%
tric particlef measurem
asurement rasurement dioxide me
atures of thometer UP-2
omparative t indicators
n speeds from
sure the fueis tank was was measurined by the
haft.
sandDisc
st importanare the effeced through e specific fufuel consum
ar on diesel f
3 shows thn of the engriments com
to the opeors were en
on.
esofharvesti
e power waission. Powrtable Road
%.
es of nitrogements of nitrrange of hydrange of ca
easuring ranhe exhaust g2М were use
assessmentof the base
m 1000 to 4
el consumptfed to the fu
red by electe motor-test
ussion
nt engine pactive power the specifieel consump
mption. Thesfuel were co
e dependengine speed ompared wit
erating temntered into t
ingwaterpla
as determineer on the d
d Dyno prod
en oxides wogen oxides
drocarbons arbon mononge 0-16%, gases, thermed.
t of the enve diesel eng4500 r./min
tion under tuel pump intronic weighter USB Aut
arameters tand effectiv
ed power ontion was calse figures oompared wit
nce of effectof the crankth work on
– 128
mperature. Tthe protoco
b
ntsforbiofue
ed as the amdriving wheduced by Dy
were measus is 0-5000 pis 0-2000 p
oxide is 0-5absolute m
mocouples o
vironmental gine, the loa
were remov
the hood wnlet. In the sht with an toscope II o
that charactve specific fun the drivinglculated thr
obtained froth those obt
tive power kshaft when n diesel fue
–
The resultsol of trials w
b)
els:naturalre
mount of poweels and pownomet. Abso
ured by the ppm, the ab
ppm, the abs5%, the abs
measuremenof the type
performancd characterved.
was installedsame tank werror of 0.1on signals f
terize the euel consumpg wheels andrough the deom the engintained when
and effectiworking on
l when wor
of measurwith triple re
eservoirs(a);a
wer on the dwer losses olute error
gas analyzesolute meassolute meassolute meast error – 0"chromele-c
ce of the enristics of the
a separate was built a r1%. The spefrom the se
fficiency of ption. The efd power losetermined ene of the X
n working on
ve specific n diesel fuelrking on m
rements of epetition at
artificialbior
driving whein the tranof measurem
er "Autotessurement ersurement ersurement er.05%. In decopel" and
ngine on gase engine at
capacity ofreverse fuel eed of the censor of the
f methanol uffective eng
ss in the traneffective eng17DTL modn alternative
fuel consuml and metha
methanol, th
f effective at each mode
reactor(b)
eels and powsmission wment of pow
t-02.03P". Trror is 10 pprror is 10 pprror is 0.03etermining the log-met
s fuel with the cranksh
f 2 litters. Fline. The m
crankshaft we speed of
use in a diegine power wnsmission. T
gine power adel of the Oe fuels.
mption on anol. Accordhe specific f
and e of
wer ere
wer
The pm, pm, 3%, the ter-
the haft
Fuel ass
was the
esel was The and
Opel
the ding fuel

– 129 –
consumption increases, depending on the rotational speed from 89.5% to 110.4%. Such a significant increase in the specific fuel consumption when working on methanol in relation to diesel fuel is explained by a significantly lower calorific value of methanol.
According to the experiments, in comparison with the work on diesel fuel when working on methanol in the range from idle speed to nominal revs, an increase in effective power by 2-5% is observed.
FIGURE3.ExperimentaldependencesofeffectivepowerNandspecificfuelconsumptiongoncrankshaftrotationalspeednforbasedieselandmethanol‐convertedengine:––––––engineworkonmethanol;––––engineworkondieseloil
Increasing of effective power of engine working on methanol is due to the content of a large amount of oxygen in the methanol molecule which leads to more complete combustion of fuel in the engine cylinders. As a result of the performed experimental studies, dependences of changes in the content of nitrogen oxides NOx, СnHm, CO, and carbon dioxide CO2 on the crankshaft rotational speed of the engine n for the diesel and methanol-convertible engine (fig. 4 and fig. 5) were determined.
FIGURE 4. Experimental dependencies of the content of hydrocarbons СnHm and carbon monoxide CO on therotational speedof the crankshaft enginen for thebasedieselandmethanol‐convertible engine: ––––––engineworkonmethanol;––––engineworkondieseloil
8
N,kW
16
24
32
48
02400 38001700 4500 n, r./m.1000 3100
275
ge,g/(kW*h)
330
440
385
220
N
ge,
550
0,10
CnHm,ppm
0,15
0,20
0,25
0,35
0,052400 38001700 4500 n, r./m.1000 3100
CO,%
300
400
350
250
600
200
CO
CnHm

– 130 –
FIGURE5.ExperimentaldependencesofthecontentofnitrogenoxidesNOxandcarbondioxideСО2ontherotationalspeed of the crankshaft engine n for the base diesel andmethanol‐convertible engine: –––––– enginework onmethanol;––––engineworkondieseloil
The analysis of the obtained results allows to draw the following conclusions. Since the combustion process of both methanol and petroleum diesel is both efficient enough in both cases, the carbon monoxide content of СnHm (fig. 4) and carbon dioxide СО2 (fig. 5) is almost unchanged when both fuels are burned.
In the range from idle speeds to nominal revolutions when working on methanol, there is a significant reduction in CO emissions of carbon monoxide compared with the engine's work on diesel fuel (fig. 4). It has been experimentally established that, with increasing engine speed, the ratio of carbon monoxide oxide emissions when working on methanol in comparison with the work of the engine on diesel fuel is almost unchanged. The average emission reductions working on methanol of carbon monoxide CO in comparison with the engine's diesel fuel is 71-89%.
Reducing the carbon monoxide content of CO at work on methanol is due to the increased amount of oxygen in the fuel compared with the work of the engine on diesel fuel. The higher content of oxygen in the combustion chamber results in the oxidation of more carbon monoxide to СО2.
In the range from no-load to nominal revolutions when working on methanol there is a significant reduction in emissions of NOx oxides compared to the engine's work on diesel fuel (fig. 5). It has been experimentally established that with increasing engine speed NOx emissions reductions become more significant. For example, if at idle speeds the NOx content of nitrogen oxides when working on methanol is almost the same as that of a diesel engine, then the NOx content of nitrogen oxides is reduced by 54% at the nominal power rpm. Such a reduction in the NOx content of oxides when working on methanol is due to the lower temperature of the combustion process compared with the work of the engine on diesel fuel.
Conclusions
1. Usage of the third generation biomaterials (algae and aquatic plants) is an effective way to provide automobile ICEs with alternative fuels. In particular methanol derived from Elodea can be successfully used in diesel ICEs after minor engine upgrades, which eliminates the need to use petroleum diesel. As a result of the performed experiments it was established that during the transfer of the diesel engine to work on methanol there is no reduction in power indexes of the engine. Specific consumption of fuel converted to methanol engine increases, but taking into account the significantly lower cost of methanol, the cost of fuel is comparable to the cost of diesel fuel.
400
NOx,
500
600
700
900
ppm
3002000 30001500 4000 n, r./m.1000 2500 50003500
4,0
CO2,%
5,0
8,0
7,0
3,0
6,0
NOx
CO2

– 131 –
2. Analysis of exhaust gases during the transfer of the diesel engine to work on methanol shows that in all modes of the engine the emission of nitrogen oxides (up to 54%) and carbon monoxide (up to 89%) is reduced. The obtained results allow to optimize the choice of fuels for power systems of internal combustion engines and to reduce emissions of harmful substances in exhaust gases of automobile diesel engines. Further research will be related to the optimization of the diesel engine's power supply convertible to work on methanol and lower the cost of methanol by improving the production of methanol from algae and aquatic plants.
References
[1] Thompson N.A. (2018), Biofuels are (Not) the Future Legitimation Strategies of Sustainable Ventures inComplexInstitutionalEnvironments. Sustainability. 10 (5), 1382.
[2] Taheripour F., Zhao X., Tyner W.E. (2017), Theimpactofconsideringlandintensificationandupdateddataonbiofuelslandusechangeandemissionsestimates. Biotechnology for Biofuels. 10(1), 1-16.
[3] Ai B., Chi X., Meng J., Sheng Z., Zheng L., Zheng X., Li J. (2016), Consolidatedbioprocessing forbutyricacidproductionfromricestrawwithundefinedmixedculture. Frontiers in Microbiology. 7.
[4] German L., Schoneveld G.C., Pacheco P. (2011), TheSocialandEnvironmental ImpactsofBiofuelFeedstockCultivation:EvidencefromMulti‐SiteResearchintheForestFrontier. Ecology and Society. 16 (3), 24.
[5] Yves S., Diamantis A., Stéphane F. (2013),Catalysttechnologyforbiofuelproduction:Conversionofrenewablelipidsintobiojetandbiodiesel. Oilseeds and fats, crops and lipids. 20 (5), 502.
[6] Haas M.I., Wagner K. (2011), Simplifyingbiodieselproduction:thedirectorinsitutransesterificationofalgalbiomass. Eur. J. Lipid Sci. Technol. 113, 1219–1229.
[7] Nascimento I.A., Marques S.S.I., Cabanelas I.T.D., Pereira S.A., Druzian J.I., de Souza C.O. (2013), Screeningmicroalgae strains forbiodieselproduction: lipidproductivityandestimationof fuelqualitybasedon fattyacidsprofilesasselectivecriteria. Bioenerg. Res. 6, 1–13.
[8] Behera S., Singh R., Arora R., Sharma N., Shukla M., Kumar S. (2015), Scopeofalgaeas thirdgenerationbiofuels, 2, 90.
[9] Afify, A. M. M., Shanab, S. M., and Shalaby, E. A. (2010). Enhancement of biodiesel production from different species of algae. Grasas y Aceites 61, 416–422.
[10] Chen C.Y., Zhao X.Q., Yen H.W., Ho S.H., Cheng C.L., Bai F. (2013), Microalgae‐basedcarbohydratesforbiofuelproduction. Biochem. Eng. J. 78, 1–10.
[11] Ho S.H., Chen C.Y., Lee D J., Chang J.S. (2011), Perspectives on microalgal Co2-emission mitigation systems-a review. Biotechnol. Adv. 29, 189–198.
[12] Brewer P.J., Brown R.J.C., Keates A.C. (2010), SensitivitiesofaStandardTestMethodfortheDeterminationofthepHeofBioethanolandSuggestionsforImprovement. Sensors. 10 (11), 9982-9993.
[13] Mukherjee V., Radecka D., Aerts G., Verstrepen K.J., Lievens B., Thevelein J.M. (2017), Phenotypiclandscapeof non‐conventional yeast species for different stress tolerance traits desirable in bioethanol fermentation. Biotechnology for Biofuels. 10 (1), 1-19.
[14] Branco R.H.R., Serafim L.S., Xavier A.M.R.B. (2018), SecondGenerationBioethanolProduction:OntheUseofPulpandPaperIndustryWastesasFeedstock. Fermentation. 5 (1), 4.
[15] Kim, I-Tae, Yoo, Young-Seok, Yoon, Young-Han, Lee, Ye-Eun, Jo, Jun-Ho, Jeong, W., Kim Kwang-Soo. (2018), Bio‐Methanol Production Using Treated Domestic Wastewater with Mixed Methanotroph Species andAnaerobicDigesterBiogas. Water. 10 (10), 1414.
[16] Duque A., Manzanares P., González A., Ballesteros M. (2018), StudyoftheApplicationofAlkalineExtrusiontothePretreatmentofEucalyptusBiomassasFirstStepinaBioethanolProductionProcess. Energies. 11 (11), 2961.
[17] Rujiroj T., Rujira J., Tarawipa P., Weerawat P., Kamonrat L. (2018), Kineticmodeling and simulation ofbiomethanolprocessfrombiogasbyusingaspenplus. MATEC Web of Conferences. 192, 3030.
[18] Bharadwaz Y.D., Rao B.G., Rao V.D., Anusha C. (2016), Improvementofbiodieselmethanolblends. Alexandria Engineering Journal. 55 (2), 1201-1209.

– 132 –
Ivan M. BOHATCHUK1
Bohdan V. DOLISHNIY1
Ihor B. PRUNKO1
Myhailo I. BOHATCHUK2
1 Ivano-Frankivsk National Technical University of Oil and Gas 2 OJSC "Ukrnafta", Ivano-Frankivsk
INFLUENCEOFOPERATINGFACTORSONSAVINGFUELEXPENDITUREBYMOBILESTEAMGENERATORUNITSOIL
ANDGASINDUSTRY
Abstract:Thearticledealswith the issueof the scaleof thescaleon theheatingelementsofmobilesteamgenerators(puus),whicharewidelyusedintheoilandgasindustryforthedeparaffinationofwells,pipelines,oilandgasandotherequipmentwithahigh‐pressureandlowpressuresteam,aswellasforotherdomesticandindustrialneeds.Sincetheoperationofsteamgeneratingunitstakesplaceinthefieldatafardistancefromthemainbasesoftheirdislocation(storageandaccounting),whichleadstotheforcedconsumptionofphysicallyandchemicallyunpreparedfeedwater.Usuallyitisundergroundnaturalspringwater,waterfromtheyear,lakes,ponds,etc.Theworkofsteamgeneratingunitsonuntreatedwaterleadstotheformationofscum,whichcausesexcessivefuel consumption and the operation of the boiler of the steam generator due to the burning of the coil.However,evenduringtheworkonpreparedcookingwateronthewallsofthecoilformedscale,whichreducestheefficiencyofitsworkandrequiresperiodicremovalwithacidtreatmentin48‐72hoursofinstallations.Operators,often themselves create conditions for the formationof thick layersof scaleand significant fueloverruntoobtaintherequiredamountofsteam,comparedwiththeregulatorydataregulatedinstructionsforthetechnicaloperationofinstallations.Thearticleanalyzestheinfluenceofthethicknessofthescaleofthescaleontheheatlossesoftheboilerandthe influence of the scale of the scale on fuel overload by amobile steam generator. Themathematicaldependenceofexcessfuelconsumptiononthethicknessofthescaleofthescaleisobtained.Ithasbeenshownthattheoccurrenceofscalecausesnotonlyeconomicbutalsoenvironmentalproblems.Itisanalyzedtheeffectofscumonfuelconsumptionbymobilesteamgeneratorunits(STU)inthearticle.Themethodsofremovalwhichaimtofueleconomyareoffered.
Keywords:mobilesteamgeneratorunits,thermalconductivity,fuel,heattransfer.
Introduction
Mobile steam generating units (MSGU) are used in the oil and gas industry for depleting wells, pipelines, oil and gas and other equipment with saturated steam and for other domestic and industrial needs. The analysis of operating conditions shows that their number in the oil and gas industry is shattered (unconcentrated in one territorial or regional region). Oil and gas administrations or other enterprises that operate wells, store or transport oil or gas have one, and in the best case, two steam generators.
Such organizations are not entirely advisable to create special technological systems for the preparation of feed water, at best at small distances to the site of operation of plants, use feed water

bodif
Pr
Op(stwaAcreq10frostethege
Re
Op
Stebowi
Thinnpapaspa w
Ththesta
FIG7–
iler units, wfferent in ph
roblemsta
peration of storage and aater, which ccording to quirements
0 μg-eq/kg. om 0.5 to 5eam generate formationnerator boil
ecentresea
perationdes
eam boilersiler is depicth lower bu
he outer coilner coil 4 arssageways ssageways ecifications
wall of the b
he two cylinde burner. Foand.
GURE1.Steam–hole,8–bur
which is cohysical and c
atement
steam generaccounting) is usually uthe physi
specified inAccording t.0 mg-eq/l, ting units op
n of scum, wler because
archandp
scriptionof
of the typected in figur
urner locatio
l 5 in the upre joined byof the loopof the hing14-3-460-7oiler’s inner
drical casingor the passa
mboiler:1–sprner,9–conn
onsumed tochemical pro
rating units leads to the
undergrouncal and ch
n the operatto a numbewhich is at
peration [1-which causes
of burning t
publication
ftheboiler
e PPUA are re 1 [1-4]. Bon.
per part endy a loop 2. Tp pipes 2. Tges 2. All c
75, the mater casing 6, se
gs 6 and 12age of air fro
park‐guard,2ector,10–pa
–
o heat the poperties for
in the fieldse forced cond natural sp
hemical proting instructr of source
t least 50 ti-4]. The wors excessive the coil.
nsanalysi
installed onBoiler is ver
ds with a flaThe opening The hole is coils are m
erial of pipeserves as the
of the boileom the annu
2–loop,3–coallet,11–spir
– 133 –
premises apower supp
s at a distannsumption opring water
operties, thtions [1-4], fs [5-8], theimes more trk of steam fuel consum
s
n mobile hertical, cylind
at spiral coilis covered covered wi
made of bois is steel 20
e passage of
er make a riular chambe
over,4–innerral,12–casin
nd other hply of steam
nce from theof physicallyr, water froe mentionefor which th hardness othan it is prgenerating
mption and
eat generatidrical with t
l 11. The enwith a lid 3
ith a lid 3, iler tubes 2. Space formflue gases.
ing chamberer to the tray
rcoilpipe,5–ngexternal,13
ousehold nm and hot wa
main basesy and chemim the rivered water dhe hardnessof natural urovided by units usingdecommiss
ng units. Thwisted spira
ds of the ou, which prowhich prov
28x3.5 accomed by cylin
r for passingy 10 there a
–outercoilpi3–wastepipe
needs, and tater boilers.
s of their disically untrears, lakes, podoes not ms should be lunprepared
the instrucg row watersioning of th
he scheme al tubes, dir
uter tubing 5ovides cutouvides cutoutording to Tndrical coils
g air from thare opening
ipe,6–casinge
they are
slocation ated feed onds, etc. meet the less than water is tions for leads to
he steam
of steam rect flow
5 and the uts at the ts at the
Technical 4, 5 and
he fan to gs 7 in its
ginternal,
The exhheating the mes
Connectboiler thgenerato
Scumfo
Generat
alkal
copp
iron
alum
scum
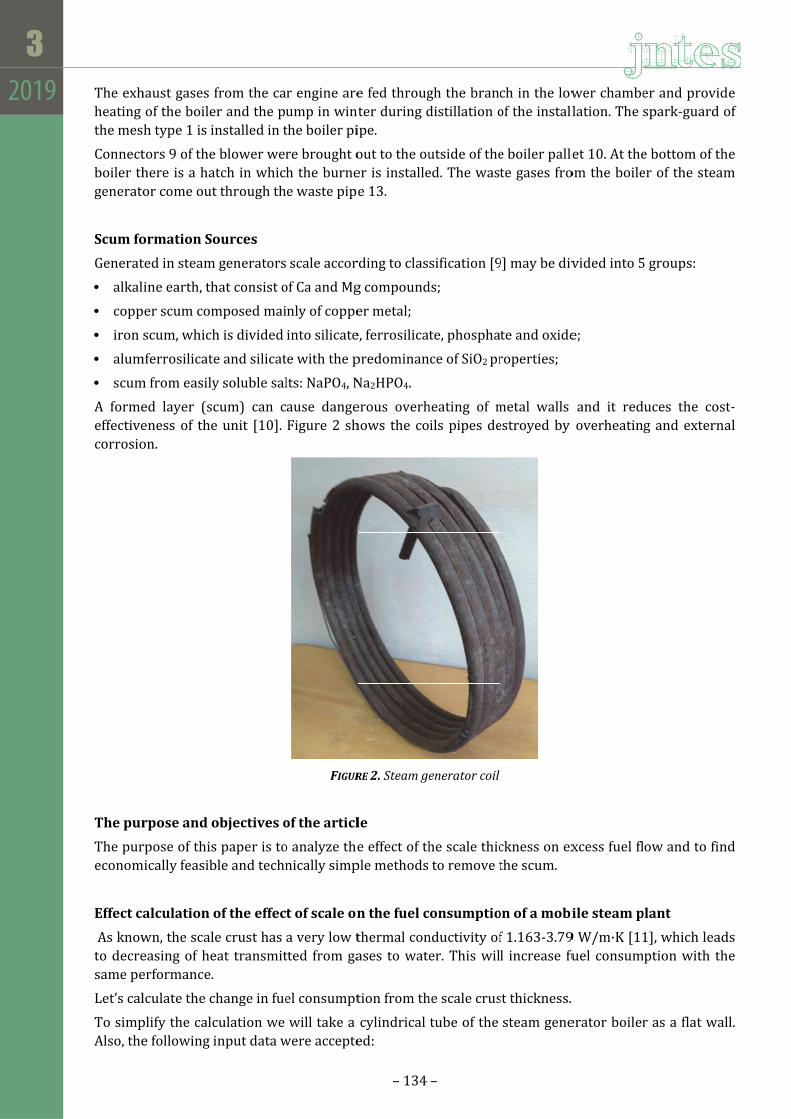
A formeeffectivecorrosio
Thepur
The pureconom
Effectсa
As knowto decresame pe
Let’s cal
To simpAlso, the
haust gases fof the boileh type 1 is i
tors 9 of thehere is a haor come out
ormationSo
ted in steam
ine earth, th
per scum com
scum, which
mferrosilicate
m from easily
ed layer (sceness of theon.
rposeando
rpose of thismically feasib
alculationo
wn, the scaleasing of heerformance.
lculate the c
plify the calce following i
from the caer and the pnstalled in t
e blower weratch in whict through th
ources
m generators
hat consist o
mposed mai
h is divided
e and silicat
y soluble sal
cum) can ce unit [10].
objectiveso
s paper is toble and techn
oftheeffec
e crust has eat transmit
change in fue
culation we input data w
r engine areump in winthe boiler pi
re brought oh the burnee waste pip
scale accor
of Ca and Mg
nly of coppe
into silicate
te with the p
lts: NaРO4, N
ause dangeFigure 2 sh
FIGUR
ofthearticl
o analyze thenically simp
tofscaleon
a very low ttted from ga
el consumpt
will take a were accepte
– 134
e fed througter during dipe.
out to the ouer is installee 13.
rding to clas
g compound
er metal;
e, ferrosilica
predominan
Na2НРO4.
erous overhhows the co
RE2.Steamge
le
e effect of thple methods
nthefuelc
thermal conases to wate
tion from th
cylindrical ed:
–
gh the brancdistillation o
utside of theed. The wast
sification [9
ds;
te, phospha
ce of SіО2 pr
heating of mils pipes de
eneratorcoil
he scale thicto remove t
consumptio
nductivity ofer. This wil
he scale crus
tube of the
ch in the lowof the install
e boiler pallete gases fro
9] may be div
te and oxide
roperties;
metal walls estroyed by
ckness on exthe scum.
onofamobi
f 1.163-3.79l increase fu
st thickness.
steam gene
wer chambelation. The s
et 10. At theom the boile
vided into 5
e;
and it redoverheatin
xcess fuel fl
ilesteamp
9 W/m·K [11fuel consum
erator boiler
er and provspark-guard
e bottom of er of the ste
5 groups:
uces the cog and exter
ow and to f
plant
1], which leaption with
r as a flat w
vide d of
the eam
ost-rnal
find
ads the
wall.

– 135 –
the temperature of the gases in the middle of the boiler is 1000-1300С [12], we accept 1120С;
the temperature of the gases at the outlet from the boiler is 160-180С [12], we accept 180С;
the water temperature at the entry to the boiler is 70С;
the coefficient of heat transfer from gases to the wall is α1 = 65 W/m2·K [2];
coefficient of heat transfer from wall to water α2 = 3500 W/m2·K [12];
the coefficient of thermal conductivity of the steel wall of the coil is λ1 = 46.5 W/m·K [2];
the coefficient of thermal conductivity of the scale crust λ2 = 1.163-3.79 W/m·K [11], we accept λ2 = 1.7 W/m·K;
lower heat of combustion of diesel fuel: Qn = 42700 kJ/kg;
coefficient of efficiency of a steam boiler: 80%.ПГ
Parameters of steam boiler cracking [3]:
outer tube diameter: 0.028 m; wall thickness: c = 0.0035 m;
average diameter of the external coil: 0.652 m;
average diameter of the internal coil: 0.568 m;
number of turns: 49.
When transferring heat through a multilayer cylindrical wall, which consists of layers, the linear heat transfer coefficient will be:
1
1 1 2 11
1
1 1 1ln
2
l ni
ii ni
kd
dd d
(1)
Estimated heat transfer coefficient of the heat exchanger:
lP
cep
kk
d (2)
where cepd = 0.0245 m.
Area of convective heat transfer, m2:
Н dL (3)
where: d – outer diameter of the coil tube, m; L – the length of coil tube, L = 187.7 m.
An average temperature pressure:
ln
m l
m
l
t tt
tt
(4)
where: ∆𝑡 – the highest temperature difference, С; ∆𝑡 – the lowest temperature difference, С;
Then: t = 369C.

– 136 –
Heat transmitted from gases to water considering the absence of scum:
Q Hk t [J/s] (5)
Fuel overrun:
ПГ
QВ
Q
[kg] (6)
Calculation for a scum of 0...2 mm is carried out using the Mathcad environment. The calculation results are given in table 1.
TABLE1.Calculationresultsoftheeffectofscumthicknessonfuelconsumption
Scumthickness,
mm
Heattransfercoefficient,W/(m2·K)
Lossofheat,J/s
Excessivefuelconsumption,
kg/h
Excessivefuelconsumption,
%
0 72.095 0 0 0
0.1 71.722 2274.362 0.24 0.518
0.2 71.349 4547.909 0.479 1.035
0.3 70.976 6820.756 0.719 1.552
0.4 70.603 9093.022 0.958 2.069
0.5 70.23 11364.824 1.198 2.586
0.6 69.857 13636.287 1.437 3.103
0.7 69.485 15907.534 1.676 3.62
0.8 69.112 18178.694 1.916 4.137
0.9 68.74 20449.895 2.155 4.654
1 68.367 22721.271 2.395 5.17
1.1 67.994 24992.958 2.634 5.687
1.2 67.622 27265.093 2.873 6.204
1.3 67.249 29537.821 3.113 6.722
1.4 66.876 31811.285 3.352 7.239
1.5 66.503 34085.634 3.592 7.756
1.6 66.129 36361.022 3.832 8.274
1.7 65.756 38637.604 4.072 8.792
1.8 65.382 40915.542 4.312 9.311
1.9 65.008 43194.998 4.552 9.829
2 64.634 45476.144 4.793 10.348
The results of calculations prove that there is significant effect of scum on fuel consumption, even with its insignificant thickness it leads to significant overfuel, especially in large plants where many steam installations are in use.
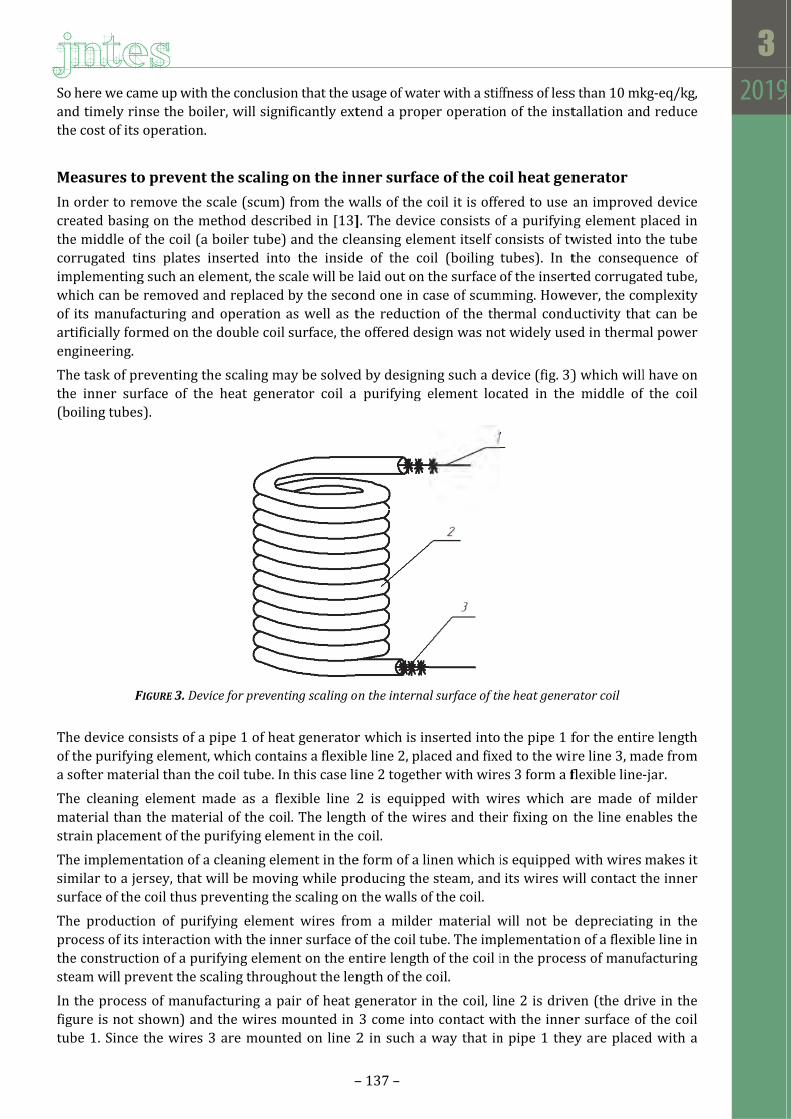
So anthe
Me
In crethecorimwhof arten
Ththe(bo
Thof a s
Thmastr
Thsimsu
Thprtheste
In figtub
here we camd timely rine cost of its
easuresto
order to reeated basinge middle of rrugated tin
mplementinghich can be its manufac
tificially formgineering.
he task of pre inner suroiling tubes
FI
he device conthe purifyin
softer mater
he cleaning aterial than rain placeme
he implemenmilar to a jerface of the
he productioocess of its ie constructieam will pre
the processgure is not sbe 1. Since
me up with tnse the boileoperation.
opreventt
move the scg on the methe coil (a bns plates in
g such an eleremoved ancturing andmed on the
reventing thrface of the ).
FIGURE3.Devic
nsists of a png element, wrial than the
element mathe materia
ent of the pu
ntation of a crsey, that wcoil thus pr
on of purifyinteraction wion of a purievent the sca
s of manufashown) and the wires 3
the conclusioer, will sign
thescaling
cale (scum) ethod describoiler tube)nserted intoement, the scnd replaced operation double coil
e scaling maheat gener
ceforprevent
pipe 1 of heawhich contacoil tube. In
ade as a fleal of the coiurifying elem
cleaning elewill be movin
eventing the
ying elemenwith the innifying elemealing throug
acturing a pathe wires m
3 are mount
–
on that the uificantly ext
gontheinn
from the wibed in [13] and the cle
o the insidecale will be by the secoas well as tsurface, the
ay be solvedrator coil a
tingscalingo
at generatorains a flexibln this case li
exible line 2il. The lengtment in the
ement in theng while proe scaling on
nt wires froner surface oent on the enghout the len
air of heat gmounted in ted on line 2
– 137 –
usage of watetend a prop
nersurfac
walls of the c]. The deviceansing eleme of the colaid out on t
ond one in cthe reductioe offered des
d by designipurifying e
ntheinterna
r which is inle line 2, plaine 2 togeth
2 is equippth of the wircoil.
e form of a lioducing the the walls of
om a milderof the coil tuntire lengthngth of the c
generator in3 come into2 in such a
er with a stifer operation
ceoftheco
coil it is offee consists o
ment itself coil (boiling the surface ase of scum
on of the thsign was no
ng such a deelement loc
lsurfaceofth
nserted into aced and fixeer with wire
ped with wires and thei
inen which i steam, andf the coil.
r material wube. The imp of the coil i
coil.
n the coil, lio contact wway that in
ffness of lessn of the inst
oilheatgen
ered to use of a purifyin
onsists of twtubes). In tof the insert
mming. Howeermal condt widely use
evice (fig. 3)cated in the
heheatgener
the pipe 1 fed to the wires 3 form a f
res which air fixing on
is equipped its wires w
will not be plementatioin the proce
ne 2 is drivith the inne
n pipe 1 the
s than 10 mktallation and
nerator
an improveng element pwisted into the consequted corrugatever, the co
ductivity thaed in therma
) which wille middle of
ratorcoil
for the entirre line 3, maflexible line-
are made othe line ena
with wires will contact t
depreciatinon of a flexibess of manuf
ven (the driver surface ofey are place
kg-eq/kg, d reduce
ed device placed in the tube
uence of ted tube, mplexity
at can be al power
l have on f the coil
re length ade from -jar.
of milder ables the
makes it the inner
ng in the ble line in facturing
ve in the f the coil
ed with a

– 138 –
tension, then in contact with the inner surface of the pipe 1, if the scaling is possible it will be removed from the surface and washed with a steam-water mixture in the coil. When steam is open the scale in the form of a slime will be taken from the tube 1 of the coil.
An offered device for preventing the scaling on the inner surface of heat generators coils will allow to reduce the cost of manufacturing steam.
Conclusions
Basing on the performed calculations we came up with the decision and an influence pattern of the scale layer on fuel overexposure by steam generating units. There was also offered the device for minimizing the effect of scale on the boiler performance as well as on the cost of producing steam.
A device is proposed to minimize the effect of scum on boiler performance and cost of steam production. Application of the proposed device will save up to 10.5% of fuel (approximately 121.5 kg/h).
It is also important that the economical fuel consumption will also reduce the environmental load.
Thus, the problem discussed in this article is quite relevant for enterprises in the oil and gas industry.
References
[1] Ustanovka promyislovaya parovaya peredvizhnaya PPUA-1200/100. Tehnicheskoe opisanie i instruktsiya po ekspluatatsii (25.00.00.000 TO), 1989, 72 s.
[2] Ustanovka promyislovaya parovaya peredvizhnaya PPUA-1600/100. Rukovodstvo po ekspluatatsii (TU 26-02-987-85), OAO «Nalchikskiy mashinostroitelnyiy zavod» Nalchik : KBR, 2005, 73 s.
[3] Parovaya peredvizhnaya ustanovka PPU-3M : Katalog – M. : Nedra, 1971, 43 s.
[4] Baybakov N.K., Termointensifikatsiyadobyichinefti, N.K. Baybakov, V.A. Bragin, A.R. Garushev, I.V. Tolstoy. M.: Nedra, 1971, 280 s.
[5] Ochistka kotlov i teploobmennikov [Elektron. resurs]. – Rezhim dostupu : http://tehgidro.com.ua/rus/truby.
[6] Okocha A.I., DovIdnikpopalivuImastilnihmaterIalah. A.I. Okocha, Ya.Yu. BIlokon. K. : Urozhay, 1988, 184 s.
[7] Kolesnik P.A., Materialovedenienaavtomobilnomtransporte. M.: Transport, 1987, 271 s.
[8] Instruktsiya po analizu vodyi, para i otlozheniy v teplosilovom hozyaystve. M.: "Energiya", 1967.
[9] Malkina N.N., Fiziko‐himicheskieprotsessyivparovomtsikleelektrostantsiy. M.: "Energiya", 1997.
[10] Bolshayasovetskayaentsiklopediya, tom 17 pod redaktsiey A.M.Prohorova. M.: "Sovetskaya Entsiklopediya", 1974.
[11] Pavlov K.F., Romankov P.G., Noskov A.A., Primeryi i zadachi po kursu protsesov i aparatov himicheskoytehnologi. Uchebnoe posobie dlya vuzov. L.: Himiya, 1987, 576s.
[12] Chastuhin V.I., Teplovoyraschetpromyishlennyihparogeneratorov. Kiev: "Vischa shkola", 1980.
[13] A.S. 33537 SSSR, klas 13a,30. Prisposoblenie dlya preduprezhdeniya otlozheniya nakipi na stenkah kipyatilnyih trubok parovyih kotlov. P. N. Myasoedov. - # 128296; zayavl. 04.05.1933g.; opubl.31.12.1933 g.
– 139 –
Valerii DESHKO
Iryna SUKHODUB
Olena YATSENKO
National technical university of Ukraine “Igor Sikorsky Kyiv Polytechnic Institute”, Ukraine
INTERMITTENTHEATINGSYSTEMOPERATIONMODESFORRESIDENTIALSPACES
Abstract: In thispaper themathematicalmodelofanapartmentwas created to investigate the impactofintermittent heatingmodes on energy consumption. Also, actual temperature profileswere presented forweekdayandweekend.Comparedwithcontinuousheatingmode,theenergyconsumptionwith intermittentheatingoperationislessby16.4%.
Keywords:energysaving,intermittentheating,buildingenergymodelling,EnergyPlus.
Introduction
In recent years, the need to reduce natural resources as well as energy consumption has led to the need to explore new aspects of energy efficiency in residential and public buildings. The regulations operating in many European countries follow two strategies, which typically include increasing of building envelope thermal insulation and reducing of heating devices using time during the day [1].
One of the most effective ways to save heat in providing comfortable temperature conditions is the use of intermittent heating system operation mode. Such mode reduces the heating system temperature and load during non-working hours. The main reason for the lack of its wide distribution in buildings is the low level of disclosure in the literature, as well as a small number of practical results of the introduction. Scientifically substantiated recommendations that relate to rational choice of the intermittent heat mode with its specifics is clearly not enough. This work is aimed at presenting practical data on the analysis of intermittent heating mode for residential spaceand confirming its effectiveness.
The daily mode of the intermittent heating system is divided into three periods:
the beginning of the heating system (heating-up period), during which the room temperature rises from the minimum allowable to the required internal temperature;
period of steady mode, during which indoor air temperature is maintained;
the termination of the heating system (cooling period), during which the indoor temperature is reduced to the minimum allowable.
In work [2] various options of intermittent heating mode are considered and economies for different heat load schedules are determined.
The heat flow during the heating of the room is much more than during the steady mode. Therefore, the value of the additional heating system capacity in the normal and economic modes depends on the following indicators [3]:
amount of time required to achieve a comfort internal temperature;
the value of the reducing internal temperature relative to the comfort internal temperature;
heat-storage capacity of the building;
air exchange during heating-up period.

In [4], tconditioperformbuildingenergy-soperatin
An analapproacapproaceconombuildingapproprmode inpaper [8used inconditio
It is knoheating intermitaccountcharacteenergy cpaper, E
Buildin
The exisis shownbedroomHeat froheat in envelopheat excto other
the energy ons is optim
mance of the gs with low saving apprng costs. The
ysis of the ches taking ch. Accordin
mic efficiencyg envelope riate to use n buildings w8] the impo conditions
ons of heat s
own that thsystem is
ttent heatint the heat eristics of thconsumptio
EnergyPlus,
ngcharact
sting apartmn in figure 1ms, kitchen, om the radia
itself, and ape constructchange due r apartments
FIGURE1
consumptiomized. It is a
heating sysheat-storag
oach that we efficiency o
intermitteninto accoun
ng to [7], thiy. Quasi-statconstructiofor energy
with relativertance of dy
s of intermsupply termi
he speed of not regulat
ng mode catransfer r
he external won analysis u
a whole-bui
teristicsan
ment located1. According
bathroom. ator enters ta part transtions and wito the idents.
1.Thermalan
on of the coalso establisstem in the hge capacity
would ensureof the optima
nt heating synt various inis calculatiotionary appr
ons, but onlconsumptioely light conynamic charittent heatiination is als
achieving oed by normn be calculresistance owalls and inusually usesilding energ
ndheating
d in Kyiv regg to the activThe heat trathe room bysfers to the indows occutity thermal
ndoccupancy
– 140
ombined heshed in thisheating-up pare achievee maximumal intermitte
ystem opernfluential fa
on method croach does ly its heat on calculationstructions racteristics ing is showso investiga
of the comfoms. Therefor
ated using of the bui
nternal parts dynamic apgy simulation
gmodes
gion was chvities it wasansfer in apy radiation a
internal anurs by convconditions
zoning:circu
–
eat supply ss paper thatperiod. At th
ed. Thereform thermal en
ent heating m
ation modeactors. One can only pronot take inttransfer re
on during inand in buildof construc
wn. The proated in pape
ort internal re, the lenga dynamic lding constitions. Modepproaches tn software,
hosen as an s divided in partment rooand convectnd external vection and
is accepted
ulationarea,b
system undt it is neceshe same time, it is nece
nergy savingmode in artic
efficiency iof these me
ovide an appto account thsistance. Th
ntermittent dings with ation materia
ocess of coor [9].
temperaturgth of the tr
approach. tructions aern specializto achieve hwas used fo
object of studifferent zooms works tion. The airconstructiothermal confor walls, ce
bedrooms,kit
der intermitssary to ens
me, the greatessary to degs at minimucles [2, 5, 6]
is carried oethods is quproximate e
the accumulhis calculatheating sys
a large glazials for buildoling the b
re at the beransient prThis appro
as well as zed softwar
high-quality or building m
udy. The apone types: ci
as the followr accumulateons. Heat tranductivity. Teilings and f
tchen,bathroo
ttent operatsure maximtest savings evelop such um capital a is researche
out in differuasi-stationestimate of ation abilityion method
stem operatng area. Butding envelop
building in
eginning of ocesses in ach takes i
the dynamre for buildin
results. In tmodel creati
artment’s pirculation arwing principes a part of ansfer throuThe absencefloors adjac
om
ting um for an
and ed.
ent ary the
y of d is tion t in pes the
the the nto mic ngs this ion.
plan rea, ple. the ugh e of ent

Thbuconsys
Thstr
TAB
Ex
Exan
In
Eaheprthe
Th
In gasp
he model wauilding enernstructions stems, inclu
he main dimructures are
BLE1.Buildin
Construction
xterior walls
xterior windond glazed doo
nternal partit
ach zone in ating sourcoduction dee boiler at it
he apartmen
addition to ins from peoecify schedu
as created irgy simulat
and thermauding heatin
mensional pe given below
ngconstructio
ntype
ows ors
tions
apartment ce, which isepending onts discretion
nt's heating s
the technicople, lights aules for inte
in DesignBution. The ual interactiog and ventil
arameters aw in table 1.
onsmodelling
is conditions gas boilern the internn.
system crea
cal systems, and electric rnal parame
–
uilder softwused softwaons betweenlation system
and constru.
gparameters
Parame
ned. The bur. The boileal and exter
ted in Desig
the EnergyPequipment
eters and tec
– 141 –
ware that useare takes in zone heat ms [10].
uction mate
eters
uilding heatier is equipprnal temper
gnBuilder so
Plus apartmas well as z
chnical syst
es EnergyPlnto accounand mass b
erials of the
ing system ped with arature. The
oftware give
ment model tzone air exchtems operati
lus engine tnt thermal balance and
e apartment
Cr
is water-bautomatics, digital disp
en in figure 2
takes into achange. The pion [10].
to perform inertia of technical b
t external e
rosssection
ased with inwhich set
play allows t
2.
ccount interprogram pro
dynamic building
building’s
enclosing
ndividual the heat to adjust
rnal heat ovides to

The temmaintaincriteria temperasurfaces
The pro
mperature ned at 16-2for the poss
ature lowers [11].
grammed w
mode for i22C. In facsible duratioing is the r
weekdays an
FIGURE
inside air tct, heating mon of the heequirement
nd weekends
– 142
E2.Heatingsy
temperaturmode correat supply in
t that the co
s temperatu
–
ystemdiagram
re during tesponds to nterruption ondensate d
ure modes ar
m
he heating the occupaand the asso
does not fal
re shown in
period in ancy scheduociated withll on the int
n histograms
apartmentule. One of h it internal ternal build
s in figure 3.
t is the air
ding

FIGcom
An
In (Dkitget
Th16chintthedeno
A msofallinttheacttra
GURE3.Tempemfortablemo
nalysisoft
order to anS1923, tem
tchen. The tt temperatu
he graphs (fi6C is not ac
aracteristicsternal tempe fact that thpending on
oted that the
mathematicftware. Thisows to taktermittent he following tual solar raansmitted so
a)
b)
eraturesetpoode,3–daytim
theinterm
nalyze actuamperature m
emperatureure profile gr
igs. 4 and 5)chieved thers of buildinerature in the thermos
n the internae apartment'
cal model ofs model mor
ke into accoheating mod
results shoadiation on olar radiatio
ointsforboilemeeco‐mode
mittenthea
al indoor airmeasuremenes were colleraphics show
) show that tre at all. Thng envelopethe bedroomtat is locateal temperat's heating sy
f the buildinre accuratel
ount outdoode for the saown in the f
the analyzeon rate are a
–
rprogramme
atingsyste
r temperatunt accuracy ected with 5wn in figure
the rooms this is largelyes construct
m 1 and in thed in bedrooture on therystem needs
ng thermal rly describes
or temperatame outdoorfigures 6 and day and th
also given.
– 143 –
erforweekday
emoperati
ure profile tebetter tha
5-minutes ines 4 and 5.
temperaturey affected otion materihe kitchen eom 2. In factrmostat. Ths hydronic b
regime has bs the heat-inture changer air temper
nd 7. To takhe IWEC so
ays(a)andwe
onmodes
emperature n ±0.5C) wntervals. Th
e is not fall bn outside teials. We alsexceeds the t, the boilererefore, bas
balancing.
been also denertial propes over timratures in th
ke into accoular radiation
eekends(b):1
temperaturwere placedus, practica
below 19.5Cemperature so see on t
set temperar automaticssed on the g
eveloped userties of bue. Thus, thehe EnergyPlunt the diffen data, grap
1–nighteco‐
re/humidityd in bedroo
al research h
C. So prograas well as
the graphs ature. This s modulate tgraphs, it sh
sing the Eneuilding envee simulatiolus softwareference betwphs of windo
‐mode,2–
y loggers oms and helped to
ammable dynamic that the is due to the flow, hould be
ergy Plus lope and n of the e yielded ween the ows total

FIGURE4.In
FIGURE5.In
ndoorandout
ndoorandout
– 144
tdoorairtem
tdoorairtem
–
mperatureprof
mperatureprof
filesforawee
filesforawee
ekday
ekend

a)
c)
FIGwe
a)
c)
FIGwe It c
Towe
Temperature, °C
Temperature, °C
Temperature, °C
Temperature, °C
GURE6.Energeekday
GURE7.Energeekend
can be noted
o analyze theere created.
16
17
18
19
20
21
22
23
0:00 3:00
16
17
18
19
20
21
22
23
0:00 3:00
16
17
18
19
20
21
22
23
0:00 3:00
16
17
18
19
20
21
22
23
0:00 3:00
gyPlussimula
gyPlussimula
d that therm
e heating sys
6:00 9:00 1
Tim
Bedro
6:00 9:00 1
Tim
Kitc
6:00 9:00 12
Tim
Bedroo
6:00 9:00 1
Tim
Kitch
ationresultso
ationresultso
mal inertia is
stem load of
12:00 15:00 18:
me
om 1
12:00 15:00 18
me
hen
2:00 15:00 18:0
me
om 1
12:00 15:00 18
me
hen
–
of indoorair
of indoorair
s more pron
f the entire a
:00 21:00
:00 21:00
00 21:00
:00 21:00
– 145 –
b)
d)
temperature
b)
d)
temperature
nounced in r
apartment d
16
17
18
19
20
21
22
23
0:00
Temperature, °C
0
50
100
150
200
0
W
16
17
18
19
20
21
22
23
0:00
Temperature, °C
0
20
40
60
0:0
W
profiles(a‐c)
profiles(a‐c)
eal schedule
during the sa
0 3:00 6:00
:00 3:00 6:0
Windows Tot
Bedroom 2
0 3:00 6:00
00 3:00 6:00
Windows Tota
Bedroom 2
)andsolarra
)andsolarra
es in figures
ame days, th
9:00 12:00 1
Time
Bedroom 2
0 9:00 12:00
tal Transmitted S
Kitchen
9:00 12:00 1
Time
Bedroom 2
9:00 12:00 15
l Transmitted Sol
Kitchen
radiationrate
radiationrate
s 4 and 5.
he graphs in
15:00 18:00 21
15:00 18:00 2
Solar Radiation Ra
n Bedro
15:00 18:00 21
5:00 18:00 21:00
lar Radiation Rat
Bedroo
e(d) fora
e(d) fora
n figure 8
1:00
1:00
ate
oom 1
:00
0
e
m 1

a)
b)
FIGURE8.loadfora
Due to rday (figpresenc
a)
.EnergyPlussaweekday(a)
regulation o. 9). Some c
ce of the byp
0
200
400
600
800
1000
1200
1400
1600
1800
2000
1:00
W
0
200
400
600
800
1000
1200
1400
1600
1800
2000
1:00
W
0
0,01
0,02
0,03
0,04
0,05
0,06
0,07
0,08
1:00
Mass flow rate, kg/s
simulationre)andweeken
f heating syschanges in tpass in the E
2:00
3:00
4:00
5:00
1:00
2:00
3:00
4:00
5:00
2:00
3:00
4:00
5:00
Boiler Mass Flo
esultsofapartnd(b)
stem heat cathe heat carnergyPlus h
5:00
6:00
7:00
8:00
900
H
5:00
6:00
7:00
8:00
He
5:00
6:00
7:00
8:00
900
ow Rate
– 146
tmentaverag
arrier temprier mass fl
heating syste
9:00
10:00
11:00
12:00
TimHeating Rate
9:00
10:00
11:00
12:00
Ti
eating Rate
9:00
10:00
11:00
12:00
TBoiler outle
–
geindoorair
erature andlow rate areem model.
13:00
14:00
15:00
16:00
meInternal
13:00
14:00
15:00
16:00
me
Internal
13:00
14:00
15:00
16:00
Timeet temperature
temperature
mass flow re not visible
17:00
18:00
19:00
20:00
temperature
17:00
18:00
19:00
20:00
temperature
16:00
17:00
18:00
19:00
2000
Boiler
dependingon
rate is differe on the gra
21:00
22:00
23:00
0:00
20:00
21:00
22:00
23:00
0:00
20:00
21:00
22:00
23:00
r Inlet Tempera
nheatingsyst
rent during phs due to
16
17
18
19
20
21
22
23
0:00
°C
16
17
18
19
20
21
22
23
0:00
°C
53
54
55
56
57
58
59
60
61
62
63
0:00
Temperature, °C
ature
tem
the the

FIGwe
An
WiDeEnmosta
Acaphis
FIGmo
Monthly energy consumption for
b)
GURE9.Energyeekend(b)
nalysisoft
ith the coeterminationnergyPlus. Aode. The actandard heat
TABLE2.A
Type
Constan
Intermi
ccording to tartment zonstogram in f
GURE10.Monodeling
0,0
0,0
0,0
0,0
0,0
0,0
0,
0,0
0,0
0,0
0,0
0,0Mass flow rate, kg/s
0
20
40
60
80
100
120
140
160
180
200
220
ygy
pheatim
g, kWh
gyPlussimula
theinterm
ntinuous an of energy
Apartment entual energy ting degree-d
Apartmenten
ofheatings
nt mode, kWh
ttent mode, k
the modelinnes with cofigure 10.
nthly intermit
064
065
066
067
068
069
,07
071
072
073
074
075
1:00
2:00
300
Boiler M
tionresultso
mittenthea
adjustment y consumptnergy consuconsumptiodays.
nergyconsum
ystemopera
h
kWh
ng results inntinuous an
ttentand con
3:00
4:00
5:00
6:00
Mass Flow Rate
–
ofheatcarrie
atingsyste
of heatingtion reduce
umption invon during th
mption
ationmode
n Energy Plund intermitt
nstantheating
7:00
8:00
9:00
10:00
e Boile
– 147 –
ertemperatur
emmodesm
g system, e provided
vestigated use heating pe
Ene
48
40
us the amoutent heating
ng system ene
11:00
12:00
13:00
14:00
Timeer outlet tempe
reandflowra
modeling
considerabwith the
sing constaneriod was co
ergyPlus
805.56
019.44
unt of consug system op
ergy consump
14:00
15:00
16:00
17:00
1800
erature
ateinboilerf
results
le savings dynamic ap
nt mode, as orrected con
Actual
4
umed heat eration mod
ptionaccordi
18:00
19:00
20:00
21:00
Boiler Inlet Te
foraweekda
can be apartment mwell as inte
nsidering ac
(corrected)
–
824.92
energy for de are show
ing to theEn
5
5
5
5
5
5
5
6
6
6
6
22:00
23:00
0:00
emperature
Bedroom
Bedroom
Kitchen in
Bathroom
Hall int
Bedroom
Bedroom
Kitchen c
Bathroom
Hall cons
ay(a)and
achieved. model in ermittent ctual and
different wn in the
nergyPlus
3
4
5
6
7
8
9
0
1
2
3
Temperature, °C
m 1 int
m 2 int
nt
m int
m 1 const
m 2 const
const
m const
t

– 148 –
Conclusions
The availability of practical data of indoor temperature profile helped to see the flaws in the actual operation of heating system and to compare the actual results with the simulated ones. The results of energy modeling in EnergyPlus software are similar to actual apartment energy consumption for heating.
Created dynamic model helps to analyze energy saving potential of changes in engineering systems including various options of intermittent heating mode. Therefore using modern specialized software for dynamic buildings energy consumption analysis we can achieve high-quality results.
According to the EnergyPlus simulation results energy saving potential of intermittent heating mode for considered apartment is 16.4%.
References
[1] Nannei E., Tanda G., Ananalysisofenergyconsumptionandthermalcomfortinbuildingsindailyintermittentheating, Dipartimento di Ingegneria Energetica Università degli Studi di Genova, pp. 1248-1259.
[2] Дешко В.І., Моделювання режимів опалення приміщень. В.І. Дешко, І.Ю. Білоус, Енергетика: економіка, технології, екологія, 2016, No. 3, С. 97-104.
[3] Дацюк Т.А., Моделированиетепловогорежимажилыхпомещенийприпрерывистомотоплении. Т.А. Дацюк, Ю.П. Ивлев, В.А. Пухкал, Современные проблемы науки и образования: электронный научный журнал, 2014, No. 5, Библиогр.: 6 назв.
[4] Баласанян Г.А., Моделирование режима прерывистого отопления комбинированной системытеплоснабжения с тепловым насосом. Г.А. Баласанян, А.А. Климчук, М.Б. Миняйло, Вестник Нац. техн. ун-та "ХПИ" : сб. науч. тр. Темат. вып. : Энергетические и теплотехнические процессы и оборудование. Харьков : НТУ "ХПИ", 2015, No. 17 (1126), С. 97-102.
[5] Анисимова Е.Ю., Энергоэффективностьтепловогорежимазданияприиспользованииоптимальногорежима прерывистого отопления. Вестник ЮУрГУ. Серия "Строительство и архитектура" : науч. журн, 2012, No. 38, Вып. 15, С. 55-59.
[6] Панферов В.И., Об оптимальном управлении тепловым режимом зданий. В.И. Панферов, Е.Ю. Анисимова, А.Н. Нагорная, Вестник ЮУрГУ. Серия «Энергетика» : науч. журн, 2007, Вып. 8, No. 20 (92), С. 3-9.
[7] Куценко А.С., Анализэнергоэффективностипрерывистогорежимаотопленияздания. А.С. Куценко, С.В. Коваленко, В.И. Товажнянский, Журнал "Ползуновский вестник", 2014, No. 4-1, С.247-253.
[8] Vychtikov Yu., Saparev M., Chulkov A., Analyzing energy consumption while heating one‐layer buildingenvelopesinconditionsofintermittentheating, MATEC Web of Conferences 106, 06013 (2017).
[9] Голишев О.М., Дослідженняпроцесуостиганнябудівлівумовахприпиненнятеплопостачання. О.М. Голишев, А.О. Голишев, Д.В. Михалків, Е.В. Серебреніков, Вісник Національного університету "Львівська політехніка". Теорія і практика будівництва, 2016, No. 844, С. 58-63.
[10] The official website EnergyPlus Energy Simulation Software. – Website: https://energyplus.net/sites/default/files/pdfs/pdfs_v8.3.0/InputOutputReference.pdf
[11] Табунщиков Ю.А., Математическое моделирование и оптимизация тепловой эффективностизданий. Ю.А. Табунщиков, М.М. Бродач. М.: АВОК-ПРЕСС, 2002, 194 с.

– 149 –
Anastasiia PAVLENKO
Dniprovskii state technical university, Ukraine
CALCULATIONOFPROCESSESOFMELTINGMETALPARTICLES(INOCULATOR)INAONE‐DIMENSIONALPROBLEMSTATEMENT
Abstract:The article presents the results of research of thermophysical peculiarities obtaining volumetricamorphous structures in metals and alloys. This technology differs mainly the realization internal heatremovalbymeansof localheat sink (inoculator).Amathematicalmodelofmelting inoculator inmelts foroptimizing the process of obtaining massive amorphous structures, which allows to reduce time ofexperimental research and material resources to create massive amorphous structures. Mathematicalmodelingofprocessesheatandmass transfer inoculator inmeltsallowsyou to identifypeculiaritiesof thetechnological process, and establish influence inoculator on the degree of amorphizationmelt.The resultsprovideaneffectiveassessmentof the intensityofheat transferduring thecastingprocess,whichmakes itpossibletoestimateandpredicttheabilityofalloystotheamorphizationofthestructure.
Keywords: heat andmass transfer, amorphous structure, inoculator, thermal conductivity,mathematicalmodel,cooling,melting
Introduction
Consider the process of melting solid inoculator having a melting point ,TLt completely immersed in
molten metal with a given temperature .pt In reality, the initial temperature inoculator 0t always less
temperature of solidification metal pSt and therefore, initially formed on its surface shell of solid
metal. Further progress depends on the melting of the relationship between temperature values ,TLt
,pSt pt [1]. In I inoculator period when immersed in the molten metal at its surface formed shell of
solid metal. The heat coming from the melt by convection and solidification of metal on the surface, is spent on heating and melting inoculator shell melt. End of period determined by moment of complete melting of the shell. In the II period the solid inoculator heated to the melting point T
Lt and direct
contact with the liquid alloy. In III period inoculator begins to melt and liquid phase body dissolved in the melt.
Mathematicalmodel
On the surface inoculator the formation of solid metal shell with further melting of the shell. This period is described melting heat conduction equations for two-layer body, which includes the equation for the material body ( 0 ir R ) and for shell melt ( i mR r Z ) at 1 2:
( , ) ( , )1( ) ( ) ( ) , 0
( , ) ( , )1( ) ( ) ( ) ,
i ii i i i
m mm m m i m
t r t rc t t r t r R
r r r
t r t rc t t r t R r Z
r r r
(1)

– 150 –
Boundary conditions at 1 2:
on the axis of symmetry of the body ( 0r ) given the symmetry condition [1]:
(0, )
0itr
(2)
at the interface between the material inoculator and the shell melt ( kr R ) given boundary
conditions IV:
, ,( ) ( )
, ,
i i m mi m
i i m i
t R t Rt t
r r
t R t R
(3)
of heat exchange condition on the boundary of frozen shell melt – melt ( mr Z ):
0 2 1 2
( ),( )( ) ( ) ( )
( ( ), ) , 0 ( ) , , ( )
m mmm m m mp V
L m i
t ZdZt Q t t t
d r
t z t z z Z R
(4)
The initial conditions:
1 1
1 2
, , , 0i i i
m i
t r r r R
Z R
(5)
where 1 2, ,i r a solution to the problem of heat conduction material inoculator at 1 2.
Three period ends when the shell melts completely melt, formed on the surface of the body. Duration of the third period – 3.
Mathematicalmodel
Process melting material inoculator begins after heating its surface to the melting point. Thus, we solve the problem of heat conduction for a body with III kind boundary conditions at the outer edge ( ir Z ) for calculated area. Heating the body surface is described by the heat equation for the material
inoculator at 1 2 2:
( , ) ( , )1( ) ( ) ( ) , 0i ii i i i
t r t rc t t r t r Z
r r r
(6)
Boundary conditions at 1 2 2:
on the axis of symmetry inoculator ( 0r ) symmetry conditions:
(0, )0it
r
(7)
of heat exchange condition on the boundary surface inoculator – melt ( kr Z ):
,( ) ( ) ,i ii m p i i
t Zt t t Z
r
(8)

Th
wh
pe
Afteq
Co
Th
wh
de
Fope
Thto in dupr
FIGino
he initial con
here 1,i r
riod 3, at
ter heating uation for m
onditions on
he initial con
here ,i r
scribed in
1 2 3
ur periods riod – 4
he estimateddetermine graphs in fi
ue content inoperties of t
GURE1.Graphoculator1mm
nditions:
1 2 3 s
1 2 3
the surfacematerial ingo
the bounda
nditions:
1 2 3
the heatin
4 .п The d
considered
4 4 .п пl
d model wasthe impact igures 1-2. An the elementhe alloy.
0
h changesmam
1
,
(i
i
t r
Z
solution to
3. The durat
e of the bodot (6) at
ary of heat e
( )
(
i
i i
t Q
t Z
1,it r
4 ,п a sol
ng period duration of th
complete w
s made usinginoculator o
As a model ant prone to a
0-20 – initial t
assof theall
–
1 2 3
1 2 3 )
the problem
tion of heati
dy begins th
1 2 3
xchange sur
( )
), ,
ii m
iL
dZQ
d
t
2 3 4п
ution to th
surface of he melting m
with the full
g the prograon the degrealloy was chamorphizati
temperature i
loy Сu45Ti35Zr
– 151 –
1,i
i
r
R
m of heat co
ing of the bo
he process o
4 .n
rface of the
( )
0 ,
im p L
i i
t t
Z R
1,i r
he problem
the matermaterial bod
l melt mate
amming langee of amorp
hosen alloy tion, Zr [2, 3
inoculator acc
r20 in theme
2 3 , 0
onduction m
ody surface t
of melting, w
body – melt
1 2
( ) ii
tt
2 3 4 ,п
m of heat c
rial inoculady – 4 .пl
rial inocula
guage BASICphization stthat has a g]. In table 1
cording 0С an
elting liquida
ir Z
material inoc
to the meltin
which is de
t ( ir Z ):
3 4
( ),i
n
Z
r
, 0 ir Z
onduction
ator to the
tor. The du
C, calculationructure. Theood tendencare researc
nd 20С
alloyduring t
culator desc
ng point –
escribed by
material in
e melting p
uration of th
ns obtainede calculationcy to amorp
ched thermo
the initialdia
(9)
cribed in
4 .п
the heat
(10)
(11)
noculator
point at
he fourth
d allowed n results
phization ophysical
ameterof

FIGURE2inoculato
TABLE1.
Alloy
Сu45Ti35
Conclu
1. Add addit
2. Impatechnremo
3. At thhypo
Referen
[1] PavleMeta
.Graph chanor2mm
Thermophysi
y Themtempe
°
5Zr20 10
usion
inoculator tional active
act inoculatonology diffeoval.
he time of othermia eve
ces
enko A.M., Usallurgical and
0-20 –
ngesmassof
icalpropertie
meltingerature,°С
tam
090
leads to the melt crysta
or manifesters mainly t
solid particen in the eve
senko B.O., Kd Mining Indu
initial temper
thealloy Сu4
esinvestigated
Thetransititemperaturemorphousst
K
410
e implemenallization ce
ted in the inthe implem
cles inoculaent of signifi
Koshlak H.V., Austry, 2014, N
– 152
rature inocula
45Ti35Zr20 in t
dalloy
ioneintate,
Dethk
ntation of tnters.
ncreasing smentation of
ator contactficant overhe
AnalysisofthNo. 2, pp. 15-2
–
ator according
themelting l
ensityofhealloy,kg/m3
T
6900
the internal
peed and pf internal h
t with liquieating of tot
hermalpeculi20.
g 0°С and 20°С
liquidalloyd
Theheatcapofalloy,J/(kg·K)
513.9
heat remo
preferably veat remova
id metal mtal melt.
iaritiesofallo
С
during the ini
pacityy,)
Co
co
oval and the
volume solidal by means
melt creates
oyingwithsp
itialdiameter
oefficientofthermal
onductivity,W/m·K
175
e formation
dification. Ts of local h
local therm
pecialpropert
rof
f
n of
This heat
mal
ties,
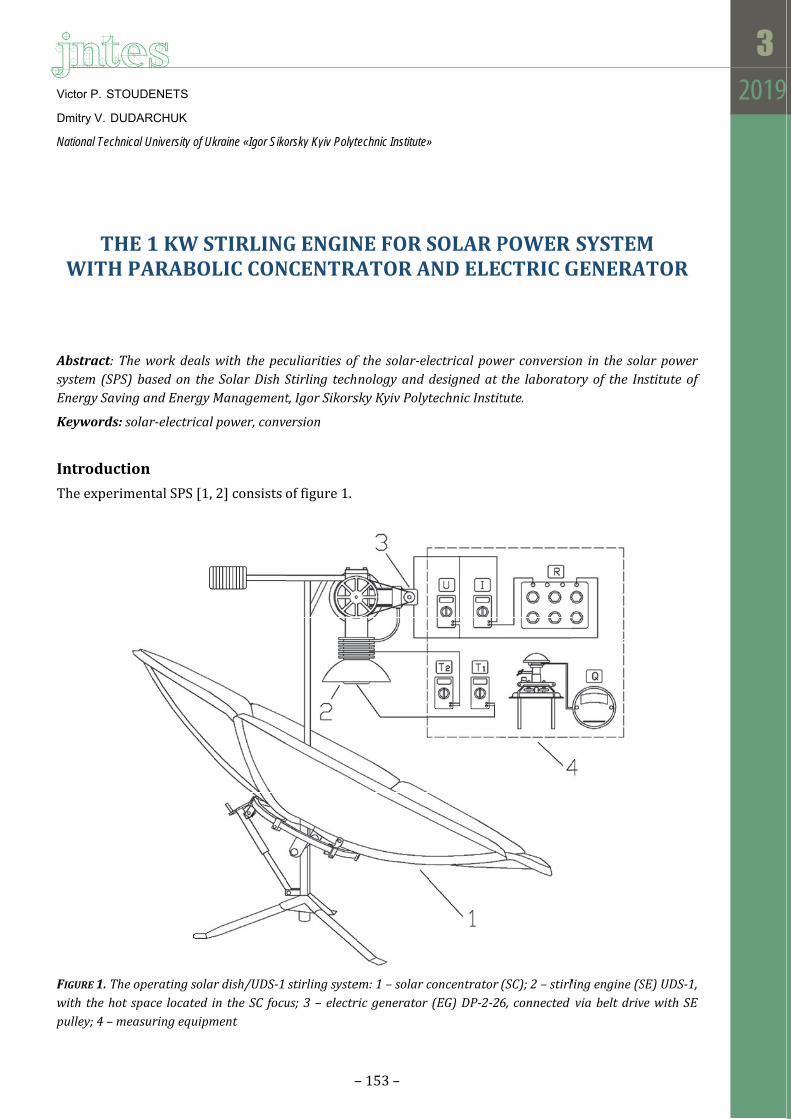
Vic
Dm
Nat
W
AbsysEn
Key
In
Th
FIGwitpul
ctor P. STOUD
mitry V. DUDA
tional Technical
THEWITHPA
bstract:Thestem (SPS)bergySaving
eywords:sola
troduction
he experime
GURE1.Theopth thehot splley;4–meas
DENETS
ARCHUK
University of Uk
1KWSARABOL
workdealsbasedon theandEnergyM
ar‐electrical
n
ntal SPS [1,
peratingsolarace located isuringequipm
kraine «Igor Siko
TIRLINGLICCON
with thepecSolarDishSManagement
power,conv
2] consists
rdish/UDS‐1in theSC focument
–
orsky Kyiv Polyte
GENGINNCENTRA
culiaritiesofStirling techt,IgorSikors
ersion
of figure 1.
stirlingsysteus;3–electr
– 153 –
technic Institute»
NEFORSATORA
f the solar‐elnologyandskyKyivPolyt
em:1–solarcricgenerator
»
SOLARPANDELE
lectricalpowdesignedattechnicInstit
concentrator(EG)DP‐2‐2
POWERCTRICG
werconversiothe laboratotute.
(SC);2–stirl6,connected
SYSTEMGENERA
on in the soloryof the In
lingengine(Sviabeltdriv
MATOR
arpowerstituteof
SE)UDS‐1,vewithSE

– 154 –
The SC is a six-section dural parabolic dish, covered with the mirror foil, mounted on a tripod base with the ability to turn 360 and to aim. The characteristics of the SC are: Midsection diameter 5 m Midsection area 1.77 m2 Focal length 0.6 m Diameter/focal length ratio 2.5 Angular aperture 64 Power 1.8 kW
As a power conversion unit the model of UDS-1 was chosen [1-3]. UDS-1 is a single-acting displacing type machine with power and displacing cylinders, inclined orthogonally (γ-coupling). The ratings of Stirling engine UDS-1 are: Rated power 5÷10 W Angular velocity 500 rpm Number of power cylinders 1 Combustion External Cooling Air Working fluid Air Coupling Gamma Weight 8 kg Dimensions 340х160х170 mm
The objective is the thermodynamic calculation of the 1 kW Stirling engine of β-coupling with the rhombic drive for the SC optimal operation. Such a coupling and a drive make it possible to reduce the shading area of the reflecting surface by the SE body.
BetaStirlingAnalysis
The SE calculation carried out in the work is based on the Schmidt isothermal model.
The Schmidt technique forms the basis of the most of the theoretical researches of the Stirling engine, regardless of whether it is used to calculate the operating parameters and to identify the dependencies of their change or to find algorithms for design development.
In the Schmidt analysis, the effect of the continuous (and not discrete) motion of the pistons is taken into account. All other assumptions for the ideal (thermodynamic) Stirling cycle are preserved.
The Schmidt theory assumptions [4, 5]: Processes of regeneration are ideal; there is a perfect regeneration. Instant value of system pressure is constant. Conditions of the working fluid are changed as an ideal gas. Gas volume changes are sinusoidal. Temperature of cylinder walls and piston is constant. The expansion-compression processes are isothermal. The amount of working fluid is constant.
The engine system is divided into 3 main parts: the compression volume, the expansion volume, the dead volume. The cycle pressure is common and the same for all volumes.
The purpose of Schmidt analysis is to obtain equations expressing the energy transfer in the system. The first step for this is to obtain expressions for variable volumes, which may have different functional forms depending on the drive mechanism (DM) used. However, in all cases, excluding the rhombic drive and the Ross linkage, it is possible to use the assumption of the harmonic movement of the piston ( – the crank rotation angle, is considered to be zero when the working piston is in bottom dead centre (BDC)) [5].

Th
1.
2.
3.
4.
Th
In Todis[5]
here are som
Volume ph it is kno
betweenthe pres
Swept volu
(for Beta co
can be working
for real
One more v
Temperatu
here are pref
order to fino find it, we splacer may]). Choose th
me basic para
ase angle 𝛼:own that then the displassure change
ume ratio – t
oupling pk
used for Stg volumes; systems usu
volume ratio
ure ratio:
ferable valu
nd the Stirlinuse the Sch
y (or may nhe case of ca
FIGURE2.Be
ameters for
: e DM with v
acer and woe during the
the ratio of t
SP
SE
VV
):
tirling engin
ually 𝐾 1
o: D
SE
VX
V –
,C
E
TT
where
ues of the ba
TABLE 1. Typwithcrankd
ng engine shmidt techniot) be in ph
alculating a
etacouplingS
–
the analysis
various comrking piston
e cycle; for o
the compres
nes with any
(𝑘 1) or
– dead volum
e: CT – coole
sic paramet
pical valuesdrive(applica
𝐾
𝛼
𝑋
haft work, wique for the hysical contBeta model
SEwithnegat
– 155 –
s convenien
mbinations on, and the poptimum out
ssion SCV a
y drive me
close to thi
me ratio.
er temperatu
ters for the S
of the basicableinthegen
we need to SE Beta mo
tact – a casewith a nega
tiveoverlap(
nce [4, 5]:
f its elemenphase angle tput power
nd expansio
chanism, si
s value.
ure [K]; ET –
Stirling engi
parameters fneralcase)
0.9÷1.2
85°÷95°
1.3÷1.7
0.3÷0.4
first find thodel. In this e of a negatative overlap
(𝑉 )andpos
nts gives a dsignificantly
90 [5]
on SEV swe
nce it is sim
– heater tem
ines (tab. 1)
for SE
e engine opmodel, the
ive (or posip [5].
itiveoverlap
different phay affects the.
ept volumes
mply a ratio
mperature [K
[5].
peration in oworking pi
itive) overla
(𝑉 )
ase angle e kind of
SC
SE
VK
V
o of two
K].
one turn. ston and ap (fig. 2

– 156 –
SEpower per revolution [kW/rev]:
T TS max STW W p V (1)
where:
TSW – dimensionless work parameter;
𝑝 – max working pressure, kPa; 𝑉 – total working volume, m3.
To find a dimensionless work parameter ,TSW we first find the dimensionless parameters B and S:
1/22 22 1 cos 1p pB k k
(2)
1/22 42 cos 1
1p pX
S k k
(3)
where:
pk – swept volume ratio for Beta coupling engine, we accept 𝑘 1;
– volume phase angle [rad].
Find a coefficient that combines these two parameters:
BS
(4)
Volume compression ratio:
1/22
1/22
1 2 2 cos 1
1 2 2 cos 1
p p pV
p p p
X k k kr
X k k k
(5)
Using the above formulas, we find the dimensionless work parameter:
1/2
1/2 1/21/2 2 2
2 1 sin 1
1 1 1 3 2 2 cos 1TS
p p p
WX k k k
(6)
where 𝜃 is the angle determined by the ratio:
sinsin pk
B
(7)
Find the total working volume:
1/2213 2 cos 1
2 2pSE
ST p p p
kVV k k k
(8)
where 𝑉 is expansion swept volume, m3.
To find the expansion space volume, use the standard geometric formula:
2
4SE hD
V V S
(9)

whD S
FuSE
wh
Ancor
Rh
Weof
Th
FIGtraSynA–
here: – power pi– power pi
urther, for th shaft angul
here 𝑁 is an
n expressionrrelations fo
hombicdri
e will calculthe key feat
he advantagesetting the piston, whiseparation pressure), lack of normthe presenmoving ma
GURE3.Betaaverse; 4, 4',nchronizingg–Hotspace;B
iston diameiston stroke
he transitionlar velocity:
gular veloci
n for the anor the select
iveanalys
ate the RD mtures of the
es of RD incl phase advaich is necess
of the SE wsince the RDmal forces a
nce of synchasses.
couplingSEw9, 9' – Rods;gears;11,12B–Coldspace
eter, m; e, m.
n from SE po
ity, s-1.
ngular velocted engine D
sis
main paramBeta couplin
lude the follance (usuallsary for the working spaD simplifies acting on thehronizing ge
withrhombic; 5, 5' – Cra–Piston rode
–
ower per rev
P
city can onlyDM, that is, t
eters, basedng SE design
lowing [6]:ly 90 of craSE working ace from ththe sealing
e piston andears, allowin
cdrive:1–Wnks; 6 –Dispd seals;13–
– 157 –
volution to t
S TP W N
y be obtainthe rhombic
d on the resun (fig. 3 [6])
ankshaft rotprocess imp
he crankcaseproblem;
d seals; ng easy bal
Workingpistoplacer; 7 – DBuffervolum
the total pow
ed by conndrive (RD).
ults of sever.
tation) of thplementatioe (crankcase
lance the fo
on;2–WorkDisplacer rod;me;14–Coole
wer, it is ne
ecting to th
ral approach
he displaceron; e unloaded
orces of iner
ingpistonro; 8 –Displacer;15–Rege
ecessary to k
he calculatio
hes [6-12]. R
r above the
from the in
rtia from th
od;3–Workicer traverse;enerator;16
know the
(10)
on of the
RD is one
working
ncreased
he linear
ingpiston10, 10' ––Heater;

RP can symmet
Characte The d
The c
The c
The c
In [8] it of a symThe authallowedNeverthsymmettechniqurelation
So, fromgeometrbe chang
1. The b
𝑅 – th
1 LR
ek
R
2. The c
3. The c
be performtric version.
eristics of thdesaxials of
connecting r
crank length
crank angles
is indicatedmmetric RD hors [8, 9] i
d the creatioheless, we wtric RD calcue, and, sec
nships.
m four listedry: 𝐾, 𝛼. Singed only in t
basic param
he crank rad
LR
– the rod
eR
– the desa
crankshaft a
crankshaft a
med in two
he symmetrthe working
rod lengths
hs of the wo
s of rotation
d that the cladue to the
improved thn of a calcu
will stay on culation, whcondly, the
d basic parce the diamthe limited r
meters of the
dius;
length ratio
axial ratio.
angular velo
angle change
kinematic
ic RD (fig. 4 g group 𝑒 a
of the work
rking group
n of the work
assical Schmsimplifying
his model bylation meththe techniq
hich are necapproach [
FIGURE4.Ty
ameters (taeters of the range and o
RD geomet
o (𝐿 – the co
ocity is assum
es in propor
– 158
versions: s
[7]): and the disp
king group L
p pR and the
king group a
midt techniqg assumptioy eliminatin
hodology forque [10], bcessary to c[10] is mor
ypesofrhomb
ab. 1) only Beta coupli
only due to t
try [10, 6]:
nnecting ro
med constan
3CSN
rtion to time
CS CN
–
symmetric a
placer group
pL and the d
e displacer g
and pressur
que does notn about the
ng the assumr determininecause, firscomplete the detailed,
bicdriveasym
two are coing SE pistohe RD geom
d length);
nt
30n
e
CS t
and asymm
𝑒 are the s
displacer gro
group 𝑅 are
e group 𝛾
t allow detere harmonic
mption of theng the paramt, we need
he SE calculand, just, c
mmetry
nnected witns are the s
metry [6].
metrical. Cho
same.
oup 𝐿 are t
e the same.
0.
rmining themovement e harmonic meters of a
only those lation withicontains all
th the DM same, the pa
oose a simp
the same.
optimal ratof the pistomotion, whsymmetric Rresults of
n the Schmthe necess
design and arameter 𝐾 c
(1
(1
pler
tios ons. hich RD. the
midt ary
its can
11)
12)

– 159 –
the angle 𝛼 is measured from a certain initial position of the RD, at which the planes of the cranks of both shafts are parallel to the axis of the cylinder, and the working piston at this moment is close to top dead centre (TDC).
4. It follows from the RD geometry that
sin sin CSL R e (13)
where arcsin sin CS k – connecting rod angular displacement;
from the continuity condition of the function 𝛽
1 sin 1k k (14)
we obtain the RD implementation condition:
11k
(15)
in the dimensional values (RD cranking condition):
L R e (16)
5. Working piston kinematics: working piston speed:
sin
cosCS
P CSw N R
(17)
working piston acceleration:
22
2
cos coscos cosCS CS
P CSj N R
(18)
6. SE volumes: SE working volume
max minh г х г хV V V V V (19)
and if we neglect the displacer rod volume
2
2 22 21/ 1 1/ 14hD
V R k k
(20)
the max cold and max hot volume ratio
2 22 2
2 22 2
1/ 1 1/ 12
1/ 1 1/ 1
k kw
k k
(21)
Result (21) is identical to the corresponding formula in [6] for 𝑘 1. It is argued in [10] that the case 𝑘 1 has no practical meaning.

– 160 –
In the SE constructions the RD parameters have the following ranges of values:
90 110
1/5 1/2.5
1 2k
For the present calculation the following values are assumed:
110 , 1/3, 𝑘 1
7. Inertia force of the working piston set linear moving masses
22
2
cos coscos cosCS CS
p p p pF m j m N R
(22)
where 𝑚 is linear moving masses of the working piston set.
For our consideration results (10)÷(22) are sufficient to complete the calculation of the SE by the Schmidt technique.
To simplify the calculation, let's make the following assumption: the mass of the working piston set with translational motion 𝑚 and its acceleration 𝑗 in the engine with a symmetrical rhombic drive (SRD) is equal to, respectively, the mass 𝑚 and acceleration 𝑎 of the piston group elements for the engine with the classic crank drive (CD).
In other words, the inertia force 𝐹 of a SRD working piston set is equal to the gas force 𝐹 acting on the CD piston group of the conventional engine:
p p pF m j ma F (23)
Next we can find acceleration according to the well-known formula:
mid pfFa
p
m m
(24)
where:
midp – middle cycle pressure, Pa (take 𝑝 = 0.1 MPa);
pf – piston area, m2.
To find the mass we will use the constructive mass for the internal combustion engines (ICE) [13], the standard values of which are given in table 2:
p
mm
f (25)
where 𝑚 is constructive mass, kg/m2.
According to table 1 we accept:
2m D (26)
where: D – cylinder diameter, mm; 2 – has dimensionality, kg/(m2·mm).
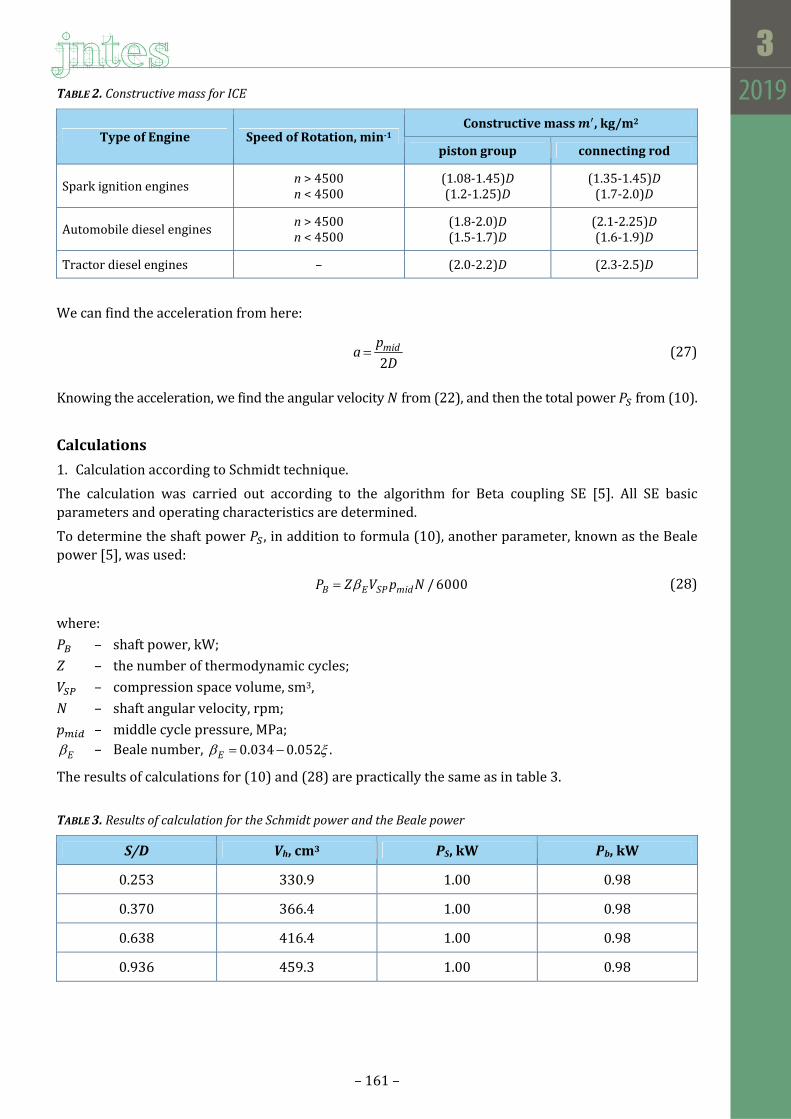
– 161 –
TABLE2.ConstructivemassforICE
TypeofEngine SpeedofRotation,min‐1Constructivemass𝒎 ,kg/m2
pistongroup connectingrod
Spark ignition engines n > 4500n < 4500
(1.08-1.45)D(1.2-1.25)D
(1.35-1.45)D(1.7-2.0)D
Automobile diesel engines n > 4500n < 4500
(1.8-2.0)D(1.5-1.7)D
(2.1-2.25)D(1.6-1.9)D
Tractor diesel engines – (2.0-2.2)D (2.3-2.5)D
We can find the acceleration from here:
2midp
aD
(27)
Knowing the acceleration, we find the angular velocity 𝑁 from (22), and then the total power 𝑃 from (10).
Calculations
1. Calculation according to Schmidt technique.
The calculation was carried out according to the algorithm for Beta coupling SE [5]. All SE basic parameters and operating characteristics are determined.
To determine the shaft power 𝑃 , in addition to formula (10), another parameter, known as the Beale power [5], was used:
/ 6000B E SP midP Z V p N (28)
where: 𝑃 – shaft power, kW; 𝑍 – the number of thermodynamic cycles; 𝑉 – compression space volume, sm3, 𝑁 – shaft angular velocity, rpm; 𝑝 – middle cycle pressure, MPa;
E – Beale number, 0.034 0.052 .E
The results of calculations for (10) and (28) are practically the same as in table 3.
TABLE3.ResultsofcalculationfortheSchmidtpowerandtheBealepower
S/D Vh,cm3 PS,kW Pb,kW
0.253 330.9 1.00 0.98
0.370 366.4 1.00 0.98
0.638 416.4 1.00 0.98
0.936 459.3 1.00 0.98

– 162 –
2. Determination of the RD main parameters.
To find these values, use the nomogram to determine the size of the SRD kinematic elements [10].
During the simultaneous calculations by the Schmidt method and by the nomogram for the SRP, the SE parameters are obtained, in particular those presented in the diagrams 𝑃 𝑆 𝐷⁄ and 𝑃 𝑉 , and the parameter of which is the crank radius 𝑅 (figs. 5, 6). However, it is also necessary to fulfill the condition specified for the ratio 𝑆 𝐷⁄ [5], namely 𝑆 𝐷⁄ → 2, that gives the optimum correlation between the heat transfer losses and the friction losses in the SE seals. Such a condition leads to an increase in volume 𝑉 and, accordingly, an unwanted increase in the SE design dimension. Consequently, it is necessary to find a compromise between the values 𝑆 𝐷⁄ and 𝑉 , for which it is desirable to find a relationship between them.
To find the function 𝑉 𝑆 𝐷⁄ , several paths are suggested. First, you can use the results of numerical calculations, but the limitation of the working field of the nomogram for the SRD does not allow this to be done in full. As a result, 4 points were calculated from this calculation for this dependence, and then extrapolation was made in the direction 𝑆 𝐷⁄ → 2.
Secondly, the dependence 𝑉 𝑆 𝐷⁄ for 𝑃 = 1 kW is found analytically. To do this, the system of equations, which consists of the following relationships (for this calculation 𝐶 , 𝐶 , 𝐶 are constants) is solved:
max 1 1T TS ST SE hW W p V V C V C (29)
where:
1/21/2 2
1 max 1/2 1/21/2 2 2
1 sin 1 3 2 cos 1
1 1 1 3 2 2 cos 1
p p p
p p p
k k kC p
X k k k
[kPa] (see (1), (6), (8), (9));
22N RD C (30)
where:
2 2
2
cos cos2000
cos cos
mid
SC SC
pC
[J/kg] (see (22)-(27));
2000 kg/(m2·m) = 2 kg/(m2·mm), see (26);
23hV D RC (31)
where:
2 22 23 1/ 1 1/ 1
4C k k
(see (20));
T SW N P (32)
where:
𝑃 = 1 kW (see (10)).

– 163 –
FIGURE5.Thedependenceoftheshaftpower𝑃 onthe𝑆 𝐷⁄ ratio
FIGURE6.Thedependenceoftheshaftpower𝑃 ontheworkingvolume𝑉
As a result of the solution, the expression of the dependence 𝑉 𝑆 𝐷⁄ is obtained (for 𝑃 = 1 kW):
3 31/2
2 2
331 2 3
104S
h
SP
SDV ADC C C
(33)
1/4
hS
V AD
(34)
where: 𝑉 in sm3 and 𝑃 in W.
Ps (S/D)
0,0
0,5
1,0
1,5
2,0
2,5
3,0
0,0 0,5 1,0 1,5 2,0 2,5S/D
Ps, k
W
R=13,0 mm
R=17,5 mm
R=26,0 mm
R=35,0 mm
Ps (Vh)
0,0
0,5
1,0
1,5
2,0
2,5
3,0
0 200 400 600 800 1000 1200 1400 1600 1800
Vh, cm3
Ps, k
W
R=13,0 mm
R=17,5 mm
R=26,0 mmR=35,0 mm

– 164 –
For the parameters selected in this calculation:
1/4
463.9hS
VD
(35)
Figure 7 presents the results of numerical determination of the dependence 𝑉 𝑆 𝐷⁄ , its extrapolation in the direction of increase 𝑆 𝐷⁄ and, as well as analytical dependence 𝑉 𝑆 𝐷⁄ (the correlation of all three results is satisfactory).
FIGURE7.Thedependenceoftheworkingvolume𝑉 onthe𝑆 𝐷⁄ ratio
Finally, using the geometric parameters obtained, namely the piston stroke and the number of cylinders, one can estimate the size of the Beta coupling SE (tab. 4 [5]).
TABLE4.SEapproximatedimensions,expressedthrough𝑆and𝑁
Typeofdrive Height CrankcaseWidth
CrankcaseLength
Rhombic 14𝑆 7𝑆 (3𝑆)𝑁
Conclusions
1. The design calculation of the Stirling engine with power of 1 kW, beta-coupling, symmetric rhombic drive and working pressure of 1 bar based on the Schmidt technique and the rhombic drive analysis combination was carried out.
2. The calculation results give the 𝑃 𝑆 𝐷⁄ , 𝑃 𝑉 , 𝑉 𝑆 𝐷⁄ dependencies, which allow estimating the SE geometrical parameters at given power.
3. The SE with a rhombic drive size estimation can be made on the basis of indicators expressed in terms of the piston stroke 𝑆 and the number of cylinders 𝑁 .
4. The results of the work will be used to develop the SE operating concept, which will enable the increase of the overall power of the SPS and its efficiency.
Vh (S/D), Ps=1 kW
y = 466,77x0,2486
R2 = 0,9994
300
350
400
450
500
550
600
0,2 0,6 1,0 1,4 1,8 2,2S/D
Vh, c
m3
Vh (S/D)calc. Vh (S/D)
analyt.

– 165 –
References
[1] Stoudenets V.P., Dovgyi S.S., Yemanova N.O., SolarPowerSystemBasedonStirlingEngine. Proceedings of the international conference "UKR-POWER 2012" "Energy saving, energy efficiency, ecology – a strategic direction of energy development. Investments and Innovations», Kyiv, IEE NTUU «KPI», December 06-07, 2012, pp. 42-45.
[2] Stoudenets V.P., Dovgyi S.S., Yemanova N.O., TheCharacteristicsofSolarDish/StirlingSystemBasedonUDS‐1Machine. Proceedings of the 8-th International Green Energy Conference (IGEC-8). Kyiv, June 17-19, 2013, pр. 214-216.
[3] Dolganov K.Y., Lisitsa V.P., Uchebno‐demonstratsionnyiy dvigatel Stirlinga UDS‐1 (Educational‐demonstrationalStirlingengineUDS‐1). Dvigatelestroyeniye, 1989, No. 5, pp. 28-33 (in Russian).
[4] Walker G.,Stirlingengines. Oxford: Clarendon Press, 1980.
[5] Reader G.T, Hooper C., StirlingEngines. London, E. & FN Spon, 1983.
[6] Zvonov V.A., Sergeev P.V., Shmerelzon Ya.F., Vybor osnovnyh parametorv rombicheskogo mehanizmadvigatelya Stirlinga (Selection of the rhombic drive basic parameters for the Stirling engine). Dvigateli vnutrennego sgoraniya. Resp. mezhvedomstv. nauch.-teh. sbornik. Vyp. 18, Harkov: Izd-vo HGU, 1973, pp. 98-111 (in Russian).
[7] Biryukov V.I., Sergeev P.V., Sintez trehparametricheskih mehanizmov rombicheskogo privoda dvigatelyaStirlinga(Synthesisoftherhombicdrivethree‐parametermechanisms forStirlingengine). Izvestiya vysshih uchebnyh zavedenij. Ser. Mashinostr. M.: Izd-vo MVTU im. Baumana. No. 11, 1975, pp. 70-76 (in Russian).
[8] Orunov B.B., Truhov V.S., Tursunbaev I.A., Raschetparametrovsimmetricheskogorombicheskogoprivodadlyaodnocilindrovogo dvigatelya Stirlinga (Calculation of symmetric rhombic drive parameters for the single‐cylinderStirlingengine). Geliotehnika. Tashkent: Izd-vo FTI AN UzSSR. No. 4, 1983, pp. 29-33 (in Russian).
[9] Tursunbaev I.A., Truhov V.S., Orunov B.B., Nekotorye rezultaty issledovaniya dvigatelya Stirlinga ssimmetrichnymrombicheskimprivodom(SomeresultsofStirlingengineresearchwiththesymmetricrhombicdrive). Dvigatelestroenie. No. 3, 1985, pp. 16-18 (in Russian).
[10] Dvigateli Stirlinga (Stirling Engines), M.G. Kruglova (ed.), M.: Mashinostroenie, 1977, 150 pp. (in Russian).
[11] Cinar C., Yucesu S., Topgul T., Okur M., 2005. Beta‐typeStirling engineoperatingatatmosphericpressure.AppliedEnergy, 81(4), pp. 351-357.
[12] Aksoy F., Cinar C., 2013, Thermodynamicanalysisofabeta‐typeStirlingenginewithrhombicdrivemechanism. Energy conversion and management, 75, pp. 319-324.
[13] Dvigateli vnutrennego sgoraniya. V 3 kn. Kn. 2. Dinamika i konstruirovanie: Uchebnik dlya vuzov (Internal combustion engines. In 3 vol., Vol. 2. Dynamics and design: A textbook for Universities), Lukanina V.N., Shatrova M.G. (ed.), 3-e izd. pererab. M.: Vyssh. shk., 2007, 400 pp. (in Russian).