these · personally as well as professionally. firstly, i would like to thank csc (china...
TRANSCRIPT

THESE
En vue de l’obtention du
DOCTORAT DE L’UNIVERSITE DE TOULOUSE
Délivré par :
Institut National des Sciences Appliquées de Toulouse (INSA Toulouse)
Discipline ou spécialité :
Génie Civil
Présentée et soutenue par
Xiao Xiao GAO
le : jeudi 16 décembre 2010
Titre :
Contribution to the requalification of Alkali Silica Reaction (ASR) damaged
structures: Assessment of the ASR advancement in aggregates
Jury :
M. Benoît FOURNIER Rapporteur M. Eric GARCIA-DIAZ Rapporteur
M. William PRINCE Examinateur M. Eric BOURDAROT Examinateur M. Martin CYR Examinateur M. Stéphane MULTON Examinateur M. Alain SELLIER Examinateur
Laboratoire Matériaux et Durabilité des Constructions INSA-UPS 135 Avenue de Rangueil 31077 Toulouse Cedex 04


Acknowledgements
Acknowledgements
Looking back on these three years of my thesis, there are full of happiness, bitterness,
excitement, disappointment… All these words are not enough to summarize the feeling
experiences. However, I enjoy in this process, I appreciate and cherish these experiences because
they made me to grow up from immaturity to maturity. This manuscript witnesses this process.
However, this manuscript would have been impossible to accomplish without the help of many
people. Here, I would like to express my thanks to all members who have helped me directly and
indirectly in accomplishing this project and giving me a leaning environment to grow me
personally as well as professionally.
Firstly, I would like to thank CSC (China Scholarship Council) who financed my thesis during
2007-2010. Further, I thank with all of my heart to my country (Chinese people) who gives me
this chance to live and learn in this beautiful country. On the other side, I would like to thank to
INSA who accepted me as a researcher in this laboratory, and also the France who gives me
memorable experiences of the culture, the food, the elegance, the delicateness…
Very special thanks go out to my supervisors Martin CYR and Stéphane Multon, without whose
motivation and encouragement, I would not have finished this research. Martin is a very earnest
professor. Under his tutelage, I learn to face and solve the difficulties instead of evading them; I
learned how to make a plan, how to express my ideas, how to organize an article and so on. I
cannot enumerate all what he taught me with these several phases. What I want to say is that he
truly makes a difference in my life, not only in the research field, but also in the personal
development. Stéphane is a very serious and dynamic scholar. I enjoy discussing questions with
him, he has “magic” power to get quickly the points of the problems and to give me good
advices. I profited much more at the first year when I spoke little French. Under his guidance,
one thing I should mark, I learn a method to write a report/article rapid and progressively,
“rapid” means wring down the structures, ideas quickly without considering the syntax, wording;
then reorganizing and correcting these ideas “progressively”, making better and better. I profit a
lot his method in writing this manuscript. And also I am touched by his firm and precise attitude
to work and research. Last but not least, I would like to thank to another supervisor Alain Sellier.
Although I have only several meetings with Mr. Sellier, I am impressed by his academic
accomplishments, his research attitude, especially his smiles which give me the warmhearted
encourages. Otherwise, I appreciate his works behind the “scenes”, like looking for the
references, writing documents for explaining the methods, managing the direction of the whole
project and so on. In a word, I am glad to work in this team with these three professors. I profit
and will profit these experiences in all of my life.
Then, I would like to express my gratitude to the committee of the jury. Thanks for the reporters:
Benoît Fournier and Eric Garcia-Diaz, who gave their time to read my thesis and to provide lots
of good advices and suggestions for the manuscript. I would also like to thank Eric Bourdarot

Acknowledgements
and William Prince who came to take part in the defense of my thesis and gave me a lot of
suggestions.
I would like to thank Mr. Pierre Clastres who accepted me as ATER in Génie Civil, and thus I
have got the finance to finish my thesis. Thank to Mr. Gills Escadeillas who accepted me to learn
and work in LMDC. Special thanks to Mr. Carle who helped me a lot in the petrography
characterization of the aggregates.
I must also acknowledge the technicians who provide technical supports: Guillaume Lambaré,
Marc Bégué, Maud Schiettekatte, Bernard Attard, Frédéric Leclerc, Laurent Boix, David Dottor
and so on. Without their helps, my thesis cannot be finished successfully. Especially Bernard,
Guillaume, Frédéric, Marc, their encouragement and jokes help me to get over the difficult
periods.
I would also like to thank the other PhD students in the laboratory: Pauline Segui, Christelle
Tribout, Paco Diederich, Rashid Hameed, Batian Kolani, Wahid Ladaoui, Thomas Martinez, Oly
Vololonirina, Rackel San Nicolas, Vu Hiep Dang, Harifidy Serge Ranaivomanana, Thomas
Stablon, Muazzam Ghous Sohail, and so on. All of them give me extreme friendship and support
towards my thesis and all other activities.
I would also like to thank my family –my parents and my cute little sister for their support and
encouragement of my thesis. I must acknowledge my boyfriend Vincent Pasqualato, without his
help on the langue, I would not have got the development of the French. I would also like to
thank my Chinese friends: the director of UCECF-ST Weiming Ye, Yinghua Wei, Susu He,
Liang Tian, Letian Song, Fan Zhao, Yanping Liu, Zhe Chen, Lu Lu, Jie Liu, Shiyan Qiao, Xiao
Wu, Wei wei and so on. With their friendship, my PhD life fulfills with happiness. I should
specially thank to my tutor of master: Professor Chuanjing Huang. Without his help, I cannot
have came to France and studied here.
I doubt that I will ever be able to convey my appreciation fully, but I owe him my eternal
gratitude.

Abstract
Contribution to the requalification of ASR-damaged structures:
Assessment of the ASR advancement in aggregates
In order to answer the questions of the ASR-affected structures owners, this work focused on a
part of a global methodology, which is proposed originally by the LMDC and EDF, aiming to
reassess the mechanical behavior of ASR-damaged constructions. To achieve this purpose, the
chemical advancement of ASR in the aggregates recovered from the structure should be
evaluated. Thus, this work focuses on the assessment of the potentially reactive silica content
with two main methods: indirectly by expansion test and directly by chemical methods. The
presentation of this manuscript is around the following points:
A relevant and rapid expansion test on mortars to link the reactive silica content to
measured expansion. The experimental condition: 1 mol/l NaOH solution conserved at
60°C is chosen to test different aggregate sizes, specimen sizes and natures of aggregate.
A fast chemical method of selective dissolution to measure directly the silica available for
ASR. Acid/basic methods are tested and compared; HF / HF+HCl method is found to be
the most effective.
A chemo-mechanical model to analyze the effect of aggregate size and specimen size,
and evaluate the chemical advancement of ASR.
Finally, a methodology is proposed to calculate the kinetics constant in the framework of
structural requalification.
Key words: alkali-silica reaction (ASR), chemical advancement, reactive silica, expansion test,
chemical test, chemo-mechanical model, kinetic constant, selective dissolution

Abstract
Contribution à la requalification des structures endommagées par l‟alcali
réaction : Evaluation de l‟avancement de l‟alcali réaction dans les
granulats
Afin de répondre aux questions des propriétaires de structures atteintes de réaction alcali-silice
(RAS), ce travail se concentre sur une partie d'une méthodologie globale, proposée initialement
par le LMDC et EDF, et dont le but est l'étude du comportement mécanique des constructions
endommagées par la RAS. Pour atteindre cet objectif, l'avancement chimique de la RAS des
granulats récupérés dans les structures affectées doit être évalué. Ainsi, ce travail est consacré à
la quantification de la silice potentiellement réactive des granulats, par l'utilisation de deux
approches : une approche indirecte par un test d'expansion et une approche directe par des
méthodes chimiques. La présentation du manuscrit s'articule autour des points suivants :
Un test d'expansion pertinent et rapide sur mortiers pour relier la quantité de silice
réactive à l'expansion mesurée. Les conditions expérimentales suivantes ont été choisies
pour tester différentes tailles et natures de granulats, ainsi que différentes tailles
d'éprouvettes : solution de NaOH à 1 mol/l et température de conservation de 60°C.
Une méthode chimique rapide de dissolution sélective pour mesurer directement la
quantité de silice réactive disponible pour la RAS. La méthode HF / HF+HCl a été trouvé
comme étant la plus efficace.
Un modèle chemo-mécanique pour analyser les effets de la taille des granulats et des
éprouvettes, et évaluer l'avancement chimique de la réaction.
Finalement, une méthodologie est proposée pour calculer la constante cinétique de la réaction
dans le cadre de la requalification des structures atteintes de RAS.
Mots clés : réaction alcali-silice (RAS), avancement chimique, silice réactive, test d'expansion,
test chimique, modèle chemo-mécanique, constante cinétique, dissolution sélective.

Table of content
Table of content
RESUME IN FRENCH ............................................................................................................................................ 1
1. OBJECTIFS .......................................................................................................................................................... 2
2. PLAN DE LA THESE ET RESULTATS ............................................................................................................................. 3
GENERAL INTRODUCTION ................................................................................................................................... 7
3. OBJECTIVES ........................................................................................................................................................ 8
4. PLAN OF THE THESIS ............................................................................................................................................. 9
CHAPTER 1-BIBLIOGRAPHY ...................................................................................................................... 11
1. INTRODUCTION.................................................................................................................................................. 11
2. ALKALI SILICA REACTION (ASR) ............................................................................................................................. 12
2.1. Mechanisms of the reaction ................................................................................................................ 12
2.2. Factors affecting ASR .......................................................................................................................... 14 2.2.1. Reactive silica .................................................................................................................................................. 14 2.2.2. Alkalis ............................................................................................................................................................... 15 2.2.3. Water ............................................................................................................................................................... 15 2.2.4. Other factors.................................................................................................................................................... 15
2.3. Mechanical consequences ................................................................................................................... 16 2.3.1. The kinetics of expansion ................................................................................................................................ 16 2.3.2. Anisotropy ....................................................................................................................................................... 16 2.3.3. The effect of compressive stress on expansion ............................................................................................... 17
3. INCIDENCE OF ASR ON CIVIL ENGINEERING STRUCTURES ............................................................................................ 17
3.1. ASR-damaged structures in the field ................................................................................................... 17
3.2. ASR-damaged concrete in the laboratory ........................................................................................... 18
4. METHODS OF ASR DIAGNOSIS .............................................................................................................................. 18
4.1. Site inspection ..................................................................................................................................... 19
4.2. Fluorescence uranyl test ...................................................................................................................... 20
4.3. Residual expansion .............................................................................................................................. 21
5. REQUALIFICATION OF STRUCTURES AFFECTED BY ASR ............................................................................................... 22
5.1. Method of Léger [Léger et al. 1995] .................................................................................................... 22
5.2. Method of LCPC ................................................................................................................................... 23
5.3. Method of Saouma .............................................................................................................................. 24

Table of content
5.4. Method used in LMDC ......................................................................................................................... 25 5.4.1. Background of the method ............................................................................................................................. 25 5.4.2. Methodology of LMDC method ...................................................................................................................... 27 5.4.3. Principle and application of the method ......................................................................................................... 29
5.4.3.1. Principle ................................................................................................................................................ 29 5.4.3.2. Application ........................................................................................................................................... 31
6. PLAN OF THE THESIS ........................................................................................................................................... 32
CHAPTER 2-OPTIMIZATION OF AN EXPANSION TEST ................................................................................. 34
1. INTRODUCTION ................................................................................................................................................. 34
2. BASIC KNOWLEDGE ............................................................................................................................................ 35
3. EXPERIMENTAL CONDITIONS ................................................................................................................................ 37
3.1. Materials ............................................................................................................................................. 37
3.2. Sample preparation ............................................................................................................................ 38
3.3. Expansion measurements ................................................................................................................... 38
3.4. Specimen conservation ....................................................................................................................... 38 3.4.1. Procedure ....................................................................................................................................................... 38 3.4.2. Choice of the solution concentration .............................................................................................................. 38
4. COMBINED EFFECT OF AGGREGATE AND SPECIMEN SIZES ............................................................................................ 39
4.1. Mortar mixtures .................................................................................................................................. 39
4.2. Experimental results ........................................................................................................................... 40
4.3. Effect of specimen size ........................................................................................................................ 45
4.4. Effect of aggregate size ...................................................................................................................... 47
5. TEST ON AGGREGATES OF DIFFERENT NATURES ........................................................................................................ 50
5.1. Mortar mixtures .................................................................................................................................. 50
5.2. Results ................................................................................................................................................. 50
6. DISCUSSION ..................................................................................................................................................... 51
7. CONCLUSION .................................................................................................................................................... 52
CHAPTER 3-CHEMICAL MEASUREMENT OF REACTIVE SILICA IN AGGREGATE ............................................. 54
1. INTRODUCTION ................................................................................................................................................. 54
2. METHODS AND MATERIALS .................................................................................................................................. 56
2.1. Analytical methods and mortar test ................................................................................................... 56
2.2. Materials ............................................................................................................................................. 57 2.2.1. Chemical and mineralogical properties .......................................................................................................... 57 2.2.2. Expansion potential ........................................................................................................................................ 70
3. METHODS FOR THE CHEMICAL EXTRACTION OF REACTIVE SILICA: RESULTS AND DISCUSSION .............................................. 70
3.1. NaOH attack (100°C and 60°C) – cold HCl washing ............................................................................ 71 3.1.1. Procedure ....................................................................................................................................................... 72 3.1.2. Mechanisms of attack ..................................................................................................................................... 72 3.1.3. Results and discussion .................................................................................................................................... 73
3.2. HCl (heated) - KOH (boiled) ................................................................................................................. 76 3.2.1. Procedure ....................................................................................................................................................... 77 3.2.2. Mechanisms of attack ..................................................................................................................................... 77 3.2.3. Results and discussion .................................................................................................................................... 77
3.3. HF attack ............................................................................................................................................. 78 3.3.1. Procedure ....................................................................................................................................................... 78 3.3.2. Mechanisms of attack ..................................................................................................................................... 78 3.3.3. Results and discussion .................................................................................................................................... 79
3.4. Comparison of the methods and discussion ........................................................................................ 81
4. CONCLUSION .................................................................................................................................................... 84

Table of content
CHAPTER 4-CHEMO-MECHANICAL MODELLING ........................................................................................ 86
1. INTRODUCTION.................................................................................................................................................. 86
2. PRINCIPLES ....................................................................................................................................................... 87
2.1. Mechanics of ASR ................................................................................................................................ 87
2.2. Assumptions ........................................................................................................................................ 87 2.2.1. Geometry ......................................................................................................................................................... 87 2.2.2. Transport of alkali ............................................................................................................................................ 88
2.2.2.1. Diffusion of alkali in cement paste ........................................................................................................ 88 2.2.2.2. Diffusion of alkali in aggregate .............................................................................................................. 89
2.2.3. Threshold of alkali concentration .................................................................................................................... 90 2.2.4. Effective ASR gel .............................................................................................................................................. 91 2.2.5. Mechanical consideration ................................................................................................................................ 92
3. PHYSICOCHEMICAL MODELLING ............................................................................................................................ 92
3.1. Mass balance equations ...................................................................................................................... 93 3.1.1. Alkali diffusion in cement paste ....................................................................................................................... 93 3.1.2. Alkali diffusion in aggregate ............................................................................................................................ 94 3.1.3. Consumption of alkalis .................................................................................................................................... 94
3.2. Formation of ASR gels ......................................................................................................................... 95
4. MECHANICAL MODELLING ................................................................................................................................... 95
5. APPLICATION AND COMPARISON WITH EXPERIMENTS ................................................................................................ 98
5.1. Experimental conditions ...................................................................................................................... 98
5.2. Assessment of the parameters ............................................................................................................ 99 5.2.1. Parameters of the physicochemical and mechanical modelling .................................................................... 100 5.2.2. Identification by curve fitting ........................................................................................................................ 100
5.3. Discussion .......................................................................................................................................... 105 5.3.1. Curve fitting ................................................................................................................................................... 105 5.3.2. Prediction of expansions with different specimen sizes ................................................................................ 106 5.3.3. Prediction of specimens immersed in different alkali concentrations .......................................................... 107 5.3.4. Prediction of specimens cast with different types of aggregate.................................................................... 108 5.3.5. Interest and limitations of the model ............................................................................................................ 109
5.3.5.1. Comparison with the previous work [Multon et al. 2009] .................................................................. 109 5.3.5.2. Limitations of the model ..................................................................................................................... 111
6. CONCLUSION .................................................................................................................................................. 111
CHAPTER 5-METHODOLOGY TO ASSESS THE KINETICS CONSTANT OF EXPANSION .................................. 113
1. INTRODUCTION................................................................................................................................................ 113
2. DETERMINATION OF THE KINETIC CONSTANT ACCORDING TO THE AGGREGATE SIZE ........................................................ 113
3. METHOD TO ASSESS THE KINETIC CONSTANT OF DAMAGED STRUCTURES ..................................................................... 116
3.1. Recovery of the aggregate from damaged concrete ......................................................................... 117
3.2. Chemical test for reactive silica content ............................................................................................ 118
3.3. Choice of the best size of aggregate and specimen for fast, relevant expansion test ....................... 118
3.4. Calculation of the kinetic constant in the framework of structural requalification .......................... 119
4. CONCLUSION .................................................................................................................................................. 120
CONCLUSION .................................................................................................................................................. 121
REFERENCES ................................................................................................................................................... 126


Resume in French
1
Resume in French
La réaction alcali-silice (RAS) est une réaction chimique délétère entre les alcalins du ciment et
la silice réactive des granulats du béton. La RAS produit des gels expansifs et entraîne
l'apparition de fissures dans les granulats et la pâte, causant des problèmes structuraux majeurs,
qui peuvent mener à la démolition de l'ouvrage. Cette détérioration se produit dans le monde
entier et dans tous les types de structures (comme les barrages, les ponts, les routes). Dans les
structures endommagées, les conséquences de la RAS apparaissent après plusieurs années.
Pendant un certain temps de latence qui peut durer plus de 10 ans, la réaction prend place dans le
béton sans causer de problèmes structuraux. Une des principales interrogations des propriétaires
de ces structures atteintes par la RAS est de savoir si cette réaction est presque achevée, ou s'il
reste encore plusieurs années de gonflement. Une requalification de ces structures affectées peut
aider le propriétaire à décider s'il est nécessaire de démolir ou réparer la structure.
Plusieurs méthodes ont été proposées pour recalculer les structures atteintes par la RAS [Léger et
al. 1995, Li et al. 2000,2001, Li and Coussy 2002, Malla and Wieland 1999, Saouma and Perotti
2006, Saouma et al. 2007, Saouma 2009]. La plupart d'entre elles sont fondées sur la mesure de
l‟expansion résiduelle effectuée sur des échantillons carottés dans les structures affectées. Les
tests d'expansion résiduelle, qui gardent les échantillons dans un environnement contrôlé (à
38°C, H.R. > 95 %) ont quelques limites. Les limites incluent : 1) la silice réactive des gros
granulats ne peut pas être consommée complètement en considérant la durée du test [Sellier et al.
2009], 2) les gels de RAS n'ont pas la même composition dans les tests accélérés par rapport aux
structures réelles [Urhan 1987], 3) le lessivage des alcalins pendant les tests peuvent avoir un
effet néfaste sur l'évaluation de l'expansion asymptotique [Rivard et al. 2003, 2007], 4) les
conditions d'humidité élevées (> 95 %) sont difficiles à contrôler, ce qui peut causer des
variations significatives des expansions pour des humidités relatives variant de 95 % à 100 %
[Poyet et al. 2006]. Ces limites entraînent des différences entre les résultats calculés avec les
données venant des tests d'expansion résiduelle et les observations in situ effectuées sur les
structures [Sellier et al. 2009].
Le LMDC (Laboratoire Matériaux et Durabilité des Constructions) et EDF (Electricité de
France) ont donc proposé une méthodologie globale basée sur l'évaluation de l'avancement

Resume in French
2
chimique de la RAS (Figure 1). Cette méthodologie suppose que les alcalins ne sont pas le
facteur limitant de la RAS en raison d'une substitution des alcalins par le calcium dans les gels
produits par la réaction [Duchesne et Bérubé 1994, Lagerblad et Trägardh 1992, Jensen 1993].
Ainsi, la quantité de silice réactive est supposée être le facteur limitant de la réaction dans le
béton des structures. Basée sur cette hypothèse, la méthodologie propose un essai de laboratoire
mesurant la cinétique de consommation de silice et une analyse numérique inverse par éléments
finis de la structure affectée (Figure 1). Le coefficient cinétique du modèle est déterminé en
laboratoire et l'amplitude finale d'expansion est ajustée en utilisant un déplacement observé sur la
structure. La capacité de prédiction du modèle a été validée par la comparaison entre le
déplacement de points instrumentés prédits par les calculs et le déplacement mesuré sur la digue
(non utilisé pour l'ajustement) [Grimal 2007, Sellier et al. 2009, Bourdarot et al. 2010].
AAR kinetic and swelling amplitude assessment
Affected structure
Core samples drilled in various zones: - Wet, dry, concrete type…
Structural monitoring: - Displacements - Temperatures - Moistures…
Laboratory tests: Assessment of reactive silica consumption kinetic
Reactive silica consumption measurement for each drilling zone and for each aggregate size range
Finite element inverse analysis of the affected structure: Swelling amplitude assessment
Search for swelling amplitude compatible with:
- environnemental conditions - reactive silica consumption kinetics
Finite element analysis
- Displacements and damage patterns prediction - Repair efficiency assessment…
Figure 1 Résumé de la méthodologie globale [Sellier et al. 2009]
1. Objectifs
Ce travail se concentre sur les essais de laboratoire effectués pour évaluer l'avancement chimique
de la consommation de silice réactive (deuxième partie de la Figure 1). L'avancement de la
consommation de la silice peut être évalué par deux méthodes principales : indirectement par des
essais d'expansion comme proposé dans [Grimal 2007, Sellier et al. 2009] ou directement par des
méthodes chimiques de quantification de la silice. Dans ce travail, les deux méthodes sont

Resume in French
3
étudiées. L'essai d'expansion étant la méthode la plus couramment utilisée dans les
expérimentations de RAS, elle a donc été analysée en premier. Les essais chimiques sur les
poudres obtenues des granulats réactifs peuvent être plus rapides que les essais d'expansion, mais
les résultats peuvent ne pas être représentatifs de la RAS dans le béton. Cette partie est donc
présentée après les essais d'expansion. Un modèle chemo-mécanique est utilisé pour analyser ces
deux méthodes et évaluer l'avancement chimique de la réaction pour une utilisation de
requalification de la structure. Ainsi, trois objectifs peuvent être atteints :
1. Proposer un essai d'expansion en laboratoire, rapide et pertinent, dans le but d'évaluer la
quantité de silice réactive des granulats. La méthode doit garantir des conditions de
conservation contrôlées des éprouvettes, et optimiser la taille des éprouvettes et des
granulats.
2. Trouver une méthode chimique pour mesurer la silice disponible dans un granulat, silice
susceptible de réagir avec les alcalins contenus dans le béton. La méthode doit être rapide
et fiable.
3. Développer un modèle chemo-mécanique pour évaluer l'avancement chimique de la
réaction. Ce modèle doit inclure la diffusion des alcalins dans les granulats et la pâte de
ciment, le processus chimique de fixation des alcalins, la consommation de la silice et la
production de gels de RAS.
Ces trois objectifs sont résumés sur la Figure 2.
Figure 2 Relation entre les trois objectifs de ce travail.
2. Plan de la thèse et résultats
Pour réaliser ces objectifs, quatre parties sont développées :
Bibliographie (chapitre 1)

Resume in French
4
La bibliographie concernant la Réaction Alcali-Silice est étudiée dans ce chapitre. Comme ce
travail se concentre sur les données d'entrée nécessaires à la requalification des structures
atteintes de RAS, une grande partie de la bibliographie concerne les méthodes existantes de
requalification de structures. Les références spécifiques des techniques développées dans ce
travail sont données au début de chaque chapitre.
Optimisation des essais d'expansion (chapitre 2)
Dans le but d'obtenir des résultats rapides, un essai d'expansion accélérée à 60°C dans une
solution de NaOH est choisi. La quantité d'alcalins est supposée suffisante pour garantir la
consommation de toute la silice réactive. De plus, en tenant compte du temps nécessaire aux
alcalins pour diffuser dans les éprouvettes et dans les granulats, les éprouvettes et les granulats
ne doivent pas être trop volumineux. Différentes tailles d'éprouvettes et de granulats sont testées.
Plusieurs types de roches sont évalués pour vérifier si le test d'expansion peut différencier la
réactivité des différents granulats.
Les conclusions principales tirées de ces essais nous ont permis de proposer des conditions
optimisées pour les essais à effectuer sur les granulats réactifs :
Dans la condition d'un excès d'alcalins, la concentration en alcalins semble avoir un effet
négligeable sur la cinétique d'expansion et sur l'expansion finale.
Concernant le choix de la taille des granulats, il a été constaté que les expansions finales
mesurées sur les éprouvettes contenant des granulats fins ont été atteintes dans des délais
plus courts que pour les éprouvettes contenant des granulats plus grossiers. Le temps
nécessaire pour atteindre l'expansion asymptotique sur les petites éprouvettes est
principalement dû au temps de diffusion des espèces ioniques dans les granulats.
Cependant, si les particules sont trop petites, le gel produit par le granulat peut migrer
dans la porosité connectée et causer peu d'expansion. Dans le cas du calcaire siliceux, la
fourchette de taille 315-630 µm s'est avéré un bon compromis.
Pour ce qui concerne la taille des éprouvettes, les plus petites (20 x 20 x 160 mm)
montrent la cinétique de gonflement la plus grande. Cependant, une partie de l'expansion
n'est pas mesurée, en raison d‟un effet couplé entre la taille des granulats et la taille des
éprouvettes sur l'expansion. Au-delà de la méthodologie de requalification exposée,
l'observation de cet effet nous semble également être une conclusion importante de ce
travail. Il a ainsi été montré que l'effet pessimum de la taille des granulats sur
l'expansion de RAS était un phénomène qui n'était pas seulement intrinsèque au granulat,
mais qu'il était aussi provoqué par les conditions expérimentales. Cela peut être expliqué
par la proportion de gels de RAS qui est absorbé par le volume de vide créé par la
fissuration, causant une diminution de la pression de gel et réduisant de ce fait
l'expansion induite.
Enfin, pour le calcaire siliceux étudié, les petits granulats (315-630 µm) et les petites
éprouvettes (20 x 20 x 160 mm) se sont avérés convenables pour un essai rapide
d'expansion. Cependant, ces conditions peuvent dépendre de la nature du granulat. Afin
Resume in French
5
d'optimiser les conditions d'essai selon la nature du granulat, il semble être important de
mesurer la réactivité potentielle du granulat. Dans ce but, les essais chimiques (chapitre
3) peuvent être un outil utile.
Dosage chimique de la silice réactive dans les granulats (chapitre 3)
Le chapitre 3 présente une étude sur « les essais chimiques » prévus pour mesurer la silice
réactive des granulats. La silice réactive est un concept relatif qui est employé pour définir la
partie de la silice qui peut réagir avec les alcalins pour produire des gels de RAS. Afin de
connaître avec précision la quantité de silice réactive disponible pour la RAS, la meilleure
manière serait de simuler l'environnement du béton mais c'est pratiquement impossible
considérant le temps de réaction. Les études minéralogiques ont montré que la silice réactive
inclut les minéraux amorphes, les minéraux cryptocrystallins et les minéraux cristallins
contenant des imperfections. En outre, considérant que tous les types de silice (silice réactive et
silice bien cristallisée) ont une certaine solubilité dans un environnement acide ou basique, la
méthode doit distinguer les capacités de solubilité de la silice réactive et de la silice bien
cristallisée. Ainsi, trois méthodes d'attaque, NaOH-HCl, HCl-KOH, et HF/HF+HCl, ont été
employées pour tester différents types de granulats. La quantification chimique a été comparée
aux expansions obtenues sur des mortiers contenant ces granulats. Les principaux résultats des
analyses trouvées sont :
Pour l'attaque NaOH-HCl, la haute température (100°C) est efficace pour dissoudre la
silice. Cependant, l'essai n'a pas pu distinguer la dissolution de la phase réactive et de la
phase bien cristallisée. L'attaque NaOH-HCl semble dissoudre les minéraux bien-
cristallisés, qui ne réagissent pas avec les alcalins dans les conditions réelles du béton.
L'attaque HCl-KOH s'est avérée ne pas convenir puisque le quartz non-réactif a été
attaqué. En outre, cette attaque permet seulement un essai à la fois et, il n'est pas possible
de distinguer les différentes formes de silice.
L'attaque HF/HF+HCl s'est avérée le meilleur compromis puisqu'elle a séparé les silices
réactives et non-réactives. Bien que ce soit une attaque acide, le résultat a montré la
meilleure corrélation avec les essais de gonflement sur mortiers. En outre, cette méthode
est rapide (24h) et simple.
Modélisation chemo-mécanique (Chapitre 4)
Le chapitre 4 propose un modèle chemo-mécanique amélioré pour analyser les résultats des
essais d'expansion et pour évaluer l'avancement chimique de la réaction. Ce modèle est basé sur
un modèle précédemment développé par Multon et al [2009]. Afin de déterminer l'expansion de
la RAS, la diffusion et la fixation des alcalins dans les granulats et l‟endommagement du béton
ont été considérées. Des modifications étaient nécessaires pour prendre en compte la diminution
de l'expansion avec le rapport "taille de éprouvette / taille de granulat" et la non-linéarité de
l'expansion avec la teneur en silice réactive des granulats, phénomènes observés pendant les
expériences (chapitre 2). Les questions principales au sujet du modèle sont résumées ci-dessous :
Resume in French
6
Cinq paramètres de la modélisation physico-chimique ont été évalués par l'ajustement des
courbes d'expansion obtenues sur les plus grosses éprouvettes.
Les paramètres ajustés ont été employés pour évaluer l'expansion de la RAS des autres
éprouvettes de plus petites dimensions et conservées dans différentes concentration de
NaOH. Le modèle peut reproduire les différences d'expansion dues à la taille des
granulats, la taille des éprouvettes et la nature des granulats. Il valide la fonction
proposée pour représenter les effets combinés des tailles de granulats et d‟éprouvettes et
de la quantité de silice réactive.
Méthodologie d'étude de la constante cinétique de l'expansion (Chapitre 5)
Le chapitre 5 récapitule les résultats des chapitres 2, 3 et 4 en présentant une méthode pour
calculer la constante cinétique d'expansion, qui est utile pour établir la cinétique d'expansion du
béton in situ. Le calcul de ce paramètre à partir du modèle micro chemo-mécanique montre qu'il
varie avec les différentes tailles de granulat et est peu affecté par la taille de l‟éprouvette. Enfin,
une méthodologie est proposée pour calculer la constante cinétique dans le cadre de la
requalification structurelle.

General Introduction
7
General Introduction
Alkali-Silica Reaction (ASR) is a deleterious chemical reaction between the alkali hydroxides
from the concrete pore solution and the silica of reactive aggregate in concrete. ASR produces
expansive gels and causes cracking of aggregate and paste, sometimes resulting in major
structural problems which could lead to extensive maintenance, repair and demolition in extreme
cases. This deterioration occurs worldwide and in all types of structures (such as dams, bridges,
roads, breakwaters). In damaged structures, the consequences of ASR become noticeable after a
period which could be as short as 5 years. During a latent time, the reaction takes place in the
concrete without causing structural problems. The latent time can last more than ten years. One
of the main concerns for the owners of these ASR-damaged structures is to know whether the
reaction is almost finished or if many years of swelling still remain. A requalification of the
ASR-affected structures could help the owner to decide whether to demolish or repair the
structures.
Several methods have been proposed to reassess ASR-affected structures [Léger et al. 1995, Li et
al. 2000, Li et al. 2001, Li and Coussy 2002, Malla and Wieland 1999, Saouma and Perotti 2006,
Saouma et al. 2007, Saouma 2009]. Most of them are based on the measurement of residual
expansion on core samples drilled in affected structures. The residual expansion tests, which
keep the samples in a controlled environment (at 38°C, R.H. > 95%) have some limits. The
limits include: 1) the reactive silica in large aggregates cannot be consumed totally considering
the duration of the test [Sellier et al. 2009], 2) the ASR-gels do not have the same composition in
accelerated tests as in real structures [Urhan 1987], 3) alkali leaching during the tests can have a
deleterious effect on the assessment of the asymptotic expansion [Rivard et al. 2003, Rivard et
al. 2007], 4) the high moisture conditions (>95%) are difficult to control, which leads to
significant variations of ASR expansions for relative humidity (R.H.) ranging between 95% and
100% [Poyet et al. 2006]. These limits lead to differences between calculated results obtained
with data coming from this residual expansion test and in-situ observations performed on
structures [Sellier et al. 2009].
Therefore, the LMDC (Laboratory of Materials and Durability of Construction) and EDF
(Electricité de France) have proposed a global methodology based on the assessment of chemical

General Introduction
8
advancement (Figure 1).This methodology assumes that the alkali content in concrete is not the
limiting factor in ASR due to the substitution of alkalis by calcium in the ASR gels [Duchesne
and Bérubé 1994, Lagerblad and Trägardh 1992, Jensen 1993], and the limiting factor in
concrete structure is the quantity of silica. Based on this assumption, the methodology proposes a
laboratory test dealing with the silica consumption kinetics and a numerical finite element
inverse analysis of the affected structure (Figure 1). The kinetic coefficient of the model is
determined in the laboratory and the final swelling amplitude is fitted using one observed
structural displacement. The model prediction capability has been validated through the
comparison between the displacement of instrumented points predicted by the calculations and
the displacement measured on the dam (not used for the fitting) [Bourdarot et al. 2010, Grimal
2007, Sellier et al. 2009].
AAR kinetic and swelling amplitude assessment
Affected structure
Core samples drilled in various zones: - Wet, dry, concrete type…
Structural monitoring: - Displacements - Temperatures - Moistures…
Laboratory tests: Assessment of reactive silica consumption kinetic
Reactive silica consumption measurement for each drilling zone and for each aggregate size range
Finite element inverse analysis of the affected structure: Swelling amplitude assessment
Search for swelling amplitude compatible with:
- environnemental conditions - reactive silica consumption kinetics
Finite element analysis
- Displacements and damage patterns prediction - Repair efficiency assessment…
Figure 1 Global methodology summary [Sellier et al. 2009]
3. Objectives
This work focuses on the laboratory tests performed to assess the chemical advancement of silica
consumption (the second part of Figure 1). The advancement of silica consumption can be
assessed by two main methods: indirectly by expansion test as proposed in [Grimal 2007, Sellier
et al. 2009] or directly by chemical methods of silica quantification. In this work, the two
methods are investigated. Expansion test is the most usual method used in ASR experimentation,

General Introduction
9
so it is analyzed firstly. Chemical test on powders made from aggregate can be faster than
expansion test but the results may not be representative of the ASR in concrete. Therefore, it is
presented after the expansion tests. A chemo-mechanical model is used to analyze these two
methods, and evaluate the chemical advancement for the use of structural requalification. Thus,
three objectives should be achieved:
1. Propose a fast and relevant expansion test in the laboratory to evaluate the reactive silica
content in aggregates. The method should guarantee reliable conservation conditions of
specimens and optimize the size of specimen and aggregate.
2. Find a chemical method to measure the silica available in an aggregate to react with the
alkali contained in the concrete. The method should be fast and convenient.
3. Develop a chemo-mechanical model to evaluate the chemical advancement. This model
should include the diffusion of alkali in aggregate and in cement paste, the chemical
process of the fixation of alkali, the consumption of silica and the production of ASR
gels.
These three objectives are summed up in Figure 2.
Figure 2 Relation between the three objectives of this work
4. Plan of the thesis
In order to achieve these objectives, four parts are developed:
Bibliography (chapter 1)
Before the investigations, references concerning Alkali-Silica Reaction are studied. As this work
focuses on the input data necessary to reassess ASR-damaged structures, a large part of the
bibliography concerns the methodology of requalification of structures. Specific references of
the techniques developed in this work are given at the beginning of each chapter.

General Introduction
10
Optimization of an expansion test (chapter 2)
In the purpose of getting rapid results, an accelerated expansion test at 60°C and in NaOH
solution is chosen. Considering that the amount of alkali is sufficient to guarantee the
consumption of all the reactive silica, conservation in solutions with different alkali
concentrations is tested. In addition, taking account of the time needed for alkalis to diffuse in
the specimens and in the aggregate, the specimens and the aggregates should not be too large.
Different specimen and aggregate sizes are tested. Several types of rocks are tested to verify
whether the expansion test can differentiate the reactivity of different aggregates.
Chemical measurement of reactive silica in aggregate (chapter 3)
Several methods exist for attacking silica. However, these methods cannot attain the objective of
directly measuring the total amount of silica available for ASR. Thus, a literature survey is made
to summarize and analyze the existing methods. Inspired by these methods, acid and/or basic
attacks are chosen to test different types of aggregates. Combined with the mineralogical studies
- XRD and petrographic studies, the chemical results are compared and discussed in order to
choose the most relevant method in comparison with the expansion test.
Chemo mechanical modelling (chapter 4)
This part includes the improvement of an existing microscopic model to understand the
mechanism involved the development of expansion in ASR-damaged specimens. The
microscopic model is based on the model built by Multon et al. [2009]. Modifications should be
conducted due to the differences in experimental conditions (specimens immersed in alkali
solution instead of conservation in air at 95% R.H. as in the previous work), and due to the tested
samples (particularly the effect of the sizes of the specimens on the expansions, which was not
considered in the previous work).
Methodology to assess the kinetics constant of expansion (chapter 5)
This chapter, based on the findings of Chapter 2, 3 and 4, aims to re-build the expansion kinetics
in the framework of structural modelling. It includes two parts:
Introduction of the significance of the kinetics constant in the laboratory test.
Presentation of a methodology to calculate the kinetics in the framework of structural
requalification.
The conclusion recalls the main results of the investigations and proposes some perspectives,
which could be used for requalification of structures damaged by ASR.
Chapter I
11
Chapter 1
Bibliography
1. Introduction
Alkali-Silica Reaction (ASR) is a common type of Alkali-Aggregate Reaction (AAR). It is a
deleterious chemical reaction occurring in all types of structures: dams, bridges, roads and
breakwaters, containing alkali reactive aggregates. Three main factors are considered to be
necessary for this reaction: the high alkali content in the pore solution, reactive silica in
aggregate and the humidity in the environment. These three factors are indispensable elements
stimulating the alkali-silica reaction. Reviewing the history of the ASR in 1935, Holde explored
the reactions between cements and certain aggregates [Comby-Peyrot 2006], and in 1940 Stanton
described the nature of the reagents of ASR and observed the disorders in the structures. In 1941,
the hydraulic structure “Parker Dam” (USA) was first identified as affected by alkali aggregate
reaction [Corneille et al. 1991]. Afterwards, many structures were gradually found to be affected
by this harmful reaction.
The interest in research in this field has increased because of the risk to structure safety and the
high cost of structure repairs. Figure I-1 shows the number of papers recorded in the proceedings
of ICAAR (International Conference on Alkali-Aggregate Reaction in Concrete), which
demonstrates the increasing trend of research into the reaction in the past three decades. The
research is distributed in four main fields: the mechanism of ASR, prevention of ASR, diagnosis
and assessment of damage, and management of damaged structures. In this work, particular
attention is paid to the requalification of the damaged structures.

Chapter I
12
Figure I-1 The paper published in the main International conferences on Alkali-Aggregate
Reaction during the past three decades [12th
ICAAR and 13th
ICAAR]
Considering the complexity of ASR, which refers to the chemical process, the materials and the
mechanical consequences, this chapter introduces the background of ASR from different
standpoints. Firstly, the mechanism of the chemical reaction is presented and the factors
affecting the reaction are summarized. Then the mechanical consequences are presented from the
material point of view. The incidence on structures in the field and in the laboratory is illustrated
to give a global concept of the damage. Then the methods of diagnosis are explained that detect
ASR damage macroscopically. Later, the models used to requalify the structures are introduced
and the method used in LMDC is highlighted. Finally, the plan of this work is described.
2. Alkali silica reaction (ASR)
2.1. Mechanisms of the reaction
Understanding the mechanism of the ASR is a basic step to know the reasons causing the
degradation, and also is helpful in evaluating the attacked structures and then finding methods to
prevent the damage. However, until now there has not been a consensus on the mechanism. The
disagreements have led to two main theories: one of them considers that the ASR occurs on the
surface of the aggregate and then forms gel diffusing into the pore solution [Dent Glasser and
Kataoka 1981], the other thinks that all the reagents of ASR meet and react in the pore solution
and then precipitate in gel [Dron and Brivot 1993]. The main principle of the mechanism
proposed by Dent Glasser and Kataoka [1981] includes two processes:
- Ionic species (such as Na+, K
+, OH
-) diffuse around the aggregates, and then disrupt the
silanol and siloxane bonds contained in the reactive silicate (Figure I-2).

Chapter I
13
Figure I-2 Alkalis attack the Si-O bonds (according to [Poole 1992])
- Alkali silicate reacts with the ionic species (Na+, K
+, Ca
2+) and form ASR gels. This
process has been described in detail in [Ichikawa and Miura 2007; Ichikawa 2009]. The
Ca2+ ions penetrate the soft alkali silicate which covers the aggregate to re-polymerize the
silicate, and pack a ridi reaction rim around the aggregate which allows the penetration of
the ionic species (Na+, K
+, Ca
2+ and OH
- ions). The penetration of these inoic species
converts the fresh silicate into bulky alkali silicate gels.
ASR gels can exert high imbibition pressures during the swelling process. The osmotic pressures
force the gel to fill in the open pores which are between aggregate and cement paste. Once the
volume of the gel is greater than the porous volume, a swelling pressure caused by gel leads to
cracking and degrades the concrete (Figure I-3).
Figure I-3 Cracks caused by ASR gel filling the open pores
The role of Ca ions in the formation of gel has been discussed for a long time. Some authors
think that Ca ions are indispensable in the formation of gel. Without Ca ions, the silicate ions
stay in the solution and do not form gel [Diamond 1989]. However, too much Ca ion in the gel
could decrease the capacity of gel to expand [Dent-Glasser 1979, Wilson et al. 1994]. In
addition, another role of Ca ions is to substitute and release Na ions, and this process reproduces
“new available” alkalis and makes the ASR continue [Wang and Gillot 1991]. However, this
substitution process is frequently ignored in laboratory tests since it is a slow process, often

Chapter I
14
observed in structures in the field [Duchesne and Bérubé 1994, French 1989, Lagerblad and
Trägardh 1992].
2.2. Factors affecting ASR
Three components are necessary to induce ASR damage:
1) Reactive silica from aggregate
2) Alkalis, mainly from cement but also from other materials
3) Water from the concrete mix-design and the environment of the field structures.
2.2.1. Reactive silica
Aggregate is the main source of reactive silica, and the silica reactivity depends on the aggregate.
Aggregates used in mass and reinforced concrete mainly come from sand, gravel and crushed
rock and so on. Sand and gravels are derived from the weathering of rocks. Thus, knowing the
petrographic properties of the rocks is helpful for the owners to prevent ASR. Table I-1 gives a
list of rocks which have been considered as reactive to ASR. The reactivity of aggregates
depends on several factors, such as the grain size of the aggregate, the angularity of the
aggregate and the content of reactive aggregate or mineral form[Multon et al.2008, Ramyar et al.
2005]. The rocks shown in Table I-1 represent those that are most prone to ASR, but it does not
suggest that these are always prone to ASR.
Table I-1 Some of the rocks found to be reactive to alkalis (according to [French 1992])
Sedimentary rocks Igneous rocks Metamorphic rocks
orthoquartzite
shale
greywacke
sub-greywacke
chert
siliceous limestone
siliceous dolostone
sandstone
argillite
arkose
taconite
chalcedony
opal
marl
andesite
rhyolite
rhyolitic tuff
silicified tuff
devitrified glass
granite
pumice
tuff
dacitic tuff
diorite
dacite
dacitic tuff
obsidian
trachyte
felsites
basalt (Depends on the roches)
granophyres
quartzite
phyllite
granite gneiss
slate
amphibole
metabasalt
hornblende schist
metadolerite
mica schist

Chapter I
15
2.2.2. Alkalis
The source of alkalis can be Portland cement, aggregates, chemical admixtures, external sources
(such as seawater, deicing salts). Of the above materials, cement is considered as the main source
of alkalis [Corneille et al. 1991].
The alkali content of Portland cement is normally measured as sodium and potassium oxides
(Na2O and K2O) expressed as the “equivalent sodium oxide” content as follows:
Na2Oe % = Na2O % + 0.658 x (K2O %) (I-1)
Na2Oe = total sodium oxide equivalent in percent by mass
Na2O = sodium oxide content in percent
K2O = potassium oxide content in percent
Portland cements containing less than 0.60% equivalent sodium oxide are considered to be low-
alkali cements. This value has been cited in various international specifications as the
specification limit of ASR. However, this specification was found not to be effective since some
cases with a quantity of alkalis lower than 0.60% has also given rise to harmful expansion
[Corneille et al. 1991]. Some reports thought that the neglect of the other source of alkalis (like
aggregate, admixture et al.) could be a reason to explain these phenomenons [Corneille et al.
1991]. Thus, another calculation of total alkali content of the concrete was proposed. The
calculation is based on the consideration of all the sources of alkalis and the percentage of these
materials in the concrete. A range of 3~5 kg/m3 Na2Oe has been proposed as the threshold of
ASR by many papers, below this range the ASR expansion is negligible, above this range the
ASR expansion increases with the alkali content. In Canadian standards (CSA A23.2-27A), a
limit of 1.2 kg/ m3 Na2Oe is required to control ASR when the “high risk structures” have to be
built.
2.2.3. Water
Available moisture is necessary for ASR to occur since the ASR gel forms through imbibing
water, and causes expansion within concrete. Concrete with reactive aggregates and high alkali
content has shown little or no expansion in very dry environments. Generally, it is believed that a
relative humidity of less than 80% will not cause significant expansion due to ASR [Corneille et
al. 1991]. The reaction will proceed when the humidity rises above 80%. Although limiting the
availability of moisture to the structures is an effective way to reduce ASR damage for some
types of structures it is not feasible since for some structures like dams and bridges where
humidity is unavoidable [Poyet 2003].
2.2.4. Other factors
Apart from the three factors referred to above, other elements of concrete also have an effect on
ASR. For instance, mineral admixtures (such as silica fume, fly ash, blast furnace slag), which
are well known for their properties of modifying concrete behaviour physically and

Chapter I
16
mechanically, can constitute a valid defence against ASR [Corneille et al. 1991, Fournier et al.
2004]. This defence is mainly caused by the reaction between the active component of mineral
admixtures, the alkalis in the pore solution of concrete leading to reduction of the alkalinity, the
consumption of Ca(OH)2, and the reduction of permeability and moisture diffusion[Carles-
Gibergues et al. 2008]. However, due to the substitution of alkalis by calcium ions, the alkali can
regenerate and react with reactive aggregate again, which could lead to the invalidation of this
ASR defence effect[Multon et al. 2009]. Thus, some authors emphasize that, in order to limit the
effects of ASR, mineral admixtures should be added in an abundant amounts such as in[Hobbs
1988, Turriziani 1986] et al..
2.3. Mechanical consequences
Understanding the mechanical consequences of ASR is also very helpful to comprehend and
predict the degradation and damage. In this part, the kinetics of the expansion, anisotropy and
compressive stress on expansion will be explained from the material point of view.
2.3.1. The kinetics of expansion
The kinetics of expansion has already been described by many authors [Clayton 1989, Larive
1998]: all expansion curves have a high and increasing initial rate of swelling, followed by a
decrease of the rate until a long-term expansion asymptote is reached. Different with this
classical model, some authors have put forward other explanations. Larive [1998] thinks that the
latent time of the reaction depends on the reaction temperature: at ambient temperature, the
kinetic curve shows an “S”-form, indicating a very slow rate of expansion at first, then
increasing rapidly, and finally gradually slowing down. Carles-Gibergues and Cyr [2002]
summarized the results found in the literature about the expansion kinetics of concrete in
accelerated tests and concluded that, instead of reaching an asymptote, the ASR-attacked
concretes often continue to expand at a low rate.
2.3.2. Anisotropy
The ASR expansion is anisotropic, and thus the expansion results depend on the exposure
conditions (wind, localised exposure to sun and moisture), the conditions of measurement and
the process of concrete fabrication. This view has been proved in many studies [Ballivy et al.
2000, Larive et al. 2000, Smaoui 2003].
Larive et al. [2000] thought that the anisotropic characteristic of AAR expansion derived from
many local factors (such as concrete porosity, tensile strength variation and aggregate
distribution) that may affect cracking formation. Smaoui [2003] pointed out that “the form of the
sample (such as cylinder, prism), the direction used for the measurement, the methods used
during the casting have an important effect on the ASR expansion”. Multon and Toutlemonde
[2006] summarized the literature and considered that the anisotropy was influenced by the
directions of the cracks. They also quantified the effect of stresses on ASR expansion anisotropy.

Chapter I
17
This effect of anisotropy due to the direction studied should be considered in the model, in order
to avoid over or under estimating the results.
2.3.3. The effect of compressive stress on expansion
According to the literature [Jones and Clark 1996, Larive 1998, Le Roux et al. 1992, Multon and
Toutlemonde 2006], the compressive stress influences the kinetics of ASR expansion in the
direction of loading and this effect leads to the reduction of expansion in the direction of loading
or stress. However, this view has given rise to disputes. Some authors think that this reduction of
expansion “decreases” only superficially in the loading direction but actually the expansion is
transferred to the direction without load; the volumetric expansions should then be constant.
Some authors do not agree with this view. They think that the volumetric expansions depend on
the value of the compressive stress [Larive et al. 1996][Smaoui 2003]. Saouma [2009] thinks
that, if the compressive stress is “large”, the volumetric increase is reduced due to the formation
of structural micro/macro cracks which will absorb the gel without pressurizing the adjacent
concrete.
3. Incidence of ASR on civil engineering structures
3.1. ASR-damaged structures in the field
In 1985, a report from ICOLD (International Commission of Large Dams) summarized the
damage to dams caused by alkali-aggregate reaction, which involved 24 structures in USA, 5
dams in France, 3 dams in Spain, 2 in India, 2 in Brazil and so on. [Corneille et al. 1991].
Another report [Charlwood 2009] gives statistical data on the dams damaged by AAR (Figure I-
4).
Figure I-4 Dams damaged by AAR attack (data from [Charlwood 2009])

Chapter I
18
Some other countries have also reported the incidence of AAR on structures. Gilks and Curtis
[2003] reported on the Mactaquac Dam in Canada; Jabarooti and Golabtoonchi [2003] on an
Iranian dam; Malla and Wieland [1999] a dam in Switzerland. In France, among 130 large
concrete dams examined for ASR, 30% show swelling effects, 10 need special attention (strain >
10µm/m/year), 3 have great problems: Le Chambon, Maury and Temple-sur-Lot. And hundreds
of bridges are also involved in ASR problems [Larive 1998]. Some authors give summaries of
this incidence, Fu et al. [2004] and Li [2004] present the structures affected in China; Durand et
al. [2004] summarize ASR history in Québec, Canada; Leemann et al. [2004] present the
affected underground structures in Switzerland, Richardson [2004] gives a survey of recent
research cases in the Republic of Ireland. In addition to the cases mentioned above, new cases
seem to be explored and published every year all over the world. This trend indicates that ASR is
not a phenomenon occurring only in certain places or certain countries; it is a universal problem
involving many types of structures. Typical ASR damage on structuresincludes several features,
such as:
Exudation of gels into the surface cracking
Signs of expansion, relative movement between structural elements;
Appearance of longitudinal cracks and/or map cracking (random cracking pattern). The
cracks of macro and micro level can radiate from the interior of the aggregate out into the
surrounding paste.
Deformation or displacement of the structures
3.2. ASR-damaged concrete in the laboratory
The effect of ASR is investigated on the concrete (reinforced concrete, beam) or mortar in
laboratory studies as well as in field studies. The same type of cracks have been observed: 1)
map-cracking occurs in elements free of major stress or poorly reinforced [e.g. ICAAR
proceedings], 2) for reinforced concrete or in elements subjected to loading stress, cracks reflect
the arrangement of the underlying rebars or the direction of major stress [e.g. Fan and Hanson
1998, Rivard and Saint-Pierre 2009]. The deformation is found not only to be due to the three
factors inherent in ASR (alkali content, reactive silica and water), but also to depend on the
stress states and thus on the presence of reinforcing steel. Discussion of the effect of ASR on the
mechanical properties (compressive strength, splitting tensile strength, dynamic modulus) has
not reached a consensus yet. In some cases, the degree of reduction depends on the experimental
conditions, like the nature of the aggregate, the formulation of the concrete, and the type of
concrete (normal strength or high strength concrete) [Larive 1998, Multon 2004].
4. Methods of ASR diagnosis
ASR affected structures usually manifest three signs: 1) concrete expansion, 2) surface cracking,
and 3) products which may exude on the surface of the concrete, particularly at joints. However,
ASR cannot be identified by 1) and 2) alone since there are many reasons which could cause
Chapter I
19
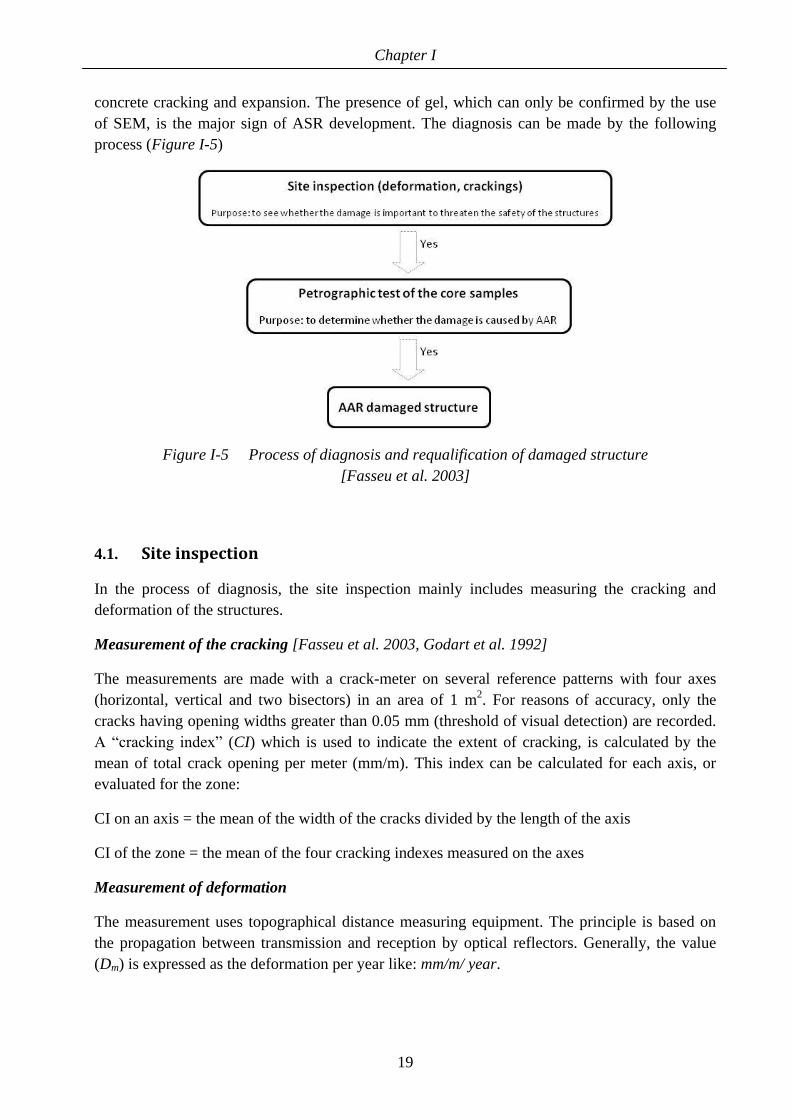
concrete cracking and expansion. The presence of gel, which can only be confirmed by the use
of SEM, is the major sign of ASR development. The diagnosis can be made by the following
process (Figure I-5)
Figure I-5 Process of diagnosis and requalification of damaged structure
[Fasseu et al. 2003]
4.1. Site inspection
In the process of diagnosis, the site inspection mainly includes measuring the cracking and
deformation of the structures.
Measurement of the cracking [Fasseu et al. 2003, Godart et al. 1992]
The measurements are made with a crack-meter on several reference patterns with four axes
(horizontal, vertical and two bisectors) in an area of 1 m2. For reasons of accuracy, only the
cracks having opening widths greater than 0.05 mm (threshold of visual detection) are recorded.
A “cracking index” (CI) which is used to indicate the extent of cracking, is calculated by the
mean of total crack opening per meter (mm/m). This index can be calculated for each axis, or
evaluated for the zone:
CI on an axis = the mean of the width of the cracks divided by the length of the axis
CI of the zone = the mean of the four cracking indexes measured on the axes
Measurement of deformation
The measurement uses topographical distance measuring equipment. The principle is based on
the propagation between transmission and reception by optical reflectors. Generally, the value
(Dm) is expressed as the deformation per year like: mm/m/ year.

Chapter I
20
Analysis of the results of cracking and deformation
Initial cracking and deformation are the signals that attract attention to the pathology of the
structures. The following surveillance is important to evaluate the behaviour of the structures
over time. After a long period of close observation, the results can be analyzed on the damage
degree of the structures. Usually a structure with deformation greater than 0.5 mm/m/year is
considered as seriously affected by an expansive reaction [Fasseau et al. 2003].
4.2. Fluorescence uranyl test
The purpose of this test is to determine whether ASR is the reason for the observed cracking,
because the presence of deformation and cracking can be caused by other problems. The
examination of the products on the surface of cracking is helpful to determine the pathology.
Fasseu et al. [2003] suggests the fluorescence test: the products of ASR are identified by
“staining” them with uranyl ions, which have a characteristic greenish yellow fluorescence under
short-wave UV light (Figure I-6)
Figure I-6 Test of cores with uranyl acetate under UV light in [Fasseu et al. 2003]
This method is rapid to test the presence of ASR gel but it cannot exclude the presence of DEF
crystal. Thus SEM or other petrographic methods are necessary to identify ASR. Figure I-7
shows the different forms of ASR gel and DEF crystals under the test of SEM.

Chapter I
21
(a) ASR gel (b) DEF
Figure I-7 ASR gel and DEF crystals in the test of SEM [Fasseu et al. 2003]
4.3. Residual expansion
The most usual test to measure the residual expansion of the damaged structures is conducted on
cores extracted from the ASR affected structures under conditions of storage at 38°C and 95%
R.H. (Relative Humidity). A classic expansion curve is shown in Figure I-8 [LPC 1997].
Residual expansion
Figure I-8 Residual expansion curve (at 38°C, R.H.> 95%) [LPC 1997]
Phase A: This period can vary largely, but according to the [LCPC 1997], this period is
considered as the first 8 weeks. The expansion of this period is mostly due to hydraulic shrinkage
and the absorption of water by the hydrophilic products. Therefore, the expansion in phase A is
not taken accounts in the ASR expansion. However, it arises the discussion about whether no
ASR expansion occurs during in this period [Multon et al. 2008].

Chapter I
22
Phase B: The expansion during this period (8~52 weeks) is mainly attributed to ASR
swelling. The curve increases slowly, and shows no evident asymptotic aspect. The swelling of
this phase is generally thought to be representative of the residual expansion.
Phase C: This phase lasts about two months. The reduction of the expansion can be
attributed to desiccation when the samples are taken out of the humid environment.
Requalification of structures affected by ASR
5. Requalification of structures affected by ASR
Considering the consequences of AAR (such as internal cracking, surface cracking, displacement
of structures), the owners seek to know whether the reaction is almost finished or whether there
still remains many years of swelling. Thus, an evaluation of the potential AAR expansion could
help the owner to make a reliable choice between different scenarios, including the demolition of
the structure or the implementation of repair solutions. In this part, a few requalification methods
are presented.
5.1. Method of Léger [Léger et al. 1995]
The advantage of this model is that it takes several factors into account in detail: external factors
(compressive stress, temperature, and moisture), material factors (reactivity of the aggregates)
and mechanical consequences. The methodology is based on the assumption that the observed
concrete expansion is proportional to the applied and induced compressive stress state,
temperature, moisture and the reactivity of the concrete constituents. The numerical modelling of
the structure swelling process is rationalized with the evaluation of these elements. The
methodology is given in Figure I-9.
Moisture model
FM
Temperature model
FT
Reactivity model
FR
Mechanical model
FC
Spatial distribution of AAR expansion
CTMR (x, y, z) = [FC* FT *FR *FC ]
Magnitude of AAR expansion
Displacement (x, y, z) = β * CTMR (x, y, z)
(β: a calibration factor to adjust the computed displacements against the observed ones)
Figure I-9 AAR simulation model [Léger et al. 1995]

Chapter I
23
5.2. Method of LCPC The methodology proposed by the LCPC (Laboratoire Central des Ponts et Chaussées) is
described in [Li et al. 2000, Li et al. 2001, Li and Coussy 2002, Seignol et al. 2009]. This
method highlights the effect of the material on ASR (Figure I-10). It builds a model considering
the reaction swelling kinetics at a material level. This material model is calibrated with the in situ
structural data, and then a comprehensive time-space scaled assessment is conducted by a two-
step algorithm for the model parameter calibration. This part emphatically introduces the
material model, and roughly presents the necessary data for the in situ investigations.
Material modeling of ASR swelling
Describe the overall reaction-swelling kinetics in
an elastic/elasto-plastic media under thermal
hydrometric condition
Inverstigations
-Residual expansion test
- In situ: structural evolution,
thermal-hydrometric conditions
Structure assessment
-Retrieve the structure degradation history
-Determine the present mechanical state
- predict the future structural behaviors
Figure I-10 Diagram of “consistent assessment method”
1) Material modelling of ASR swelling:
The material model involves two aspects: the progressive formation of expansive ASR product
and the material response to this internal swelling. The authors use “the system free energy” (as
in Equation I-2) which takes account of material elastic deformation energy and chemical energy
to characterize the reaction‟s progress.
Ψ (ε, ) = ½ Es (ε-κ )2 + ½ Em ε2 + ½ A0 (1- )2
Material elastic deformation energy ASR chemical energy
(I-2)
Ψ: the system free energy
ε: the reversible material deformation
: the global reaction-expansion extent in a range of [0,1]
κ: the coefficient of ASR expansion
Es: the modulus representing the internal pressure exerted by the swelling gel
Em: the modulus withstanding the autogeneous tension in the solid matrix
A0: the initial chemical force

Chapter I
24
This model (chemo-elastic model) is only suitable for laboratory conditions with free expansion
and it cannot be used in structures with severe material degradation (like cracking and surface
delamination). To apply it to degraded structures, which have an evident structure effect on the
degradation, the authors modified this model and built two other models (imposed chemo-plastic
model and coupled chemo-plastic model). In these two models, two parameters: the irreversible
deformation εp and the internal hardening variable χ are introduced to characterize the plastic
characteristics of the material.
Imposed chemo-plastic model:
Ψ [(ε-εp), χ, ) = ½ E[ (ε- εp)- β ]2 + ½ Eh χ2 + ½ A0 (1- )2
(I-3)
Coupled chemo-plastic model:
Ψ [(ε-εp), χ, ) = ½ E (ε- εp)2 + ½ Eh (β- -χ)2 + ½ A0 (1- )2
(I-4)
2) Investigations
The investigations included: a) the laboratory test of residual expansion conducted with the
extracted cores, b) in situ investigation which includes the structural evolution involving the
detection of the structure dimensional variation and surface cracking evolution of the attacked
concrete, and the thermal-hydrometric conditions including analyses of the internal temperature
and humidity of the structure.
5.3. Method of Saouma
This model is described in [Saouma and Perotti 2006, Saouma et al. 2007, Saouma 2009]. The
model is rooted in the chemistry (kinetics of the reaction), physics (crack gel absorption, effect
of compression) and mechanics of concrete. Considering all the factors, the expansion can be
deduced on the basis of the following equation:
vAAR (t) = t ( t’∣ , σ1∣COD max) c (σ’, c’) g (H) (t, ) ε∞∣ = 0
gel absorption
effect of compression
effect of humidity
chemical evolution
final expansion
(I-5)
This equation of volumetric ASR strain is composed of five elements:

Chapter I
25
t (є [0,1] ) is a function that reduces the expansion in the presence of large tensile stresses
(macrocracks absorbing the gel).
c (є [0,1] ) accounts for the reduction in ASR volumetric expansion under relatively high
compressive stresses (microcracks under compression and gel expansion reduction due to pluri-
axial state of compressive stresses).
g(H) represents a reduction function on account of the relative humidity.
(t,) expresses the chemical evolution depending on reaction time and temperature. This kinetic
law is taken from the work of Larive [1998]. ε o is the final volumetric expansion as
determined from laboratory tests at temperature 0.
Based on the above theory, a methodology of structure evaluation is proposed as shown in
Figure I-11. Since ASR is a thermodynamically induced reaction, the thermal analysis can
provide a temporal map of the internal temperature. Following the thermal analysis, the stress
analysis is performed on the difference between actual and stress-free temperature. In this step,
the thermal temperature must be transformed to temperature of stress since different finite
element meshes are used in these two calculations. The system identification includes the
determination of chemical kinetics parameters, the structure analysis with an initial set of
assumptions, the comparison of computed results with displacements recorded on the dam, and
an update of the input parameters.
1.Thermal analysis
2.Stress analysis
3.System identification
Structure evaluation
Figure I-11 Diagram of analysis procedure of structure evaluation
5.4. Method used in LMDC
5.4.1. Background of the method
In the past two decades, the modelling of ASR in evaluating affected structures has developed
significantly. The conventional residual expansion method can be used to evaluate the chemical
kinetics. The main experimental condition is “storing the specimens at 38°C and in Relative
humidity > 95% ”, However, there are numerous criticisms that can be made of this method:
1) Relative humidity
Bérubé and Frenette [1994] showed that the condition of humidity higher than 95% made the
results subject to variations among labs, and thus led to bad repeatability and reproducibility.

Chapter I
26
This can be explained by the difficulty of precisely controlling such R.H. during the experiments,
and RH variations between 95 and 100% can lead to significant variations of ASR expansions
[Poyet et al. 2006].
2) Alkali leaching
Alkali leaching is the loss of alkali of concrete into the external environment. This phenomenon
was found and attested with a mortar bar in air with relative humidity > 95% [Bérubé et al. 2002,
Rivard et al. 2003, Rivard et al. 2007] or in water/solution [Roger and Hooton 1991]. Due to the
alkali leaching from the concrete, the ASR expansions can be stopped by the lack of alkali.
3) Composition of ASR gels
The composition of the gel produced by the alkali silica reaction is greatly influenced by the
environmental conditions (such as temperature, RH, alkali content). The gel obtained in the
laboratory is different from the gel found in situ regarding the nature and chemical composition
[Grimal 2007, Grimal et al. 2008, Sellier et al. 2009]. In some cases, gels from concrete cast in
the laboratory show a high alkali concentration (Figure I-12a) while gels from in-situ concrete
cores show a small alkali content and are often crystallized (Figure I-12b).
(a) ASR gel produced in accelerated conditions (b) ASR gel in field
Figure I-12 SEM and EDS of gels in laboratory and gels in field
[Grimal 2007, Sellier et al. 2009]

Chapter I
27
Urhan [1987] attributes this difference of gel between laboratory and in situ structures to the
impact of temperature on the chemical equilibrium of gel production. The “residual expansion
test” is conducted at a higher temperature (38°C) than the average in situ temperature of the
attacked structures (23°C), in the aim of obtaining the potential expansion in a short time [Fasseu
et al. 2003, Rivard 2002]. This difference of temperatures leads to a variation of chemical
products.
Some other authors think that the reason for gel variation should be the substitution process
between alkalis and calcium as it is known that alkalis can be substituted by calcium. However,
this process occurs only over a long period [Lagerblad and Trägardh 1992] [Jensen 1993]
[Duchesne and Bérubé 1994]. In other words, this substitution takes place mostly in the field
cases, and rarely occurs in laboratory tests since the duration of laboratory tests is always one or
two years.
4) Effect of aggregate size
In cores drilled from large structures like dams, the time necessary to reach the centre of the
large aggregate is considerably longer than 52 weeks even in accelerated conditions. This could
explain why the curve of the residual expansion test does not reach a final asymptote. It is
suggested that the duration of 52 weeks given by the method is not sufficient to show the total
expansion that can be expected for the tested concrete.
5) Direction of coring
The casting direction has an important effect on the expansion since the behaviour of concrete is
often anisotropic [Larive, 2000, Multon et al. 2008, Smaoui et al. 2004]. Thus, cores obtained
along different directions can lead to different residual expansions. This difference between the
axial and transversal cores leads to large scatter in the results, and leads to difficulties in
obtaining a reliable assessment.
Considering the imprecision of the “conventional residual expansion test”, especially the notable
failure of this test to predict the expansion of Temple-sur-Lot dam (in France) [Grimal 2007]
[Sellier et al. 2009], a new method has been developed.
5.4.2. Methodology of LMDC method
The aim of LMDC method was to assess the safety level of degraded structures with a finite
element code [Bourdarot et al. 2010, Grimal 2007, Sellier et al. 2009].This method takes account
of the long-term behaviour of ASR gels with the substitution between alkali and calcium. The
substitution guarantees a continuous regeneration of alkali, which can thus react with the totality
of the reactive silica. Therefore, the method pays attention to the consumption of silica with a
sufficient supply of alkali. The method involves a laboratory test dealing with the silica
consumption kinetics and a numerical finite element inverse analysis of the dam, which includes
the consumption kinetics measured in the laboratory. The kinetic coefficient of the model is
determined in the laboratory and the final swelling amplitude is fitted using only one observed
structural displacement rate. The model prediction capability has been validated through the

Chapter I
28
comparison between the displacement of instrumented points predicted by the calculations (not
used for the fitting) and the variations measured on the dam.
The method consists of three steps (Figure I-13):
Affected structure
Structure monitoring:-Displacements-Temperature-Moisture
Cores drilled from:-wet zone-dry zone-different place of structure
Step 1
Laboratory tests:Build reactive silica consumption kinetics for each drillingzone and for different aggregate size ranges
Step 2
Finite element inverse analysis of the affected structure with-environnemental conditions-reactive silica consumption kinetic
Step 3
Figure I-13 Plan of the LMDC method [Grimal 2007, Sellier et al. 2009]
1) In-situ measurement of the affected structure. The purpose of this step is to collect the
information necessary for the modelling step. The information should include the surveillance of
displacements, temperatures, and moisture of the affected structures. It should also contain the
information from the different core samples: the saturation degree, the aggregates and cement
used in the concrete.
2) Tests in laboratory. The tests in laboratory are conducted with the aggregates recovered
from the damaged structures. The purpose is to assess the consumption kinetics of reactive
aggregate under the consideration of the aggregate size effect.
3) Finite element inverse analysis of the affected structure. This step combines the results
of step 1) environmental conditions and step 2) reactive silica consumption kinetics to obtain
swelling amplitude.
Finally, calculations are performed to predict the future displacements and damage fields of the
dam. The damage degree can be given as in Figure I-14 to show the progress of degradation.

Chapter I
29
Figure I-14 The damage degree of the structures attacked by ASR [Grimal 2007]
5.4.3. Principle and application of the method
5.4.3.1. Principle
The principle of the method involves mainly the silica consumption kinetics, which is based on
the following assumptions:
The chemical advancement of the reaction can be presented by the degree of silica consumption,
which varies with different reaction time (Equation I-6). For a certain aggregate size, the value
of A is in the range of 0~1 (0: the beginning of the reaction, 1: the completion of the reactive
silica reaction).
)0(
)()(
tSi
tSitA
reactive
reacted
(I-6)
Si reacted
represents the silica consumed at time t,
Si reactive
represents the total reactive silica content of the aggregate
The kinetic law shows that the chemical advancement is a function of the degree of saturation Sr
and the temperature T [Grimal, 2007, Grimal et al. 2008, Poyet 2003, Poyet et al. 2004], thus the
derivative of chemical advancement with respect to the reaction time t can be presented in
Equation I-7:

Chapter I
30
)(1
11exp ASr
Sr
SrSr
TrefTR
Ea
t
Athreshold
threshold
ref
(I-7)
αref: the constant of the kinetics,
Ea: the activation energy of the AAR (~47 kJ/M),
R: the gas constant (8.31 J/M/K)
Tref: the absolute temperature of the test,
T: the current absolute temperature
Sr: the degree of the saturation of concrete porosity
Sr threshold
is the minimal saturation degree necessary to allow the evolution of the chemical
reaction, equal to 0.2 according to the value of [Grimal 2007].
Sr can be obtained from the non-linear equation of mass transfer and solved numerically with the
finite element method and boundary conditions imposed from the measurement of in-situ degree
of the saturation [Grimal 2007, Sellier et al. 2009].
The mechanical advancement of the reaction can be expressed by the increase of the volume of
aggregate (ΦASR
), which is caused by the production of gel. Supposing that all the gel effect is
isotropic in a free swelling specimen, then:
0)()( _ thresholdASRASRASR tAt (I-8)
If the aggregate is sufficiently large, which means ΦASR
>>ΦASR_threshold
, the total expansion can
be expressed as Equation I-9 and shown in Figure I-15:
ASR
ASR tA )(
(I-9)
Figure I-15 Variation εASR
, A, Φ with time

Chapter I
31
5.4.3.2. Application
The application of the method is based on the testing of aggregates extracted from two types of
cores drilled from the affected structures, which have been called sound aggregates and affected
aggregates.
Silica consumption kinetics with sound aggregate
The sound aggregates come from sound zones of large aggregates or can be taken in dry zones
of the structure. The purpose of using this type of aggregate is for knowing the reactive silica in
the aggregate (Sireactive
).
Evaluate the structure with affected aggregate
The affected aggregates can be extracted from wet zones or zones affected by ASR. From the
laboratory tests of this type of aggregate, the residual reactive silica (Siresidual
= Sireactive
–Si reacted
)
can be obtained. If the time of drilling cores is t1, which is relative to the time from the
construction of the structure to the time of drilling core, then the chemical advancement A(t1)
can be calculated from Equation I-10:
reactive
residual
reactive
reacted
Si
Si
Si
SitA 1)1(
(I-10)
Since the chemical advancement is independent of the absolute expansion of the structures, this
A(t1) value, deduced from the laboratory condition, can also represent the chemical
advancement of silica consumption in the field. Thus, the kinetics constant of the expansion can
be deduced from Equation I-11:
)1(
)(1
11
1
1
0
tA
dtASrSr
SrSr
TTR
Eaxpe
threshold
threshold
ref
tt
t
efr
(I-11)
Once the kinetic constant is known, the assessment of the swelling amplitude can be conducted
with the displacements in the field (Equation I-9). And then, the finite element method
(including the mechanical aspect – creep and damage effects) can be used. To summarize the
fitting process, the swelling is assumed to be proportional to the advancement rate and
proportional to the amplitude ASR, and thus the advancement rate is proportional to the
advancement and proportional to the amplitude ASR as shown in Equation I-12:
ASR
ASR
t
tAt
)()(
ASR
threshold
threshold
ref ASrSr
SrSr
TrefTR
Ea
)(
1
11exp
(I-12)

Chapter I
32
The only unknown parameter is ФASR
. This value can be obtained through curve fitting with the
measurements of in-situ displacement (Figure I-16).
)(tASR
Time (t) 0
1
Mesure in situ
Figure I-16 Curve fitting of ASR
In summary, the LMDC method can determine the chemical kinetics of aggregate consumption
of the structure in the field (with the parameters of saturation degree and temperature) through
the laboratory experimental analysis of the sound aggregate extracted from the sound zone of the
affected structure. It can also evaluate the damage degree of the concrete and predict the future
deterioration by analyzing the chemical kinetics of the aggregates extracted from the damaged
zone of the affected structure.
6. Plan of the thesis
According to the knowledge referred above, the requalification of ASR affected structures
involves: 1) knowing the chemical advancement of silica consumption in aggregate recovered
from the structure, 2) combining the chemical advancement analysis with environmental
conditions in the field to evaluate the structure. This work focuses on improving laboratory
tests to assess the chemical advancement of silica consumption. In the previous work [Grimal
2007], only expansion tests were performed to assess the ASR advancement in the aggregates.
This work focuses on a direct method of "chemical test" to measure the silica content and an
indirect method of "expansion test" to know the expansion caused by reactive aggregate are
proposed, and then a chemo-mechanical method is used to analyze these two methods and assess
the chemical advancement. The work is separated into four chapters:
Chapter 2 (optimization of an expansion test) aims to find a fast and relevant method to assess
the expansion in a laboratory test. In this method, the conservation conditions of specimens and
the size of specimen and aggregate are taken into account. Several aggregates are tested with the
method to verify whether the expansion test can differentiate between the reactivity of different
aggregates.
Chapter 3 (chemical measurement of reactive silica in aggregate) has the purpose of finding a
fast and convenient chemical method to measure the reactive silica of aggregate. Inspired by the

Chapter I
33
analysis of existing methods, acid and/or basic attacks are chosen to test different types of
aggregates. Combined with the mineralogical studies - XRD and petrography - and the
expansion results, the chemical results are compared and discussed.
Chapter 4 (chemo-mechanical modelling) develops a chemo-mechanical model to analyze the
expansion of a given mortar. This chapter includes two parts: 1) development of a microscopic
model based on previous work [Multon et al. 2009] to understand the mechanism involved in the
reaction; 2) relation between the microscopic model and the structural requalification.
Chapter 5 (Methodology to assess the kinetics constant of expansion) aims to introduce the
kinetics constant of expansion which is helpful to re-build the expansion kinetics in the
framework of structural modelling. The significance of this parameter in the laboratory test is
introduced firstly, and then a methodology to calculate the kinetics in the framework of structural
requalification is proposed.
At the end, a general conclusion is made on summering the main results of this work and
proposing some perspectives for the future works.

Chapter II
34
Chapter 2
Optimization of an Expansion Test
1. Introduction
This chapter aims to improve a laboratory method for expansion measurement since the usual
tests appear to be difficult to use in structural assessment. The development involves optimizing
the conservation conditions and the size of the specimen and aggregate. A combined effect of the
aggregate and specimen sizes on ASR expansion is thus pointed out: for a given mortar, the
expansion is lower in small specimens than in large specimens. Therefore, the ratio „specimen
size / aggregate size‟ has to be sufficiently high to decrease this scale effect and obtain relevant
measurements. The discussion finally suggests how this test can be optimized to provide fast and
relevant results for use in structure reassessment.
The most usual test is the residual expansion test at 38°C in air at 95% RH, which is performed
on cores drilled from damaged structures [Bérubé et al. 2002, Fasseu et al. 2003, Multon et al.
2008]. However, several criticisms can be made of this usual laboratory test: (1) the reactive
silica in the core of the aggregates is never reached in a short time because of the large size of
the aggregates used in structures (the asymptotic expansion is not achieved after one year of
measurement) [Sellier et al. 2009] (2) the ASR-gels do not have the same composition in
accelerated tests as in real structures because of the impact of temperature on chemical
equilibrium [Urhan 1987] and the substitution process between alkalis and calcium [Duchesne
and Bérubé 1994, Lagerblad and Trägardh 1992, Jensen 1993] (3) alkali leaching during the tests
can have a deleterious effect on the assessment of the asymptotic expansion [Bérubé et al. 2002,
Rivard et al. 2003, Rivard et al. 2007, Rogers and Hooton 1991], (4) the high moisture
conditions (higher than 95% RH) are difficult to control, which leads to significant variations of
ASR expansions for RH ranging between 95 and 100% [Poyet et al. 2006]. It therefore seems
unrealistic to use the ASR-expansions obtained on cores in accelerated conditions to assess the
future expansion of concrete in the damaged structures. This view has been proved correct in the
structural analysis of a French dam (small residual expansion in accelerated laboratory test and
significant expansion measured on the dam) [Grimal 2007, Sellier et al. 2009]. Therefore, a
method has been proposed to use reliable experimental information and avoid the uncertainty
due to imperfect conditions of control in laboratory tests [Sellier et al. 2009]. In this method, the

Chapter II
35
future ASR expansions are determined through a finite elements analysis of the structures using
two experimental data:
1) measurements performed directly on the structures to determine the amplitude of ASR
expansion,
2) laboratory expansion tests on aggregate extracted from the structures to assess the expansion
kinetics.
The laboratory tests are necessary to determine how the reaction advances according to the size
of the aggregate [Sellier et al. 2009].
The aim of this chapter is to optimize the expansion test in terms of conditions of conservation,
size of specimens and size of aggregates. Several experimental conditions were tested in order to
rapidly evaluate the totality of the residual reactive silica. The conservation of the specimens
should guarantee that all the residual reactive silica is consumed in a short period of time. Tests
were carried out in NaOH solutions so that there was enough alkali to consume all the reactive
silica, and at 60°C to accelerate the reaction. Alkalis had to reach all the reactive silica quickly.
Therefore, the specimens and the aggregates could not be too large in order to decrease the time
for alkalis to diffuse in the specimens and in the whole aggregate. Finally, the tests were
performed on several types of rocks to verify whether they could differentiate between the
reactivity of different aggregates.
2. Basic knowledge
In order to use the results of expansion tests performed on specimens damaged by ASR for
structure requalification, it is necessary to understand the effect of the size of the aggregate
[Bakker 1983, Baronio et al. 1987, Diamond and Thaulow 1974, Feng et al. 2002, Hobbs and
Gutteridge 1979, Kawamura et al. 1983, Kelly et al. 1948, Kodama and Nishino 1986, Kuroda et
al. 2004, Lenzner and Ludwig 1980, McConnell et al. 1947, Ramyar et al. 2005, Vivian 1951,
Xie et al. 2003, Zhang and Groves 1990, Zhang et al. 1999]and the size of the specimens
[Duchesne and Bérubé 2003,Smaoui et al. 2004, Zhang et al. 1999] on the measured expansion.
With this in mind, the development of ASR expansion can be described in several steps:
1. Hydroxyl ions present in the cement paste reach and diffuse in the aggregates (Figure II-1a).
2. Hydroxyl ions attack reactive silica, followed by the reaction with alkalis in the cements, and
create ASR gel in and around the aggregate. The external periphery of aggregate will be attacked
firstly since the hydroxyl ions contained in cement paste arrive to attack reactive component of
aggregate primarily. The gel can fill the connected porous volume surrounding the aggregate in a
thickness tc without leading to damage [Furusawa et al. 1994, Multon et al. 2009, Poyet et al.
2007] (Figure II-1b).
3. Once the connected porosity is filled, the pressure in the gels increases and causes cracking of
the aggregate and the cement paste surrounding the aggregate [Multon et al. 2009]. The
propagation of cracks in specimens with large „size of the aggregate‟ to „size of the specimen‟
ratios is rapid and can occur for low pressures whereas it is more difficult for larger specimens
and needs higher pressure (Figure II-1c). This scale effect can be justified by fracture mechanics

Chapter II
36
concepts [François et al. 1993, Lemaître and Chaboche 1988]. The maximal normal stress in the
vicinity of an inclusion is given by:
r
Kr I
2
(II-1)
where is the maximal normal stress at the point M located at r, the distance from the edge of
the inclusion (Figure II-1c) and KI is the stress intensity factor obtained from the relation:
L
RfpK a
gI
(II-2)
where f is a function increasing with the ratio Ra/L, with Ra, the radius of the aggregate and with
L, the dimension of the specimen. Assuming that the aggregates have spherical shapes, and pg,
the gel pressure can be assessed from [Multon et al. 2009, Multon et al. 2010]:
333
3
4
3
4aca
m ol
gelagg RtRsVRMp
(II-3)
with Mg the gel elastic modulus, s the reactive silica content, Vgelmol
the molar volume of the gel,
the concrete porosity, and tc the thickness along which the gel can migrate from the aggregate
to the cement paste.
Fracture mechanics concepts show that the greater the ratio „size of the aggregate‟ to „size of the
specimen‟, the larger the normal stress at a given distance from the aggregate. Thus, the greater
this ratio is, the smaller the pressure can be in the gel to reach the tensile stress at the boundary
of the specimen (Figure II-1c).
4. Once cracks have reached the boundary of the specimens, ASR gels can be absorbed by the
cracks [Saouma and Perotti 2006] and then leach off through the porosity induced by cracking,
thus the pressure in the gels falls, which stops the expansion (Figure II-1d). If the cracks occur at
lower pressure, i.e. for experiments with high „size of the aggregate‟ to „size of the specimen‟
ratio, lower expansions can be measured, as observed in previous experimental works [Bakker
1983, Zhang et al. 1999].
Na+, K+
Na+, K+
Na+, K+
a)
boundary of
the specimen
connected porosity
filled by the gel
b)
boundary of
the specimen
c)
boundary of
the specimen
d)
boundary of
the specimen
r
r
ft
ft
crack filled
by the gel
gel
exudation
Na+, K+
Na+, K+
Na+, K+
a)
boundary of
the specimen
Na+, K+
Na+, K+
Na+, K+
a)
boundary of
the specimen
connected porosity
filled by the gel
b)
boundary of
the specimen
c)
boundary of
the specimen
d)
boundary of
the specimen
r
r
ftft
ftft
crack filled
by the gel
gel
exudation
Figure II-1 Development of ASR-gels in four steps:a) Diffusion of alkali in aggregates, b) Filling of
connected porosity by ASR-gels,c) Tensile stresses in the cement paste around aggregate compared to
tensile strength,d) Permeation of ASR-gels through cracks and exudation on the external boundary
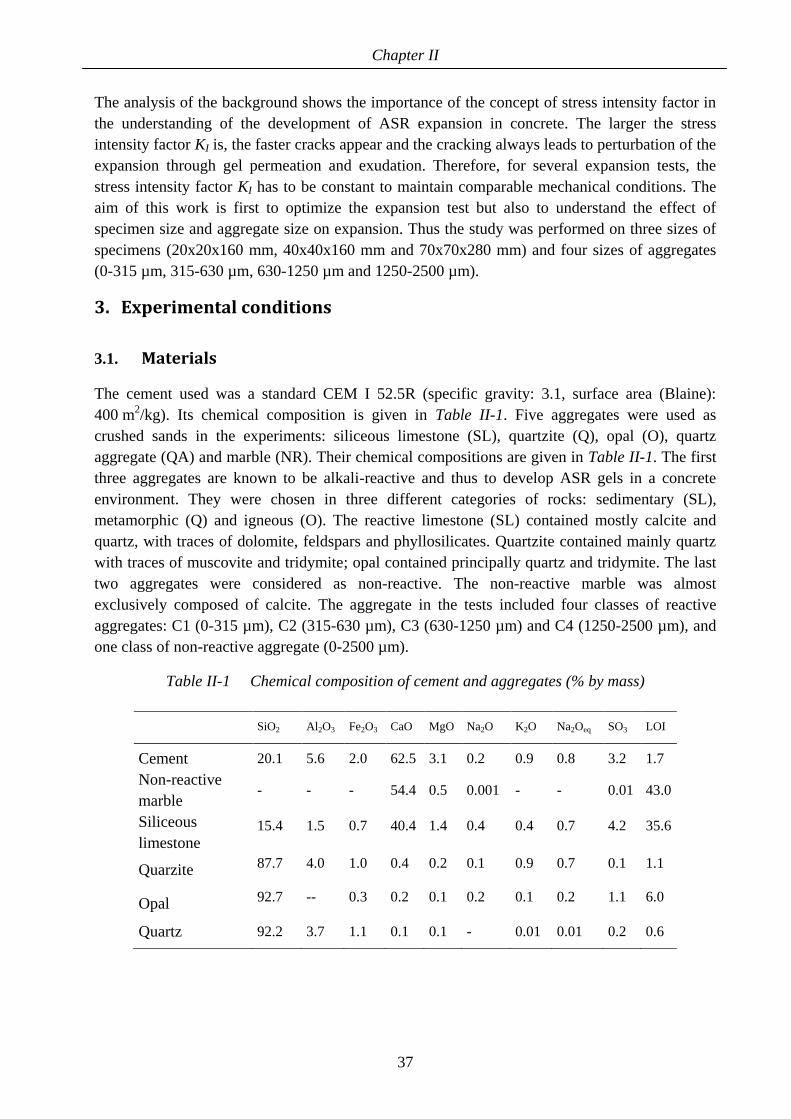
Chapter II
37
The analysis of the background shows the importance of the concept of stress intensity factor in
the understanding of the development of ASR expansion in concrete. The larger the stress
intensity factor KI is, the faster cracks appear and the cracking always leads to perturbation of the
expansion through gel permeation and exudation. Therefore, for several expansion tests, the
stress intensity factor KI has to be constant to maintain comparable mechanical conditions. The
aim of this work is first to optimize the expansion test but also to understand the effect of
specimen size and aggregate size on expansion. Thus the study was performed on three sizes of
specimens (20x20x160 mm, 40x40x160 mm and 70x70x280 mm) and four sizes of aggregates
(0-315 µm, 315-630 µm, 630-1250 µm and 1250-2500 µm).
3. Experimental conditions
3.1. Materials
The cement used was a standard CEM I 52.5R (specific gravity: 3.1, surface area (Blaine):
400 m2/kg). Its chemical composition is given in Table II-1. Five aggregates were used as
crushed sands in the experiments: siliceous limestone (SL), quartzite (Q), opal (O), quartz
aggregate (QA) and marble (NR). Their chemical compositions are given in Table II-1. The first
three aggregates are known to be alkali-reactive and thus to develop ASR gels in a concrete
environment. They were chosen in three different categories of rocks: sedimentary (SL),
metamorphic (Q) and igneous (O). The reactive limestone (SL) contained mostly calcite and
quartz, with traces of dolomite, feldspars and phyllosilicates. Quartzite contained mainly quartz
with traces of muscovite and tridymite; opal contained principally quartz and tridymite. The last
two aggregates were considered as non-reactive. The non-reactive marble was almost
exclusively composed of calcite. The aggregate in the tests included four classes of reactive
aggregates: C1 (0-315 µm), C2 (315-630 µm), C3 (630-1250 µm) and C4 (1250-2500 µm), and
one class of non-reactive aggregate (0-2500 µm).
Table II-1 Chemical composition of cement and aggregates (% by mass)
SiO2 Al2O3 Fe2O3 CaO MgO Na2O K2O Na2Oeq SO3 LOI
Cement 20.1 5.6 2.0 62.5 3.1 0.2 0.9 0.8 3.2 1.7
Non-reactive
marble - - - 54.4 0.5 0.001 - - 0.01 43.0
Siliceous
limestone 15.4 1.5 0.7 40.4 1.4 0.4 0.4 0.7 4.2 35.6
Quarzite 87.7 4.0 1.0 0.4 0.2 0.1 0.9 0.7 0.1 1.1
Opal 92.7 -- 0.3 0.2 0.1 0.2 0.1 0.2 1.1 6.0
Quartz 92.2 3.7 1.1 0.1 0.1 - 0.01 0.01 0.2 0.6

Chapter II
38
3.2. Sample preparation
Mortars had a water-cement ratio of 0.5 and a sand (1512 kg/m3) - cement (504 kg/m
3) ratio of 3.
For the reference specimens, the sand was only composed of the non-reactive marble. For all the
other specimens, the sand contained 30% of the aggregate under study and 70% of non-reactive
marble. (Since the objective of this test is to research the effect of aggregate size and specimen
size in the condition of enough alkalis, the pessimum of the reactive aggregate content was not
considered. The percentage of 30% was used for all the types of aggregate in order to have a
reliable expansion without changing the granularit. Also, the previous studies in [Multon et al.
2010] under 60°C, R.H. > 95% were conducted with 30% reactive aggregate. To comparing with
the previous works, in this study, the same percentage was used.) Mixtures were adjusted to
fixed alkali contents (Na2Oeq) by adding NaOH in the mixing water in order to have an alkali
concentration in the mortar pore solution close to the concentration in the conservation solution
(0.77, 1.0 and 1.25 mol/l).
3.3. Expansion measurements
Deformation was measured on mortar prisms (20x20x160 mm, 40x40x160 mm and
70x70x280 mm) using the scale micrometer method (specimens had shrinkage bolts in the two
extremities). Each length change value was the mean of three values from three replicate
specimens. Expansion measurements were performed after the prisms had cooled from the
conversation temperature to 20ºC (~12h) in the NaOH solution.
3.4. Specimen conservation
3.4.1. Procedure
After demoulding, the specimens were first kept in sealed bags at 20°C for 14 days. Then, they
were immersed in NaOH solutions for the 14 following days. The aim of this step was to obtain
the same concentration of alkali in the pore solution as in the conservation solution. It was also
intended to decrease the non-ASR expansion due to water absorption. The expansions were
measured during this period, and the same amplitudes were obtained for both reactive and
reference specimens. Thus, it was deduced that the expansions of the reactive specimens in this
period were due to water absorption, and they were therefore neglected in the following analyses.
After this period, the temperature of the solutions was increased to 60°C.
3.4.2. Choice of the solution concentration
In order to test the effect of alkali concentration on ASR expansion, mortars containing siliceous
limestone were kept in NaOH solutions of three different concentrations: 0.77, 1.0 and
1.25 mol/l. The mortars contained 15% of the size class C2 (315-630 µm), 15% of the size class
C3 (630-1250 µm) and 70% of the non-reactive aggregate. The solutions were changed at about
250 days in order to verify if the alkali concentrations were still sufficient to react with aggregate.

Chapter II
39
The curves of the reactive mortars showed high initial rates of swelling (Figure II-2), followed
by a low rate of expansion up to a final asymptote. The final expansions for the three
concentrations 0.77, 1.0 and 1.25 mol/l were 0.70%, 0.65% and 0.60% respectively. The
difference between two consecutive concentrations appeared to be negligible considering that the
standard deviation for the specimens was in the range of 0~0.02%. Finally, no changes were
observed in the expansion rates at 250 days when the solutions had been changed (Figure II-2).
Thus, the alkali concentrations could be considered to have little influence on ASR expansions in
our tests, and an NaOH concentration of 1 mol/l was chosen for the following tests.
-0.1
0
0.1
0.2
0.3
0.4
0.5
0.6
0.7
0.8
0 100 200 300 400 500 600Time (days)
% s
tra
in
SL-0.77
SL-1.0
SL-1.25
R-0.77/1.0/1.25
Figure II-2 Expansions on specimens with siliceous limestone (SL) and with non-reactive
limestone (reference R) kept in NaOH solutions (0.77, 1.0 and 1.25 mol/l)
4. Combined effect of aggregate and specimen sizes
4.1. Mortar mixtures
In order to study the effect of the size of the specimens, three kinds of prisms were used:
20x20x160 mm, 40x40x160 mm and 70x70x280 mm. The particle size distributions were
obtained by adding 30% of reactive aggregate of the four different size classes (C1, C2, C3, C4)
to 70% of a continuous size distribution (0–2500 µm) of non-reactive aggregate, the particle size
distributions were different for the five mortars. A previous study on these kinds of mixtures
[Multon et al. 2010] had shown that the effect of the difference of particle size distributions on
the porosity of mortars did not appear to be significant. During the casting process, super
plasticizer was added for the fines aggregate under the consideration of the workability of the
mortars. During the experiments, all mortar prisms were conserved at 60°C in the 1 mol/l NaOH
solution.

Chapter II
40
4.2. Experimental results
For the non-reactive aggregate, the final expansion is 0.015%, the final mass variation is 1.03%.
In order to assess mass variations and expansions only due to ASR, net values were calculated
and used in the following parts of the study. They were obtained by subtracting the
measurements of reference mortars (without reactive aggregate) from those obtained on the
reactive specimens. Figures II-3, II-4 and II-5 present the mass variations and the ASR
expansions obtained on 20x20x160 mm, 40x40x160 mm and 70x70x280 mm specimens,
respectively. All the curves show a high and increasing initial rate of mass and swelling,
followed by a decrease of the rate until a long-term asymptote is reached.

Chapter II
41
(a) Mass variation
(b) expansions
Figure II-3 Kinetics curves of prismatic specimens 20x20x160 mm containing the
reactive aggregate siliceous limestone kept in NaOH solution (1.0 mol/l)

Chapter II
42
(a) Mass variation
(b) expansions
Figure II-4 Kinetics curves of prismatic specimens 40x40x160 mm containing the
reactive aggregate siliceous limestone kept in NaOH solution (1.0 mol/l)

Chapter II
43
(a) Mass variation
(b) expansions
Figure II-5 Kinetics curves of prismatic specimens 70x70x280 mm containing the
reactive aggregate siliceous limestone kept in NaOH solution (1.0 mol/l)

Chapter II
44
In addition to the expansion measurement, the cracking patterns were observed and the crack
widths were measured at 290 days with a video-microscope (Figure II-6). Crack widths were
assessed on 15 points taken in at least 15 regions of the specimens in order to obtain relevant
average values. No cracking was observed for the reference prisms and for the prisms containing
the particles of size C1 (0~315µm), which is in accordance with the small expansion. For the
other specimens, the crack widths are given in Table II-2. The largest specimens
(70x70x280 mm) presented the widest cracks (Figure II-6 and Table II-2). The smallest prisms
(20x20x160 mm) had the smallest cracks (Figure II-6 and Table II-2), which were below the
measurement limit of the video-microscope (<10 µm). These differences between the large
specimens and the small ones can be explained by Equation II-2: the large specimens have a
smaller value of f (Ra/L), thus for the same stress intensity the gel pressure pg is greater, which
leads to a larger widths of cracks. The differences between crack widths of mortars containing
different aggregate sizes were not significant (Table II-2).
(a)
(b)
(c)
Figure II-6 Cracking patterns of specimens cast with siliceous limestone (a) 70x70x280 mm (b)
40x40x160 mm and (c) 20x20x160 mm

Chapter II
45
Table II-2 Crack widths in µm
20x20x160 mm 40x40x160 mm 70x70x280 mm
C2 / 315-630 μm <10 50 360
C3 / 630-1250 μm <10 60 335
C4 / 1250-2500 μm <10 55 300
Average <10 µm ~ 55 µm ~ 335 µm
4.3. Effect of specimen size
Analysis of the ASR expansions demonstrated the significant effect of the size of specimens.
First, the largest specimens showed the slowest rate of ASR-expansion whatever the aggregate
size (Figure II-7). This can be likely explained by the diffusion of the alkalis in the specimens.
The initial alkali concentration in the pore solution was sufficient to initiate the reaction. Alkalis
were quickly fixed by the ASR gel and supplementary alkalis were necessary to maintain gel
production. These alkalis came from the solution and diffused in the mortar. Thus, they needed
longer to reach the core of the largest specimens than the small ones.
The second effect was on the amplitude of the asymptotic ASR expansion, where the largest
specimens showed the highest asymptotic ASR expansion (Figure II-7). This was particularly
significant on the large aggregate class 1250-2500 µm (ASR expansions were twice as large for
the 70 mm size specimens as for the others). This observation shows the significant coupling
effect between specimen size and aggregate size and confirms the assumptions made in the
„background‟ section.
For the same size of aggregate, the proportion of aggregate particles close to the surface of the
prism compared to the total aggregate increases with decreasing cross section of the prism. The
gel created by the aggregate particles close to the surface of the prism is lost more easily than for
the inner particles. In consequence, for the same size of aggregate, the smaller the specimen, the
more significant the amount of gel lost by the cracks. This can possibly explain the lower
expansion measured (Figure II-7).

Chapter II
46
0
0.2
0.4
0.6
0.8
1
1.2
0 100 200 300 400 500
Time (days)AS
R e
xp
an
sio
n (
%)
70*70*280
40*40*160
20*20*160
315-630 μm
(a)
0
0.2
0.4
0.6
0.8
1
1.2
0 100 200 300 400 500
Time (days)
AS
R e
xp
an
sio
n (
%)
70*70*280
40*40*160
20*20*160
630-1250 μm
(b)
0
0.2
0.4
0.6
0.8
1
1.2
0 100 200 300 400 500
Time (days)AS
R e
xp
an
sio
n (
%)
70*70*280
40*40*160
20*20*160
1250-2500 μm
(c)
Figure II-7 ASR expansions on prismatic specimens containing siliceous limestone (a)
20x20x160 mm (b) 40x40x160 mm and (c) 70x70x280 mm kept in NaOH solution (1.0 mol/l)

Chapter II
47
In order to quantify the combined effect of the aggregate and the specimen size, the ASR-
expansion versus the ratio of the specimen size (the minimal dimension of the specimen which
means the length of the section. For example, 20 x20 x160mm,the specimen size was taken as 20
mm) to reactive aggregate size (the average value of the aggregate size ) is plotted in Figure II-8.
0
0.2
0.4
0.6
0.8
1
1.2
101001000
Prism size / Particle size
AS
R e
xp
an
sio
n (
%)
70x70x280
40x40x160
20x20x160
small aggregates
Figure II-8 The final ASR expansions according to
the „Prism size / Particle Size‟ ratio
For small aggregates (circled in Figure II-8), the ASR-expansions were small due to the effect of
the connected porous volume as explained in the „background‟ section. For larger aggregates, the
„prism size / particle size‟ ratio had an important effect on measured expansions even for ratios
greater than 100. For example, the 315-630 µm aggregates presented expansion about 20%
larger for the 70x70x280 mm specimens (ratio equal to 200) than for the 40x40x160 mm ones
(ratio equal to 100 – Figures II-7a and II-8). Such ratios are largely higher than usual values,
which lie between 5 to 10, taken to choose a specimen size according to aggregate size for
compressive strength for example. Therefore, it appears to be impossible to break free of this
scale effect when performing expansion tests, which leads to part of the expansion being
neglected compared to structural conditions. It is thus necessary to take this fact into account
when analysing the expansion tests that can be carried out with the theoretical development
presented in the background.
4.4. Effect of aggregate size
The effect of the reactive aggregate size on the ASR expansion has already been largely studied.
Research has shown that the ASR expansion increases as the reactive particle size is reduced.
This is the case in the works of [Hobbs and Gutteridge 1979, Kuroda et al. 2004 and Zhang et

Chapter II
48
al.1999], who obtained maximum expansions for size classes of 150-300 μm (opal), 80-150 μm
(quartz glass) and 150-300 μm (andesite), respectively. However, when the experiments are
performed with particles smaller than a few tens of a μm, it has frequently been shown that the
expansion does not increase continuously with the reduction of particle size. Some authors
obtained insignificant expansion when the sizes of the reactive particles were under 50 to 150
μm [Kawamura et al. 1983, Kodama and Nishino 1986, Zhang and Groves 1990]. Only a few
exceptions of very small particles led to significant ASR expansions, all involving opal
aggregates [Diamond and Thaulow 1974, Kelly et al. 1948, McConnell et al. 1947]. Other
research works clearly show a pessimum effect for particle size, but for particles much larger
than 100 μm [Baronio et al. 1987, Diamond and Thaulow 1974, Feng et al. 2002, Lenzner and
Ludwig 1980, Xie et al. 2003, Zhang and Groves 1990]. These investigations were usually
performed on specimens of the same size. The originality of the study presented here is to have
used three sizes of specimens with the same aggregate classes.
For all the specimens, it can be observed that the prisms containing small reactive particles (0-
315 µm) have the lowest expansion (lower than 0.15% - Figures II-3 to II-5). For the three other
aggregate sizes, the ASR expansions are significant and higher than 0.5%. The difference of
ASR expansions for the small aggregate can likely be explained by the effect of the connected
porosity. For the smallest aggregates, more of the gel can migrate in this connected porosity than
for larger aggregates and thus little ASR gel is available to cause expansion [Multon et al. 2009,
Multon et al. 2010]. At 150 days, the ASR expansion presents a pessimum effect whatever the
specimen size (Figure II-9a), as already observed during previous investigations. But, after 400
days, when asymptotic expansions had been reached, the pessimum had totally disappeared for
the largest specimens (Figure II-9b). For the largest aggregates, part of the difference of
expansion can be explained by a delay in the ASR expansion due to the diffusion of the alkali in
the aggregate [Multon et al.2010].
0
0.2
0.4
0.6
0.8
1
1.2
0 500 1000 1500 2000
Average particle size (µm)
AS
R e
xp
an
sio
n (
%)
70x70x280
40x40x160
20x20x160
150 days

Chapter II
49
(a)
0
0.2
0.4
0.6
0.8
1
1.2
0 500 1000 1500 2000
Average particle size (µm)
AS
R e
xp
an
sio
n (
%)
70x70x280
40x40x160
20x20x160
400 days
(b)
Figure II-9 ASR expansions according to the average particle size after (a)
150 days and (b) 400 days
The results of measurement confirm that the expansion rate was slower in the largest particles
whatever the size of the specimens (Figures II-3 to II-5). However, even when the asymptotic
value was reached, ASR expansion remained lower for the largest aggregates in the smallest
specimens (Figure II-9b). This result shows that the pessimum effect is not only due to the
diffusion of alkalis in the aggregate, meaning that it is not an intrinsic phenomenon but could be
due to a scale effect that depends on the „specimen size / aggregate size‟ ratio.
In addition, the pessimum effect of aggregate size appears to be related to the expansion capacity
of the mortars. Compared with a previous study [Multon et al. 2009] which was performed on
mortars kept in saturated atmosphere (R.H. > 95%), the present study showed a pessimum effect
moving towards smaller aggregate. The mortars conserved in the alkali solution were more
expansive than the specimens in saturated atmosphere due to the presence of sufficient alkali and
probably due to large effect of alkali leaching from the test prisms at R. H. > 95%. Thus, it can
be concluded that the more expansive the mortar is, the more significant is the scale effect. This
can be explained by equations II-1 to II-3. The mortar is very expansive, which means that more
gel is produced (i.e. the gel molar volume is higher), and then the gel pressure is larger than for
less expansive mortar (Equation II-3). The cracks appear for a constant value of the stress factor
KI. In consequence, if the pressure increases, the function f referred to Ra/L must become smaller
to keep KI constant. This means that the ratio Ra/L decreases and explains why the pessimum
moves towards smaller aggregate (Equation II-1 and II-2). In the contrary, the pessimum effect

Chapter II
50
can disappear for a sufficient large specimen dimension which could lead to a high L/Ra (as in
Fig.II-8).
5. Test on aggregates of different natures
The aim of this part was to study the expansion test on several natures of aggregate to verify how
it could differentiate between the reactivity of different aggregates.
5.1. Mortar mixtures
In previous investigations [Multon et al. 2009], the reactive aggregate of sizes 315-630 µm and
630-1250 µm showed the same expansion in the condition of 60°C, R.H. > 95%. Therefore, it
was decided to use aggregate of size 315-1250 µm for these experimentations. Thus, the mortars
had the following particle size distribution: 30% of 315-1250 µm and 70% of the marble of size
0-2500 µm. The aggregates included four types of rocks: siliceous limestone, quartzite, opal and
quartz. The mortars were casted in the size of 20 x 20 x160 mm. All the mortars were conserved
in a 1 mol/l NaOH solution at 60°C.
5.2. Results
The ASR expansions obtained for these four aggregates are plotted in Figure II-10.
0
0.2
0.4
0.6
0.8
1
1.2
1.4
1.6
0 100 200 300 400
Time (days)
AS
R e
xp
an
sio
n (
%) Opal
Silic. limest.
Quarzite
Quartz
Figure II-10 ASR expansions according to the nature of the aggregate
After a slight delay, the mortar containing opal appeared to be the most reactive, with rather fast
expansion and an asymptotic value of about 1.35%. The expansion of the mortar containing
siliceous limestone was quite fast too, but the final expansion was less (about 0.6%). The mortar
with quartzite aggregate presented a slow expansion rate at the beginning but reached a final

Chapter II
51
value about 0.5%, which was quite close to that of the siliceous limestone. ASR expansion of the
mortar with quartz aggregate was small compared to the other three, but not totally innocuous in
the testing conditions. These results are consistent with experimental feedback on these
aggregates. Opal is known to be very reactive and to present large expansion if the amount of
available alkali is sufficient, while the other two reactive aggregates are usually less reactive and
present similar ASR expansions. In fact, due to the large pressure developed by ASR gels, the
specimens containing opal were greatly damaged and cracked (crack width of about 425 µm –
Figure II-11). The analysis performed in the „background‟ section suggests that a great
proportion of the ASR gel should have permeated through these large cracks and thus not
contributed to the expansion. This was due to the large amount of reactive silica contained in
opal, which induced high gel pressure (Equation II-3) and thus a greater stress intensity factor
(Equation II-2) for opal than for the siliceous limestone.
Figure II-11: Cracking patterns of specimens cast with opal (20x20x160 mm)
6. Discussion The previous observations show the difficulty of obtaining a fast but relevant expansion test on
specimens. In expert assessments, the owners of structures often expect fast results. To this end,
it is interesting to note that the time necessary to reach the expansion asymptote (assumed here to
be reached when the difference between two consecutive measured expansions is lower than
0.015% ) increases with the specimen and the aggregates sizes (Table II-3). This influence can
be explained by the diffusion of ionic species into the specimen and the agggregates. Thus, the
shortest time necessary to achieve expansion is about 56 days (Table II-3), obtained for the
smallest specimens (20x20x160 mm) and for aggregate class C2 (315-630µm). For larger
aggregates and specimens, the time is always longer than 100 days (Table II-3). Moreover, it is
always difficult to obtain much material from existing structures that are still in use. From this
point of view, too, working on small specimens is interesting. The most relevant, fast and
convenient tests should use small expansive particles (315-630 µm) and small specimens
(20x20x160 mm). But, in this condition, a part of the expansion is neglected because of the
combined effect of aggregate and specimen size (expansions measured on 20x20x160 mm
specimens are 30% lower than expansions obtained on 70x70x280 mm specimens). Moreover,
section 5.2 shows the effect of the aggregate nature on cracking due to differences in reactive
silica content. It could disturb the analysis of the measured expansions. To decrease this
disturbance, the same stress intensity factor KI should be taken. This means that for different

Chapter II
52
nature of aggregate the aggregate size and specimen size should be chosen carefully to have the
same KI value (Equations II-2 and II-3). This method will be introduced in detail in Chapter 5.
Table II-3 Time necessary to achieve asymptotic expansion (in days)
315-630µm 630-1250µm 1250-2500µm
20x20x160 mm 56 120 148
40x40x160 mm 134 148 302
70x70x280 mm 301 342 393
*the asymptotic expansion is assumed to be reached when the difference
between two consecutive measured expansions is lower than 0.015%.
7. Conclusion
The main aim of this chapter was to analyse the expansion test in terms of conservation
conditions, size of specimens (20x20x160 mm, 40x40x160 mm and 70x70x280 mm), and size of
aggregate (0-315 µm, 315-630 µm, 630-1250 µm and 1250-2500 µm) in order to obtain fast and
relevant expansions. This test is only a part of a global methodology using measurements
performed directly on structures, finite element calculations and laboratory expansion tests on
aggregate extracted from structures to assess the expansion kinetics. The tests are used to assess
the residual reactive silica content in the aggregates of various sizes used in the structure to
determine the advancement of the reaction according to the size of the aggregate and thus to
assess the kinetics of future expansions [Sellier et al. 2009].
The following conclusions can be drawn:
1. For the siliceous limestone aggregate, the expansion tests in three concentrations of
NaOH solution (0.77 mol/l, 1 mol/l, 1.25 mol/l) showed that, in the condition of abundant
alkalis, the expansion is not significantly influenced by the alkali concentration in the
range of NaOH concentration studied here.
2. For the same size of aggregate, small prisms needed the shortest time to achieve final
expansions. For the same size of specimen, small aggregate took the shortest time to
reach the final expansions. These results can likely be explained by the faster diffusion of
ionic species into the porosity of small prisms and into the aggregate.
3. A combined effect of the aggregate and specimen sizes on ASR expansions has been
highlighed. It appears that, even with a „specimen size / aggregate size‟ ratio higher than
100, the scale effect still exists. It could be explained by the effect of the cracking on the
gel pressure. After the cracking, a part of the increasing volume due to ASR gel
formation can be accomodated by the cracks volume and a part of the gels can permeate
out the specimens, causing a decrease of the gel pressure and thus reducing the induced
expansion.

Chapter II
53
4. A fast and convenient tests should use small reactive particles (315-630 µm) and small
specimens (20x20x160 mm). But in this condition, a part of the expansion is neglected
because of the coupled effect of aggregate and specimen size. So the results should be
analyzed through the concept of stress intensity factor in order to take all the parameters
into account in the measured ASR expansions.
5. Even if the expansion measurements are used through a finite element analysis, the
expansion tests should be performed in comparable conditions. Therefore, nonlinear
effects due to connected porosity or cracking should be avoided or well enough
understood to be taken into consideration.

Chapter III
54
Chapter 3
Chemical measurement
of reactive silica in aggregate
1. Introduction
The method of requalification of ASR-damaged structures proposed by [Grimal 2007, Sellier et
al. 2009] is based on a numerical finite element inverse analysis of the structure, which uses the
silica content of the aggregates measured in laboratory tests. One of the basic assumptions of the
method is that the potential expansion of the concrete is proportional to the remaining reactive
silica within the aggregates. This assumption is based on the consideration that the alkali content
is not the limiting parameter of the reaction, since alkalis can be regenerated by calcium ions
[Duchesne and Bérubé 1994, Lagerblad and Tragardh 1992] and thus continue to attack the silica
[Sellier et al. 2009].
In the previous work [Grimal 2007, Sellier et al. 2009], the chemical analysis were not
performed. In this work, the chemical test was highlighted since the results could be obtained
faster than expansion test. The chemical method of requalification highlights the interest of
measuring the quantity of reactive silica in aggregates. However, this apparently simple question
involves complex notions related to the interpretation and the measurement of the so-called
"reactive silica".
The term "reactive silica"
The subjective term "reactive silica" has no absolute meaning since it depends on the conditions
of attack (temperature, pressure, type and concentration of solution in contact with silica). Some
types of silica known as reactive in a given environment (e.g. in concrete) can be considered as
inert or not reactive for other conditions. Obviously, in our context, the term must be taken as the
silica that dissolves in contact with concrete pore solution, producing gels leading to the
expansion of the concrete. The most commonly incriminated minerals subject to ASR are
considered to be [Corneille et al. 1991]: 1) amorphous minerals such as glass and opal, 2)
cryptocrystalline minerals such as chalcedony, and 3) crystalline minerals such as quartz,

Chapter III
55
feldspar and phyllosilicates when they contain imperfections (deformations and/or alterations of
the crystalline lattice).
Measurement of reactive silica
The most representative test to evaluate the reactive silica content available for ASR in concrete
would simulate real concrete conditions in terms of pH, pressure and humidity temperature.
However, under these conditions, ASR usually lasts several decades, even hundreds of years in
the case of concrete containing very large aggregates, so the measurement of total silica
consumption seems impractical.
A few accelerated methods exist for attacking silica in aggregates. Standard chemical methods
are used to evaluate the potential reactivity of aggregates, by comparing the dissolved silica with
criteria chosen to correspond to ASR-damaged concretes. For instance, ASTM C289 allows the
measurement of dissolved silica after crushed aggregates (150-300 µm) are attacked in 1N
sodium hydroxide solution for 24h at 80°C. The result obtained is used to classify the aggregate
as deleterious or not, but not intend to quantify the reactive silica.
Other tests are available in the literature to quantify reactive silica but they are initially intended
for supplementary cementing materials (SCM) such as fly ash [Forest 1962, Hulett and
Weinberger. 1980, Richartz 1984, Sivapullaiah et al. 1998], metakaolin [Murat and Arnaud 1988]
or rice husk ash (RHA) [Mehta 1978]. All these methods, which involve the attack of silica, can
be divided into two groups: basic attack and acid attack.
One example of basic attack (other than ASTM C289) is given by Mehta [1978], who created the
“Silica reactivity index” for RHA, defined as the percentage of available silica which dissolves
in an excess of boiling 0.5N NaOH in 3 minutes (sample <45μm). According to its author, this
method gives "an indication of the reactivity of silica present in a material". However, there is no
guarantee that the value obtained concerns the total reactive silica content.
Acid attacks are more commonly found in the literature and different types of acid are used,
typically: HCl, HF and organic acids. Sivapullaiah et al. [1998] compared the effectiveness of
different HCl concentrations (1 to 5 mol/l) to dissolve silica in fly ash. They found that
concentrations between 2 and 3 mol/l correlated well with the compressive strength of
lime/cement fly ashes. Fly ash European standard NF EN 450-1 [2005] defines reactive silicon
dioxide as the fraction of SiO2 which is soluble after treatment of the ash with HCl and boiling
KOH solution for washing. This method, also used for other SCM such as metakaolin
[Badogiannis et al. 2004], sewage sludge ash [Cyr et al. 2007], slag and other pozzolans
[Papadakis et al. 2002], is sometimes criticized for the uncertainty concerning whether
crystalline silica is dissolved [Paya et al. 2003].
The HF method is usually less criticized, since it allows the amorphous silica to be distinguished
from the crystalline form. At the beginning of the HF attack application, researchers focused on
finding an appropriate HF concentration and reaction time to attack only the amorphous phase,
leaving the crystalline phase [Diamond 1986, Hulett and Weinberger 1980]. However, the results

Chapter III
56
obtained were uncertain, depending mostly on the materials used in the experiments. For
example, Hulett and Weinberger [1980] tested fly ashes and concluded that, with 1% HF attack
for 16-20 h, the glass phases could be mostly dissolved. Diamond [1986] tested different types of
fly ashes and found that 1% HF and 4 hours were the optimized reaction conditions to etch the
glass phases. This uncertainty led to unreliability of the results, and a new method was therefore
proposed, based on the different dissolution rates of amorphous and crystalline silica. For
example, the rate at which quartz dissolved at 25°C with 0.10 mol/l HF was roughly 2.8-3.0
(mg·m-2
·hr-1
), while, for vitreous material under the same attack conditions, the rate was 136-150
(mg·m-2
·hr-1
). This method was successfully used by Murat and Arnaud [1988] to measure the
amorphous phase of activated kaolinite and montmorillonites, and used by Pichon et al. [1996] to
quantify the amorphous phase of pozzolanic materials.
Organic methods have been applied to determine the amorphous silica in RHA as a rapid
analytical method. One of these methods is based on the mechanism of amorphous silica reacting
with glycerol reagent to produce glycerosilicate solution which can be titrated with an aqueous
glycerol solution of barium hydroxide. This method has been used only on fine materials up to
now. For example, Kreshkov et al. [1965] tested it on clay, and Payá et al. [2001] used it for
testing rice husk ash (size: 10~17 µm).
The aim of this chapter is to test and compare three methods, chosen as being simple and rapid,
to quantify the amount of reactive silica in five aggregates (including three materials known be
affected by ASR). These methods, which are based on selective dissolution in bases and/or acids,
have not been used so far to study alkali-reactive aggregates (or when they have, it was only to
evaluate the reactivity to alkalis and not to precisely quantify the proportion of reactive silica).
The reliability of the methods is evaluated by correlating the reactive silica contents with
expansion measurements of mortars containing the aggregates presented in the previous chapter.
2. Methods and materials
2.1. Analytical methods and mortar test
Aggregates
The chemical composition of the aggregates was determined using a Perkin Elmer 2100 atomic
absorption spectrophotometer with flame atomization. Loss on ignition was measured by
calcination at 1000°C. Mineralogical properties were obtained by X-ray powder diffractometry
using a Siemens D5000 diffractometer equipped with a monochromator and using a Kα (λ =
1.789 Ǻ) cobalt anticathode. Measurements were made with a 2θ step interval of 0.04° (5°-70°)
and an acquisition time of 2s per step. The particle size distribution of the crushed materials used
for the dissolution tests was measured by laser granulometry in water, using a Cilas 1090. The
petrographic observations by optical microscopy were carried out with thin sections in
transmitted light with crossed polars.

Chapter III
57
2.2. Materials
Five materials were selected for the tests: three aggregates known to be alkali-reactive (siliceous
limestone - SL, quartzite - Q, and opal -O), and one material considered as non-reactive (quartz
aggregate - QA). The three reactive aggregates were chosen to cover a wide range of types and
geological origins, from low to high kinetics of silica dissolution: an igneous rock (opal: high
kinetics), sedimentary rock (siliceous limestone: low kinetics), a metamorphic rock (quartzite:
low kinetics). For the chemical tests; the aggregates were crushed to particle sizes of less than
80 µm (mean diameter of 20 µm). Special attention was paid to avoiding overgrinding of
aggregates, in order to limit the appearance of the “soluble surface layer on ground quartz”
already observed by other authors [e.g. Iler 1979]. This thin amorphous phase around the
aggregates could lead to an overestimation of the reactive silica content.
2.2.1. Chemical and mineralogical properties
The chemical compositions of the aggregates are given in Table III-1. Quartzite, opal, and quartz
aggregate were mainly composed of silica, while the siliceous limestone had only a limited SiO2
content. In order to identify the forms of reactive silica, petrographic analyses were carried out
on each aggregate type.
Table III-1 Chemical compositions of the five aggregates (% by mass)
Aggregates SiO2 Al2O3 Fe2O3 CaO MgO Na2O K2O SO3 LOI
O 92.7 -- 0.3 0.2 0.1 0.2 0.1 1.1 6.0
SL 15.4 1.5 0.7 40.4 1.4 0.4 0.4 4.2 35.6
Q 87.7 4.0 1.0 0.4 0.2 0.1 0.9 0.1 1.1
QA 92.2 3.7 1.1 0.1 0.1 -- 0.01 0.2 0.6
Opal
The XRD pattern of opal (Figure III-1) shows relatively broad diffraction lines at d-spacing
between 5.60 and 3.42 Å (2θ = 18.37° ~ 30.3°). According to the classification proposed by
Jones and Segnit [1971], the sample can be considered to be opal-CT, characterised by a
structure consisting of randomly interstratified layers of α-tridymite and α-cristobalite [Jones and
Segnit 1971], with a high degree of disorder [Wilson et al. 1974]. Depending on the relative
amounts of cristobalite and tridymite, the position of the main opal peak shifts from 4.04 Å (2θ =
25.60°), which is typical of α-cristobalite, to 4.11 Å (2θ = 25.13°), characteristic of α-tridymite.
In the sample studied here, the position of the main peak was centred at about 4.11 Å (2θ =
25.13°), closer to the tridymitic one. The well-pronounced secondary peak at 4.3 Å (2θ = 23.98°)

Chapter III
58
confirms a high relative amount of tridymite. The XRD pattern also indicates the presence of
quartz, confirmed by the diffraction lines at 3.34 and 4.26 Å (2θ = 31.08° and 24.25°).
5 10 15 20 25 30 35 40 45 50 55 60 65 70
2θCo K
T
Q
Q
Q
T: TridymiteQ : Quartz
T
T
T
Q
QT
Q
Q
Figure III-1 XRD pattern of opal
The petrographic analysis of thin sections (Figure III-2) showed the presence of crypto-
microcrystalline quartz (chalcedony) spherulites (A) reaching sizes around 100 µm, surrounded
by a glassy phase (B, black in polarised light). Small crystals of xenomorphic quartz (C),
presenting a certain degree of undulatory extinction, were also observed. SEM observations
(Figure III-3) confirmed the presence of different textures of silica in this aggregate.

Chapter III
59
Figure III-2 Petrographic analysis of opal in polarised and natural lights. A: chalcedony
spherulites – B: amorphous phase – C: quartz

Chapter III
60
Figure III-3 SEM observations and EDX of opal aggregate.
(A,B: amorphous silica, C: quartz)
Siliceous limestone
The XRD pattern of raw SL and the pattern of SL after leaching in 0.25 mol/l HCl (Figure III-4)
showed that this aggregate was composed of calcite and dolomite, with significant amounts of
impurities including quartz, plagioclase feldspars, micas, kaolinite and pyrite. A small amount of
amorphous silica was also found in some spectrum patterns, especially visible after HCl
pretreatment. In addition to calcite, present in the form of micritic crystals containing many
debris of fossils, thin-section observations (Figure III-5) showed the presence of small
spherulites probably made of chalcedony (A) and microquartz (A) enclosed in calcite grains.
Larges veins of xenomorphic quartz (B) presenting high undulatory extinction were also
observed. Amorphous silica was difficult to identify by optical microscopy, but has already been
seen in this type of aggregate [Guédon et al. 2000]. Figures III-6 and III-7 illustrate the
morphologies and compositions of different minerals found in this aggregate.

Chapter III
61
5 10 15 20 25 30 35 40 45 50 55 60 65 70
2θCo K
KD
C
Q+M
Q+DQ Q
Q
M Q+M
+M
C
C
C
CC C C
C
C
Q
F+D
Q : QuartzC : Calcite
D : DolomiteF: Felspar
K : KaoliniteM: MicaPy: Pyrite
M
C
5 10 15 20 25 30 35 40 45 50 55 60 65 70
2θCo K
K D
C
Q+D
Q
D
Q
Q
M
Q
C
C
C
D
C C C
CC
D
F+D
Q : QuartzC : Calcite
D : DolomiteF: Feldspar
K : KaoliniteM: MicaPy: Pyrite
MFM
F FF
DD
D
PyM
Figure III-4 XRD pattern of siliceous limestone

Chapter III
62
Figure III-5 Petrographic analysis of siliceous limestone (SL) in polarised and natural lights.
A: microquartz and spherulites, B: quartz with undulatory extinction

Chapter III
63

Chapter III
64
Figure III-6 SEM observations and EDX of siliceous limestone aggregate
Figure III-7 Mapping (SEM+EDX) of siliceous limestone aggregate

Chapter III
65
Quartzite
As shown in the XRD pattern (Figure III-8), quartzite mainly contained quartz, and also a certain
amount of phyllosilicate minerals (mica-type such as muscovite). Examination of thin-sections
(Figure III-9) showed that this rock was mainly composed of heterometric quartz grains of sizes
varying from less than 1 µm (A) up to a few hundreds of µm (B, C). The presence of primary (C)
and recrystallised (B) quartz grains was noted. The former (C) were irregular, showed undulatory
extinction and were separated by an intergranular cement (D) composed of microquartz and
micas. The latter (B) were usually much better defined and no undulatory extinction was
observed. Muscovite minerals were often found, sometimes concentrated in areas containing
microquartz (E), as large particles (F) or as a cementing agent (D). According to Sims and Nixon
[2003], the intergranular phase is responsible for the alkali-reactivity of this kind of aggregates.
SEM observations (Figure III-10) confirmed the presence of cracked quartz grains (A)
surrounded by zones containing quartz and micas (B). Some small automorphic quartz grains (C)
and zircon particles (D) were also found.
5 10 15 20 25 30 35 40 45 50 55 60 65 702θCo Kθ
Q Q
Q
Q
Q
Q :QuartzK: Kaolinite
M: Mica
Q
Q
Q
Q
Q
QQKKM
MM M
Figure III-8 XRD pattern of quartzite

Chapter III
66
Figure III-9 Petrographic analysis of quartzite (Q) in polarised and natural lights.
1) Various sizes of quartz grains (A,B), presence of micas (E).
2) Primary quartz particles (C), micas (F) and intergranular cement (D).
3) Quartz grains (A,B) and micas (E).
4) Primary quartz particles (C) and intergranular cement (D).
A: microquartz, B: recrystallised quartz, C: primary quartz, D: intergranular cement, E:
microquartz and micas, F: micas.

Chapter III
67
Figure III-10 SEM observations and EDX of quartzite aggregate

Chapter III
68
Quartz aggregate
The XRD pattern of quartz aggregate (Figure III-11) shows only quartz, with visible traces of
other minerals.
5 10 15 20 25 30 35 40 45 50 55 60 65 702θCo K
Q
Q
Q
Q
Q
Q
Q
Q
Q
Q
Q : QuartzF: Feldspar
Mica: MicaMu: Mullite
Q
QMF
F FM
FM
MuF+M
Figure III-11 XRD pattern of quarz aggregate
Thin sections (Figure III-12) reveal: (a) Particles composed of quartz grains of a few hundreds of
µm, some of them presenting undulatory extinction. Contrary to quartzite, the boundaries of each
grain are free of micas or microquartz. (b) Large homogeneous quartz grains having a well
defined extinction without rolling.

Chapter III
69
Figure III-12 Petrographic analysis of quartz aggregate (QA) in polarised and natural lights.
1) small quartz grains and 2) large homogeneous quartz grains. A: quartz
Types of silica in aggregates and potential of reactivity
The mineralogical and petrographic studies allowed us to determine the types of silica found in
the aggregates. Table III-2 summarizes the results in terms of qualitative evaluation, with the
potential reactivity of each silica type as classified in the literature [Sims and Nixon 2003,
Broekmans 2004]
Table III-2 Potential reactivity and occurrence of silica types (related to silica content) in
aggregates
Types of silica Potential of
reactivity Opal
Siliceous
limestone Quartzite
Quartz
aggregate
Total content of silica (%) 92.7 15.4 87.7 92.2
Quartz without undulatory extinction Weak Scarce Scarce Majority Majority
Quartz with undulatory extinction Strong Frequent Majority Scarce Not observed
Microquartz (intergranular) Strong Not observed Scarce Frequent Not observed
Chalcedony-like spherulites Very strong Frequent Scarce Not observed Not observed
Amorphous phase Very strong Frequent Scarce Not observed Not observed

Chapter III
70
2.2.2. Expansion potential
The expansion tests presented in the previous chapter give a good estimation of the difference of
reactivity potential of these aggregates (Figure III-13). These results confirm that opal (O),
siliceous limestone (SL) and quartzite (Q) are alkali-reactive, and that quartz aggregates (QA)
can be considered as a poorly reactive material. The results of the chemical measurements
presented below will be compared to these measurements in the final discussion.
0
0.2
0.4
0.6
0.8
1
1.2
1.4
1.6
0 100 200 300 400
Time (days)
AS
R e
xp
an
sio
n (
%) Opal
Silic. limest.
Quarzite
Quartz
Figure III-13 ASR expansion of mortars containing different types of aggregates
30% aggregates (315-1250 µm) + 70% non-reactive aggregate (0-2500 µm), mortar size: 20x20x160mm
3. Methods for the chemical extraction of reactive silica: results and
discussion Three methods, using principles mainly based on the literature review, were used to quantify the
amount of potentially reactive silica in aggregates (Figure III-14).
The selective dissolution processes are described in the following sections. They can be divided
in two categories: basic attack (NaOH) and acid attack (HCl and HF). Two of the three methods
included two steps: a main attack to dissolve the silica contained in the aggregate, followed by a
washing phase to dissolve the silica which had precipitated in the first step.

Chapter III
71
Figure III-14 Methods used to measure the reactive silica content.
3.1. NaOH attack (100°C and 60°C) – cold HCl washing
This method is based on US standard ASTM C289 and French standard XP P18-594 [2004],
since it consists of attacking silica with 1M sodium hydroxide solution. The use of a basic
solution is a reasonable choice to get close to a cement-based environment. These standards were
modified for our purposes, since the goal was not to evaluate the reactivity potential of an
aggregate but to determine the silica content available for ASR.
Considering the long duration of NaOH attack at ambient temperature, the tests were carried out
at a high temperature (100°C) to accelerate the reaction. The dissolution of silica as a function of
reaction time (up to 96 hours) was measured on all the materials tested. A few tests were also
performed at 60°C, a temperature usually used in ASR tests [Cyr et al. 2007, NF P18-454, Sellier
et al. 2009].
The aggregate was crushed to particle sizes smaller than 80 µm in order to quickly attack all the
silica inside the grains. With coarse particles, the reagent would need a long time to reach the
centre of the particles. The analyses of dissolved silica were made at different reaction times (up
to 96 h at 100°C or 150 days at 60°C) to estimate the kinetics of dissolution. It was assumed that
only reactive silica was attacked (this hypothesis is discussed later). The residue of the NaOH
attack was then washed with HCl in order to dissolve the gel which was likely to precipitate
during the basic attack [Bulteel et al. 2002]. If the washing was not performed, some of the
dissolved silica which had precipitated could not be measured in solution and this could lead to
an underestimation of the reactive silica.
In aggregates containing only small amounts of silica and for which some minerals (e.g. calcite)
could interfere with the extraction method (for instance by consuming the reagents), a pre-
treatment was conducted to eliminate the matrix and so refine the active fraction. The process,

Chapter III
72
used here with aggregates made of limestone, consisted in dissolving the calcareous part of the
aggregate in 0.25 mol/l HCl at 0 °C for almost 30 min (until there is no CO2 released) . The low
concentration and low temperature aimed to avoid attacking silica [Goto 1955]. This kind of pre-
treatment is recommended in standards such as French XP P18-594 [2004], for limestone
contents higher than 15%.
3.1.1. Procedure
The procedure of the test is divided in two steps. In the first part, 1.5 g of sample is weighed and
put into a 75 ml sealed steel container. After addition 50 ml of 1 mol/l NaOH solution (L/S=33.3
ml/g), the container is put in a constant-temperature oven at 100°C or at 60°C for different test
times. At a given age, the solution is filtered and analysed using atomic absorption. The second
step of the test consists in transferring the filtered residue into a beaker, adding 300 ml of cold
HCl (1 mol/l), putting the beaker in an ice-water bath (0°C, to avoid silica gel precipitation
during the acid attack) for 30 minutes and then filtrating the solution for SiO2 measurement by
atomic absorption. The total dissolved silica is taken as the sum of the values obtained for the
two steps.
3.1.2. Mechanisms of attack
When silica is exposed to a strong alkaline solution such as NaOH, there is an acid-base reaction
between the hydroxyl ions in solution and the acidic silanol (Si-OH) groups [Dent Glasser and
Kataoka 1981] as follows:
As further hydroxyl ions penetrate the structure, some of the siloxane linkages (Si-O-Si) are also
attacked:
The negative charges on the terminal oxygen atoms are balanced by alkali cations (Na+) that
simultaneously diffuse into the structure. The disruption of siloxane bridges weakens the
structure, and if there are sufficient reserves of alkali hydroxide, the process continues to
produce an alkaline silicate solution.
This mechanism is suitable for both amorphous silica and crystalline silica but, in this last case,
the solubility is much lower. For example, in 25°C aqueous solution at pH=14, the solubility of
vitreous silica is approximately 21 times the solubility of quartz (~125 mol/l for vitreous silica
compared to ~6 mol/l for quartz) [Paul 1982].
The reaction mechanism can be simplified as follows [Bulteel et al. 2002, Garcia-Diaz et al.
2006]:
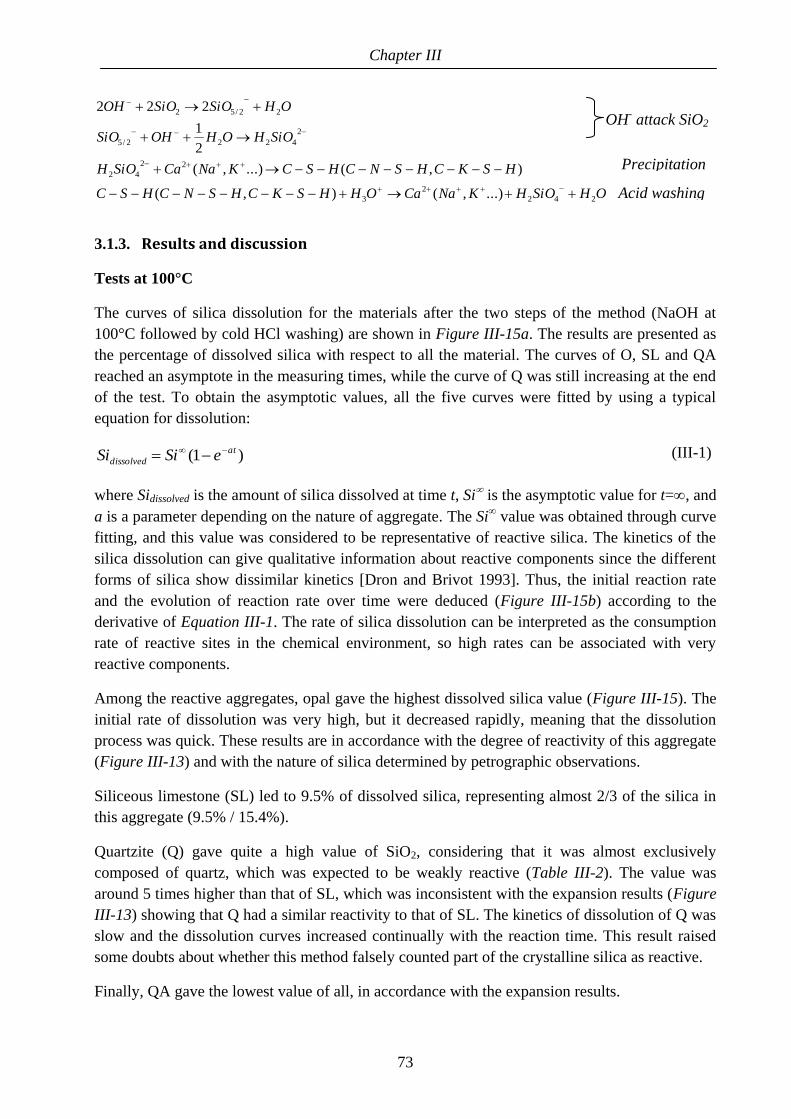
Chapter III
73
OHSiOHKNaCaOHHSKCHSNCHSC
HSKCHSNCHSCKNaaCSiOH
SiOHOHOHSiO
OHSiOSiOOH
242
2
3
22
42
2
4222/5
22/52
...),(),(
),(...),(
2
1
222
3.1.3. Results and discussion
Tests at 100°C
The curves of silica dissolution for the materials after the two steps of the method (NaOH at
100°C followed by cold HCl washing) are shown in Figure III-15a. The results are presented as
the percentage of dissolved silica with respect to all the material. The curves of O, SL and QA
reached an asymptote in the measuring times, while the curve of Q was still increasing at the end
of the test. To obtain the asymptotic values, all the five curves were fitted by using a typical
equation for dissolution:
)1( at
dissolved eSiSi (III-1)
where Sidissolved is the amount of silica dissolved at time t, Si is the asymptotic value for t=, and
a is a parameter depending on the nature of aggregate. The Si∞ value was obtained through curve
fitting, and this value was considered to be representative of reactive silica. The kinetics of the
silica dissolution can give qualitative information about reactive components since the different
forms of silica show dissimilar kinetics [Dron and Brivot 1993]. Thus, the initial reaction rate
and the evolution of reaction rate over time were deduced (Figure III-15b) according to the
derivative of Equation III-1. The rate of silica dissolution can be interpreted as the consumption
rate of reactive sites in the chemical environment, so high rates can be associated with very
reactive components.
Among the reactive aggregates, opal gave the highest dissolved silica value (Figure III-15). The
initial rate of dissolution was very high, but it decreased rapidly, meaning that the dissolution
process was quick. These results are in accordance with the degree of reactivity of this aggregate
(Figure III-13) and with the nature of silica determined by petrographic observations.
Siliceous limestone (SL) led to 9.5% of dissolved silica, representing almost 2/3 of the silica in
this aggregate (9.5% / 15.4%).
Quartzite (Q) gave quite a high value of SiO2, considering that it was almost exclusively
composed of quartz, which was expected to be weakly reactive (Table III-2). The value was
around 5 times higher than that of SL, which was inconsistent with the expansion results (Figure
III-13) showing that Q had a similar reactivity to that of SL. The kinetics of dissolution of Q was
slow and the dissolution curves increased continually with the reaction time. This result raised
some doubts about whether this method falsely counted part of the crystalline silica as reactive.
Finally, QA gave the lowest value of all, in accordance with the expansion results.
OH- attack SiO2
Precipitation
Acid washing

Chapter III
74
0
10
20
30
40
50
60
70
80
0 10 20 30 40 50 60 70 80 90 100
O
SL
Dis
so
lve
d S
iO2 (
%)
.
Reaction time (h)
Q
QASi
= 9.5%
Si = 73.0%
Si = 58.9%
Si = 3.4%
)1( kt
dissolved eSiSi
(a)
0.01
0.1
1
10
100
0 10 20 30 40 50 60 70 80 90 100
OSL
Ra
te o
f s
ilic
a d
iss
olu
tio
n (
%/h
) .
Reaction time (h)
Q
QA
27.1
1.1 1.3 0.4
0
5
10
15
20
25
30
O SL Q QA
Init
ial
rate
of
reacti
on
(%/h
) .
(b)
Figure III-15 Dissolved silica (a) and reaction rate (b), as a function of reaction time, after
NaOH (100°C)-HCl attack
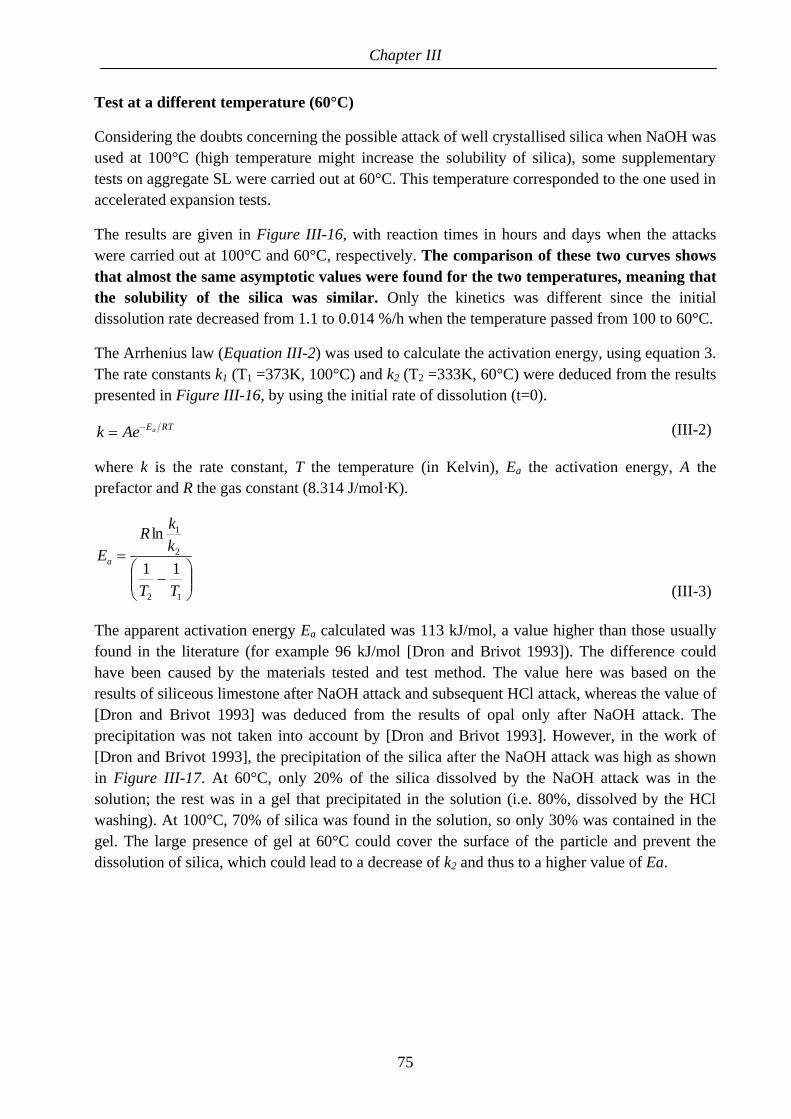
Chapter III
75
Test at a different temperature (60°C)
Considering the doubts concerning the possible attack of well crystallised silica when NaOH was
used at 100°C (high temperature might increase the solubility of silica), some supplementary
tests on aggregate SL were carried out at 60°C. This temperature corresponded to the one used in
accelerated expansion tests.
The results are given in Figure III-16, with reaction times in hours and days when the attacks
were carried out at 100°C and 60°C, respectively. The comparison of these two curves shows
that almost the same asymptotic values were found for the two temperatures, meaning that
the solubility of the silica was similar. Only the kinetics was different since the initial
dissolution rate decreased from 1.1 to 0.014 %/h when the temperature passed from 100 to 60°C.
The Arrhenius law (Equation III-2) was used to calculate the activation energy, using equation 3.
The rate constants k1 (T1 =373K, 100°C) and k2 (T2 =333K, 60°C) were deduced from the results
presented in Figure III-16, by using the initial rate of dissolution (t=0).
RTEaAek
(III-2)
where k is the rate constant, T the temperature (in Kelvin), Ea the activation energy, A the
prefactor and R the gas constant (8.314 J/mol·K).
12
2
1
11
ln
TT
k
kR
Ea
(III-3)
The apparent activation energy Ea calculated was 113 kJ/mol, a value higher than those usually
found in the literature (for example 96 kJ/mol [Dron and Brivot 1993]). The difference could
have been caused by the materials tested and test method. The value here was based on the
results of siliceous limestone after NaOH attack and subsequent HCl attack, whereas the value of
[Dron and Brivot 1993] was deduced from the results of opal only after NaOH attack. The
precipitation was not taken into account by [Dron and Brivot 1993]. However, in the work of
[Dron and Brivot 1993], the precipitation of the silica after the NaOH attack was high as shown
in Figure III-17. At 60°C, only 20% of the silica dissolved by the NaOH attack was in the
solution; the rest was in a gel that precipitated in the solution (i.e. 80%, dissolved by the HCl
washing). At 100°C, 70% of silica was found in the solution, so only 30% was contained in the
gel. The large presence of gel at 60°C could cover the surface of the particle and prevent the
dissolution of silica, which could lead to a decrease of k2 and thus to a higher value of Ea.

Chapter III
76
0
1
2
3
4
5
6
7
8
9
10
0 10 20 30 40 50 60 70 80 90 100 110 120 130 140 150
100°C60°C
Dis
so
lved
SiO
2 (
%)
.
Reaction time (100°C: h - 60°C: d)
Figure III-16 Dissolved silica of siliceous limestone (SL) as a function of time after NaOH-HCl attack
at 60°C and 100°C. Note the scale for reaction time: hours at 100°C and days at 60°C
0 2 4 6 8 10
4 days
2 days
1 day
5 months
4 months
3 months
after NaOH attack after HCl attack
60°C
100°C
Dissolved silica (%)
80% of Si dissolved formed a gel
30% of Si dissolved
formed a gel
Figure III-17 Comparison of dissolved silica after NaOH and HCl attack at 60°C and 100°C
3.2. HCl (heated) - KOH (boiled) This method is found in standards such as NF EN 450-1 to evaluate the reactive silicon dioxide
in fly ash to be used in concrete. Many papers have already reported results using this procedure
for other supplementary cementing materials [Badogiannis et al. 2004, Cyr et al. 2007, Papadakis
et al. 2002, Paya et al. 2003]. In this method, the aggregate is firstly attacked by concentrated
HCl (12 mol/l) in order to destroy the silica network and produce silica gel. KOH (4.5 mol/l) is
then used mainly to dissolve the gel and also to attack the remaining reactive silica.

Chapter III
77
3.2.1. Procedure
The procedure of the test is divided into two steps. In the first part, 5 g of sample is weighed and
dispersed in a porcelain dish with 125 ml of water. After addition of 200 ml of concentrated HCl
(12 mol/l), the solution is evaporated to dryness on a sand bath. The operation is repeated two
more times with 100 ml concentrated HCl. Then, the residue is treated with 100 ml diluted HCl
(3 mol/l), heated, filtered and washed with boiling water until free from chloride ions. The
solution is then analysed using atomic absorption. The second step of the test consists of
transferring the residue into a steel container, adding 500 ml KOH (4.5 mol/l) and leaving to
stand for 16 h at room temperature. Then the solution is boiled under reflux for 4 hours, filtrated,
and washed with water and diluted HCl (1.2 mol/l). The solution is analysed for SiO2 using
atomic absorption. The total dissolved silica is taken as the sum of the values obtained for the
two steps.
3.2.2. Mechanisms of attack
Generally, silicate glasses and silicate minerals can be attacked by acid, leaving a residue of
hydrated silica which forms a gel. This process can be explained as the acid removing the iron
atoms, which are incorporated in the continuous silicon-oxygen frameworks, leaving the siloxane
structures to yield gelatinous silica. Paul [1982] described the acid attack of silicate glass.
Although at lower pH values the exchange of cation with hydrogen ion seems favoured, the
silicic acid does not ionize and thus offers a high activation barrier for the diffusion of positive
ions. This can explain why only a little soluble silica (< 0.1% at 35°C) is detected in glass in an
acid environment.
ASiOHHglassASiO
323 )( (A:cations like Na+, Ca
2+, Al
3+…)
However, under the conditions of high acid concentration and high temperature, this exchange
between cation and hydrogen ion occurs frequently, and finally produces gel. This method was
summarized by Iler [1979] to synthesize gel by acidifying silicate minerals.
3.2.3. Results and discussion
Table III-3 presents the results of the HCl attack, followed by the KOH washing. The tests were
carried out using particles of less than 80 µm and a liquid-solid ratio of 80. It should be noted
that no soluble silica was measured after the concentrated HCl attack (first stage of the method),
since the attacked silica formed a gel that was dissolved only after the KOH washing.
It can be seen from the results that opal (O) again released much more silica (77%) than the other
materials. The dissolved silica of the other reactive aggregates (SL and Q) reached lower values
(2.4 and 5.4%, respectively). The non-reactive aggregate QA released 5.4% of its silica, which is
the same value as for quartzite. Let us recall that this method, although it is now used for the
quantification of active silica and alumina in fly ash (European standard EN 450-1), was initially
intended to measure insoluble residue in cement, as specified in European standard NF EN 196-2
[2006]. So it might be accurate for fly ash, but some doubts remain here about its effectiveness in

Chapter III
78
distinguishing between reactive (e.g. quartzite) and non-reactive (e.g. quartz aggregate)
aggregates, since it seems that the extremely severe acid environment favours the attack of well
crystallized quartz.
Table III-3 Results of dissolved silica with HCl-KOH method
O SL Q QA
Dissolved SiO2* 77.1 2.4 5.4 5.4
*in % of the total aggregate mass
3.3. HF attack This method is found in the literature [Diamond 1986, Hulett and Weinberger 1980, Murat et al.
1988, Pichon et al. 1996] for the quantification of the amorphous silica in fly ash or pozzolanic
materials. It is based on the fact that the amorphous silica dissolves rapidly in diluted HF
solution, and the rate of dissolution can be distinguished from the dissolution of crystalline
phases. Different reaction times are obtained, and the kinetics of amorphous phase dissolution
can be deduced using a graphic method.
Considering that some aggregates such as siliceous limestone contain calcite, which can
consume HF and interfere with the silica dissolution, a second acid, HCl, was added into HF
solution in that case. In this paper, 1 mol/l HCl was chosen to add into 1.5% HF to test siliceous
limestone. This second acid is known not to affect the dissolution of silica since Liang and
Readey [1987] tested the effect of 1 mol/l HCl on fused silica and quartz and found that, with
and without HCl, the final values of dissolved silica showed no marked differences.
3.3.1. Procedure
1.5 g of sample were put into a plastic container, mixed with 1.5% HF (or HF + 1 mol/l HCl) in
the proportions of 200 ml liquid /g solid, and left for reaction at 4°C in the aim of obtaining a
clear difference between the dissolution of amorphous phase and crystalline phase [Liang and
Readey 1987]. At reaction times ranging between 1 and 24 h, the solution was filtered and
washed with distilled water. The solution was then analysed for SiO2 by atomic absorption.
3.3.2. Mechanisms of attack
Fluorine ion is a strong nucleophilic reagent; it has the same mechanism of attack of silicon-
oxygen frameworks as OH-. However, HF is a stronger reagent than alkalis, for two reasons: 1)
the electronegativity of F is 3.98, greater than oxygen (3.44), 2) the hydrogen ion (H+) as an
electrophilic reagent helps fluorine ion to disrupt the Si-O bond [Budd 1962]. The reaction
mechanism is as follows:

Chapter III
79
The mechanism can be simplified to:
OHSiFHSiOHF 2622 26
This equation applies at low temperature (< 86°C). At high temperature, H2SiF6 can decompose
to SiF4, and SiF4 is easy to volatilize (boiling point: ~86°C).
3.3.3. Results and discussion
A typical curve of dissolution kinetics of aggregates in HF is given in Figure III-18. The curve
increases with the reaction time and two different phases are observed: a rapid dissolution (phase
I) followed by a constant rate of dissolution characterized by a linear evolution (phase II). In
phase I, the high reaction rate lasts about 2 hours (between 1 and 4 hours) and is mainly due to
the quick dissolution of the reactive phase. In phase II, the reaction rate slows down, but the
reaction still keeps an upward trend even after 24 hours. This phase is usually considered to be
representative of the attack of crystallised minerals such as quartz. The reactive phase is
estimated by extrapolating the linear trend to t=0, since it can be assumed that the crystallised
phases are also dissolved from the beginning.
0 3 6 9 12 15 18 21 24
experimental points
Reaction time (h)
Dis
so
lve
d s
ilic
a
I II
Figure III-18 Typical dissolution kinetics of aggregate in HF

Chapter III
80
The kinetics of dissolution of the aggregates in HF (O, Q and QA) or in HF+HCl (SL) are given
in Figure III-19. The two-phase evolution obtained for the aggregates is consistent with the
works of [Murat and Arnaud 1988 and Pichon et al. 1996], who worked on pozzolans. The
results deduced from these curves (reactive silica content, end of phase I and dissolution rate of
crystalline phase) are shown in Table III-4.
0
10
20
30
40
50
60
70
0 6 12 18 24
SL
Dis
so
lved
SiO
2 (
%)
.
Reaction time (h)
9.614.02 tSiO
0
10
20
30
40
50
60
70
0 6 12 18 24
O
Dis
so
lved
SiO
2 (
%)
.
Reaction time (h)
5.5037.02 tSiO
0
10
20
30
40
50
60
70
0 6 12 18 24
Q
Dis
so
lved
SiO
2 (
%)
.
Reaction time (h)
6.741.02 tSiO
0
10
20
30
40
50
60
70
0 6 12 18 24
QA
Dis
so
lved
SiO
2 (
%)
.
Reaction time (h)
9.228.02 tSiO
0
10
20
30
40
50
60
70
0 6 12 18 24
QF
Reaction time (h)
Dis
so
lved
SiO
2 (
%)
.
5.732.02 tSiO
Figure III-19 - Evolution of dissolved silica in HF as a function of time at 4oC, L/S=200ml/g
(a) Opal (b) Siliceous limestone (c) Quartzite (d) Quartz aggregate
Table III-4 Results of dissolved silica in HF/HF+HCl solution at 4oC, L/S=200ml/g
O SL Q QA
Amorphous SiO2 (%) 50.4 6.9* 7.6 2.7
End of phase I (~ h) 1 3 1 2
Dissolution rate of crystalline phase (% /h) 0.38 0.14 0.41 0.28
* HF+HCl

Chapter III
81
As for the other methods, O gave the highest value, much higher than the other aggregates. SL
and Q were in the same range, and also showed a similar reactivity in expansion tests (Figure
III-13). QA gave the lowest value, in accordance with the fact that this aggregate is considered as
poorly reactive.
A supplementary test with HF only was made for the siliceous limestone. A value of 5.3% was
found, compared to 6.9 when HF-HCl was used. This 20% difference cannot be caused by the
attack by the added HCl, because Liang and Readey [1987] found that the addition of 1 mol/l HCl
in HF solution did not change the dissolution of silica in fused silica and quartz. The difference may
be attributed to the fact that, under the effect of HCl acid, more silica was released from the
enclosure of calcite (no pre-treatment was made for acid attacks) and participated in the reaction
with HF. HF also dissolved calcite, but the production of CaF2 which has low solubility, was
likely to precipitate around the silica and prevent it from being attacked. Thus, it was considered
that the result of HF+HCl was more reliable.
The dissolution rates of crystalline phase for the materials containing mostly silica (O, Q, and
QA) were of the same order of magnitude (between 0.28 and 0.41 %/h) and were controlled by
the dissolution of quartz. The differences probably depended on the properties of the attacked
crystallized phases, such as the surface area and the porosity, which controlled the diffusion
process of the solution in the aggregate. In the case of siliceous limestone, the slower rate of
dissolution (0.15 %/h) was probably due to the presence of calcite, which made the silica more
difficult to reach than in the other aggregates.
3.4. Comparison of the methods and discussion
The three methods presented in the previous section were effective in attacking silica in
aggregates (Figure III-20) but, as discussed, some doubts remained about the nature of the
dissolved silica. It is important to know if the silica quantified by these methods is only the part
of the silica that is reactive, i.e. the one responsible of the degradation of concrete due to ASR, or
if a part of the crystallised silica, which should remain stable in the long term in a cement-based
material, is also dissolved.
The reliability of the methods is now discussed by comparing, in Figure III-21, the results of the
three methods (Figure III-20) with the asymptotic expansions measured using the mortar-bar test
(Figure III-13).

Chapter III
82
9.5
58.9
3.42.4
77.1
5.4 5.46.9 7.6
2.7
73.0
50.4
0
10
20
30
40
50
60
70
80
SL O Q QA
NaOH-HCl HCl-KOH HF
Dis
so
lve
d S
iO2 (
%)
.
Figure III-20 Dissolved silica of each material for the three tests used.
R2 = 0.96
0.0
0.2
0.4
0.6
0.8
1.0
1.2
1.4
1 10 100
Dissolved silica (%)
Exp
an
sio
n (
%)
.
HF (4°C)
Q
SL
O
QA
R2 = 0.60
0.0
0.2
0.4
0.6
0.8
1.0
1.2
1.4
1 10 100
Dissolved silica (%)
Exp
an
sio
n (
%)
.
HCl (heated) - KOH (boiled)
Q
SL
O
QA
R2 = 0.57
0.0
0.2
0.4
0.6
0.8
1.0
1.2
1.4
1 10 100
Dissolved silica (%)
Exp
an
sio
n (
%)
.
NaOH (100°C) – cold HCl
Q
SL
O
QA
Figure III-21 Final expansion of mortar bars as a function of dissolved silica for aggregates
O, Q, QA and SL, for the three methods used.

Chapter III
83
NaOH-HCl
Basic attack is thought to be representative of the real structure environment. However, this
method did not seem reliable, for many reasons:
As seen in Figure III-22, the dissolution of silica at high pH is difficult to control and
high variations of SiO2 can be obtained for small differences of pH
For a given aggregate, no different rates of dissolution can be distinguished (as for HF
attack), which would allow the separation of the different forms of silica. Thus the
dissolved silica is calculated from an asymptotic value obtained by curve fitting.
Knowing that, at high temperature, the kinetics of quartz dissolution increases rapidly
[Liang and Readey 1987], some concerns arose about whether this method attacked part
of the well-crystallized silica. It led to an overestimation of the reactive silica available
for ASR in concrete. The decrease of the temperature (from 100 to 60°C) did not improve
the results, and the duration of tests became problematic (tens of days). Since high
temperatures are usually used in accelerated ASR tests, some concerns could arise about
the effectiveness of evaluating reactive aggregates in mortars and concrete at these
temperatures.
No correlation can be highlighted with expansion measurements (Figure III-21).
An improvement of the method would be to more accurately reproduce the pore solution of
concrete that attacks the aggregates, as in the method proposed by Bulteel et al. [2002].
However, this kind of method leads to the production of hydrates (which include silica), and thus
makes the measurement of silica complicated and time-consuming.
Figure III-22 The solubility of quartz and amorphous silica at 25°C (from Tucker [2001])

Chapter III
84
HCl-KOH
This method is derived from the analysis of cements and standardized for fly ash (EN 450-1). It
has been successively used for the measurement of the reactive part of fly ash. However, the
results obtained on aggregates seem to deviate from the practical expansion results (Figure III-
21). The main disadvantage seen in the present study is that the severe acid environment
combined with hot conditions led to the dissolution of well-crystallised quartz (e.g. QA). With
only one test at a given time, it seems impossible to distinguish between the different forms of
silica. So in order to guarantee correct separation of reactive and stable silica, it seems to be
preferable to use a method which gives the kinetics of dissolution.
HF
When compared to the former methods, the advantage of HF attack is that it allows the
calculation of the reactive silica by dissociating the dissolution curves into two phases. These
two phases are distinguished by their dissolution abilities. Thus, for the HF method, there is less
problem of counting parts of quartz as reactive as mentioned in the other methods. A good
correlation is found with the expansion results, as confirmed by the value of the coefficient of
determination (R2=0.96).
Although this method is based on an acid attack, it seems to be the best compromise to quantify
the active fraction of silica in alkali-silica reactive aggregates. The method is rapid (in 24 hours)
and simple and allows the different forms of silica to be separated.
4. Conclusion
The quantification of the reactive silica is necessary to assess the residual expansion of structures
damaged by ASR. The originality of this work is to investigate three methods used to measure
the reactive silica in various aggregates in the sole aim of quantifying the part of silica
potentially available for ASR in concrete. Knowing the sensitivity of quartz dissolution to the
liquid/solid ratio and temperature conditions, the most representative tests would use real
structure conditions for these two parameters. The use of the real conditions of liquid / solid ratio
and temperature of ASR-damaged structures would lead to long measurements; this would
hardly be effective for the assessment. That is why fast methods are necessary.
Three methods were tested: one basic attack - NaOH (100°C and 60°C)-HCl - and two acid
attacks - HCl-KOH and HF. The reactive silica was quantified in five materials, including three
reactive aggregates and two non-reactive materials. The results show that NaOH attack at 100°C
is more effective than attack at 60°C but the high reaction temperature seems to cause the attack
of a part of the well-crystallized minerals and thus leads to confusion between the silica which
can be soluble in chemical tests and the silica which would really react with alkali in concrete
(with lower liquid/solid ratio and lower temperature). HCl-KOH attack is found unsuitable since
the results of reactive aggregate – Quartzite, and the non-reactive aggregate – Quartz aggregate,
are the same. Comparing the chemical quantification with the expansion results, the HF method
presents the best accordance with the mortar tests. It cannot be concluded that these values of the
HF method are the exact amounts of “reactive silica” because the acid attack cannot represent the

Chapter III
85
real environment of alkali-silica reaction. However, this method appears to provide a reliable
approach for roughly evaluating the amount of reactive silica in the material.
Finally, among the different tests, HF/HF+HCl attack is the best compromise since it satisfies the
objectives fixed initially: a rapid (24 h) and simple test which allows the separation of reactive
and non-reactive silica. Moreover, the dissolution results obtained by this method show a high
correlation with expansion tests.

Chapter IV
86
Chapter 4
Chemo-mechanical modelling
1. Introduction
The development of a microscopic ASR model is a major concern of researchers trying to
understand the mechanisms involved in the reaction and to predict future expansion of concrete.
Previous modelling investigated the different aspects of the reaction: the mechanical
consequences of an expansive aggregate in cement paste [Bazant and Steffens 2000, Comby-
Peyrot et al. 2009, Goltermann 1994], the chemical mechanisms driving attacks of the aggregate
by hydroxyl ions [Furusawa et al. 1994], and their coupling [Bazant and Steffens 2000, Multon
et al. 2009, Poyet et al. 2007, Nielsen et al. 1993, Sellier et al. 1996, Suwito et al. 2002]. The
work presented here is based on the microscopic model developed by Multon et al. [2009]. This
microscopic model is based on some of the previous models [Furusawa et al. 1994, Nielsen et al.
1993, Poyet et al. 2007, Suwito et al. 2002] and attempts to predict the damage and the
expansion of a Representative Elementary Volume (REV) of concrete containing a mix of
reactive aggregates of different sizes. The attack of the reactive silica by alkali was determined
through the mass balance equation, which controls the diffusion mechanism in the aggregate and
the fixation of the alkali in the ASR gels. The mechanical part of the model is based on the
damage theory in order to assess the decrease of stiffness of the mortar due to cracking caused by
ASR and to calculate the expansion of a Representative Elementary Volume (REV) of concrete
[Multon et al., 2009]. However, the experimental results which were presented in the Chapter 2
revealed a serious imperfection of this model: it does not take the effect of the specimen size into
account. The main aim of this chapter is to take this parameter into consideration. Another
modification appears in the experimental conditions. In the experimentation analysed by Multon
et al. [2009], the specimens were kept in air at 95% RH without an external supply of alkali. In
this study, the model considers the presence of alkali at the external boundaries of the specimens.
In this chapter, the previous model is first presented with the new developments of the effect of
the specimen size. Then, the experimental results obtained from the former chapters are used to
calibrate and discuss the validity of the model. At the end, the results of this microscopic model

Chapter IV
87
are used to assess the chemical advancement used in the model of structure qualification [Sellier
et al. 2009].
2. Principles
2.1. Mechanics of ASR
The model was first based on the mechanisms proposed by Dent Glasser and Kataoka [1981] and
on considerations made by Jones [1988]:
The hydroxyl ions diffused around the reactive aggregate, attack and destroy the Si-O
bonds, and then form ASR gel in presence of water and calcium ions.
Gel permeates through the connected pores which exist between aggregate and cement
paste and fills a part of the connected porosity [Jones 1988]. When the volume of gel is
greater than the porous volume, it exerts a pressure on the cement paste, which causes
cracking and expansion of the concrete.
2.2. Assumptions
Based on the mechanisms above, several assumptions were made to simplify the physical and
chemical process of this reaction. Simplifications have to be assumed in order to model ASR
expansion in accordance with most phenomena.
2.2.1. Geometry
The reactive aggregate is taken to be spherical. The Relative Elementary Volume (REV), which
represents the surroundings of the aggregate in the concrete paste, is assumed to be spherical too
(Figure IV-1), and it can be deduced as in Equation IV-1, depending on the size and content of
the aggregate.
Figure IV-1 Definition of the Relative Elementary Volume for several reactive aggregate sizes
[Poyet et al. 2007]
Porous zone
(thickness tc)
Reactive
aggregate
r
R.E.V.
Concrete
R.A
Cement paste
and aggregate
Final REV with the
maximal radius

Chapter IV
88
3 . agga
aa
REVC
RR
(IV-1)
a: a superscript relative to the size fraction of the reactive aggregate with mean radius Ra
Ra
REV: the REV radius corresponding to aggregate size fraction a
Φa: the volume fraction of reactive aggregates with mean radius Ra
Cagg: the volume fraction of all the aggregate per m3 of concrete.
The number of reactive aggregates per m3 of concrete Na is equal to:
3
3
4
.
a
agga
a
R
CN
(IV-2)
All the aggregates of a given size are assumed to expand in the same way (same kinetics and
same amplitude).
2.2.2. Transport of alkali
As explained in the introduction to this chapter, the model was modified to take the specific
experimental conditions into account. In the expansions analysed in this part, the specimens were
immersed in NaOH solution (1 mol/l).
2.2.2.1. Diffusion of alkali in cement paste
The diffusion of the ionic species into the cement paste is considered as roughly homogeneous.
In Poyet‟s work [Poyet 2003], the coefficient of diffusion of alkali in cement paste was estimated
approximately 10-11
m2/s while the coefficient of diffusion in aggregate was 10
-15 m
2/s [Suwito et
al. 2002]. Therefore, Multon et al. [2009] considered that the diffusion in the paste was much
more rapid than the diffusion in the aggregate and thus the diffusion in the cement paste was
considered not to affect the kinetics of ASR-expansion. This assumption was made for the
analysis of small specimens (20 mm) not exposed to an external supply of alkali. However, the
observations made on the experimental measurements presented in Chapter 2 show that this
cannot be assumed for large specimens (like 40x40x160 mm and 70x70x280 mm). Therefore,
the model was modified in order to consider the effect of the alkali diffusion in the cement paste
and to predict the different dissolution rates observed according to specimen size.
Because there is an external supply of alkali, the alkali diffuses first towards the aggregates close
to the external boundary of the specimens, which react before the aggregates in the core of the
specimens (Figure IV-2). This means that all the aggregates of a given size cannot have the same
expansion at the same time (difference of kinetics), which is in opposition to the assumption
made above. Only complete discretization of the whole specimen would allow this difference of
expansion to be considered. This type of approach has been proposed by [Comby-Peyrot et al.
2009]. In our work, the phenomenon of diffusion in the specimen was simplified. The quantity
coming into the specimen was approximated by a mean flow of alkali proportional to the

Chapter IV
89
difference of concentration between the external alkali concentration and that a quarter of the
way into the specimen (Figure IV-2). This ¼ l is an empiric value. The greater this value is
chosen, the higher the difference of alkalis concentrations is, and then the faster the rate of
alkalis diffusion will be. In the contrary, the smaller this value is, the slower the rate of alkalis
diffusion will be. It is difficult to have a value representative of reality. In our calculations, ¼ l
was found to be more representative. '
Figure IV-2 Diffusion of Na2Oeq in paste
2.2.2.2. Diffusion of alkali in aggregate
The aggregate was taken as spherical in this model. The concentrations of the ionic species
diffusing into the aggregate depend only on the time and on the radius r from the centre of the
reactive aggregate (Figure IV-3).

Chapter IV
90
Figure IV-3 Diffusion of Na2Oeq in aggregate [Multon et al. 2009]
2.2.3. Threshold of alkali concentration
In the model of Multon et al. [2009], a threshold of alkali concentration of 0.625 mol/l of Na+,
was considered, under which ASR did not occur. It was based on the strong non-linearity
between the pH and the solubility of the silica, since “the solubility of silica is quite constant in a
solution having a pH of less than 9 or 10 but increases rapidly for higher pH” [Urhan 1987]. In
concrete, this threshold of alkali concentration has been pointed out by numerous experiments
and evaluated at between 3 and 5 kg/m3 [Hobbs 1993, Rogers and Hooton 1991, Shehata and
Thomas 2000, Thomas et al. 1996]. Thus, in mortar tests (in air, R.H.>95%), the concentration
of alkali played an important role in attacking silica.
In this work, all the mortars were kept immersed in alkali solution and, thus, the alkali was
supplied in abundant quantities. The experiments performed on specimens immersed in three
alkali concentrations (0.77, 1 and 1.25 mol/l) showed few differences. Considering a threshold of
0.625 mol/l, the expansion of the mortars kept in 0.77 mol/l solution should be significantly
slower than the expansion of the mortars kept in 1.25 mol/l solution. With this threshold, the
alkali concentration in the aggregate has to be higher than 0.625 mol/l before the reactive silica is
attacked. The speed is then proportional to the difference between the alkali concentration in the
paste and the threshold. Then, the concentration gradient between the paste and the aggregate
remains too small to induce the same reaction speed as for the other concentration. But it has
been observed that the swelling kinetics is quite similar (Chapter 2). Therefore, the gradient
must be the same and consequently the alkali consumption by the silica must begin as soon as
alkalis are present in the aggregate, without a threshold. The results of this assumption will be
studied in the following investigations. The threshold observed in concrete specimens exposed to
air or water without alkali could be explained by the retention of alkali in CSH rather than by a
Ra
r Aggregate
eqONaC2
eqONa2
eqONa2
Concentration of ionic
species is constant at a
distance r from the
centre

Chapter IV
91
threshold effect on the silica dissolution. This fixation consumes alkali, which can no longer
react with silica, and causes an apparent threshold effect.
2.2.4. Effective ASR gel
The composition of ASR gel varies and depends on many parameters of the reaction. The range
of Na2O / SiO2 ratio was found to be 0.1~0.4 [Kawamura and Fuwa 2003, Taylor 1990, Thaulow
et al. 1996]. In the model used here, the Na2O / SiO2 ratio is assumed to be equal to a mean value
0.2 obtained in laboratory experiments in [Kawamura and Fuwa 2003] and used in [Multon et al.
2009]. It means that 1 mole of Na2Oeq reacts with 5 moles of SiO2 to give 1 mole of ASR gel.
Then the total volume of gel can be calculated by Equation IV-3:
mol
gel
i
i
gg VnV
(IV-3)
ngi (mol): the number of moles of ASR gel produced by the aggregate size i
Vgelmol
(m3/mol): the molar volume of the gel
After gel has formed, it can permeate through the connected porous volume and partly fill it. It
can also leach off the specimens into the solution through the cracks. The previous model
[Multon et al. 2009] only considered the first phenomenon. However, the gel lost in these two
ways does not produce significant pressure. The proportion of gels staying in the connected
porosity was calculated as the total volume of porosity filled by the gel with an equivalent
thickness tc, which was assumed to be constant with the size of the aggregate [Poyet et al. 2007,
Sellier 1995]. Thus, the volume of this part of the gel filling the porosity can be expressed as in
Equation IV-4.
pRtRV acapor .3
4 33
(IV-4)
Ra: the radius of the particles
tc: the thickness of gels (around aggregates) filling the porosity
p: the connected porosity
A part of the rest of the gel <Vg – Vpor > is assumed to leach off the specimens into the solution,
which does not produce significant pressure either. This part depends on the scale effect
“specimen size/aggregate size”: the smaller the “specimen size/aggregate size” ratio, the more
the gel leaches off. This phenomenon is also affected by the nature of the aggregate. As
explained in the analysis of the experiments, the greater the reactive silica content is, the stronger
is the non-linearity due to leached gel. Fracture mechanics concepts show that the aggregates
closer to the external boundary lead first to cracks connected with the external solution. In order
to quantify this effect, it can be assumed that these aggregates lose more gel than the aggregates
located in the core of the specimens. As for the diffusion in cement paste, this will lead to a
gradient of deformation between the external boundary and the core and thus to internal stresses,
which it is impossible to consider with this model. Due to the complexity of quantifying this

Chapter IV
92
phenomenon by theoretical concepts, only a numerical model including a mesh of aggregate
[Comby-Poyrot et al. 2009] and an empirical relationship can be proposed here to assess the
consequences on ASR expansions. A mean leaching is assumed that applies equally to all the
aggregates of a given size. The decrease of the gel volume effective in the expansion measured
on the specimen is given by Equation IV-5.
x
porg sl
cVVV
exp
(IV-5)
V: the volume of the gel available to produce pressure
Vg: the total volume of gels
Vpor: the volume of gel filling the connected porosity
c: the scale effect coefficient, fitted to take account of the stress concentration induced by the gel,
considering the effect of the ratio of „aggregate size / specimen size‟ and the nature of the
aggregate
Φ: the aggregate size
l: the specimen size
s: the amount of reactive silica (mol/m3 of aggregate)
: silica content exponent, fitted to take into account the stress concentration induced by the gel
considering the reactive silica content due to the nature of the aggregate
2.2.5. Mechanical consideration
No modifications were made to the mechanical part of the model. The model assumes a stress-
free state of the specimens. The mechanical behaviour of the aggregate and of the cement paste
in the REV (Relative Elementary Volume) are considered as isotropic [Poyet et al. 2007]. The
expansion due to ASR occurs over a long period. During this period, the materials are subjected
to progressive stresses which cause creep strains in the concrete. To calculate the effect of creep
strain on the ASR expansion, a long-term Young‟s modulus is used. For the same stress, using
the long-term modulus rather than the instantaneous modulus leads to larger strains. The strains
are then equal to the sum of the instantaneous strains due to the ASR gel pressure and the creep
strains of the cement paste under the ASR gel pressure. If the stresses become higher than the
tensile strengths of the materials, cracking and damage occur in the concrete. In the following
calculations, the crack density is consistent with the damage to the concrete calculated by the
model (the damage is defined as the decrease of the long-term Young‟s modulus due to
cracking). After cracking, the gel is assumed to permeate into the cracks.
3. Physicochemical modelling
This part presents the equations of the diffusion of the alkali ions into the cement paste and into
the aggregate and ends with the assessment of the volume of ASR gel created. As presented in
[Multon et al. 2009], the alkali diffusion into the aggregate is controlled by the mass balance
equation. A depletion term is used to represent the consumption of alkali during the formation of

Chapter IV
93
the ASR gel. Finally, the volume of gel produced by the reaction is proportional to the amount of
alkali consumed in the mass balance equation. Two points are different in the modelling
presented here: the specimens are immersed in NaOH solution (1 mol/l) and the alkali diffusion
in the cement paste is taken into account.
3.1. Mass balance equations
3.1.1. Alkali diffusion in cement paste
The variation of alkali content in the cement paste is due to the diffusion of alkali from the
external solution to the aggregate through the cement paste. Without an external supply of alkali,
the variation between the cement paste and the aggregate is equal to the sum of the flux of alkali
at the boundary (r=Ra) between all the aggregate and the paste. Due to the immersion in NaOH
solution, alkali comes into the cement paste from the solution. It is assessed by a sink term Scp.
Therefore, the mass balance equation for the alkali diffusion in the cement paste is:
cp
a
a
a
Na
aaa
cp
Narcpagg SRr
CRDNCSp
tC
24..1
(IV-6)
with
Cagg the aggregate concentration per m3 of concrete,
pcp :the porosity of the cement paste,
Sr : the saturation degree,
Ccp
Na: the mean alkali concentration in the cement paste,
Na: the number of reactive aggregates of size a per m3 (Equation IV-2),
Ca
Na: the concentration of alkali in the aggregate per m3 of mortar,
D a: the coefficient of diffusion of alkalis into the aggregate.
As explained above, the quantity coming into the specimen is determined by a mean flux of
alkali calculated between the external boundary and the inner quarter of the specimen. This flux
supplies alkali through the external surface of the specimens Sdif
sp. The total amount of alkali
coming into the specimen is the product of the mean flux by this external surface area. For 1 m3
of mortar, the sink term is this total amount of alkali divided by the volume of the specimen Vsp.
Thus, the sink term in Equation IV-7 is:
2
0
2
00
4/
4
4/4/ l
CCD
hl
hl
l
CCD
V
S
l
CCDS
cp
NaNa
cp
cp
NaNa
cp
sp
dif
spcp
NaNa
cpcp
(IV-7)
with:
C0
Na: the alkali concentration in the solution (equal to 1 mol/l),
Dcp: the coefficient of diffusion of alkalis into the cement paste,
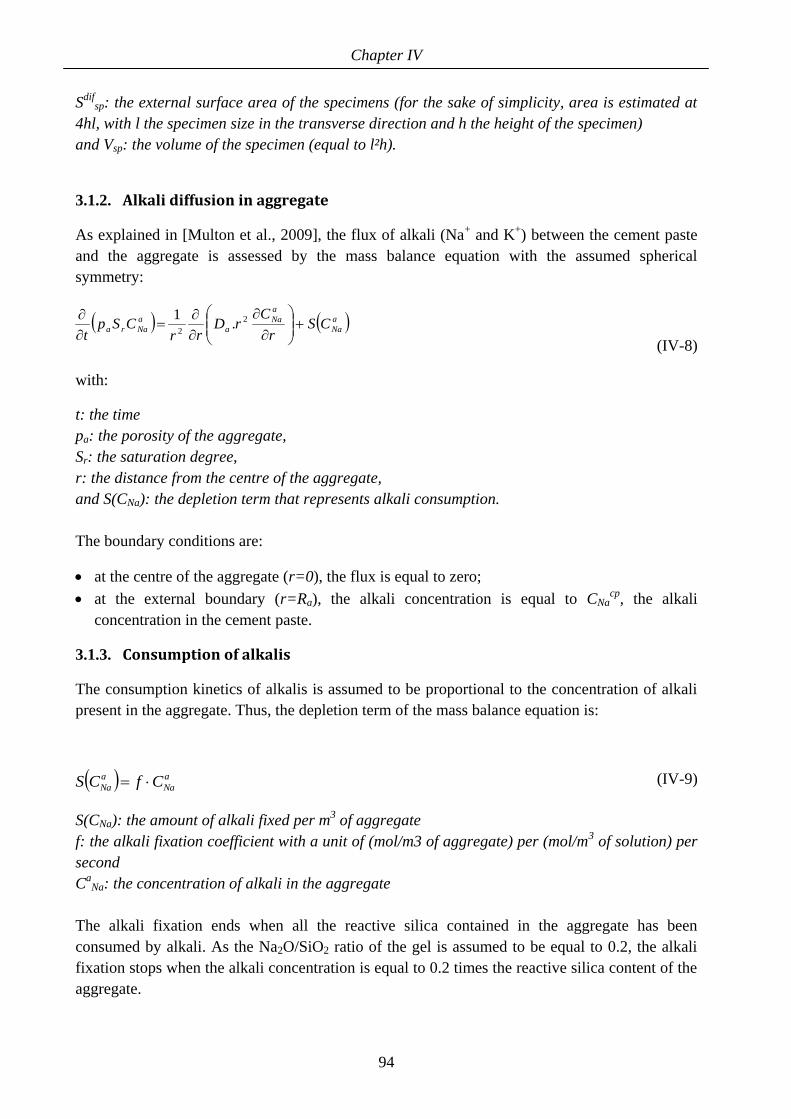
Chapter IV
94
Sdif
sp: the external surface area of the specimens (for the sake of simplicity, area is estimated at
4hl, with l the specimen size in the transverse direction and h the height of the specimen)
and Vsp: the volume of the specimen (equal to l²h).
3.1.2. Alkali diffusion in aggregate
As explained in [Multon et al., 2009], the flux of alkali (Na+ and K
+) between the cement paste
and the aggregate is assessed by the mass balance equation with the assumed spherical
symmetry:
a
Na
a
Na
a
a
Nara CSr
CrD
rrCSp
t
2
2.
1
(IV-8)
with:
t: the time
pa: the porosity of the aggregate,
Sr: the saturation degree,
r: the distance from the centre of the aggregate,
and S(CNa): the depletion term that represents alkali consumption.
The boundary conditions are:
at the centre of the aggregate (r=0), the flux is equal to zero;
at the external boundary (r=Ra), the alkali concentration is equal to CNacp
, the alkali
concentration in the cement paste.
3.1.3. Consumption of alkalis
The consumption kinetics of alkalis is assumed to be proportional to the concentration of alkali
present in the aggregate. Thus, the depletion term of the mass balance equation is:
a
Na
a
Na CfCS (IV-9)
S(CNa): the amount of alkali fixed per m3 of aggregate
f: the alkali fixation coefficient with a unit of (mol/m3 of aggregate) per (mol/m3 of solution) per
second
Ca
Na: the concentration of alkali in the aggregate
The alkali fixation ends when all the reactive silica contained in the aggregate has been
consumed by alkali. As the Na2O/SiO2 ratio of the gel is assumed to be equal to 0.2, the alkali
fixation stops when the alkali concentration is equal to 0.2 times the reactive silica content of the
aggregate.

Chapter IV
95
3.2. Formation of ASR gels
Finally, the number of moles of ASR gel produced in the aggregate a is equal to the number of
moles of Na2O consumed by the reaction, thus half the number of moles of Na+:
t a
Naa
a
g dtCS
Rn0
3
23
4
(IV-10)
4. Mechanical modelling
From the main results of the chemical modelling, Vg (the volume of available ASR gel), the
strain induced on the REV and the expansion of the damaged concrete can be determined. In the
REV (Relative Elementary Volume), the mechanical equations are used for two media: a, the
aggregate under study, and SC, the concrete surrounding the studied aggregate (medium
including cement paste and other aggregate – Figures IV-4 and IV-5). The ASR gel is taken to be
incompressible. The cracking due to ASR is considered as isotropic and the mechanical problem
is assumed to be non-linear due to the introduction of the damage variable. The main equation
used in the model is obtained as follows.
The cement paste and aggregate are first considered as elastic. Therefore, the ASR expansion can
be taken into account as an imposed strain in the aggregate elastic constitutive law:
timp
µµItr aaaaaaa 1232
where
imp1 is the imposed strain applied to the aggregate due to the increasing volume
which can be caused by ASR gels and aggregate cracking.
(IV-11)
The constitutive law of the medium SC only considers the elastic effect of the material:
scscscscsc µItr 2 (IV-12)
with
the stress matrix for each material,
the strain matrix for each material,
I the unit matrix,
and µ are, for each material:
211
E
(IV-13)

Chapter IV
96
and
12
Eµ
(IV-14)
E: the Young‟s modulus
ν: the Poisson‟s coefficient of the medium.
εimp1: the imposed strain applied to the aggregate.
When the chemically imposed strains become too large, the tensile stresses in the cement paste
can be higher than the tensile strength and cracks appear in the material. Cracking causes a
decrease in the Young‟s modulus. It is taken into account by a damage evaluation model. The
damage evaluation method is based on the strain equivalence principle [Lemaître and Chaboche
1988]: the cracked medium (initial Young‟s modulus E0) is replaced by an equivalent medium
without cracks but with a lower modulus Ed leading to the same displacement as the cracked one
with the initial Young's modulus [Multon et al. 2009]:
0
1E
Ed d
(IV-15)
Cracks close to the aggregate are assumed to be filled by the ASR gels and, in the mechanical
problem, three parts are distinguished (Figure IV-5): the central aggregate (between radii 0 and
Ra), the cracked zone filled by the gel (between radii Ra and Rcz) and the part of the REV not yet
cracked. As the gel reaches the cracks connected to the reactive aggregate, the radius Rcz
corresponds to the radius Rd used to determine the damage (Figure IV-5). The gel pressure is
constant in both the aggregate and the cracked zone. It is then applied to the internal boundary of
the surrounding uncracked concrete. The modulus of the whole medium surrounding the
aggregate is equal to Ed according to the damaged Young‟s modulus evaluated above. The
following behaviour equation, concerning the part of the REV surrounding the aggregate and
filled by the ASR gel, has to be added. The constitutive law of this part is:
timp
µµItr czczczczczfgcz 2232 (IV-16)
where
imp2 is the imposed strain applied to the cracked zone of the surrounding concrete due to the
presence of ASR gel in the cracks.

Chapter IV
97
Figure IV-4 Determination of the modulus of the damaged concrete [Multon et al. 2009]
Figure IV-5 Mechanical equilibrium of the damaged REV [Multon et al. 2009]
The chemically imposed strains are assessed from the relative increase of volume due to the
production of gel by ASR. The part of the gel which fills the porous volume surrounding the
aggregate and the part of the gel leached off the specimen do not participate in the pressure and
thus in the expansion. The last equation is given by chemical modelling:
lcVVRRR porgim paczim pa
exp
3
4
3
42
33
1
3
(IV-17)
where
X is equal to X if X > 0 or equal to 0 if X ≤ 0.

Chapter IV
98
The mechanical modelling uses only five parameters: the Young‟s modulus and the Poisson‟s
coefficient of the aggregate and mortar (Ea,a and Em,m) and the tensile strength of the mortar
ft. No fitting is necessary for the mechanical part.
5. Application and comparison with experiments
Calculations were performed to analyse the experiments presented in Chapter 2 (expansion tests)
with the chemo-mechanical model presented above. Some of the necessary parameters were
firstly determined with tests carried out on 70x70x280 mm specimens. The parameters obtained
were applied to predict the expansion curves of the two other specimen sizes (40x40x160 mm,
20x20x160 mm) in the same environmental conditions and immersed in different alkali
concentrations (0.77, 1 and 1.25 mol/l). In order to assess the capability of the model to
represent and predict real ASR expansions, the analysis is divided into three parts. First, different
experimental points necessary for modelling are briefly recalled. Then, the assessment of all the
parameters is explained. Finally, a discussion analyses the model.
5.1. Experimental conditions
The experimental results used in the calculation have already been presented and analysed in the
previous chapters. Therefore, in this part, only the features used by the model are introduced
briefly.
Expansion was measured on mortar prisms with a sand (1512 kg/m3) to cement (CEM I 52.5R,
504 kg/m3) ratio of 3, and a water-cement ratio of 0.5. The sand contained 30% of reactive
aggregate and 70% of non-reactive marble.
Effects of aggregate size and specimen size on expansion
Siliceous limestone was used as reactive aggregate. Four aggregate size classes: C1 (0~315 µm),
C2 (315-630 µm), C3 (630-1250 µm) and C4 (1250-2500 µm) and three specimen sizes
70x70x280 mm, 40x40x160 mm, 20x20x160 mm were used to research the effect of aggregate
size and specimen size on expansion. Alkali content (Na+) of mortar was added into the mixtures
of cement paste in order to obtain an alkali concentration in the pore solution of 1 mol/l. The
specimens were conserved in 1 mol/l NaOH solution at 60°C.
Effects of alkali concentrations on expansion
The specimen size of 20 x 20 x 160 mm and aggregate size range of 315-1250 µm were chosen
to investigate the effect of alkali concentrations and aggregate nature on the expansion. Three
NaOH contents were added into the mixture of cement paste for the siliceous limestone to obtain
different alkali concentrations in the pore solution (0.77, 1 and 1.25 mol/l). Correspondingly the
specimens were stored respectively in 0.77, 1 and 1.25 mol/l NaOH solutions.

Chapter IV
99
Effects of aggregate nature on expansions
For the study of the aggregate nature, two supplementary mixtures were cast with Opal,
Quartzite and Quartz Aggregate (aggregate size range of 315-1250 µm) and conserved in 1 mol/l
solution.
5.2. Assessment of the parameters Table IV-1 sums up the various parameters of the two models, stating the symbols, the method
used for identification, the values and the units. The following parts explain how the values were
obtained.
Table IV-1 Parameter identification
Parameter Symbol Identification Value Units
Physicochemical modeling
Aggregate Reactive silica content
s
measurement
3.0 x 10³
mol/m3
Coefficient of diffusion Da curve fitting 5.0 x 10⁻¹⁵ m²/s
Porosity p usual value** 0.01 %
Paste Coefficient of diffusion
Dcp
curve fitting
5.0 x 10⁻¹³
m²/s
Porosity of mortar pmort measurement 18.0 %
Thickness of the connected
porous interface zone
tc curve fitting 14.0 x 10⁻⁶
m
Gel Molar volume of ASR gel Vgel
mol curve fitting 4.2 x 10⁻⁴ m3/mol
Alkali fixation coefficient f previously determined* - 6.5 x 10⁻⁷ m3/m3/s
Scale effect coefficient c curve fitting 0.037 (mol/m3)-
Silica content exponent curve fitting 0.75 -
Mechanical modelling
Aggregate Young‟s modulus Ea usual value** 70000 MPa
Poisson‟s coefficient υa usual value** 0.2 -
Mortar Young‟s modulus EREV usual value** 9000 MPa
Poisson‟s coefficient υREV usual value** 0.2 -
Tensile strength ft usual value** 3 MPa
*results determined in [Multon et al. 2009]
**results from [Larive 1998, Poyet 2003, Multon et al. 2009]

Chapter IV
100
5.2.1. Parameters of the physicochemical and mechanical modelling
Parameters of the physicochemical modelling:
The reactive silica contents par m3 aggregate are shown in Table IV-2. The porosity of the
aggregate was taken as equal to 0.01% [Poyet 2003]. The porosity of the mortar determined for
the same kind of materials in a previous experimental study was around 18% [Multon et al.
2010]. The alkali fixation coefficient was calculated and determined in a previous work [Multon
et al. 2009].
Table IV-2 Reactive silica contents of different aggregates
Reactive silica SL O Q QA
Percentage (%)* 6.9 50.4 7.6 2.7
Content in m3 aggregate (mol/m
3) 3000 21900 3300 1170
* Results obtained from HF/HF+HCl method (Chapter 3)
The last five parameters of the physicochemical modelling (coefficient of diffusion in aggregate
Da and in paste Dcp, thickness of the connected porous interface zone tc, molar volume of ASR
gel Vgelmol
, scale effect coefficient c) were obtained by curve fitting on the expansions measured
on the specimen of size 70x70x280 mm with four different size classes (C1~C4) of aggregate
SL, as shown in 5.2.2.
Mechanical modelling:
All the parameters of the mechanical modelling (Table IV-1) were obtained from the literature.
The Young‟s modulus of an equivalent siliceous limestone was determined in experiments
reported by [Larive 1998]. The other values were obtained from [Multon et al. 2009]. The
instantaneous Young‟s modulus of the mortar was taken as equal to 27000 MPa. The creep effect
was taken into account by the use of a long-term Young‟s modulus equal to one third of the
instantaneous Young‟s modulus. The Poisson‟s coefficients of aggregate and mortar were taken
as 0.2. The tensile strength of the mortar was evaluated at 3 MPa.
5.2.2. Identification by curve fitting
As seen in Figures IV-6 and IV-7, the six parameters to be fitted - coefficient of diffusion in
aggregate (Da) and in paste (Dcp), thickness of the connected porous interface zone (tc), molar
volume of ASR gel (Vgelmol
) and the coefficients of non-linearity (c and ) - have different effects
on the expansion curves. Considering their influences on the form of the expansion curves, these
effects can be classified in two categories:

Chapter IV
101
1) Parameters affecting the final expansion
The molar volume of ASR gel (Vgelmol
), the thickness of the connected porous interface zone (tc)
and the coefficients of non-linearity (c and ) are parameters affecting the final expansion. As
shown in Figure IV-6, the influence of individual parameters on the expansion curve is presented
under the condition of fixing the other parameters. The parameter Vgelmol
has an increasing effect
on final expansion (Figure IV-6a), which means that the higher the molar volume of ASR gel,
the larger the final expansion. tc represents the thickness of the connected porous zone (Figure
IV-1) and has a decreasing effect on final expansion (Figure IV-6b). If the thickness is large, a lot
of ASR-gel is necessary to fill the connected porous zone and the final expansion is small. In
contrast, if the thickness is too small, the ASR-gel is present in excessive amounts after filling
the connected porous zone, and this leads to a large final expansion. This picture is clear for
small particles (Figure IV-7). The parameters c and have a negative effect on final expansion
since they represent the loss of gel into the external solution, which does not produce expansion
(Figures IV-6c and IV-6d).
(a) Effect of the molar volume of ASR gel (b) Effect of the thickness of the connected
porous interface zone
(c) Effect of scale effect coefficient (d) Effect of silica content exponent
Figure IV-6 Effect of four parameters on the final expansion

Chapter IV
102
Figure IV-7 Effect of tc on the final expansion with the small particle size (0-315µm)
The values of these parameters were obtained by curve fitting. It was performed on the
expansion curves measured using the largest specimens (70x70x280 mm) since they were less
affected by the scale effect. The parameters Vgelmol
and tc were firstly determined through fitting
the final expansions measured on mortars containing the smallest (0-315 µm) and the largest
(1250-2500 µm) particles. Then the value of c was fitted in order to obtain final expansions of
the aggregate size classes: 315-630, 630-1250, 1250-2500 µm close to the experimental results.
All the three parameters above were determined without considering the effect of the silica
content exponent ( = 0) since the mortar involving the curve fitting contains the same
aggregate: siliceous limestone. Once these three parameters were fixed, the value of was
determined by fitting the final expansion of mortars containing opal as aggregate. The fitting
results of final expansion are shown in Figure IV-8.
Figure IV-8: Experimental and calculated final expansions measured on 70 x 70 x 280 mm
specimens

Chapter IV
103
2) Parameters affecting the expansion kinetics
The coefficient of diffusion in aggregate (Da) and in paste (Dcp), and also the thickness of the
connected porous interface zone (tc) are the parameters affecting the expansion kinetics. These
three parameters show different influences on the shape of the curves (Figure IV-9).
Da changes the latent time (the time necessary to measure expansion) and the initial expansion
rate (Figure IV-9a). A high Da leads to a high rate of alkali diffusion in the aggregate, and thus
alkalis need a short time to initiate the reaction and cause expansion. It also explains why the
initial expansion rate increases with Da. It should be noted that Da can differ with the nature of
the aggregate.
Dcp does not have an effect at the beginning of expansion, because the alkalis present in the pore
solution are sufficient to diffuse into the aggregates and cause the initial expansion. However,
when alkalis are consumed by the reaction with the reactive silica, aggregates need an external
supply of alkalis to keep expanding, and thus the effect of Dcp becomes important. The
expansion rate increases with Dcp, but the increasing trend is more obvious from 5.0 x 10⁻¹⁴
to
5.0 x 10⁻¹³
m2/s than from 5.0 x10
-13 to 5.0 x 10
-12 m
2/s (Figure IV-9b). The increase of Dcp has
only a slight effect on the expansion rate. Due to this fact, ASR expansion rate is driven by
“diffusion into the aggregate”. tc, the thickness of the connected porous interface zone, has an
impact on the final expansion and also on the expansion kinetics through its effect on the latent
time (Figure IV-9c). The higher tc is, the longer the latent time is. High values of tc signify large
volumes of porous zone, which can accommodate a lot of ASR gel without producing expansion,
and thus a long time to fill the porous zone and then produce gels available for expansion.
( a) Effect of Da on the form of expansion curves (b)Effect of Dcp on the form of expansion curves

Chapter IV
104
(c) Effect of tc on the form of expansion curves
Figure IV-9 The effect of parameters Da , Dcp , tc on the shape of expansion curves under the
conditions of fixing other parameters
The fitting of the three parameters is quite difficult and has to be performed simultaneously.
Here, the fitting was carried out using the expansion obtained on the largest particles (1250-
2500 µm) (Figure IV-10). Da was chosen to give a good initial rate of expansion for these
specimens. Then Dcp was determined so that the calculated curve was quite close to the
experimental points. The values of the parameters obtained by fitting are shown in Table IV-1.
Figure IV-10 ASR expansions of specimens 70x70x280 mm for different sizes of aggregates

Chapter IV
105
5.3. Discussion
5.3.1. Curve fitting
The aim of this part is to discuss the ability of the model to represent the expansion measured on
large specimens by the curve fitting presented above.
Benefits
The description of the expansion kinetics by the model is globally quite good: presence of a
latent time before the initiation of the expansion, followed by a high rate of expansion and
ending by a low rate to reach the final expansion.
The model distinguishes the differences of expansion curves due to the differences of size of the
aggregate particles and of the aggregate nature. The experimental programme points out two
main conclusions for 70x70x280 mm specimens: the small particles (smaller than 315 µm)
present very small expansions while particles larger than 315 µm present almost the same
ultimate expansion whatever their size. The small expansion can likely be explained by the
ability of the porous zone connected to the aggregate to accommodate the gel without causing
pressure and thus expansion. In this model, this is obtained for a porous zone about 14 µm thick,
which appears to be realistic. With this assumption alone, the larger the particles are, the larger
the expansion is. This is in contradiction with the measured expansions, which are quite constant
for the three largest particles. This point can be explained by the permeation of gel in cracks
towards the external solution. This leaching could cause lower gel pressure in specimens
containing the largest particles. This phenomenon is quite difficult to quantify by a theoretical
approach. The model proposes an empirical relation to assess the volume of gel leached
according to the specimen size and the aggregate nature, and its consequences on the expansion
(Equation IV-5).
Limits
The curves obtained by the model do not fit perfectly with the experimental results. An absolute
difference of 0.05% is observed between the calculated and the measured expansions for the
particles of 315-630 µm and 1250-2500 µm. This difference is mainly due to the scale effect
coefficient (c). Equation IV-5 implies a maximum for the expansion curve according to the size
of the particle. Thus the model cannot predict the same final expansion value for three different
aggregate sizes. The value of c determined for the calculations (equal to 0.037) appears to be the
best to take this limit into account.
The most important limitation of this model is the difficulty of representing the kinetics of the
expansion measured on the large specimens for all particle sizes and particularly for particles of
315-630 µm and 630-1250 µm. The calculations give a higher rate of expansion than is found
experimentally. A better fit is possible for these particles with smaller coefficients of diffusion in
the aggregate but, in this case, the expansion kinetics which was obtained from the large particles
is too slow for small particles. Only different values of Da could lead to good curve fitting of
expansion. But since these aggregates have the same nature, these differences of Da values seem
incomprehensible.

Chapter IV
106
This difference between modelling and experimental results can also be attributed to the
diffusion in the cement paste (coefficient of diffusion Dcp). As explained above, if Dcp is too
high, the diffusion in the cement paste becomes instantaneous, but if the value is too low,
expansions are too slow and it is impossible to fit the measured expansion. Therefore, the
diffusion in the cement paste appears to be poorly represented by the sink term added into the
model; and the global calculated kinetics remains quite different from the measured expansions.
This problem can be due to the way of taking the diffusion of alkalis into consideration. In the
model, the alkali concentration in the mortar pores is assumed to be the same in the whole
specimen. In reality, the alkali concentration is not uniform in the specimen since the migration
of ionic species in the pores depends on the distance of the pores to the external boundary of the
specimen. However, this limit is clear for large specimens, for which the diffusion in the
specimen has a large effect, but it is much less critical for smaller specimens, as shown in the
next part.
5.3.2. Prediction of expansions with different specimen sizes
Once the curve fitting had been performed on the expansions measured on the 70x70x280 mm
specimens, all the other expansions were calculated without any additional fitting. The
calculations were carried out and compared with the expansions obtained with the four aggregate
classes and two specimen sizes (20x20x160 mm, 40x40x160 mm – Figures IV-11 and IV-12).
The final ASR expansions of most of the specimens were quite well predicted. Table IV-3 shows
the percentage of the difference between calculated and measured final expansions compared
with the maximal value among the measured final expansions of the same specimen size. The
global kinetics appeared well estimated. The worst calculation was obtained for the largest
aggregate size in the smallest specimens (difference of 28%) likely due to the lowest „specimen
size/ aggregate size‟ ratio (equal to 10 for the aggregate of 1250-2500 µm in 20x20x160 mm
specimens).
Figure IV-11 Calculated and measured ASR expansion for specimen of size 20x20x160 mm

Chapter IV
107
Figure IV-12 Calculated and measured ASR expansion for specimen of size 40x40x160 mm
Table IV-3* Evaluation of the differences between the calculated and measured final expansions
2x2x16 4x4x16
C1 (0-315 µm) + 7% - 1%
C2 (315-630 µm) - 3% + 9%
C3 (630-1250 µm) - 6% + 16%
C4 (1250-2500 µm) + 28% + 10%
*Value obtained from )max( .
..
mes
mescal
, with max (εmes.): the maximal value
among the measured final expansions of the same specimen size.
5.3.3. Prediction of specimens immersed in different alkali concentrations
In this part, the ASR expansions of 20x20x160 mm specimens containing reactive aggregates of
two sizes (15% of 315-630 µm and 15% of 630-1250 µm) immersed in three different alkali
concentrations (0.77, 1.0 and 1.25 mol/l) were calculated without any additional fitting. The
calculated curves and experimental curves are shown in Figure IV-13.

Chapter IV
108
Figure IV-13 ASR expansion curves of 20x20x160 mm specimens immersed in three different
alkali concentrations
The difference between the final expansion predicted by the model (0.70%) and the mean
measured expansion (0.65%) is lower than 10%. The calculation does not show any difference in
final expansions between the three alkali concentrations. The model assumes that all the reactive
silica is consumed in the three conditions and, thus, the volume of ASR gel created is the same,
leading to the same ASR-expansion. The aim of this part was to verify the ability of the model to
evaluate the effect of the alkali concentration surrounding the specimens. It was obtained by the
assumption exposed above (see 2.2.3): in the case of specimens immersed in alkali solutions, no
alkali threshold has to be considered since there is enough OH- to satisfy the consumption of
reactive silica, and the reaction can be not stopped due to the lack of OH- ions (unlike for
specimens exposed to a saturated environment [Multon et al, 2009]). This assumption was well
supported by the experimental results. If the alkali threshold was considered, the differences
between the specimens kept in the three concentrations would be very large and the kinetics
would not fit the experimental measurements well.
5.3.4. Prediction of specimens cast with different types of aggregate
In this part, the ASR expansions of 20x20x160 mm specimens cast with opal, Quartzite and
Quartz Aggregate, and containing two reactive aggregate sizes (15% of 315-630 µm and 15% of
630-1250 µm), were calculated. Because of the difference of nature, additional fitting was used
to determine Da of each aggregate (equal to 5.0 x 10⁻¹⁴
m2/s for opal, 4.0 x 10
-16 m
2/s for
quartzite and 2.0 x 10⁻¹⁶
m2/s for quartz aggregate). The calculated curves showed good
agreement with the experimental results in terms of kinetics and final expansions (Figure VI-14).

Chapter IV
109
However, the curve of opal obtained by the model did not fit with experimental results perfectly.
At the beginning of the experiment, the slopes of the two curves were the same but, after about
50 days, the measurements showed a speeding-up of the expansions which was not predicted by
the calculation. It could be likely attributed to crack opening for opal specimens. As explained in
Chapter 2, the specimens containing opal aggregate present much larger cracks than specimens
of the same size cast with the other aggregates. These cracks could cause a great increase in the
diffusion phenomenon, which could accelerate the reaction. The model considers the diffusion as
constant in spite of cracks opening.
Figure VI-14 ASR expansion curves of 20x20x160 mm specimens containing different nature of
aggregates
5.3.5. Interest and limitations of the model
5.3.5.1. Comparison with the previous work [Multon et al. 2009]
In order to discuss the interest and the limitations of the model, the improvements made relative
to the previous model [Multon et al. 2009] will first be summed up:
Considering that the diffusion of alkalis in the large specimen size is not instantaneous,
the concentrations of alkalis in the cement paste do not remain constant with reaction
time. A coefficient of alkali diffusion in the cement paste was added to take these
conditions into account.

Chapter IV
110
Experiments showed the impact of the sizes of the aggregate and specimen on the
expansion. It can be explained by the effect on the final expansion of gel leaching
through the cracks. This phenomenon appears to be amplified when the reactive
aggregate contains a lot of reactive silica. It appears difficult to use the theoretical
considerations of fracture mechanics presented above to quantify this phenomenon.
Therefore, it was quantified by an empirical function to assess the volume of gel lost
according to the „aggregate size / specimen size‟ ratio and to reactive silica content.
The parameters fitted in this work have been compared to the parameters issued from [Multon et
al. 2009] (Table IV-1). Considering the coefficient of alkali diffusion in the aggregate, it can be
noted that the coefficient calculated here is significantly higher. This can be explained by the
assumption on the alkali threshold. The first work [Multon et al. 2009] considered the effect of
an alkali threshold on the silica dissolution. However, in the present work, the threshold is not
considered (see 2.2.3 and 5.3.3). Since the reaction speed is proportional to the difference
between the alkalis concentration in the aggregate and the threshold, not considering the
threshold leads to a higher value of reaction speed. Therefore, the gradient of alkali
concentration is higher in the model studied here. In order to counteract this increase of speed,
the coefficient of alkali diffusion has to be decreased.
The molar volume of the gel obtained in this work is higher than in [Multon et al. 2009] (Table
IV-3), which is pointed out by the large final expansion measured during the experiments. The
difference can be explained by the conditions of conservation (in saturated air in [Multon et al.
2009] and immersed in solution in this work). The ASR gels were created in pore solution with
different water contents and alkalis concentrations. The compositions of the gel were therefore
different and thus the molar volume was different. Concerning the water, ASR gels formed in
specimens kept in solution can absorb much more water than those in saturated air (R.H. >95%).
Moreover, the previous work did not pay attention to gel leaching. With the consideration of this
phenomenon, the volume of gel has to be greater to reach the same level of expansion. What‟s
more, comparing with the molar volume of C-S-H gel: 96 x 10-6
m3/mol [Taylor 1990], the value
of A-S-H gel in this work is also higher. Except for the reasons mentioned above, it could also be
explained by the reason that A-S-H gel is more expansive than C-S-H gel.
The thickness of the connected porous interface zone (tc) is also higher than in the previous work
[Multon et al. 2009] (Table IV-4). This value is obtained to fit four aggregate sizes while in the
previous work, only two aggregate sizes were studied. Moreover, the molar volume of the gel is
higher and therefore more connected porous volume is necessary to accommodate the gel. This
value guarantees that the expansion of the small particles was negligible in spite of the high
molar volume.

Chapter IV
111
Table IV-4 Comparison of the parameters with a previous work [Multon et al. 2009]
Parameters Coefficient of diffusion
in aggregate
Da (m2/s)
Molar volume of
ASR gel
Vgel mol
(m3/mol)
Thickness of the connected
porous interface zone
tc (m)
from [Multon et al. 2009]
3.5 x 10⁻¹³
54.6 x 10⁻⁶
1.8 x 10⁻⁶
in this work
5.0 x 10-15*
420 x 10-6
14.0 x 10⁻⁶
* Results obtained from siliceous limestone aggregate
5.3.5.2. Limitations of the model
This model allows the prediction of ASR expansions of different specimen sizes containing
different particle size classes. However, the present model still has some limitations:
1) For the largest specimens, the kinetic curves have some dissimilarity with the
experimental results. This can be explained by the difficulty of taking the diffusion of
alkali in the cement paste into account for large specimens.
2) The final expansion of the experimentation with the lowest „specimen size / aggregate
size‟ ratio is not well estimated. Due to the complexity of the phenomenon, the effect of
this ratio is taken into account through an empirical function. This test shows the limit in
the application range.
6. Conclusion
The experiments on expansion measurements were analysed by a microscopic model using the
chemical quantification of reactive silica. The effect of numerous parameters was investigated:
aggregate size (four classes) and mixes of aggregate of two sizes, specimen size (three
dimensions) and alkali concentration of the external solution. The model proposes some
improvements to take the decrease of expansion into account with the ratio of „specimen
size/aggregate size‟ which can be explained by the process of gel leaching and the non-linearity
of expansion with the reactive silica content of the aggregate. As in previous work, the diffusion
and the fixation of the alkali are assessed with the mass balance equation, the speed of alkali
fixation is assumed to be proportional to the alkali concentration in the aggregate and the
mechanical modelling uses a damage variable in order to determine the ASR expansion. Five
parameters of the physicochemical modelling were determined by curve fitting the expansion
curves obtained on the largest specimens. The fitted parameters were used to assess the ASR
expansion of the other specimens with smaller dimensions and different conditions of
conservation. The model can reproduce the differences of expansion due to the size of the
aggregates and specimens and to the aggregate nature. However, the empirical function proposed
to take account of the effect of the ratio „specimen size/aggregate size‟ appears to be limited to

Chapter IV
112
experiments with high enough ratios (higher than 20). Finally, the model using this empirical
function points out the complexity of predicting ASR expansion with micro modelling and states
the numerous parameters which have to be taken into account. The next chapter will show how
the model could make a contribution to the methodology for predicting the slow expansion of
concrete structures from the fast expansion of mortars in controlled conditions in the laboratory.

Chapter V
113
Chapter 5
Methodology to assess
the kinetics constant of expansion
1. Introduction
The kinetic constant of expansion is a parameter used in structural modeling to describe the
chemical advancement with time. With this value, the kinetics of expansion in situ can be rebuilt.
Thus, in order to assess the advancement (A) of ASR in affected concretes (and so requalify the
structure), the kinetic constant, of the structural modeling must be determined [Grimal 2007,
Grimal et al. 2008, Sellier et al. 2009]. This chapter, based on the findings of Chapters 2, 3 and
4, firstly connects the structural model and micro chemo-mechanical model and explains the
meaning of in the micro chemo-mechanical model, and then proposes a method to assess this
parameter in structural requalification.
2. Determination of the kinetic constant according to the aggregate size
The aim of this first part is to show that the kinetic constant (Equation I-7 in Chapter 1)
depends on the size of the aggregate. The advancement in the specimens is as that in the
structures , and can be calculated by:
)(1
11exp ASr
Sr
SrSr
TrefTR
Ea
t
Athreshold
threshold
ref
(V-1)
ref: kinetic constant,
Ea: activation energy of the AAR (~47KJ/M),
R: gas constant (8.31 J/M/K)
Tref: absolute temperature of the test,
T: current absolute temperature
Sr: degree of saturation of concrete porosity,
Sr threshold
: minimal saturation degree necessary to allow the chemical reaction to take place.

Chapter V
114
The application of Equation V-1, combining with the gel volume determined by the micro model
presented in Chapter 4, allows finding for the laboratory test. In this case, the temperature of
the expansion test was 60°C, thus T = Tref = 60°C. The specimens were saturated with a solution
of alkalis, thus Sr=1. Therefore, Equation V-1 can be deduced to be:
)1(60 At
A
60: kinetic constant at 60°C
(V-2)
The analytical solution of this equation is:
tetA 601)(
(V-3)
The chemical advancement can be expressed by:
max_
)()(
g
g
V
tVtA or
)0(
)()(
tSi
tSitA
reactive
reacted
(V-4)
(V-5)
with:
Vg: volume of gel created as a function of time (according to the diffusion phenomenon)
Vg_max: maximum value of the volume of gel. It stands for the consumption of all the reactive
silica.
Si reacted
represents the silica consumed at time t,
Si reactive
represents the total reactive silica content of the aggregate
The kinetic constant (60), under the conditions of expansion tests in the laboratory, can be
obtained by curve fitting the advancement (Equation V-4) using Equation V-3. In Equation V-4,
the volume of gel is calculated by micro modeling (Chapter 4). It can be seen from Figure V-1
that the curves given by the model used in the structural calculations correspond well with the
results of the micro chemo-mechanical model.
(a) (b)

Chapter V
115
(c) (d)
Figure V-1 Comparison of chemical advancements obtained by the micro chemo-mechanical
model and by Equation V-3
The values calculated (Equation V-3) for the different aggregate sizes and specimen sizes are
plotted in Figure V-2. As shown in this figure, the constant of the kinetics () varies with the
sizes of the aggregate and specimen.
In the structural modeling, the value of is a property of the aggregate and should not be
influenced by different specimen sizes. However, differences do appear among specimen sizes
(Figure V-2). This can be attributed to the diffusion in the specimen, which has an effect on the
kinetics of the gel creation. The values of are different for each class of aggregate size: lies
between 8 and 70 x 10-3
day-1
. The values of showed the greatest values for the smallest
aggregate. This may be because the diffusion of alkalis is fastest in the smallest aggregates.
These calculations confirm that different values of have to be taken into account according to
the aggregate size so that relevant structural calculations can be made, as already proposed in
[Grimal 2007, Sellier et al. 2009]. It must be noted that the values of obtained with the analysis
of mortar expansion test cannot be used for the structural assessment because of the different
aggregate size and the different environmental conditions.

Chapter V
116
Figure V-2 values of different aggregate sizes and specimen sizes cast with siliceous
limestone aggregate
3. Method to assess the kinetic constant of damaged structures
This part presents the calculation of the kinetic constant in the framework of the methodology
(Figure V-3) of structural requalification. The chemical advancement differs according to the
size of the aggregate in the structure concrete: the smaller the aggregate is, the deeper the alkali
attacks the aggregate and thus the higher is the chemical advancement. Therefore, the method of
requalification proposes to determine the difference of chemical advancement according to the
size of the recovered aggregate. Once the aggregates have been recovered, several types of
mortars are cast. These mortars should represent the ASR damaged structures, and thus the
different sizes of aggregates should be taken into account. It means that the mortars containing
each class of recovered aggregate should be evaluated. In the process of casting mortars, all of
these classes of recovered aggregates are crushed to the same grain size in order to obtain the
same aggregate size distribution in each mortar and thus the same conditions of expansion.
Therefore, the differences of total expansion observed during the expansion test depend only on
the residual reactive silica contained in the recovered aggregate.
The method can be summarized as follows:
1. Recover the aggregate from damaged concrete in a given structure.
2. Perform the chemical test in order to quantify the potential of reactive silica contained by
the aggregate.
3. According to the reactive silica content, choose the best size of aggregate and specimen to
carry out a fast, relevant expansion test,
4. Use the chemo-mechanical model to obtain the residual reactive silica of aggregate and
deduce the kinetic parameter according to the environmental conditions of the drilling
zone.

Chapter V
117
The kinetic parameters thus obtained for the different sizes of aggregates recovered from
damaged concrete could then be used as input data to perform structural reassessment and
evaluate the safety level of the damaged structure with a finite element code as proposed in
[Sellier et al. 2009].
Figure V-3 Proposed method to assess the kinetic parameter of concrete containing
aggregates that have already been attacked
3.1. Recovery of the aggregate from damaged concrete
For requalification, two types of aggregates are necessary:
- Sound aggregates to evaluate the reactivity of the aggregate, either by expansion tests
(Chapter 2) or by the measurement of reactive silica (Chapter 3). These aggregates can be
taken from sound zones of large aggregates (not attacked yet) or from dry zones of the
structure.
- Attacked aggregates to evaluate the advancement of ASR (using the same test as for sound
aggregates). They can be extracted from wet zones or zones affected by ASR.
Obtaining these two kinds of aggregate properly and entirely determines the accuracy of the
following steps of the method, so the recovery method should be chosen carefully. It should
satisfy the following conditions:
1) paste completely separated from the aggregate. This requirement makes provision for an
expansion test (in the future) as sound as with the new aggregate, and also ensures a relevant
result of chemical measurement since the remains of paste (C-S-H) would disturb the
measurement.

Chapter V
118
2) aggregate not broken up. Aggregates of different sizes have different chemical advancements
in the affected structures, so to research this effect of aggregate size on degradation, the
recovered aggregates should be kept as whole as possible.
3) reactive silica not dissolved. The reactive silica content in recovered aggregates will be
measured with the HF/HF+HCl method, so for a relevant chemical result the recovery
process should take care not to dissolve the silica in aggregates.
Mechanical, thermal and chemical methods exist to recover aggregates form concretes. Works
are still in progress to propose a suitable method that can be applied to structures such as dams.
3.2. Chemical test for reactive silica content
Chapter 3 shows that the dissolution results obtained by the HF/HF+HCl attack present the
highest correlation with expansion tests. Therefore, the second step of the method is to perform
the HF/HF+HCl attack in order to quantify the potential of reactive silica contained by the
aggregate. However, some doubt arises about the sensitivity of the method to the small
differences of residual silica between the attacked aggregates. At present, a complementary
expansion test has to be conducted when evaluating the chemical advancement. Nevertheless, it
would be interesting to improve the chemical method since it can give the residual silica directly
and is faster than an expansion test.
3.3. Choice of the best size of aggregate and specimen for fast, relevant
expansion test
In order to use expansion tests in predictive calculations, it is necessary to clarify all the complex
and coupled phenomena and quantify all the parameters involved during expansion. In particular,
the scale effect, shown in Chapter 2, which could make the measurements vary wildly according
to expansion conditions (conservation, reactive silica content), should be carefully considered.
These effects are partly taken into account in the micro modeling through an empirical function
(Equation IV-5 in Chapter 4) but this function is not perfect (for the largest particles in the
smallest specimens for example) and it could be interesting to decrease the impact of this
function in the analysis of the expansion. The parameters of the scale effect on ASR expansions
measured on specimens are pointed out in Equations II-2 and II-3 of Chapter 2. In order to
decrease the influence of this scale effect on ASR expansion, the stress intensity factor KI
(Equation II-2 in Chapter 2) should be the same for the different expansion tests, which means
that the constants D1 and D2 in Equations V-6 and V-7 should be fixed.
1
333
3
4
3
4DRtRsVR aca
mol
gela
(V-6)

Chapter V
119
2DL
Ra
(V-7)
Once D1 and D2 are fixed, the aggregate size can be calculated with Equation V-6. The values of
Vgel
mol and tc have been determined by curve fitting above. Then the specimen size can be
obtained with Equation V-7.
For example, in the case of the expansion tests on siliceous limestone and opal aggregates, the
reactive silica content was 3000 mol/m3 for the siliceous limestone and 21900 mol/m
3 for opal.
For mortars of siliceous limestone, aggregate class C2 (315-630 µm) and specimen size
20x20x160 mm were chosen, thus D1 and D2 were equal to 6.8E-11 m3 and 0.012. In order to
have the same stress intensity factor for opal as for siliceous limestone, the aggregate size (the
mean diameter) obtained by Equation V-7 should be about 240 µm and the specimen size should
be about 10 mm. With such experimental conditions, the ASR-expansions for these two
aggregates could be compared with more accuracy.
3.4. Calculation of the kinetic constant in the framework of structural
requalification
Finally, under the condition Tref = T of the structure, the kinetic constant needed for the
requalification calculation can then be evaluated by the two following equations [Grimal 2007,
Grimal et al. 2008, Sellier et al. 2009]:
0
00
1
1
Sr
SrSrii
i
(V-8)
with i
iA
t
1ln (V-9)
t: time between the building of the structure and the drilling of the core samples
Sr: mean degree of saturation of the concrete in the structure
Sr0: degree of saturation above which ASR occurs, 0.2 according to [Grimal 2007]
The principle of the determination of Ai is to compare the residual reactive silica obtained on
recovered aggregate with the reactive silica obtained on sound aggregate [Grimal 2007, Sellier et
al. 2009]. The value of Ai (in Equation V-9) is calculated using Equation V-10.
RS
tRRStA i
i
)()(
(V-10)
with:
RRSi(t): residual reactive silica of aggregate size i

Chapter V
120
RS: reactive silica of sound aggregate
In Equation V-10, the residual reactive silica (RRSi) and the reactive silica of sound aggregate
(RS) can be obtained in two complementary ways: 1) directly by chemical measurements (but
with an HF test, which implies different conditions compared to the concrete environment and is
open to discussion), 2) indirectly by the expansion test (which is a better representation of the
concrete conditions) and the use of the micro modeling. In the second way, the micro chemo-
mechanical model is used to determine RRSi or RS (represented by the reactive silica content s in
Table IV-1 in Chapter 4) by fitting the curve of measured expansion.
It is important to note that the advancement Ai differs according to the aggregate size, thus, the
kinetic constants obtained here are for each aggregate size. To obtain an average value of kinetic
constant for all the aggregate sizes, a method is proposed in [Grimal 2007].
4. Conclusion
This last chapter proposes a method to assess the kinetic parameter necessary for structural
requalification for concrete containing aggregates already attacked and recovered from damaged
structures. It is now necessary to test this method in real cases of damaged structures. In the
future, the experimental feedback will show whether the qualification of the reactive silica
content by two methods (chemical dissolution and expansion) is redundant and if chemical
dissolution alone (the fastest method) is relevant to quantify the reactive silica available for ASR
with sufficient accuracy.

Conclusion
121
Conclusion
In order to help the owners of ASR-affected structures to take decisions on the maintenance,
repair or replacement of structures, methods of requalification of damaged structures are required.
However, the evaluation of structures involves many inter-related factors (such as the
environmental conditions – temperature and R.H., chemical components of the reaction,
mechanical conditions). Numerous investigations already performed on ASR allow these
phenomena to be explained. Several methodologies of requalification have been proposed
[Grimal 2007, Grimal et al. 2008, Léger et al. 1995, Li et al. 2000, Li et al. 2001, Li and Coussy
2002, Malla and Wieland 1999, Multon et al. 2009, Saouma and Perotti 2006, Saouma et al.
2007, Saouma 2009, Sellier et al. 2009]. One of the problems of requalification is the reliability
of the input data of the model and particularly the residual expansion test performed on
specimens kept at 38°C and RH higher than 95%. The analysis of the structural behaviour of a
French dam showed the difficulty of using the residual expansion test as input data for structural
modeling [Grimal 2007, Sellier et al. 2009]. Therefore, the LMDC and EDF propose a method
(Figure 1) to characterize the expansion kinetics through the assessment of the chemical
advancement of the reaction in the aggregates contained by the structure concrete [Grimal 2007,
Sellier et al. 2009]. This method proposes to assess the chemical advancement by the quantity of
residual silica still present in the aggregate. This quantity of residual silica can be measured
indirectly by expansion tests or directly by chemical tests.

Conclusion
122
AAR kinetic and swelling amplitude assessment
Affected structure
Core samples drilled in various zones: - Wet, dry, concrete type…
Structural monitoring: - Displacements - Temperatures - Moistures…
Laboratory tests: Assessment of reactive silica consumption kinetic
Reactive silica consumption measurement for each drilling zone and for each aggregate size range
Finite element inverse analysis of the affected structure: Swelling amplitude assessment
Search for swelling amplitude compatible with:
- environnemental conditions - reactive silica consumption kinetics
Finite element analysis
- Displacements and damage patterns prediction - Repair efficiency assessment…
Figure 1 Global methodology summary [Sellier et al. 2009]
The objectives of this work concern the laboratory tests as a part of the LMDC program. The
research included expansion tests, chemical quantification of reactive silica in aggregates and,
finally, the presentation of a micro-mechanical model.
The first chapter presented a literature survey of some existing requalification methods,
including the details of the LMDC methodology.
Chapter 2 was devoted to expansion tests. It reported the optimization of an accelerated test by
taking three parameters into consideration:
The conservation conditions of the specimens in solutions, by using different alkali
concentrations. They were chosen to consume all the silica in reactive aggregates.
The aggregate size, which should be small enough for all the reactive silica to be
attacked in a minimum of time (the aggregates in large structures such as dams must be
broken). However, a minimum value must be fixed otherwise no expansion can be
measured.
The specimen sizes, which can have an effect on the results of expansion test kinetics
and final asymptote.
The main conclusions drawn allowed us to propose optimized conditions for tests to be
conducted on reactive aggregates :

Conclusion
123
In choosing the aggregate size, it was found that the expansions measured on specimens
containing fine aggregates reached the final expansions in shorter times than specimens with
coarser aggregates. The time necessary to reach asymptotic expansion on small specimens
(smaller than 40 mm) is mainly due to the time of diffusion of the ion species through the
aggregates. However, if the aggregate particles are too small, the gel produced by the aggregate
can migrate into the connected porosity and cause little expansion. In the case of siliceous
limestone, the size range 315-630 µm was found to be a good compromise.
Concerning the specimen size, the small specimens (e.g. 20 x 20 x 160 mm) were found
to reach the final expansion in a short time because the diffusion of the ion species into the
specimen was faster than in larger specimens. However, a part of the expansion was not
measured because of the coupled effect of aggregate and specimen size on ASR-expansion.
Beyond the methodology of requalification, the observation of this effect is also an important
conclusion of this work. It was shown that the pessimum effect of aggregate size on ASR-
expansion was a phenomenon that was not only intrinsic to the aggregate but was also caused
by the experimental conditions. The effect of the cracking on the gel pressure could explain this
phenomenon. Indeed, after the cracking, a part of the increasing volume due to ASR gel
formation can be accommodated by the cracks volume. Moreover, a part of the gels can
permeate out of the specimens. Accommodation by cracks and gels permeation can cause a
decrease of the gel pressure and thus reducing the induced expansion.
Finally, for the siliceous limestone studied, small aggregate particles (315-630 µm) and
small specimens (20 x 20 x 160 mm) were found to be convenient for a fast expansion test.
However, these conditions could depend on the nature of the aggregate. In order to optimize the
test conditions according to the nature of the aggregate, it appears to be important to quantify the
„potential reactivity‟ of the aggregate. In this aim, chemical tests (chapter 3) could be a useful
tool.
Chapter 3 presented a study on “chemical tests” intended to measure the reactive silica in
aggregate. Reactive silica is a relative concept which is used to define the part of silica which
can react with alkali to produce gel. In order to know precisely the amount of reactive silica
available for ASR, the best way would be to simulate the concrete environment but this is
practically impossible considering the long reaction time. Mineralogical studies showed that the
reactive silica includes amorphous minerals, cryptocrystalline minerals and crystalline minerals
containing imperfections. In addition, considering that all types of silica (reactive silica and well
crystallized silica) have certain solubility in an acid or basic environment, the method should
distinguish the soluble capabilities of reactive silica and well crystallized silica. With these
notions, three methods, NaOH-HCl, HCl-KOH, and HF/HF+HCl attack were used to test
different types of aggregates. The chemical quantification was analyzed with respect to the
expansion obtained on mortars containing these aggregates. The principal results of the analyses
found were:
For NaOH-HCl attack, the high temperature (at 100°C) was effective to dissolve silica.
However, the test could not distinguish the dissolution of reactive phase and well-crystallized
phase. The NaOH-HCl seems to attack the well-crystallized minerals which would not really
react with alkali in concrete.

Conclusion
124
HCl-KOH attack was found not to be suitable since it attacked the non-reactive quartz. In
addition, this attack allows only one test at a time and, with only one result, it is not possible to
distinguish the different forms of silica.
HF/HF+HCl attack was found to be the best compromise since it separated the reactive
and non-reactive silica. Although it is an acid attack, the result showed the best correlation with
the mortar tests. In addition, this method is a rapid (24h) and simple.
Chapter 4 proposed an improved “chemo-mechanical model” to analyze the results of
expansion tests and assess the chemical advancement of the reaction. This model was based on a
model previously developed by Multon et al. [2009]. In order to determine the ASR expansion,
the diffusion and the fixation of the alkali in the aggregates and the material damage were
considered. Improvement was necessary to take into account the decrease in expansion with the
“specimen size / aggregate size” ratio and the non-linearity of expansion with the reactive silica
content of the aggregate observed during the experiments (chapter 2). The main points
concerning the model are summed up below:
Five parameters of the physicochemical modeling were evaluated by curve fitting the
expansion curves obtained on the largest specimens.
The fitted parameters were used to assess the ASR expansion of the other specimens with
smaller dimensions and different conditions of conservation. The model can reproduce the
differences of expansion due to the size of the aggregates and specimens and to the aggregate
nature. It validates the function proposed to represent the combined effects of aggregate and
specimen sizes and reactive silica content.
Chapter 5 summarized the findings of Chapters 2, 3 and 4 by presenting a method to calculate
the kinetics constant of expansion, which is helpful in building the expansion kinetics in the
field. The calculation of this parameter from micro chemo mechanical model showed that it
varies along with the different sizes of aggregate and is little affected by the specimen size.
Then, a methodology was proposed to calculate the kinetics constant in the framework of
structural requalification.
Perspectives
The methodology proposed in chapter 5 still needs some improvements, which should be made
in the near future. Among them:
Some methods exist for recovering the aggregate from damaged concrete but their
reliability is questionable. A literature survey has been made to compare the existing
methods for recovering process, a two-steps strategy is chosen for the following
experiments: physical method to delete roughly the cement paste and then a chemical
method to dissolve the cement paste as much as possible. Work is still in progress to test
the concrete in laboratory and finally applied to structures such as dams.

Conclusion
125
It could be interesting to test other chemical attacks (e.g. organic acid or other bases) to
evaluate the reactive silica in aggregates. This subject matters not only for aggregates, but
also for mineral admixtures such as natural or artificial pozzolans.
After these improvements, a complete assessment of an affected concrete using this methodology
would need to be performed.

References
126
References
A
[ASTM C289] ASTM C289, Standard Test Method for Potential Alkali-Silica Reactivity of
Aggregates (Chemical Method), October, 2003.
[ASTM C856] ASTM C856, Standard Practice for Petrographic Examination of Hardened
Concrete, Annual Book of ASTM standards, 2004.
B
[Badogiannis et al. 2004] E. Badogiannis, V. G. Papadakis, E. Chaniotakis, S. Tsivilis,
Exploitation of poor Greek kaolins: strength development of metakaolin concrete and
evaluation by means of k-value, Cement and Concrete Research, 2004, 34(6), 1035-1041.
[Bakker 1983] R. F. M. Bakker, The influence of test specimen dimensions on the expansion of
reactive alkali aggregate in concrete, Proc. of the 6th
ICAAR, Copenhagen, Denmark, 1983,
369-375.
[Ballivy et al. 2000] G. Ballivy, K. Khayat, C. Gravel, D. Houle, Influence of reinforcement
steel on the expansion of concrete affected by Alkali-aggregate reaction, 11th
International
Conference on Alkali-Aggregate Reaction in Concrete, 2000, Québec, Canada, pp 919-928.
[Baronio et al. 1987] G. Baronio, M. Berra, L. Montanaro, A. Delmastro and A. Bacchiorini,
Couplage d’action de certains paramètres physiques sur le développement de la réaction
alkalis granulats, From Materials Science to Construction Materials Engineering, 1st
International RILEM Congress on Durability of Construction Materials, Versailles, France, 1987,
Vol.3, pp 919-926.

References
127
[Bazant and Steffens 2000] Z.P Bazant, A. Steffens, Mathematical model for kinetics of alkali-
silica reaction in concrete, Cement and Concrete Research, 2000, 30, 419–428.
[Bérubé and Frenette 1994] M. A. Bérubé, J. Frenette, Testing Concrete for AAR in NaOH and
NaCl solutions at 38°C and 80°C, Cement and Concrete Composites, 1994, 16(3), 189-198.
[Bérubé et al. 1994] M.A. Bérubé, J. Frenette, M. Landry, D. Mcpherdan, A. Pedneault, S.
Ouellet, Evaluation du potentiel résiduel de réaction et d’expansion du béton en service atteint
de réactivité alcalis-silice, final report 1991-1993 at Université Laval, Québec. In [Rivard 2002].
[Bérubé et al; 2002] M.-A. Bérubé, J. Duchesne, J. F. Dorion, M. Rivest, Laboratory assessment
of alkali contribution by aggregates to concrete and application to concrete structures affected
by alkali-silica reactivity, Cement and Concrete Research, 2002, 32, pp. 1215-1227.
[Bourdarot et al. 2010] E. Bourdarot, A. Sellier, S. Multon, E. Grimal, Areview of continuum
damage modelling for dam analysis Main steps of a fruitful university-industry collaboration
leading to an integrated model applicable to AAR affected structures, European Journal of
Environmental and Civil Engineering, 2010, 14(6-7), 805-822.
[Broekmans 2004] M. A. T. M. Broekmans, Structural properties of quartz and their potential
role for ASR, Materials Characterization , 2004,53, 129-140.
[Budd and Frackiewiez 1962 ] S.M. Budd, J. Frackiewiez, Physics and Chemistry of Glass,
1962, 3, 116, in [Paul 1982].
[Bulteel et al. 2002] D. Bulteel, E. Garcia-Diaz, C. Vernet, H. Zanni, Alkali-silica reaction: a
method to quantify the reaction degree, Cement and Concrete Research, 2002, 32,1199–1206.
C
[Carles-Gibergues and Cyr 2002] A. Carles-Gibergues, M. Cyr, Interpretation of expansion
curves of concrete subjected to accelerated alkali-aggregate reaction (AAR) tests, Cement and
Concrete Research, 2002, 32, 691-700.
[Carles-Gibergues et al; 2008] A. Carles-Gibergues, M. Cyr, M. Moisson, E. Ringot, A simple
way to mitigate alkali-silica reaction, RILEM, Materials and Structures, 2008, 41(1), 73-83.
[Charlwood 2009] R. Charlwood, AAR in Dams: Case studies, Monitoring Remediation, AAR
short course, Paris, 2009.
[Clayton 1989] N. Clayton, Structural performance of ASR affected concrete, 8th
International
Conference on Alkali-Aggregate Reaction in Concrete, 1989, Kyoto, Japan, pp 671-676.

References
128
[Comby-Peyrot 2006] I. COMBY PEYROT, Development and validation of a 3D
computational tool to describe damage and fracture due to alkali silica reaction in concrete
structures, Ph.D. thesis, 2006, France.
[Comby-Peyrot et al. 2009] I. Comby-Perot, F. Bernard, P.-O. Bouchard, F. Bay, E. Garcia-Diaz,
Development and validation of a 3D computational tool to describe concrete behaviour at
mesoscale. Application to the alkali-silica reaction, Computational Material Science, 2009,
46(4), 1163-1177.
[Corneille et al. 1991] A. Corneille, G. Douillet, J.-P. Garbe, A. Leroux, P. Monachon, M.
Moranville-Regourd, P. Poitevin, M. Berra, R. Turriziani, D. Palmer, J. Graham, Alkali-
aggregate Reaction in Concrete Dams/Alcali-réaction dans les Barrages en Béton, Bulletin of
ICOLD 79, 1991.
[Cyr et al. 2007] Cyr M., Coutand M., Clastres P., Technological and environmental behavior
of sewage sludge ash (SSA) in cement-based materials, Cement and Concrete Research, 2007,
37 (8) ,1278-1289.
D
[Dent-Glasser 1979] L.S. Dent-Glasser, Osmotic pressure and swelling of gels, Cement and
Concrete Research, 1979, 9, 515-517.
[Dent Glasser and Kataoka 1981] L.S. Dent Glasser & N. Kataoka, The chemistry of alkali-
aggregate reaction, Cement and Concrete Research, 1981, 11(1), 1-9.
[Diamond 1986] S. Diamond, Particle morphologies in fly ash, Cement and Concrete Research,
1986, 16(4), 569-579.
[Diamond 1989] S. Diamond, ASR-Another look at mechanism, 8th
International Conference on
Alkali-Aggregate Reaction in Concrete, 1989, Tokyo, pp83-94
[Diamond and Thaulow 1974] S. Diamond, N. Thaulow, A study of expansion due to alkali-
silica reaction as conditioned by the grain size of the reactive aggregate, Cement and Concrete
Research, 1974, 4(4), 591-607.
[Divet et al. 2003] L. Divet, P. Fasseu, B. Godart, T. Kretz, A. Laplaud, A. Le Méhauté, G. Le
Mestre, K. Li, B. Mahut, M. Michel, F. Renaudin, P. Reynaud, J. –F. Seignol, F. Toutlemonde,
L. Labourie, M. Laude, Guide méthodologique : Aide à la gestion des ouvrages atteints de
réactions de gonflement interne, eds., LCPC, « techniques et méthodes des LPC » collection,
2003, Paris, France (in French).
[Dron and Brivot 1993] R. Dron, F. Brivot, Thermodynamic and kinetic approach to the alkali-
silica reaction. Part 2: Experiment, Cement and Concrete Research, 1993, 23(1), 93-103.

References
129
[Duchesne and Bérubé 1994] J. Duchesne, M-A. Bérubé, Discussion of the Paper "The
effectiveness of supplementary cementing materials in suppressing expansion due to ASR –
Part 1, Concrete expansion and portlandite depletion, Cem. Conc. Res. 1994, 24 (8), 1572-
1573.
[Duchesne and Bérubé 2003] J. Duchesne, M.-A. Bérubé, Effect of the cement chemistry and
the sample size on ASR expansion of concrete exposed to salt, Cement and Concrete Research,
2003, 33, 629–634.
[Durand et al. 2004] B. Durand, B. Marchand, R. Larivère, J-M. Bergeron, G. Pelletier, M.
Ouimet, J. Bérard, T. Katayama, A special history case about seven damages due to freezing
and thawing combined with sulfate migration and ASr at rapides-des-quinze hydraulic
structures, Quebec, Canada, 12th
International Conference on Alkali-Aggregate Reaction in
Concrete, 2004, Beijing, China, pp 1043-1054.
F
[Fan and Hanson 1998] S. F. Fan and J. M. Hanson, Effect of Alkali Silica Reaction Expansion
and Cracking on Structural Behavior of Reinforced Concrete Beams, ACI Structural Journal,
1998, 95(5), 498-505.
[Fasseu et al. 2003] P. Fasseu, B. Mahut, L. Divet, B. Godart, T. Kretz, A. Laplaud, A. Le
Méhauté, G. Le Mestre, K. Li, M. Michel, F. Renaudin, P. Reynaud, J.-F. Seignol, F.
Toutlemonde, L. Labourie, M. Laude, Guide méthodologique : Aide à la gestion des ouvrages
atteints de réactions de gonflement interne, eds., LCPC, « techniques et méthodes des LPC »
collection, 2003, Paris, France (in French).
[Feng et al. 2002] N. Q. Feng, T. Y. Hao, X. X. Feng, Study of the alkali reactivity of
aggregates used in Beijing, Magazine of Concrete Research, 2002, 54 (4), 233-237.
[Forest 1962] J. Forest, Recherche d’une méthode d’appréciation rapide de la réactivité des
cendres volantes et des pouzzolanes additionnées au ciment, Silicates Industriels,1962, P265-
276.
[François et al. 1993] D. François, A. Pineau, A. Zaoui, Comportement mécanique des
matériaux : viscoplasticité, endommagement, mécanique de la rupture, mécanique du contact,
Hermes (Eds.), 1993.
[French 1989] W. J. French, Maintenance of mobile alkali concentration in cement paste
during alkali-aggregate reaction, 8th
International Conference on Alkali-Aggregate Reaction in
Concrete, 1989, Tokyo.

References
130
[French 1992] W. J. French, The characterization of potentially reactive aggregate, 9th
International Conference on Alkali-Aggregate Reaction in Concrete, London, 1992, pp.338-346.
[Fournier et al. 2004] B. Fournier, P.-C. Nkinamubanzi, R. Chevrier, Comparative field and
laboratory investigations on the use of supplementary cementing materials to control alkali-
silica reaction in concrete, 12th
International Conference on Alkali-Aggregate Reaction in
Concrete, 2004, Beijing, pp 528-537.
[Fu et al.2004] P. X. Fu, Y. Liu, J. M. Wang, Alkali reactivity of aggregates and AAR-affected
concrete structures in Beijing, 12th
International Conference on Alkali-Aggregate Reaction in
Concrete, 2004, Beijing, China, pp 1055-1061.
[Furusawa et al. 1994] Y. Furusawa, H. Ohga, T. Uomoto, An analytical study concerning
prediction of concrete expansion due to alkali-silica reaction, in Malhotra (ed.), 3rd
Int. Conf.
on Durability of Concrete, Nice, France (1994) 757–780. SP 145-40.
G
[Garcia-Diaz et al. 2006] E. Garcia-Diaz, J. Riche, D. Bulteel, C. Vernet, Mechanism of damage
for the alkali-silica reaction, Cement and Concrete Research, 2006, 36, 395-400.
[Gilks and Curtis 2003] P. Gilks, D. Curtis, Dealing with the effects of AAR on the water
retaining structures at Mactaquac GS, Proceedings of the 21st Congress on Large Dams,
Montreal, Quebec, Canada, pp681-703 in [Saouma et al. 2007].
[Grimal 2007] E. Grimal, Caractérisation des effets du gonflement provoqué par la réaction
alcali-silice sur le comportement mécanique d'une structure en béton, PhD thesis, Université
Paul Sabatier Toulouse, France (2007).
[Grimal et al. 2008a] E. Grimal, A. Sellier, Y. Le Pape, E. Bourdarot, Creep, Shrinkage, and
Anisotropic Damage in AAR Swelling Mechanism—Part I : A Constitutive Model, ACI
Materials Journal, 2008, 105(3), 227-235.
[Grimal et al. 2008b] E. Grimal, A. Sellier, Y. Le Pape, E. Bourdarot, Creep, Shrinkage, and
Anisotropic Damage in AAR Swelling Mechanism—Part II : Identification of Model
Parameters and Application, ACI Materials Journal, 2008, 105(3), 236-242.
[Godart et al. 1992] B. Godart, P. Fasseu, M. Michel, Diagnosis and monitoring of concrete
bridges damaged by A.A.R. in northern France, 9th
International Conference on Alkali-
Aggregate Reaction in Concrete, 1992, London, pp 368-375.
[Goto 1955] K. Goto, J. Chem. Soc. Jap. Pure Chem. Sect., 76, 1364(1955) in [Iler 1979].

References
131
[Guédon-Dubied et al. 2000] J. S. Guédon-Dubied, G. Cadoret, V. Durieux, F. Martineau, F.
Fasseu, V. Van Overkeke, Etude du calcaire Tournaisien de la carrière Cimescaut à Antoing
(Belgique). Analyse pétrographique et chimique et réactivité aux alcalins, Bulletin des
Laboratoires des Ponts et Chaussées, 226 (2000) 57-66.
[Goltermannn 1994] P. Goltermann, Mechanical predictions on concrete deterioration. part 1:
Eigenstresses in concrete, ACI Materials Journal, 1994, 91 (6), 543–550.
H
[Hobbs 1988] D. W. Hobbs, Alkali-Silica Reaction in Concrete, Thomas Telford, London,
1988, 103-133.
[Hobbs 1993] D.W. Hobbs, Deleterious alkali–silica reactivity in the laboratory and under
field conditions, Magazine of Concrete Research, 1993, 45 (163), 103–112.
[Hobbs and Gutteridge 1979] D. W. Hobbs, W. Gutteridge, Particle size of aggregate and its
influence upon the expansion caused by the alkali-silica reaction, Magazine of Concrete
research, 1979, 31 (109), 235-242.
[Hulett and Weinberger 1980]L. D. Hulett, A. J. Weinberger, Some etching studies of the
Microstructure and Composition of Large Aluminosilicate Particles in Fly Ash from Coal-
Burning Power Plants, Environmental Science & Technology V14 (1980): 965-970.
I
[Ichikawa and Miura 2007] T. Ichikawa, M. Miura, Modified model of alkali-silica reaction
Cement and Concrete Research, 2007, 37(9), 1291-1297.
[Ichikawa 2009] T. Ichikawa, Alkali-silica reaction, pessimum effects and pozzolanic effect,
Cement and Concrete Research, 2009, 39(8), 716-726.
[Iler 1979] R.Iler, The Chemistry of Silica, John Wiley ed., New York, 1979.
J
[Jabarooti and Golabtoonchi 2003] M. R. Jabarooti, I. Golabtoonchi, Alkali-Aggregate reactivity
in South-East Iran, Proceedings of the 21st Congress on Large Dams, Montreal, Quebec,
Canada, pp53-62 in [Saouma et al. 2007].
[Jensen 1993] V. Jensen, Alkali Aggregate Reaction in Southern Norway, Doctor Technicae
Thesis, Norwegian Institute of Tehcnology, University of Trondheim, Norway, 1993, 262 p.

References
132
[Jones 1988] T.N. Jones, A new interpretation of alkali-silica reaction and expansion
mechanisms in concrete, Chemistry and Industry, 1988, 18, 40-44.
[Jones and Clark 1996] A.E. Jones, L. A. Clark, The effects of restraint on ASR expansion of
reinforced concrete, Magazine of Concrete Research, 1996, 48(174), 1-13.
[Jones and Poole 1987] T.N. Jones, A.B. Poole, Alkali-silica reaction in several U.K.
concretes: the effect of temperature and humidity on expansion, and the significance of
ettringite development, 7th
International Conference on Alkali-Aggregate Reaction in Concrete,
1986, Ottawa, pp 446-450.
[Jones and Segnit 1971] Jones J.B., Segnit E.R. The nature of opal I. Nomenclature and
constituent phases, Australian Journal of Earth Sciences, 1971, 18(1) ,57-68.
K
[Kawamura et al. 1983] M. Kawamura, K. Takemoto, S. Hasaba, Application of quantitative
EDXA analyses and microhardness measurements to the study of alkali-silica reaction
mechanisms, 6th
International Conference of Alkalis in Concrete, Idorn G.M. and Rostam S.
(Editors), 310 Copenhagen, Denmark, 1983, pp.167-174.
[Kawamura and Fuwa 2003] M. Kawamura, H. Fuwa, Effects of lithium salts on ASR gel
composition and expansion of mortars, Cement and Concrete Research, 2003, 33, 919-919.
[Kelly et al. 1948] T. M. Kelly, L. Schuman, F. B. Hornibrook, A study of alkali-silica reactivity
by means of mortar bar expansions, Journal of the American Concrete Institute, Proceedings
1948, 45(1), pp.57-80.
[Kodama and Nishino 1986] K. Kodama, T. Nishino, Observation around the cracked region
due to alkali-aggregate reaction by analytical electron microscope, 7th
International Conference
on Alkali- Aggregate Reaction in Concrete, Grattan-Bellew P.E. (Editor), Ottawa, Canada, 1986,
pp.398-402.
[Kreshkov et al. 1965] A. P. Kreshkov, A. N. Chivikova, A. A. Zagorovskava, A rapid method
for determining free amorphous silica in clay, Journal Analalysis Chemistry URSS 1965, 20,
1295-1296, in [Payá et al. 2001]
[Kuroda et al. 2004] T. Kuroda, S. Inoue, A. Yoshino, S. Nishibayashi , Effects of particle size,
grading and content of reactive aggregate on ASR expansion of mortars subjected to autoclave
method, 12th
International Conference on Alkali-Aggregate Reaction in Concrete, Tang M. and
Deng M. (Editors), Beijing, China, 2004, 736-743.

References
133
L
[Lagerblad and Trägardh 1992] B. Lagerblad, J. Trägardh, Slowly reacting aggregates in
Sweden – Mechanism and conditions for reactivity in concrete, 9th
International Conference on
Alkali-Aggregate Reaction in Concrete, Concrete Society Publication CS 106, Vol 2, London,
Great-Britain, 1992, 570-578.
[Larive et al. 1996] C. Larive, A. Laplaud, M. Joly, Behavior of AAR-affected concrete:
Experimental data, 10th
International Conference on Alkali-Aggregate Reaction in Concrete,
1996, Melbourne, Australia, pp. 670-677.
[Larive 1998] C. Larive, Apports combinés de l’expérimentation et de la modélisation à la
compréhension de l’alcali-réaction et de ses effets mécaniques, Laboratoire Central des Ponts
et Chaussées (Edt.), Ouvrage d‟Art, Rapport OA 28, 1998.
[Larive 2000] C. Larive, M. Joly, O. Coussy, Heterogeneity and anisotropy in ASR-affected
concrete –Consequences for structural assessment, 11th
International Conference on Alkali-
Aggregate Reaction in Concrete, 2000, Québec, Canada, pp 969-978.
[Le Roux et al. 1992] A. Le Roux, E. Massieu, B. Godart, Evolution under stress of a concrete
affected by AAR – application to the feasibility of strengthening a bridge by prestressing, 9th
International Conference on Alkali-Aggregate Reaction in Concrete, 1992, Concrete Society
Publication CS 106, Vol 2, London, Great-Britain, pp 599-606.
[Leemann et al. 2004] A. Leemann, C. Thalmann, W. Studer, AAR in underground structures
of Switzerland-a survey, 12th
International Conference on Alkali-Aggregate Reaction in
Concrete, 2004, Beijing, China, pp 1071-1077.
Léger et al. 1995] P. Léger, P. Côté, R. Tinawi, Finite element analysis of concrete swelling due
to alkali-aggregate reactions in dams, Computers and Structures, 1995, 60(4), 601-611.
[Lemaître and Chaboche 1988] J. Lemaître, J.-L. Chaboche, Mécanique des Matériaux Solides,
Dunod (Eds.), Paris, France, 1988.
[Lenzner and Ludwig 1980] D. Lenzner, U. Ludwig, Alkali aggregate reaction with opaline
sandstone, 7th
International Congress on the Chemistry of Cement, Septima (Ed.), Paris, France,
1980, Vol.3, pp.VII-119 - VII-123.
[Li 2004] J.Y. Li, Problems on alkali-aggregate reactions of dam concrete in China, 12th
International Conference on Alkali-Aggregate Reaction in Concrete, 2004, Beijing, China, pp
1078-1085.
[Li et al. 2000] K.F. Li, F.J. Ulm, O. Coussy, C. Larive, L. Fan, Chemoelastic modelling of
alkali-silica reaction in concrete, 11th
International Conference on Alkali-Aggregate Reaction in
Concrete, 2000, Quebec, pp. 989-998.

References
134
[Li et al. 2001] K.F. Li, F.J. Ulm, O. Coussy, Durability assessment of ASR-induced structural
concrete degradation by a consistent model-based diagnosis-prognosis methodology, in
Massachusetts Institute of Technology (Ed.), Creep, Shrinkage and Durability Mech. Concrete
and Other Quasi-brittle Materials, Boston, USA, pp. 499-504 in [Seignol et al. 2009]
[Li and Coussy 2002] K. Li, O. Coussy, Concrete ASR degradation: from material modeling to
structure assessment, Concrete Science and Engineering, 2002, 13(4), 35-46.
[Liang and Readey 1987] D.T. Linag, D. W. Readey, Dissolution Kinetics of Crystalline and
Amorphous Silica in Hydrofluoric-Hydrochloric Acid Mixtures, Journal of the American
Ceramic Society, 1987(70), 8, P570-577.
[LCPC 1997] LCPC N°44, Alcali reaction du béton: essai d’expansion résiduelle sur béton
durci, à 38°C et H.R.≥ 95%, Presse des ponts et chaussées, February 1997, in French.
M
[Malla and Wieland 1999] S. Malla, M. Wieland, Analysis of an arch-gravity dam with a
horizontal crack, Computers and Structures, 1999, 72, 267-278.
[Mehta 1978] P. K. Mehta, Siliceous Ashes and Hydraulic Cements Prepared Therefrom, US
Patent, 1978, 4,105,459.
[McConnell et al. 1947] D. McConnell, R. C. Mielenz, W. Y. Holland, K.T. Greene, Cement-
aggregate reaction in concrete, Journal of the American Concrete Institute, Proceedings 1947,
44(2), pp.93-128.
[Multon 2004] S. Multon, Evaluation expérimentale et théorique des effets mécaniques de
l’alcali-réaction sur des structures modèles, thesis, 2007.
[Multon and Toutlemonde 2006] S. Multon, F. Toutlemonde, Effect of applied stresses on
alkali-silica reaction-induced expansions, Cement and Concrete Research, 2006, 36, 912-920.
[Multon et al. 2008] S. Multon, F-X. Barin, B. Godart, F. Toutlemonde, Estimation of the
Residual Expansion of Concrete Affected by AAR, Journal of Materials in Civil Engineering,
ASCE, 2008, 20(1), January 2008, 54-62.
[Multon et al. 2009] S. Multon, A. Sellier, M. Cyr, Chemo–mechanical modeling for prediction
of alkali silica reaction (ASR) expansion, Cement and Concrete Research, 2009, 39, 490-500.
[Multon et al. 2010] S. Multon, M. Cyr, A. Sellier, P. Diederich, L. Petit, Effect of aggregate
size and alkali content on ASR expansion, Cement and Concrete Research, 2010, 40, 508–516.

References
135
[Murat and Arnaud 1988] M. Murat, Y. Arnaud, Dissolution d‟une cendre Silico-Alumineuse
dans HF Dilué.Influence du Broyage, Silicates Industriels, 1988, 3-4, 43-48.
N
[Natesaiyer 1993] K. Natesaiyer, Some applications of the Gel Fluorescence Test for Alkali-
Aggregate Reaction in Concrete, Cement and Concrete Composites, 1993 (15), 3-6.
[NF P18-454, 2004] AFNOR, NF P18-454, Réactivité d'une formule de béton vis-à-vis de
l'alcali-réaction, December, 2004.
[NF EN 196-2, 2006] AFNOR, NF EN 196-2, Method of testing cement, part2: Chemical
analysis of cement, avril 2006, P26-28.
[NF EN 450-1, 2005] AFNOR, NF EN 450-1, Cendres volantes pour béton, Octobre 2005
[Nielsen et al. 1993] A. Nielsen, F. Gottfredsen, F. Thogersen, Development of stresses in
concrete structures with alkali-silica reactions, Material and Structures, 1993, 26, 152-158.
P
[Papadakis et al. 2002] V.G. Papadakis, S. Antiohos, S. Tsimas, Supplementary cementing
materials in concrete: Part II: A fundamental estimation of the efficiency factor , Cement and
Concrete Research, 2002, 32(10), 1533-1538.
[Paul 1982] A. Paul, Chemistry of Glasses, Chapman and Hall, 1982
[Payá et al. 2001] J. Payá, J. Monzo, M. V. Borrachero, L.M. Ordonez, Determination of
amorphous silica in rice husk ash by a rapid analytical method, Cement and Concrete
Research,2001, 31(2) ,227-231.
[Pichon et al. 1996] H. Pichon, P. Gaudon, A. Benhassaine, O. Eterradossi, Caractérisation et
quantification de la fraction reactive dans les pouzzolanes volcaniques, Bulletin Des
Laboratoires des Ponts et Chaussées,1996, 201, 29-37.
[Pleau et al. 1989] R. Pleau, M.A. Bérubé, M. Pigeon, B. Fournier, S. Raphael, Mechanical
behavior of concrete affected by ASR, 8th
International Conference on Alkali-Aggregate
Reaction in Concrete, 1989, Tokyo, pp 721-726.
[Poyet 2003] S. Poyet, Etude de la dégradation des ouvrages en béton atteints de la réaction
alcali-silice: approche expérimentale et modélisation numérique multi-échelle des
dégradations dans un environnement hydrochemo-mécanique variable, PhD thesis, 2003,
Université de Marne la Vallée, France.
References
136
[Poyet et al. 2006] S. Poyet, A. Sellier, B. Capra, G. Thèvenin-Foray, J.M. torrenti, H. Tournier-
Cognon, E. Bourdarot, Influence of water on Alkali-Silica Reaction: Experimental study and
numerical simulations, ASCE J Mater Civ Eng, 2006, 18(4): 588-596.
[Poyet et al. 2007] S. Poyet, A. Sellier, B. Capra, G. Foray, J.-M. Torrenti, H. Cognon, E.
Bourdarot, Chemical modelling of Alkali Silica reaction: Influence of the reactive aggregate
size distribution, Mater. Struct., 2007, 40, 229–239.
[Poole, 1992] A.B. Poole, Alkali-silica reactivity mechanism of gel formation and expansion,
9th
International Conference on Alkali-Aggregate Reaction in Concrete, 1992, London, pp 782-
789
R
[Ramyar et al. 2005] K. Ramyar, A. Topal, O. Andic, Effects of aggregate size and angularity
on alkali–silica reaction, Cement and Concrete Research, 2005, 35 (11), 2165-2169.
[Richardson 2004] M.G. Richardson, Alkali-silica reaction in the republic of Ireland: recent
research and revisions to national guidance, 12th
International Conference on Alkali-Aggregate
Reaction in Concrete, 2004, Beijing, China, pp 1120-1129.
[Richartz 1984] W. Richartz, 1984, Composition and properties of fly ashes, ZKG - Zem. Kalk
Gips, 1984, 84(2), 62.
[Rivard 2002] P. Rivard, Contribution à l’étude de l’expansion résiduelle des bétons atteints de
réactivité alcali-silice, Ph.D. thesis, Sherbrooke (Canada), 2002.
[Rivard et al. 2003] P. Rivard, M.-A. Bérubé, J.-P. Ollivier, G. Ballivy, Alkali mass balance
during the accelerated concrete prism test for alkali-aggregate reactivity, Cement and Concrete
Research, 2003, 33, pp. 1147-1153.
[Rivard et al. 2007] P. Rivard, M.-A. Bérubé, J.-P. Ollivier, G. Ballivy, Decrease of pore
solution alkalinity in concrete tested for alkali-silica reaction, Materials and Structures 2007,
40, 909–921.
[Rivard and Saint-Pierre 2009] P. Rivard, F. Saint-Pierre, Assessing alkali-silica reaction
damage to concrete with non-destructive methods: From the lab to the field, Concrete and
Building Materials, 2009, 23(2), 902-909.
[Rogers and Hooton 1991] C. A. Rogers, R. D. Hooton, Reduction in Mortar and Concrete
Expansion with Reactive Aggregates Due To Alkali Leaching, Cement, Concrete and
Aggregates, 1991, 13(1), pp. 42-49.

References
137
S
[Saouma and Perotti 2006] V. Saouma, L. Perotti, Constitutive model for alkali-aggregate
reactions, ACI Materials Journal, 2006, 103(3), 194-202.
[Saouma et al. 2007] V. Saouma, L. Perotti, T. Shimpo, Stress Analysis of Concrete Structures
subjected to Alkali-aggregate reactions, ACI Structural Journal, 2007, 104 (5), 532-541.
[Saouma 2009] V. Saouma, Finite Element modeling of AAR in Dams and Massive R/C
structures, AAR short course, Paris, 2009.
[Seignol et al. 2009] J. F. Seignol, L. I. Boldea, R. Leroy, B. Godat, J. G. Hammerschlag, Hydro-
power structure affected by alkali-aggregate reaction : a case-study involving numerical re-
assessment, Chemo-mechanical interaction in concrete Session Version 3, April 10, 2009, pp1-
21.
[Sellier 1995] A. Sellier, Modélisation probabiliste du comportement de matériaux et de
structures en génie civil, Ph.D. thesis, 1995, France.
[Sellier et al. 1996] A. Sellier, J-P. Bournazel, A. Mébarki, Modelling the alkali aggregate
reaction within a probabilistic frame-work, 10th
International Conference of Alkali Aggregate
Reaction, Melbourne, Australia, (1996) 694-701.
[Sellier et al. 2009] A. Sellier, E. Bourdarot, S. Multon, M. Cyr, E. Grimal, Combination of
Structural monitoring and laboratory tests for the assessment of AAR-swelling - Application to
a gate structure dam, ACI Materials Journal,2009, 106 (3), 281-290.
[Shayan 1997] A. Shayan, Where is AAR Heading after the 10th
International Conference?,
Cement and Concrete Composites, 1997, 19: 441-449.
[Shayan et al. 1988] A. Shayan, R. G. Diggins, I. Ivanusec, P.L. Westgate, Accelerated testing
of some Australian and overseas aggregates for alkali-aggregate reactivity, Cement and
Concrete Research, 1988, 18, 843-851.
[Shehata and Thomas 2000] M.H. Shehata, M.D.A. Thomas, The effect of fly ash composition
on the expansion of concrete due to alkali–silica reaction, Cement and Concrete Research,
2000, 30 (7), 1063–1072.
[Sims and Nixon 2003] I. Sims, P. Nixon, RILEM Recommended Test Method AAR-I:
detection of potential alkali-reactivity of aggregates - Petrographic method, Materials and
Structures, 2003, 36, 480-496.
[Sivapullaiah et al. 1998] P.V. Sivapullaiah, J.P. Prashanth, A. Sridharan, B.V. Narayana,
Reactive silica and strength of fly ashes, Geotechnical and Geological Engineering,1998, 16,
239–250.

References
138
[Smaoui 2003] N. Smaoui, Contribution à l’évaluation du comportement structural des
ouvrages d’art affectés de reaction alkali-silice (RAS), Ph.D. thesis, 2003, Québec, Canada
[Smaoui et al. 2004] N. Smaoui, M.-A. Bérubé, B. Fournier, and B. Bissonnette, Influence of
specimen geometry, direction of casting, and mode of concrete consolidation on expansion
due to ASR, Cement, Concrete and Aggregates, 2004, 26(2), 58-70.
[Suwito et al. 2002] A. Suwito, W. Jin, Y. Xi, C. Meyer, A mathematical model for the
pessimum effect of ASR in concrete, Concrete Science and Engineering, 2002, 4, 23-34.
T
[Taylor 1990] H.F.W. Taylor, Cement Chemistry, Academic Press, London, 1990.
[Thaulow et al. 1996] N. Thaulow, U-H. Jakobsen, B. Clark, Composition of alkali silica gel
and ettringite in concrete railroad ties: SEM-EDX and X-ray diffraction analyses, Cement and
Concrete Research, 1996, 26, 309-318.
[Thomas et al. 1996] M.D.A. Thomas, B.Q. Blackwell, P.J. Nixon, Estimating the alkali
contribution from fly ash to expansion due to alkali-aggregate reaction in concrete, Magazine
of Concrete Research, 1996, 48 (177) , 251–264.
[Tucker 2001] M. E. Tucker, Sedimentary petrology: an introduction to the origin of
sedimentary rocks, Wiley-Blackwell, 2001, 262 pages.
[Turriziani 1986] R. Turriziani, Internal degradation of concrete: alkali-aggregate reaction,
reinforcement steel corrosion, 8th
International Conference on Chemistry of Cement, Rio de
Janeiro, Brazil, 1986, pp 388-437.
U
[Urhan 1987] S. Urhan, Alkali Silica and Pozzolanic Reactions in concrete. Part 1 :
interpretation of published results and an hypothesis concerning the mechanism, Cem. Conc.
Res., 1987, 17 (1), 141-152.
V
[Vivian 1951] H. E. Vivian, Studies in cement-aggregate reaction. XIX: The effect on mortar
expansion of the particle size of the reactive component in the aggregate, Australian Journal of
Applied Science, 1951, 2, 488-494.
W
[Wang and Gillot 1991] H.Wang, J.E. Gillot, Mechanism of alkali-silica reaction and the
significance of calcium hydroxide, Cement and Concrete Research, 1991, 21, 674-654.

References
139
[Wilson et al. 1974] M. J. Wilson, J. D. Russel, J. M. Tait, A new interpretation of the structure
of disordered α-cristobalite, Contributions to Mineralogy and Petrology, 1974, 47 (1), 1-6.
[Wilson et al. 1994] M. Wilson, J.G. Cabrera, Y. Zou, The process and mechanism of alkali-
silica reaction using fused silica as the reactive aggregate, Advances in Cement Research,
1994, 23(6), 117-125.
[Wood et al. 1986] J.G.M. Wood, J.S. Ward, D.E.Ward, The structural effects of alkali-
aggregate reaction on reinforced concrete, 7th
International Conference on Alkali-Aggregate
Reaction in Concrete, 1986, Ottawa, pp 157-162
X
[Xie et al. 2003] Z. Xie, W. Xiang , Y. Xi, ASR Potentials of Glass Aggregates in Water-Glass
Activated Fly Ash and Portland Cement Mortars, Journal of Materials in Civil Engineering,
2003,15 (1), 67-74.
[XP P18-594, 2004] AFNOR, XP P18-594, Granulats - Méthodes d'essai de réactivité aux
alcalis (Aggregates -Test methods on reactivity to alkalis), February 2004.
Z
[Zhang and Groves 1990] X. Zhang, G. W. Groves, The alkali-silica reaction in OPC-silica
glass mortar with particular reference to pessimum effects, Advances in Cement Research,
1990, 3 (9), 9-13.
[Zhang et al. 1999] C. Zhang, A. Wang, M. Tang, B. Wu, N. Zhang, Influence of aggregate size
and aggregate size grading on ASR expansion, Cement and Concrete Research, 1999, 29 (9),
1393-1396.