contentsus.imshealth.com/actsonline/acts2013.pdf · overall precision index, ... we supply our...
TRANSCRIPT


Contents Abstract 3
Accuracy 5
Retail Validation 7
Algeria 11
Argentina 12
Australia 13
Austria 14
Bangladesh 15
Belgium 16
Bolivia 17
Brazil 18
Bulgaria 19
Canada 20
Central America 21
Chile 22
Colombia 23
Croatia 24
Czech Republic 25
Dominican Republic 26
Ecuador 27
Egypt 28
Estonia 29
Germany 30
Greece 31
Hong Kong 32
Hungary 33
India 34
Indonesia 35
Ireland 36
Italy 37
Japan 38
Jordan 39
Korea 40
Kuwait 41
Latvia 42
Lebanon 43
Lithuania 44
Malaysia 45
Mexico 46
Morocco 47
New Zealand 48
Pakistan 49
Paraguay 50
Peru 51
Philippines 52
Poland 53
Portugal 54
Saudi Arabia 55
Serbia 56
Singapore 57
Slovak Republic 58
Slovenia 59
Spain 60
Sri Lanka 61
Switzerland 62
Thailand 63
Tunisia 64
Turkey 65
Un. Arab Emirates 66
United Kingdom 67
Uruguay 68
USA 69
Venezuela 70
Vietnam 71
OTC Validation 72
Argentina 74
Austria 75
Belgium 76
Brazil 77
Bulgaria 78
Canada 79
Czech Republic 80
Finland 81
Germany 82
Greece 83
Hungary 84
Italy 85
Korea 86
Mexico 87
Poland 88
Portugal 89
Spain 90
Switzerland 91
Venezuela 92
PharmaTrend Validation 93
Austria 95
Belgium 96
Czech Republic 97
Finland 98
Germany 99
Hungary 100
Italy 101
Poland 102
Portugal 103
Spain 104
Switzerland 105
Hospital Validation 106
Austria 108
Belgium 109
Bulgaria 110
Canada 111
China 112
Germany 113
Italy 114
Korea 115
Philippines 116
Spain 117
Switzerland 118
United Kingdom 119
Specialty Mar-kets Validation 120
Forecasting Validation 122
Accuracy (cont’d) 124
Timeliness 129
Contact 133
2 acts 2013

Abstract Dear Client: With this edition of ACTS – the IMS Health Annual Report on Quality As-sessment – we are continuing a 27-year tradition of documenting the quality of our products for our customers. Quality, which can be expressed quite simply as “sound information at the right time”, can be measured in terms of Accuracy and Timeliness of Delivery. These as-pects of quality are paramount to users of IMS Health data and analytics, and through our publication of ACTS, we demonstrate our commitment to both. In performing our analysis, we hold our last year’s performance against strict thresholds and then report on both achievements and challenges. Accuracy metrics are derived from validation pro-cesses that reflect how close our data estimates were to the industry’s actual numbers. To make the comparison, we collect data down to the pack level on over 70,000 individual product forms – from more than 2,300 pharmaceutical company affiliates – in over 60 countries. Getting returns back from all 2,300 cus-tomers takes time – normally a full year. For this reason, we can only update you now on validity metrics for 2012; the validation process for 2013 has just be-gun. With the 2012 data, we’ve generally seen a minor decline against prior year – typically of one percentage point – in the overall precision index, which is calcu-lated as an aggregate of the precision in the retail, hospital, and pharmacy-based services. The overall precision level is evidence of continued stability for 2012. It is perfectly in line with that of previous years when we saw only slight fluctua-tions on a high precision level of 93% to
94%. This degree of stability is also visi-ble in all underlying offering types: retail and pharmacy at 94% and hospital re-ports at 90%. OTC offerings in the Con-sumer Health area even had their se-cond-best year in a five-year history, at 93%. Clearly, some markets saw economic pressure in 2012, mostly in the Euro zone and shortly after the turning point of the European financial crisis. Valida-tion results indicate that Accuracy in the US has declined by nearly two percent-age points, mainly due to the fact that a series of blockbuster products faced pa-tent expiration, which caused pre-expiry pipeline effects. Meanwhile, the precision level dropped in the two leading emerg-ing markets, China and India, also driven by rapid changes in the logistics and in-frastructure of pharmaceutical distribu-tion. In contrast, 11 countries – more than half from Latin America – have shown improvement over the preceding year. On the delivery side, we are proud to re-port that a challenging trend has come to a stop: in the first three quarters of 2013, delivery on average was made 24.9 days after the end of the reporting period – exactly as it had been in the prior year. Meanwhile, on-target perfor-mance even improved to 82%. This is not yet at the level set in 2011 and ear-lier, but could be interpreted as a turning point. As in previous years, ACTS will give you an honest appraisal of the quality of IMS Health's core offerings, reporting on a mix of favorable and less favorable trends and conditions. Please be assured
3 acts 2013

that the entire IMS Health Statistical Services team, the IMS Health Global Operations community and our local of-fices will strive for further improvement where necessary and retain the excellent results already achieved. The ACTS program is unparalleled across our industry and is very demanding in terms of time and effort. We would like to thank all our clients for helping to make this report possible through your
outstanding collaboration. Your com-ments and questions are very welcome; we invite you to keep the discussion alive and help us make ACTS a superior and relevant reference. Yours sincerely, Stefan Ziegele Vice President IMS Statistical Services
4 acts 2013

Accuracy The IMS Validation Studies, with their global reach and standardized measures, provide pharmaceutical companies with an impartial and forthright reference with which to judge the quality of IMS
data. By thus reporting on the precision of IMS’ decision-support tools, validation studies facilitate pharmaceutical compa-nies’ international decision making.
The Validation Process IMS conducts its Validation Studies in close co-operation with our service sub-scribers. Once we complete our year-end pharmacy audit, we supply our subscrib-ers with software that presents our esti-mated yearly sales volume for each product pack. Subscribers then enter their actual sales volume based on what they supplied to retail pharmacies. We then calculate an “R-Value” repre-senting the ratio of estimated sales as projected by IMS to actual sales as re-ported by our industry partners. For each product examined, we calculate an individual “R-Value.” We also calculate an average R-Value across all validated product forms. R-Values indicate the scale of overesti-mation or underestimation in IMS re-sults. An R-Value of 1.0 is the ideal and would mean that our projection matched reality exactly. Due to the nature of sta-tistical sampling, R-Values typically de-viate from 1.0, and it is only practical to strive for individual R-Values that are clustered tightly around this theoretical ideal. We express audit precision (or the de-gree of clustering) as the percentage of all individual R-Values that fall within a predefined range of deviation around the
average R-Value. The standard precision range is ±22.5 percentage points, some-times paired with a tighter range of ±17.5 percentage points around the av-erage over/underestimation. The greater the data precision, the more tightly R-Values will be clustered in the centre of this range. A precision value of 90 percent, paired with a zero percent bias, can be inter-preted as follows: On average, IMS audit data reflect a high degree of homogene-ity since 90 percent of the validated product forms lie between –22.5 percent and +22.5 percent of the reported in-dustry numbers. If we were to apply the tighter ±17.5 percent precision range to the same data as an additional measure, an 85 percent value would indicate that: • 85 percent of the validated product
forms were between –17.5 percent and +17.5 percent of the average R-Value and
• 5 percent deviated by more than
±17.5 percent but less than ±22.5 percent. The remaining 10 percent were outside the ±22.5 percentage range.
5 acts 2013

Conceptually, comparing IMS audit esti-mates with manufacturer sales data re-quires that the numbers be fully com-patible. This compatibility hinges on the ability of companies participating in the validation study to segregate their inter-nal sales data, isolating those sales channeled to the pharmacy retailing sector. The degree to which they can do this correlates closely with the technical infrastructure of the country and the complexity of the distribution system. When sales to other market sectors (e.g., tenders, exports) are not segre-gated and instead are included in a com-pany’s sales, the assumption is that IMS data have underestimated reality, and consequently they are viewed as incor-rect. Parallel trade practices add another ele-ment of incompatibility to the data. Typi-cally, manufacturers are unaware of the sales volume that sub-distributors and pharmacies export to other countries (parallel exports) or import from other countries (parallel imports). In parallel export situations, the industry numbers are usually inflated by sales that never entered the domestic pharmacy market. Conversely, in parallel import situations in which the imported items are not iso-
lated, for example through official paral-lel traders, IMS numbers are usually in-flated. Due to growing issues with data incom-patibility, validation studies are gradually losing some of their potency as an ob-jective measure of accuracy. Thus we are in the process of evaluating meas-ures of data relevance for those regions highly affected by parallel business (e.g., European rim). Nevertheless, we believe that once we exclude products typically traded in parallel from the validation process, the exercise still provides a good overall picture of the accuracy and trends achieved in the individual mar-kets. Validation Study results are considered to be representative of the survey uni-verse if more than 20 percent of the market is reflected in what our data partners send us. If the total market coverage reported by our data partners falls between 10 and 20 percent, valida-tion results may still give a good indica-tion of change from one year to the next, but otherwise must be used with care. Studies with participation rates less than 10 percent are included in the ACTS report but marked as not representative.
The 2012 Validation Results The validation process usually starts 2-3 months after the close of the year being validated. Typically, it can take up to ten months after we receive final feedback and can complete the analysis of any given country. This year, the last com-pleted materials for 2012 were returned to us in February 2014.
The 2012 participation level decreased slightly to a total of 39 companies on av-erage participating in a country’s valida-tion process, compared to 40 companies in 2011. In total, 2,321 company affili-ates world-wide participated in the 2012 validation surveys and supplied 70,927 product forms for analysis.
Global Validation Results Until a couple of years ago, we only vali-dated IMS retail audits while hospital, OTC and PharmaTrend offerings were quality-assessed more on a sporadic ba-sis. Along with an upgrading of the ACTS
validation process, we also incorporated these other standard deliverables in ACTS and have provided you lately with individual validation results. One request from our readers’ community was to
6 acts 2013

summarize all individual validation re-sults to one single metric – the Global Precision Index. This is an aggregate of all validations performed with uninter-rupted 5-years data and serves as a high level indicator on IMS data accuracy. For 2012, this global index utilizes the
outcome from 88 validation studies and demonstrates a high degree of stability across the 5-years time period. Lately, a slight reduction by 1.2 percentage points has been visible but keeps the index at a robust value of 93.1% - still in line with previous years’ results.
Global Precision Index
Retail Validation Results For the 2012 validation studies, 61 countries provided analyzable results. No validation study was necessary in Den-mark, Finland, the Netherlands, Norway and Sweden because we collect full cen-sus data in these countries. There, preci-sion results are assumed to be 100 per-
cent. This makes a total of 66 sets of validation results, of which 56 had unin-terrupted five-year results. The overall degree of precision in IMS pharmaceuti-cal reports is best described by an ag-gregated precision index for these 56 countries:
Retail Precision Index
93.6 93.9 93.4 94.3 93.1
0.0
20.0
40.0
60.0
80.0
100.0
2008 2009 2010 2011 2012
%
94.5 94.8 94.3 95.0 94.0
0
20
40
60
80
100
2008 2009 2010 2011 2012
%
7 acts 2013

Overall, the Retail Precision Index over the 5-year period documents solid out-come in maintaining existing levels of data quality well above the 90% margin.
However, in 2012, the index showed de-cline of one percentage point over 2011 and with 94.0% reached the lowest pre-cision level of the last five years.
Regional Retail Results The 66 countries are distributed over the greater IMS regions as follows:
Regional Distribution of Participation
Regional Retail Precision Index 2011/2012
2
13
14
3 8
11
14
1
North America
Latin America
North Europe & Africa
Central Europe
East Europe
South Europe & Mid East
AsiaPacific
Japan
0 20 40 60 80 100
Japan
AsiaPacific
South Europe & Mid East
East Europe
Central Europe
North Europe & Africa
Latin America
North America
World
%
Improvement
Deterioration
8 acts 2013
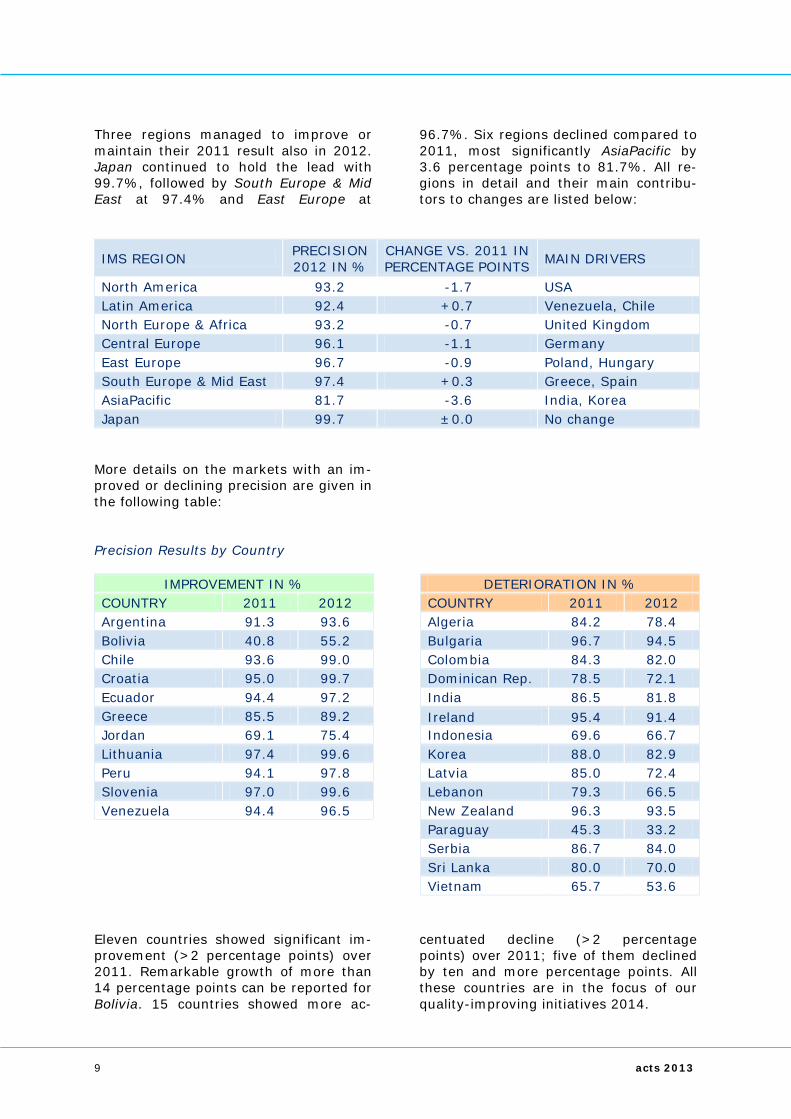
Three regions managed to improve or maintain their 2011 result also in 2012. Japan continued to hold the lead with 99.7%, followed by South Europe & Mid East at 97.4% and East Europe at
96.7%. Six regions declined compared to 2011, most significantly AsiaPacific by 3.6 percentage points to 81.7%. All re-gions in detail and their main contribu-tors to changes are listed below:
IMS REGION PRECISION 2012 IN %
CHANGE VS. 2011 IN PERCENTAGE POINTS MAIN DRIVERS
North America 93.2 -1.7 USA Latin America 92.4 +0.7 Venezuela, Chile North Europe & Africa 93.2 -0.7 United Kingdom Central Europe 96.1 -1.1 Germany East Europe 96.7 -0.9 Poland, Hungary South Europe & Mid East 97.4 +0.3 Greece, Spain AsiaPacific 81.7 -3.6 India, Korea Japan 99.7 ±0.0 No change
More details on the markets with an im-proved or declining precision are given in the following table: Precision Results by Country
IMPROVEMENT IN % DETERIORATION IN % COUNTRY 2011 2012 COUNTRY 2011 2012 Argentina 91.3 93.6 Algeria 84.2 78.4 Bolivia 40.8 55.2 Bulgaria 96.7 94.5 Chile 93.6 99.0 Colombia 84.3 82.0 Croatia 95.0 99.7 Dominican Rep. 78.5 72.1 Ecuador 94.4 97.2 India 86.5 81.8 Greece 85.5 89.2 Ireland 95.4 91.4 Jordan 69.1 75.4 Indonesia 69.6 66.7 Lithuania 97.4 99.6 Korea 88.0 82.9 Peru 94.1 97.8 Latvia 85.0 72.4 Slovenia 97.0 99.6 Lebanon 79.3 66.5 Venezuela 94.4 96.5 New Zealand 96.3 93.5
Paraguay 45.3 33.2
Serbia 86.7 84.0
Sri Lanka 80.0 70.0
Vietnam 65.7 53.6
Eleven countries showed significant im-provement (>2 percentage points) over 2011. Remarkable growth of more than 14 percentage points can be reported for Bolivia. 15 countries showed more ac-
centuated decline (>2 percentage points) over 2011; five of them declined by ten and more percentage points. All these countries are in the focus of our quality-improving initiatives 2014.
9 acts 2013

Country-specific Results The validation studies mentioned on the following country pages refer to the IMS
retail reports, with the following excep-tions:
COUNTRY MARKET COVERED Croatia, Czech Republic, Hungary, India, Poland, Serbia, Slovak Republic, Slovenia, United States
Hospital market included
Hong Kong, Indonesia, Vietnam Total market Malaysia, Singapore Total private market
Further parts of this accuracy section, which follow the retail validation pages, highlight other validation initiatives of high interest to our data subscribers: • OTC Validation Studies • PharmaTrend Validation Studies • Hospital Validation Studies • Specialty Markets Validation Results • Validating IMS Forecasting Services
In addition, we are providing updates on the latest measures we’ve taken to sus-tain today’s quality levels: • Universe Updates • Data Capture • Sample Fulfillment
10 acts 2013

Algeria Retail Validation Study 2012
Participation Number of companies 13 The 2012 LMNPA validation study was at-
tended by 13 companies, two more than in 2011. The participants supplied 235 product forms for evaluation, of which 10 (4%) showed extreme deviation and had to be ex-cluded from the bias analysis. The validated market share of the participating manufac-turers was 27% in terms of units.
Validated market share 27% Number of R-Values 235 Number of extreme values 10
Over/Underestimation
The overall bias turned from 1.3% underestimation in 2011 to 1.2% overestimation in 2012. Low and high sales vol-ume products were overesti-mated by 3.9% and 1.5%, re-spectively, whereas the me-dium sales volume group showed a small underestima-tion of 0.6%.
Precision
The overall precision index de-clined from 84.2% in 2011 to 78.4% in 2012. The medium sales volume group surpassed this score at 83.5%. Low and high sales volume products had precision values of 76.0% and 76.1%, respectively. Looking only at forms validated in both years, 2011 and 2012, the pre-cision index declined from 85.3% in 2011 to 83.1% in 2012.
Actions Enhance projection methodology
0.6
-4.4 -1.3
1.2
-40
-30
-20
-10
0
10
20
2008 2009 2010 2011 2012
%
85.6 83.1 84.2 78.4
0
20
40
60
80
100
2008 2009 2010 2011 2012
%
±17.5% ±22.5%
11 acts 2013

Argentina Retail Validation Study 2012
Participation Number of companies 64 The 2012 PMA validation study was attended
by 64 companies, the same number as in 2011. The participants supplied 2,929 prod-uct forms for evaluation, of which 60 (2%) showed extreme deviation and had to be ex-cluded from the bias analysis. The validated market share of the participating manufac-turers was 59% in terms of units.
Validated market share 59% Number of R-Values 2,929 Number of extreme values 60
Over/Underestimation
The overall underestimation in-creased from 3.7% in 2011 to 4.5% in 2012. Low sales vol-ume products were underesti-mated by 2.9%, medium by 3.1%, and the high sales vol-ume group showed a 5.6% un-derestimation.
Precision
The overall precision index im-proved from 91.3% in 2011 to 93.6% in 2012. The high sales volume group surpassed this score at 95.1%. Low and me-dium sales volume products had precision values of 91.0% and 92.5%, respectively. Looking only at forms validated in both years, 2011 and 2012, the precision index improved from 91.7% in 2011 to 95.2% in 2012.
Actions No action required from the statistical point of view
-1.9 -6.7 -5.6 -3.7 -4.5
-40
-30
-20
-10
0
10
20
2008 2009 2010 2011 2012
%
96.0 93.4 92.8 91.3 93.6
0
20
40
60
80
100
2008 2009 2010 2011 2012
%
±17.5% ±22.5%
12 acts 2013
Australia Retail+Hospital Validation Study 2012
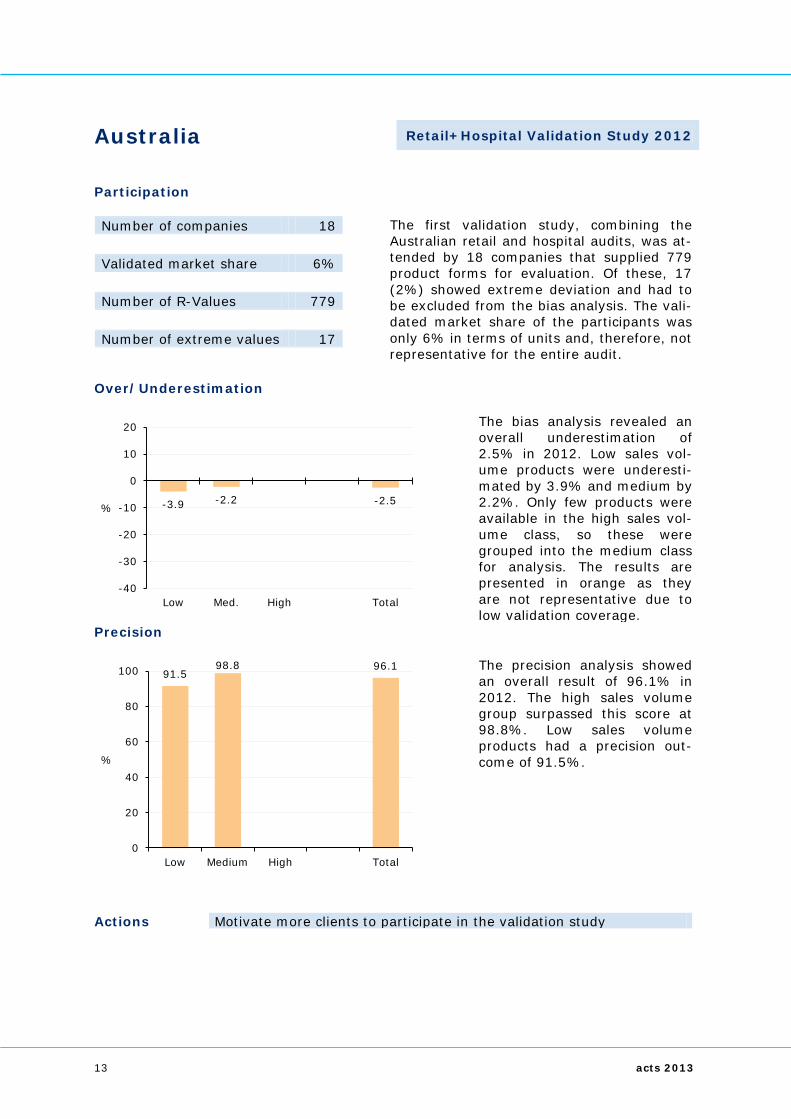
Participation Number of companies 18 The first validation study, combining the
Australian retail and hospital audits, was at-tended by 18 companies that supplied 779 product forms for evaluation. Of these, 17 (2%) showed extreme deviation and had to be excluded from the bias analysis. The vali-dated market share of the participants was only 6% in terms of units and, therefore, not representative for the entire audit.
Validated market share 6% Number of R-Values 779 Number of extreme values 17
Over/Underestimation
The bias analysis revealed an overall underestimation of 2.5% in 2012. Low sales vol-ume products were underesti-mated by 3.9% and medium by 2.2%. Only few products were available in the high sales vol-ume class, so these were grouped into the medium class for analysis. The results are presented in orange as they are not representative due to low validation coverage.
Precision
The precision analysis showed an overall result of 96.1% in 2012. The high sales volume group surpassed this score at 98.8%. Low sales volume products had a precision out-come of 91.5%.
Actions Motivate more clients to participate in the validation study
-3.9 -2.2 -2.5
-40
-30
-20
-10
0
10
20
Low Med. High Total
%
91.5 98.8 96.1
0
20
40
60
80
100
Low Medium High Total
%
13 acts 2013

Austria Retail Validation Study 2012
Participation Number of companies 16 The 2012 DPMOE validation study was at-
tended by 16 companies, the same number as in 2011. The participants supplied 654 product forms for evaluation, of which 5 (<1%) showed extreme deviation and had to be excluded from the bias analysis. The validated market share of the participating manufacturers was 25% in terms of units.
Validated market share 25% Number of R-Values 654 Number of extreme values 5
Over/Underestimation
The overall underestimation in-creased slightly, from 1.3% in 2011 to 1.9% in 2012. Low sales volume products were underestimated by 2.4%, me-dium by 2.3%, and the high sales volume group showed a 1.7% underestimation.
Precision
The overall precision index im-proved slightly from 97.8% in 2011 to 97.9% in 2012. The medium and high sales volume groups surpassed this score at 98.1% and 99.1%, respec-tively. Low sales volume prod-ucts had a precision value of 93.2%. Looking only at forms validated in both years, 2011 and 2012, the precision index declined slightly from 98.8% in 2011 to 98.3% in 2012.
Actions No action required from the statistical point of view
-1.7 -0.1 -1.5 -1.3 -1.9
-40
-30
-20
-10
0
10
20
2008 2009 2010 2011 2012
%
97.8 94.9 95.6 97.8 97.9
0
20
40
60
80
100
2008 2009 2010 2011 2012
%
±17.5% ±22.5%
14 acts 2013
Bangladesh Retail Validation Study 2012
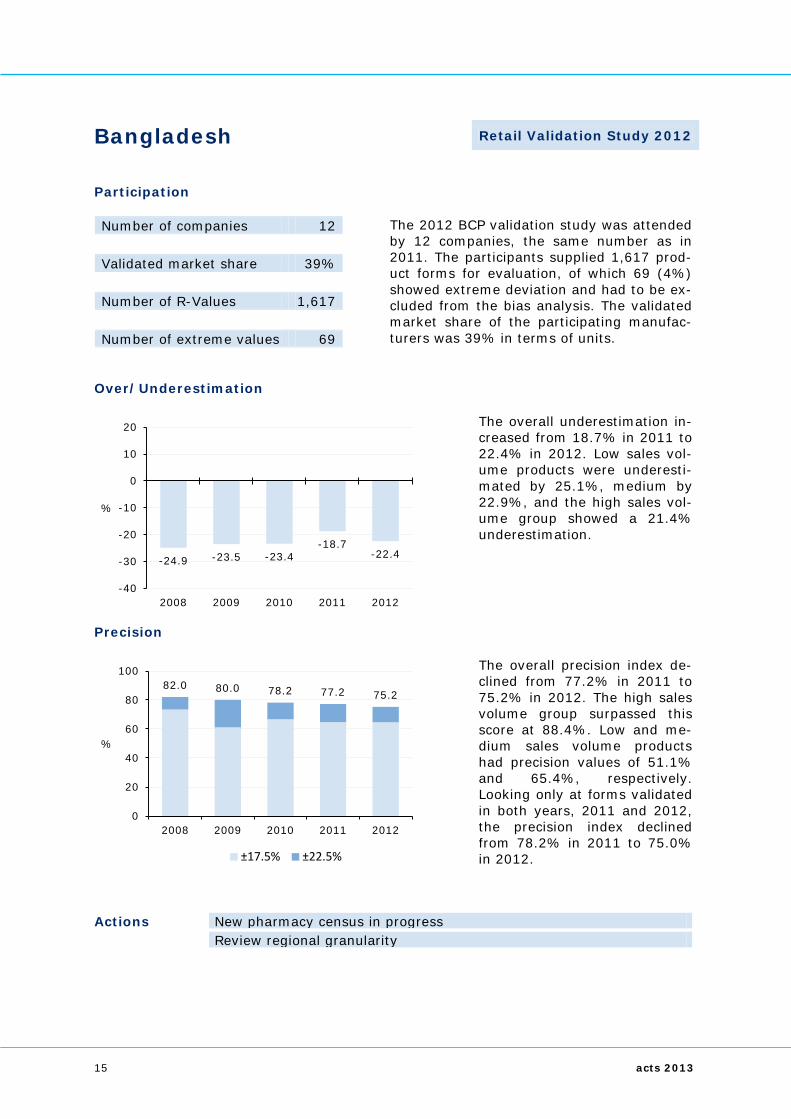
Participation Number of companies 12 The 2012 BCP validation study was attended
by 12 companies, the same number as in 2011. The participants supplied 1,617 prod-uct forms for evaluation, of which 69 (4%) showed extreme deviation and had to be ex-cluded from the bias analysis. The validated market share of the participating manufac-turers was 39% in terms of units.
Validated market share 39% Number of R-Values 1,617 Number of extreme values 69
Over/Underestimation
The overall underestimation in-creased from 18.7% in 2011 to 22.4% in 2012. Low sales vol-ume products were underesti-mated by 25.1%, medium by 22.9%, and the high sales vol-ume group showed a 21.4% underestimation.
Precision
The overall precision index de-clined from 77.2% in 2011 to 75.2% in 2012. The high sales volume group surpassed this score at 88.4%. Low and me-dium sales volume products had precision values of 51.1% and 65.4%, respectively. Looking only at forms validated in both years, 2011 and 2012, the precision index declined from 78.2% in 2011 to 75.0% in 2012.
Actions New pharmacy census in progress Review regional granularity
-24.9 -23.5 -23.4 -18.7
-22.4
-40
-30
-20
-10
0
10
20
2008 2009 2010 2011 2012
%
82.0 80.0 78.2 77.2 75.2
0
20
40
60
80
100
2008 2009 2010 2011 2012
%
±17.5% ±22.5%
15 acts 2013
Belgium Retail Validation Study 2012
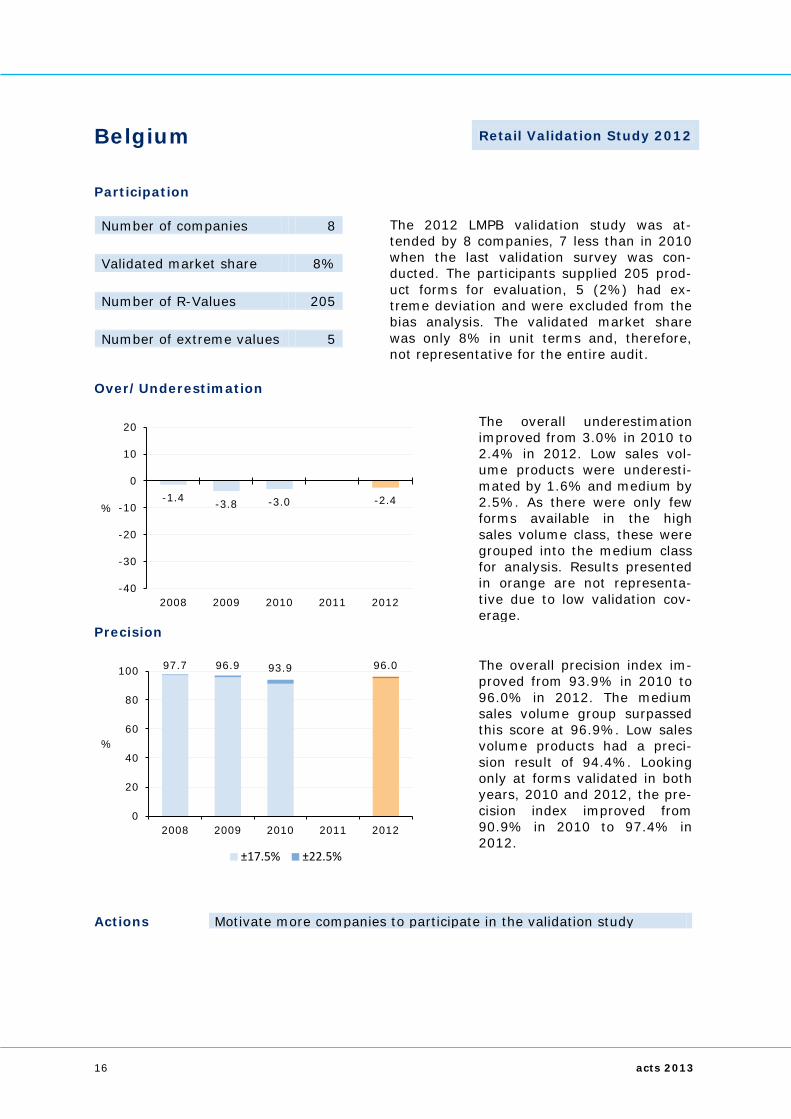
Participation Number of companies 8 The 2012 LMPB validation study was at-
tended by 8 companies, 7 less than in 2010 when the last validation survey was con-ducted. The participants supplied 205 prod-uct forms for evaluation, 5 (2%) had ex-treme deviation and were excluded from the bias analysis. The validated market share was only 8% in unit terms and, therefore, not representative for the entire audit.
Validated market share 8% Number of R-Values 205 Number of extreme values 5
Over/Underestimation
The overall underestimation improved from 3.0% in 2010 to 2.4% in 2012. Low sales vol-ume products were underesti-mated by 1.6% and medium by 2.5%. As there were only few forms available in the high sales volume class, these were grouped into the medium class for analysis. Results presented in orange are not representa-tive due to low validation cov-erage.
Precision
The overall precision index im-proved from 93.9% in 2010 to 96.0% in 2012. The medium sales volume group surpassed this score at 96.9%. Low sales volume products had a preci-sion result of 94.4%. Looking only at forms validated in both years, 2010 and 2012, the pre-cision index improved from 90.9% in 2010 to 97.4% in 2012.
Actions Motivate more companies to participate in the validation study
-1.4 -3.8 -3.0 -2.4
-40
-30
-20
-10
0
10
20
2008 2009 2010 2011 2012
%
97.7 96.9 93.9 96.0
0
20
40
60
80
100
2008 2009 2010 2011 2012
%
±17.5% ±22.5%
16 acts 2013
Bolivia Retail Validation Study 2012
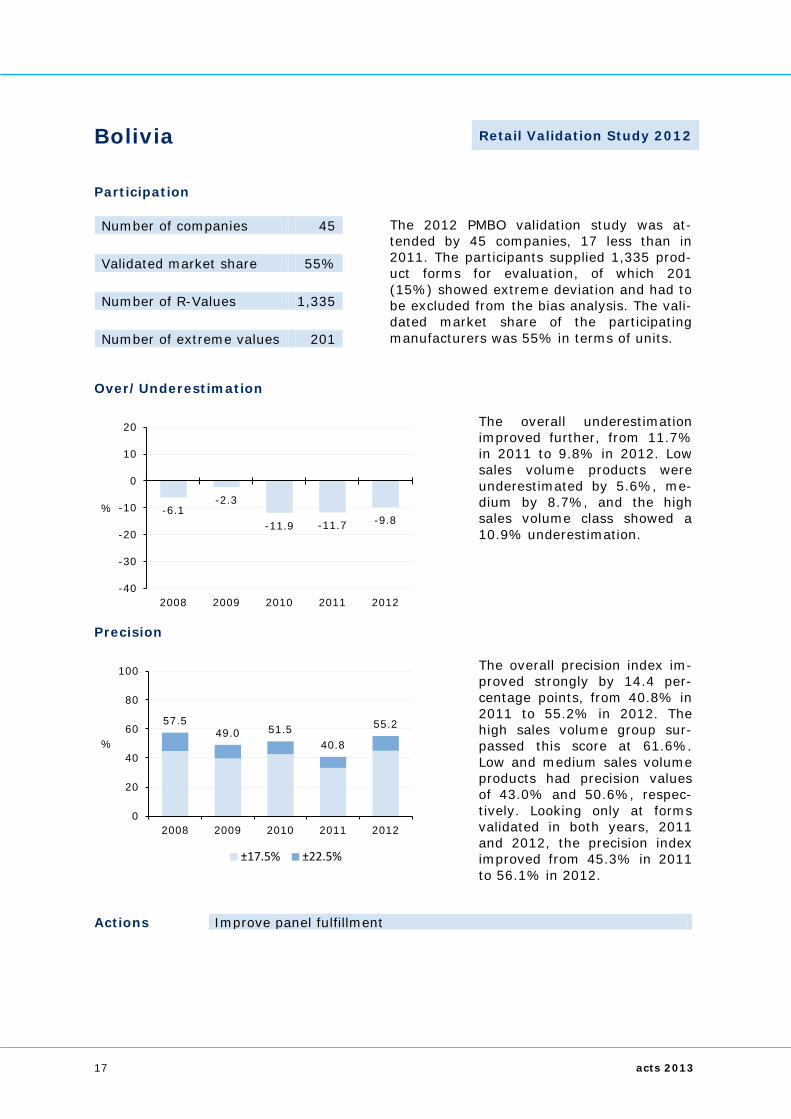
Participation Number of companies 45 The 2012 PMBO validation study was at-
tended by 45 companies, 17 less than in 2011. The participants supplied 1,335 prod-uct forms for evaluation, of which 201 (15%) showed extreme deviation and had to be excluded from the bias analysis. The vali-dated market share of the participating manufacturers was 55% in terms of units.
Validated market share 55% Number of R-Values 1,335 Number of extreme values 201
Over/Underestimation
The overall underestimation improved further, from 11.7% in 2011 to 9.8% in 2012. Low sales volume products were underestimated by 5.6%, me-dium by 8.7%, and the high sales volume class showed a 10.9% underestimation.
Precision
The overall precision index im-proved strongly by 14.4 per-centage points, from 40.8% in 2011 to 55.2% in 2012. The high sales volume group sur-passed this score at 61.6%. Low and medium sales volume products had precision values of 43.0% and 50.6%, respec-tively. Looking only at forms validated in both years, 2011 and 2012, the precision index improved from 45.3% in 2011 to 56.1% in 2012.
Actions Improve panel fulfillment
-6.1 -2.3
-11.9 -11.7 -9.8
-40
-30
-20
-10
0
10
20
2008 2009 2010 2011 2012
%
57.5 49.0 51.5
40.8
55.2
0
20
40
60
80
100
2008 2009 2010 2011 2012
%
±17.5% ±22.5%
17 acts 2013

Brazil Retail Validation Study 2012
Participation Number of companies 28 The 2012 PMB validation study was attended
by 28 multinational companies, the same number as in 2011. The participants sup-plied 1,250 product forms for evaluation, of which 9 (<1%) showed extreme deviation and had to be excluded from the bias analy-sis. The validated market share of the participating manufacturers was 18% in terms of units.
Validated market share 18% Number of R-Values 1,250 Number of extreme values 9
Over/Underestimation
The overall underestimation in-creased by four percentage points, from 3.8% in 2011 to 7.8% in 2012. Low sales vol-ume products were underesti-mated by 9.9%, medium by 8.3%, and the high sales vol-ume group showed a 6.9% un-derestimation.
Precision
The overall precision index de-clined slightly, from 93.9% in 2011 to 93.7% in 2012. The high sales volume group sur-passed this score at 95.8%. Low and medium sales volume products had precision values of 89.8% and 92.0%, respec-tively. Looking only at forms validated in both years, 2011 and 2012, the precision index improved from 95.8% in 2011 to 98.4% in 2012.
Actions Conduct distribution channel survey in 2014
-3.2 -5.4 -6.5 -3.8
-7.8
-40
-30
-20
-10
0
10
20
2008 2009 2010 2011 2012
%
91.2 92.6 94.9 93.9 93.7
0
20
40
60
80
100
2008 2009 2010 2011 2012
%
±17.5% ±22.5%
18 acts 2013

Bulgaria Retail Validation Study 2012
Participation Number of companies 59 The 2012 BGPI validation study was at-
tended by 59 companies, ten more than in 2011. The participants supplied 851 product forms for evaluation, of which 16 (2%) showed extreme deviation and had to be ex-cluded from the bias analysis. The validated market share of the participating manufac-turers was 58% in terms of units.
Validated market share 58% Number of R-Values 851 Number of extreme values 16
Over/Underestimation
The overall bias turned from 1.0% underestimation in 2011 to a small overestimation of 0.5% in 2012. Low sales vol-ume products were underesti-mated by 1.5%, medium by 0.8%, and the high sales vol-ume group showed a 1.5% overestimation.
Precision
The overall precision index de-clined from 96.7% in 2011 to 94.5% in 2012. The high sales volume group surpassed this score at 97.5%. Low and me-dium sales volume products had precision values of 87.8% and 92.9%, respectively. Looking only at forms validated in both years, 2011 and 2012, the precision index declined from 97.7% in 2011 to 94.4% in 2012.
Actions No immediate action required from the statistical point of view
-0.2
2.2
-3.3 -1.0
0.5
-40
-30
-20
-10
0
10
20
2008 2009 2010 2011 2012
%
93.6 94.8 97.7 96.7 94.5
0
20
40
60
80
100
2008 2009 2010 2011 2012
%
±17.5% ±22.5%
19 acts 2013

Canada Retail Validation Study 2012
Participation Number of companies 88 Data from 88 companies, one more than in
2011, was available for the 2012 CDH Drug-stores validation study. In total, 3,259 prod-uct forms were processed, of which 7 (<1%) showed extreme deviation and had to be ex-cluded from the bias analysis. The validated market share equaled 95% in terms of units, representing the highest participation rate across all countries.
Validated market share 95% Number of R-Values 3,259 Number of extreme values 7
Over/Underestimation
The overall overestimation in-creased slightly, from 0.6% in 2011 to 1.2% in 2012. Low and high sales volume products were both overestimated by 1.0% and medium sales vol-ume products showed a 1.6% overestimation.
Precision
The overall precision index showed stability at 98.9% in 2012. The high sales volume group surpassed this score at 99.5%. Low and medium sales volume products had precision values of 97.3% and 98.7%, respectively. Looking only at forms validated in both years, 2011 and 2012, the precision index declined slightly from 99.1% in 2011 to 98.9% in 2012.
Actions No action required from the statistical point of view
1.1 0.6 0.7 0.6 1.2
-40
-30
-20
-10
0
10
20
2008 2009 2010 2011 2012
%
98.2 99.0 98.8 99.1 98.9
0
20
40
60
80
100
2008 2009 2010 2011 2012
%
±17.5% ±22.5%
20 acts 2013

Central America Retail Validation Study 2012
Participation Number of companies 31 The 2012 PMCA validation study was at-
tended by 31 companies, two more than in 2011. The participants supplied 1,833 prod-uct forms for evaluation, of which 68 (4%) showed extreme deviation and had to be ex-cluded from the bias analysis. The validated market share of the participating manufac-turers was 33% in terms of units.
Validated market share 33% Number of R-Values 1,833 Number of extreme values 68
Over/Underestimation
The overall underestimation in-creased slightly, from 1.5% in 2011 to 2.9% in 2012. Low sales volume products were underestimated by 3.7%, me-dium by 2.6%, and the high sales volume classes showed a 3.0% underestimation.
Precision
The overall precision index im-proved slightly, from 87.4% in 2011 to 87.9% in 2012. The high sales volume group sur-passed this score at 91.3%. Low and medium sales volume products had precision results of 77.1% and 87.6%, respec-tively. Looking only at forms validated in both years, 2011 and 2012, the precision index improved from 89.1% in 2011 to 91.8% in 2012.
Actions Review projection level
-8.4 -3.6 -3.0 -1.5 -2.9
-40
-30
-20
-10
0
10
20
2008 2009 2010 2011 2012
%
84.8 86.9 88.9 87.4 87.9
0
20
40
60
80
100
2008 2009 2010 2011 2012
%
±17.5% ±22.5%
21 acts 2013

Chile Retail Validation Study 2012
Participation Number of companies 15 The 2012 PMCH validation study was at-
tended by 15 companies, two more than in 2011. The participants supplied 842 product forms for evaluation, of which only one (<1%) showed extreme deviation and had to be excluded from the bias analysis. The validated market share of the participating manufacturers was 20% in terms of units.
Validated market share 20% Number of R-Values 842 Number of extreme values 1
Over/Underestimation
The 2012 overall bias analysis revealed the same result of 0.1% overestimation as in 2011. Low sales volume prod-ucts were overestimated by 1.7%, whereas medium and high sales volume products were underestimated by 0.4% and 0.3%, respectively.
Precision
The overall precision index im-proved by 5.4 percentage points, from 93.6% in 2011 to 99.0% in 2012. The high sales volume group surpassed this score at a perfect 100%. Low and medium sales volume products had precision values of 96.7% and 98.5%, respec-tively. Looking only at forms validated in both years, 2011 and 2012, the precision index improved from 96.5% in 2011 to 99.4% in 2012.
Actions Conduct distribution channel survey in 2014
-3.1 -2.9 -4.8
0.1 0.1
-40
-30
-20
-10
0
10
20
2008 2009 2010 2011 2012
%
90.9 94.9 93.4 93.6 99.0
0
20
40
60
80
100
2008 2009 2010 2011 2012
%
±17.5% ±22.5%
22 acts 2013

Colombia Retail Validation Study 2012
Participation Number of companies 18 The 2012 PMC validation study was attended
by 18 companies, ten more than in 2011. The participants supplied 1,078 product forms for evaluation, of which 82 (8%) showed extreme deviation and had to be ex-cluded from the bias analysis. The validated market share of the participating manufac-turers was 23% in terms of units.
Validated market share 23% Number of R-Values 1,078 Number of extreme values 82
Over/Underestimation
The overall underestimation improved from 9.8% in 2011 to 7.8% in 2012. Low sales vol-ume products were underesti-mated by 2.7%, medium by 4.8%, and the high sales vol-ume group showed a 10.4% underestimation.
Precision
The overall precision index de-clined from 84.3% in 2011 to 82.0% in 2012. The medium and high sales volume groups surpassed this score at 83.4% and 85.7%, respectively. Low sales volume products had a precision value of 66.9%. Looking only at forms validated in both years, 2011 and 2012, the precision index improved slightly from 87.8% in 2011 to 88.0% in 2012.
Actions Conduct distribution channel survey Update universe and sample
-3.1
1.5
-3.5 -9.8 -7.8
-40
-30
-20
-10
0
10
20
2008 2009 2010 2011 2012
%
86.4 89.0 77.1
84.3 82.0
0
20
40
60
80
100
2008 2009 2010 2011 2012
%
±17.5% ±22.5%
23 acts 2013

Croatia Retail+Hospital Validation Study 2012
Participation Number of companies 10 The 2012 validation study, combining the
Croatian retail and hospital audits, was at-tended by 10 companies, two more than in 2011. The participants supplied 541 product forms for evaluation, of which 2 (<1%) showed extreme deviation and had to be ex-cluded from the bias analysis. The validated market share of the participants equaled 41% in terms of units.
Validated market share 41% Number of R-Values 541 Number of extreme values 2
Over/Underestimation
The overall overestimation in-creased from 0.6% in 2011 to 2.4% in 2012. Low sales vol-ume products were overesti-mated by 0.7%, medium by 1.6%, and the high sales vol-ume group revealed a 3.4% overestimation.
Precision
The overall precision index im-proved from 95.0% in 2011 to 99.7% in 2012. The medium and high sales volume classes surpassed this score both at a perfect 100%. Low sales vol-ume products had a precision value of 98.3%. Looking only at forms validated in both years, 2011 and 2012, the pre-cision index improved from 99.6% in 2011 to 100% in 2012.
Actions No action required from the statistical point of view
0.6 2.4
-40
-30
-20
-10
0
10
20
2008 2009 2010 2011 2012
%
95.0 99.7
0
20
40
60
80
100
2008 2009 2010 2011 2012
%
±17.5% ±22.5%
24 acts 2013

Czech Republic Retail+Hospital Validation Study 2012
Participation Number of companies 29 The 2012 validation study, combining the
Czech retail and hospital audits, was at-tended by 29 companies, four more than in 2011. The participants supplied 1,147 prod-uct forms for evaluation, of which four showed extreme deviation and had to be ex-cluded from the bias analysis. The validated market share of the participants was 48% in terms of units.
Validated market share 48% Number of R-Values 1,147 Number of extreme values 4
Over/Underestimation
The overall underestimation in-creased slightly, from 0.7% in 2011 to 0.9% in 2012. Low sales volume products were underestimated by 1.4%, me-dium by 0.7%, and high sales volume products were under-estimated by 1.0%.
Precision
The overall precision index de-clined marginally by 0.1 per-centage point, from 99.0% in 2011 to 98.9% in 2012. The high sales volume group sur-passed this score at a perfect 100%. Low and medium sales volume products had precision values of 94.1% and 99.5%, respectively. Looking only at forms validated in both years, 2011 and 2012, the precision index declined slightly from 99.4% in 2011 to 99.1% in 2012.
Actions No action required from the statistical point of view
-1.2 -0.4
0.5
-0.7 -0.9
-40
-30
-20
-10
0
10
20
2008 2009 2010 2011 2012
%
99.1 98.7 98.7 99.0 98.9
0
20
40
60
80
100
2008 2009 2010 2011 2012
%
±17.5% ±22.5%
25 acts 2013
Dominican Republic Retail Validation Study 2012
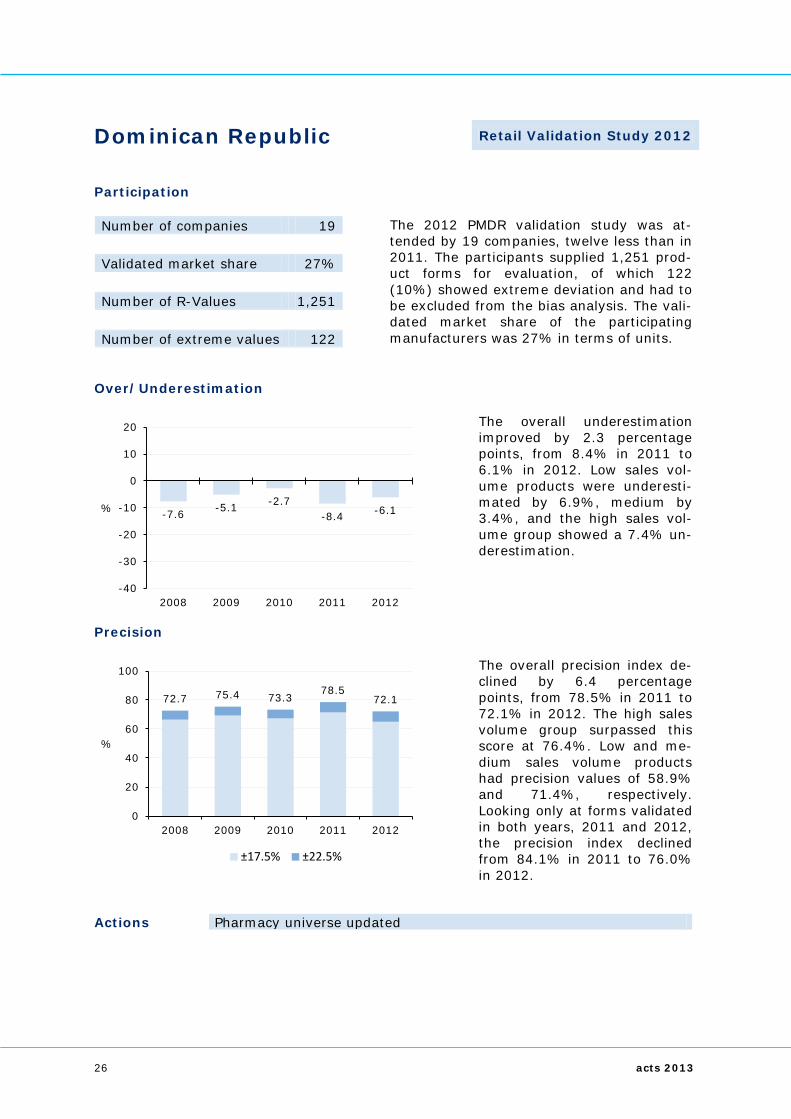
Participation Number of companies 19 The 2012 PMDR validation study was at-
tended by 19 companies, twelve less than in 2011. The participants supplied 1,251 prod-uct forms for evaluation, of which 122 (10%) showed extreme deviation and had to be excluded from the bias analysis. The vali-dated market share of the participating manufacturers was 27% in terms of units.
Validated market share 27% Number of R-Values 1,251 Number of extreme values 122
Over/Underestimation
The overall underestimation improved by 2.3 percentage points, from 8.4% in 2011 to 6.1% in 2012. Low sales vol-ume products were underesti-mated by 6.9%, medium by 3.4%, and the high sales vol-ume group showed a 7.4% un-derestimation.
Precision
The overall precision index de-clined by 6.4 percentage points, from 78.5% in 2011 to 72.1% in 2012. The high sales volume group surpassed this score at 76.4%. Low and me-dium sales volume products had precision values of 58.9% and 71.4%, respectively. Looking only at forms validated in both years, 2011 and 2012, the precision index declined from 84.1% in 2011 to 76.0% in 2012.
Actions Pharmacy universe updated
-7.6 -5.1 -2.7 -8.4 -6.1
-40
-30
-20
-10
0
10
20
2008 2009 2010 2011 2012
%
72.7 75.4 73.3 78.5
72.1
0
20
40
60
80
100
2008 2009 2010 2011 2012
%
±17.5% ±22.5%
26 acts 2013

Ecuador Retail Validation Study 2012
Participation Number of companies 89 The 2012 PME validation study was attended
by 89 companies, one more than in 2011. The participants supplied 2,449 product forms for evaluation, of which 8 (<1%) showed extreme deviation and had to be ex-cluded from the bias analysis. The validated market share of the participating manufac-turers was 72% in terms of units.
Validated market share 72% Number of R-Values 2,449 Number of extreme values 8
Over/Underestimation
The overall underestimation improved marginally from 4.8% in 2011 to 4.7% in 2012. Low sales volume products were underestimated by 2.7%, medium by 3.7%, and the high sales volume group showed a 5.8% underestimation.
Precision
The overall precision index im-proved from 94.4% in 2011 to 97.2% in 2012. The medium sales volume group surpassed this score at 98.2%. Low and high sales volume groups both had precision values of 96.7%. Looking only at forms validated in both years, 2011 and 2012, the precision index improved from 95.1% in 2011 to 97.9% in 2012.
Actions Include more distributors to improve panel coverage
-2.5 -4.1 -3.0 -4.8 -4.7
-40
-30
-20
-10
0
10
20
2008 2009 2010 2011 2012
%
93.2 93.8 91.9 94.4 97.2
0
20
40
60
80
100
2008 2009 2010 2011 2012
%
±17.5% ±22.5%
27 acts 2013

Egypt Retail Validation Study 2012
Participation Number of companies 46 The 2012 PIE validation study was attended
by 46 companies, 16 more than in 2011. The participants supplied 604 product forms for evaluation, none of which showed any extreme deviation. The validated market share of the participating manufacturers equaled 24% in terms of units.
Validated market share 24% Number of R-Values 604 Number of extreme values 0
Over/Underestimation
The overall underestimation improved by 2.1 percentage points, from 4.0% in 2011 to 1.9% in 2012. Low sales vol-ume products were underesti-mated by 1.8%, medium by 2.2%, and the high sales vol-ume class showed a 1.7% un-derestimation.
Precision
The overall precision index showed again a perfect result of 100% in 2012. This excellent result is also distributed over all sales volume groups. Look-ing only at forms validated in both years, 2011 and 2012, the precision index remained at 100%.
Actions No action required from the statistical point of view
-1.8 -2.6 -2.8 -4.0 -1.9
-40
-30
-20
-10
0
10
20
2008 2009 2010 2011 2012
%
98.6 100.0 99.9 100.0 100.0
0
20
40
60
80
100
2008 2009 2010 2011 2012
%
±17.5% ±22.5%
28 acts 2013

Estonia Retail Validation Study 2012
Participation Number of companies 17 The 2012 ESTPI validation study was at-
tended by 17 companies, eleven more than in 2011. The participants supplied 220 prod-uct forms for evaluation, of which 3 (1%) showed extreme deviation and had to be ex-cluded from the bias analysis. The validated market share of the participating manufac-turers equaled 15% in terms of units.
Validated market share 15% Number of R-Values 220 Number of extreme values 3
Over/Underestimation
The overall bias improved from a 2.0% underestimation in 2011 to a small 0.9% overes-timation in 2012. Low sales volume products were under-estimated by 1.4%, medium by 1.3%, and the high sales vol-ume group showed a 2.3% overestimation.
Precision
The overall precision index im-proved slightly, from 88.1% in 2011 to 88.4% in 2012. The medium and high sales volume groups surpassed this score at 92.0% and 89.1%, respec-tively. Low sales volume prod-ucts had a precision value of 79.1%. Looking only at forms validated in both years, 2011 and 2012, the precision index improved from 92.5% in 2011 to 94.4% in 2012.
Actions Review projection level for OTC data
-8.6
-15.8 -15.3
-2.0
0.9
-40
-30
-20
-10
0
10
20
2008 2009 2010 2011 2012
%
84.6 85.2 80.7 88.1 88.4
0
20
40
60
80
100
2008 2009 2010 2011 2012
%
±17.5% ±22.5%
29 acts 2013
Germany Retail Validation Study 2012
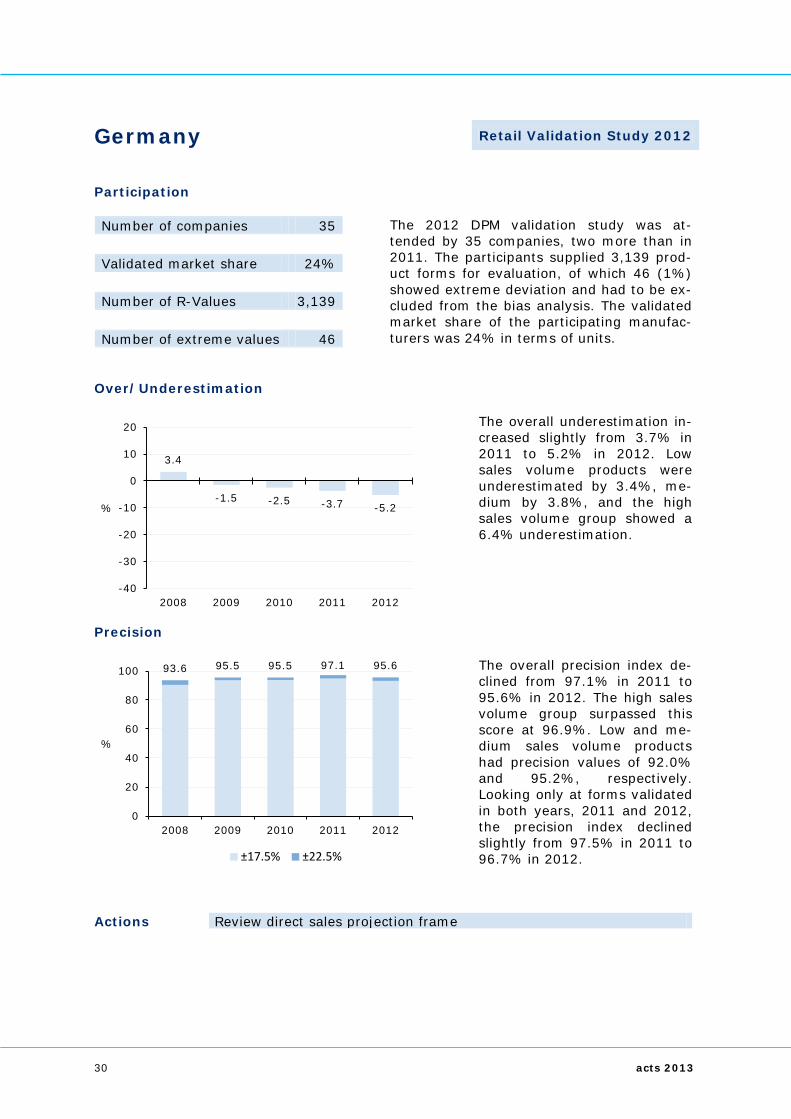
Participation Number of companies 35 The 2012 DPM validation study was at-
tended by 35 companies, two more than in 2011. The participants supplied 3,139 prod-uct forms for evaluation, of which 46 (1%) showed extreme deviation and had to be ex-cluded from the bias analysis. The validated market share of the participating manufac-turers was 24% in terms of units.
Validated market share 24% Number of R-Values 3,139 Number of extreme values 46
Over/Underestimation
The overall underestimation in-creased slightly from 3.7% in 2011 to 5.2% in 2012. Low sales volume products were underestimated by 3.4%, me-dium by 3.8%, and the high sales volume group showed a 6.4% underestimation.
Precision
The overall precision index de-clined from 97.1% in 2011 to 95.6% in 2012. The high sales volume group surpassed this score at 96.9%. Low and me-dium sales volume products had precision values of 92.0% and 95.2%, respectively. Looking only at forms validated in both years, 2011 and 2012, the precision index declined slightly from 97.5% in 2011 to 96.7% in 2012.
Actions Review direct sales projection frame
3.4
-1.5 -2.5 -3.7 -5.2
-40
-30
-20
-10
0
10
20
2008 2009 2010 2011 2012
%
93.6 95.5 95.5 97.1 95.6
0
20
40
60
80
100
2008 2009 2010 2011 2012
%
±17.5% ±22.5%
30 acts 2013

Greece Retail Validation Study 2012
Participation Number of companies 85 The 2012 GPI validation study was attended
by 85 companies, 17 more than in 2011. The participants supplied 1,074 product forms for evaluation, of which 27 (3%) showed extreme deviation and had to be ex-cluded from the bias analysis. The validated market share of the participating manufac-turers was 69% in terms of units.
Validated market share 69% Number of R-Values 1,074 Number of extreme values 27
Over/Underestimation
The overall bias analysis re-vealed a 2.6% underestimation in 2012. Low sales volume products were underestimated by 3.1%, medium by 2.7%, and the high sales volume group revealed a 2.5% under-estimation.
Precision
The overall precision index im-proved further, from 85.5% in 2011 to 89.2% in 2012. The high sales volume group sur-passed this score at 94.6%. Low and medium sales volume products had precision values of 71.9% and 89.0%, respec-tively. Looking only at forms validated in both years, 2011 and 2012, the precision index declined slightly from 90.1% in 2011 to 89.0% in 2012.
Actions New universe study conducted Enhance sampling method based on universe study outcome
0.0 2.0
-1.4
0.0
-2.6
-40
-30
-20
-10
0
10
20
2008 2009 2010 2011 2012
%
85.2 83.3 82.8 85.5 89.2
0
20
40
60
80
100
2008 2009 2010 2011 2012
%
±17.5% ±22.5%
31 acts 2013

Hong Kong Retail Validation Study 2012
Participation Number of companies 26 Data from 26 companies, ten less than in
2009 when the previous validation study was conducted, was available for the 2012 HKPA validation study. In total, 964 product forms were processed, of which 132 (14%) showed extreme deviation and had to be ex-cluded from the bias analysis. The validated market share equaled 31% in terms of units.
Validated market share 31% Number of R-Values 964 Number of extreme values 132
Over/Underestimation
The overall underestimation showed stability at 11.8% in 2012. Low sales volume prod-ucts were underestimated by 19.8%, medium by 18.0%, and the high sales volume group had a 2.6% underestimation.
Precision
The overall precision index de-clined from 75.2% in 2009 to 73.0% in 2012. The high sales volume group surpassed this score at 80.0%. Low and me-dium sales volume products had precision values of 60.3% and 67.7%, respectively. Looking only at forms validated in both years, 2009 and 2012, the precision index declined marginally from 83.8% in 2009 to 83.7% in 2012.
Actions Review projection level and panel composition
-11.3 -11.9 -11.8
-40
-30
-20
-10
0
10
20
2008 2009 2010 2011 2012
%
74.9 75.2 73.0
0
20
40
60
80
100
2008 2009 2010 2011 2012
%
±17.5% ±22.5%
32 acts 2013

Hungary Retail+Hospital Validation Study 2011
Participation Number of companies 82 The 2012 validation study, combining the
Hungarian retail and hospital audits, was at-tended by 82 companies, eight less than in 2011. The participants supplied 1,703 prod-uct forms for evaluation, of which 19 (1%) showed extreme deviation and had to be ex-cluded from the bias analysis. The validated market share of the participating companies equaled 76% in terms of units.
Validated market share 76% Number of R-Values 1,703 Number of extreme values 19
Over/Underestimation
The overall underestimation improved from 4.1% in 2011 to 1.7% in 2012. Low sales vol-ume products were underesti-mated by 1.5%, medium by 1.9%, and the high sales vol-ume group showed a 1.7% un-derestimation.
Precision
The overall precision index de-clined slightly, from 98.6% in 2011 to 96.9% in 2012. The high sales volume group sur-passed this score at 97.9%. Low and medium sales volume products had precision values of 94.6% and 96.4%, respec-tively. Looking only at forms validated in both years, 2011 and 2012, the precision index declined slightly from 98.7% in 2011 to 97.7% in 2012.
Actions No action required from the statistical point of view
-1.0 -1.2 -1.8 -4.1 -1.7
-40
-30
-20
-10
0
10
20
2008 2009 2010 2011 2012
%
99.4 99.4 98.9 98.6 96.9
0
20
40
60
80
100
2008 2009 2010 2011 2012
%
±17.5% ±22.5%
33 acts 2013
India Retail+Hospital Validation Study 2012
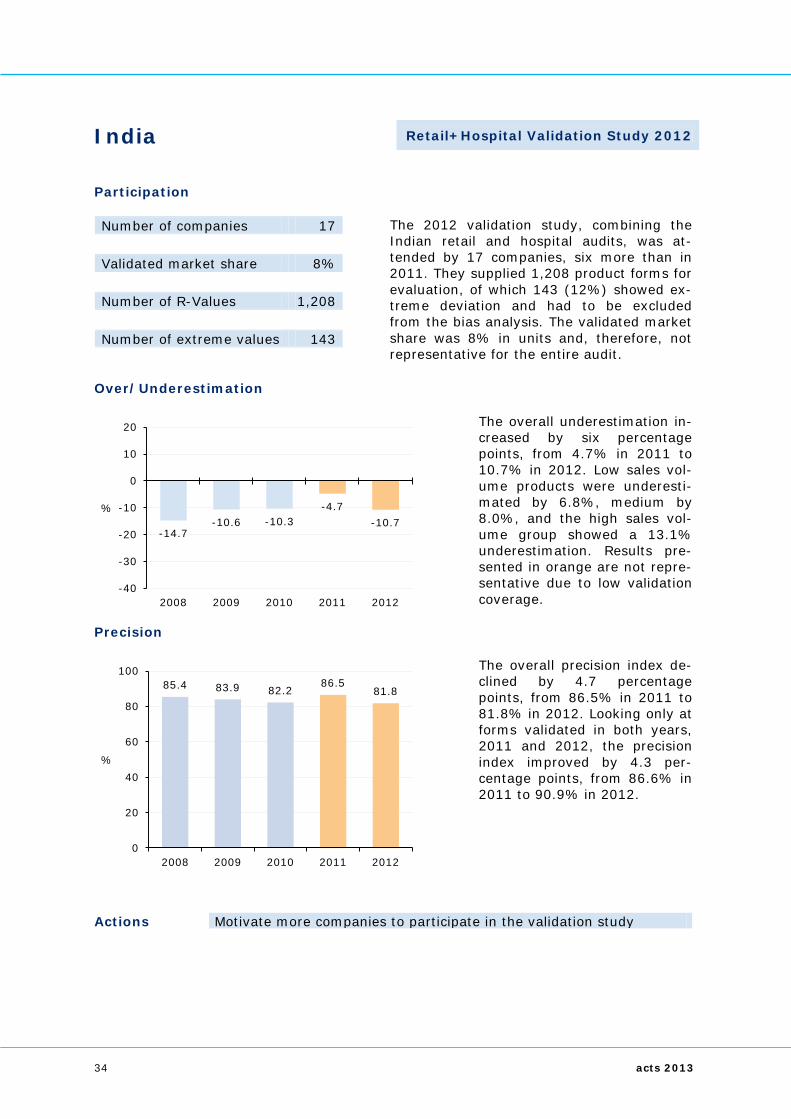
Participation Number of companies 17 The 2012 validation study, combining the
Indian retail and hospital audits, was at-tended by 17 companies, six more than in 2011. They supplied 1,208 product forms for evaluation, of which 143 (12%) showed ex-treme deviation and had to be excluded from the bias analysis. The validated market share was 8% in units and, therefore, not representative for the entire audit.
Validated market share 8% Number of R-Values 1,208 Number of extreme values 143
Over/Underestimation
The overall underestimation in-creased by six percentage points, from 4.7% in 2011 to 10.7% in 2012. Low sales vol-ume products were underesti-mated by 6.8%, medium by 8.0%, and the high sales vol-ume group showed a 13.1% underestimation. Results pre-sented in orange are not repre-sentative due to low validation coverage.
Precision
The overall precision index de-clined by 4.7 percentage points, from 86.5% in 2011 to 81.8% in 2012. Looking only at forms validated in both years, 2011 and 2012, the precision index improved by 4.3 per-centage points, from 86.6% in 2011 to 90.9% in 2012.
Actions Motivate more companies to participate in the validation study
-14.7 -10.6 -10.3
-4.7 -10.7
-40
-30
-20
-10
0
10
20
2008 2009 2010 2011 2012
%
85.4 83.9 82.2 86.5
81.8
0
20
40
60
80
100
2008 2009 2010 2011 2012
%
34 acts 2013

Indonesia Total Market Validation Study 2012
Participation Number of companies 62 Data from 62 companies, sixteen less than
in 2011, was available for the 2012 ITMA validation study. In total, 4,981 product forms were processed, of which 843 (17%) showed extreme deviation and had to be ex-cluded from the bias analysis. The validated market share equaled 43% in terms of units.
Validated market share 43% Number of R-Values 4,981 Number of extreme values 843
Over/Underestimation
The overall bias increased slightly to a 1.2% underesti-mation. Low sales volume products were underestimated by 6.6%, medium by 4.0%, and the high sales volume group showed a slight 0.1% underestimation.
Precision
The overall precision index de-clined to 66.7% in 2012. The low sales volume class sur-passed this score at 71.6%. Medium and high sales volume products had precision results of 64.3% and 66.7%, respec-tively. Looking only at forms validated in both years, 2011 and 2012, the precision index improved from 73.6% in 2011 to 80.7% in 2012.
Actions Enhance projection methodology Improve data collection and coding quality
-2.2 -1.3 -2.7
0.0
-1.2
-40
-30
-20
-10
0
10
20
2008 2009 2010 2011 2012
%
67.5 70.1 69.5 69.6 66.7
0
20
40
60
80
100
2008 2009 2010 2011 2012
%
±17.5% ±22.5%
35 acts 2013

Ireland Retail Validation Study 2012
Participation Number of companies 12 The 2012 IPI validation study was attended
by 12 companies, eleven less than in 2011. The participants supplied 188 product forms for evaluation, of which 6 (3%) showed ex-treme deviation and had to be excluded from the bias analysis. The validated market share of the participating manufacturers was only 6% in terms of units and, therefore, not representative for the entire audit.
Validated market share 6% Number of R-Values 188 Number of extreme values 6
Over/Underestimation
The overall bias turned from 1.2% underestimation in 2011 to 1.0% overestimation in 2012. Low sales volume prod-ucts were overestimated by 0.1% and medium by 1.2%. Only few forms were available in the high sales volume class, so these were grouped into the medium class for analysis. Re-sults presented in orange are not representative due to low validated market coverage.
Precision
The overall precision index de-clined from 95.4% in 2011 to 91.4% in 2012. The medium sales volume group surpassed this score at 95.8%. Low sales volume products had a preci-sion result of 83.8%. Looking only at forms validated in both years, 2011 and 2012, the pre-cision index remained at a perfect 100%.
Actions Motivate more companies to participate in the validation study
-1.5 -0.6 -1.2
1.0
-40
-30
-20
-10
0
10
20
2008 2009 2010 2011 2012
%
97.3 98.2 95.4 91.4
0
20
40
60
80
100
2008 2009 2010 2011 2012
%
±17.5% ±22.5%
36 acts 2013

Italy Retail Validation Study 2012
Participation Number of companies 29 The 2012 IMF validation study was attended
by 29 companies, one more than in 2011. The participants supplied 1,081 product forms for evaluation, of which ten (<1%) showed extreme deviation and had to be ex-cluded from the bias calculation. The vali-dated market share of the participating manufacturers was 32% in terms of units.
Validated market share 32% Number of R-Values 1,081 Number of extreme values 10
Over/Underestimation
The overall underestimation in-creased slightly by 0.3 per-centage points, from 2.2% in 2011 to 2.5% in 2012. Low sales volume products were underestimated by 2.4%, me-dium by 3.7%, and the high sales volume class revealed a 1.9% underestimation.
Precision
The overall precision index de-clined from 98.7% in 2011 to 96.8% in 2012. The high sales volume group surpassed this score at 98.0%. Low and me-dium sales volume products had precision results of 94.4% and 96.1%, respectively. Looking only at forms validated in both years, 2011 and 2012, the precision index declined slightly from 99.1% in 2011 to 98.3% in 2012.
Actions No action required from the statistical point of view
-2.7 -2.3 -1.9 -2.2 -2.5
-40
-30
-20
-10
0
10
20
2008 2009 2010 2011 2012
%
97.3 96.7 97.3 98.7 96.8
0
20
40
60
80
100
2008 2009 2010 2011 2012
%
±17.5% ±22.5%
37 acts 2013

Japan Retail+Hospital Validation Study 2012
Participation Number of companies 53 The 2012 JPM validation study was attended
by 53 companies, two more than in 2011. The participants supplied 3,056 product forms for evaluation, of which six (<1%) showed extreme deviation and were ex-cluded from the bias analysis. The validated market share of the participating manufac-turers was 71% in terms of units.
Validated market share 71% Number of R-Values 3,056 Number of extreme values 6
Over/Underestimation
The overall bias improved to +0.1% in 2012. Low sales vol-ume products were overesti-mated by 0.5%, medium by 1.2%, and the high sales vol-ume group showed a 0.1% overestimation.
Precision
The overall precision index showed again a very good re-sult in 2012, ending at 99.7%. The high sales volume group surpassed this score at a per-fect 100%. Low and medium sales volume products had pre-cision indices of 99.0% and 99.6%, respectively. Measure-ment at the tighter ±17.5% interval revealed a precision result of 99.5%.
Actions No action required from the statistical point of view
0.2 0.0 0.1 0.3 0.1
-40
-30
-20
-10
0
10
20
2008 2009 2010 2011 2012
%
99.7 99.7 99.8 99.7 99.7
0
20
40
60
80
100
2008 2009 2010 2011 2012
%
±17.5% ±22.5%
38 acts 2013

Jordan Retail Validation Study 2012
Participation Number of companies 10 The 2012 JPI validation study was attended
by 10 companies, five less than in 2011. The participants supplied 349 product forms for evaluation, of which 7 (2%) showed ex-treme deviation and had to be excluded from the bias analysis. The validated market share of the participating manufacturers was 17% in terms of units.
Validated market share 17% Number of R-Values 349 Number of extreme values 7
Over/Underestimation
The overall underestimation improved further, from 16.6% in 2011 to 10.1% in 2012. Low sales volume products were underestimated by 4%, me-dium by 6.8%, and the high sales volume group showed a 13.7% underestimation.
Precision
The overall precision index im-proved by 6.3 percentage points, from 69.1% in 2011 to 75.4% in 2012. The medium sales volume group surpassed this score at 77.3%. Low and high sales volume products had precision values of 83.2% and 72.0%, respectively. Looking only at forms validated in both years, 2011 and 2012, the pre-cision index declined slightly from 76.9% in 2011 to 76.3% in 2012.
Actions Motivate more companies to participate in the validation study
-32.1 -29.5
-21.7 -16.6
-10.1
-40
-30
-20
-10
0
10
20
2008 2009 2010 2011 2012
%
69.4 62.7 62.9
69.1 75.4
0
20
40
60
80
100
2008 2009 2010 2011 2012
%
±17.5% ±22.5%
39 acts 2013

Korea Retail Validation Study 2012
Participation Number of companies 16 The 2012 KPA validation study was attended
by 16 companies, three less than in 2011. The participants supplied 696 product forms for evaluation, of which 31 (4%) showed extreme deviation and had to be excluded from the bias analysis. The validated market share of the participating manufacturers was 12% in terms of units.
Validated market share 12% Number of R-Values 696 Number of extreme values 31
Over/Underestimation
The overall underestimation in-creased from 11.0% in 2011 to 15.9% in 2012. Low sales vol-ume products were underesti-mated by 18.9%, medium by 14.3%, and high sales volume products showed a 16.7% un-derestimation.
Precision
The overall precision index de-clined from 88.0% in 2011 to 82.9% in 2012. The high sales volume group surpassed this score at 91.3%. Low and me-dium sales volume products had precision values of 64.4% and 78.1%, respectively. Looking only at forms validated in both years, 2011 and 2012, the precision index declined from 88.8% in 2011 to 79.1% in 2012.
Actions Review projection level and panel composition Improve data collection and coding quality
-17.1 -17.7 -15.5 -11.0
-15.9
-40
-30
-20
-10
0
10
20
2008 2009 2010 2011 2012
%
82.2 83.7 85.1 88.0 82.9
0
20
40
60
80
100
2008 2009 2010 2011 2012
%
±17.5% ±22.5%
40 acts 2013

Kuwait Retail Validation Study 2012
Participation Number of companies 26 The 2012 KWPI validation study was at-
tended by 26 companies, three more than in 2011. The participants supplied 520 product forms for evaluation, none of which showed any extreme deviation. The validated market share of the participating manufacturers was 46% in terms of units.
Validated market share 46% Number of R-Values 520 Number of extreme values 0
Over/Underestimation
The overall underestimation of 0.5% in 2011 remained at the same level in 2012. Low sales volume products were under-estimated by 1.1%, medium by 0.7%, and the high sales vol-ume class revealed a 0.3% un-derestimation.
Precision
The overall precision index im-proved from 98.7% in 2011 to 99.6% in 2012. The high sales volume group reached a per-fect 100%. Low and medium sales volume products had pre-cision scores of 98.9% and 99.4%, respectively. Looking only at forms validated in both years, 2011 and 2012, the pre-cision index declined slightly from 99.8% in 2011 to 99.5% in 2012.
Actions No action required from the statistical point of view
-0.9 -1.0
0.5
-0.5 -0.5
-40
-30
-20
-10
0
10
20
2008 2009 2010 2011 2012
%
99.2 95.9 99.8 98.7 99.6
0
20
40
60
80
100
2008 2009 2010 2011 2012
%
±17.5% ±22.5%
41 acts 2013

Latvia Retail Validation Study 2012
Participation Number of companies 13 The 2012 LVPI validation study was at-
tended by 13 companies, four less than in 2011. The participants supplied 303 product forms for evaluation, of which 24 (8%) showed extreme deviation and had to be ex-cluded from the bias analysis. The validated market share of the participating manufac-turers equaled 15% in terms of units.
Validated market share 15% Number of R-Values 303 Number of extreme values 24
Over/Underestimation
The overall bias increased from a 6.6% underestimation in 2011 to a 10.3% overestima-tion in 2012. Low sales volume products were overestimated by 8.7%, medium by 9.2%, and the high sales volume group showed an 11.2% over-estimation.
Precision
The overall precision index de-clined further, from 85.0% in 2011 to 72.4% in 2012. The high sales volume group sur-passed this score at 77.4%. Low and medium sales volume products had precision values of 59.1% and 70.8%, respec-tively. Looking only at forms validated in both years, 2011 and 2012, the precision index dropped from 91.2% in 2011 to 61.7% in 2012.
Actions Pharmacy panel increased Adjust projection level
3.2 3.0 1.4
-6.6
10.3
-40
-30
-20
-10
0
10
20
2008 2009 2010 2011 2012
%
96.1 94.7 96.3 85.0
72.4
0
20
40
60
80
100
2008 2009 2010 2011 2012
%
±17.5% ±22.5%
42 acts 2013

Lebanon Retail Validation Study 2012
Participation Number of companies 8 The 2012 LPI validation study was attended
by 8 companies, 16 less than in 2011. The participants supplied 131 product forms for evaluation, of which 19 (15%) showed ex-treme deviation and had to be excluded from the bias analysis. The validated market share of the participating manufacturers was only 6% in terms of units and, therefore, not representative for the entire audit.
Validated market share 6% Number of R-Values 131 Number of extreme values 19
Over/Underestimation
The overall underestimation improved from 13.1% in 2011 to 0.2% in 2012. Low sales vo-lume products were underesti-mated by 3.9% and medium were overestimated by 0.3%. As there were only few forms available in the high sales vol-ume class, these were grouped into the medium class for anal-ysis. Results presented in or-ange are not representative due to low validation coverage.
Precision
The overall precision index de-teriorated further, from 79.3% in 2011 to 66.5% in 2012. The medium sales volume group surpassed this score at 67.9%. Low sales volume products had a precision value of 64.1%. Looking only at forms validated in both years, 2011 and 2012, the precision index dropped from 77.8% in 2011 to 66.7% in 2012.
Actions Motivate more companies to participate in the validation study
-15.7 -13.1
-0.2
-40
-30
-20
-10
0
10
20
2008 2009 2010 2011 2012
%
93.1
79.3
66.5
0
20
40
60
80
100
2008 2009 2010 2011 2012
%
±17.5% ±22.5%
43 acts 2013

Lithuania Retail Validation Study 2012
Participation Number of companies 12 The 2012 LTPI validation study was attended
by 12 companies, nine less than in 2011. The participants supplied 203 product forms for evaluation, none of which showed any extreme deviation. The validated market share of the participating manufacturers was 13% in terms of units.
Validated market share 13% Number of R-Values 203 Number of extreme values 0
Over/Underestimation
The overall overestimation in-creased slightly, from 1.3% in 2011 to 1.7% in 2012. Low sales volume products were underestimated by 1.7%, me-dium had no bias at all, and the high sales volume group showed a 2.9% overestimation.
Precision
The overall precision index im-proved from 97.4% in 2011 to 99.6% in 2012. The medium and high sales volume groups both surpassed this score at a perfect 100%. Low sales vol-ume products had a precision value of 97.5%. Looking only at forms validated in 2011 and 2012, the precision index was 100% in both years.
Actions Slightly adjust projection level
0.5 2.2 1.8 1.3 1.7
-40
-30
-20
-10
0
10
20
2008 2009 2010 2011 2012
%
98.3 98.6 98.8 97.4 99.6
0
20
40
60
80
100
2008 2009 2010 2011 2012
%
±17.5% ±22.5%
44 acts 2013

Malaysia Retail Validation Study 2012
Participation Number of companies 64 Data from 64 companies, one more than in
2011, was available for the 2012 MPA vali-dation study. In total, 2,795 product forms were processed, of which 245 (9%) showed extreme deviation and had to be excluded from the bias analysis. The validated market share equaled 32% in terms of units.
Validated market share 32% Number of R-Values 2,795 Number of extreme values 245
Over/Underestimation
The overall underestimation improved by 1.5 percentage points, from 12.4% in 2011 to 10.9% in 2012. Low sales vol-ume products were underesti-mated by 12.2%, medium by 12.9%, and the high sales vol-ume group showed a 9.3% un-derestimation.
Precision
The overall precision index showed stability at 81.1% in 2012. The high sales volume group surpassed this score at 85.3%. Low and medium sales volume products had precision values of 72.7% and 78.4%, respectively. Looking only at forms validated in both years, 2011 and 2012, the precision index declined slightly from 83.8% in 2011 to 82.2% in 2012.
Actions Review projection level and panel composition
-15.9 -15.0 -16.4 -12.4 -10.9
-40
-30
-20
-10
0
10
20
2008 2009 2010 2011 2012
%
80.2 80.6 80.1 81.2 81.1
0
20
40
60
80
100
2008 2009 2010 2011 2012
%
±17.5% ±22.5%
45 acts 2013

Mexico Retail Validation Study 2012
Participation Number of companies 25 The 2012 PMM validation study was at-
tended by 25 companies, twelve less than in 2011. The participants supplied 1,619 prod-uct forms for evaluation, of which 38 (2%) showed extreme deviation and had to be ex-cluded from the bias analysis. The validated market share of the participating manufac-turers was 35% in terms of units.
Validated market share 35% Number of R-Values 1,619 Number of extreme values 38
Over/Underestimation
The overall overestimation im-proved slightly from 1.6% in 2011 to 1.4% in 2012. Low sales volume products were underestimated by 0.1%, whereas the medium and high sales volume classes were overestimated by 0.6% and 2.0%, respectively.
Precision
The overall precision index im-proved slightly, from 90.4% in 2011 to 90.7% in 2012. The high sales volume group sur-passed this score at 93.9%. Low and medium sales volume products had precision results of 82.9% and 89.4%, respec-tively. Looking only at forms validated in both years, 2011 and 2012, the precision index improved slightly from 90.8% in 2011 to 91.3% in 2012.
Actions Update universe and sample Conduct distribution channel survey
0.0
-0.8 -0.8
1.6 1.4
-40
-30
-20
-10
0
10
20
2008 2009 2010 2011 2012
%
89.9 92.1 89.5 90.4 90.7
0
20
40
60
80
100
2008 2009 2010 2011 2012
%
±17.5% ±22.5%
46 acts 2013

Morocco Retail Validation Study 2012
Participation Number of companies 95 The 2012 LMPM validation study was at-
tended by 95 companies, 60 less than in 2011. The participants supplied 958 direct and indirect product forms for evaluation, of which only one (<1%) showed extreme de-viation and had to be excluded from the bias analysis. The validated market share of the participating manufacturers was 59% in terms of units.
Validated market share 59% Number of R-Values 958 Number of extreme values 1
Over/Underestimation
The overall underestimation improved from 2.2% in 2011 to 0.8% in 2012. Low and me-dium sales volume products were both underestimated by 0.7% and the high sales vol-ume class showed a 0.9% un-derestimation.
Precision
The overall precision index im-proved from 99.2% in 2011 to 99.6% in 2012. The high sales volume group surpassed this score at a perfect 100%. Low and medium sales volume products had precision results of 99.4% and 99.1%, respec-tively. Looking only at forms validated in both years, 2011 and 2012, the precision index improved from 98.9% in 2011 to 99.9% in 2012.
Actions No action required from the statistical point of view
-5.8 -1.4 -0.8 -2.2 -0.8
-40
-30
-20
-10
0
10
20
2008 2009 2010 2011 2012
%
92.2 95.2 96.9 99.2 99.6
0
20
40
60
80
100
2008 2009 2010 2011 2012
%
±17.5% ±22.5%
47 acts 2013
New Zealand Retail Validation Study 2012
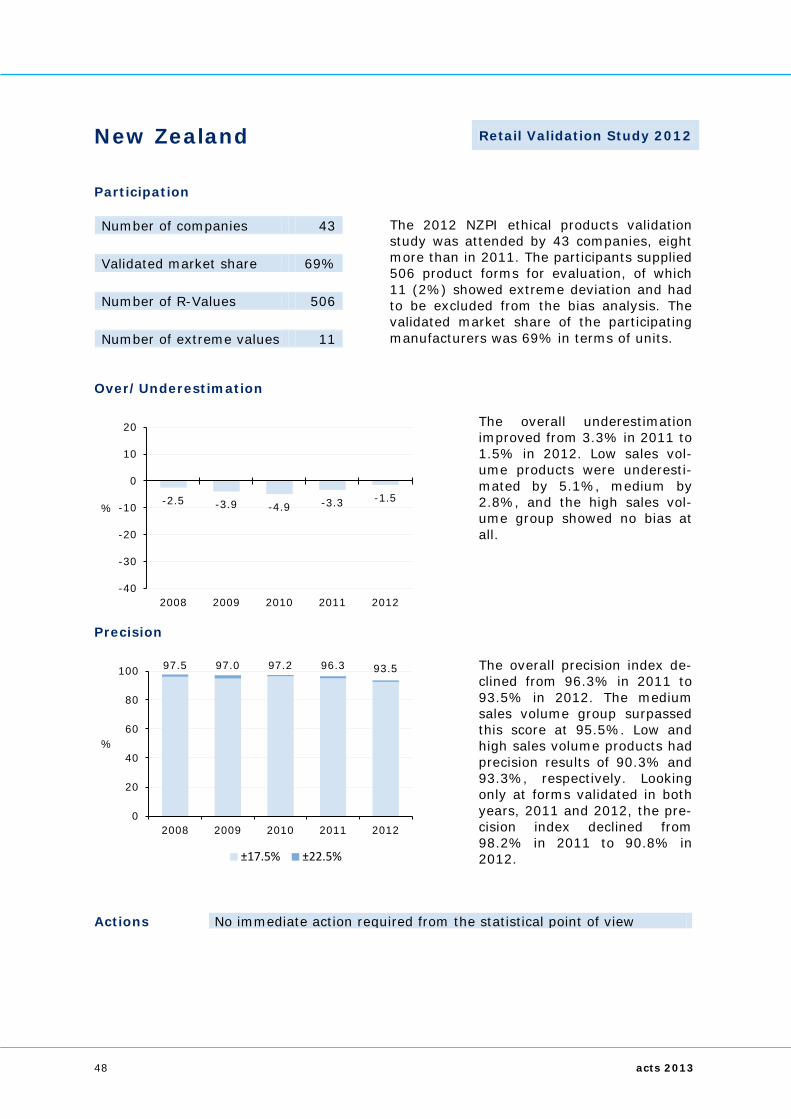
Participation Number of companies 43 The 2012 NZPI ethical products validation
study was attended by 43 companies, eight more than in 2011. The participants supplied 506 product forms for evaluation, of which 11 (2%) showed extreme deviation and had to be excluded from the bias analysis. The validated market share of the participating manufacturers was 69% in terms of units.
Validated market share 69% Number of R-Values 506 Number of extreme values 11
Over/Underestimation
The overall underestimation improved from 3.3% in 2011 to 1.5% in 2012. Low sales vol-ume products were underesti-mated by 5.1%, medium by 2.8%, and the high sales vol-ume group showed no bias at all.
Precision
The overall precision index de-clined from 96.3% in 2011 to 93.5% in 2012. The medium sales volume group surpassed this score at 95.5%. Low and high sales volume products had precision results of 90.3% and 93.3%, respectively. Looking only at forms validated in both years, 2011 and 2012, the pre-cision index declined from 98.2% in 2011 to 90.8% in 2012.
Actions No immediate action required from the statistical point of view
-2.5 -3.9 -4.9 -3.3 -1.5
-40
-30
-20
-10
0
10
20
2008 2009 2010 2011 2012
%
97.5 97.0 97.2 96.3 93.5
0
20
40
60
80
100
2008 2009 2010 2011 2012
%
±17.5% ±22.5%
48 acts 2013
Pakistan Retail Validation Study 2012
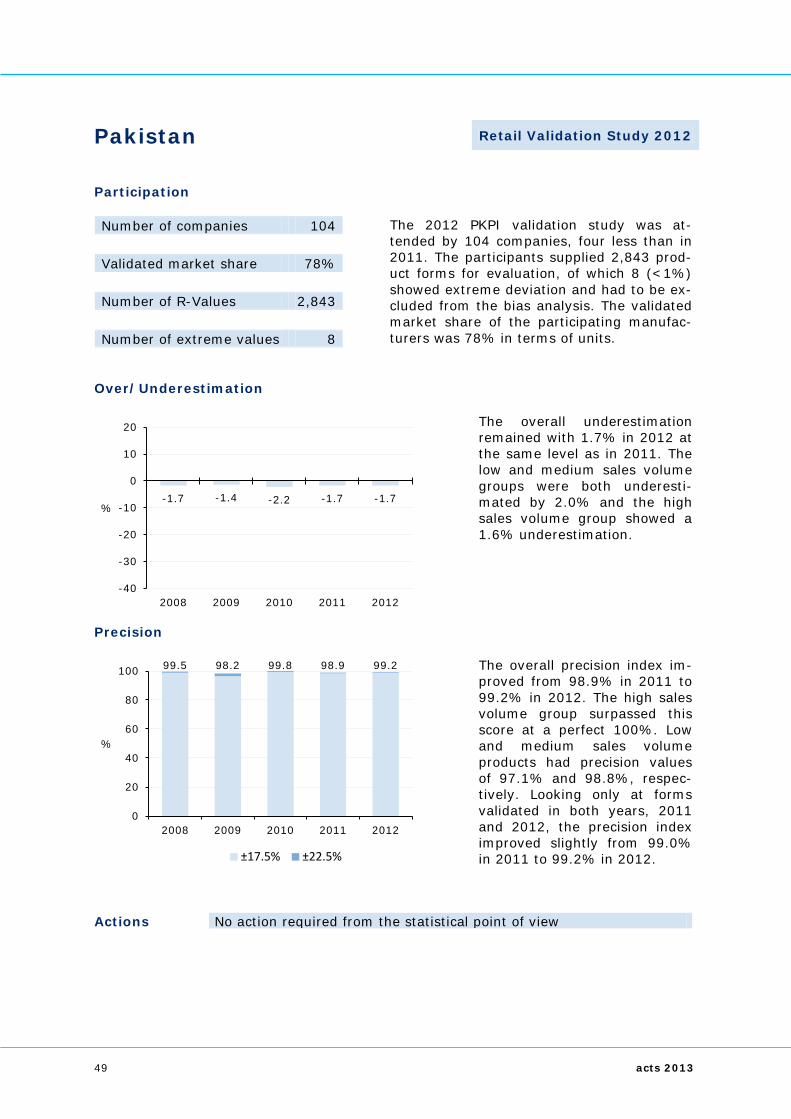
Participation Number of companies 104 The 2012 PKPI validation study was at-
tended by 104 companies, four less than in 2011. The participants supplied 2,843 prod-uct forms for evaluation, of which 8 (<1%) showed extreme deviation and had to be ex-cluded from the bias analysis. The validated market share of the participating manufac-turers was 78% in terms of units.
Validated market share 78% Number of R-Values 2,843 Number of extreme values 8
Over/Underestimation
The overall underestimation remained with 1.7% in 2012 at the same level as in 2011. The low and medium sales volume groups were both underesti-mated by 2.0% and the high sales volume group showed a 1.6% underestimation.
Precision
The overall precision index im-proved from 98.9% in 2011 to 99.2% in 2012. The high sales volume group surpassed this score at a perfect 100%. Low and medium sales volume products had precision values of 97.1% and 98.8%, respec-tively. Looking only at forms validated in both years, 2011 and 2012, the precision index improved slightly from 99.0% in 2011 to 99.2% in 2012.
Actions No action required from the statistical point of view
-1.7 -1.4 -2.2 -1.7 -1.7
-40
-30
-20
-10
0
10
20
2008 2009 2010 2011 2012
%
99.5 98.2 99.8 98.9 99.2
0
20
40
60
80
100
2008 2009 2010 2011 2012
%
±17.5% ±22.5%
49 acts 2013
Paraguay Retail Validation Study 2012
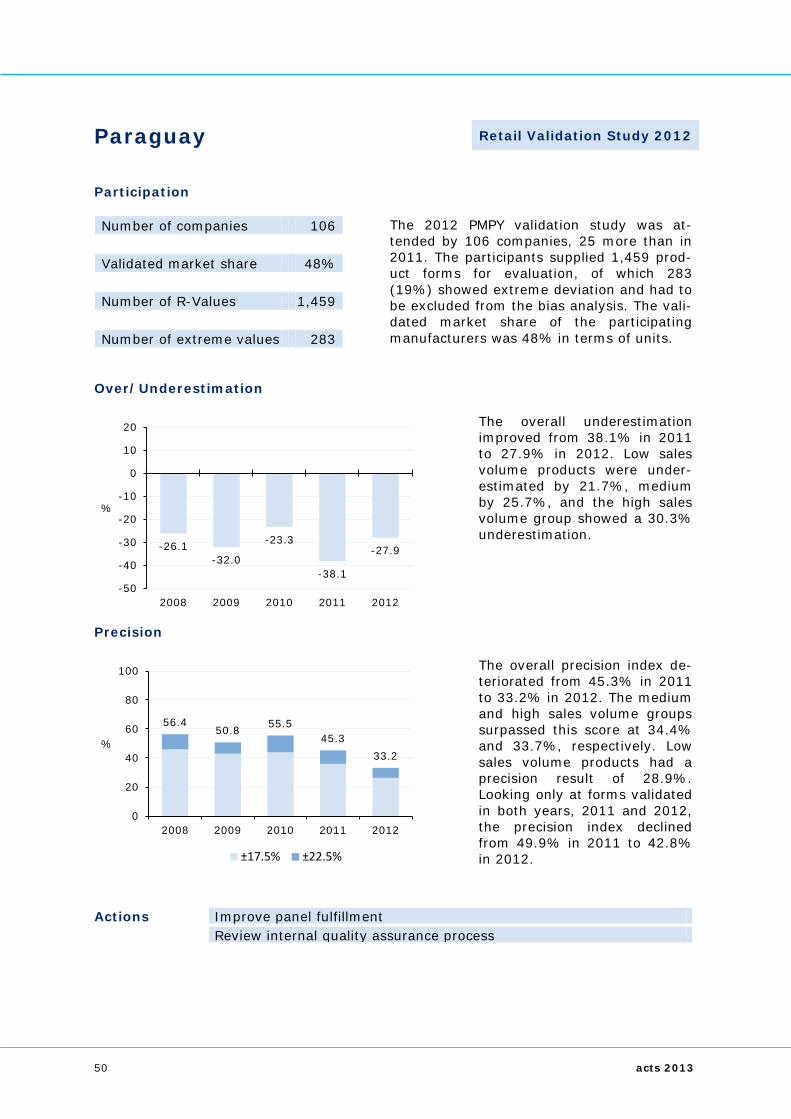
Participation Number of companies 106 The 2012 PMPY validation study was at-
tended by 106 companies, 25 more than in 2011. The participants supplied 1,459 prod-uct forms for evaluation, of which 283 (19%) showed extreme deviation and had to be excluded from the bias analysis. The vali-dated market share of the participating manufacturers was 48% in terms of units.
Validated market share 48% Number of R-Values 1,459 Number of extreme values 283
Over/Underestimation
The overall underestimation improved from 38.1% in 2011 to 27.9% in 2012. Low sales volume products were under-estimated by 21.7%, medium by 25.7%, and the high sales volume group showed a 30.3% underestimation.
Precision
The overall precision index de-teriorated from 45.3% in 2011 to 33.2% in 2012. The medium and high sales volume groups surpassed this score at 34.4% and 33.7%, respectively. Low sales volume products had a precision result of 28.9%. Looking only at forms validated in both years, 2011 and 2012, the precision index declined from 49.9% in 2011 to 42.8% in 2012.
Actions Improve panel fulfillment Review internal quality assurance process
-26.1 -32.0
-23.3
-38.1
-27.9
-50
-40
-30
-20
-10
0
10
20
2008 2009 2010 2011 2012
%
56.4 50.8 55.5
45.3 33.2
0
20
40
60
80
100
2008 2009 2010 2011 2012
%
±17.5% ±22.5%
50 acts 2013

Peru Retail Validation Study 2012
Participation Number of companies 14 The 2012 PMP validation study was attended
by 14 companies, 14 less than in 2011. The participants supplied 710 product forms for evaluation, of which 5 (<1%) showed ex-treme deviation and had to be excluded from the bias analysis. The validated market share of the participating manufacturers was 23% in terms of units.
Validated market share 23% Number of R-Values 710 Number of extreme values 5
Over/Underestimation
The overall underestimation in-creased from 9.2% in 2011 to 10.9% in 2012. Low sales vol-ume products were underesti-mated by 10.2%, medium by 9.4%, and the high sales vol-ume group showed an 11.9% underestimation.
Precision
The overall precision index im-proved from 94.1% in 2011 to 97.8% in 2012. The medium and high sales volume groups surpassed this score at 97.9% and 98.6%, respectively. Low sales volume products had a precision value of 94.8%. Looking only at forms validated in both years, 2011 and 2012, the precision index improved from 94.8% in 2011 to 98.2% in 2012.
Actions Conduct distribution channel survey in 2014 Motivate more companies to participate in the validation study
-3.4 -1.0
-10.0 -9.2 -10.9
-40
-30
-20
-10
0
10
20
2008 2009 2010 2011 2012
%
95.5
82.9 93.4 94.1 97.8
0
20
40
60
80
100
2008 2009 2010 2011 2012
%
±17.5% ±22.5%
51 acts 2013
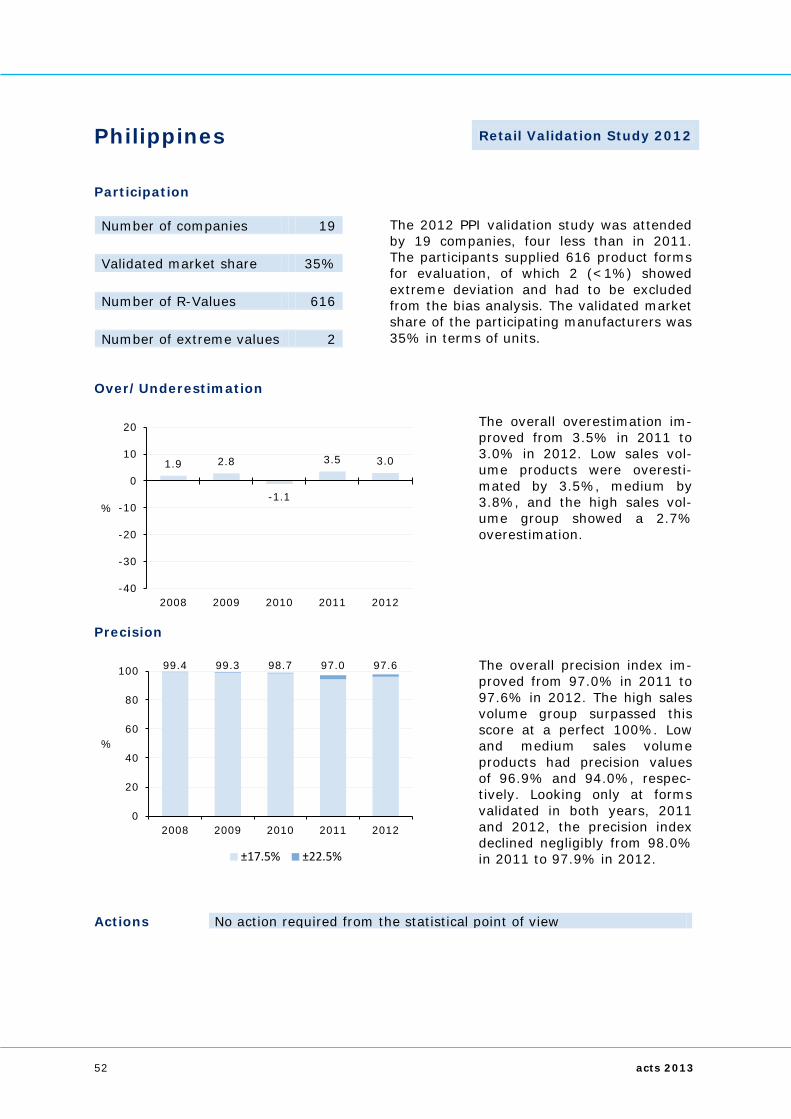
Philippines Retail Validation Study 2012
Participation Number of companies 19 The 2012 PPI validation study was attended
by 19 companies, four less than in 2011. The participants supplied 616 product forms for evaluation, of which 2 (<1%) showed extreme deviation and had to be excluded from the bias analysis. The validated market share of the participating manufacturers was 35% in terms of units.
Validated market share 35% Number of R-Values 616 Number of extreme values 2
Over/Underestimation
The overall overestimation im-proved from 3.5% in 2011 to 3.0% in 2012. Low sales vol-ume products were overesti-mated by 3.5%, medium by 3.8%, and the high sales vol-ume group showed a 2.7% overestimation.
Precision
The overall precision index im-proved from 97.0% in 2011 to 97.6% in 2012. The high sales volume group surpassed this score at a perfect 100%. Low and medium sales volume products had precision values of 96.9% and 94.0%, respec-tively. Looking only at forms validated in both years, 2011 and 2012, the precision index declined negligibly from 98.0% in 2011 to 97.9% in 2012.
Actions No action required from the statistical point of view
1.9 2.8
-1.1
3.5 3.0
-40
-30
-20
-10
0
10
20
2008 2009 2010 2011 2012
%
99.4 99.3 98.7 97.0 97.6
0
20
40
60
80
100
2008 2009 2010 2011 2012
%
±17.5% ±22.5%
52 acts 2013

Poland Retail+Hospital Validation Study 2012
Participation Number of companies 90 The 2012 validation study, combining the
Polish retail and hospital audits, was at-tended by 90 companies, eight more than in 2011. The participants supplied 1,383 prod-uct forms for evaluation, of which 20 (1%) showed extreme deviation and had to be ex-cluded from the bias analysis. The validated market share of the participating manufac-turers was 39% in terms of units.
Validated market share 39% Number of R-Values 1,383 Number of extreme values 20
Over/Underestimation
The overall overestimation im-proved by 3.2 percentage points, from 4.7% in 2011 to 1.5% in 2012. Low sales vol-ume products were overesti-mated by 0.9%, medium by 1.1%, and the high sales vol-ume group showed a 2.0% overestimation.
Precision
The overall precision index de-clined slightly from 96.6% in 2011 to 95.6% in 2012. The high sales volume group sur-passed this score at 97.4%. Low and medium sales volume products had precision values of 91.6% and 94.6%, respec-tively. Looking only at forms validated in both years, 2011 and 2012, the precision index declined slightly from 96.4% in 2011 to 95.2% in 2012.
Actions Rework local parallel trade algorithm
Replace hospital panel by pooling data to efficiently capture direct data
0.4 1.8 2.5 4.7 1.5
-40
-30
-20
-10
0
10
20
2008 2009 2010 2011 2012
%
93.7 95.8 93.6 96.6 95.6
0
20
40
60
80
100
2008 2009 2010 2011 2012
%
±17.5% ±22.5%
53 acts 2013

Portugal Retail Validation Study 2012
Participation Number of companies 30 The 2012 IFP validation study was attended
by 30 companies, seven less than in 2011. The participants supplied 784 product forms for evaluation, of which only one (<1%) showed extreme deviation and had to be ex-cluded from the bias analysis. The validated market share of the participating manufac-turers was 29% in terms of units.
Validated market share 29% Number of R-Values 784 Number of extreme values 1
Over/Underestimation
The overall underestimation improved from 3.0% in 2011 to 0.8% in 2012. Medium and high sales volume products were underestimated by 1.5% and 0.7%, respectively, where-as the low sales volume group showed a slight overestimation of 1.3%.
Precision
The overall precision index de-clined slightly from 98.4% in 2011 to 98.0% in 2012. The medium and high sales volume groups surpassed this score at 98.1% and 98.5%, respec-tively. Low sales volume prod-ucts had a precision result of 96.2%. Looking only at forms validated in both years, 2011 and 2012, the precision index declined slightly from 98.9% in 2011 to 98.3% in 2012.
Actions No action required from the statistical point of view
-3.0 -2.2 -3.5 -3.0 -0.8
-40
-30
-20
-10
0
10
20
2008 2009 2010 2011 2012
%
85.2 96.4 96.8 98.4 98.0
0
20
40
60
80
100
2008 2009 2010 2011 2012
%
±17.5% ±22.5%
54 acts 2013

Saudi Arabia Retail Validation Study 2012
Participation Number of companies 48 The 2012 SAPI validation study was at-
tended by 48 companies, two less than in 2011. The participants supplied 726 product forms for evaluation, none of which showed any extreme deviation. The validated market share of the participating manufacturers was 53% in terms of units.
Validated market share 53% Number of R-Values 726 Number of extreme values 0
Over/Underestimation
The overall overestimation in-creased slightly by 0.3 per-centage points, from 2.1% in 2011 to 2.4% in 2012. Low sales volume products were overestimated by 3.3%, me-dium by 2.5%, and the high sales volume group showed a 2.1% overestimation.
Precision
The overall precision index re-mained with a perfect 100% in 2012 at the same excellent level as in previous years. Also all volume size classes reached 100%. Looking only at forms validated in both years, 2011 and 2012, the precision index remained at 100%.
Actions No action required from the statistical point of view
1.7 1.2 1.6 2.1 2.4
-40
-30
-20
-10
0
10
20
2008 2009 2010 2011 2012
%
99.9 100.0 100.0 100.0 100.0
0
20
40
60
80
100
2008 2009 2010 2011 2012
%
±17.5% ±22.5%
55 acts 2013

Serbia Retail Validation Study 2012
Participation Number of companies 21 The 2012 validation study, combining the
Serbian retail and hospital audits, was at-tended by 21 companies, six more than in 2011. The participants supplied 478 product forms for evaluation, of which 13 (3%) showed extreme deviation and had to be ex-cluded from the bias calculation. The vali-dated market share of the participating manufacturers was 57% in terms of units.
Validated market share 57% Number of R-Values 478 Number of extreme values 13
Over/Underestimation
The overall underestimation improved strongly, from 17.1% in 2011 to 6.2% in 2012. Low sales volume products were underestimated by 11.3%, me-dium by 8.7%, and the high sales volume group showed a 3.7% underestimation.
Precision
The overall precision index de-clined from 86.7% in 2011 to 84.0% in 2012. The high sales volume group surpassed this score at 88.5%. Low and me-dium sales volume products had precision results of 79.2% and 79.0%, respectively. Looking only at forms validated in both years, 2011 and 2012, the precision index declined from 89.4% in 2011 to 87.0% in 2012.
Actions Include additional data sources to improve market coverage
-17.1
-6.2
-40
-30
-20
-10
0
10
20
2008 2009 2010 2011 2012
%
86.7 84.0
0
20
40
60
80
100
2008 2009 2010 2011 2012
%
±17.5% ±22.5%
56 acts 2013

Singapore Retail Validation Study 2012
Participation Number of companies 49 Data from 49 companies, one less than in
2011, was available for the 2012 SPA vali-dation study. In total, 2,035 product forms were processed, of which 225 (11%) showed extreme deviation and had to be ex-cluded from the bias analysis. The validated market share equaled 38% in terms of units.
Validated market share 38% Number of R-Values 2,035 Number of extreme values 225
Over/Underestimation
The overall underestimation in-creased further to 6.9% in 2012. Low sales volume prod-ucts were underestimated by 10.6%, medium by 9.5%, and the high sales volume group showed a 4.2% underestima-tion.
Precision
The overall precision index im-proved from 72.2% in 2011 to 74.0% in 2012. The low and medium sales volume groups surpassed this score at 74.2% and 75.7%, respectively. High sales volume products had a precision value of 72.9%. Looking only at forms validated in both years, 2011 and 2012, the precision index declined from 77.2% in 2011 to 75.5% in 2012.
Actions Review projection level and panel composition
-1.4 -3.1 -4.0 -6.3 -6.9
-40
-30
-20
-10
0
10
20
2008 2009 2010 2011 2012
%
63.7 66.8 68.4 72.2 74.0
0
20
40
60
80
100
2008 2009 2010 2011 2012
%
±17.5% ±22.5%
57 acts 2013
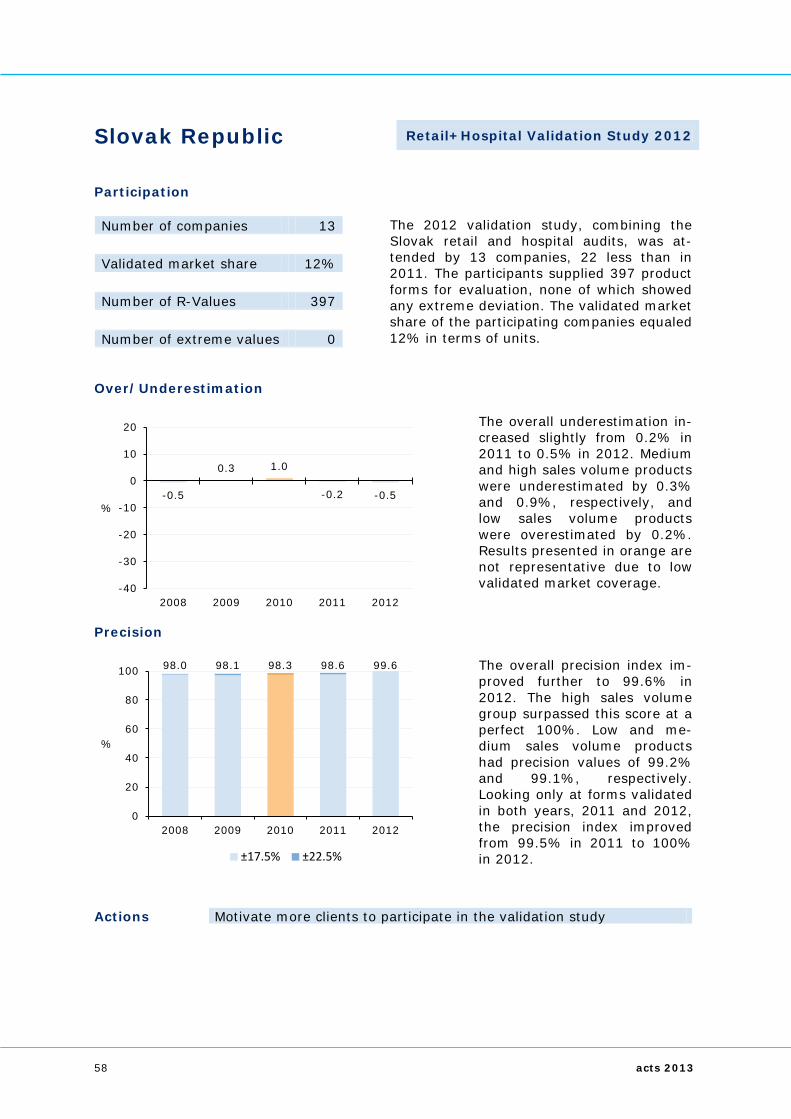
Slovak Republic Retail+Hospital Validation Study 2012
Participation Number of companies 13 The 2012 validation study, combining the
Slovak retail and hospital audits, was at-tended by 13 companies, 22 less than in 2011. The participants supplied 397 product forms for evaluation, none of which showed any extreme deviation. The validated market share of the participating companies equaled 12% in terms of units.
Validated market share 12% Number of R-Values 397 Number of extreme values 0
Over/Underestimation
The overall underestimation in-creased slightly from 0.2% in 2011 to 0.5% in 2012. Medium and high sales volume products were underestimated by 0.3% and 0.9%, respectively, and low sales volume products were overestimated by 0.2%. Results presented in orange are not representative due to low validated market coverage.
Precision
The overall precision index im-proved further to 99.6% in 2012. The high sales volume group surpassed this score at a perfect 100%. Low and me-dium sales volume products had precision values of 99.2% and 99.1%, respectively. Looking only at forms validated in both years, 2011 and 2012, the precision index improved from 99.5% in 2011 to 100% in 2012.
Actions Motivate more clients to participate in the validation study
-0.5
0.3 1.0
-0.2 -0.5
-40
-30
-20
-10
0
10
20
2008 2009 2010 2011 2012
%
98.0 98.1 98.3 98.6 99.6
0
20
40
60
80
100
2008 2009 2010 2011 2012
%
±17.5% ±22.5%
58 acts 2013

Slovenia Retail+Hospital Validation Study 2012
Participation Number of companies 5 The 2012 validation study, combining the
Slovenian retail and hospital audits, was at-tended by 5 companies that supplied 141 product forms for evaluation, of which only one had extreme deviation and was ex-cluded from the bias analysis. The validated market share of the participants was only 6% in unit terms and, therefore, not repre-sentative for the entire audit.
Validated market share 6% Number of R-Values 141 Number of extreme values 1
Over/Underestimation
The overall underestimation in-creased slightly from 0.2% in 2011 to 0.5% in 2012. Low sales volume products were underestimated by 1.6% and medium by 0.1%. As there were only few forms available in the high sales volume class, these were grouped into the medium class for analysis. Re-sults presented in orange are not representative due to low validation coverage.
Precision
The overall precision index im-proved from 97.0% in 2011 to 99.6% in 2012. The medium sales volume class surpassed this score at a perfect 100%. Low sales volume products had a precision value of 99.0%. Looking only at forms validated in both years, 2011 and 2012, the precision index remained stable at 100%.
Actions Motivate more companies to participate in the validation study
-0.2 -0.5
-40
-30
-20
-10
0
10
20
2008 2009 2010 2011 2012
%
97.0 99.6
0
20
40
60
80
100
2008 2009 2010 2011 2012
%
±17.5% ±22.5%
59 acts 2013

Spain Retail Validation Study 2012
Participation Number of companies 24 The 2012 EMF validation study was attended
by 24 companies, four less than in 2011. The participants supplied 682 product forms for evaluation, of which 7 (1%) showed ex-treme deviation and had to be excluded from the bias analysis. The validated market share of the participating manufacturers was 18% in terms of units.
Validated market share 18% Number of R-Values 682 Number of extreme values 7
Over/Underestimation
The overall overestimation in-creased from 0.4% in 2011 to 3.4% in 2012. Low sales vol-ume products were overesti-mated by 2.4%, medium by 3.2%, and the high sales vol-ume group showed a 3.7% overestimation.
Precision
The overall precision index im-proved from 96.7% in 2011 to 97.8% in 2012. The high sales volume group surpassed this score at a perfect 100%. Low and medium sales volume products had precision values of 93.9% and 96.1%, respec-tively. Looking only at forms validated in both years, 2011 and 2012, the precision index declined slightly from 98.5% in 2011 to 97.2% in 2012.
Actions No action required from the statistical point of view
1.8
-0.1
1.8 0.4 3.4
-40
-30
-20
-10
0
10
20
2008 2009 2010 2011 2012
%
97.1 96.4 97.3 96.7 97.8
0
20
40
60
80
100
2008 2009 2010 2011 2012
%
±17.5% ±22.5%
60 acts 2013
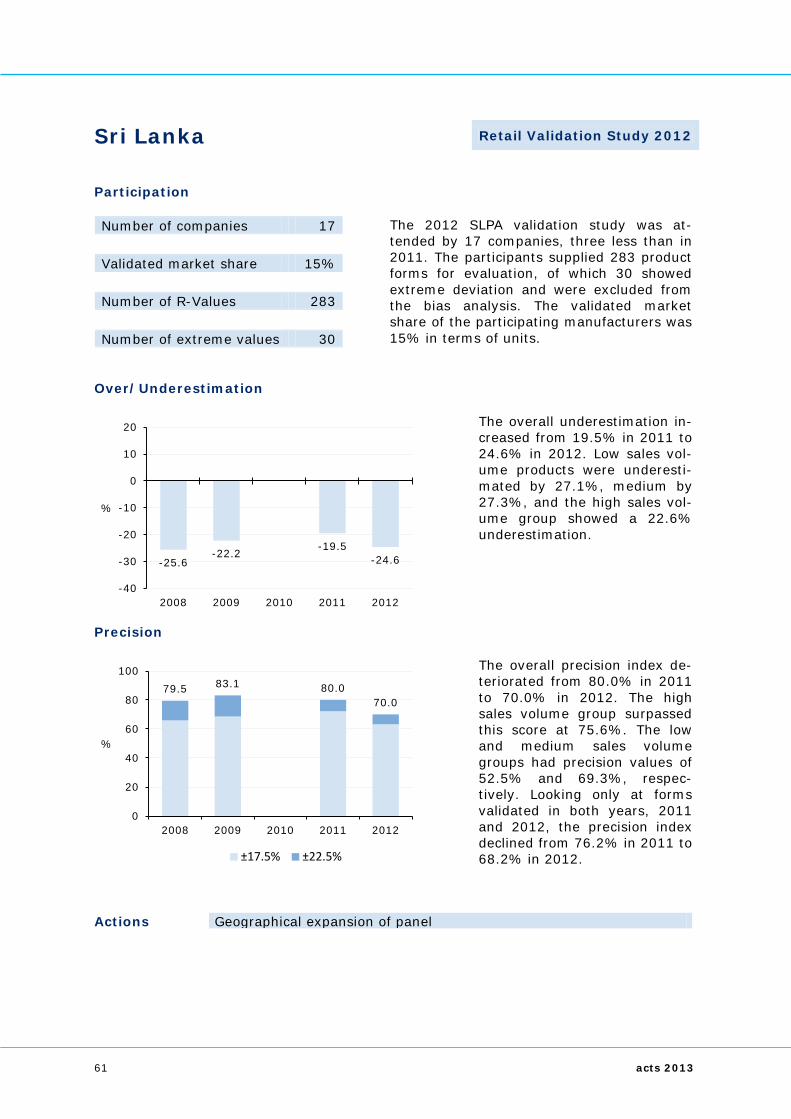
Sri Lanka Retail Validation Study 2012
Participation Number of companies 17 The 2012 SLPA validation study was at-
tended by 17 companies, three less than in 2011. The participants supplied 283 product forms for evaluation, of which 30 showed extreme deviation and were excluded from the bias analysis. The validated market share of the participating manufacturers was 15% in terms of units.
Validated market share 15% Number of R-Values 283 Number of extreme values 30
Over/Underestimation
The overall underestimation in-creased from 19.5% in 2011 to 24.6% in 2012. Low sales vol-ume products were underesti-mated by 27.1%, medium by 27.3%, and the high sales vol-ume group showed a 22.6% underestimation.
Precision
The overall precision index de-teriorated from 80.0% in 2011 to 70.0% in 2012. The high sales volume group surpassed this score at 75.6%. The low and medium sales volume groups had precision values of 52.5% and 69.3%, respec-tively. Looking only at forms validated in both years, 2011 and 2012, the precision index declined from 76.2% in 2011 to 68.2% in 2012.
Actions Geographical expansion of panel
-25.6 -22.2
-19.5 -24.6
-40
-30
-20
-10
0
10
20
2008 2009 2010 2011 2012
%
79.5 83.1 80.0 70.0
0
20
40
60
80
100
2008 2009 2010 2011 2012
%
±17.5% ±22.5%
61 acts 2013

Switzerland Retail Validation Study 2012
Participation Number of companies 30 The 2012 APO/SD/DRO validation study was
attended by 30 companies, 24 less than in 2011. The participants supplied 1,489 prod-uct forms for evaluation, of which 5 (<1%) showed extreme deviation and had to be ex-cluded from the bias analysis. The validated market share of the participating manufac-turers was 45% in terms of units.
Validated market share 45% Number of R-Values 1,489 Number of extreme values 5
Over/Underestimation
The overall underestimation improved from 1.2% in 2011 to 0.1% in 2012. Low sales vol-ume products were underesti-mated by 0.2%, high by 0.1%, and the medium sales volume class showed no bias at all.
Precision
The overall precision index im-proved from 97.3% in 2011 to 98.7% in 2012. The high sales volume group surpassed this score at 99.2%. Low and me-dium sales volume products had precision values of 97.5% and 98.4%, respectively. Looking only at forms validated in both years, 2011 and 2012, the precision index improved from 97.2% in 2011 to 98.8% in 2012.
Actions No action required from the statistical point of view
0.0
-0.4
0.2
-1.2 -0.1
-40
-30
-20
-10
0
10
20
2008 2009 2010 2011 2012
%
97.3 98.0 97.3 97.3 98.7
0
20
40
60
80
100
2008 2009 2010 2011 2012
%
±17.5% ±22.5%
62 acts 2013

Thailand Retail Validation Study 2012
Participation Number of companies 47 Data from 47 companies, three more than in
2011, was available for the 2012 TLPI vali-dation study. In total, 999 product forms were processed, of which 46 (5%) showed extreme deviation and had to be excluded from the bias analysis. The validated market share equaled 35% in terms of units.
Validated market share 35% Number of R-Values 999 Number of extreme values 46
Over/Underestimation
The overall underestimation in-creased slightly by 0.3 per-centage points, from 5.8% in 2011 to 6.1% in 2012. Low sales volume products were underestimated by 5.5%, me-dium by 7.2%, and the high sales volume group showed a 5.7% underestimation.
Precision
The overall precision index im-proved slightly by 0.5 percent-age points, from 89.3% in 2011 to 89.8% in 2012. The high sales volume group sur-passed this score at 91.8%. Low and medium sales volume products had precision values of 85.6% and 88.6%, respec-tively.
Actions Review panel composition
-6.1 -5.0 -5.7 -5.8 -6.1
-40
-30
-20
-10
0
10
20
2008 2009 2010 2011 2012
%
90.0 90.6 91.3 89.3 89.8
0
20
40
60
80
100
2008 2009 2010 2011 2012
%
±17.5% ±22.5%
63 acts 2013

Tunisia Retail Validation Study 2012
Participation Number of companies 22 The 2012 LMPT validation study was at-
tended by 22 companies, five less than in 2011. The participants supplied 571 product forms for evaluation, none of which showed any extreme deviation. The validated market share of the participating manufacturers was 45% in terms of units.
Validated market share 45% Number of R-Values 571 Number of extreme values 0
Over/Underestimation
The overall underestimation in-creased slightly from 1.1% in 2011 to 2.3% in 2012. Low sales volume products were underestimated by 2.6%, me-dium by 0.6%, and the high sales volume class showed a 3.1% underestimation.
Precision
The overall precision index showed slight improvement, from 96.8% in 2011 to 97.1% in 2012. The high sales volume class surpassed this score at 98.9%. Low and medium sales volume products had precision results of 94.5% and 95.3%, respectively. Looking only at forms validated in both years, 2011 and 2012, the precision index improved slightly from 97.2% in 2011 to 97.3% in 2012.
Actions No action required from the statistical point of view
-11.9 -8.3
-2.4 -1.1 -2.3
-40
-30
-20
-10
0
10
20
2008 2009 2010 2011 2012
%
97.1 96.5 96.4 96.8 97.1
0
20
40
60
80
100
2008 2009 2010 2011 2012
%
±17.5% ±22.5%
64 acts 2013

Turkey Retail Validation Study 2012
Participation Number of companies 54 The 2012 TPI validation study was attended
by 54 companies, 20 more than in 2011. The participants supplied 1,241 product forms for evaluation, none of which showed any extreme deviation. The validated market share of the participating manufacturers was 55% in terms of units.
Validated market share 55% Number of R-Values 1,241 Number of extreme values 0
Over/Underestimation
The overall underestimation in-creased slightly from 1.0% in 2011 to 1.6% in 2012. Low sales volume products were underestimated by 1.9%, me-dium by 1.5%, and the high sales volume class showed a 1.6% underestimation.
Precision
The overall precision index re-turned to an excellent 100% in 2012. This perfect value was also reached in all sales volume groups. Looking only at forms validated in both years, 2011 and 2012, the precision index improved from 99.7% in 2011 to 100% in 2012.
Actions No action required from the statistical point of view
-1.4 -0.6 -0.5 -1.0 -1.6
-40
-30
-20
-10
0
10
20
2008 2009 2010 2011 2012
%
100.0 100.0 100.0 99.7 100.0
0
20
40
60
80
100
2008 2009 2010 2011 2012
%
±17.5% ±22.5%
65 acts 2013

United Arab Emirates Retail Validation Study 2012
Participation Number of companies 37 The 2012 UAEP validation study was at-
tended by 37 companies, seven more than in 2011. The participants supplied 936 prod-uct forms for evaluation, of which only one (<1%) showed extreme deviation and had to be excluded from the bias analysis. The validated market share of the participating manufacturers was 62% in terms of units.
Validated market share 62% Number of R-Values 936 Number of extreme values 1
Over/Underestimation
The overall underestimation in-creased slightly from 0.5% in 2011 to 0.8% in 2012. Low sales volume products were underestimated by 0.8%, me-dium by 0.3%, and the high sales volume group showed a 0.9% underestimation.
Precision
The overall precision index im-proved from 99.0% in 2011 to 99.8% in 2012. The medium and high sales volume groups both surpassed this score at a perfect 100%. Low sales vol-ume products had a precision result of 98.5%. Looking only at forms validated in both years, 2011 and 2012, the pre-cision index improved from 99.4% in 2011 to 99.8% in 2012.
Actions No action required from the statistical point of view
-0.7
0.1
-1.9 -0.5 -0.8
-40
-30
-20
-10
0
10
20
2008 2009 2010 2011 2012
%
99.5 98.0 97.7 99.0 99.8
0
20
40
60
80
100
2008 2009 2010 2011 2012
%
±17.5% ±22.5%
66 acts 2013
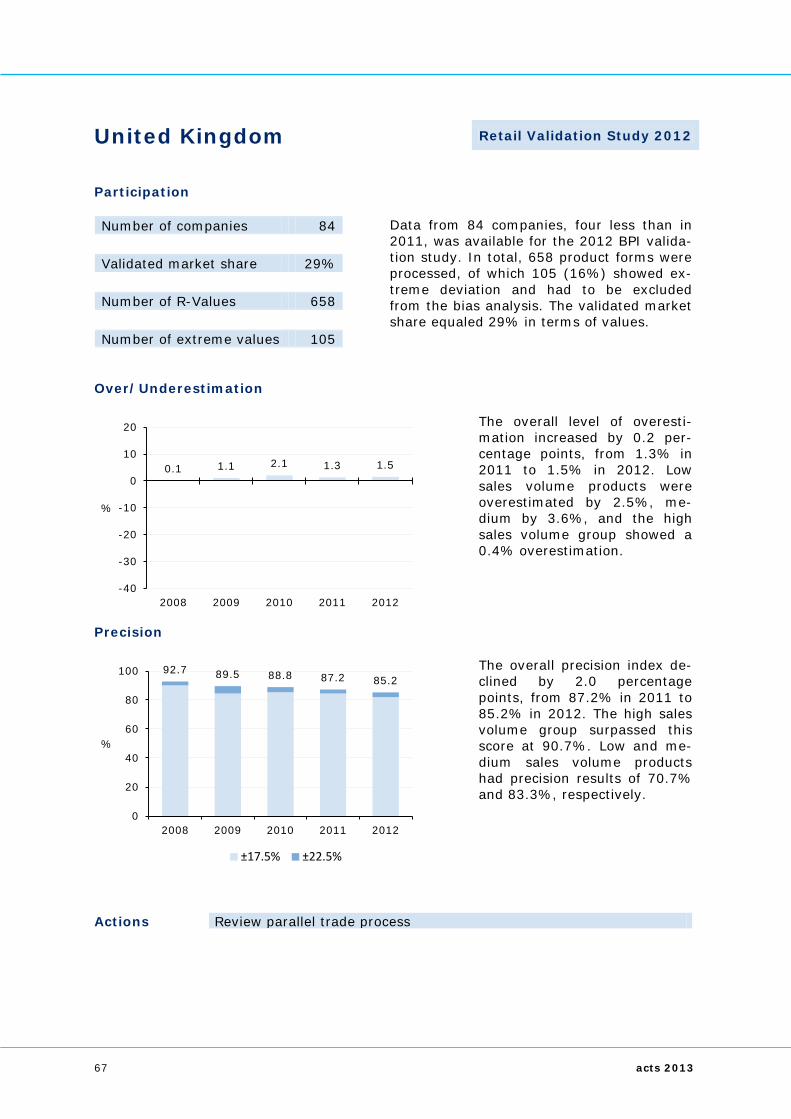
United Kingdom Retail Validation Study 2012
Participation Number of companies 84 Data from 84 companies, four less than in
2011, was available for the 2012 BPI valida-tion study. In total, 658 product forms were processed, of which 105 (16%) showed ex-treme deviation and had to be excluded from the bias analysis. The validated market share equaled 29% in terms of values.
Validated market share 29% Number of R-Values 658 Number of extreme values 105
Over/Underestimation
The overall level of overesti-mation increased by 0.2 per-centage points, from 1.3% in 2011 to 1.5% in 2012. Low sales volume products were overestimated by 2.5%, me-dium by 3.6%, and the high sales volume group showed a 0.4% overestimation.
Precision
The overall precision index de-clined by 2.0 percentage points, from 87.2% in 2011 to 85.2% in 2012. The high sales volume group surpassed this score at 90.7%. Low and me-dium sales volume products had precision results of 70.7% and 83.3%, respectively.
Actions Review parallel trade process
0.1 1.1 2.1 1.3 1.5
-40
-30
-20
-10
0
10
20
2008 2009 2010 2011 2012
%
92.7 89.5 88.8 87.2 85.2
0
20
40
60
80
100
2008 2009 2010 2011 2012
%
±17.5% ±22.5%
67 acts 2013

Uruguay Retail Validation Study 2012
Participation Number of companies 15 The 2012 validation study, combining the
Uruguayan retail and mutuales audits, was attended by 15 companies, four less than in 2011. The participants supplied 1,156 prod-uct forms for evaluation, of which 155 (13%) showed extreme deviation and had to be excluded from the bias analysis. The vali-dated market share of the participating manufacturers was 50% in terms of units.
Validated market share 50% Number of R-Values 1,156 Number of extreme values 155
Over/Underestimation
The overall underestimation in-creased from 4.4% in 2011 to 6.1% in 2012. Low sales vol-ume products were underesti-mated by 9.2%, medium by 5.9%, and the high sales vol-ume group showed a 5.5% un-derestimation.
Precision
The overall precision index showed slight decline, from 69.6% in 2011 to 67.6% in 2012. The high sales volume group surpassed this score at 68.8%. Low and medium sales volume products had precision values of 63.8% and 67.5%, respectively. Looking only at forms validated in both years, 2011 and 2012, the precision index improved from 72.3% in 2011 to 74.2% in 2012.
Actions Increase participation in distribution channel survey Review internal quality assurance process
-1.0
2.2
-4.1 -4.4 -6.1
-40
-30
-20
-10
0
10
20
2008 2009 2010 2011 2012
%
63.4 58.7 69.7 69.6 67.6
0
20
40
60
80
100
2008 2009 2010 2011 2012
%
±17.5% ±22.5%
68 acts 2013

USA Retail+Hospital Validation Study 2012
Participation Number of companies 58 Data from 58 companies, three less than in
2011, was available for the 2012 NSP vali-dation study. In total, 1,114 product forms were processed, of which 44 (4%) showed extreme deviation and had to be excluded from the bias analysis. The validated market share equaled 12% in terms of units.
Validated market share 12% Number of R-Values 1,114 Number of extreme values 44
Over/Underestimation
The overall level of underesti-mation improved slightly, from 3.0% in 2011 to 2.8% in 2012. Low sales volume products were underestimated by 6.1%, medium by 3.3%, and the high sales volume class showed a 1.2% underestimation.
Precision
The overall precision index de-clined from 94.4% in 2011 to 92.5% in 2012. The high sales volume group surpassed this score at 98.0%. Low and me-dium sales volume products had precision values of 86.4% and 86.3%, respectively. Looking only at forms validated in both years, 2011 and 2012, the precision index remained stable at 94.0%.
Actions No immediate action required from the statistical point of view
-1.2 -1.3 -2.8 -3.0 -2.8
-40
-30
-20
-10
0
10
20
2008 2009 2010 2011 2012
%
94.1 94.4 93.3 94.4 92.5
0
20
40
60
80
100
2008 2009 2010 2011 2012
%
±17.5% ±22.5%
69 acts 2013

Venezuela Retail Validation Study 2012
Participation Number of companies 45 The 2012 PMV validation study was attended
by 45 companies, 33 less than in 2011. The participants supplied 1,246 product forms for evaluation, of which 5 (<1%) showed extreme deviation and had to be excluded from the bias analysis. The validated market share of the participating manufacturers was 37% in terms of units.
Validated market share 37% Number of R-Values 1,246 Number of extreme values 5
Over/Underestimation
The overall underestimation in-creased from 0.3% in 2011 to 2.5% in 2012. Low sales vol-ume products were underesti-mated by 1.9%, medium by 1.4%, and the high sales vol-ume class showed a 3.2% un-derestimation.
Precision
The overall precision index im-proved from 94.4% in 2011 to 96.5% in 2012. The medium and high sales volume groups surpassed this score at 96.8% and 97.2%, respectively. Low sales volume products had a precision value of 93.8%. Looking only at forms validated in both years, 2011 and 2012, the precision index improved from 94.4% in 2011 to 97.3% in 2012.
Actions Conduct distribution channel survey in 2014
-0.4 -3.0 -2.2 -0.3 -2.5
-40
-30
-20
-10
0
10
20
2008 2009 2010 2011 2012
%
95.5 94.6 93.6 94.4 96.5
0
20
40
60
80
100
2008 2009 2010 2011 2012
%
±17.5% ±22.5%
70 acts 2013

Vietnam Retail+Hospital Validation Study 2012
Participation Number of companies 59 The 2012 validation study, combining the
Vietnamese retail and hospital audits, was attended by 59 companies, three less than in 2011. The participants supplied 632 prod-uct forms for evaluation, of which 70 (11%) showed extreme deviation and had to be ex-cluded from the bias analysis. The validated market share of the participating manufac-turers was 14% in terms of units.
Validated market share 14% Number of R-Values 632 Number of extreme values 70
Over/Underestimation
The overall underestimation improved from 45.3% in 2011 to 38.1% in 2012. Low sales volume products were underes-timated by 33.8%, medium by 34.2%, and the high sales vol-ume class turned out at 39.7% underestimation.
Precision
The overall precision index de-teriorated from 65.7% in 2011 to 53.6% in 2012. The high sales volume group surpassed this score at 56.1%. Low and medium sales volume products had precision results of 49.8% and 51.3%, respectively. Looking only at forms validated in both years, 2011 and 2012, the precision index declined from 67.2% in 2011 to 54.8% in 2012.
Actions Update retail and hospital universes Review hospital stratification Expand retail services to drugstore audit
-38.9 -44.4
-39.4 -45.3
-38.1
-60
-50
-40
-30
-20
-10
0
10
20
2008 2009 2010 2011 2012
%
66.5 62.5 66.3 65.7 53.6
0
20
40
60
80
100
2008 2009 2010 2011 2012
%
±17.5% ±22.5%
71 acts 2013

OTC Validation Studies Given the increasing importance of Over-The-Counter (OTC) markets, IMS regu-larly evaluates our accuracy measures for OTC products that are sub-groupings of the standard national retail or PharmaTrend services. These “sub-vali-dations” are made possible simply by re-stricting the national standard validation analysis for a clearly defined subset of products. Due to their small prescription
share, these products typically follow distinct distribution routes, and their consumption is more customer-driven than that of prescription-bound products. As a general rule, we find that a higher proportion of these products are sold directly from manufacturer to retail outlet so that IMS retail pharmacy samples have a higher impact on our ultimate audit estimates.
Global OTC Validation Results While in previous years we focused ex-clusively on IMS sell-in services as sub-offerings from our retail services portfo-lio, we in collaboration with the EPhMRA Consumer Health Committee changed our approach, now including also sell-out services in countries where they have become our standard OTC deliverable. For that purpose, five years of data got re-evaluated and summary statistics in this ACTS report are now a mix of met-rics originating from either sell-in or sell-out services.
For the 2012 OTC validation studies, 19 countries provided analyzable results. No validation study was necessary in Nor-way because we collect full census data in this country. There, precision results are assumed to be 100 percent. This makes a total of 20 sets of validation re-sults, of which 13 had uninterrupted five-year results. The overall degree of precision in IMS OTC reports is best de-scribed by an aggregated precision index for these 13 countries:
OTC Precision Index
The world-wide OTC precision index showed slight decline, from 93.3% in 2011 to 93.1% in 2012. Despite of this
small reduction, it demonstrates high-level stability well above the 90% mar-gin.
89.4 90.2 91.3 93.3 93.1
0
20
40
60
80
100
2008 2009 2010 2011 2012
%
72 acts 2013

OTC Precision Results by Country
IMPROVEMENT IN % DETERIORATION IN % COUNTRY 2011 2012 COUNTRY 2011 2012 Austria 90.8 93.0 Hungary 97.0 94.4 Bulgaria 90.7 94.1 Italy 98.6 87.8 Greece 45.8 92.1 Poland 81.3 75.9 Portugal 88.6 92.9 Spain 96.5 91.6
Four countries demonstrated significant improvement of more than two percent-age points over 2011. Remarkable growth of more than 46 percentage points is reported for Greece. Bulgaria improved by 3.4 percentage points and
Portugal by 4.3 percentage points. Four countries declined by more than two percentage points in 2012, most signifi-cantly Italy by more than 10 percentage points, followed by Poland with a 5.4 percentage point decline.
OTC Validation Results by Country The validation studies mentioned on the subsequent country pages refer to the IMS OTC reports.
73 acts 2013

Argentina OTC Validation Study 2012
Participation Number of companies 38 Data from 38 companies was available for
the 2012 validation of the OTC part of the PMA, two less than in 2011. In total, 405 product forms were processed, of which 24 (6%) showed extreme deviation and had to be excluded from the bias analysis. The vali-dated market share was 48% of the total OTC market in terms of units.
Validated market share 48% Number of R-Values 405 Number of extreme values 24
Over/Underestimation
The overall underestimation in-creased from 12.2% in 2011 to 15.8% in 2012. Low sales vol-ume products were underesti-mated by 14.9%, medium by 13.5%, and high sales volume products showed a 16.9% un-derestimation.
Precision
The overall precision index im-proved from 78.7% in 2011 to 80.0% in 2012. The medium and high sales volume groups surpassed this score at 81.5% and 80.8%, respectively. Low sales volume products had a precision value of 74.5%. Looking only at forms validated in both years, 2011 and 2012, the precision index improved from 82.0% in 2011 to 87.0% in 2012.
Actions Increase wholesaler panel with OTC-oriented wholesalers
-18.2 -13.3 -12.2
-15.8
-40
-30
-20
-10
0
10
20
2008 2009 2010 2011 2012
%
77.4 77.1 78.7 80.0
0
20
40
60
80
100
2008 2009 2010 2011 2012
%
±17.5% ±22.5%
74 acts 2013

Austria OTC Validation Study 2012
Participation Number of companies 84 Data from 84 companies was available for
the 2012 validation of the OTC part of PharmaTrend sell-out, one less than in 2011. In total, 467 product forms were pro-cessed, of which five (1%) showed extreme deviation and were excluded from the bias analysis. The validated market share was 89% of the total OTC market in terms of units.
Validated market share 89% Number of R-Values 467 Number of extreme values 5
Over/Underestimation
The overall bias turned from 4.4% underestimation in 2011 to a slight 0.8% overestimation in 2012. Low sales volume products were underestimated by 1.5%, medium by 0.5%, and the high sales volume group showed a 1.7% overes-timation.
Precision
The overall precision index im-proved from 90.8% in 2011 to 93.0% in 2012. Low sales vol-ume products surpassed this score at 94.7%. Medium and high sales volume products had precision results of 92.8% and 92.6%, respectively. Looking only at forms validated in both years, 2011 and 2012, the pre-cision index improved from 91.7% in 2011 to 92.8% in 2012.
Actions No action required from the statistical point of view
-1.4 -2.1 -3.9 -4.4
0.8
-40
-30
-20
-10
0
10
20
2008 2009 2010 2011 2012
%
93.0 92.2 92.3 90.8 93.0
0
20
40
60
80
100
2008 2009 2010 2011 2012
%
±17.5% ±22.5%
75 acts 2013

Belgium OTC Validation Study 2012
Participation Number of companies 4 Data from 4 companies (48 forms) was pro-
cessed for the 2012 validation of the OTC part of PharmaTrend sell-out, five compa-nies less than in 2010 when the last valida-tion survey was conducted. One form (2%) was excluded from the bias analysis due to extreme deviation. The validated market share was only 4% and, therefore, not rep-resentative for the entire audit.
Validated market share 4% Number of R-Values 48 Number of extreme values 1
Over/Underestimation
The overall underestimation improved by one percentage point, from 7.5% in 2010 to 6.5% in 2012. As there were only 48 products available for validation, no reasonable sep-aration into sales volume clas-ses was possible. Results pre-sented in orange are not repre-sentative due to low validated market coverage.
Precision
The overall precision index im-proved by 2.4 percentage points, from 91.4% in 2010 to 93.8% in 2012. Only sixteen product forms were validated in both years, 2010 and 2012, which is not sufficient to get a reliable picture on the accuracy of the “same product basket”.
Actions Motivate more companies to participate in the validation study
-1.8 -4.1 -7.5 -6.5
-40
-30
-20
-10
0
10
20
2008 2009 2010 2011 2012
%
98.0 89.3 91.4 93.8
0
20
40
60
80
100
2008 2009 2010 2011 2012
%
±17.5% ±22.5%
76 acts 2013

Brazil OTC Validation Study 2012
Participation Number of companies 19 Data from 19 multinational companies was
available for the 2012 validation of the OTC part of the PMB, two less than in 2011. In total, 319 product forms were processed, of which only one (<1%) showed extreme de-viation and had to be excluded from the bias analysis. The validated market share was 17% of the total OTC market in terms of units.
Validated market share 17% Number of R-Values 319 Number of extreme values 1
Over/Underestimation
The overall underestimation in-creased from 5.4% in 2011 to 9.2% in 2012. Low sales vol-ume products were underesti-mated by 11.4%, medium by 9.8%, and high sales volume products showed an 8.5% un-derestimation.
Precision
The overall precision index im-proved slightly, from 93.0% in 2011 to 93.3% in 2012. The high sales volume group sur-passed this score at 96.3%. Low and medium sales volume products had precision values of 86.0% and 91.9%, respec-tively. Looking only at forms validated in both years, 2011 and 2012, the precision index improved from 95.0% in 2011 to 99.4% in 2012.
Actions Conduct distribution channel survey in 2014
-1.6 -4.8 -6.2 -5.4
-9.2
-40
-30
-20
-10
0
10
20
2008 2009 2010 2011 2012
%
86.4 92.9 97.4 93.0 93.3
0
20
40
60
80
100
2008 2009 2010 2011 2012
%
±17.5% ±22.5%
77 acts 2013
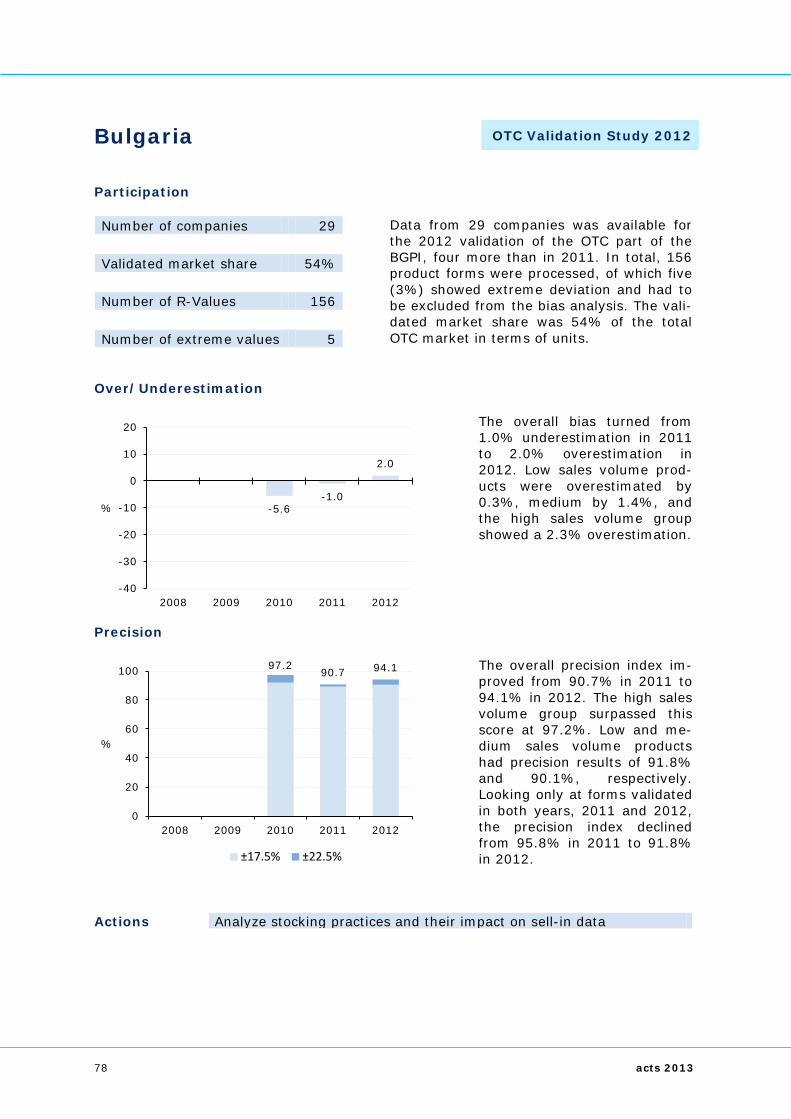
Bulgaria OTC Validation Study 2012
Participation Number of companies 29 Data from 29 companies was available for
the 2012 validation of the OTC part of the BGPI, four more than in 2011. In total, 156 product forms were processed, of which five (3%) showed extreme deviation and had to be excluded from the bias analysis. The vali-dated market share was 54% of the total OTC market in terms of units.
Validated market share 54% Number of R-Values 156 Number of extreme values 5
Over/Underestimation
The overall bias turned from 1.0% underestimation in 2011 to 2.0% overestimation in 2012. Low sales volume prod-ucts were overestimated by 0.3%, medium by 1.4%, and the high sales volume group showed a 2.3% overestimation.
Precision
The overall precision index im-proved from 90.7% in 2011 to 94.1% in 2012. The high sales volume group surpassed this score at 97.2%. Low and me-dium sales volume products had precision results of 91.8% and 90.1%, respectively. Looking only at forms validated in both years, 2011 and 2012, the precision index declined from 95.8% in 2011 to 91.8% in 2012.
Actions Analyze stocking practices and their impact on sell-in data
-5.6 -1.0
2.0
-40
-30
-20
-10
0
10
20
2008 2009 2010 2011 2012
%
97.2 90.7 94.1
0
20
40
60
80
100
2008 2009 2010 2011 2012
%
±17.5% ±22.5%
78 acts 2013
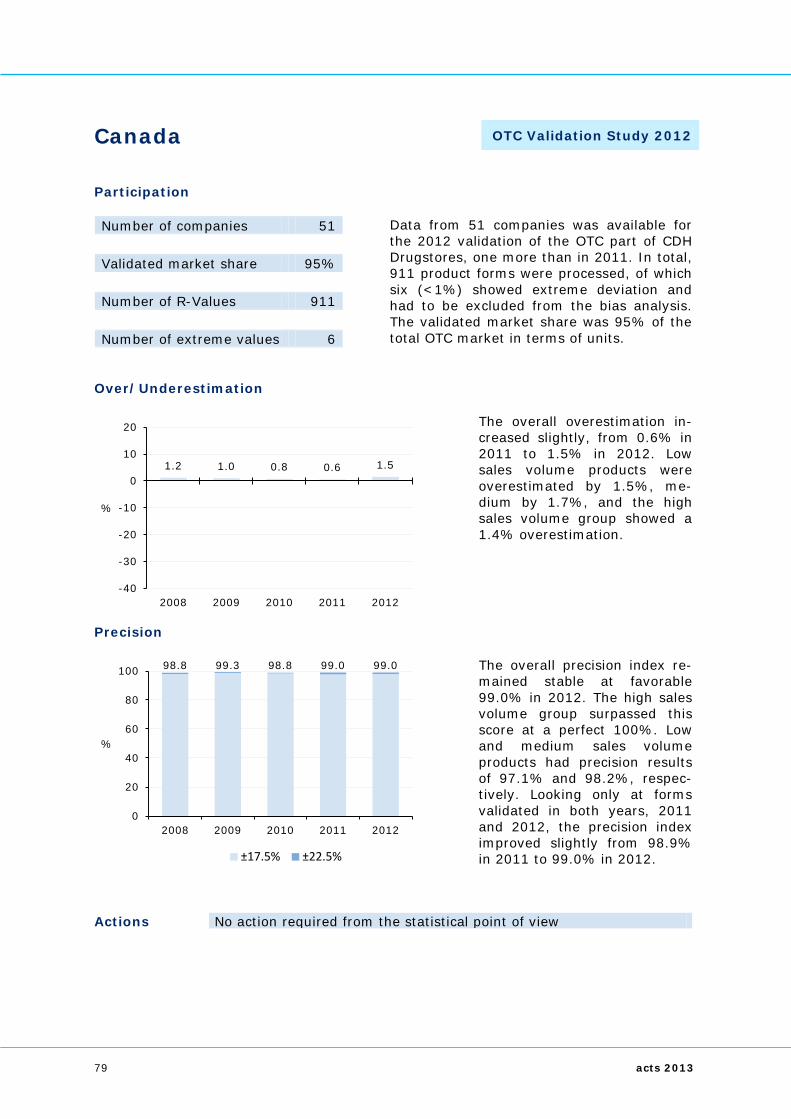
Canada OTC Validation Study 2012
Participation Number of companies 51 Data from 51 companies was available for
the 2012 validation of the OTC part of CDH Drugstores, one more than in 2011. In total, 911 product forms were processed, of which six (<1%) showed extreme deviation and had to be excluded from the bias analysis. The validated market share was 95% of the total OTC market in terms of units.
Validated market share 95% Number of R-Values 911 Number of extreme values 6
Over/Underestimation
The overall overestimation in-creased slightly, from 0.6% in 2011 to 1.5% in 2012. Low sales volume products were overestimated by 1.5%, me-dium by 1.7%, and the high sales volume group showed a 1.4% overestimation.
Precision
The overall precision index re-mained stable at favorable 99.0% in 2012. The high sales volume group surpassed this score at a perfect 100%. Low and medium sales volume products had precision results of 97.1% and 98.2%, respec-tively. Looking only at forms validated in both years, 2011 and 2012, the precision index improved slightly from 98.9% in 2011 to 99.0% in 2012.
Actions No action required from the statistical point of view
1.2 1.0 0.8 0.6 1.5
-40
-30
-20
-10
0
10
20
2008 2009 2010 2011 2012
%
98.8 99.3 98.8 99.0 99.0
0
20
40
60
80
100
2008 2009 2010 2011 2012
%
±17.5% ±22.5%
79 acts 2013

Czech Republic OTC Validation Study 2012
Participation Number of companies 21 Data from 21 companies was available for
the 2012 validation of the OTC part of PharmaTrend sell-out, two more than in 2011. In total, 217 product forms were pro-cessed, of which only one (<1%) showed extreme deviation and had to be excluded from the bias analysis. The validated market share was 52% of the total OTC market in terms of units.
Validated market share 52% Number of R-Values 217 Number of extreme values 1
Over/Underestimation
The overall bias turned from 0.1% overestimation in 2011 to 0.6% underestimation in 2012. The low and medium sales vol-ume groups were overesti-mated by 0.5% and 1.1%, re-spectively. High sales volume products showed a 1.2% un-derestimation.
Precision
The overall precision index im-proved further, from 95.6% in 2011 to 96.9% in 2012. The high sales volume group sur-passed this score at a perfect 100%. Low and medium sales volume products had precision values of 91.5% and 94.4%, respectively. Looking only at forms validated in both years, 2011 and 2012, the precision index improved from 96.7% in 2011 to 97.4% in 2012.
Actions No action required from the statistical point of view
2.5 7.0
0.1
-0.6
-40
-30
-20
-10
0
10
20
2008 2009 2010 2011 2012
%
87.5 89.8 95.6 96.9
0
20
40
60
80
100
2008 2009 2010 2011 2012
%
±17.5% ±22.5%
80 acts 2013

Finland OTC Validation Study 2012
Participation Number of companies 52 Data from 52 companies was available for
the 2012 validation of the OTC part of PharmaTrend sell-out, one less than in 2011. In total, 455 product forms were pro-cessed, of which only one (<1%) showed extreme deviation and had to be excluded from the bias analysis. The validated market share was 89% of the total OTC market in terms of units.
Validated market share 89% Number of R-Values 455 Number of extreme values 1
Over/Underestimation
The overall underestimation improved slightly, from 7.8% in 2011 to 7.4% in 2012. Low sales volume products were underestimated by 13.7%, me-dium by 10.5%, and the high sales volume group revealed a 5.3% underestimation.
Precision
The overall precision index de-clined slightly, from 96.4% in 2011 to 95.3% in 2012. The high sales volume group sur-passed this score at 96.3%. Low and medium sales volume products had precision values of 91.9% and 95.2%, respec-tively. Looking only at forms validated in both years, 2011 and 2012, the precision index declined slightly from 96.5% in 2011 to 95.7% in 2012.
Actions Revise projection level
-3.8 -3.6 -0.4
-7.8 -7.4
-40
-30
-20
-10
0
10
20
2008 2009 2010 2011 2012
%
80.1 70.6 74.8
96.4 95.3
0
20
40
60
80
100
2008 2009 2010 2011 2012
%
±17.5% ±22.5%
81 acts 2013
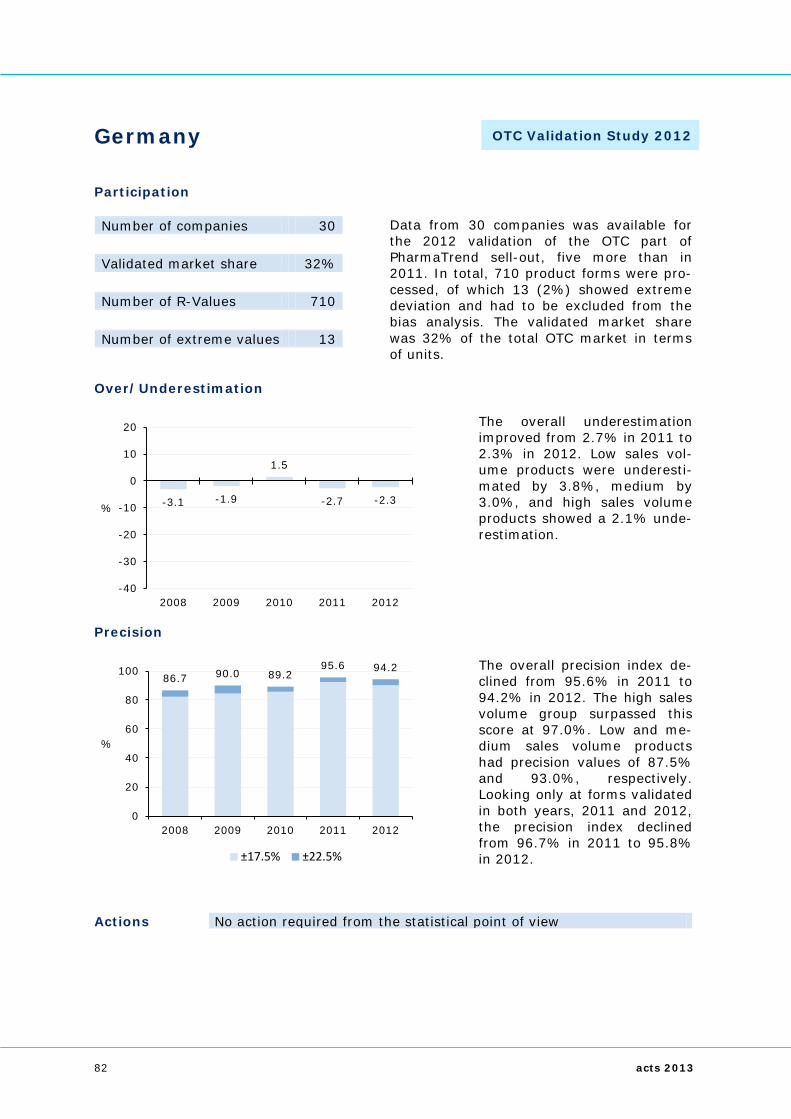
Germany OTC Validation Study 2012
Participation Number of companies 30 Data from 30 companies was available for
the 2012 validation of the OTC part of PharmaTrend sell-out, five more than in 2011. In total, 710 product forms were pro-cessed, of which 13 (2%) showed extreme deviation and had to be excluded from the bias analysis. The validated market share was 32% of the total OTC market in terms of units.
Validated market share 32% Number of R-Values 710 Number of extreme values 13
Over/Underestimation
The overall underestimation improved from 2.7% in 2011 to 2.3% in 2012. Low sales vol-ume products were underesti-mated by 3.8%, medium by 3.0%, and high sales volume products showed a 2.1% unde-restimation.
Precision
The overall precision index de-clined from 95.6% in 2011 to 94.2% in 2012. The high sales volume group surpassed this score at 97.0%. Low and me-dium sales volume products had precision values of 87.5% and 93.0%, respectively. Looking only at forms validated in both years, 2011 and 2012, the precision index declined from 96.7% in 2011 to 95.8% in 2012.
Actions No action required from the statistical point of view
-3.1 -1.9
1.5
-2.7 -2.3
-40
-30
-20
-10
0
10
20
2008 2009 2010 2011 2012
%
86.7 90.0 89.2 95.6 94.2
0
20
40
60
80
100
2008 2009 2010 2011 2012
%
±17.5% ±22.5%
82 acts 2013

Greece OTC Validation Study 2012
Participation Number of companies 31 Data from 31 companies was available for
the 2012 validation of the OTC part of the GPI, three less than in 2011. In total, 101 product forms were processed, of which 3 (3%) showed extreme deviation and had to be excluded from the bias analysis. The vali-dated market share was 52% of the total OTC market in terms of units.
Validated market share 52% Number of R-Values 101 Number of extreme values 3
Over/Underestimation
The overall underestimation in-creased from 3.9% in 2011 to 9.2% in 2012. Low sales vol-ume products were underesti-mated by 5.4%, medium by 2.0%, and the high sales vol-ume class showed an 11.5% underestimation.
Precision
The overall precision index im-proved strongly from 45.8% in 2011 to 92.1% in 2012. Look-ing only at forms validated in both years, 2011 and 2012, the precision index improved from 83.7% in 2011 to 93.2% in 2012. A new quality control and projection system, imple-mented in 2012, has contrib-uted to this considerable im-provement.
Actions New universe study conducted Enhance sampling method based on universe study outcome
-15.3 -16.9
-1.5 -3.9 -9.2
-40
-30
-20
-10
0
10
20
2008 2009 2010 2011 2012
%
64.0 69.2
55.1 45.8
92.1
0
20
40
60
80
100
2008 2009 2010 2011 2012
%
±17.5% ±22.5%
83 acts 2013

Hungary OTC Validation Study 2012
Participation Number of companies 41 Data from 41 companies was available for
the 2012 validation of the OTC part of PharmaTrend sell-out, the same number as in 2011. In total, 262 product forms were processed, of which four (2%) showed ex-treme deviation and had to be excluded from the bias analysis. The validated market share was 67% of the total OTC market in terms of units.
Validated market share 67% Number of R-Values 262 Number of extreme values 4
Over/Underestimation
The overall underestimation improved from 8.1% in 2011 to 3.3% in 2012. Low sales vol-ume products were overesti-mated by 0.5% and the me-dium and high sales volume classes turned out with under-estimation of 3.3% and 3.8%, respectively.
Precision
The overall precision index de-clined from 97.0% in 2011 to 94.4% in 2012. The high sales volume group surpassed this score at 96.6%. Low and me-dium sales volume products had precision values of 87.8% and 93.9%, respectively. Looking only at forms validated in both years, 2011 and 2012, the precision index improved from 97.3% in 2011 to 98.3% in 2012.
Actions No action required from the statistical point of view
-0.3 -6.0 -8.1
-3.3
-40
-30
-20
-10
0
10
20
2008 2009 2010 2011 2012
%
97.3 96.2 97.0 94.4
0
20
40
60
80
100
2008 2009 2010 2011 2012
%
±17.5% ±22.5%
84 acts 2013

Italy OTC Validation Study 2012
Participation Number of companies 16 Data from 16 companies was available for
the 2012 validation of the OTC part of PharmaTrend sell-out, three more than in 2011. In total, 131 product forms were pro-cessed, of which 3 (2%) showed extreme deviation and had to be excluded from the bias analysis. The validated market share was 22% of the total OTC market in terms of units.
Validated market share 22% Number of R-Values 131 Number of extreme values 3
Over/Underestimation
The overall underestimation in-creased from 6.5% in 2011 to 8.7% in 2012. Low sales vol-ume products were underesti-mated by 10.4% and medium by 8.4%. As there were only few forms available in the high sales volume class, these were grouped into the medium class for analysis.
Precision
The overall precision index de-teriorated from 98.6% in 2011 to 87.8% in 2012. The low and medium sales volume classes had precision values of 87.7% and 87.8%, respectively. Looking only at forms validated in both years, 2011 and 2012, the precision index remained stable at 97.8%, which means that newly validated products were responsible for the overall deterioration.
Actions Investigate panel distribution in view of validation results
-5.7 -4.7 -4.8 -6.5 -8.7
-40
-30
-20
-10
0
10
20
2008 2009 2010 2011 2012
%
95.4 94.7 98.4 98.6 87.8
0
20
40
60
80
100
2008 2009 2010 2011 2012
%
±17.5% ±22.5%
85 acts 2013

Korea OTC Validation Study 2012
Participation Number of companies 11 Data from 11 companies was available for
the first validation of the OTC part of the KPA. In total, 144 product forms were pro-cessed, of which eleven showed extreme deviation and had to be excluded from the bias analysis. The validated market share was only 6% of the total OTC market in terms of units and, therefore, not repre-sentative for the entire audit.
Validated market share 6% Number of R-Values 144 Number of extreme values 11
Over/Underestimation
The bias analysis revealed an overall underestimation of 13.0% in 2012. Low sales vol-ume products were underesti-mated by 14.4% and medium by 12.9%. As there were only few products available in the high sales volume class, these were grouped into the medium class for analysis. The results are presented in orange as they are not representative due to low validation coverage.
Precision
The overall precision index turned out at 72.2% in 2012. The medium sales volume group surpassed this score at 83.0%. Low sales volume products had a precision result of 53.6%.
Actions Review projection level and panel composition Improve data collection and coding quality
-14.4 -12.9 -13.0
-40
-30
-20
-10
0
10
20
Low Medium High Total
%
53.6
83.0
72.2
0
20
40
60
80
100
Low Medium High Total
%
86 acts 2013
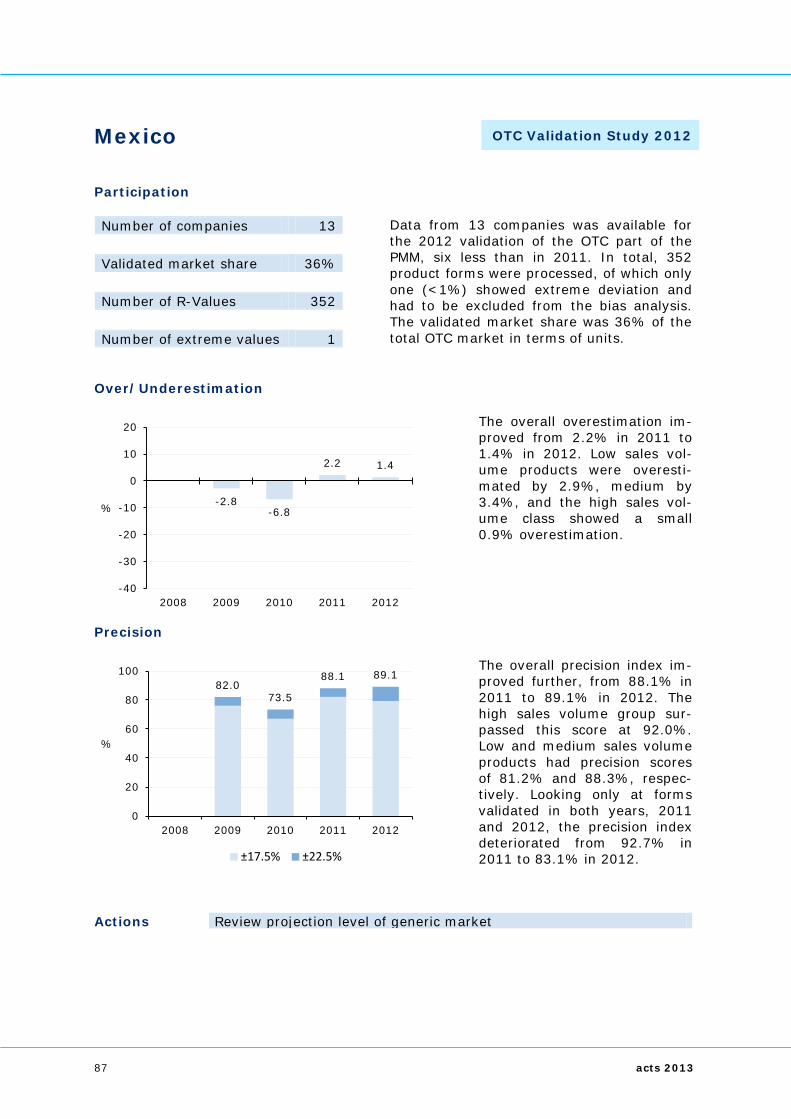
Mexico OTC Validation Study 2012
Participation Number of companies 13 Data from 13 companies was available for
the 2012 validation of the OTC part of the PMM, six less than in 2011. In total, 352 product forms were processed, of which only one (<1%) showed extreme deviation and had to be excluded from the bias analysis. The validated market share was 36% of the total OTC market in terms of units.
Validated market share 36% Number of R-Values 352 Number of extreme values 1
Over/Underestimation
The overall overestimation im-proved from 2.2% in 2011 to 1.4% in 2012. Low sales vol-ume products were overesti-mated by 2.9%, medium by 3.4%, and the high sales vol-ume class showed a small 0.9% overestimation.
Precision
The overall precision index im-proved further, from 88.1% in 2011 to 89.1% in 2012. The high sales volume group sur-passed this score at 92.0%. Low and medium sales volume products had precision scores of 81.2% and 88.3%, respec-tively. Looking only at forms validated in both years, 2011 and 2012, the precision index deteriorated from 92.7% in 2011 to 83.1% in 2012.
Actions Review projection level of generic market
-2.8 -6.8
2.2 1.4
-40
-30
-20
-10
0
10
20
2008 2009 2010 2011 2012
%
82.0 73.5
88.1 89.1
0
20
40
60
80
100
2008 2009 2010 2011 2012
%
±17.5% ±22.5%
87 acts 2013

Poland OTC Validation Study 2012
Participation Number of companies 53 Data from 53 companies was available for
the 2012 validation of the OTC part of PharmaTrend sell-out, six more than in 2011. In total, 289 product forms were pro-cessed, of which 18 (6%) showed extreme deviation and had to be excluded from the bias analysis. The validated market share was 27% of the total OTC market in terms of units.
Validated market share 27% Number of R-Values 289 Number of extreme values 18
Over/Underestimation
The overall underestimation improved from 5.8% in 2011 to 2.7% in 2012. Low sales vol-ume products were underesti-mated by 7.8%, medium by 3.3%, and the high sales vol-ume class showed a 1.4% un-derestimation.
Precision
The overall precision index de-clined from 81.3% in 2011 to 75.9% in 2012. The high sales volume group surpassed this score at 77.4%. Low and me-dium sales volume products had precision results of 72.9% and 74.8%, respectively. Looking only at forms validated in both years, 2011 and 2012, the precision index declined from 84.5% in 2011 to 79.1% in 2012.
Actions Projection methodology changed Investigate options to further enhance projection method
-3.1 -0.2
-4.3 -5.8 -2.7
-40
-30
-20
-10
0
10
20
2008 2009 2010 2011 2012
%
85.5 74.3 72.7
81.3 75.9
0
20
40
60
80
100
2008 2009 2010 2011 2012
%
±17.5% ±22.5%
88 acts 2013
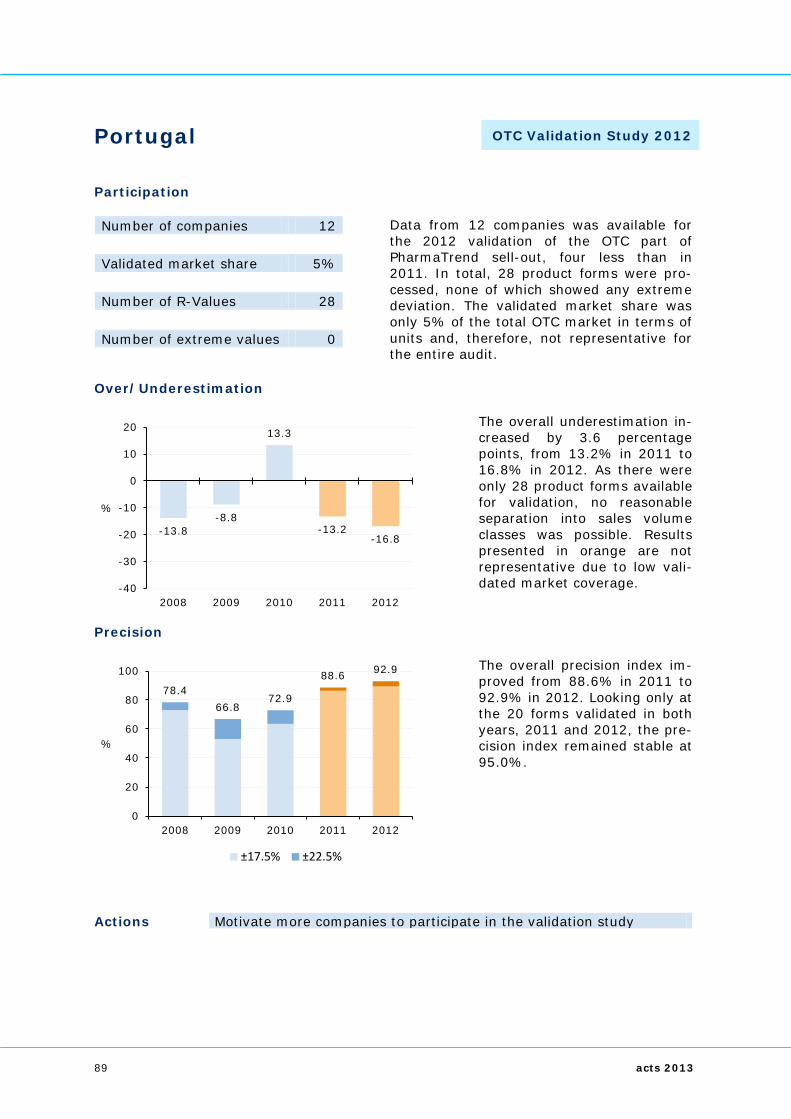
Portugal OTC Validation Study 2012
Participation Number of companies 12 Data from 12 companies was available for
the 2012 validation of the OTC part of PharmaTrend sell-out, four less than in 2011. In total, 28 product forms were pro-cessed, none of which showed any extreme deviation. The validated market share was only 5% of the total OTC market in terms of units and, therefore, not representative for the entire audit.
Validated market share 5% Number of R-Values 28 Number of extreme values 0
Over/Underestimation
The overall underestimation in-creased by 3.6 percentage points, from 13.2% in 2011 to 16.8% in 2012. As there were only 28 product forms available for validation, no reasonable separation into sales volume classes was possible. Results presented in orange are not representative due to low vali-dated market coverage.
Precision
The overall precision index im-proved from 88.6% in 2011 to 92.9% in 2012. Looking only at the 20 forms validated in both years, 2011 and 2012, the pre-cision index remained stable at 95.0%.
Actions Motivate more companies to participate in the validation study
-13.8 -8.8
13.3
-13.2 -16.8
-40
-30
-20
-10
0
10
20
2008 2009 2010 2011 2012
%
78.4 66.8
72.9
88.6 92.9
0
20
40
60
80
100
2008 2009 2010 2011 2012
%
±17.5% ±22.5%
89 acts 2013

Spain OTC Validation Study 2012
Participation Number of companies 10 Data from 10 companies was available for
the 2012 validation of the OTC part of PharmaTrend sell-out, six less than in 2011. In total, 69 product forms were processed, of which two showed extreme deviation and were excluded from the bias analysis. The validated market share was 23% of the total OTC market in terms of units.
Validated market share 23% Number of R-Values 69 Number of extreme values 2
Over/Underestimation
The overall bias increased slightly to 0.8% overestimation in 2012. Low sales volume products were underestimated by 2.1% and medium products showed a 0.9% overestimation. As there were only few prod-ucts available in the high sales volume class, these were grouped into the medium class for analysis.
Precision
The overall precision index de-clined from 96.5% in 2011 to 91.6% in 2012. Medium sales volume products exceeded this score at a perfect 100%. Low sales volume products had a precision result of 77.3%. Looking only at forms validated in both years, 2011 and 2012, the precision index declined from 97.4% in 2011 to 91.5% in 2012.
Actions Review and update turnover size stratification
0.7
-1.5 -2.8
0.1 0.8
-40
-30
-20
-10
0
10
20
2008 2009 2010 2011 2012
%
92.2 92.6 95.2 96.5 91.6
0
20
40
60
80
100
2008 2009 2010 2011 2012
%
±17.5% ±22.5%
90 acts 2013

Switzerland OTC Validation Study 2012
Participation Number of companies 128 Data from 128 companies was available for
the 2012 validation of the OTC part of PharmaTrend sell-out, six less than in 2011. In total, 1,208 product forms were pro-cessed, of which 36 (3%) showed extreme deviation and had to be excluded from the bias analysis. The validated market share was 83% of the total OTC market in terms of units.
Validated market share 83% Number of R-Values 1,208 Number of extreme values 36
Over/Underestimation
The overall underestimation improved from 3.8% in 2011 to a slight 0.2% in 2012. Low and high sales volume products were underestimated by 0.6% and 0.2%, respectively, while the medium sales volume group showed no bias at all.
Precision
The overall precision index im-proved from 91.8% in 2011 to 93.3% in 2012. The high sales volume group surpassed this score at 94.5%. Low and me-dium sales volume products had precision scores of 93.3% and 91.2%, respectively. Looking only at forms validated in both years, 2011 and 2012, the precision index improved slightly from 93.2% in 2011 to 93.4% in 2012.
Actions No action required from the statistical point of view
-3.7 -3.1 -1.8 -3.8 -0.2
-40
-30
-20
-10
0
10
20
2008 2009 2010 2011 2012
%
92.6 92.0 92.7 91.8 93.3
0
20
40
60
80
100
2008 2009 2010 2011 2012
%
±17.5% ±22.5%
91 acts 2013

Venezuela OTC Validation Study 2012
Participation Number of companies 34 Data from 34 companies was available for
the 2012 validation of the OTC part of the PMV, 21 less than in 2011. In total, 278 product forms were processed, of which 2 (<1%) showed extreme deviation and had to be excluded from the bias analysis. The validated market share was 39% of the total OTC market in terms of units.
Validated market share 39% Number of R-Values 278 Number of extreme values 2
Over/Underestimation
The overall bias turned from 0.9% overestimation in 2011 to a slight 2.0% underestimation in 2012. Low sales volume products were underestimated by 0.3%, medium by 1.9%, and the high sales volume class showed a 2.3% underestima-tion.
Precision
The overall precision index im-proved from 93.1% in 2011 to 94.7% in 2012. The high sales volume group surpassed this score at 95.9%. Low and me-dium sales volume products had precision scores of 91.9% and 94.1%, respectively. Looking only at forms validated in both years, 2011 and 2012, the precision index improved from 91.8% in 2011 to 94.9% in 2012.
Actions Conduct distribution channel survey in 2014
-1.0 -4.3 -2.2
0.9
-2.0
-40
-30
-20
-10
0
10
20
2008 2009 2010 2011 2012
%
95.3 93.1 92.7 93.1 94.7
0
20
40
60
80
100
2008 2009 2010 2011 2012
%
±17.5% ±22.5%
92 acts 2013

PharmaTrend Validation Studies Unlike OTC audits for which only direct sales information is taken from phar-macy panels, PharmaTrend studies (PTR) are derived from a panel of computerized pharmacies that report not only on sales, but also on purchases and stock inven-tory. These panels are used in multiple ways: • Providing direct sales information to
national and regional pharmaceutical reports
• Monitoring of new product launches weekly
• Tracking patient care and personal care products
• Estimating OTC vs. prescription shares
• Conducting stock and pipeline studies • Performing sell-out studies In most countries, we are in a position to validate PTR estimates against real data provided by IMS customers in the stan-dard annual validation process. Thus we are consistently using the same under-lying methodology, and the results are comparable. All ethical and OTC pharma-ceutical items, excluding patient care and personal care products, are subject to this validation. As a logical future en-hancement to the service, we are looking into validating the excluded product groups through a separate initiative.
Overall Results For the 2012 PharmaTrend validation studies, 11 countries provided analyzable data, of which 8 had uninterrupted 5-year results. We must exclude the Neth-erlands and the United Kingdom because
the data are incompatible with the national retail audit. The overall degree of precision in IMS PharmaTrend reports is best described by an aggregated precision index for these eight countries:
PharmaTrend Precision Index
The 2012 index showed decline of 1.5 percentage points over 2011, ending at 94.4% precision for PharmaTrend re-
ports on average – an outcome clearly above the 2010 result.
93.9 93.9 93.7 95.9 94.4
0
20
40
60
80
100
2008 2009 2010 2011 2012
%
93 acts 2013

PharmaTrend Precision Results by Country Ten out of the eleven reports achieved precision results considerably above 90%. Two countries turned out with significant decline (more than 2 percent-age points) over 2011. The biggest de-cline in precision was seen for Hungary that lost 3.2 percentage points. No country showed significant improvement of more than two percentage points.
DETERIORATION IN %
COUNTRY 2011 2012 Germany 95.4 92.9 Hungary 95.9 92.7
PharmaTrend Validation Results by Country The validation studies mentioned on the subsequent country pages refer to the IMS PharmaTrend reports.
94 acts 2013

Austria PharmaTrend Validation Study 2012
Participation Number of companies 210 Data from 210 companies was available for
the 2012 Austrian PharmaTrend validation, 30 more than in 2011. In total, 2,528 prod-uct forms were processed, of which 40 (2%) showed extreme deviation and had to be ex-cluded from the bias analysis. The validated market share was 71% in terms of units.
Validated market share 71% Number of R-Values 2,528 Number of extreme values 40
Over/Underestimation
The overall bias turned from 0.4% underestimation in 2011 to 1.5% overestimation in 2012. Low sales volume prod-ucts were underestimated by 0.3%, whereas the medium and high sales volume groups were overestimated by 0.9% and 2.4%, respectively.
Precision
The overall precision index de-clined slightly, from 94.1% in 2011 to 93.7% in 2012. The medium and high sales volume groups surpassed this score at 94.8% and 95.0%, respec-tively. Low sales volume prod-ucts had a precision value of 87.3%. Looking only at forms validated in both years, 2011 and 2012, the precision index improved slightly from 94.3% in 2011 to 94.9% in 2012.
Actions No action required from the statistical point of view
-0.1 -1.2 -1.6 -0.4
1.5
-40
-30
-20
-10
0
10
20
2008 2009 2010 2011 2012
%
96.5 95.7 95.8 94.1 93.7
0
20
40
60
80
100
2008 2009 2010 2011 2012
%
±17.5% ±22.5%
95 acts 2013

Belgium PharmaTrend Validation Study 2012
Participation Number of companies 8 Data from eight companies was available for
the 2012 Belgian PharmaTrend validation, seven less than in 2010 when the last vali-dation survey was conducted. In total, 203 product forms were processed, of which 4 (2%) were excluded from the bias analysis due to extreme deviation. The validated market share was 8% in units and, there-fore, not representative for the entire audit.
Validated market share 8% Number of R-Values 203 Number of extreme values 4
Over/Underestimation
The overall underestimation improved slightly from 3.9% in 2010 to 3.7% in 2012. Low sales volume products were underestimated by 3.8% and medium by 3.7%. As there were only few high sales vol-ume products available, these were grouped into the medium class for analysis. Results pre-sented in orange are not repre-sentative due to low validated market coverage.
Precision
The overall precision index im-proved from 93.4% in 2010 to 95.9% in 2012. The medium sales volume group surpassed this score at 96.8%. Low sales volume products had a preci-sion value of 94.4%. Looking only at forms validated in both years, 2010 and 2012, the pre-cision index improved from 90.9% in 2010 to a perfect 100% in 2012.
Actions Motivate more clients to participate in the validation study
-2.4 -3.8 -3.9 -3.7
-40
-30
-20
-10
0
10
20
2008 2009 2010 2011 2012
%
97.8 95.8 93.4 95.9
0
20
40
60
80
100
2008 2009 2010 2011 2012
%
±17.5% ±22.5%
96 acts 2013

Czech Republic PharmaTrend Validation Study 2012
Participation Number of companies 29 Data from 29 companies was available for
the 2012 Czech PharmaTrend validation, five more than in 2011. In total, 828 product forms were processed, of which 13 (2%) showed extreme deviation and had to be ex-cluded from the bias analysis. The validated market share was 33% in terms of units.
Validated market share 33% Number of R-Values 828 Number of extreme values 13
Over/Underestimation
The overall underestimation improved from 7.4% in 2011 to 2.5% in 2012. Low sales vol-ume products were underesti-mated by 4.9%, medium by 1.8%, and high sales volume products showed a 2.5% underestimation.
Precision
The overall precision index de-clined slightly from 95.5% in 2011 to 95.1% in 2012. The high sales volume group sur-passed this score at 98.9%. Low and medium sales volume products had precision values of 84.6% and 94.1%, respec-tively. Looking only at forms validated in both years, 2011 and 2012, the precision index remained stable at 96.5%.
Actions No action required from the statistical point of view
-5.4 -1.5
-7.4 -2.5
-40
-30
-20
-10
0
10
20
2008 2009 2010 2011 2012
%
94.5 91.9 95.5 95.1
0
20
40
60
80
100
2008 2009 2010 2011 2012
%
±17.5% ±22.5%
97 acts 2013

Finland PharmaTrend Validation Study 2012
Participation Number of companies 120 Data from 120 companies was available for
the 2012 Finnish PharmaTrend validation, the same number as in 2011. In total, 1,933 product forms were processed, of which 27 (1%) showed extreme deviation and had to be excluded from the bias analysis. The vali-dated market share was 76% in terms of units.
Validated market share 76% Number of R-Values 1,933 Number of extreme values 27
Over/Underestimation
The overall underestimation in-creased from 4.1% in 2011 to 5.6% in 2012. Low sales vol-ume products were underesti-mated by 7.3%, medium by 6.6%, and high sales volume products showed a 4.5% unde-restimation.
Precision
The overall precision index de-clined slightly from 96.3% in 2011 to 95.7% in 2010. The medium and high sales volume groups surpassed this score at 98.0% and 96.8%, respec-tively. Low sales volume prod-ucts had a precision value of 87.4%. Looking only at forms validated in both years, 2011 and 2012, the precision index declined slightly from 96.5% in 2011 to 96.2% in 2012.
Actions Revise projection level
-3.0 -2.6 -1.3 -4.1 -5.6
-40
-30
-20
-10
0
10
20
2008 2009 2010 2011 2012
%
90.3 84.8 87.5
96.3 95.7
0
20
40
60
80
100
2008 2009 2010 2011 2012
%
±17.5% ±22.5%
98 acts 2013

Germany PharmaTrend Validation Study 2012
Participation Number of companies 48 Data from 48 companies was available for
the 2012 German PharmaTrend validation, nine more than in 2011. In total, 3,831 product forms were processed, of which 73 (2%) showed extreme deviation and had to be excluded from the bias analysis. The vali-dated market share was 31% in terms of units.
Validated market share 31% Number of R-Values 3,831 Number of extreme values 73
Over/Underestimation
The overall bias turned from 1.9% overestimation in 2011 to 4.1% underestimation in 2012. Low sales volume products were underestimated by 13.8%, medium by 4.1%, and high sales volume products showed a 4.2% underestima-tion.
Precision
The overall precision index de-clined from 95.4% in 2011 to 92.9% in 2012. The high sales volume group surpassed this score at 95.7%. Low and me-dium sales volume products had precision values of 85.6% and 92.0%, respectively. Looking only at forms validated in both years, 2011 and 2012, the precision index declined from 96.2% in 2011 to 94.0% in 2012.
Actions Review direct sales projection frame
1.8 3.8
-1.3
1.9
-4.1
-40
-30
-20
-10
0
10
20
2008 2009 2010 2011 2012
%
92.0 93.4 93.2 95.4 92.9
0
20
40
60
80
100
2008 2009 2010 2011 2012
%
±17.5% ±22.5%
99 acts 2013

Hungary PharmaTrend Validation Study 2012
Participation Number of companies 79 Data from 79 companies was available for
the 2012 Hungarian PharmaTrend validation, seven less than in 2011. In total, 1,390 product forms were processed, of which 36 (3%) showed extreme deviation and had to be excluded from the bias analysis. The vali-dated market share was 44% in terms of units.
Validated market share 44% Number of R-Values 1,390 Number of extreme values 36
Over/Underestimation
The overall underestimation improved from 5.3% in 2011 to 3.0% in 2012. Low sales vol-ume products were underesti-mated by 3.3%, medium by 2.5%, and high sales volume products showed a 3.3% unde-restimation.
Precision
The overall precision index de-creased from 95.9% in 2011 to 92.7% in 2012. The medium and high sales volume groups surpassed this score at 93.2% and 95.8%, respectively. Low sales volume products had a precision value of 81.4%. Looking only at forms validated in both years, 2011 and 2012, the precision index declined from 97.0% in 2011 to 93.9% in 2012.
Actions No immediate action required from the statistical point of view
0.6
-3.5 -5.3 -3.0
-40
-30
-20
-10
0
10
20
2008 2009 2010 2011 2012
%
97.2 95.7 95.9 92.7
0
20
40
60
80
100
2008 2009 2010 2011 2012
%
±17.5% ±22.5%
100 acts 2013

Italy PharmaTrend Validation Study 2012
Participation Number of companies 29 Data from 29 companies was available for
the 2012 Italian PharmaTrend validation, two more than in 2011. In total, 1,057 prod-uct forms were processed, of which 6 (<1%) showed extreme deviation and had to be ex-cluded from the bias analysis. The validated market share was 29% in terms of units.
Validated market share 29% Number of R-Values 1,057 Number of extreme values 6
Over/Underestimation
The overall underestimation in-creased slightly, from 3.1% in 2011 to 4.4% in 2012. Low sales volume products were underestimated by 5.8%, me-dium by 5.5%, and high sales volume products showed a 3.5% underestimation.
Precision
The overall precision index de-clined from 98.5% in 2011 to 96.6% in 2012. The high sales volume group surpassed this score at 98.6%. Low and me-dium sales volume products had precision values of 93.7% and 94.8%, respectively. Looking only at forms validated in both years, 2011 and 2012, the precision index declined from 99.1% in 2011 to 97.5% in 2012.
Actions No action required from the statistical point of view
-3.1 -1.6 -1.9 -3.1 -4.4
-40
-30
-20
-10
0
10
20
2008 2009 2010 2011 2012
%
96.8 96.3 96.3 98.5 96.6
0
20
40
60
80
100
2008 2009 2010 2011 2012
%
±17.5% ±22.5%
101 acts 2013

Poland PharmaTrend Validation Study 2012
Participation Number of companies 82 Data from 82 companies was available for
the 2012 Polish PharmaTrend validation, four more than in 2011. In total, 1,185 product forms were processed, of which 34 (3%) showed extreme deviation and had to be excluded from the bias analysis. The vali-dated market share was 26% in terms of units.
Validated market share 26% Number of R-Values 1,185 Number of extreme values 34
Over/Underestimation
The overall underestimation improved from 7.9% in 2011 to 4.1% in 2012. Low sales vol-ume products were underesti-mated by 6.1%, medium by 5.1%, and high sales volume products showed a 3.0% underestimation.
Precision
The overall precision index de-clined from 89.3% in 2011 to 87.5% in 2012. The high sales volume group surpassed this score at 88.8%. Low and me-dium sales volume products had precision values of 86.6% and 85.9%, respectively. Looking only at forms validated in both years, 2011 and 2012, the precision index declined slightly from 90.3% in 2011 to 89.6% in 2012.
Actions Projection methodology changed Investigate options to further enhance projection method
-4.3 -4.8 -9.6 -7.9
-4.1
-40
-30
-20
-10
0
10
20
2008 2009 2010 2011 2012
%
89.1 86.0 84.6 89.3 87.5
0
20
40
60
80
100
2008 2009 2010 2011 2012
%
±17.5% ±22.5%
102 acts 2013
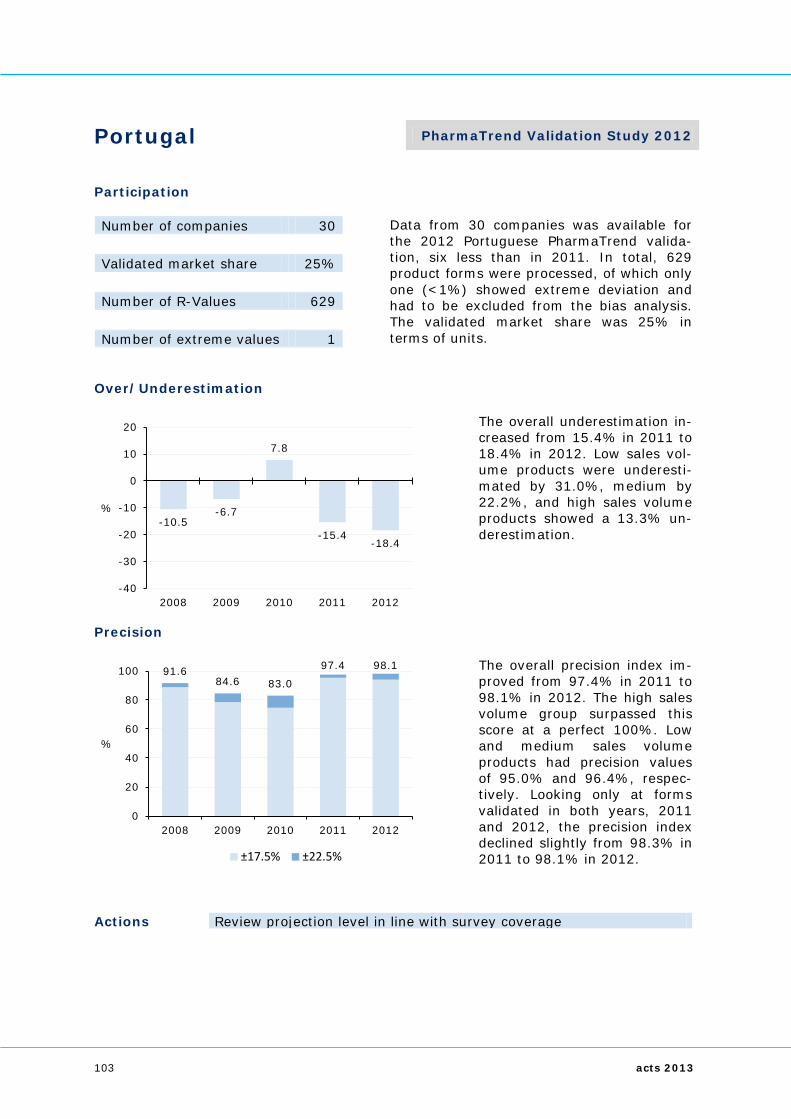
Portugal PharmaTrend Validation Study 2012
Participation Number of companies 30 Data from 30 companies was available for
the 2012 Portuguese PharmaTrend valida-tion, six less than in 2011. In total, 629 product forms were processed, of which only one (<1%) showed extreme deviation and had to be excluded from the bias analysis. The validated market share was 25% in terms of units.
Validated market share 25% Number of R-Values 629 Number of extreme values 1
Over/Underestimation
The overall underestimation in-creased from 15.4% in 2011 to 18.4% in 2012. Low sales vol-ume products were underesti-mated by 31.0%, medium by 22.2%, and high sales volume products showed a 13.3% un-derestimation.
Precision
The overall precision index im-proved from 97.4% in 2011 to 98.1% in 2012. The high sales volume group surpassed this score at a perfect 100%. Low and medium sales volume products had precision values of 95.0% and 96.4%, respec-tively. Looking only at forms validated in both years, 2011 and 2012, the precision index declined slightly from 98.3% in 2011 to 98.1% in 2012.
Actions Review projection level in line with survey coverage
-10.5 -6.7
7.8
-15.4 -18.4
-40
-30
-20
-10
0
10
20
2008 2009 2010 2011 2012
%
91.6 84.6 83.0
97.4 98.1
0
20
40
60
80
100
2008 2009 2010 2011 2012
%
±17.5% ±22.5%
103 acts 2013

Spain PharmaTrend Validation Study 2012
Participation Number of companies 24 Data from 24 companies was available for
the 2012 Spanish PharmaTrend validation, four less than in 2011. In total, 670 product forms were processed, of which 7 (1%) showed extreme deviation and had to be ex-cluded from the bias analysis. The validated market share was 13% in terms of units.
Validated market share 13% Number of R-Values 670 Number of extreme values 7
Over/Underestimation
The overall underestimation improved from 3.6% in 2011 to 0.2% in 2012. Low sales vol-ume products were overesti-mated by 0.4%, whereas the medium and high sales volume groups were underestimated by 0.4% and 0.2%, respectively.
Precision
The overall precision index im-proved from 97.2% in 2011 to 97.8% in 2012. The high sales volume group surpassed this score at a perfect 100%. Low and medium sales volume products had precision values of 91.7% and 97.1%, respec-tively. Looking only at forms validated in both years, 2011 and 2012, the precision index declined slightly from 98.2% in 2011 to 97.3% in 2012.
Actions No action required from the statistical point of view
-3.5 -3.3 -1.0 -3.6 -0.2
-40
-30
-20
-10
0
10
20
2008 2009 2010 2011 2012
%
97.2 97.8 98.2 97.2 97.8
0
20
40
60
80
100
2008 2009 2010 2011 2012
%
±17.5% ±22.5%
104 acts 2013

Switzerland PharmaTrend Validation Study 2012
Participation Number of companies 191 Data from 191 companies was available for
the 2012 Swiss PharmaTrend validation, 15 less than in 2011. In total, 3,074 product forms were processed, of which 44 (1%) showed extreme deviation and had to be ex-cluded from the bias analysis. The validated market share was 87% in terms of units.
Validated market share 87% Number of R-Values 3,074 Number of extreme values 44
Over/Underestimation
The overall underestimation improved further, from 4.8% in 2011 to 3.1% in 2012. Low sales volume products were underestimated by 3.5% and the medium and high sales volume groups showed a 3.0% underestimation each.
Precision
The overall precision index im-proved from 94.8% in 2011 to 96.1% in 2012. The low and high sales volume groups sur-passed this score at 96.2% and 96.5%, respectively. Medium sales volume products had a precision result of 95.5%. Looking only at forms validated in both years, 2011 and 2012, the precision index improved from 95.5% in 2011 to 96.2% in 2012.
Actions No action required from the statistical point of view
-7.7 -6.8 -6.1 -4.8 -3.1
-40
-30
-20
-10
0
10
20
2008 2009 2010 2011 1012
%
95.7 95.6 95.3 94.8 96.1
0
20
40
60
80
100
2008 2009 2010 2011 2012
%
±17.5% ±22.5%
105 acts 2013

Hospital Validation Studies IMS offers two types of hospital audits: purchase-based and consumption-based audits. Although both types target the national hospital market segment, the data collection methodology may pro-duce values that are not directly com-parable with the industry’s internal sales figures. Several factors lead to this in-compatibility, and thus to a failure of the traditional validation process. Examples are: • Indirect sales through secondary dis-
tribution entities (wholesalers, sub-distributors etc.) are not separable.
• Consumption often does not give an indication of the original pack dispen-sation.
• Generic products cannot be assigned
to individual manufacturers. Hospital consumption audits measure deliveries from hospital pharmacies to hospital departments. These measures are not fully compatible with manufac-turer sales into pharmacies. Large gaps or inconsistencies in the points of meas-urement between the two tracking sys-tems result in lower precision values. Therefore, when interpreting the valida-tion results, we less focus on their abso-lute value, but more on changes from one year to another.
Global Hospital Validation Results For the 2012 validation studies, 24 countries provided analyzable results. No validation study was necessary in Den-mark, Finland, New Zealand, the Neth-erlands, Norway and Sweden because we collect full census data in these countries and we suppose a 100 percent precision
in these six markets. This makes a total of 30 sets of validation results, of which 24 had uninterrupted five-year results. The overall degree of precision in IMS hospital reports is best described by an aggregated precision index for these 24 countries:
Hospital Precision Index
90.4 90.8 90.1 91.3 89.9
0
20
40
60
80
100
2008 2009 2010 2011 2012
%
106 acts 2013

The world-wide precision index of hos-pital reports declined by 1.4 percentage
points, from 91.3% in 2011 to 89.9% in 2012.
Hospital Precision Results by Country
IMPROVEMENT IN % DETERIORATION IN % COUNTRY 2011 2012 COUNTRY 2011 2012 Austria 85.5 87.9 Bulgaria 91.3 87.6 Croatia 95.0 99.7 China 92.7 90.1 Italy 79.8 85.2 India 86.5 81.8 Slovenia 97.0 99.6 Korea 60.5 55.8 Switzerland 94.7 96.8 Serbia 86.7 84.0
Spain 66.6 54.7
Vietnam 65.7 53.6 Five countries showed significant im-provement (more than 2 percentage points) over 2011. The biggest growth of 5.4 percentage points is reported for It-aly, followed by Croatia with 4.7 per-centage points. The remaining three countries improved their previous year’s precision index by 2.1 to 2.6 percentage
points in 2012. From the seven countries facing deterioration (more than 2 per-centage points) over 2011, Vietnam showed the strongest decline with 12.1 percentage points, followed directly by Spain with 11.9 percentage points. The remaining five countries lost between 2.6 and 4.7 percentage points in 2012.
Hospital Validation Results by Country From the 24 countries with analyzable results, twelve were validated jointly with their equivalent retail audits (Aus-tralia, Croatia, Czech Republic, Hungary, India, Japan, Poland, Serbia, Slovak Re-public, Slovenia, USA and Vietnam). The
detailed results for these countries can be found in the retail section of this Ac-curacy part. The remaining twelve coun-tries with pure hospital validation results are presented on the subsequent pages.
107 acts 2013

Austria Hospital Validation Study 2012
Participation Number of companies 11 The 2012 DKMOE validation study was at-
tended by eleven companies, two more than in 2011. The participants supplied 380 prod-uct forms for evaluation, of which 19 (5%) showed extreme deviation and had to be ex-cluded from the bias analysis. The validated market share was 24% in terms of units.
Validated market share 24% Number of R-Values 380 Number of extreme values 19
Over/Underestimation
The overall bias turned from 2.0% overestimation in 2011 to a slight underestimation of 0.8% in 2012. Low and me-dium sales volume products were underestimated by 5.9% and 3.2%, respectively, while the high sales volume group showed a 0.9% overestimation.
Precision
The overall precision index continued its year-over-year improving trend, now by 2.4 percentage points to 87.9% in 2012. The high sales volume group surpassed this score at 96.5%. The low and medium groups had precision values of 69.1% and 83.0%, respec-tively. Looking only at forms validated in both years, 2011 and 2012, the precision index declined slightly from 86.9% in 2011 to 86.0% in 2012.
Actions No action required from the statistical point of view
-1.7 -2.2
0.4 2.0
-0.8
-40
-30
-20
-10
0
10
20
2008 2009 2010 2011 2012
%
84.0 76.4 80.0
85.5 87.9
0
20
40
60
80
100
2008 2009 2010 2011 2012
%
±17.5% ±22.5%
108 acts 2013

Belgium Hospital Validation Study 2012
Participation Number of companies 4 The 2012 BHA validation study was attended
by four companies, three less than in 2010 when the previous validation study was con-ducted. The participants supplied 91 product forms, of which 6 (7%) showed extreme de-viation and were excluded from the bias analysis. The validated market share was only 9% in terms of units and, therefore, not representative for the entire audit.
Validated market share 9% Number of R-Values 91 Number of extreme values 6
Over/Underestimation
The overall underestimation improved from 8.4% in 2010 to 6.4% in 2012. Low sales vol-ume products were underesti-mated by 7.9% and medium by 6.3%. As there were only few forms available in the high sales volume class, these were grouped into the medium class for analysis. Results presented in orange are not representa-tive due to low validated mar-ket coverage.
Precision
The overall precision index im-proved by 12.8 percentage points, from 69.8% in 2010 to 82.6% in 2012. The medium sales volume group surpassed this score at 88.6%. Low sales volume products had a preci-sion value of 72.3%.
Actions Motivate more companies to participate in the validation study
-10.4 -8.8 -8.4 -6.4
-40
-30
-20
-10
0
10
20
2008 2009 2010 2011 2012
%
75.5 79.2 69.8
82.6
0
20
40
60
80
100
2008 2009 2010 2011 2012
%
±17.5% ±22.5%
109 acts 2013

Bulgaria Hospital Validation Study 2012
Participation Number of companies 29 The 2012 BGHI validation study was at-
tended by 29 companies, five more than in 2011. The participants supplied 153 product forms for evaluation, of which 2 (1%) showed extreme deviation and had to be ex-cluded from the bias analysis. The validated market share of the participating manufac-turers was 53% in terms of units.
Validated market share 53% Number of R-Values 153 Number of extreme values 2
Over/Underestimation
The overall overestimation im-proved from 2.8% in 2011 to 0.7% in 2012. Low and high sales volume products were overestimated by 0.2% and 1.6%, respectively, and the medium sales volume class showed a 3.1% underestima-tion.
Precision
The overall precision index de-clined from 91.3% in 2011 to 87.6% in 2012. The high sales volume group surpassed this score at 91.1%. Low and me-dium sales volume products had precision values of 90.4% and 80.4%, respectively. Looking only at forms validated in both years, 2011 and 2012, the precision index declined from 91.0% in 2011 to 88.5% in 2012.
Actions Evaluate impact of direct sales to hospitals
-2.7 -0.7
1.9 2.8 0.7
-40
-30
-20
-10
0
10
20
2008 2009 2010 2011 2012
%
89.5 90.7 97.2 91.3 87.6
0
20
40
60
80
100
2008 2009 2010 2011 2012
%
±17.5% ±22.5%
110 acts 2013

Canada Hospital Validation Study 2012
Participation Number of companies 60 Data from 60 companies, four more than in
2011, was available for the 2012 CDH hos-pital validation study. In total, 873 product forms were processed, none of which showed any extreme deviation. The vali-dated market share equaled 95% in terms of units, representing the highest participation rate across all countries.
Validated market share 95% Number of R-Values 873 Number of extreme values 0
Over/Underestimation
The overall overestimation im-proved further, from 1.1% in 2011 to 0.7% in 2012. Low sales volume products were overestimated by 0.7%, me-dium by 0.4%, and the high sales volume group showed a 0.9% overestimation.
Precision
The overall precision index de-clined slightly by 1.2 percent-age points, from 99.8% in 2011 to 98.6% in 2012. The low and medium sales volume groups surpassed this score at 99.2% and 99.0%, respec-tively. High sales volume prod-ucts had a precision value of 98.2%. Looking only at forms validated in both years, 2011 and 2012, the precision index declined negligibly from 99.9% in 2011 to 99.6% in 2012.
Actions No action required from the statistical point of view
0.5 0.8 1.2 1.1 0.7
-40
-30
-20
-10
0
10
20
2008 2009 2010 2011 2012
%
99.4 98.6 99.5 99.8 98.6
0
20
40
60
80
100
2008 2009 2010 2011 2012
%
±17.5% ±22.5%
111 acts 2013

China Hospital Validation Study 2012
Participation Number of companies 39 The 2012 CHPA validation study was at-
tended by 39 companies, four more than in 2011. They supplied 273 product forms for evaluation, of which 8 (3%) showed ex-treme deviation and were excluded from the bias analysis. The validated market share was only 4% in terms of units and, there-fore, representative for the group of partici-pants only rather than for the entire audit.
Validated market share 4% Number of R-Values 273 Number of extreme values 8
Over/Underestimation
The overall underestimation improved from 20.4% in 2011 to 18.6% in 2012. Low sales volume products were underes-timated by 8.0%, medium by 12.9%, and the high sales vol-ume group showed a 21.1% underestimation.
Precision
The overall precision index de-clined by 1.6 percentage points, from 92.7% in 2011 to 90.1% in 2012. Looking only at product forms validated in both years, 2011 and 2012, the pre-cision index declined from 93.2% in 2011 to 92.3% in 2012.
Actions Universe updated National audit structure enhanced
-23.9 -25.3
-18.4 -20.4 -18.6
-40
-30
-20
-10
0
10
20
2008 2009 2010 2011 2012
%
93.8 96.8 92.5 92.7 90.1
0
20
40
60
80
100
2008 2009 2010 2011 2012
%
112 acts 2013

Germany Hospital Validation Study 2011
Participation Number of companies 19 Data from 19 companies, two less than in
2011, was available for the 2012 DKM vali-dation study. In total, 805 product forms were processed, of which 67 (8%) showed extreme deviation and had to be excluded from the bias analysis. The validated market share equaled 21% in terms of units.
Validated market share 21% Number of R-Values 805 Number of extreme values 67
Over/Underestimation
The overall overestimation in-creased from 1.6% in 2011 to 6.8% in 2012. Low sales vol-ume products were overesti-mated by 6.7%, medium by 3.2%, and the high sales vol-ume group showed an 8.9% overestimation.
Precision
The overall precision index de-clined slighly from 80.3% in 2011 to 79.5% in 2012. The high sales volume group sur-passed this score at 89.7%. Low and medium sales volume products had precision results of 57.0% and 73.9%, respec-tively. Looking only at forms validated in both years, 2011 and 2012, the precision index declined from 82.2% in 2011 to 77.8% in 2012.
Actions Analyze consumption profile of intensive care products
-1.3 -1.3
3.1 1.6 6.8
-40
-30
-20
-10
0
10
20
2008 2009 2010 2011 2012
%
81.1 80.1 78.5 80.3 79.5
0
20
40
60
80
100
2008 2009 2010 2011 2012
%
±17.5% ±22.5%
113 acts 2013

Italy Hospital Validation Study 2012
Participation Number of companies 13 The 2012 IMFO+DPC validation study was
attended by 13 companies, two more than in 2011. The participants supplied 207 product forms for evaluation, of which 7 (3%) showed extreme deviation and had to be ex-cluded from the bias analysis. The validated market share of the participating manufac-turers was 16% in terms of units.
Validated market share 16% Number of R-Values 207 Number of extreme values 7
Over/Underestimation
The overall underestimation improved significantly from 16.1% in 2011 to 10.2% in 2012. Low sales volume prod-ucts were underestimated by 16.2%, medium by 14.4%, and the high sales volume group showed a 7.7% underestima-tion.
Precision
Also the overall precision index showed strong improvement from 79.8% in 2011 to 85.2% in 2012. The high sales volume group surpassed this score at 94.9%. Low and medium sales volume products had precision values of 72.2% and 75.6%, respectively. Looking only at forms validated in both years, 2011 and 2012, the precision index improved from 77.5% in 2011 to 79.9% in 2012.
Actions Continue implementation of quality-improving actions
-28.6 -28.7 -25.1
-16.1 -10.2
-50
-40
-30
-20
-10
0
10
20
2008 2009 2010 2011 2012
%
63.6 63.5 64.9
79.8 85.2
0
20
40
60
80
100
2008 2009 2010 2011 2012
%
±17.5% ±22.5%
114 acts 2013
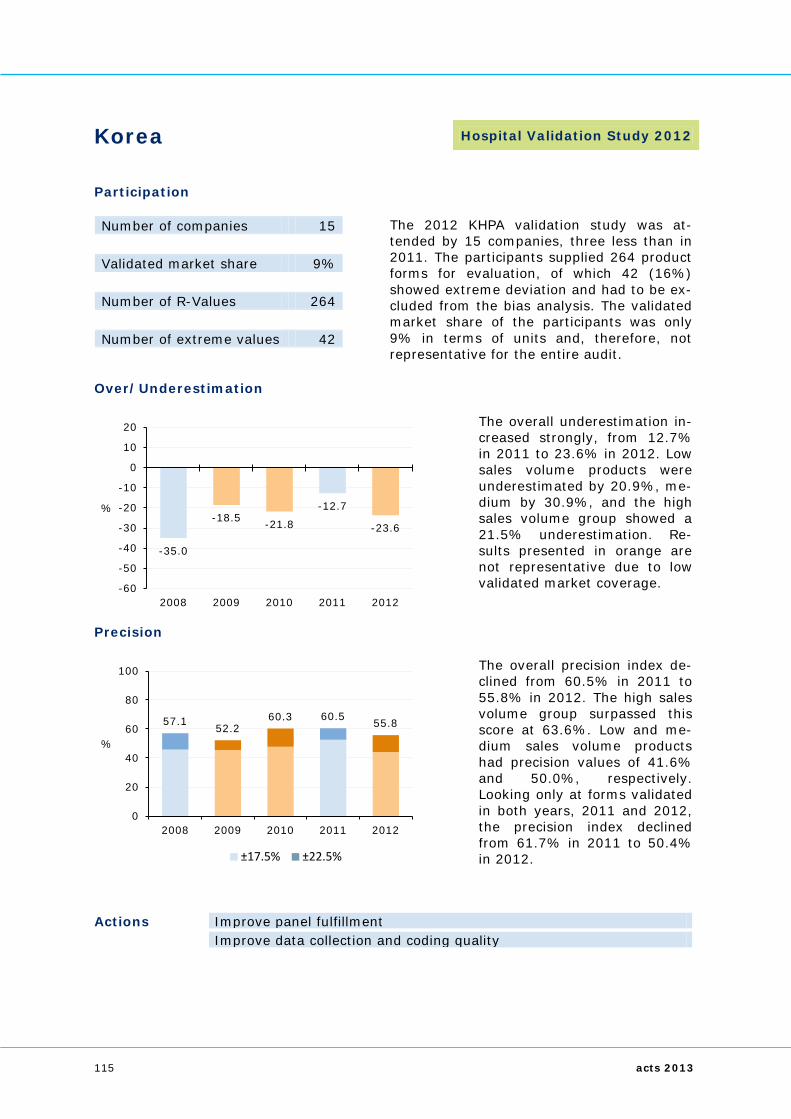
Korea Hospital Validation Study 2012
Participation Number of companies 15 The 2012 KHPA validation study was at-
tended by 15 companies, three less than in 2011. The participants supplied 264 product forms for evaluation, of which 42 (16%) showed extreme deviation and had to be ex-cluded from the bias analysis. The validated market share of the participants was only 9% in terms of units and, therefore, not representative for the entire audit.
Validated market share 9% Number of R-Values 264 Number of extreme values 42
Over/Underestimation
The overall underestimation in-creased strongly, from 12.7% in 2011 to 23.6% in 2012. Low sales volume products were underestimated by 20.9%, me-dium by 30.9%, and the high sales volume group showed a 21.5% underestimation. Re-sults presented in orange are not representative due to low validated market coverage.
Precision
The overall precision index de-clined from 60.5% in 2011 to 55.8% in 2012. The high sales volume group surpassed this score at 63.6%. Low and me-dium sales volume products had precision values of 41.6% and 50.0%, respectively. Looking only at forms validated in both years, 2011 and 2012, the precision index declined from 61.7% in 2011 to 50.4% in 2012.
Actions Improve panel fulfillment Improve data collection and coding quality
-35.0
-18.5 -21.8
-12.7
-23.6
-60
-50
-40
-30
-20
-10
0
10
20
2008 2009 2010 2011 2012
%
57.1 52.2 60.3 60.5 55.8
0
20
40
60
80
100
2008 2009 2010 2011 2012
%
±17.5% ±22.5%
115 acts 2013

Philippines Hospital Validation Study 2012
Participation Number of companies 16 The 2012 PHPA validation study was at-
tended by 16 companies, five less than in 2011. The participants supplied 272 product forms for evaluation, of which 2 (<1%) showed extreme deviation and had to be ex-cluded from the bias analysis. The validated market share of the participating manufac-turers was 21% in terms of units.
Validated market share 21% Number of R-Values 272 Number of extreme values 2
Over/Underestimation
The overall overestimation in-creased slightly from 0.7% in 2011 to 1.2% in 2012. Low sales volume products were overestimated by 1.5% and medium by 1.1%. As there were only few forms available in the high sales volume class, these were grouped into the medium class for analysis.
Precision
The overall precision index de-clined slightly by 1.1 percent-age points, from 99.8% in 2011 to 98.7% in 2012. The medium sales volume group surpassed this score at 99.0%. Low sales volume products had a precision value of 98.2%. Looking only at forms validated in both years, 2011 and 2012, the precision index declined slightly from 100% in 2011 to 98.8% in 2012.
Actions No action required from the statistical point of view
0.1 2.5
-1.9
0.7 1.2
-40
-30
-20
-10
0
10
20
2008 2009 2010 2011 2012
%
99.5 99.0 99.6 99.8 98.7
0
20
40
60
80
100
2008 2009 2010 2011 2012
%
±17.5% ±22.5%
116 acts 2013

Spain Hospital Validation Study 2012
Participation Number of companies 7 The 2012 EMH validation study was at-
tended by 7 companies, six less than in 2011. The participants supplied 106 product forms for evaluation, of which 21 (20%) showed extreme deviation and had to be ex-cluded from the bias analysis. The validated market share of the participating manufac-turers was 9% in terms of units and, there-fore, not representative for the entire audit.
Validated market share 9% Number of R-Values 106 Number of extreme values 21
Over/Underestimation
The overall overestimation im-proved from 6.8% in 2011 to 2.4% in 2012. As there were only few forms available for validation, no reasonable breakdown into the different sales volume classes was pos-sible. Results presented in or-ange are not representative due to low validated market coverage.
Precision
The overall precision index de-clined strongly by nearly twelve percentage points, from 66.6% in 2011 to 54.7% in 2012.
Actions Motivate more companies to participate in the validation study
3.5 2.8 0.6 6.8
2.4
-50
-40
-30
-20
-10
0
10
20
2008 2009 2010 2011 2012
%
75.5 70.1 72.3
66.6 54.7
0
20
40
60
80
100
2008 2009 2010 2011 2012
%
±17.5% ±22.5%
117 acts 2013

Switzerland Hospital Validation Study 2012
Participation Number of companies 19 The 2012 SPI validation study was attended
by 19 companies, six less than in 2011. The participants supplied 124 product forms for evaluation, none of which showed any ex-treme deviation. The validated market share of the participating manufacturers was 5% in terms of units and, therefore, not repre-sentative for the entire audit.
Validated market share 5% Number of R-Values 124 Number of extreme values 0
Over/Underestimation
The overall underestimation improved slightly to 2.1% in 2012. Low sales volume prod-ucts were underestimated by 3.9% and medium by 2.0%. As there were only few product forms available in the high sales volume class, these were grouped into the medium class for analysis. Results presented in orange are not representa-tive due to low validated mar-ket coverage.
Precision
The overall precision index im-proved from 94.7% in 2011 to 96.8% in 2012. The medium sales volume group surpassed this score at 97.3%. Low sales volume products had a preci-sion value of 96.0%. Looking only at forms validated in both years, 2011 and 2012, the pre-cision index improved slightly from 96.4% in 2011 to 96.7% in 2012.
Actions No action required from the statistical point of view
-2.3 -1.7 -1.2 -2.2 -2.1
-40
-30
-20
-10
0
10
20
2008 2009 2010 2011 2012
%
97.9 99.3 98.5 94.7 96.8
0
20
40
60
80
100
2008 2009 2010 2011 2012
%
±17.5% ±22.5%
118 acts 2013
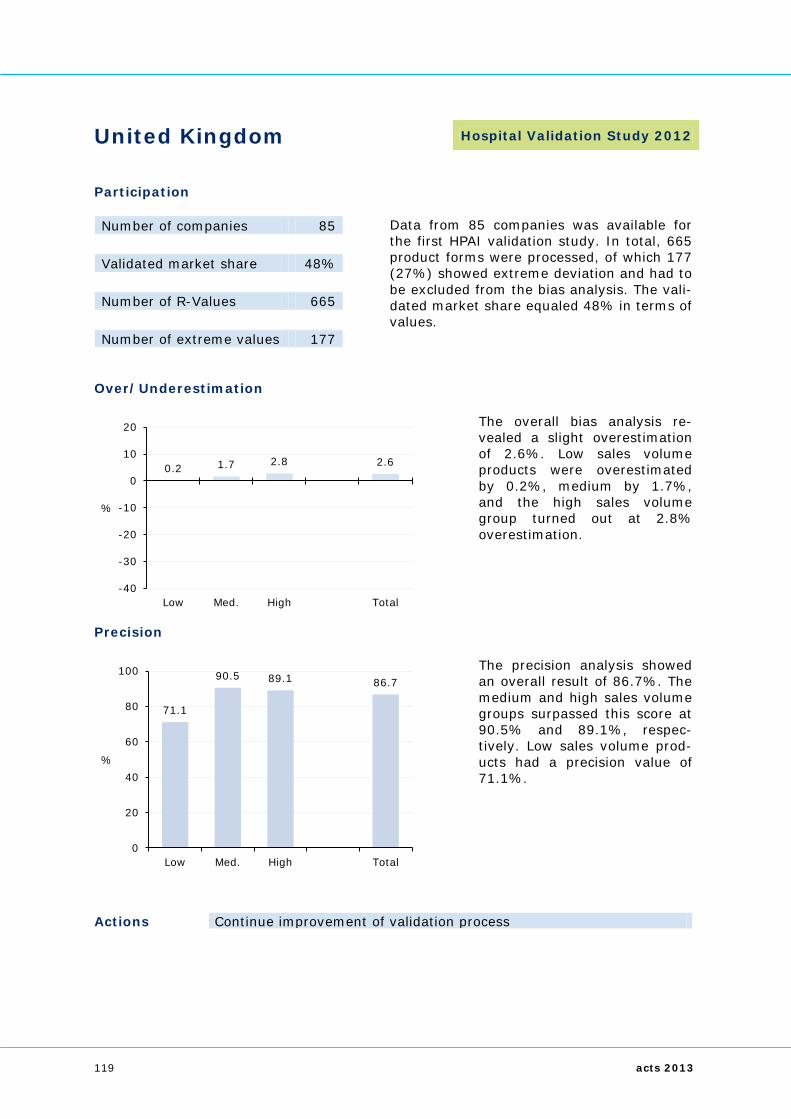
United Kingdom Hospital Validation Study 2012
Participation Number of companies 85 Data from 85 companies was available for
the first HPAI validation study. In total, 665 product forms were processed, of which 177 (27%) showed extreme deviation and had to be excluded from the bias analysis. The vali-dated market share equaled 48% in terms of values.
Validated market share 48% Number of R-Values 665 Number of extreme values 177
Over/Underestimation
The overall bias analysis re-vealed a slight overestimation of 2.6%. Low sales volume products were overestimated by 0.2%, medium by 1.7%, and the high sales volume group turned out at 2.8% overestimation.
Precision
The precision analysis showed an overall result of 86.7%. The medium and high sales volume groups surpassed this score at 90.5% and 89.1%, respec-tively. Low sales volume prod-ucts had a precision value of 71.1%.
Actions Continue improvement of validation process
0.2 1.7 2.8 2.6
-40
-30
-20
-10
0
10
20
Low Med. High Total
%
71.1
90.5 89.1 86.7
0
20
40
60
80
100
Low Med. High Total
%
119 acts 2013

Specialty Markets Validation Results Given the increasing importance of spe-cialty pharmaceutical markets, IMS has calculated separate accuracy measures for sub-groups of specialty products captured within our standard national retail and hospital services. These "sub-validations" are derived by filtering out the following four product groups from the standard services: • Anti-TNF, specific anti-rheumatic
agents and immunosuppressants • Hepatitis B & HIV • Oncology • Others
Others includes e.g., interferons, im-munoglobulins, and drugs for the treat-ment of acromegaly, Alzheimer's dis-ease, anemia, hemophilia, oste-oporosis and metabolic diseases. From a statistical perspective, specialty products typically occur in small quanti-ties across multiple distribution channels and thus produce highly variable results in any statistical survey. However, due to their importance to the pharma-ceutical industry in value terms, we conducted more detailed analyses on their overall validity.
Global Specialty Markets Validation Results In order to ensure that our analysis was based on fairly solid samples, we've cal-culated results only for groups that con-tain a minimum of 20 product forms in the corresponding validation study. The aggregated bias and precision indices below are provided only for groups that met this criterion in both 2011 and 2012. The group Anti-TNF, specific anti-rheu-matic agents and immunosuppressants represents 4 reports, Hepatitis B & HIV
contains 3 reports, Oncology has 13 re-ports, Others represents 15 reports and Total contains 35 reports. As seen in the figure below, the total un-derestimation increased slightly from 3.4% in 2011 to 4.3% in 2012. The Anti-TNF & more group increased by 4.8 per-centage points, while the other individual groups showed only marginal changes.
Specialty Markets Bias
1.8
-3.7 -0.7 -0.8 -3.4
6.6
-4.8 -0.8 -2.4 -4.3
-40
-30
-20
-10
0
10
20
Anti-TNF & more
Hepatitis B & HIV
Oncology Others Total
%
2011 2012
120 acts 2013
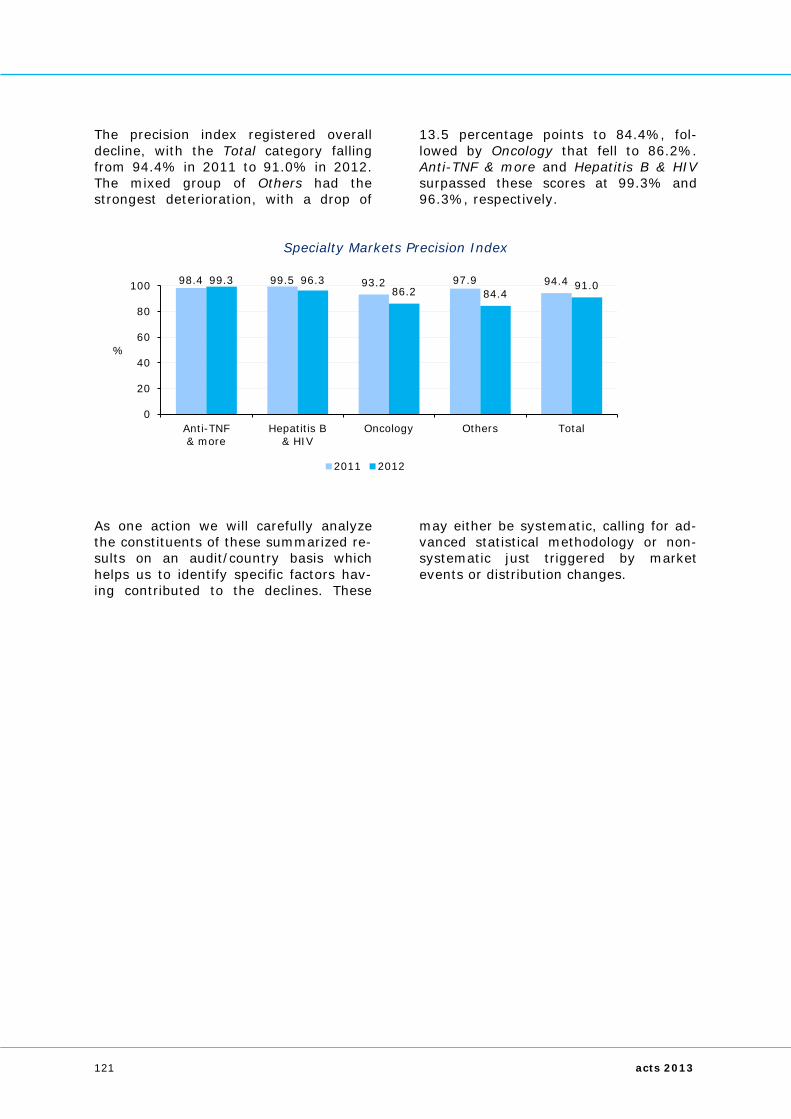
The precision index registered overall decline, with the Total category falling from 94.4% in 2011 to 91.0% in 2012. The mixed group of Others had the strongest deterioration, with a drop of
13.5 percentage points to 84.4%, fol-lowed by Oncology that fell to 86.2%. Anti-TNF & more and Hepatitis B & HIV surpassed these scores at 99.3% and 96.3%, respectively.
Specialty Markets Precision Index
As one action we will carefully analyze the constituents of these summarized re-sults on an audit/country basis which helps us to identify specific factors hav-ing contributed to the declines. These
may either be systematic, calling for ad-vanced statistical methodology or non-systematic just triggered by market events or distribution changes.
98.4 99.5 93.2 97.9 94.4 99.3 96.3 86.2 84.4
91.0
0
20
40
60
80
100
Anti-TNF & more
Hepatitis B & HIV
Oncology Others Total
%
2011 2012
121 acts 2013

Validating IMS Forecasting Services IMS Global Forecasting & Opportunity Assessment produces market forecasts at country levels to help our clients in their strategic planning. Clearly, the forecast is only one element of the plan-ning process, but it does offer guidance on strategic decisions and business de-velopment. For this purpose, IMS Market Prognosis – this year providing five-year forecasts on 31 countries and one-year forecasts on 40 countries and covering about 90 per-cent of the total world market – uses a combination of quantitative and qualita-tive techniques. Market Prognosis uses an econometric model to derive baseline forecasts. These are then integrated along with qualitative input by means of an event-driven forecasting technique, which al-
lows the forecasting team to finalize the forecasts. The validation process was designed as a twofold measurement of forecast valid-ity, one step for the five-year forecast and another for the latest one-year fore-cast: 1) Compare the five-year forecasts pub-
lished in the base year with the ac-tual results ultimately attained. In this report we have compared fore-casts for 2008–2012 with actual data for the same years.
2) Compare the published forecast for the most recent year (generated in the preceding year) with the real market sales for the same year. In this case we have compared fore-casts for 2012, produced in 2011, with real 2012 results.
Validity of Annual Forecasts – All Countries
Forecasting Bias based on 31 Countries
-1.2 -0.7
1.5 4.1
8.8
-40
-30
-20
-10
0
10
20
2008 2009 2010 2011 2012
%
122 acts 2013

The overall market prognosis for the 31 countries validated this year shows a forecasting bias ranging between -1.2% and +8.8%. Lower deviations were achieved for the first three years of the five-year span, which points at good quality of the baseline forecasting model. The overestimation in the fourth and fifth year to a great extent originates from
economic and unpredictable challenges in the Euro zone. The one-year forecast for 2012 turned out at an average +0.6 percent bias for 40 validated countries. For the entire five-year period, the re-sults by region are as follows:
REGION AVERAGE BIAS IN %
2008 – 2012 2007 – 2011 Europe +7.8% +2.6% North America +4.4% +7.5% Latin America -5.5% -8.5% AsiaPacific & Japan -1.3% -7.5% Total +2.5% -2.5%
Compared to last year, the total bias turned from -2.5% to +2.5%. Europe under economic crisis has been very im-pactful on this result, also further en-forced by short-term cost containment measures in the health care sector. North America improved by 3.1 and Asia Pacific by even 6.2 percentage points.
Latin America continued its improving trend by another 3 percentage points. The regional one-year forecast for 2012 provided low bias results, ranging be-tween -0.9% for Latin America and +1.2% for Europe.
Validity of Annual Forecasts – The Ten Leading Markets The forecast results of the ten leading markets (USA, Japan, China, Germany, France, United Kingdom, Spain, Italy,
India and Canada) are presented in de-scending economic order in the subse-quent graph:
Forecasting Bias by Country
5 Years (2008-2012) 1 Year (2012)
4.4
-2.6
-14.7
-0.2
15.2
0.4
-5.7 -0.4 -0.2
-3.5
0.1
-0.7 -0.2
2.4 2.9
-1.9
-40
-30
-20
-10
0
10
20
US JP CN GE FR UK SP IT ID CD US JP CN GE FR UK SP IT ID CD
%
123 acts 2013

The 5-year forecast showed accentuated bias for China (-14.7%) and for France (+15.2%). The remaining markets had clearly more accurate prognoses. No re-
sults were available for Spain, Italy and Canada. The one-year forecasts – with-out results for France – achieved excel-lent outcomes in nearly all countries.
Measures to Maintain and Increase Accuracy As discussed earlier in this report, it is relatively difficult to register major im-provements in accuracy without the full-scale renovation of technologies and processes. New access to large volumes of wholesale data would, for example, be the equivalent of a large-scale sample increase and usually would induce just such a leap forward. But in the absence of such advances, maintaining – much less improving upon – high quality results is like swimming upstream. A framework of processes, quality controls, and alert mechanisms is in place to avoid deterioration or to de-tect it early enough to trigger action for
amelioration. Continuous measurement is crucial to ensuring that IMS services remain a useful and accepted reference for pharmaceutical market research and performance measurement. As we obtain data from samples of wholesalers, pharmacies, and doctors or hospitals, it is of utmost importance that we carefully monitor these market play-ers and react quickly to any changes that could affect the underlying sampling process. To ensure the accuracy of the market estimates we derive, it is essen-tial that we conduct sales channel analy-ses regularly as well as update the uni-verse and sample distribution routinely.
Universe Updates IMS’ commitment to quality dictates that we update universe information in regu-lar cycles – either annually or, in geo-graphic areas with a less effective statis-tical infrastructure, in biennial cycles.
The IMS Global Statistical Services de-partment supervises the Company’s compliance with these targets for up-dating universe information:
Europe, North America, parts of Pacific Annual updates All other regions Biennial updates
In 2013, we monitored a total of 158 universe updates world-wide. Nine data-bases did not comply with the respective target cycles. The overall update index, therefore, is 94.3%, an improvement of
0.6 percentage points over last year’s 93.7%. By universe type, the 2013 update in-dices are shown on the next page.
124 acts 2013

Universe Update Monitor 2013
The update index for pharmacy uni-verses improved from 91% in 2012 to 93% in 2013. Medical universes im-proved by three percentage points to
98%. Hospital universes declined by four percentage points, from 97% in 2012 to 93% in 2013.
Wholesaler & Distributor Data Statistical theory holds that a massive improvement in data accuracy can only be achieved by increasing the underlying sample, and even that works only up to a point. Beyond that point, any addi-tional gains in accuracy from a larger sample are marginal. Still, larger sam-pling volumes are required to properly track smaller products and to assure ac- ceptable levels of confidence even in ge-ographical sub-areas. Naturally, there are limitations with pharmacy panels, and samples cannot be increased at will. Even when pharma-cies do become part of the panel, a huge technical effort is required for them to report data in a reasonable timeframe. For that reason, IMS decided to supple-ment pharmacy panel results by recruit-ing wholesalers, distributors, and in some cases, pharmaceutical manufac-turers to supply data. Meanwhile, in some countries, these alternative sources have become the sole source of data and have brought about significant jumps in precision.
In most countries today, we pursue multi-sampling approaches in which pharmacies are used to capture direct sales and wholesalers are used to cap-ture indirect sales to pharmacies and hospitals. Pharmacy samples in turn have grown considerably in many places in order sustain the high quality stand-ards set by the inclusion of near-census information. By the end of the third quarter 2013, most of the IMS countries were using wholesaler or distributor data as their major data source, either exclusively or in addition to other sample components. 76% of the countries have a sampling ratio of more than 70 percent, which represents a strong retail market cover-age. In seven countries (marked by an arrow) we made significant progress of four and more percentage points by including new wholesalers into our panels. Please, see the subsequent page for more details.
93
98
93
0 20 40 60 80 100
Hospitals
Doctors
Pharmacies
%
125 acts 2013

IMS Data Capture in % of Pharmaceutical Market The Americas Argentina 94% Brazil 100% Canada 72% Central America (6) 97% Chile 100% Colombia 82% Dominican Republic 40% Ecuador 98% Mexico 97% Paraguay 60% Peru 100% Puerto Rico 96% Uruguay 79% USA 84% Venezuela 98%
AsiaPacific, China & Japan Australia 97% Bangladesh 2% China 16% Hong Kong 77% India 36% Indonesia 64% Japan 99% Korea 58% Malaysia 76% New Zealand 97% Pakistan 87% Philippines 79% Singapore 75% Sri Lanka 10% Taiwan 5% Thailand 39% Vietnam 6%
North Europe & Africa Belgium 100% Estonia 42% Finland 100% France 56%
North Europe & Africa cont’d. French West Africa (12) 97% Ireland 100% Latvia 35% Lithuania 93% Luxembourg 95% Netherlands 100% Norway 100% South Africa 95% United Kingdom 100%
Central & East Europe Austria 86% Bulgaria 100% Croatia 100% Czech Republic 100% Germany 84% Hungary 100% Poland 99% Romania 95% Russia 30% Serbia 77% Slovak Republic 100% Slovenia 100% Switzerland 100%
South Europe & Mid East Algeria 63% Egypt 96% Greece 18% Italy 100% Jordan 16% Kuwait 98% Lebanon 69% Morocco 84% Portugal 100% Saudi Arabia 97% Spain 89% Tunisia 49% Turkey 100% United Arab Emirates 99%
126 acts 2013
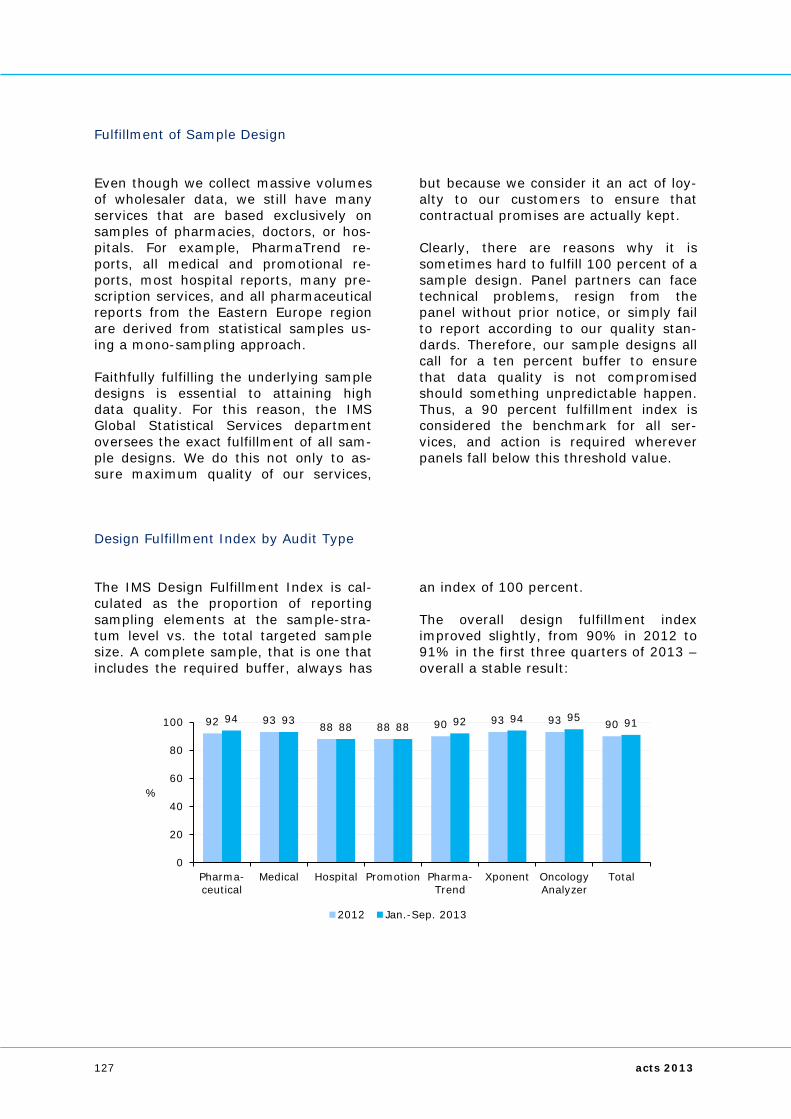
Fulfillment of Sample Design Even though we collect massive volumes of wholesaler data, we still have many services that are based exclusively on samples of pharmacies, doctors, or hos-pitals. For example, PharmaTrend re-ports, all medical and promotional re-ports, most hospital reports, many pre-scription services, and all pharmaceutical reports from the Eastern Europe region are derived from statistical samples us-ing a mono-sampling approach. Faithfully fulfilling the underlying sample designs is essential to attaining high data quality. For this reason, the IMS Global Statistical Services department oversees the exact fulfillment of all sam-ple designs. We do this not only to as-sure maximum quality of our services,
but because we consider it an act of loy-alty to our customers to ensure that contractual promises are actually kept. Clearly, there are reasons why it is sometimes hard to fulfill 100 percent of a sample design. Panel partners can face technical problems, resign from the panel without prior notice, or simply fail to report according to our quality stan-dards. Therefore, our sample designs all call for a ten percent buffer to ensure that data quality is not compromised should something unpredictable happen. Thus, a 90 percent fulfillment index is considered the benchmark for all ser-vices, and action is required wherever panels fall below this threshold value.
Design Fulfillment Index by Audit Type The IMS Design Fulfillment Index is cal-culated as the proportion of reporting sampling elements at the sample-stra-tum level vs. the total targeted sample size. A complete sample, that is one that includes the required buffer, always has
an index of 100 percent. The overall design fulfillment index improved slightly, from 90% in 2012 to 91% in the first three quarters of 2013 – overall a stable result:
92 93 88 88 90 93 93 90 94 93 88 88 92 94 95 91
0
20
40
60
80
100
Pharma- ceutical
Medical Hospital Promotion Pharma- Trend
Xponent Oncology Analyzer
Total
%
2012 Jan.-Sep. 2013
127 acts 2013

All seven report types managed to im-prove or maintain their previous year’s result also in the first three quarters of 2013. Xponent services improved its previous result by one percentage point, Pharmaceutical, Oncology Analyzer and PharmaTrend reports gained two per-centage points. Oncology Analyzer has not taken the lead position in design ac-complishment terms.
All these measures help to maintain data quality where it is already high or to in-dicate where there is need for improve-ment. We abide by the principle of “measurement + action”, and it is our obligation to launch improvement meas-ures immediately when declines become visible.
128 acts 2013
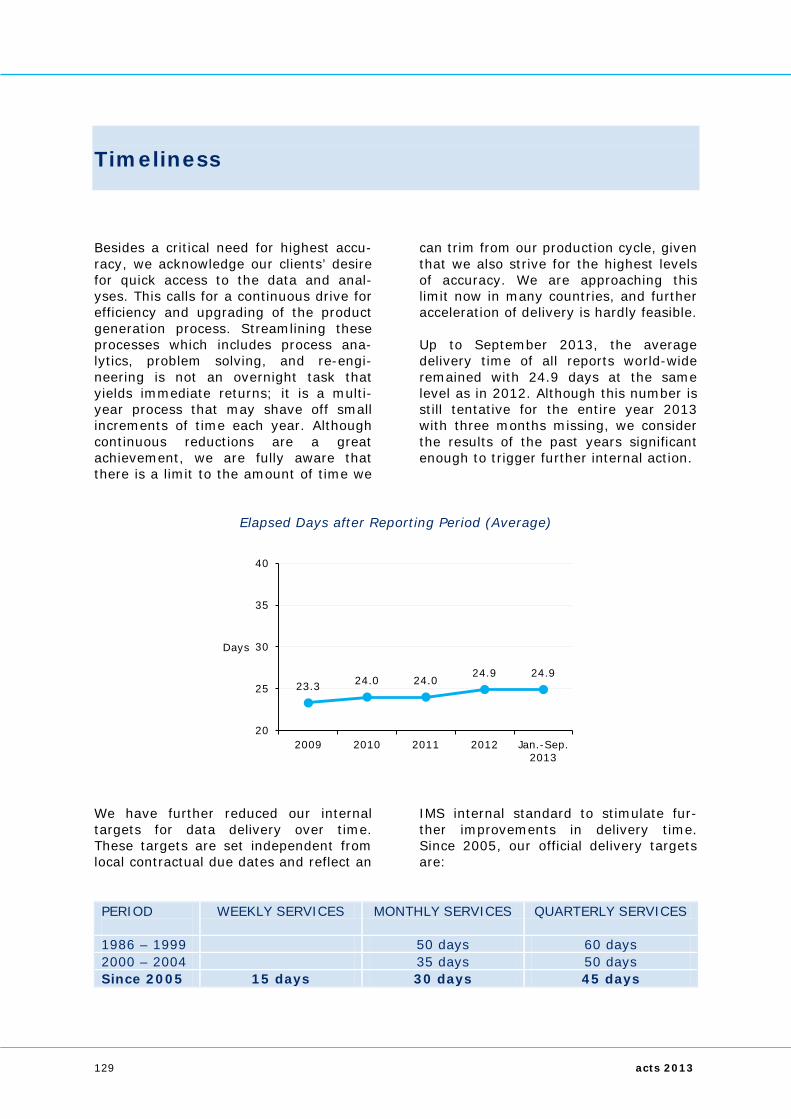
Timeliness Besides a critical need for highest accu-racy, we acknowledge our clients’ desire for quick access to the data and anal-yses. This calls for a continuous drive for efficiency and upgrading of the product generation process. Streamlining these processes which includes process ana-lytics, problem solving, and re-engi-neering is not an overnight task that yields immediate returns; it is a multi-year process that may shave off small increments of time each year. Although continuous reductions are a great achievement, we are fully aware that there is a limit to the amount of time we
can trim from our production cycle, given that we also strive for the highest levels of accuracy. We are approaching this limit now in many countries, and further acceleration of delivery is hardly feasible. Up to September 2013, the average delivery time of all reports world-wide remained with 24.9 days at the same level as in 2012. Although this number is still tentative for the entire year 2013 with three months missing, we consider the results of the past years significant enough to trigger further internal action.
Elapsed Days after Reporting Period (Average)
We have further reduced our internal targets for data delivery over time. These targets are set independent from local contractual due dates and reflect an
IMS internal standard to stimulate fur-ther improvements in delivery time. Since 2005, our official delivery targets are:
PERIOD
WEEKLY SERVICES MONTHLY SERVICES QUARTERLY SERVICES
1986 – 1999 50 days 60 days 2000 – 2004 35 days 50 days Since 2005 15 days 30 days 45 days
23.3 24.0 24.0 24.9 24.9
20
25
30
35
40
2009 2010 2011 2012 Jan.-Sep. 2013
Days
129 acts 2013
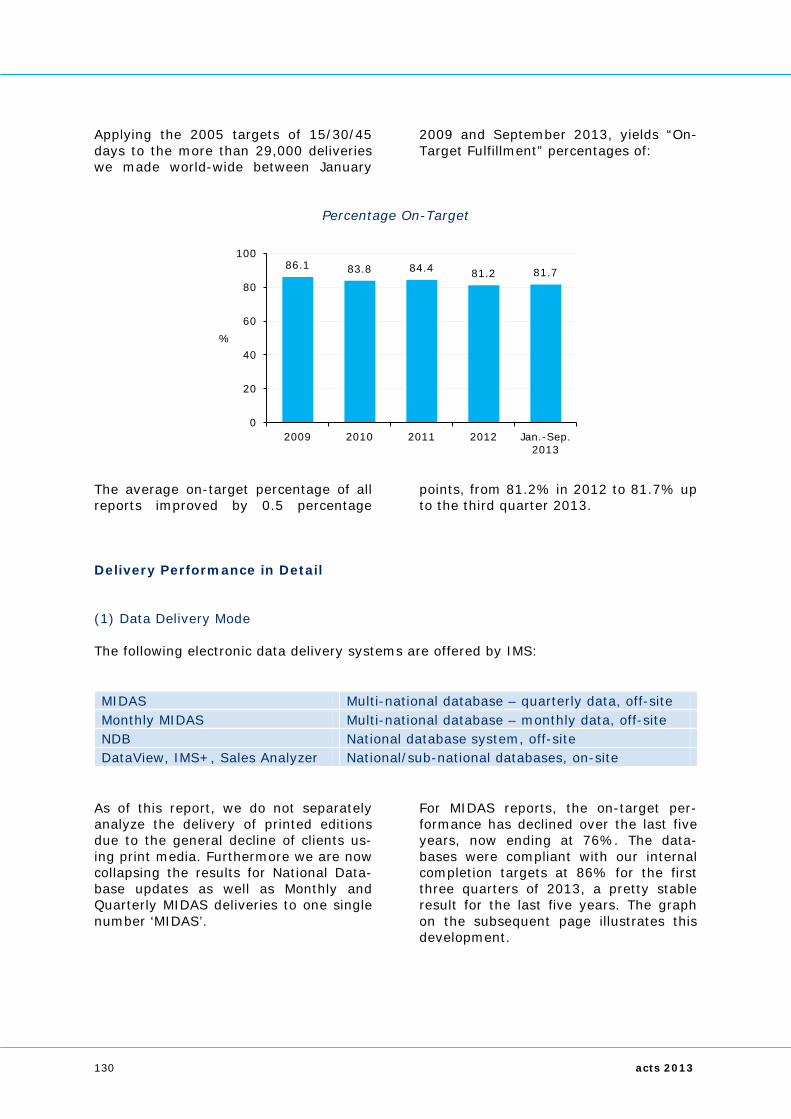
Applying the 2005 targets of 15/30/45 days to the more than 29,000 deliveries we made world-wide between January
2009 and September 2013, yields “On-Target Fulfillment” percentages of:
Percentage On-Target
The average on-target percentage of all reports improved by 0.5 percentage
points, from 81.2% in 2012 to 81.7% up to the third quarter 2013.
Delivery Performance in Detail (1) Data Delivery Mode The following electronic data delivery systems are offered by IMS: MIDAS Multi-national database – quarterly data, off-site Monthly MIDAS Multi-national database – monthly data, off-site NDB National database system, off-site DataView, IMS+, Sales Analyzer National/sub-national databases, on-site
As of this report, we do not separately analyze the delivery of printed editions due to the general decline of clients us-ing print media. Furthermore we are now collapsing the results for National Data-base updates as well as Monthly and Quarterly MIDAS deliveries to one single number ‘MIDAS’.
For MIDAS reports, the on-target per-formance has declined over the last five years, now ending at 76%. The data-bases were compliant with our internal completion targets at 86% for the first three quarters of 2013, a pretty stable result for the last five years. The graph on the subsequent page illustrates this development.
86.1 83.8 84.4 81.2 81.7
0
20
40
60
80
100
2009 2010 2011 2012 Jan.-Sep. 2013
%
130 acts 2013

Percentage On-Target
(2) Report Types Delivery by Report Type
REPORT
ELAPSED DAYS OF DELIVERY
DAYS EARLIER (-) / LATER (+)
PERCENTAGE ON-TARGET *
2012 Jan.-Sep. 2013 ±0.0 2012 Jan.-Sep.
2013 Pharmaceutical 23.4 23.6 +0.2 84% 85% Sales Territory 20.9 21.3 +0.4 83% 83% Medical 33.5 33.3 -0.2 82% 84% Hospital 27.8 28.1 +0.3 76% 75% Promotion 32.0 33.4 +1.4 67% 62% OTC 21.8 21.1 -0.7 93% 94% PharmaTrend 13.8 14.2 +0.4 94% 92% Xponent 20.8 20.3 -0.5 85% 86%
* measured against delivery targets of 15/30/45 days for weekly/monthly/quarterly services Delivery times for five out of the eight core IMS services have increased, most significantly Promotion reports by 1.4 days on average. OTC reports managed to improve their previous delivery time by 0.7 days up to September 2013, fol-lowed by Xponent and Medical reports. Looking at the on-target performance, the majority of the eight services main-
tained or improved their previous year’s results, most significantly Medical re-ports with two percentage points. OTC reports are still holding the lead with 94% on-target delivery. For the remain-ing three services, the on-target perfor-mance showed slight declines. Clear im-provement is required for Promotion re-ports as less than two third were deliv-ered on time.
86 84 82 76 76
86 84 87 86 86
0
20
40
60
80
100
2009 2010 2011 2012 Jan.-Sep. 2013
%
MIDAS Databases
131 acts 2013

(3) IMS Regions Delivery by Region
IMS AREA
ELAPSED DAYS OF DELIVERY
DAYS EARLIER (-) / LATER (+)
PERCENTAGE ON-TARGET *
2012 Jan.-Sep. 2013 ±0.0 2012 Jan.-Sep.
2013 North America 22.2 22.3 +0.1 92% 92% Latin America 28.7 28.6 -0.1 73% 73% North Europe & Africa 22.8 22.6 -0.2 83% 87% Central Europe 21.3 21.6 +0.3 87% 84% East Europe 20.3 20.3 ±0.0 91% 90% South Europe & M. East 25.1 24.9 -0.2 79% 80% AsiaPacific 30.9 31.3 +0.4 66% 66% Japan 21.7 21.9 +0.2 99% 100% China 29.8 30.6 +0.8 78% 76%
* measured against delivery targets of 15/30/45 days for weekly/monthly/quarterly services In terms of delivery days, Latin America, North Europe & Africa and South Europe & Mid East managed to reduce the deliv-ery time. East Europe was successful in maintaining their previous year’s result. The remaining five regions all faced in-creased delivery times. The biggest in-crease was recorded for China with 0.8 days, followed by AsiaPacific with 0.4 days and Central Europe with 0.3 days. Measuring on-target delivery, six regions managed to maintain or improve their 2012 delivery performance in the first three quarters of 2013. The remaining three regions declined, most significantly Central Europe with a reduction of three
percentage points. Japan continued to hold the lead, now with a perfect score of 100% on-target delivery of their ser-vices. After a general decline reported for 2012 over previous years which was mainly due to building new production sites in off-shore geographies, we were able to retain our delivery performance in 2013 which was another year marked by sig-nificant changes in the processing structure. In 2014 we will incorporate measures for creating higher visibility of the ongoing production processes which shall allow early interaction and im-provement.
132 acts 2013

Contact Global Statistical Services c/o IMS Health GmbH & Co. OHG Darmstaedter Landstrasse 108 60598 Frankfurt/Main Germany Tel.: +49-69-66044248 E-Mail: [email protected] www.imshealth.com ABOUT IMS HEALTH IMS Health is the leading provider of information services for the healthcare industry around the world. The company draws on its global technology infrastructure and unique combination of in-depth, sophisticated analytics, on-shore and off-shore commercial services, and consulting platforms to help clients better understand the performance and value of medicines. With a presence in 100+ countries and more than 55 years of industry experience, IMS Health serves leading decision makers in healthcare, including pharmaceutical manufacturers and distributors, providers, payers, government agencies, policymakers, researchers and the financial community. Additional information is available at www.imshealth.com.
© 2014 IMS Health Incorporated and its affiliates. All rights reserved. Trademarks are registered in the United States and in various other countries.
133 acts 2013