· our website – sustainability the principles of sustainability are embedded in the bank’s...
TRANSCRIPT


A Unique Story: The Impression
Annual Report2017
N A T I O N A L S A V I N G S B A N K

Contents
A Unique Story: The Impression
04Prologue 06NSB's Unique History 08
About NSB’s Annual Report 2017 09
Management Discussion and Analysis 72
Financial Capital 73Review of Key Business Lines 85Intellectual Capital 92Manufactured Capital 100Human Capital 108Social and Relationship Capital 124Natural Capital 142NSB’s impression on the UN Sustainable Development Goals 146
Governance 155
Board of Directors 156
Corporate Management 160
Executive Management 162
Chief Managers 163
Corporate Governance 165
Report of the Board Audit Committee 190Report of the Board Human Resource and Remuneration Committee 193Report of the Board Nomination Committee 195Report of the Board Integrated Risk Management Committee 196Report of the Board Credit Committee 198Report of the Board Information TechnologyStrategy Committee 200Risk Management Report 201
The 2017 Story12
Highlights 14
Our Protagonists 19
Chairman’s Message 20
General Manager/CEO’s Review 26
NSB’s Unique Business Model 32
Operating Environment 37Stakeholders 46Materiality matters, risks, and opportunities 52Our Strategy 63

VisionTo be the most reliable and sought-after choice for your savings.
MissionProviding our customers with total financial solutions to optimise their savings and investment needs, while meeting the expectations of all our stakeholders.
ValuesIn conducting business we will respond decisively to resonate trust, mutual respect, integrity, and creativity.
Financial Reports
239Financial Calendar 240Annual Report of Board of Directors 241Statement of Directors’ Responsibility for Financial Reporting 248Directors’ Statement on Internal Control Over Financial Reporting 250Independent Assurance Report on Internal Controls 252General Manager/CEO’s and Deputy General Manager’s (Finance and Planning) Statement of Responsibility 253Auditor General’s Report 255Statement of Comprehensive Income 256Statement of Financial Position 258Statement of Changes in Equity 260Statement of Cash Flows 264Notes to the Financial Statements 265
Supplementary Information371Products and Services 372Statement of Comprehensive Income in US Dollars 376Statement of Financial Position in US Dollars 378Basel III Disclosures as per Schedule III of Banking Act Direction No. 1 of 2016 379Other Disclosure Requirements 392Statistical Indicators 2008–2017 397Analysis of Deposits 399GRI Content Index: “In Accordance” with Core Criteria 400Correspondent Banks 404Exchange Companies 405Glossary of Financial and Banking Terms 408Corporate Information 412
Annual Report – 2017A Unique Story: The Impression
National Savings Bank
Produced by:Smart Media The Annual Report Company
ISBN 978-955-1619-13-8

4
National Savings Bank Annual Report 2017

5
National Savings Bank Annual Report 2017

Prologue

7
National Savings Bank Annual Report 2017
The National Savings Bank was established on the founding principle of financial inclusion in 1972 when a Parliamentary
Act amalgamated the four traditional savings organisations in the country into one establishment. As a result, the moment our
unique story began, we inherited a savings legacy of over a century old.
As the largest licensed specialised bank in the country, we undertake a unique mandate to foster a savings culture in
all Sri Lankans irrespective of class, gender, or status. The 19.9 million accounts attest to our claim of being the Bank
for all segments of society.
Since our inception, NSB has acted as a pillar of strength to the Nation. The pillar on the cover embodies our Mission, Vision,
and Values, the stability and rootedness as a premier financial institution, and our commitment to empower the Nation to achieve
financial security.
Brick by brick our pillar has grown to provide shade to the whole Nation. Thus, as we celebrate our 45th Anniversary, we reflect on the impression we have made on Sri Lanka, the financial sector,
and more importantly, we reflect on all the lives we have touched throughout our unique history.
Our unique story is written by the people for the people. With that thought, we offer you A Unique Story:
The Impression.
8
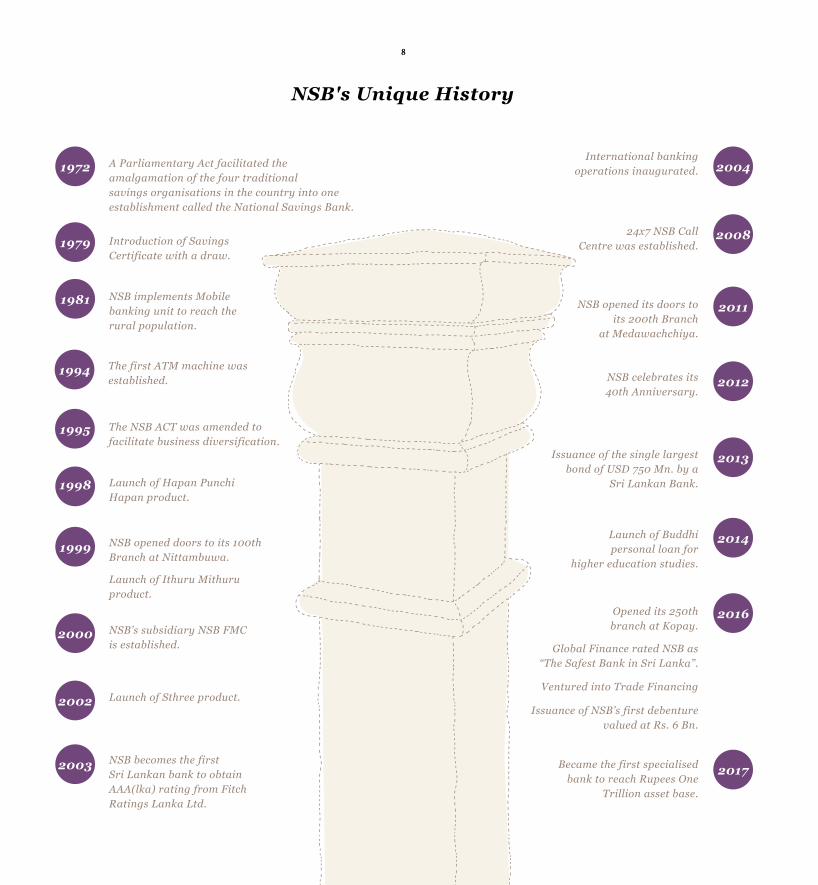
NSB's Unique History
8
2004International banking
operations inaugurated.
2013Issuance of the single largest bond of USD 750 Mn. by a
Sri Lankan Bank.
2012NSB celebrates its 40th Anniversary.
2011NSB opened its doors to its 200th Branch
at Medawachchiya.
200824x7 NSB Call Centre was established.
2014Launch of Buddhi personal loan for
higher education studies.
2017Became the first specialised bank to reach Rupees One
Trillion asset base.
2016Opened its 250th branch at Kopay.
Global Finance rated NSB as “The Safest Bank in Sri Lanka”.
Ventured into Trade Financing
1998 Launch of Hapan Punchi Hapan product.
1995 The NSB ACT was amended to facilitate business diversification.
1994 The first ATM machine was established.
2000 NSB’s subsidiary NSB FMC is established.
2002 Launch of Sthree product.
2003 NSB becomes the first Sri Lankan bank to obtain AAA(lka) rating from Fitch Ratings Lanka Ltd.
1979
1972
1981
A Parliamentary Act facilitated the amalgamation of the four traditional savings organisations in the country into one establishment called the National Savings Bank.
Introduction of Savings Certificate with a draw.
NSB implements Mobile banking unit to reach the rural population.
1999 NSB opened doors to its 100th Branch at Nittambuwa.
Launch of Ithuru Mithuru product.
Issuance of NSB’s first debenture valued at Rs. 6 Bn.

9
National Savings Bank Annual Report 2017
GRI 102-1
About NSB’s Annual Report 2017 This is National Savings Bank’s fourth integrated Annual Report for the calendar year of
2017. This Report constitutes of financial and non-financial information providing insight into economic, social, ecological, and corporate governance consequences. This year’s
report follows a similar reporting format to the past report, Annual Report 2016: A Unique Story: The Sequel. This Report is a clear, comprehensive presentation of the relationships between individual and interdependent aspects that are fundamental to NSB’s business.
How to read A Unique Story: The Impression
A Unique Story: The Impression takes the form of a story. It follows NSB’s unique story since its inception in 1972. The first part of the Report is titled the “Prologue” which
introduces the Report. The second part titled “The 2017 Story” provides information on how the Bank fared in the year under review, how the Bank achieved its core objectives,
how NSB is gearing up to meet future challenges, and how NSB has created an impression on the Nation and its people. This section is followed by “NSB’s Unique Business Model” which outlines the Bank’s role and its use of resources to create value. It also outlines the
Bank’s Stakeholder engagement process, materiality, and the strategic direction. The section titled Governance outlines corporate governance, followed by the
Financial Statements.
This Annual Report is produced in print and PDF versions. The latter is available on our website – www.nsb.lk
Sustainability
The principles of sustainability are embedded in the Bank’s strategy and form the basis of its business in value creation and capital formation. The Bank evaluates the social,
economical, and ecological impressions it makes and takes actions to mitigate any negative impacts on the society and environment where it operates. Sustainability is thus seamlessly integrated with financial reporting and a separate sustainability review does
not appear in this Report.
10
National Savings Bank Annual Report 2017
GRI 102-10, 45, 46
Report boundary and materiality
The overall boundary of this Annual Report comprises the National Savings Bank and its fully-owned Subsidiary, NSB Fund Management Company Ltd., duly identified as the
“Bank” individually and “Group” collectively. Consistent with the framework adopted in the 2014 report, key financial aspects are discussed in the context of the Bank as
well as the Group, while non-financial aspects are discussed in the context of the Bank unless stated otherwise. This Report focuses on aspects that are material or important. It is an assessment based on the extent to which these factors may substantively affect
the Bank’s ability to create value over the short, medium and long term. The materiality determination process is discussed under the section titled Materiality Matters, Risks and
opportunities on page 52.
GRI 102-12, 48, 49, 50, 51, 52, 54
Compliance
The Bank’s Annual Report 2017 covers the 12-month period from 1 January to 31 December 2017, and is consistent with the usual annual reporting cycle for financial
and sustainability reporting. NSB has followed the GRI guidelines in formulating its past Annual Reports. For sustainability reporting, we have transitioned to the recently
published Global Reporting Initiative (GRI) Standards and this report has been prepared in accordance with the GRI Standards; core options. Being an integral part of the Bank’s
overall business, it is subject to the Bank’s existing internal and external control and assurance systems. There are no significant changes from previous reporting periods in the scope and aspect boundaries. The most recent previous Annual Report, dated 28 March 2017, covered the 12-month period ended 31 December 2016. Comparative financial information, if reclassified or restated, has been disclosed and explained in
the relevant sections.
The primary statutes that govern the activities of the Bank are the National Savings Bank Act No. 30 of 1971 and its amendments, Banking Act No. 30 of 1988 and its
amendments, Directives and Guidelines of the Central Bank of Sri Lanka (CBSL), and Regulations and Directions of the Department of Inland Revenue (IRD). The financial
information contained in this report, as in the past, is in compliance with all applicable

11
National Savings Bank Annual Report 2017
laws, regulations and standards and is declared in the several reports and statements that appear under the section on Financial Reports commencing on page 239. This integrated Annual Report draws on concepts, principles, and guidance given in the following, where
applicable:
Sri Lanka Accounting Standards issued by The Institute of Chartered Accountants of Sri Lanka (CA Sri Lanka).
The International Integrated Reporting Council (IIRC) Framework
[www.theiirc.org]
Code of Best Practice on Corporate Governance issued by the CA Sri Lanka.
Smart Integrated Reporting MethodologyTM
[www.smart.lk]
Global Reporting Initiative (GRI) Sustainability Reporting Guidelines GRI Standards
[www.globalreporting.org]
External assurance
The Bank has complied with all the regulatory and statutory requirements in producing the Annual Report. The Financial Statements were audited by the Government Audit while
the assurance on sustainability reporting was provided by Messrs KPMG Sri Lanka.
GRI 102-53
Queries
We welcome your comments or inquiries on this Report, which could be addressed to the Finance and Planning Division at National Savings Bank, No. 255, Galle Road, Colombo 3
(email: [email protected]).

12
National Savings Bank Annual Report 2017
The 2017 Story

13
National Savings Bank Annual Report 2017
The 2017 Story was filled with landmark achievements making NSB’s impression felt in all domains. NSB celebrated its 45th anniversary in style by notably reaching
Rupees One Trillion in asset base and recoding the highest ever PBT of Rs. 14 Bn. and highest ever PAT of Rs. 9.6 Bn. Further, 2017 saw NSB achieving the NPL ratio
of 1.3% which is amongst the lowest in the banking industry average.
The Chairman in his message, while celebrating the stellar performance of NSB in 2017, reflect on the effect of “disruptive” technologies on the sector as a whole. He emphasises the importance of being au courant of the new financial ecosystem that is being created
through digitalisation of the sector. Further, the Chairman reiterates that in order for NSB to stay relevant, the Bank has to stay connected and engaged, physically and virtually,
with its stakeholders by offering new and better financial products and services suited to every customer’s needs and expectations.
The General Manager/CEO in his review outlines that these significant milestones attest to the robustness of the pragmatic strategic direction pursued by the Bank and that they were achieved by navigating in a highly competitive environment with developments in
the fiscal and monetary policy. In 2017, NSB became the only local bank to receive “AAA (lka)” by Fitch Ratings Lanka Ltd. for the 15th consecutive year and NSB was
ranked as the 5th most valuable brand in Sri Lanka by Brand Finance.
The 2017 Story captures how NSB’s unique story unfolded within the year: the nature and scope of the Bank’s business operations, strategic direction, and key moments of
growth and evolution. It also contains financial and non-financial highlights of the Bank in the year, transparent financial information, and all other pertinent information to the
main stakeholders of the Bank. It also outlines the Bank’s preparedness to meet challenges and offers a glimpse into the future.
This is the 2017 Story of A Unique Story: The Impression...

Highlights

15
National Savings Bank Annual Report 2017
Financial HighlightsBank Group
For the year ended 31 December 2017 2016 Change %
2017 2016 Change %
Results for the year (Rs. Mn.)Gross income 107,817 87,399 23.36 108,056 88,039 22.74 Profit before financial VAT and taxation 17,522 16,094 8.87 17,236 16,209 6.34 Profit before taxation (PBT) 14,029 13,303 5.46 13,645 13,397 1.85 Income tax expenses 4,419 3,805 16.14 4,595 3,835 19.82 Profit after taxation (PAT) 9,610 9,498 1.18 9,050 9,562 (5.36)
Position at the year end (Rs. Mn.)Shareholders’ funds (total equity) 40,222 32,246 24.73 41,266 33,787 22.14 Due to other customers/deposits from customers 737,213 657,280 12.16 737,213 657,280 12.16 Financial investment – held to maturity 544,273 505,824 7.60 547,924 507,625 7.94 Gross loans and receivable 390,323 325,543 19.90 389,036 324,744 19.80 Total assets 1,012,103 911,704 11.01 1,018,795 921,603 10.55
Information per ordinary share (Rs.)Earnings (basic) 15.50 29.68 (47.78) 14.60 29.88 (51.14)Earnings (diluted) 15.50 29.68 (47.78) 14.60 29.88 (51.14)Net assets value 60.03 52.01 15.43 61.59 54.49 13.02
RatiosNet interest margin (NIM) (%) 2.59 2.89 (10.38) 2.60 2.89 (10.38)Return on average shareholders’ funds (ROE) (%) 26.52 29.37 (9.70) 24.12 28.21 (14.51)Return on average assets (ROA) (%) 1.46 1.51 (3.42) 1.41 1.51 (6.67)Year on year growth in earnings (%) 1.18 9.52 (87.64) (5.36) 8.27 (164.79)
Statutory ratiosLiquid assets (%) – minimum requirement 20% 73.44 72.56 1.21 N/A N/A – Liquidity coverage ratio (%) minimum requirement 80% – 2017 (70% – 2016) 376.18 393.96 (4.51) N/A N/A –
Capital requirements: Basel IIIBasel III – Tier – 1– minimum requirement 7.75% 11.93 11.31 5.48 12.65 12.03 5.15 Basel III – total capital – minimum requirement 11.75% 15.31 13.86 10.46 16.00 14.54 10.04
Financial goals and achievements – Bank
Goals2017
Achievement
Financial indicator 2017 2016 2015 2014 2013
Net interest margin (NIM) (%) 2.66 2.59 2.89 3.32 2.98 1.74Return on average assets (ROA) (%) 1.35 1.46 1.51 1.51 1.46 0.39 Return on average shareholders’ funds (ROE) (%) 27.67 26.52 29.37 29.37 30.20 5.15 Growth in income (%) 23.72 23.36 10.24 10.24 18.78 23.95Growth in profit for the year (PAT) 11.06 1.18 9.52 9.52 479.98 (68.54)Growth in total assets (%) 11.23 11.01 7.50 7.50 19.12 28.61
Capital requirements: Basel IIIBasel III - Tier - 1– minimum requirement 7.75% Over 7.75% 11.93 11.31 N/A N/A N/ABasel III - total capital– minimum requirement 11.75% Over 11.75% 15.31 13.86 N/A N/A N/A
GRI 102-7

16
National Savings Bank Annual Report 2017
Non-Financial Highlights
Rs. 107,817 Mn.Direct economic value
generated
Financial Capital
Rs. 4,623 Mn.Business partners
Rs. 78,445 Mn.Depositors
Rs. 13,442 Mn.Government
Rs. 6,887 Mn.Employees
Rs. 20.0 Mn.Community
Rs. 4,400 Mn.Direct economic value retained
Rs. 103,417 Mn.Direct economic value
distributed
Intellectual Capital
USD 168 Mn.Brand value
5th most valuable
brand
Brand Finance ranking
B+ Stable from S&P
Global
B+ Stable from Fitch
Ratings
Global ratings
Rs. 319 Mn.
Investment in software
GRI 102-7
AAA (lka) from Fitch
Ratings Lanka Ltd.
National rating

17
National Savings Bank Annual Report 2017
253 branches
9 regional
offices
4,062 post offices
4,000 ATMs through
LankaPay
33 exchange
houses
14 correspondent
banksInternational relationships
Manufactured Capital
4,470Total workforce
216Total
recruitments
6:5Gender ratio
(male:female) at all levels
Rs. 34.4 Mn.Total
investment in training
96.7%Retention rate
Human Capital

18
National Savings Bank Annual Report 2017
19.9 millionTotal no. of
accounts
Rs. 78,445 Mn.
Interest paid to customers
Rs. 20 Mn.Total
investment in CSR projects
225,950No. of enquiries
received over the phone
147No. of
suppliers
Social and Relationship Capital
Rs. 1.7 Mn.Investment in NSB
Agroforestry
25,000No. of plants distributed
through NSB Agroforestry
902
No. of Eco Loans disbursed
Rs. 686 Mn.
Total amount of Eco Loans
disbursed
3.5 million
No. paper use reduced from
2016
27,614 GigajoulesEnergy consumption
Natural Capital

Our Protagonists

20
National Savings Bank Annual Report 2017
21
National Savings Bank Annual Report 2017
Chairman’s Message
The year 2017 was yet another captivating chapter in NSB’s unique story that has evolved for the past 45 years. Our 2017 story was filled with landmark achievements creating an impression in all domains, notably reaching the Rupees One Trillion mark in our asset
base, the first specialised bank to do so, and recording our highest profit after tax of Rs. 9.6 Bn. These felicitous results, that script another compelling chapter in our unique story which began in 1972, exhibit our exemplary governance and commitment to global
best practices. Equipped with a triennial business plan (2017-2019) which charts our course for the coming three years, NSB is primed to face the future.
GRI 102-14

22
National Savings Bank Annual Report 2017
Making an impression on the NationNSB’s unique story goes beyond the readership of our 20 million accounts to touch the lives of each and every Sri Lankan. Being a State-owned bank, we are firmly rooted in the National economy and we serve the Nation in our unique way. In 2017 alone, NSB contributed Rs. 13.4 Bn. to the Government through taxes, levies, and dividends, which the Government mobilised to create value through economic and
social projects. NSB and our customers participate in nation building and help to maintain stability and sustainability of the financial system.
Staying relevant in a “disruptive” setting As we celebrate our achievements of 2017, we are cognisant of the world that transforms at an increased pace through “sustaining” and “disruptive” technologies. NSB, as a specialised, State-owned bank, being
au courant or staying relevant is quintessential. A new financial ecosystem is being created through digitalisation of the sector. We realise that to stay relevant, we have to stay connected and engaged,
physically and virtually, with our main stakeholders by offering new and better financial products and services suited to every customer’s needs and expectations.
NSB iSaver
NSB’s unique, innovative product, iSaver, is a prime example of NSB’s strategy for capitalising on the potential efficiencies, cost-savings, and new marketing opportunities in this new financial landscape.
NSB’s flagship digital product, iSaver complements NSB’s objective of fostering a savings culture among Sri Lankans. NSB partnered with SLT Mobitel to create a convenient, accessible, and innovative method
of saving money. NSB iSaver encourages our customers to save money anytime, anywhere using 16,000+ mCash retailers spread across the country.
NSB’s Model Branch
NSB’s Model Branch concept under the brand name NSB Connect is another example of NSB’s strategic drive to create a positive impression and to stay relevant in the highly competitive financial ecosystem. The Model Branch concept was launched in 2017 at the Boralesgamuwa branch with a bespoke “Smart Zone” for digital banking. This concept will be implemented in 50 branches across the island in 2018.
23
National Savings Bank Annual Report 2017
The playing field Sri Lankan economy witnessed a growth of 3.1% in 2017, below the estimated growth due to affects of natural disasters. Despite monetary policy tightening to ease inflationary pressures in the first half of 2017, credit growth remained strong, supporting private consumption and investment. Sri Lanka is
expected to sustain macroeconomic stability and support potential growth over the medium term through the adoption of reforms proposed by World Bank and IMF programmes. Accounting for 5.7% of the GDP,
the Sri Lankan banking sector plays a critical role in financial intermediation, financial inclusion, and facilitating economic growth. Overall, the sector witnessed growth in profitability, deposit base, and
maintained a healthy liquid assets ratio.
The full implementation of Basel III framework will be effective from January 2019. This will strengthen the resilience of banks, and may lead to consolidation in the sector. Furthermore,
the adoption of SLFRS 9 standards proposed by CA Sri Lanka from 2018 onwards will increase the impairment provision of banks.
NSB’s higher standards of corporate governance, which foster a culture of risk management and compliance, allowed the Bank to take necessary measures to understand the evolving frameworks. NSB
continues to comply with Basel III capital adequacy and liquidity requirements, among others, to prepare for implementation within the stipulated time period.
Our financial impression NSB’s financial impression, as mentioned above, is marked with several impressive financial milestones
achieved during the year. In the year 2017 we reached gross NPL ratio of 1.3% which is amongst the lowest in the banking sector average, which demonstrates NSB’s excellent asset quality. The impact of the substantial increase in interest cost and the resulting drop in the net interest margin was offset by a substantial increase in business volumes. Consequently, the interest income surpassed Rs. 100 Bn.
Another financial highlight was the improvement of NSB’s total Capital adequacy ratio to 15.3%, which is among the highest in the State-banking sector.
As the only State-guaranteed bank, NSB offers 100% security to its customers' deposits and interest therein making NSB the safest place for saving. Reflecting the Bank’s stability and reliability, Fitch
Ratings Lanka Limited reaffirmed the Bank at AAA (lka) for the 15th consecutive year. I am also happy to announce that Brand Finance ranked NSB as the 5th most valuable brand in Sri Lanka. These
accolades are a testament to NSB’s sound governance and robust strategic direction and they attest to the impression we have made on Sri Lanka’s financial sphere. We will not rest our efforts to stay relevant,
connected, and engaged and continue to deliver value to our stakeholders in the future.
24
National Savings Bank Annual Report 2017
NSB’s impression on the global stage As the turbulent global economic climate subside, the world economy strengthened in 2017 to reach a
growth rate of 3%, the highest growth since 2011. The cyclical recovery in global economy is expected to be sustained over the next several years and will even accelerate in Emerging Markets and Developing Economies (EMDEs), reaching 4.5% in 2018 and an average of 4.7% in 2019/20, due to a rebound in
commodity exports.
With a view of diversification, NSB’s imprint is taken offshore through international banking and trading services. At present, NSB possesses an extensive network of international banking relationships built over the years with prominent international financial bodies such as the Arab National Bank, Saudi Arabia Exchange Company, and DBS Bank, Singapore. In 2017, NSB’s inward remittances experienced a mammoth 33% growth compared to 2016 amounting to Rs. 26 Bn. and the foreign currency deposit base was at Rs. 9.4 Bn. as at 31 December 2017. Trade finance business thrived by opening Rs. 221 Mn. worth of Letters of Credit for the year. We will continue to penetrate into prominent international markets for
inward and outward remittances to expand our international business and overseas networks in the future.
Towards making an impression on sustainability
The principles of sustainability are embedded in our strategy and form the basis of our business and everything we do. We evaluate the social, economical, and ecological impressions we make and take
action to mitigate any negative impacts on the society and environment where we operate. Last year, we promoted the proliferation of renewable energy islandwide and adopted green banking initiatives like
NSB Eco Loans. While continuing to support those initiatives, in 2017, we took another step to reduce our carbon footprint through our NSB Agroforestry project. The project was initiated to celebrate the 93rd World Thrift Day. Through NSB Agroforestry, we plan to distribute a million plants by 2020. This year
alone, we distributed 25,000 plants islandwide.
Moreover, we have pledged to support the UN Sustainable Development Goals (SDGs), as we continue to address SDGs that directly relate to our business and our operations. For the first time in the history of NSB, we have obtained an Independent Assurance Report for non-financial reporting. Our commitment and ongoing efforts to the SDGs is outlined within our Annual Report (refer to page 146). We recognise that these global challenges require effective, multi-stakeholder collaboration at a local, national, and
international level and we call on all our stakeholders to join us in our efforts.

25
National Savings Bank Annual Report 2017
Glimpsing into tomorrow While NSB’s unique story is 45 years old, we possess a financial heritage of over 180 years. Throughout
our illustrious history, we have remained relevant and we will continue to do so. Our strategic objectives are geared towards engaging and connecting with all our stakeholders. In our goal to diversify our business, we will seek opportunities for sustainable growth, streamline our internal processes, and
bolster our product offering. We will focus on improving our digital footprint by investing in state-of-the-art ICT infrastructure. In conclusion, we will continue to deliver value to our stakeholders in a diverse,
inclusive, and transparent manner.
Expressing appreciationI would like to thank first and foremost our dedicated, loyal team of employees led by the General
Manager and the Management Team. The exceptional performance of the year is due to their commitment and loyalty to the Bank. My gratitude is extended to the esteemed colleagues in the Director
Board for their guidance, our customers, and other stakeholders whose contribution we appreciate. To the Postmaster General, and all officials of the Postal Department, I would like to extend my deep appreciation for the vital assistance you provide to NSB across the island. In conclusion, I would like
to thank the Hon. Minister of Public Enterprise Development, Hon. State Minister of Public Enterprise Development, Secretary to the Ministry of Public Enterprise Development and the officials, the Hon. Minister of Finance and Mass Media, the Hon. Deputy Minister of Finance and Mass Media, the Hon. State Minister of Finance, the Secretary to the Treasury and the officials, the Governor and officials of
the Central Bank of Sri Lanka, the Attorney General, the Auditor General and his team and heads of other regulatory bodies and their teams for their continued support and guidance.
Aswin De SilvaChairman
12 March 2018

26
National Savings Bank Annual Report 2017

27
National Savings Bank Annual Report 2017
General Manager/ CEO’s Review
In 2017, NSB celebrated its 45th anniversary by recording an exceptional financial performance and organic growth in all core business areas. These significant milestones
were achieved by navigating in a highly competitive environment with developments in the fiscal and monetary policies. They attest to the robustness of the pragmatic strategic direction pursued by the Bank. Not withstanding market challenges, NSB
will continue to hold true to its unique mandate to foster a savings culture in Sri Lanka.

28
National Savings Bank Annual Report 2017
A historic performance The Bank created history within its relatively short period of 45 years in operation to reach a stellar
landmark figure in asset base of Rupees One Trillion as at 31 December 2017. The 11.0% growth in assets was primarily aided by the 12.2% growth of NSB’s deposit base to reach Rs. 737.2 Bn., a net increase of
Rs. 79.9 Bn. from 2016. The Bank’s loans and advances portfolio in both retail and corporate sectors too recorded a phenomenal 19.8% growth to reach Rs. 388.0 Bn.
In another historic achievement, NSB recorded its highest ever PBT of Rs. 14.0 Bn., a growth of 5.5%, and the highest ever PAT of Rs. 9.6 Bn. The significant growth in business volumes coupled with a gain of Rs. 1.1 Bn. from trading in Government Securities, demonstrating our strong presence in the Government Securities market, contributed to this performance. Furthermore, NSB has consistently recorded a PBT of
over Rs. 13.0 Bn. in the past three years.
Non-interest income comprising fee and commission income, net gain from trading, financial investments, and other operating income contributed to record an impressive growth of 337.8% to touch
Rs. 4.4 Bn. as opposed to Rs. 1.0 Bn. reported during 2016. The impact of the substantial increase in interest cost and the resulting drop in the net interest margin was offset by a substantial increase in
business volumes. Consequently, the interest income stood at Rs. 103.4 Bn.
Making history once more, the gross NPL ratio decreased to 1.3%, one of the lowest in the banking industry average, compared to 1.6% in 2016. The improvement in the NPL ratio was supported by
substantial growth in the loans and advances and demonstrates sound management of the Bank’s credit portfolio, excellent asset quality, and the prudent approach to risk management of the Bank. The Bank’s
total capital adequacy ratio stands at an impressive 15.3%, among the highest in the State-banking sector.
Expanding the virtual and physical footprintWith a financial heritage of over 180 years, NSB has successfully weathered many disruptive shifts in the industry. NSB recognises that rapid digitalisation of the banking sector worldwide with the proliferation
of mobile, online, and digital banking services has not made traditional branch banking obsolete. Rather than letting technology “disrupt” our operations we have taken steps to innovate and evolve our
existing branch network while delivering competitive digital services to meet the changing needs and expectations. We have witnessed that our strategic responses over the past years have contributed to deliver a better customer experience in the physical as well as the virtual domains serving customers
from all segments of society.

29
National Savings Bank Annual Report 2017
NSB expanded its wide-ranging reach to 253 branches. Our extensive, islandwide customer touchpoints include 4,062 post offices. Further, with the introduction of the innovative digital product NSB iSaver in partnership with SLT Mobitel, our customers can save money using 16,000+ mCash retailers across the country. The “Model Branch” concept, under the brand name “NSB Connect”, launched in 2017, will be
implemented across 50 branches islandwide in 2018.
In 2017, the Bank’s regional operational structure was revamped where all branches were consolidated into nine regions during the year. Moreover, the branches initiated customer forums and regional level progress review meetings to appraise the performance and customer satisfaction of branches in 2017.
Advancing the learning culture We have consistently recognised that continual learning is critical to our continued success. I am proud
to say that we have created a learning culture within NSB through our annual training programmes, our knowledge sharing, and our intellectual capital with its accumulated wisdom and experience. Our team of dedicated, highly-skilled, loyal employees, many with over 10 years of service, have
embraced the prevalent learning culture at NSB to become business leaders and provide better value to our stakeholders.
In 2017, over Rs. 34.4 Mn. was invested in 252 training programmes which included foreign and local training initiatives, logging a massive 45,347 training hours. The average number of training hours per employee stood at 12 hours and the participation ratio stood at 88%. There were 14 overseas training
programmes for 53 participants from NSB. We will continue to invest in training programmes to maintain our unique learning culture.
Towards women’s empowerment We recognise that empowerment of women, who constitute more than half the population of Sri Lanka, will provide impetus in Sri Lanka’s journey to achieve middle-income status. NSB has taken a holistic
approach to empower women through specialised products and enabling the women within our workforce. We can boast of a very healthy male to female ratio of 6:5 at all levels with a 58% of
women in our total workforce. We are an equal opportunity employer that does not discriminate on the grounds of gender.

30
National Savings Bank Annual Report 2017
In 2017, our flagship product Sthree, aimed at promoting financial freedom in Sri Lankan women, was revamped and relaunched. The relaunch is part of NSB’s theme in 2017 to promote and mobilise savings deposits. A brand ambassador was appointed and the product was relaunched with new benefits. We will
continue our efforts to assist in women’s empowerment through diverse means.
Glimpsing into tomorrow Our strategy towards diversification have led to spurred activity in the international front to boost our
presence in the international markets. We are poised to take advantage of the myriad opportunities resulting from the steady growth in international markets in 2017. We plan to enter the European,
Canadian, and United Kingdom markets to attract more remittances from the Sri Lankan expatriates. We hope to improve the market share of remittances which has shown exorbitant growth over
the past three years.
We will also focus expanding our savings products portfolio and continue to provide Master Card and Visa chip debit cards (EMV) where our customers can experience enhanced security in their transactions worldwide. We have also laid the preliminary ground work for the acquisition of Sri Lanka Savings Bank
(SLSB) in 2017. The due diligence studies related to the acquisition are completed and actions were initiated for its finalisation.
Following our triennial business plan 2017-2019, we will expand our footprint as a retail bank.
Continuing our digital initiatives and improving ICT infrastructure will be top priority in 2018 through innovative products like iSaver and NSB Reach. In our unique way, we will conflate traditional, familiar banking with the latest digital products and services to provide a superior experience to our customers
that hail from all segments of Sri Lankan society.

31
National Savings Bank Annual Report 2017
Expressing appreciationIn closing, I would like to extend my appreciation to those who played an instrumental role in making our 2017 story unique. I would like to express my gratitude to the Chairman, the Board of Directors, and my Management Team for their continued support and exemplary governance. I also extend my gratitude to Hon. Minister of Public Enterprise Development, Hon. State Minister of Public Enterprise Development, Secretary to the Ministry of Public Enterprise Development and the Officials, Hon. Minister of Finance
and Mass Media, the Hon. Deputy Minister of Finance and Mass Media, the Hon. State Minister of Finance, Secretary to the Treasury and the Officials, the Governor and Officials of the Central Bank of
Sri Lanka, the Postmaster General and his Staff, the Attorney General, the Auditor General and his team, Heads of other regulatory bodies, and their teams.
Our 2017 success story would not be possible without the dedication and loyalty of the NSB team, the trust and confidence of our customers, and the support of our stakeholders. Thank you all for making
2017 another gripping chapter of our unique story.
S D N PereraGeneral Manager/CEO
12 March 2018

NSB’s Unique Business Model
33
National Savings Bank Annual Report 2017
NSB’s unique mandate to foster a savings culture, serve and contribute to the Nation, and cater to all segments of the Sri Lankan society, form the founding pillars of the Bank’s
unique Business Model.
Our Business Model provides an overview of the Bank's value creation process guided byour Vision, Mission, Values, and our strategic pillars. The operating environment reflects
the context in which we operate, the local and international economies, and the trends in the industry as a whole. This section will also include the threats, opportunities, and
future outlook of the industry.
In “Stakeholders”, we outline stakeholder groups which have a substantial impact on our ability to create value and the methods we use to engage with them.
This will also include how stakeholders impact our business activities and how the Bank created value for them in 2017.
Assessment of our Business Model, operating environment, along with proactive
stakeholder engagement shaped our material issues and aspects that add or distract value. These along with resultant risk and opportunities from material matters lead to the
formation of the Bank’s strategy. “Our strategy” outlines NSB’s business plan and the Bank’s strategic direction.

34
National Savings Bank Annual Report 2017
Key resources and relationships (inputs) Value creation
Inp
ut
fro
m O
rga
nis
ati
on
Inp
ut
fro
m S
oci
ety
Financial Capital Refer to pages 73 to 89
Manufactured Capital Refer to pages 100 to 105
Intellectual Capital Refer to pages 92 to 99
Human Capital Refer to pages 108 to 121
Social and Relationship Capital Refer to pages 124 to 139
Natural Capital Refer to pages 142 to 145
Corporate Governance
Risk Management and Compliance
Exte
rnal
env
iron
men
t
External environment
Our business activities
Accepting deposits (Rs./FC)Retail lending
Corporate lending/Trade financeInward and outward Remittances
Treasury and money market operations
External environment
Internal environment
External environment
Internal environment
Inte
rnal
env
iron
men
t
Mis
sio
nVision
Values
Internal environment

35
National Savings Bank Annual Report 2017
Profit after tax – Rs. 9.6 Bn.Asset base – 1.01 Tn.Interest paid – Rs. 78.4 Bn.Loans disbursed – 187.3 Bn.Contributed to the Government: Rs. 13.4 Bn.
Branches – 253Postal network – 4,062ATMs – 286ICT investment – Rs. 712.4 Mn.
Employee benefits – Refer to page 114Promotions granted – 824Employee strength – 4,470Recruitments – 216Investment in training – Rs. 34.4 Mn.Training hours – 45,347Retention rate – 96.7%
Brand value – USD 168 Mn.Brand ranking – 5th most valuable brandFitch Ratings Lanka (lka) – AAA (lka)S&P Global Ratings – B+ stableFitch Ratings – B+ stable
Number of accounts – 19.9 millionCommunity development investment – Rs. 20.4 Mn.Contribution to the society – Refer to page 135
Plants distributed – 25,000Investment – Rs. 1.8 Mn.Eco loans granted – 902Value of Eco loans – Rs. 686 Mn.
ShareholderFinancial stabilityContribution to the Nation
CustomersExpanded business viabilityEnhanced accessibility and convenienceFinancial inclusionEfficient customer serviceExtensive product portfolioDigital product offering
EmployeesGreater level of employee engagementSafe working environmentGenerating local employmentEmployee satisfaction and loyalty
Regulators and Government institutionsCommunity developmentAn exemplary culture of compliance
Suppliers and service providersBuilding good relationships with suppliers
Society and environmentMitigating the negative impact of our business on the environmentEnergy efficiencyResponsible corporate citizenDrive towards renewable energySupporting to increase the domestic and national savings
Financial and non-financial performance (outputs)
Value created for stakeholders (outcomes)
Eco
no
mic
So
cia
lE
nvi
ron
men
t
36
National Savings Bank Annual Report 2017
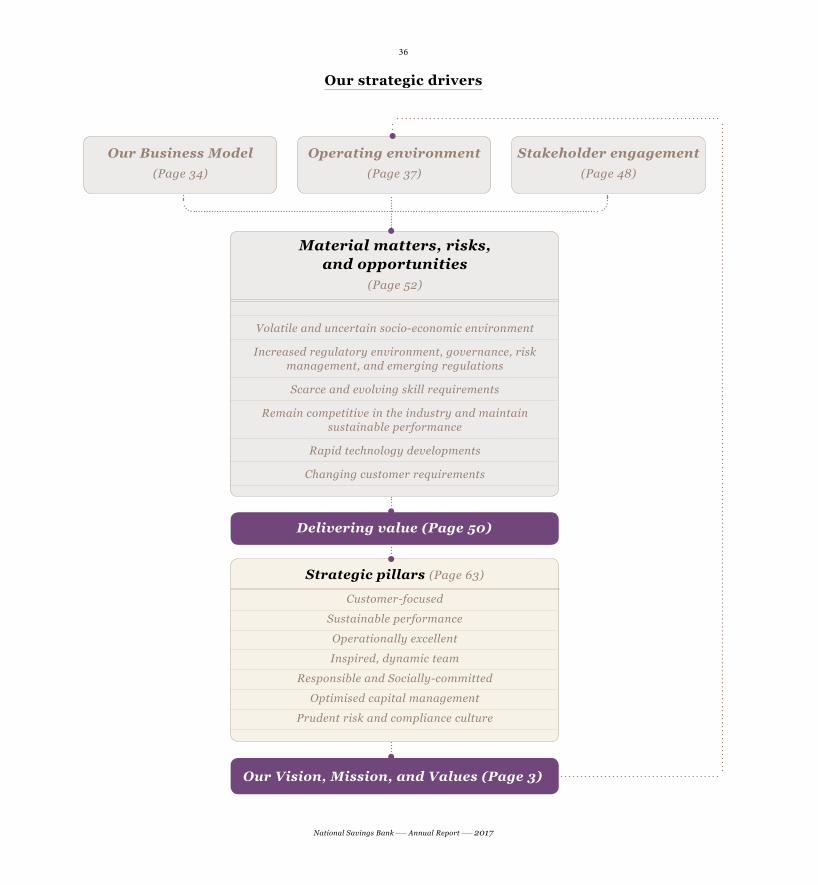
Our strategic drivers
Our Business Model(Page 34)
Material matters, risks, and opportunities
(Page 52)
Volatile and uncertain socio-economic environment
Increased regulatory environment, governance, risk management, and emerging regulations
Scarce and evolving skill requirements
Remain competitive in the industry and maintain sustainable performance
Rapid technology developments
Changing customer requirements
Operating environment(Page 37)
Stakeholder engagement(Page 48)
Delivering value (Page 50)
Our Vision, Mission, and Values (Page 3)
Strategic pillars (Page 63)
Customer-focused
Sustainable performance
Operationally excellent
Inspired, dynamic team
Responsible and Socially-committed
Optimised capital management
Prudent risk and compliance culture

37
National Savings Bank Annual Report 2017
Operating environment Operating environment is the sum of all external and internal factors that influence
the Bank. NSB is conscious that the socio-economic, and political trends in the world and in Sri Lanka impacts the Bank’s strategic decisions and financial performance. The following section outlines the micro and macro environmental trends in 2017.
Global economy
As the global financial crisis subsides, the world economy strengthened in 2017. The global economic growth rate reached 3% recording a highest growth rate since 2011.
The world economic growth is expected to remain steady for the coming years. The global output is estimated to have grown by 3.7% in 2017. The global growth forecast have been
revised upward to 3.9%. The revision reflects increased global growth momentum and the expected impact of the recently approved US tax policy changes.
The improved growth is due to spurred activity in several developed economies with the US growth up by 2.3% in 2017 given stronger than expected activity in capital spending,
a turnaround in inventories, and strengthening external demand. While growth accelerated in all major economies, the improvement was markedly stronger than
expected in the Euro Area with 2.4%. Another notable developed economy growth was recorded in Japan with an estimated 1.7% growth in 2017. The growth was supported
by increased domestic demand, recovery in consumer spending, as well as the implementation of a fiscal stimulus package.
In 2017, East and South Asia accounted for nearly half of global growth, with China alone contributing about one-third with 6.8%. The end of recessions in Argentina, Brazil,
Nigeria, and the Russian Federation also contributed to the rise in the rate of global growth between 2016 and 2017. The upturn has been supported by a rebound in world
trade and an improvement in investment conditions.
Outlook
The improved global economic situation provides an opportunity for countries to focus policy towards longer-term issues such as low carbon economic growth, reducing
inequalities, economic diversification, and eliminating deep-rooted barriers that hinder
38
National Savings Bank Annual Report 2017
development. The challenge is to channel this growth into a sustained acceleration in productive investment to support medium-term prospects.
Emerging and developing Asia will grow at around 6.5% over 2018-19. Growth is expected to moderate gradually in China. India's growth is expected to rise in 2018-19. Conversely,
growth in Emerging Markets and Developing Economies (EMDEs) is expected to accelerate, reaching 4.5% in 2018 and an average of 4.7% in 2019-20. Advanced economies
are expected to maintain the same growth level as in 2017, with an expected pick-up in growth across advanced economies such as the United States, France, and Japan.
Risks to the outlook remain tilted to the downside. Financial market volatility has been unusually low and asset prices have become highly valued, suggesting the risk
of sudden market adjustments. Increased trade protectionism and rising geopolitical tensions could weigh on sentiment and disrupt the recovery. Over the longer term,
a sharper-than expected slowdown in potential output growth could reduce the resilience of the global economy to adverse shocks and damage prospects for gains in living
standards and poverty reduction.
Sri Lankan economy
Sri Lanka grew by 3.1% in 2017, below the June forecast, as a resultof disruptions from droughts and floods. Despite monetary policy tightening to ease
inflationary pressures in the first half of 2017, credit growth remained strong, supporting private consumption and investment.
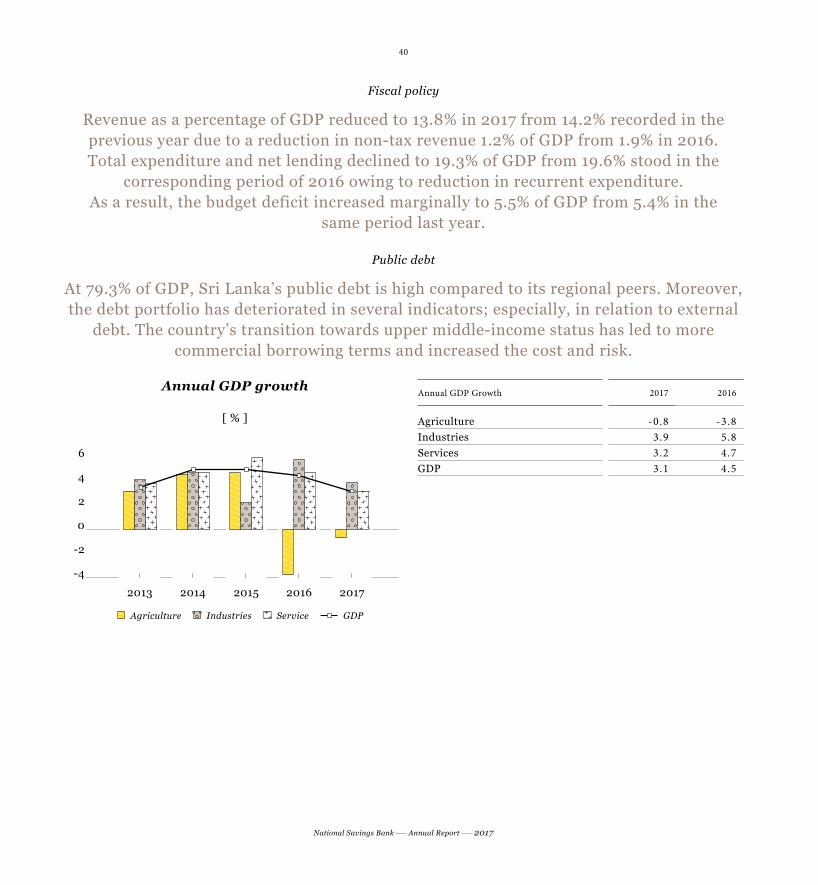
The services sector contributed 55.8% of growth which stretched by 3.2% from 2016, particularly by telecommunication, financial services, human health, insurance and
wholesale, and retail trade. Industrial activities with the share of 27.2% had a positive impact by recording a modest growth of 3.9% underpinned by construction, mining and quarrying, and manufacturing sectors. The agriculture sector, however, has contracted
by 0.8% mainly due to unfavourable weather conditions, severe drought, as well as heavy rainfall prevailing in the country for last two years which consequently curtailed
economic growth. The Sri Lankan Rupee depreciated against the US Dollar by 2% at the end of the December 2017 on the ground of foreign outflaws
owing to increased import expenditure, debt service payments and a reduction in foreign investments in Government Securities.

39
National Savings Bank Annual Report 2017
Inflation
Headline inflation based on NCPI (National Consumer Price Index) closed at 7.3% in 2017, albeit tight monetary policy and slowdown of credit growth fuelled by increased food prices and imported commodities. The scope of VAT broadened to remove exemptions on
selected private health-related items. The rate was raised from 11% to 15% which came into effect from November 2016, which was fully felt during 2017.
Monetary policy
Sri Lanka is pursuing a 3-year reform programme with IMF support under the Extended Fund Facility (EFF) since June 2016. Macro stabilisation and two major tax reforms were
the key outcomes of the first half of the programme. Accordingly, the monetary policy was tightened by the CBSL to control inflation as well as monetary pressures and credit
aggregates. Policy interest was raised by 25 basis points in March 2017 which resulted in increasing the Standing Deposit Facility Rate (SDFR) and the Standing Lending Facility Rate (SLFR) to 7.25 % and 8.75%, respectively. Eventually, market interest rates moved upwards combined with deposit and lending rates of commercial banks during the first half of the year. Reversing this trend, short-term rates adjusted downwards reflecting
liquidity improvements in the domestic money market during the second half of the year. Yield on Treasury bills in the primary market escalated during first quarter of 2017
associated with increased demand for funds from the Government.
External sector
The country’s cumulative export earnings during 2017 recorded an all time high of USD 11.4 Bn., up 10.2% from 2016 and surpassed the previous best of USD 11.1 Bn.
achieved in 2014. This was primarily driven by tea, petroleum products, garments, spices, and seafood. Restoration of the GSP+ facility together with removal of the ban on exports of fisheries products to the European markets paved the way to improve export earnings
of the country. Import expenditure for the year accelerated by 9.4% to USD 20.98 Bn. reporting historically highest values on account of higher imports of fuel, rice, gold and base metals led the country’s trade deficit to widen to USD 9.62 Bn. against the
USD 8.87 Bn. stood in the corresponding period of 2016. Workers’ remittances, being the key source of foreign exchange income, continued to deteriorate by 1.1% to USD 7.2 Bn.
due to slow pace of external economic recovery in several advanced economies and emerging markets and adverse geopolitical conditions in the Middle East countries.
40
National Savings Bank Annual Report 2017
Fiscal policy
Revenue as a percentage of GDP reduced to 13.8% in 2017 from 14.2% recorded in the previous year due to a reduction in non-tax revenue 1.2% of GDP from 1.9% in 2016. Total expenditure and net lending declined to 19.3% of GDP from 19.6% stood in the
corresponding period of 2016 owing to reduction in recurrent expenditure. As a result, the budget deficit increased marginally to 5.5% of GDP from 5.4% in the
same period last year.
Public debt
At 79.3% of GDP, Sri Lanka’s public debt is high compared to its regional peers. Moreover, the debt portfolio has deteriorated in several indicators; especially, in relation to external
debt. The country’s transition towards upper middle-income status has led to more commercial borrowing terms and increased the cost and risk.
Annual GDP Growth 2017 2016
Agriculture -0.8 -3.8Industries 3.9 5.8Services 3.2 4.7GDP 3.1 4.5
Annual GDP growth
[ % ]
6
4
2
0
-2
-4
2017201620152013 2014
Agriculture Industries Service GDP

41
National Savings Bank Annual Report 2017
Commercial banks lending and deposit rates 2017
[ % ]
15 14 13 12 11 10
9 8
29 Dec.
31 Aug.
28 Apr.
30 Nov.
31 Jul.
31 Mar.
31 Oct.
30 Jun.
28 Feb.
29 Sep.
31 May
29 Jan.
AWLR AWPR AWDR AWFDR
Outlook
The International Monetary Fund (IMF) sees the stabilising of Sri Lanka’s economy in 2018 with GDP growth expected to reach about 5%. Growth in the region excluding India
is expected to remain stable at an average 5.9% a year, as domestic demand remains robust and exports recover.
Sri Lanka’s economic reform agenda, supported by the World Bank and IMF programmes, is expected to sustain macroeconomic stability and support potential growth over the
medium term. Public debt is expected to decline amid ongoing fiscal consolidation, which will open fiscal space and enable the country to allocate public spending towards human
capital investments that support potential growth.
The Foreign Exchange Act replaced by the Government focuses on further liberalisation of exchange rate flexibility and better management of exchange reserves which could
result in attracting more Foreign Direct Investment (FDI) and encourage the free flow of capital. The Inland Revenue Act passed in October 2017 with the objective of reducing the fiscal deficit and simplifying tax compliance could mobilise additional revenue that could
support growth-enhancing spending, including infrastructure investment.
Further, Government’s policy reforms towards fiscal consolidation, changes to the Foreign Direct Investment Policy to attract investors, formulating cohesive export strategy, and

42
National Savings Bank Annual Report 2017
improving international relations are expected to place a significant impact on long-term economic development and country’s growth potential.
The Sri Lankan banking industry
Sri Lanka’s banking sector consists of 13 local and 12 international licensed commercial banks (LCB) and seven licensed specialised banks (LSB). These institutions have been classified as large, medium, and small banks based on their asset base, with the top 6
banks (assets over Rs. 500 Bn.) holding a dominant share of assets, loans and advances, and deposits. Sri Lanka’s financial services sector accounts for 5.7% of the GDP and plays
a critical role through financial intermediation in facilitating economic growth. With the Government’s regional development agenda, the banking sector is expected to play an important role in enhancing financial inclusion, and providing access to affordable
financial solutions across the country.
Growth
Total assets of the banking sector grew 13.77% to Rs. 10.3 Tn. at the end of 2017 underpinned by expansion of credit and investment portfolios, compared to 10.8% growth recorded in 2016. Total loan and advances, which is the largest asset base of the banking
sector widened by 16.2% boosted by large disbursements towards transport, trading, tourism, and manufacturing sectors amidst the higher market interest rates.
Profitability
The banking sector reported a profit (after tax) of Rs. 138.9 Bn. during 2017, which is an increase of 19.2% when compared with the corresponding period of 2016. Strong net
interest income coupled with significant capital gains and better cost efficiencies were the key contributory factors to this impressive performance. The sector’s Return on Assets
(ROA) and Return on Equity (ROE) closed at 2.0% and 17.6% respectively.
Asset quality
The NPL ratio dropped to 2.5% at the end of December 2017 against 2.6% clocked in 2016, triggered by recovery measures adopted by banks and higher growth in the credit portfolio
despite the NPLs increasing by Rs. 18.4 Bn. to Rs. 160.7 Bn.

43
National Savings Bank Annual Report 2017
Funding position
Deposits, which were the main source of funding, represented 71.9% of the total assets of the banking sector. Total deposit base of the sector expanded by 17.5% to achieve Rs. 7.4 Tn. at the end of the 2017 driven by the term deposits prevailed in the upward interest trajectory.
Sector borrowings declined 5.3% to Rs. 1.6 Tn. during the year owing to drop in rupee borrowings following the CBSL announcement to raise policy rates by the 25 bps.
Capitalisation
The pressure on banking sector to have a higher percentage of quality capital has increased with implementation of new Basel III direction. The banking sector was able to maintain sufficient capital levels in order to absorb any adverse shocks throughout
the year, though it fell due to credit expansion. The Tier 1 Risk Weighted Capital Adequacy Ratio (RWCAR) and overall RWCAR clocked in 12.4% and 15.2% respectively in
comparison to 12.6% and 15.6% recorded in the corresponding period in 2016.
Liquidity
Liquidity position of the sector continued to maintain at healthy level and Statutory Liquid Assets Ratio (SLAR) were maintained at 27.2% well above the minimum
requirement of 20%, whilst the ratio of liquid assets to total assets registered at 28.3%.
Assets and loans growth
[ % ]
25
20
15
10
5
0
20172016201520142013
Assets Loans and Advances
Deposits and borrowings growth
[ % ]
24
18
12
6
0
-6
20172016
Deposits Borrowings
44
National Savings Bank Annual Report 2017
Outlook
The CBSL intends to strengthen the regulatory and supervisory framework to ensure the soundness of banks and protect the customers through the following policy reforms and guidelines. Greater regulatory requirements would increase the cost of banking and lead
to a slowdown in loan growth.
CBSL Road Map 2018: Key initiatives
CA Sri Lanka has issued the Sri Lanka Accounting Standard – SLFRS 9 (Financial Instruments), which would be effective from 1 January 2018. Adoption of the “expected loss model” in place of the “incurred loss model” for impairment testing upon implementation of SLFRS 9 is expected to substantially increase the impairment provision of banks.
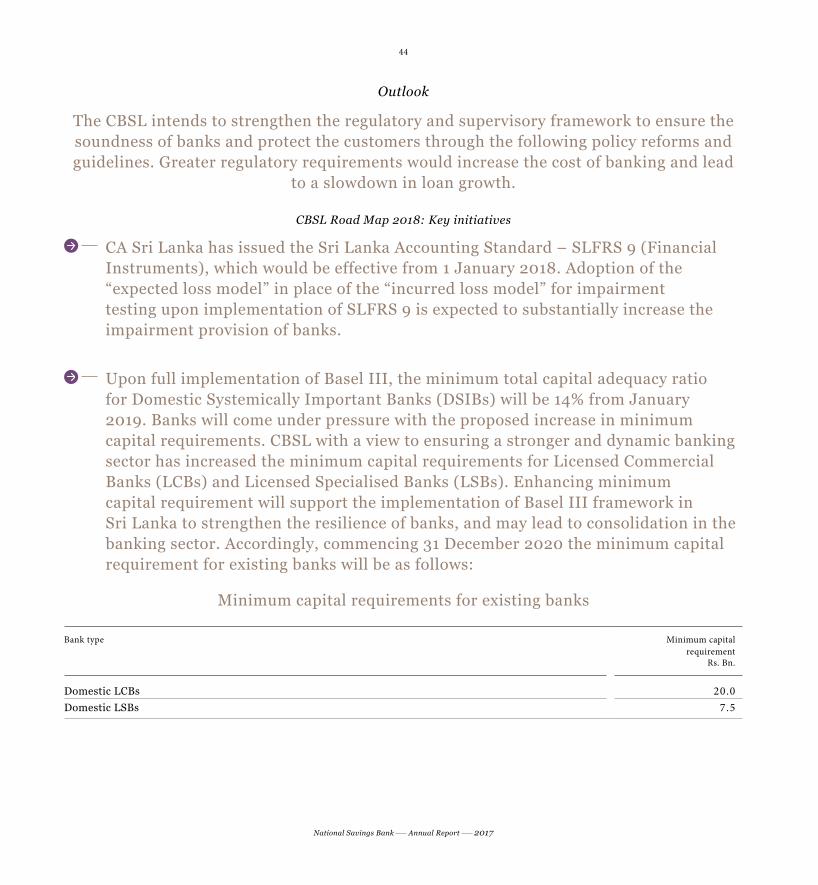
Upon full implementation of Basel III, the minimum total capital adequacy ratio for Domestic Systemically Important Banks (DSIBs) will be 14% from January 2019. Banks will come under pressure with the proposed increase in minimum capital requirements. CBSL with a view to ensuring a stronger and dynamic banking sector has increased the minimum capital requirements for Licensed Commercial Banks (LCBs) and Licensed Specialised Banks (LSBs). Enhancing minimum capital requirement will support the implementation of Basel III framework in Sri Lanka to strengthen the resilience of banks, and may lead to consolidation in the banking sector. Accordingly, commencing 31 December 2020 the minimum capital requirement for existing banks will be as follows:
Minimum capital requirements for existing banks
Bank type Minimum capital requirement
Rs. Bn.
Domestic LCBs 20.0Domestic LSBs 7.5

45
National Savings Bank Annual Report 2017
The new Inland Revenue Tax is introduced with the view to enhance direct tax. Removal of most of the tax concessions currently available, combined with removal of notional tax credit on Government Securities and introduction of 0.02% Debt Repayment Levy are expected to significantly increase tax liability of banks.
Introduction of new foreign exchange management framework for further relaxation of capital transactions of the economy.
CBSL is to develop Anti-money Laundering and Countering the Financing of Terrorism with the view to strengthening the financial intelligence environment.
Introduction of an effective Flexible Inflation Targeting (FIT) framework to preserve price stability of the economy by targeting inflation rang of 4-6 %.
Directions have already been issued on financial derivative transaction to streamline the risk management process and foreign currency borrowing limits based on the total assets of a bank replacing the previous direction involving assets of Domestic Banking Unit (DBU) only.
Adoption and implementation of measures to strengthen the payment and settlement infrastructure and to facilitate the transition to a less-cash dependent society.
Government's commitment to reform State-Owned Enterprises (SOEs) in order to reduce future financial losses of key SOEs which will have a positive impact on the balance sheets of both the Government and state banks.
46
National Savings Bank Annual Report 2017
StakeholdersOur stakeholder engagement process
Being a diversified, responsible financial service provider, deep relationships with our stakeholders are important to us. By achieving sustainable growth that creates long-term
value for our stakeholders, we are committed to make a difference in the lives of our stakeholders and to the community in which we operate.
Our long-term business strategies are aligned with the interests of our stakeholders to
create sustainable value. Productive stakeholder engagement builds lasting relationships and enabling better service and a better stakeholder experience. Stakeholder feedback
gathered through dialogue, collaboration, and other methods (listed below), helps us fulfil their expectations while assessing the socio-environmental, and governance risks and
opportunities across our business.
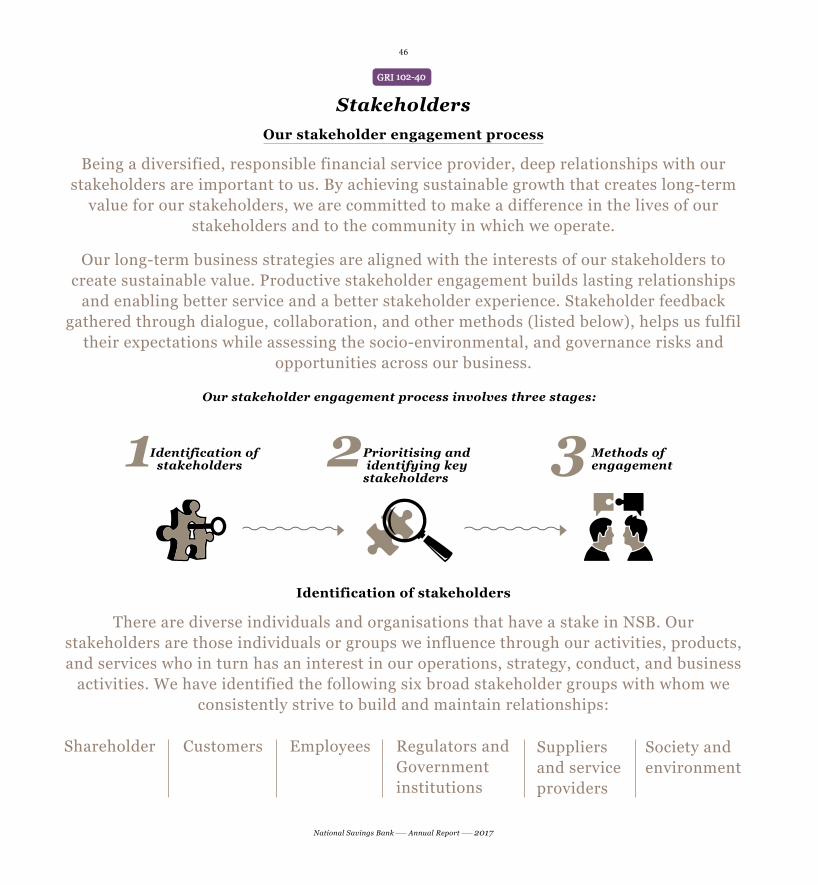
Our stakeholder engagement process involves three stages:
2Prioritising and identifying key stakeholders
3Methods of engagement1Identification of
stakeholders
Identification of stakeholders
There are diverse individuals and organisations that have a stake in NSB. Our stakeholders are those individuals or groups we influence through our activities, products, and services who in turn has an interest in our operations, strategy, conduct, and business
activities. We have identified the following six broad stakeholder groups with whom we consistently strive to build and maintain relationships:
Shareholder Customers Employees Regulators and Government institutions
Suppliers and service providers
Society and environment
GRI 102-40

47
National Savings Bank Annual Report 2017
Prioritising and identifying key stakeholders
We have prioritised our stakeholders based on their relevance to the Bank’s issues. We continuously monitor our stakeholders’ needs and expectations to create value for
them as well as to balance the conflicting priorities of our stakeholders. We identify our key stakeholders by mapping them using the Mendelows matrix.
Keep satisfiedRegulators and
Government institutions
Minimum effortSuppliers & service providers and
society & environment
Key playersShareholder and customers
Keep informedEmployees
High
Power
Interest
High
Low
Low
Methods of engagement
Stakeholder engagement is a core component of our business, our strategy, our annual reporting process, and our activities islandwide. Our engagements range from meetings with local, regional, and national groups to ongoing dialogues with our customers and suppliers. Actively listening to our various stakeholders, engaging in an open dialogue
with them and responding to their views and concerns are very important for us.
A summary of the key issues for each of our stakeholder groups, and a table depicting an outline of our stakeholder engagement in 2017 is provided below:
GRI 102-42

48
Stakeholder engagement
Customers
Employees
Shareholder
Regulators and Government institutions
Society and environment
IndividualsInstitutionsCorporatesEntrepreneurs
Permanent employeesEmployees on contract basisOutsourced personnelTrade unions
GOSL represented by Ministry of Finance
CBSLMinistry of Public Enterprises Development (MPED)IRDAuditor Generals DepartmentOther Government and professional organisations
Society at largePressure GroupsMedia
Suppliers and service providers
SuppliersUtility service providersOther service providers
Stakeholders GRI 102-43, 44
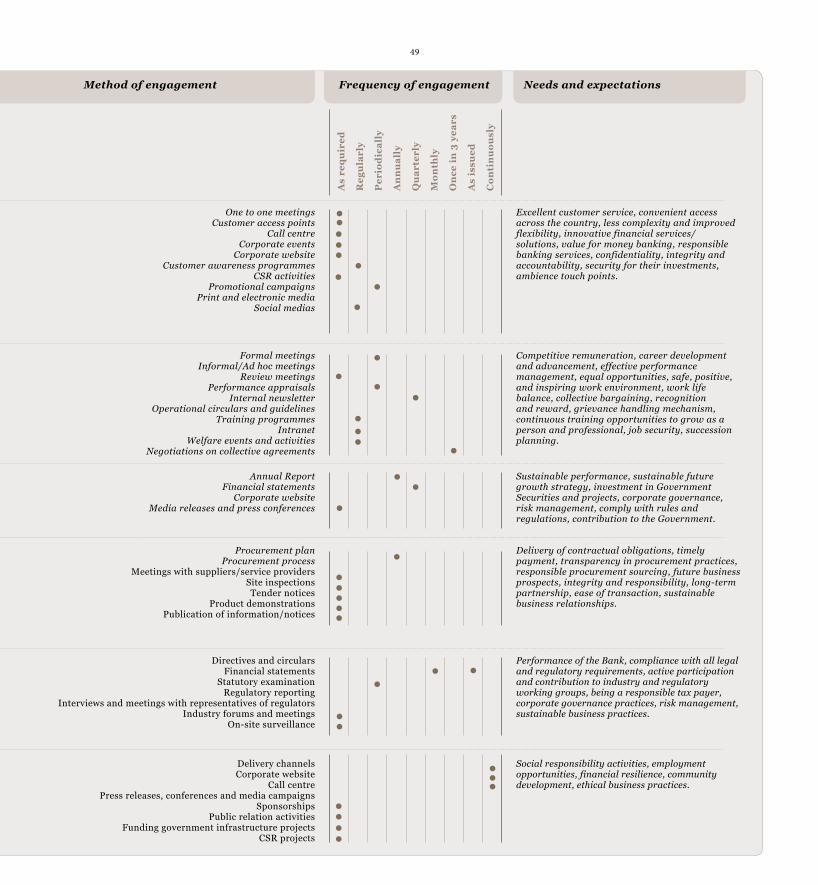
49
One to one meetingsCustomer access points
Call centreCorporate events
Corporate websiteCustomer awareness programmes
CSR activitiesPromotional campaigns
Print and electronic mediaSocial medias
Formal meetingsInformal/Ad hoc meetings
Review meetingsPerformance appraisals
Internal newsletterOperational circulars and guidelines
Training programmesIntranet
Welfare events and activitiesNegotiations on collective agreements
Annual ReportFinancial statements
Corporate websiteMedia releases and press conferences
Procurement planProcurement process
Meetings with suppliers/service providersSite inspectionsTender notices
Product demonstrationsPublication of information/notices
Directives and circularsFinancial statements
Statutory examinationRegulatory reporting
Interviews and meetings with representatives of regulatorsIndustry forums and meetings
On-site surveillance
Delivery channelsCorporate website
Call centrePress releases, conferences and media campaigns
SponsorshipsPublic relation activities
Funding government infrastructure projectsCSR projects
As
req
uir
ed
Reg
ula
rly
Per
iod
ical
ly
An
nu
ally
Qu
arte
rly
Mo
nth
ly
On
ce i
n 3
yea
rs
As
issu
ed
Co
nti
nu
ou
sly
Excellent customer service, convenient access across the country, less complexity and improved flexibility, innovative financial services/solutions, value for money banking, responsible banking services, confidentiality, integrity and accountability, security for their investments, ambience touch points.
Competitive remuneration, career development and advancement, effective performance management, equal opportunities, safe, positive, and inspiring work environment, work life balance, collective bargaining, recognition and reward, grievance handling mechanism, continuous training opportunities to grow as a person and professional, job security, succession planning.
Sustainable performance, sustainable future growth strategy, investment in Government Securities and projects, corporate governance, risk management, comply with rules and regulations, contribution to the Government.
Delivery of contractual obligations, timely payment, transparency in procurement practices, responsible procurement sourcing, future business prospects, integrity and responsibility, long-term partnership, ease of transaction, sustainable business relationships.
Performance of the Bank, compliance with all legal and regulatory requirements, active participation and contribution to industry and regulatory working groups, being a responsible tax payer, corporate governance practices, risk management, sustainable business practices.
Social responsibility activities, employment opportunities, financial resilience, community development, ethical business practices.
Frequency of engagement Needs and expectationsMethod of engagement
Cu
sto
mer
s
Wh
y d
o t
hey
ma
tter
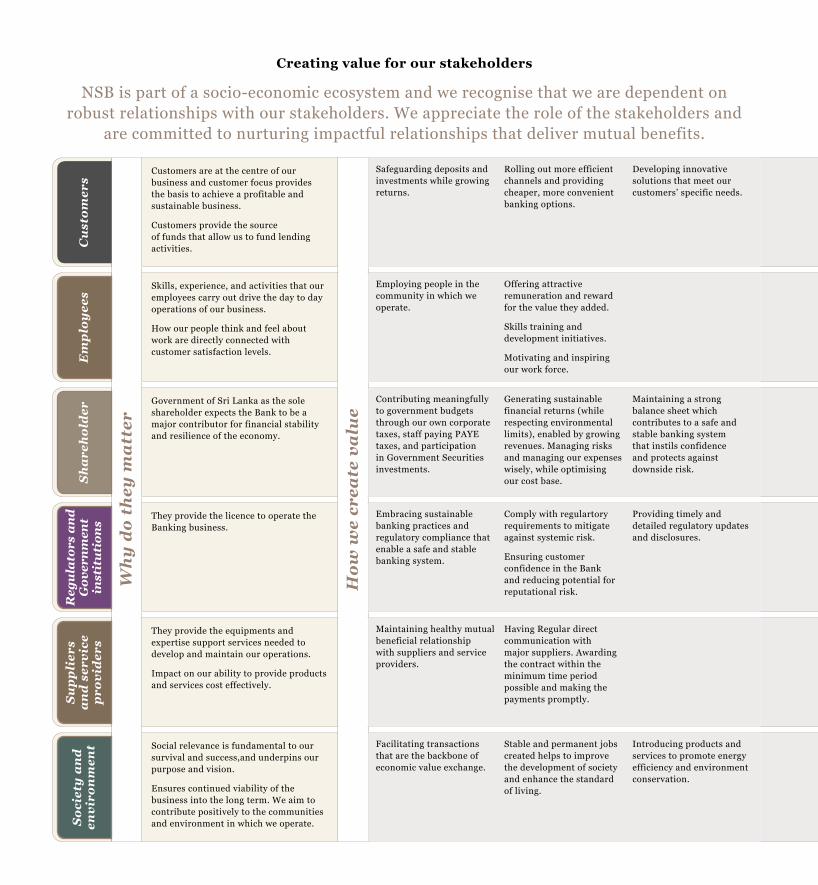
Customers are at the centre of our business and customer focus provides the basis to achieve a profitable and sustainable business.
Customers provide the source of funds that allow us to fund lending activities.
Ho
w w
e cr
eate
va
lue
Safeguarding deposits and investments while growing returns.
Rolling out more efficient channels and providing cheaper, more convenient banking options.
Developing innovative solutions that meet our customers’ specific needs.
Ho
w w
e cr
eate
d v
alu
e in
20
17
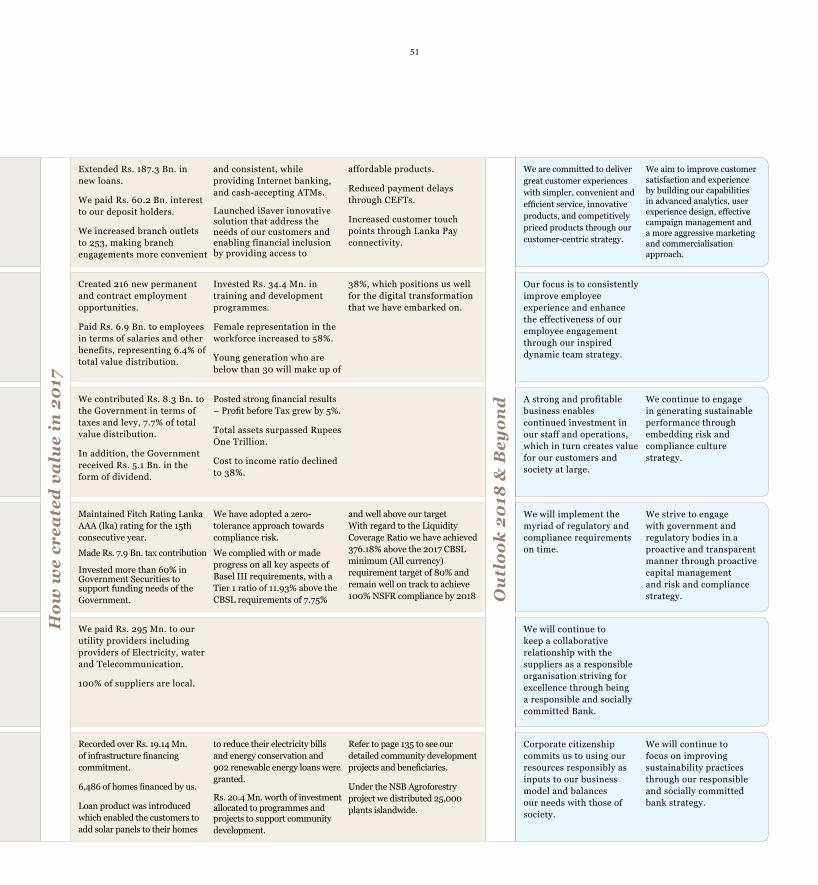
Extended Rs. 187.3 Bn. in new loans.
We paid Rs. 60.2 Bn. interest to our deposit holders.
We increased branch outlets to 253, making branch engagements more convenient
and consistent, while providing Internet banking, and cash-accepting ATMs.
Launched iSaver innovative solution that address the needs of our customers and enabling financial inclusion by providing access to
affordable products.
Reduced payment delays through CEFTs.
Increased customer touch points through Lanka Pay connectivity.
Ou
tlo
ok
20
18 &
Bey
on
d
We are committed to deliver great customer experiences with simpler, convenient and efficient service, innovative products, and competitively priced products through our customer-centric strategy.
We aim to improve customer satisfaction and experience by building our capabilities in advanced analytics, user experience design, effective campaign management and a more aggressive marketing and commercialisation approach.
Em
plo
yee
s
Skills, experience, and activities that our employees carry out drive the day to day operations of our business.
How our people think and feel about work are directly connected with customer satisfaction levels.
Employing people in the community in which we operate.
Offering attractive remuneration and reward for the value they added.
Skills training and development initiatives.
Motivating and inspiring our work force.
Created 216 new permanent and contract employment opportunities.
Paid Rs. 6.9 Bn. to employees in terms of salaries and other benefits, representing 6.4% of total value distribution.
Invested Rs. 34.4 Mn. in training and development programmes.
Female representation in the workforce increased to 58%.
Young generation who are below than 30 will make up of
38%, which positions us well for the digital transformation that we have embarked on.
Our focus is to consistently improve employee experience and enhance the effectiveness of our employee engagement through our inspired dynamic team strategy.
Sh
are
ho
lder
Government of Sri Lanka as the sole shareholder expects the Bank to be a major contributor for financial stability and resilience of the economy.
Contributing meaningfully to government budgets through our own corporate taxes, staff paying PAYE taxes, and participation in Government Securities investments.
Generating sustainable financial returns (while respecting environmental limits), enabled by growing revenues. Managing risks and managing our expenses wisely, while optimising our cost base.
Maintaining a strong balance sheet which contributes to a safe and stable banking system that instils confidence and protects against downside risk.
We contributed Rs. 8.3 Bn. to the Government in terms of taxes and levy, 7.7% of total value distribution.
In addition, the Government received Rs. 5.1 Bn. in the form of dividend.
Posted strong financial results – Profit before Tax grew by 5%.
Total assets surpassed Rupees One Trillion.
Cost to income ratio declined to 38%.
A strong and profitable business enables continued investment in our staff and operations, which in turn creates value for our customers and society at large.
We continue to engage in generating sustainable performance through embedding risk and compliance culture strategy.
Reg
ula
tors
an
d
Gov
ern
men
t in
stit
uti
ons
They provide the licence to operate the Banking business.
Embracing sustainable banking practices and regulatory compliance that enable a safe and stable banking system.
Comply with regulartory requirements to mitigate against systemic risk.
Ensuring customer confidence in the Bank and reducing potential for reputational risk.
Providing timely and detailed regulatory updates and disclosures.
Maintained Fitch Rating Lanka AAA (lka) rating for the 15th consecutive year.
Made Rs. 7.9 Bn. tax contribution
Invested more than 60% in Government Securities to support funding needs of the Government.
We have adopted a zero-tolerance approach towards compliance risk.
We complied with or made progress on all key aspects of Basel III requirements, with a Tier 1 ratio of 11.93% above the CBSL requirements of 7.75%
and well above our target With regard to the Liquidity Coverage Ratio we have achieved 376.18% above the 2017 CBSL minimum (All currency) requirement target of 80% and remain well on track to achieve 100% NSFR compliance by 2018
We will implement the myriad of regulatory and compliance requirements on time.
We strive to engage with government and regulatory bodies in a proactive and transparent manner through proactive capital management and risk and compliance strategy.
Su
pp
lier
s
an
d s
ervi
ce
pro
vid
ers
They provide the equipments and expertise support services needed to develop and maintain our operations.
Impact on our ability to provide products and services cost effectively.
Maintaining healthy mutual beneficial relationship with suppliers and service providers.
Having Regular direct communication with major suppliers. Awarding the contract within the minimum time period possible and making the payments promptly.
We paid Rs. 295 Mn. to our utility providers including providers of Electricity, water and Telecommunication.
100% of suppliers are local.
We will continue to keep a collaborative relationship with the suppliers as a responsible organisation striving for excellence through being a responsible and socially committed Bank.
So
ciet
y a
nd
en
viro
nm
ent Social relevance is fundamental to our
survival and success,and underpins our purpose and vision.
Ensures continued viability of the business into the long term. We aim to contribute positively to the communities and environment in which we operate.
Facilitating transactions that are the backbone of economic value exchange.
Stable and permanent jobs created helps to improve the development of society and enhance the standard of living.
Introducing products and services to promote energy efficiency and environment conservation.
Recorded over Rs. 19.14 Mn. of infrastructure financing commitment.
6,486 of homes financed by us.
Loan product was introduced which enabled the customers to add solar panels to their homes
to reduce their electricity bills and energy conservation and 902 renewable energy loans were granted.
Rs. 20.4 Mn. worth of investment allocated to programmes and projects to support community development.
Refer to page 135 to see our detailed community development projects and beneficiaries.
Under the NSB Agroforestry project we distributed 25,000 plants islandwide.
Corporate citizenship commits us to using our resources responsibly as inputs to our business model and balances our needs with those of society.
We will continue to focus on improving sustainability practices through our responsible and socially committed bank strategy.
Creating value for our stakeholders
NSB is part of a socio-economic ecosystem and we recognise that we are dependent on robust relationships with our stakeholders. We appreciate the role of the stakeholders and
are committed to nurturing impactful relationships that deliver mutual benefits.
51
Cu
sto
mer
s
Wh
y d
o t
hey
ma
tter
Customers are at the centre of our business and customer focus provides the basis to achieve a profitable and sustainable business.
Customers provide the source of funds that allow us to fund lending activities.
Ho
w w
e cr
eate
va
lue
Safeguarding deposits and investments while growing returns.
Rolling out more efficient channels and providing cheaper, more convenient banking options.
Developing innovative solutions that meet our customers’ specific needs.
Ho
w w
e cr
eate
d v
alu
e in
20
17
Extended Rs. 187.3 Bn. in new loans.
We paid Rs. 60.2 Bn. interest to our deposit holders.
We increased branch outlets to 253, making branch engagements more convenient
and consistent, while providing Internet banking, and cash-accepting ATMs.
Launched iSaver innovative solution that address the needs of our customers and enabling financial inclusion by providing access to
affordable products.
Reduced payment delays through CEFTs.
Increased customer touch points through Lanka Pay connectivity.
Ou
tlo
ok
20
18 &
Bey
on
d
We are committed to deliver great customer experiences with simpler, convenient and efficient service, innovative products, and competitively priced products through our customer-centric strategy.
We aim to improve customer satisfaction and experience by building our capabilities in advanced analytics, user experience design, effective campaign management and a more aggressive marketing and commercialisation approach.
Em
plo
yee
s
Skills, experience, and activities that our employees carry out drive the day to day operations of our business.
How our people think and feel about work are directly connected with customer satisfaction levels.
Employing people in the community in which we operate.
Offering attractive remuneration and reward for the value they added.
Skills training and development initiatives.
Motivating and inspiring our work force.
Created 216 new permanent and contract employment opportunities.
Paid Rs. 6.9 Bn. to employees in terms of salaries and other benefits, representing 6.4% of total value distribution.
Invested Rs. 34.4 Mn. in training and development programmes.
Female representation in the workforce increased to 58%.
Young generation who are below than 30 will make up of
38%, which positions us well for the digital transformation that we have embarked on.
Our focus is to consistently improve employee experience and enhance the effectiveness of our employee engagement through our inspired dynamic team strategy.
Sh
are
ho
lder
Government of Sri Lanka as the sole shareholder expects the Bank to be a major contributor for financial stability and resilience of the economy.
Contributing meaningfully to government budgets through our own corporate taxes, staff paying PAYE taxes, and participation in Government Securities investments.
Generating sustainable financial returns (while respecting environmental limits), enabled by growing revenues. Managing risks and managing our expenses wisely, while optimising our cost base.
Maintaining a strong balance sheet which contributes to a safe and stable banking system that instils confidence and protects against downside risk.
We contributed Rs. 8.3 Bn. to the Government in terms of taxes and levy, 7.7% of total value distribution.
In addition, the Government received Rs. 5.1 Bn. in the form of dividend.
Posted strong financial results – Profit before Tax grew by 5%.
Total assets surpassed Rupees One Trillion.
Cost to income ratio declined to 38%.
A strong and profitable business enables continued investment in our staff and operations, which in turn creates value for our customers and society at large.
We continue to engage in generating sustainable performance through embedding risk and compliance culture strategy.
Reg
ula
tors
an
d
Gov
ern
men
t in
stit
uti
ons
They provide the licence to operate the Banking business.
Embracing sustainable banking practices and regulatory compliance that enable a safe and stable banking system.
Comply with regulartory requirements to mitigate against systemic risk.
Ensuring customer confidence in the Bank and reducing potential for reputational risk.
Providing timely and detailed regulatory updates and disclosures.
Maintained Fitch Rating Lanka AAA (lka) rating for the 15th consecutive year.
Made Rs. 7.9 Bn. tax contribution
Invested more than 60% in Government Securities to support funding needs of the Government.
We have adopted a zero-tolerance approach towards compliance risk.
We complied with or made progress on all key aspects of Basel III requirements, with a Tier 1 ratio of 11.93% above the CBSL requirements of 7.75%
and well above our target With regard to the Liquidity Coverage Ratio we have achieved 376.18% above the 2017 CBSL minimum (All currency) requirement target of 80% and remain well on track to achieve 100% NSFR compliance by 2018
We will implement the myriad of regulatory and compliance requirements on time.
We strive to engage with government and regulatory bodies in a proactive and transparent manner through proactive capital management and risk and compliance strategy.
Su
pp
lier
s
an
d s
ervi
ce
pro
vid
ers
They provide the equipments and expertise support services needed to develop and maintain our operations.
Impact on our ability to provide products and services cost effectively.
Maintaining healthy mutual beneficial relationship with suppliers and service providers.
Having Regular direct communication with major suppliers. Awarding the contract within the minimum time period possible and making the payments promptly.
We paid Rs. 295 Mn. to our utility providers including providers of Electricity, water and Telecommunication.
100% of suppliers are local.
We will continue to keep a collaborative relationship with the suppliers as a responsible organisation striving for excellence through being a responsible and socially committed Bank.
So
ciet
y a
nd
en
viro
nm
ent Social relevance is fundamental to our
survival and success,and underpins our purpose and vision.
Ensures continued viability of the business into the long term. We aim to contribute positively to the communities and environment in which we operate.
Facilitating transactions that are the backbone of economic value exchange.
Stable and permanent jobs created helps to improve the development of society and enhance the standard of living.
Introducing products and services to promote energy efficiency and environment conservation.
Recorded over Rs. 19.14 Mn. of infrastructure financing commitment.
6,486 of homes financed by us.
Loan product was introduced which enabled the customers to add solar panels to their homes
to reduce their electricity bills and energy conservation and 902 renewable energy loans were granted.
Rs. 20.4 Mn. worth of investment allocated to programmes and projects to support community development.
Refer to page 135 to see our detailed community development projects and beneficiaries.
Under the NSB Agroforestry project we distributed 25,000 plants islandwide.
Corporate citizenship commits us to using our resources responsibly as inputs to our business model and balances our needs with those of society.
We will continue to focus on improving sustainability practices through our responsible and socially committed bank strategy.

52
National Savings Bank Annual Report 2017
Materiality matters, risks, and opportunitiesThis section delineates NBS’s management approach framework where the Bank
navigates through the socio-economic, and environmental impact and outlines process of determining and discussing the material aspects of the Bank.
In our integrated approach to doing business, we see materiality as a tool. Our material matters represent the issues that have the most impact on our ability to create value in the short, medium, and long term. Evolving stakeholders’ concerns and emerging new trends
and developments determine material matters.
We consider an issue to be material if it has the potential to substantially impact our commercial viability, our social relevance, and our relationship with stakeholders.
Our process of identifying and determining material issues includes an analysis of our Business Model (page 34), our operating environment (page 37), stakeholder engagement
(page 48), as well as issues that stem from our risk management process (page 201).
Internal information External information
Issues that received the most attention of the Board and the Management during the year
Management Committee reports
Board Committee reports
Research analysis done by the Research and Development Division on market conditions and sentiments
Internal Audit reports
Employee workshops
Reports and publications from regulatory bodies
Issues raised in parliamentary and Government speeches, statements, and policy documents.
Reports and articles by industry analysts and Rating agencies
Media coverage
Global and regional development concerns
Prioritising material aspects through the mapping process
Determination of material
issues
GRI 102-11 GRI 103-1, 2, 3

53
National Savings Bank Annual Report 2017
This materiality matrix shows the most relevant concerns for NSB that we identified in the materiality study, prioritised according to the level of importance for the business and
for stakeholders as well as their strongest interconnections. How the identified Bank’s material aspects correspond to the topics prescribed by GRI standards as well as non-GRI
standards are mapped and presented below:
GRI 102-47
Materiality
GRI Topic Significance to Bank’s operations
Boundary To the Bank
To thestakeholders
GRI 200: Economic
201 Economic performance High Internal High High
202 Market presence High Internal High High
203 Indirect economic impacts High Community High High
204 Procurement practices Low Internal High Low
205 Anti-corruption High Internal High High
206 Anti-competitive behaviour Low Community Low Low
GRI 300: Environmental
301 Materials Low Internal Low Low
302 Energy Moderate Internal Moderate Moderate
303 Water Moderate Internal Moderate Moderate
305 Emissions Low Internal Moderate Moderate
306 Effluents and waste Moderate Environment Low Moderate
307 Environmental compliance Low Environment Low Moderate
GRI 400: Social
401 Employment High Internal High High
403 Occupational health and safety Moderate Internal Moderate Moderate
404 Training and education High Internal High High
405 Diversity and equal opportunity High Internal High High
406 Non-discrimination High Internal High High
407 Freedom of association and collective bargaining High Internal High High
413 Local communities Moderate Community Moderate Moderate
415 Public policy Low Community Low Moderate
416 Customer health and safety Moderate Customers Moderate High
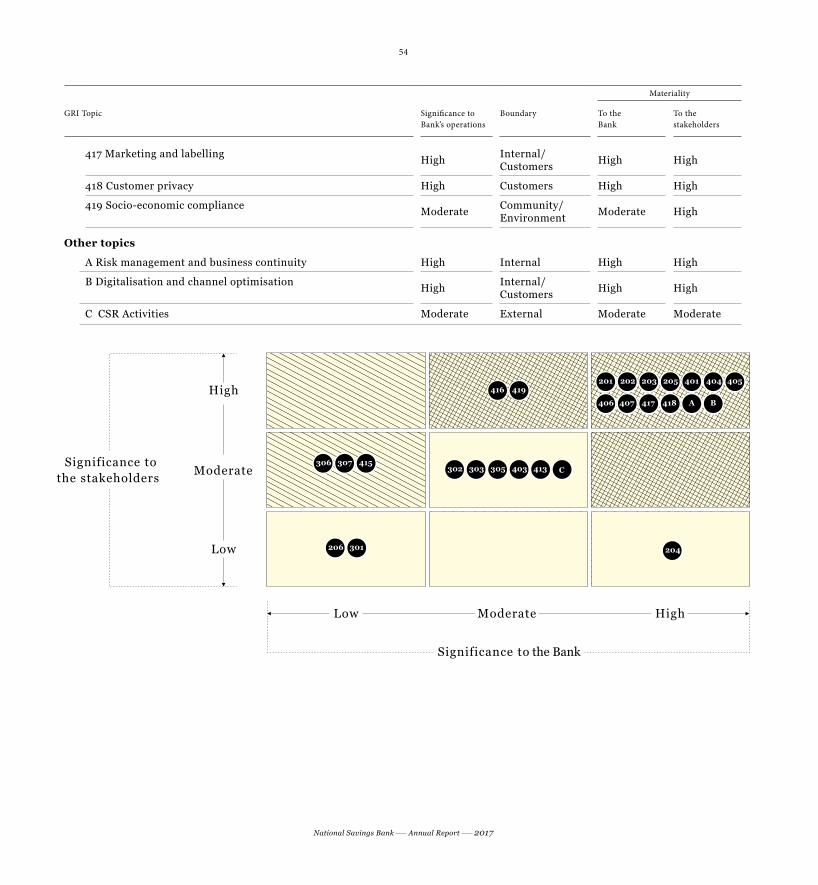
54
National Savings Bank Annual Report 2017
Materiality
GRI Topic Significance to Bank’s operations
Boundary To the Bank
To thestakeholders
417 Marketing and labelling High Internal/Customers High High
418 Customer privacy High Customers High High
419 Socio-economic compliance Moderate Community/Environment Moderate High
Other topics
A Risk management and business continuity High Internal High High
B Digitalisation and channel optimisation High Internal/Customers High High
C CSR Activities Moderate External Moderate Moderate
Significance tothe stakeholders
High
Moderate
Low
Low Moderate High
201 202 203 205 401
206 301
404 405
406 407 417 418 A B
306 307 415
204
Significance to the Bank
302 303 403 413 C305
419416

55
National Savings Bank Annual Report 2017
We have clustered these material aspects into following six material issues to improve the connectivity to the other sections of the Report:
1 Volatile and uncertain socio-economic environment
4 Remain competitive in the industry and maintain sustainable performance
2 Increased regulatory environment, governance and risk management, and new emerging regulations
5 Rapid technology developments
3 Scarce and evolving skill requirements
6 Changing customer requirements
We address them by evaluating their impact and coming up with strategies to mitigate those with the potential to disrupt value creation as well as management interventions to
capitalise offered opportunity for greater value creation.
The following is a detailed outline of the Bank’s current material issues, together with risk and opportunities emanated from material issues, their potential impacts on value creation, and our strategic responses. Our strategic responses depend on the severity of
impact and likelihood of occurrence of the risks and opportunities we face.
Volatile and uncertain socio-economic environment
Macroeconomic factors impact our ability to sustain business and achieve market commitments. The volatile nature of global and local economies on inflation, interest
rate, and exchange rate have a significant impact on our operations. Sri Lankan economy continues to face headwinds: pressure on the rupee, escalating imported inflation, and a possible further sovereign rating downgrade. Consumers remain burdened by high levels
of debt, diminishing levels of disposable income, escalating energy prices, and rising inflation.

56
National Savings Bank Annual Report 2017
Risks and opportunities Impact on value creation Strategic response
Risks Slowdown in GDP growth, increase in inflation along with volatility in interest and exchange rates may increase business risks.
Slower GDP affects consumer spending, credit demand, and public and private sector investment which influence retail lending and corporate lending activities.
A slower GDP growth along with increase in inflation affects the disposable income and savings ability of the public leads to lower deposit mobilisation.
Higher inflation causes the cost pressures and increases the operating expenses of the Bank.
Negatively affects on earnings growth potential and capital generation while increasing the risk of higher cost of funding and NPLs.
Continue to respond to changes in leading indicators of macro economic conditions with definitive steps to mitigate risks and unlock opportunities.
Adequate pricing mechanism to attract appropriate deposit type and mix.
Prudent risk management approaches and remain profitable with our risk appetite framework in the right market segments.
Using market intelligence related to businesses and industry trends.
Opportunities Improving revenue generation capacity in rising interest rate scenario.
Increased infrastructure projects carried out by government.
Higher interest rates on loans and advances positively impact in our revenue generated through interest income.
Expanding the Corporate lending portfolio by contributing towards financing infrastructure projects.
Maintain and strengthening capital and liquidity level in excess of regulatory requirements to absorb economic downturns.
A dedicated and committed approach to responsible lending.
Customer centric service to understand our customer’s requirements and identify and manage risks.
Stakeholders involved Regulators and Government institutions, customers, society and environment.
Strategic focus areas Customer, growth, operations, risk, and compliance.
Increased regulatory environment, governance and risk management, and emerging regulations
Regulation of the financial services industry, though essential, has become more and more rigorous. Governance of all industry-related risks is essential along with adherence to
regulations to protect both the industry and the customers. A rapidly changing regulatory landscape in the industry may impact the speed and ability of financial service providers
to react to changes. This may be accompanied by increased costs or added difficulty in doing business. Liquidity is highly competitive in the financial services industry due to
regulatory requirements and demand for higher returns by investors.
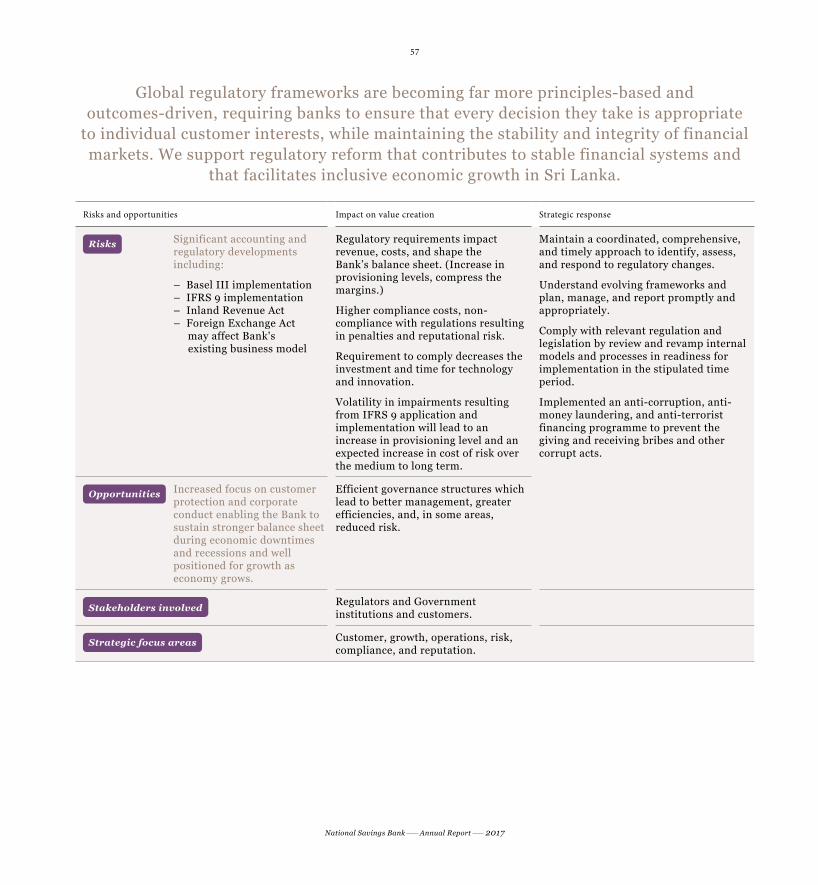
57
National Savings Bank Annual Report 2017
Global regulatory frameworks are becoming far more principles-based and outcomes-driven, requiring banks to ensure that every decision they take is appropriate
to individual customer interests, while maintaining the stability and integrity of financial markets. We support regulatory reform that contributes to stable financial systems and
that facilitates inclusive economic growth in Sri Lanka.
Risks and opportunities Impact on value creation Strategic response
Risks Significant accounting and regulatory developments including:
– Basel III implementation– IFRS 9 implementation– Inland Revenue Act– Foreign Exchange Act may affect Bank's existing business model
Regulatory requirements impact revenue, costs, and shape the Bank’s balance sheet. (Increase in provisioning levels, compress the margins.)
Higher compliance costs, non-compliance with regulations resulting in penalties and reputational risk.
Requirement to comply decreases the investment and time for technology and innovation.
Volatility in impairments resulting from IFRS 9 application and implementation will lead to an increase in provisioning level and an expected increase in cost of risk over the medium to long term.
Maintain a coordinated, comprehensive, and timely approach to identify, assess, and respond to regulatory changes.
Understand evolving frameworks and plan, manage, and report promptly and appropriately.
Comply with relevant regulation and legislation by review and revamp internal models and processes in readiness for implementation in the stipulated time period.
Implemented an anti-corruption, anti-money laundering, and anti-terrorist financing programme to prevent the giving and receiving bribes and other corrupt acts.
Opportunities Increased focus on customer protection and corporate conduct enabling the Bank to sustain stronger balance sheet during economic downtimes and recessions and well positioned for growth as economy grows.
Efficient governance structures which lead to better management, greater efficiencies, and, in some areas, reduced risk.
Stakeholders involved Regulators and Government institutions and customers.
Strategic focus areas Customer, growth, operations, risk, compliance, and reputation.

58
National Savings Bank Annual Report 2017
Scarce and evolving skill requirements
Employees are integral to our business and the primary link in our high-touch customer service model. Banking and financial services continue to evolve and become more complex. Providing excellent service, driving balance sheet growth while managing
complex risk increases shareholder value and remaining liquid and solvent requires the highest level of skilled, customer focused, and analytical employees.
Our employees are vital in allowing us to provide products and services in line with our strategy. Having the right people at the right places, with the right training and skill sets, is essential to our success and innovation. If our people are not managed well, we run the risk of negatively impacting customer satisfaction, which would reduce our competitive
edge in the market. There is a significant increase of specialised skills in Sri Lanka, which has resulted in high levels of competition for recruiting the most qualified people,
especially in the banking and financial services industry.
We must ensure that our people are empowered and recognised for embodying our values and for delivering on our strategic objectives. We provide our people with the opportunity to realise their full potential, and to develop the skills and adaptability needed to thrive in
a rapidly changing world.

59
National Savings Bank Annual Report 2017
Risks and opportunities Impact on value creation Strategic response
Risks Intense competition in the labour market when acquiring specialised skills and emigration of highly skilled people.
Transformation of people and bridging the skills gap.
Demand for future required sources and current employee skills set due to evolving technological developments .
Work-life balance.
Continuous investment on the training and development programmes to transform the people and bridging skills gap.
Cost pressure due to recruiting highly skilled employees on specialised areas and ongoing trainings.
Unskilled and skills gap negatively impact the customer experience and satisfaction.
Responsible recruitment and remuneration policy to attract and retain skills and talent.
Driving a performance culture: Fair and transparent performance management linked with personal development programmes.
New ways of working and tailor-made employee learning and development programmes.
Proactive talent and succession planning.
Diverse and equipped workforce to execute our strategies and nurture talent allow us to be speedy and agile in responding to changes in our volatile socio-economic environment.
Opportunities Able to attract the best skills with right attitude.
Transform our people into an innovative and techsavy.
Increasing expectation on the employee experiences and value propositions.
Stakeholders involved Employees, customers, and suppliers and service providers.
Strategic focus areas Customer, people, growth, operations, risk and compliance, and reputation.
Remain competitive in the industry and maintain sustainable performance
Remaining profitable and growing our business requires the loyalty and support of our stakeholders. Being the largest specialised bank set up to foster a savings culture amongst Sri Lankans, the Bank’s sustainability is dependent upon the economic value
addition to the country. Value is measured differently for each of our stakeholders, and this necessitates an understanding of their key concerns and preferences to provide an
outcome that is mutually beneficial.
The financial services industry continuously experiences innovation in doing business, primarily driven by regulatory and technology changes to customer needs and preferences. Increased regulatory requirements to new entrants reduce the number of new entrants to the industry, however, the competition from Non-Banking Financial Institutions (NBFIs)
has increased as they tend to provide alternative solutions.

60
National Savings Bank Annual Report 2017
The banking sector has been transformed by the digital age. The expectations that are placed on banks by customers have increased significantly. Customers are empowered
to select the most effective options for their needs.
Risks and opportunities Impact on value creation Strategic response
Risks Increased competition.
Loss of market share.
Weak business volumes.
Managing the cost base.
Digital competition.
Competition erodes revenues and profitability.
Increase in the cost base compress the margins.
Increase customer acquisition and retention cost.
Continuous focus on cross selling of products and services and new product development.
Disciplined and careful management of cost base, proper pricing mechanism for funding, and investment mix.
Transit from branch-centric model to cheaper self-service, multi channel model.
Sustain revenue generation capacity while creating new revenue streams and cost efficiencies.
Bolster brand reputation.
Opportunities Diversifying income streams.
Force companies to innovate to remain relevant and competent.
Reducing the over dependency on investment in Government Securities and increase the fee-based income.
Allow us to be customer centric.
Stakeholders involved Regulators and Government institutions, customers and employees.
Strategic focus areas Customer, growth, operations, and reputation.
Rapid technology developments
The technological revolution sweeping through the financial services industry is causing profound disruption. To prove our relevance in an increasingly digital world, we are
actively embracing disruption and innovation, and working with innovation partners to deliver better value for our customers. We strive to find ways that make financial services
more cost-effective, convenient, and relevant.
Over the past couple of years we have made investments in modernising our IT platforms, replacing our ageing systems. It has also strengthened our resilience against cybercrime
and improved integration across our business units.
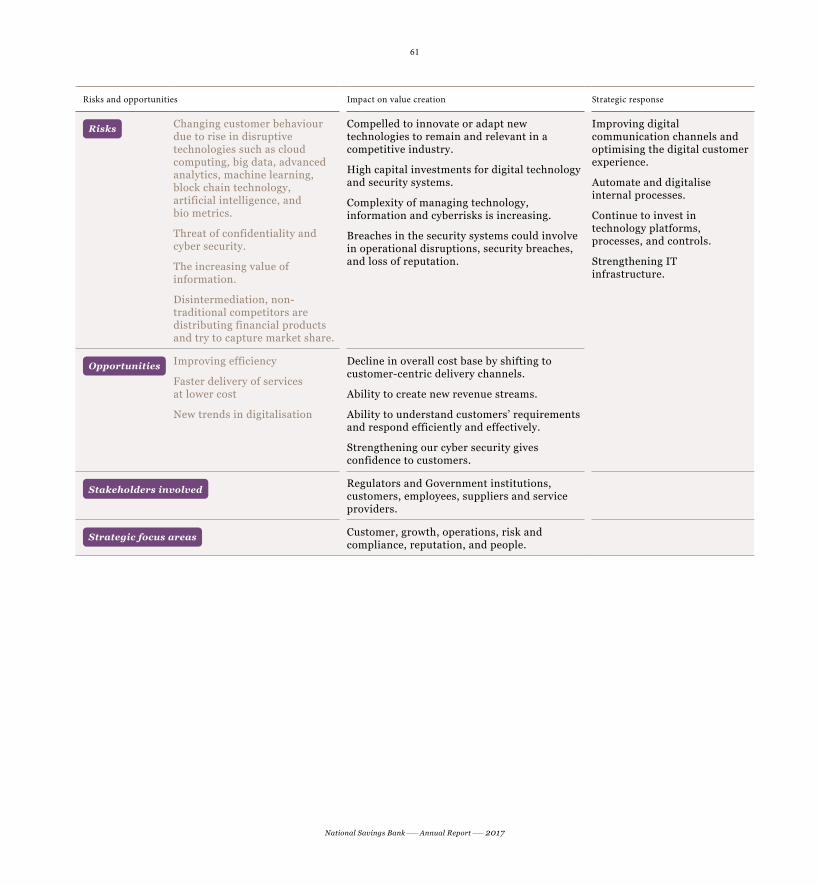
61
National Savings Bank Annual Report 2017
Risks and opportunities Impact on value creation Strategic response
Risks Changing customer behaviour due to rise in disruptive technologies such as cloud computing, big data, advanced analytics, machine learning, block chain technology, artificial intelligence, and bio metrics.
Threat of confidentiality and cyber security.
The increasing value of information.
Disintermediation, non-traditional competitors are distributing financial products and try to capture market share.
Compelled to innovate or adapt new technologies to remain and relevant in a competitive industry.
High capital investments for digital technology and security systems.
Complexity of managing technology, information and cyberrisks is increasing.
Breaches in the security systems could involve in operational disruptions, security breaches, and loss of reputation.
Improving digital communication channels and optimising the digital customer experience.
Automate and digitalise internal processes.
Continue to invest in technology platforms, processes, and controls.
Strengthening IT infrastructure.
Opportunities Improving efficiency
Faster delivery of services at lower cost
New trends in digitalisation
Decline in overall cost base by shifting to customer-centric delivery channels.
Ability to create new revenue streams.
Ability to understand customers’ requirements and respond efficiently and effectively.
Strengthening our cyber security gives confidence to customers.
Stakeholders involved Regulators and Government institutions, customers, employees, suppliers and service providers.
Strategic focus areas Customer, growth, operations, risk and compliance, reputation, and people.

62
National Savings Bank Annual Report 2017
Changing customer requirements
We aspire to build long-term, fulfilling relationships with our customers by understanding and responding to their needs effectively and efficiently. We strive to continually improve
the customer experience at our branches, on mobile and online banking platforms. Our culture, underpinned by our values, aims to ensure that our customers are treated fairly at
all times and that their best interests are placed first in every decision we take.
Risks and opportunities Impact on value creation Strategic response
Risks Customers awareness on various bank offerings, quality of service, and pricing lead to reducing loyalty and increased customer switching.
Increasing customer expectation.
Increase the customer acquisition and retention cost.
Higher investment in innovation and digitalisation.
Self-service platforms are changing the nature of customer relationships and business model.
Boosting lending for consumption.
Build long-term relationships by understanding and effectively responding to their needs.
Continually improve the customer experience at branches and on mobile and online banking platforms.
Training in advisory and make advisory is a key differentiator.
Transition to multi channel customer-centric model.
Strengthen our sustainability footprint focusing on responsible lending, financial inclusion and SDGs.
Acting ethically to maintain trust of the customers.
Opportunities Greater need for advice.
Making positive impact on society and the environment.
Increase the confidence of the society which is looking to deal with sustainable business.
Increase customer loyalty through value propositions based on segmentation and financial advice.
Stakeholders involved Regulators and Government institutions, customers and employees.
Strategic focus areas Customer, growth, operations, risk and compliance, and reputation

63
National Savings Bank Annual Report 2017
Our strategy Our strategy is designed to ensure a sustainable business which creates value in the short,
medium, and long term. It is firmly anchored to our vision of being “the most reliable and sought after choice for your savings”. Equipped with a new triennial business plan
(2017-2019), the Bank has identified key strategies to focus on. In developing the strategic plan, a company-wide, inclusive approach was taken with the participation of staff and
Management at different levels. It involved in-depth discussions with all members of the corporate management, highly interactive residential workshops with employees across all the staff categories, and an intensive research where staff had the opportunity to provide
their proposals, views, and suggestions.
NSB’s strategy can be divided into two sections: long term and short to medium term:
Long-term strategies
The Bank identified five long-term strategies to be implemented through our corporate business plan. They are: Become a digitalised bank, driven by people, diversification,
innovation, and strength and sustainability.
Become a digitalised bank
The banking industry is going through radical changes and digitalisation is the foundation of the next phase of growth in the banking and financial services industry. NSB sees
technology as an essential core competency and a key differentiator to drive future growth. Customers’ evolving demands coupled with changes in social and demographic structures and economic outlook put pressure on the Bank to invest in digitalisation. The Bank will
adopt end-to-end innovation integrating digitalisation from a front to back manner by modernising core processes in back office systems and developing front office platforms.
The Bank formulates a holistic digitisation strategy encompassing clear strategies that address customer-centric, multidimensional delivery channel and modernising products
and services to allow increased digital delivery and marketing supported by an agile, efficient IT infrastructure.

64
National Savings Bank Annual Report 2017
Driven by people
People who share our values and feel a personal responsibility for the success of the Bank are fundamental to the achievement of our vision. The Bank needs to ensure that all the employees poses right skills and attitude to adopt the present as well as future
requirements, as agility and constant change will become the norm at the present context in the industry. The essence of the digital transformation will be laid on agility, flexibility, autonomy and innovation. It creates an environment of openness, opportunity and trust
and allows being adaptive and responsive to change. The digitalisation of processes, deployments of digital solutions, strategic cultural shifts, moving to more customer
centric and integrated approach have a transformational impact on behaviour and skills of the people. Hence, the Bank is committed to preparing people for change, promoting culture of service excellence, embedding risk and compliance culture, and training and
developing to grow and succeed throughout their careers.
Diversification
The Bank aims to diversify its business spectrum with the view to enhance new investments and opportunities aligned with its vision to become the most reliable and
sought after choice for the savings. As a National Budget proposal, NSB will focus on the acquisition of the Sri Lanka Savings Bank (SLSB), which it believes gives it diversified and
growing exposure to the Sri Lanka banking and general services industries by reaching untapped market segments with new segments of financial services. Further, the Bank looks into new avenues of revenue in the present competitive operating environment
through the contribution from traditional banking services as well as non-banking services by introducing innovative products and services to the market with the view to boost the
bottom line
Innovation
Innovation has become one of the drivers of growth, performance, and valuation of any organisation given the disruptions caused by digital technology and globalisation.
The Bank will develop innovative solutions to its customers by enabling innovation in business processes, delivery channels, value chains, and business models to take
advantage of emerging opportunities. The Bank will create an environment that nurture innovation. This will contribute to the customer experience, financial inclusion, and make
a positive impact on society.

65
National Savings Bank Annual Report 2017
Strength and sustainability
Strong capital and liquidity buffers are key drivers of financial stability. NSB will continue to focus on building a strong and sustainable bank which creates long-term value for
stakeholders by increasing capital strength and developing a sound liquidity position. Nevertheless, we believe that sustainability will be generated not only by organic growth but also through improved efficiencies. We are striving to grow within our prudent risk appetite and our legislative act, maintaining our legacy. We intend to increase market
share in our key business lines, acquiring higher business volumes leveraging widespread foot print of branches and continuing expansion of network and digital channels while
strengthening our risk and compliance culture.
Short to medium-term strategy
To fulfil our strategic objectives, we have built following key strategic pillars in our strategy formulation process:
Customer-focused: We continue
to support our customers by understanding their requirements through offering products, services, and excellent customer experience which will make NSB the Bank of choice.
Inspired, dynamic team:
Engaged employees lead to engaged customers. We are committed to invest in our employees who set us apart from the competition.
Sustainable performance:
We focus on increasing business volumes, relating to retail lending and attracting sustainable deposits.
Responsible and socially-committed:
As a specialised Bank with deep social roots, we have embedded our contribution to the SDGs in our community development projects.
Prudent risk and compliance culture:
We are committed to instil a prudent approach to risk management to keep the Bank safe.
Operationally excellent:
We continue to simplify and standardise our operations and internal processes to deliver a superior customer and employee experience.
Optimised capital management:
We continued to improve the fundamentals by increasing our capital strength and building a robust liquidity position.

66
Resource allocation
Resource allocation is the most critical means of translating corporate strategy into action. NSB allocates prudently the myriad resources the Bank possess in the form of capitals: financial, intellectual, manufactured, human, social and relationship, and natural to create sustainable value for our stakeholders. Our strategy is geared to achieving equitable resource allocation across all capitals.
In the implementation of our strategy, NSB takes a macro view of the intrinsic trade-offs in the allocation of the scare financial and non-financial resources which will affect returns.
Customer-focused
Sustainable performance
Operationally excellent
Key initiatives2017
Expansion of customer touch points.
Providing greater convenience.
Launch of new products.
Providing value-added services.
Achievements in 2017
Refer: Manufactured capital. Page 102
Customer capital. Pages 126 to 131
Outlook 2018
Refer: Financial capital. Page 86
Manufactured capital. Page 105
Social and relationship capital. Page 139
Key initiatives2017
Enhance revenue generation capacity.
Achieving growth in earnings.
Broadening the deposit base and loan portfolio.
IdentifyingOpportunities for acquisition and organic growth.
Transforming loss-making branches to profit-making status.
Achievements in 2017
Refer: GM/CEO's Review. Page 30
Financial capital. Pages 73-89
Outlook 2018
Refer: Financial capital. Pages 86 to 89
Key initiatives2017
Enhance efficiencies and reduce cost to income ratio.
ICT investment to improve operations.
Invest in our people, systems, and process to provide better service and be competitive.
Improving credit quality.
Achievements in 2017
Refer: Financial capital. Pages 77 and 82
Intellectual capital. Pages 96 to 99
Outlook 2018
Refer: Manufactured capital. Page 105
Intellectual capital. Page 99
Financial capital. Page 88

67
Inspired, dynamic team
Responsible and socially-
committed
Optimised capital
management
Prudent risk and compliance
culture
Key initiatives2017
Building a performance-driven culture.
Encourage employees to participate in strategy and business planning process.
Foster training in critical professional and leadership skills.
Wide range of continuous development programmes.
Encouraging employees to complete professional exams.
Improving employee wellbeing by offering benefits and extra-curricular activities.
Achievements in 2017
Refer Human capital. Pages 112 to 118
Outlook 2018
Refer Human capital. Page 121
Key initiatives2017
Exemplary corporate responsibility practices through supporting the community, and the environment.
Proactively engage with key stakeholders.
Building stakeholder trust.
Achievements in 2017
Refer: Financial capital. Page 80
Social and relationship capital. Pages 135 to 139
Natural capital. Page 143 to 145
Outlook 2018
Refer: Social and relationship capital. Page 139
Natural capital. Page 145
Key initiatives2017
Management of capital by anticipating and adapting to new regulatory requirements.
Improvement of asset base.
Reduce non-performing assets.
Achievements in 2017
Refer: Financial capital. Pages 77, 82 and 84
Risk management report. Pages 236 to 238
Outlook 2018
Refer: Chairman's message. Page 23
Risk management report. Page 237
Key initiatives2017
Implementation and strengthening of sound asset and liability management process.
Actively evaluating and mitigating risk, and maintaining effective governance systems.
Regulatory awareness initiatives and compulsory compliance training.
Achievements in 2017
Refer: Financial capital. Page 84
Human capital. Page 119
Social and relationship capital. Page 125
Risk management report. Pages 201 to 238
Outlook 2018
Refer: Stakeholders. Pages 51
Financial capital. Pages 88 to 89.
Refer to Risk management. Page 237
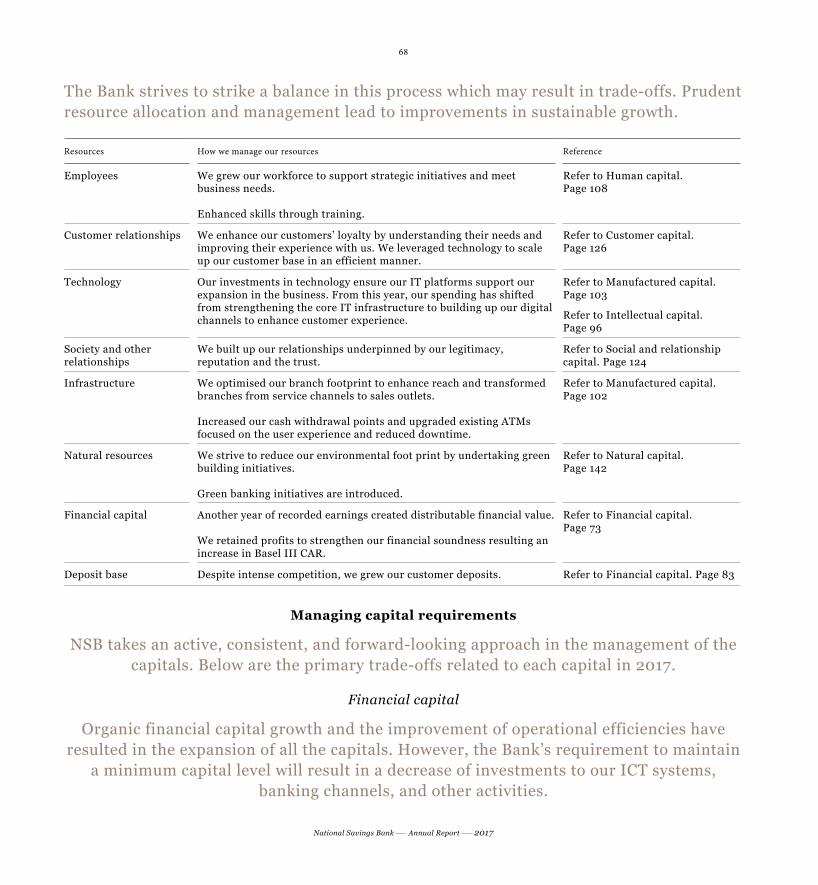
68
National Savings Bank Annual Report 2017
The Bank strives to strike a balance in this process which may result in trade-offs. Prudent resource allocation and management lead to improvements in sustainable growth.
Resources How we manage our resources Reference
Employees We grew our workforce to support strategic initiatives and meet business needs.
Enhanced skills through training.
Refer to Human capital. Page 108
Customer relationships We enhance our customers’ loyalty by understanding their needs and improving their experience with us. We leveraged technology to scale up our customer base in an efficient manner.
Refer to Customer capital. Page 126
Technology Our investments in technology ensure our IT platforms support our expansion in the business. From this year, our spending has shifted from strengthening the core IT infrastructure to building up our digital channels to enhance customer experience.
Refer to Manufactured capital. Page 103
Refer to Intellectual capital. Page 96
Society and other relationships
We built up our relationships underpinned by our legitimacy, reputation and the trust.
Refer to Social and relationship capital. Page 124
Infrastructure We optimised our branch footprint to enhance reach and transformed branches from service channels to sales outlets.
Increased our cash withdrawal points and upgraded existing ATMs focused on the user experience and reduced downtime.
Refer to Manufactured capital. Page 102
Natural resources We strive to reduce our environmental foot print by undertaking green building initiatives.
Green banking initiatives are introduced.
Refer to Natural capital. Page 142
Financial capital Another year of recorded earnings created distributable financial value.
We retained profits to strengthen our financial soundness resulting an increase in Basel III CAR.
Refer to Financial capital. Page 73
Deposit base Despite intense competition, we grew our customer deposits. Refer to Financial capital. Page 83
Managing capital requirements
NSB takes an active, consistent, and forward-looking approach in the management of the capitals. Below are the primary trade-offs related to each capital in 2017.
Financial capital
Organic financial capital growth and the improvement of operational efficiencies have resulted in the expansion of all the capitals. However, the Bank’s requirement to maintain
a minimum capital level will result in a decrease of investments to our ICT systems, banking channels, and other activities.
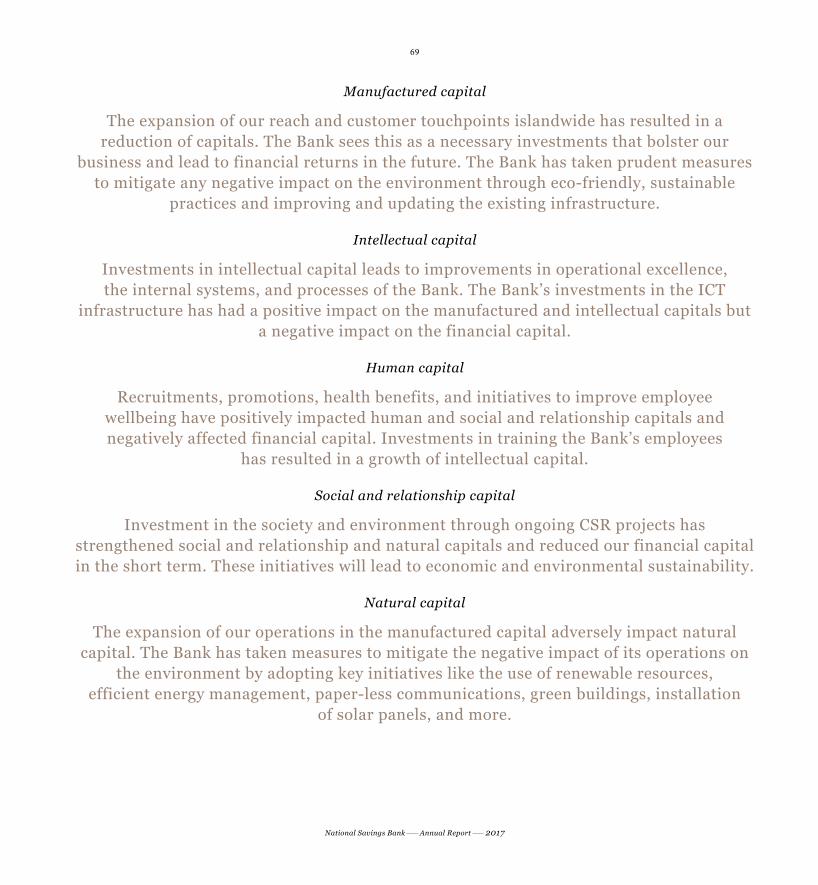
69
National Savings Bank Annual Report 2017
Manufactured capital
The expansion of our reach and customer touchpoints islandwide has resulted in a reduction of capitals. The Bank sees this as a necessary investments that bolster our
business and lead to financial returns in the future. The Bank has taken prudent measures to mitigate any negative impact on the environment through eco-friendly, sustainable
practices and improving and updating the existing infrastructure.
Intellectual capital
Investments in intellectual capital leads to improvements in operational excellence, the internal systems, and processes of the Bank. The Bank’s investments in the ICT
infrastructure has had a positive impact on the manufactured and intellectual capitals but a negative impact on the financial capital.
Human capital
Recruitments, promotions, health benefits, and initiatives to improve employee wellbeing have positively impacted human and social and relationship capitals and negatively affected financial capital. Investments in training the Bank’s employees
has resulted in a growth of intellectual capital.
Social and relationship capital
Investment in the society and environment through ongoing CSR projects has strengthened social and relationship and natural capitals and reduced our financial capital in the short term. These initiatives will lead to economic and environmental sustainability.
Natural capital
The expansion of our operations in the manufactured capital adversely impact natural capital. The Bank has taken measures to mitigate the negative impact of its operations on
the environment by adopting key initiatives like the use of renewable resources, efficient energy management, paper-less communications, green buildings, installation
of solar panels, and more.

Towards a bold, new digital world...
NSB is au courant of the new financial ecosystem created through digitalisation of the sector. We realise that to stay relevant, to reduce the digital gap, and to make a lasting
impression, we have to stay connected and engaged with our stakeholders, physically as well as virtually.

71
National Savings Bank Annual Report 2017

Management Discussion and
Analysis

73
National Savings Bank Annual Report 2017
Financial CapitalFinancial capital is essentially a pool of funds used to create value through conversion
into other forms of capital. This capital is raised through financing (equity and debt), and operations (Deposits). Funds so generated are in turn utilised for operations and capital
investment projects, to create sustainable returns within the approved risk appetite and to meet regulatory minimum requirements.
Overview
The year 2017 was a momentous year for the National Savings Bank, with the Bank ending the year with a stellar financial performance recording its highest ever PBT of Rs. 14.0 Bn. and PAT at Rs. 9.6 Bn. The Bank witnessed an all round growth in core
business areas. A significant growth in business volumes coupled with a gain of Rs. 1.1 Bn. from trading in Government Securities contributed to this performance. Other factors
such as the implementation of sound marketing plans, investments on strengthening the brand, and prudent management of risk facilitated these achievements. The impact of the substantial increase in interest cost and the resulting drop in the net interest margin was offset by a substantial increase in business volumes. Consequently, the interest income
stood at Rs. 103.4 Bn.
NSB also became the first licenced specialised bank to amass an asset base of Rupees One Trillion. which is another significant landmark. Demonstrating the sound management of its credit portfolio, and excellent asset quality, the gross NPL ratio decreased to 1.3%, one of the lowest in the banking sector average. Growing share in remittances business bears
testimony to the confidence placed in it by Sri Lankan expatriates.
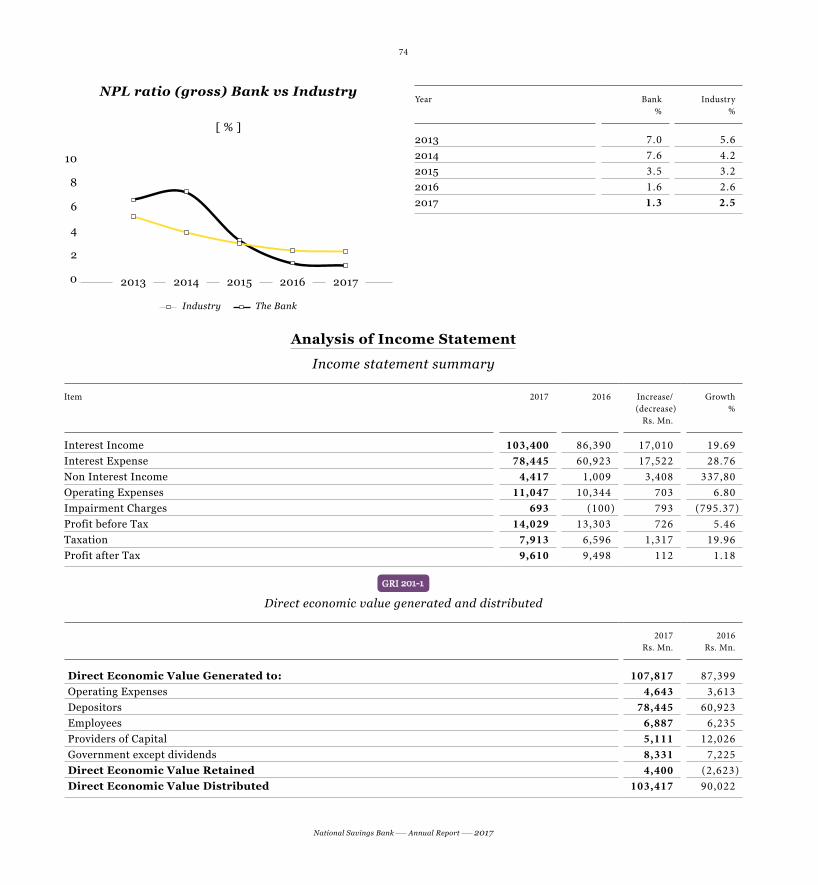
74
National Savings Bank Annual Report 2017
NPL ratio (gross) Bank vs Industry
[ % ]
20172016201520142013
Industry The Bank
10
8
6
4
2
0
Year Bank%
Industry%
2013 7.0 5.62014 7.6 4.22015 3.5 3.22016 1.6 2.62017 1.3 2.5
Analysis of Income Statement
Income statement summary
Item 2017 2016 Increase/(decrease)
Rs. Mn.
Growth%
Interest Income 103,400 86,390 17,010 19.69 Interest Expense 78,445 60,923 17,522 28.76 Non Interest Income 4,417 1,009 3,408 337,80Operating Expenses 11,047 10,344 703 6.80 Impairment Charges 693 (100) 793 (795.37)Profit before Tax 14,029 13,303 726 5.46 Taxation 7,913 6,596 1,317 19.96 Profit after Tax 9,610 9,498 112 1.18
GRI 201-1
Direct economic value generated and distributed
2017Rs. Mn.
2016Rs. Mn.
Direct Economic Value Generated to: 107,817 87,399 Operating Expenses 4,643 3,613 Depositors 78,445 60,923 Employees 6,887 6,235 Providers of Capital 5,111 12,026 Government except dividends 8,331 7,225 Direct Economic Value Retained 4,400 (2,623)Direct Economic Value Distributed 103,417 90,022

75
National Savings Bank Annual Report 2017
Net interest income
Gross income of the Bank grew by 23.4% to Rs. 107.8 Bn. underpinned by strong growth of interest income which represented 95.9% of the total income, improved by 19.7% to
reach Rs. 103.4 Bn. compared to Rs. 86.4 Bn. recorded in the previous year. This is mainly driven by broad-based growth in loans and advances portfolio and interest income on
Government Securities.
With a notable increase of 33.9%, interest income generated from loans and advances recorded Rs. 43.8 Bn. against the Rs. 32.7 Bn. recorded in 2016. Interest income from Sri Lanka Government Securities continues to be the largest contributor to the Bank’s
interest income with a share of 56.9%, recording a growth of 11.0% to achieve Rs. 58.9 Bn. from Rs. 53.1 Bn. in 2016.
Interest expense have increased by 28.8% to Rs. 78.4 Bn. against the Rs. 60.9 Bn. reported in the last year. This, could be mainly attributable to the increase of 35.6% in interest expenses due to other customers which amounted to Rs. 60.2 Bn. There was a
tangible increase in interest expenses in 2017 due to upward trajectory of interest rates along with upward re-pricing of short-term deposits.
Increasing interest expense well above the increase in interest income on loans and advances and HTM investments in Government Securities adversely impacted the net interest income and squeezed Net interest margin. Consequently, Bank’s net interest
income which accounted for 85.3% of the total operating income, dropped marginally by 2.0% to Rs. 25.0 Bn. in 2017 from Rs. 25.5 Bn. in 2016 and NIM also declined to 2.6%
from the 2.9% registered last year.
Non-interest income
Non-interest income accounted for 4.1% of the Gross Income comprising fee and commission income, net gain/loss from trading financial investments, and other operating
income. The remarkable progress recorded in the all aforesaid components enabled the Bank to deliver the impressive growth of 337.8% in non-interest income to touch
Rs. 4.4 Bn. as opposed to Rs. 1.0 Bn. reported during 2016.

76
National Savings Bank Annual Report 2017
Fee and commission income has expanded by 20.4% to Rs. 783.8 Mn. mainly driven by fees and commission earned from loans which grew by 23.3% to Rs. 675.4 Mn. during the year.
With a 352.4% of growth, net gains from trading portfolios amounted to Rs. 1.2 Bn. against the loss of Rs. 39.3 Mn. the year before, benefited from mark to market gain from interest rates.
Other operating income too accelerated by 381.5% to Rs. 1.7 Bn. against the Rs. 357.3 Mn. reported in the previous year stemming from the gain arising from changes in exchange rates coupled with dividend earned from available-for-sale financial investments and dividends from subsidiary.
Total operating income
Subsequently, improvements in fee and commission income coupled with net gain from trading income and other operating income albeit the slid in Net Interest Income were the
main contributory factors for the growth of Total Operating Income which increased by 11.1% to Rs. 29.3 Bn. up from Rs. 26.3 Bn. in 2016. The relative contribution from the non-interest income to total operating income too improved during the period under
review due to realised and unrealised gains derived from equities and interest rate-related instruments.
Total operating income
[ Rs. Mn.]
35,000
28,000
21,000
14,000
7,000
0
800
640
480
320
160
0
20172016201520142013
NII (LHS) Other Income (LHS) Net Fee & Commission (RHS)
2013Rs. Mn.
2014Rs. Mn.
2015Rs. Mn.
2016Rs. Mn.
2017Rs. Mn.
NII 10,107 21,380 26,983 25,467 24,955 Other Income 1,097 3,512 678 359 3,634 Net Fee & Commission 195 286 364 513 674
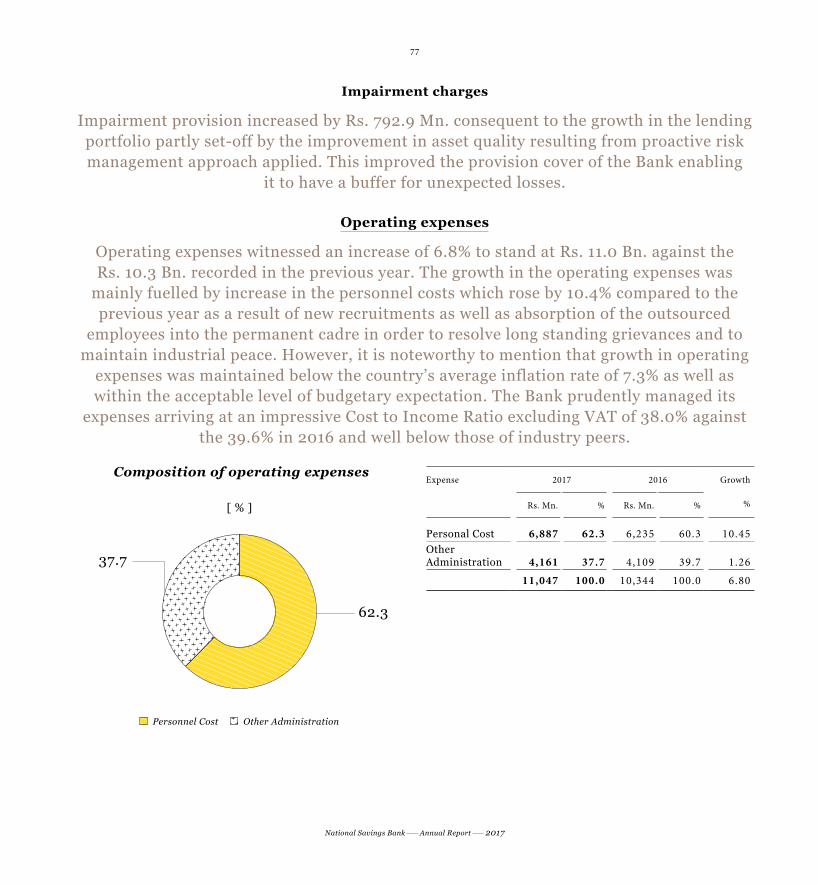
77
National Savings Bank Annual Report 2017
Impairment charges
Impairment provision increased by Rs. 792.9 Mn. consequent to the growth in the lending portfolio partly set-off by the improvement in asset quality resulting from proactive risk management approach applied. This improved the provision cover of the Bank enabling
it to have a buffer for unexpected losses.
Operating expenses
Operating expenses witnessed an increase of 6.8% to stand at Rs. 11.0 Bn. against the Rs. 10.3 Bn. recorded in the previous year. The growth in the operating expenses was
mainly fuelled by increase in the personnel costs which rose by 10.4% compared to the previous year as a result of new recruitments as well as absorption of the outsourced
employees into the permanent cadre in order to resolve long standing grievances and to maintain industrial peace. However, it is noteworthy to mention that growth in operating
expenses was maintained below the country’s average inflation rate of 7.3% as well as within the acceptable level of budgetary expectation. The Bank prudently managed its
expenses arriving at an impressive Cost to Income Ratio excluding VAT of 38.0% against the 39.6% in 2016 and well below those of industry peers.
Composition of operating expenses
[ % ]
37.7
62.3
Personnel Cost Other Administration
Expense 2017 2016 Growth
%Rs. Mn. % Rs. Mn. %
Personal Cost 6,887 62.3 6,235 60.3 10.45 Other Administration 4,161 37.7 4,109 39.7 1.26
11,047 100.0 10,344 100.0 6.80
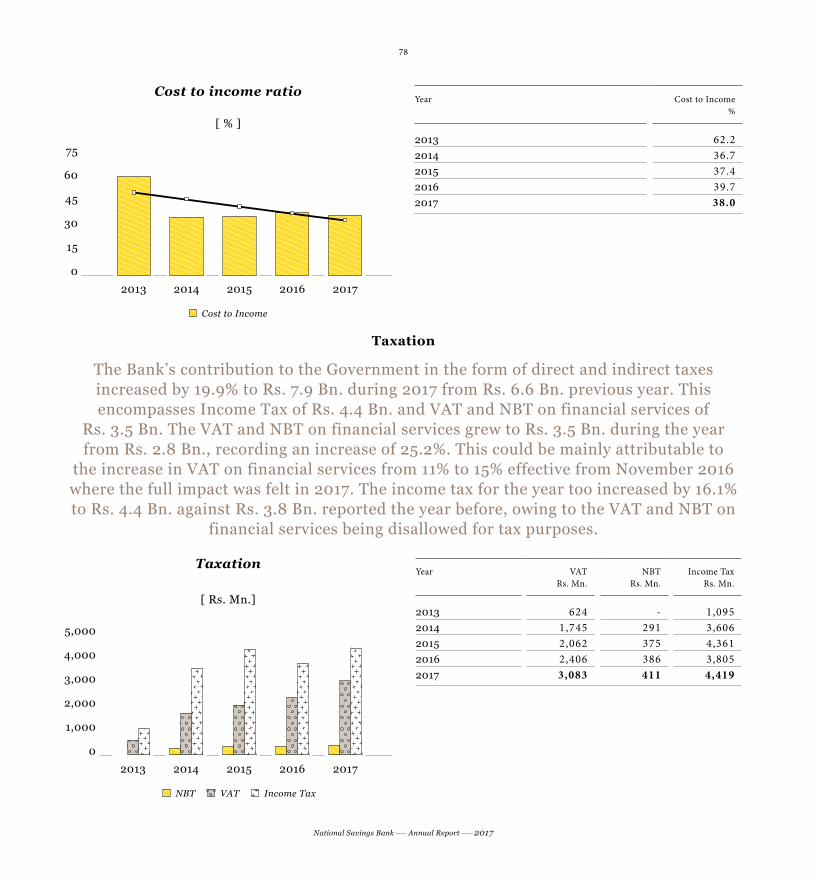
78
National Savings Bank Annual Report 2017
Cost to income ratio
[ % ]
75
60
45
30
15
0
201520142013 20172016
Cost to Income
Year Cost to Income %
2013 62.22014 36.72015 37.42016 39.72017 38.0
Taxation
The Bank’s contribution to the Government in the form of direct and indirect taxes increased by 19.9% to Rs. 7.9 Bn. during 2017 from Rs. 6.6 Bn. previous year. This encompasses Income Tax of Rs. 4.4 Bn. and VAT and NBT on financial services of
Rs. 3.5 Bn. The VAT and NBT on financial services grew to Rs. 3.5 Bn. during the year from Rs. 2.8 Bn., recording an increase of 25.2%. This could be mainly attributable to
the increase in VAT on financial services from 11% to 15% effective from November 2016 where the full impact was felt in 2017. The income tax for the year too increased by 16.1% to Rs. 4.4 Bn. against Rs. 3.8 Bn. reported the year before, owing to the VAT and NBT on
financial services being disallowed for tax purposes.
Taxation
[ Rs. Mn.]
20172016201520142013
NBT VAT Income Tax
5,000
4,000
3,000
2,000
1,000
0
Year VATRs. Mn.
NBTRs. Mn.
Income TaxRs. Mn.
2013 624 - 1,095 2014 1,745 291 3,606 2015 2,062 375 4,361 2016 2,406 386 3,805 2017 3,083 411 4,419

79
National Savings Bank Annual Report 2017
Profitability
This year, the Bank imprinted its highest ever PBT in its history of Rs. 14.0 Bn., growing by 5.5% from Rs. 13.3 Bn. in 2016. Notwithstanding the improvement in PBT, Profit after
Tax grew only marginally by 1.2% from Rs. 9.5 Bn. to Rs. 9.6 Bn. in 2017, despite being limited by higher percentage of income taxes. Growth in interest income resulted from
expansion in loans and advances portfolio combined with the increase of the non-interest income allowed the Bank to impress with the highest profit record amidst a drop in the
net interest margin and an increase in impairment charge and taxes.
Return on Assets maintained at same level of 1.5% consequent to asset growth of 11.0%. The return on equity ratio closed at 26.5% lower than the 29.4% reported in previous year mainly as a result of surplus on revaluation of property, plant and equipment amounting
to Rs. 4.5 Bn.
Profit before taxation and profit after taxation
[ Rs. Mn.]
16,000
12,800
9,600
6,400
3,200
0
20172016201520142013
PBT PAT
Year PBTRs. Mn.
PATRs. Mn.
2013 2,279 1,184 2014 10,472 6,867 2015 13,034 8,672 2016 13,303 9,498 2017 14,029 9,610

80
National Savings Bank Annual Report 2017
Contribution to the Nation
As the Nation’s Savings Bank, the Bank continues its contribution towards the Nation’s development by means of special fee, dividend to the treasury, levy, and contribution
to the National Insurance Trust Fund in addition to the taxes. The Bank’s contribution to Government during the year 2017 amounted to Rs. 13.4 Bn. against the Rs. 19.2 Bn. reported in the previous year. During the year the Bank has paid a significant dividend
amount of Rs. 5.1 Bn. to its sole shareholder, the Government of Sri Lanka, 57.5% down from Rs. 12.0 Bn. paid in 2016 consequent to the decision to retain profit
for sustainable growth.
Contribution to the Nation
[ % ]
VAT and NBT Income Tax Special Fee Paid to Treasury Dividend Contribution to the National Insurance Trust Fund
38.0
0.7
2.4
26.0
32.9
Year 2017Rs. Mn.
VAT and NBT 3,494 Income Tax 4,419 Special fee paid to Treasury 320 Dividend 5,111 Contribution to the National Insurance Trust Fund 96 Total 13,440

81
National Savings Bank Annual Report 2017
Analysis of financial position
Asset
Financial position summary
2017Rs. Mn.
2016Rs. Mn.
2017%
2016%
Total Asset 1,012,103 911,704 100 100Financial Investment – Held to Maturity 544,273 505,824 53.78 55.48Loan and Receivable to other Customer 360,310 291,977 35.60 32.03Loan and Receivable to Bank 27,715 31,834 2.74 3.49Other Financial Asset Held for Trading 6,472 20,291 0.64 2.23
The Bank crossed the Rupees One Trillion landmark to reach Rs. 1.0 Tn. in assets at the end of this year, surging 11.0% from Rs. 911.7 Bn. as at 31 December. NSB became the first
licensed specialised bank to achieve the Rupees One Trillion asset base and the first Sri Lankan bank to get Rupees One Trillion asset base within a relatively short period
since its incorporation 45 years ago. Reflecting robustness of the focus on core business activities, the interest earning loan portfolio and financial investments accounted for more
than 95% of the total asset base.
The Bank's loans and investments portfolio increased by Rs. 92.1 Bn. during 2017, with a growth rate of 10.5%, mainly contributed by loans and advances which increased by Rs. 64.2 Bn. and accounted for 69.7% of the total increase in loans and investments.
However, this increase was achieved despite the Rs. 14.3 Bn. negative growth in Trading and AFS portfolios which were disposed for the purpose of realising capital gains.
This was evident by the slid in Government Securities to Deposits ratio from 66.4% in 2016 to 62.1% at the end of year 2017.
Loans and receivables
The asset composition was relatively unchanged in comparison to last year where financial investments held to maturity dominated the asset base with a share of 53.8% followed by loans and receivables representing 38.3% of the total asset base. Strong growth in loans and advances to other customers bolstered by 23.4% to reach Rs. 360.3 Bn. in
comparison to previous year of Rs. 292.0 Bn. backed by increased credit demand from the Corporate credit as well as Retail credit lines of personal loans, loans against deposits,
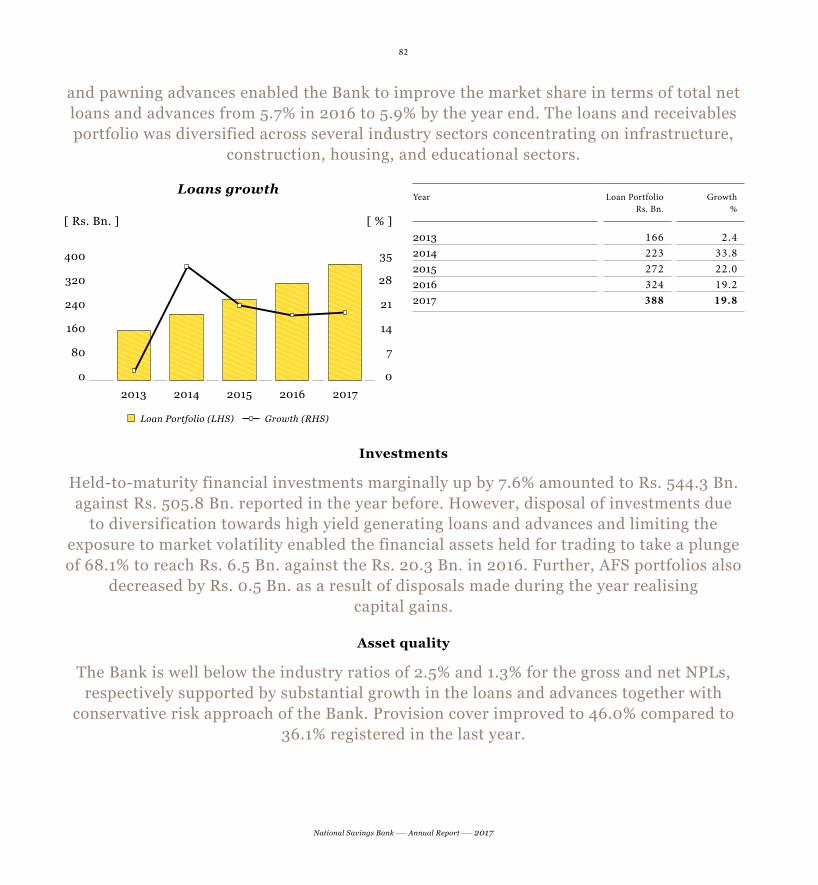
82
National Savings Bank Annual Report 2017
and pawning advances enabled the Bank to improve the market share in terms of total net loans and advances from 5.7% in 2016 to 5.9% by the year end. The loans and receivables portfolio was diversified across several industry sectors concentrating on infrastructure,
construction, housing, and educational sectors.
Loans growth
[ Rs. Bn. ] [ % ]
400
320
240
160
80
0
35
28
21
14
7
0
20172016201520142013
Loan Portfolio (LHS) Growth (RHS)
Year Loan PortfolioRs. Bn.
Growth%
2013 166 2.4 2014 223 33.8 2015 272 22.0 2016 324 19.2 2017 388 19.8
Investments
Held-to-maturity financial investments marginally up by 7.6% amounted to Rs. 544.3 Bn. against Rs. 505.8 Bn. reported in the year before. However, disposal of investments due
to diversification towards high yield generating loans and advances and limiting the exposure to market volatility enabled the financial assets held for trading to take a plunge of 68.1% to reach Rs. 6.5 Bn. against the Rs. 20.3 Bn. in 2016. Further, AFS portfolios also
decreased by Rs. 0.5 Bn. as a result of disposals made during the year realising capital gains.
Asset quality
The Bank is well below the industry ratios of 2.5% and 1.3% for the gross and net NPLs, respectively supported by substantial growth in the loans and advances together with
conservative risk approach of the Bank. Provision cover improved to 46.0% compared to 36.1% registered in the last year.

83
National Savings Bank Annual Report 2017
Accordingly, gross NPL and net NPL ratios improved to 1.3% and 1.2% as at 31 December 2017, compared to 1.6% and 1.5%, respectively reported in 2016.
Liabilities
Total liabilities at end 2017 increased to Rs. 971.9 Bn., recording a growth of 10.5% compared to Rs. 879.5 Bn. recorded in the last year, led by expansion in customer
deposits. The funding composition remained relatively unchanged with the total assets base largely funded by customer deposits with a share of 72.8%, while the rest of the
assets are funded mainly by borrowings.
Deposits
The Bank’s deposit base recorded its highest mobilisation when the total base increased by Rs. 79.9 Bn. to Rs. 737.2 Bn. in 2017, a 12.2% growth over the previous year base
of Rs. 657.3 Bn. Robust growth of 14.2% registered in fixed deposits amounted to Rs. 549.0 Bn. in comparison with 6.7% rise in savings deposits to Rs. 188.2 Bn. compelled the Time deposits in the deposit mix to increase from 73.2% in 2016 to 74.5% during the period under review. These funds were mainly utilised for disbursing loans rather than
investment in Government Securities, thereby bringing down the Government Securities to deposit ratio from 66.4% to 62.1% at the end of year 2017 which is a remarkable
achievement. This resulted in enhanced loans to deposit ratio of 47.0% against the 44.1% recorded the year before.
Year Deposit baseRs. Bn.
Growth%
2013 502 9.7 2014 554 10.4 2015 596 7.5 2016 657 10.3 2017 737 12.2
Deposit growth
[ Rs. Bn. ] [ % ]
750
600
450
300
150
0
15
12
9
6
3
0
20172016201520142013
Deposit base (LHS) Growth (RHS)
84
National Savings Bank Annual Report 2017
Borrowings
Followed by customer deposits, borrowings accounted for 22.2% of the funding sources. Key contributors to the borrowings included international bonds, subordinated
debentures issued, and securities sold under repurchase (REPO) agreements, recording a marginal growth of 5.2% to reach Rs. 224.1 Bn. from Rs. 213.2 Bn. in 2016. This growth was primarily driven by the REPO borrowings which increased by 13.2% to Rs. 61.3 Bn.
against the Rs. 54.1 Bn. in 2016.
Capital
Shareholders’ funds of Rs. 40.2 Bn. increased from Rs. 32.2 Bn. with an increase of 24.7% growth which was backed by Rs. 500 Mn. capitalisation of unclaimed deposit reserve
combined with surplus of revaluation reserve and other reserves of Rs. 4.5 Bn. and Rs. 7.0 Bn. respectively. Equity was utilised to fund only 4.0% of the total assets as at the
current year end, growing from 3.5% registered as at December 2016.
The CBSL introduced BASEL III to the Sri Lankan banking industry with effect from 1 July 2017. The full implementation would take place in three phases over a period of
18 months, completing by 1 January 2019, at which point the Bank would need to maintain its Tier 1 Capital Adequacy Ratio (CAR) at 10% and its total CAR at 14%.
The Tier 1 and Tier 2 capital adequacy ratios of the Bank clocked at 11.9% and 15.3% respectively at the end of 2017 which remained well above the regulatory minimum limits
of 7.75% for Tier 1 and 11.75% for Tier 1 and 2.
In relation to the Statutory Liquidity Ratio, the Bank stood at 73.4%, also well above the regulatory minimum requirement of 20%. In accordance with Basel III, the Liquidity
Coverage Ratio (LCR) which explains the availability of the high quality liquid assets at the disposal of the Bank amounted at 376.2% as at the end of the 2017, well above the
statutory minimum of 80%. The Bank was “healthy” based on availability of stable funding as per the definitions prescribed by the CBSL. The Net Stable Funding Ratio (NSFR) stood
at 135% as at 31 December 2017 against the minimum requirement of 100%.

85
National Savings Bank Annual Report 2017
Review of key business lines
Through our diversified and sustainable business model, we offer smart financial products and full-fledged services to our customers from all
segments of society. Diversification of associated operations, services, and products along segmented business lines have enabled us to provide for our customers with varied needs. Proper management of our core business areas lead to better performance and the increase of capital. We are also cognisant
of the fact that failure of our core business lines will lead to material loss of revenue, profit, and value. Through astute governance and shrewd risk
management we are able to sustain and strengthen the Bank’s leading position in all the key business areas. Our key business lines are:
Corporate credit
Credit
TreasuryBranch banking
International banking and
trade services

National Savings Bank Annual Report 2017
Branch banking: Making our presence felt islandwide
With the rapid adoption of virtual banking, self-service, and the digitalisation of the banking sector, more and more customers are moving to online-based, Internet or mobile banking to complete most of their daily banking transactions. While NSB’s strategy is aligned with the digital transformation, we still focus on the impression that we make on our customers.
Our customers come from all segments of society and some still prefer
There were several key initiatives that were implemented throughout the year to improve and streamline branch banking. These include the revamping of the existing regional systems under nine regions to strengthen the regional offices.
The “Model Branch” concept with a designated smart zone for digital banking was introduced in 2017.
Green banking initiatives including Eco Loans and the switch towards renewable energy in the branches were implemented within the year.
Several new retail product innovations were initiated and promoted through the branch network: NSB reach+ , NSB iSaver, NSB Eco Loan, and Sonduru Piyasa Housing Loan.
The Bank has mobilised Rs. 75 Bn. during the period under review, the highest amount of deposits recorded in its history. The deposit base reached Rs. 737 Bn. with a growth rate of 12.2%. The main contributor for this significant achievement was the Rs. 62.6 Bn. increase in time deposits with a growth of 13.5% driven largely by institutional deposits while savings mobilisation was increased to Rs. 12.8 Bn. recording a growth of 7.3%.
Amidst the tight liquidity in the market followed by CBSL’s measures, retail lending portfolio achieved 20.0% growth to reach a Rs. 213.8 Bn., primarily driven by the personal lending which increased by 37.3% over the last year. The pawning portfolio accelerated by 15.0% reversing the negative growth witnessed in 2016. Demand for long-term fixed deposits has surged by 24.8% in a rising interest rate environment.
Our multi-brand and multi-channel approach will continue to enhance customer experience and provide more transparent products. The Model Branch concept and Green Banking initiatives will be further expanded while certain products and services will be relaunched during the year. New measures will be implemented to evaluate the customer service experience with a view to improve the quality of service. These are some of the initiatives that branch banking will venture into in 2018 to provide a high-standard, diversified, customer experience.
What we did in 2017 Our performance in 2017 A look into the future
traditional banking. While we are prepared to meet the digital future, we still believe that face-to-face customer interaction yields better results, especially for sales-oriented advice and complex transactions that are not suitable for self-service.
Our branch network is 253 strong and NSB branch banking offers a broad range of products and services. Our deposit products encompass a range of savings deposits as well as term deposits. Our retail lending portfolio
includes Personal Loans, Educational Loans, Housing Loans, Auto Loans, Loans against Deposits, and Pawning.
The key strategic goals for 2017 were to increase the low-cost deposits and optimal usage of funds, to improve operational efficiency and to increase our footprint through the multi channel strategy. Please refer to the Operating environment section on page 39 for an overview of the socio-political constraints and economic policy challenges faced by branch banking in 2017.
86

National Savings Bank Annual Report 2017
International banking: Making a global impression
Our International Banking Division (IBD) can boast of an extensive network of international banking relationships and we cater to the needs of offshore as well as onshore clientele and financial institutions. The steady growth in international markets in 2017 has placed NSB’s IBD in a unique position to take advantage of the myriad opportunities abroad. NSB provides Personal/Diplomatic and Business foreign currency savings and fixed deposit accounts facilities,
We continued from where we left off last year to establish new and maintain existing relationships with Arab National Bank, Saudi Arabia (Exchange Company), and DBS Bank, Singapore (Correspondent Bank) in the expansion of our remittance arm. We partnered with overseas Sri Lankan missions and other such organisations to promote our remittance services to Sri Lankan expatriates through several marketing campaigns and organising cultural programmes. Such programmes were carried out in Sri Lanka as well. There were also training programmes for potential migrant workers that was conducted at the Sri Lankan Foreign Employment Bureau. We have established correspondence with Bank of Tokyo, Japan in order to expand the trade finance business and to penetrate remittances business in Japan.
Since the establishment of IBD in 2004 we have managed to secure a 2.4% market share of remittances compared to the 1.8% recorded in 2016. The Bank’s foreign deposit base was 9.4 Bn. as at 31 December 2017. The IBD also recorded a 33% growth in foreign remittance to reach Rs. 26.0 Bn. trade finance business thrived in its first year of operations by recording Rs. 221.0 Mn. Letter of Credit value for the year. Outward remittance made through NSB channels were Rs. 340.0 Mn.
We will continue to expand our global reach through our IBD operations to enhance global business relationships as well as business volumes. In 2018, we will further develop and promote our remittance services through selected post offices to increase customer convenience. We also hope to penetrate markets in prominent countries for inward remittances (LKR/FC) and outward remittances. The present international network of IBD will be further expanded. Trade services will be made accessible through arrangements with Government institutions, trade unions, and automobile dealers.
What we did in 2017 Our performance in 2017 A look into the future
inward/outward remittance services, and trade financing. We also offer Letter of Credits, Shipping Guarantees, Import Bills under LC, and Import Bills on collection basis.
Our strategic priorities for 2017 included the strengthening of delivery channels, amplification of business, development of trade finance facilities, and to make our customers aware and promote, through various national and international marketing campaigns.
Please refer to the Operating environment section on page 37 for an overview of the geopolitical constraints and global economic challenges to international banking in 2017.
87

National Savings Bank Annual Report 2017
Treasury: Maintaining financial security
The Treasury plays a pivotal role in maintaining financial security and stability of our business. Operating in a highly competitive environment, a strong Treasury framework ensures the maximising of financial and business opportunities. Our Treasury is managed through the use of best practices and efficient internal controls and processes in compliance with regulatory requirements. The Treasury at NSB performs a centralised function and is responsible
During the year, the Treasury enhanced the liquidity positions of branches by building new relationships with commercial banks to facilitate maximum utilisation of cash and bank balances to meet its obligations by managing inflows and outflows of funds. We also optimised our operations in Reverse Repurchase transactions by coordinating with new corporate customers and banks. We are happy to report that many corporate funds, public enterprise funds, and bank funds invested with the Treasury during 2017. Treasury functions of the bank have been strengthened by setting up a separate ALM unit.
In 2017, we recorded our highest-ever capital gain of Rs. 1,083.8 Mn. from trading activities of Government Securities which contributed to the Bank’s highest ever PAT of Rs. 9.6 Bn. Interest income from Government Securities stood at Rs. 58.9 Bn., a growth of 11.0% from 2016, contributing to 56.9% share of the total interest income of the Bank.
We will implement a new Treasury Management System (TMS) in 2018 to further streamline Treasury activities and to achieve operational excellence. The TMS will also contribute to strengthening the Asset-Liability Management (ALM) process of the Bank. We also hope to restrict the equity portfolio through purchasing and diversification. We will also introduce a new branch Cash Management System to better systematise cash management.
What we did in 2017 Our performance in 2017 A look into the future
for prudential management of interest rate, liquidity, foreign exchange, and equity risks. The Treasury actively participates in the money market, investing in Government Securities and Equities, and use of derivative instruments such as spot and forward contracts.
Treasury division’s principal strategic priority was to balance profitability, risk, and growth. We also set out to reduce Government Securities to
Deposit ratio whilst maintaining the regulatory requirement with the objective of increasing high-yield investments. Please refer to the Operating environment section on page 40 for information about the changes in the Government’s fiscal policy, the introduction of the Foreign Exchange Act and its effects to Treasury activities, and other relevant information.
88

National Savings Bank Annual Report 2017
Corporate credit: Fulfilling corporate financial needs
At NSB, we understand the financial needs of corporates, the Corporate Credit Division of NSB delivers superior service for all corporate requirements. Our officers possess an integrated approach to relationship management, and an in depth understanding of the sectors our corporate customers operate in to provide better value through structured financial solutions. The Division supports investors by providing funds for large-scale
There was a growing need for project lending and financing within the local economy which was spurred by the Government’s drive to promote large-scale infrastructure projects which facilitated NSB’s Corporate Credit Division. We contributed to the loan syndication of Stage III of Sethsiripaya building by committing Rs. 8 Bn. We continued our funding of housing loans to condominiums. We also took part in the funding of the Central Expressway Project by committing Rs. 17 Bn. Further, committed to fund the rehabilitation of existing highways under the Swiss Challenge Scheme.
During the year we recorded an impressive growth of 20.2%, Rs. 28.3 Bn. in the corporate lending portfolio. This growth was mainly due to the disbursement of funds to Government infrastructure projects. The Non-SOE loans increased considerably by Rs. 7.6 Bn. resulting from arranged loan syndication for the biggest takeover bid of the country where Hayleys PLC acquired Singer (Sri Lanka). NSB granted Rs. 4.0 Bn. to the conglomerate to facilitate the acquisition. Lending to banks declined by 14.6% due to the excess liquidity prevailing in the market which increased the repayment capacity of the banks.
The Corporate Credit Division will further diversify its operations to reach new customers and continue to provide financial support to the Government infrastructure projects. In 2018, new credit lines will be introduced and will also strengthen the risk-based pricing policy.
What we did in 2017 Our performance in 2017 A look into the future
projects through project financing and loan syndication. The Division is responsible for investing in trust certificates, private placement, and debenture issues. Our main aims in 2017 were to function as a lead manager in projects and to enhance our corporate lending portfolio.
89
Credit
A lasting impression on the Nation...
NSB’s unique story goes beyond the readership of our 19.9 million accounts to touch the lives of each and every
Sri Lankan. We are firmly rooted in the National economy and we serve the Nation in our unique way.

91
National Savings Bank Annual Report 2017

92
National Savings Bank Annual Report 2017
Intellectual Capital
USD 168 Mn.
Brand value
5th most valuable brand
Brand finance ranking
AAA (lka)
National rating from Fitch Ratings
Lanka Ltd.
B+ stable
Global ratings from S&P Global
B+ stable from Fitch Ratings
100% Government guarantee
on deposits and interest therein
17.5%
Employees with experience over 15
years
258
Employees completing 25-35 years of service
972
Graduates at the Bank

93
National Savings Bank Annual Report 2017
Intellectual capital refers to one of the most important sources of business advantage - the knowledge within the Bank of how to create value for customers. It is largely intangible in nature and covers a broad spectrum of non-financial aspects which are a direct result of exemplary governance. It includes components such as institutionalised knowledge, customer confidence, brand and reputation, internal systems, softwares and internal
ethical standards policies, and the corporate culture that the Bank uses to create value.
The “unique” NSB brand
NSB has become a household name for all Sri Lankans since our inception in 1972. Every year our brand is strengthened by numerous accolades that are bestowed upon NSB.
In 2017, we became the only Sri Lankan bank to receive “AAA (lka)” from Fitch Ratings Lanka Ltd. for the 15th consecutive year. Furthermore, Brand Finance ranked NSB as the
5th most valuable brand in Sri Lanka.
Brand building initiatives
A range of brand building exercises were carried out throughout the year. These varied from advertising, events, exhibitions, sponsorships, and special promotional campaigns.
Advertising
To build NSB’s corporate brand, we advertise our products in mass media, billboards, social media, website and other web-based advertising, bus halts around the country, etc. These forms of advertising have helped the brand to be more visible. The NSB brand has become a household name for savings in Sri Lanka, and our intention is to cater to and
resonate with a wider demographic from all walks of life.
Sponsorships
NSB sponsored and co-sponsored various national, social, and cultural events. We sponsored a variety of religious events: National Vesak Festival, Gangarama Esala
Perehera, Thissamaharama Poson Perehera, Bauddhaloka Vesak Festival, Kelaniya Perehera, and Kotte Perehera. We also spent Rs. 27 Mn. on sponsorships under special
publicity, souvenirs, and banners for selected events. These enabled us to develop our Brand Image and to develop public relations.

94
National Savings Bank Annual Report 2017
Special events and exhibitions
NSB participated in a number of exhibitions and events throughout 2017 where we promoted our premier products. Annual Hapan Scholarship Awards ceremony was held at Nelum Pokuna to recognise the top 15 of each district who obtained the highest marks
for Grade 5 Scholarship Examination in 2017. NSB also participated at the Edex Expo, Kedella 2017, Sustainable Energy Exhibition, Colombo Property Show, and Life Style Fair.
Special promotional campaigns
NSB conducted Hapan account opening campaigns through Hapan Scholarships seminar series. We conducted 144 Hapan scholarship seminars islandwide. Refer to page 138 for
more information.
Awards and recognition
Our Annual Report 2016 was recognised at the recently concluded ARC Awards 2017 with a Gold award for the Chairman's letter in the Banks: Savings and Loan category and
two Bronze awards for Financial data and Written text. In addition, our Annual Report 2016 received the Silver Award in Financial Institutions category at the CA Sri Lanka Annual Report Awards and Second Runner-up Public Sector Banking Institutions at
the SAFA awards.
GRI 102-16
Corporate values
NSB’s corporate values, developed over the last 45 years, help define the core values of the Bank and shape NSB’s culture and vision. These values are the essence of NSB’s identity. Further, they represent the Bank’s philosophy that guide our stakeholder relationships.
Trust:
Building relationships through having complete confidence in the interests of all involved
Mutual respect:
Recognising the inherent worth of every individual and treating everyone with dignity
Integrity:
Being honest, consistent, and transparent in all our actions and decisions
Creativity:
Challenging existing practices whilst continuously seeking out for novel concepts
Safety:
Consistently making prudent decisions to meet the community needs and protect their value

95
National Savings Bank Annual Report 2017
Corporate culture
The corporate culture that prevails in NSB is consistent with our values and mission. It is a culture of utmost professionalism, teamwork, transparency, diversity, and respect
between individuals.
We have embedded our values and beliefs in the processes such as recruiting, training and development activities. We strive to build a strong team fostering personal
responsibility and collective decision-making with a strong level of compliance and governance. We have created a culture that promotes close collaboration among talented
employees with diverse backgrounds. Our corporate culture is central to our long-term success.
Moreover, we have carefully fostered the Bank’s team culture, where every individual is directly involved and accountable in realising the Bank’s overall vision. From the
most remote hill station post office to our boardroom in Colombo, the staff of NSB is deeply loyal to the Bank. To nurture the sense of family that prevails within the NSB, we have organised numerous events and initiatives throughout the year. For the first
time in history, “NSB Staff Day” with the participation of all NSB employees was held at Sugathadasa Stadium in February 2017. Furthermore, we encourage other team-building
activities through NSB Sports Club, Buddhist Society, Christians Society, NSB Welfare Society, and Kala Kawaya (Arts Circle).
Business ethics and integrity
As the premier savings bank of the nation, we believe that our business goes beyond banking. It is about making a difference and serving our employees, customers,
communities, and the nation. We understand our ethical responsibility to our main stakeholders. Business ethics and integrity form the foundation of NSB’s working culture.
We constantly review our internal standards, codes and control mechanisms, regulatory and compliance requirements and upgrade them to be in line with
the industry best practices.

96
National Savings Bank Annual Report 2017
Institutionalised knowledge
Our institutionalised knowledge derives from serving the nation for over 180 years. The processes and practises that are in place have matured over decades. Our experienced staff force, which comprises a high percentage of employees who have been with the Bank
for more than ten years, principally contributes to our institutionalised knowledge. As the leading savings Bank in the country coming under the purview of the state and the Ministry of Public Enterprise Development, NSB has been able to adopt the best practices
in the financial industry. Using our legacy and our experience, the Bank has developed innovative savings options for all segments of society.
Our top executives hold more than fifteen years of experience in the industry which contributes to our sound operational knowledge. NSB team members, who are qualified and well-trained, form the backbone of our operations. Our staff retention ratio stood at 96.7% in 2017. As at 31 December 2017, 1,156 employees completed more than ten years of service with us. This reveals our capacity in retaining experienced and knowledgeable
employees with the Bank.
Customer confidence
Customer confidence is the fundamental requirement for a bank for its growth and for its long-standing success in the industry. The Government has offered 100% statutory
guarantee on people’s deposits in NSB and due interest which positions NSB as the safest bank in the country. In addition, exemplary corporate governance, risk management
frameworks, business ethics, and values have contributed to sustain customer confidence.
Systems implemented and improved in 2017
We have taken numerous initiatives to improve and maintain robustness of the systems and processes to uphold our role in ensuring safe, secure, and trusted banking system. We
implemented new IT systems to enhance business and workflow systems for employees, customers, and our business partners during the period under review. Continual review of the IT environment ensures that our IT systems and processes are both efficient and
resilient and they can effectively support the delivery of services to customers. Our improved systems and processes help us to become more responsive to changing customer
expectations while maintaining the operational excellence in the industry.

97
National Savings Bank Annual Report 2017
Business Continuity Management Systems (BCMS)
A BCMS is formed by a set of policies and proven methods to ensure continuity after a major disruption to an organisation resulting from technical failures, natural disasters,
human error, or intentional hostile acts. A BCMS is a part of the Bank’s overall management system. It is a set of interrelated elements that a company uses to establish,
implement, operate, monitor, review, maintain, and improve their business continuity capabilities. NSB annually reviews our BCMS, and based on the results, changes are made.
With the newly established Disaster Recovery facility based on TIA-942-tier 3, which is located remotely to the primary site, is the main improvement in the business continuity
capability of the Bank during the year.
Information Security Management System (ISMS)
Through the ISMS, the Bank manages the security of assets and customer data such as financial information, intellectual property, employee details, or information entrusted to the Bank by third parties. Based on ISO 27001:2013, an ISMS governance structure is established comprising committees at Executive and Board levels. The processes that are
introduced are being matured for certification. In addition, situational awareness and threat intelligence capabilities are also strengthened with a collaboration of an enterprise
solution for event and incident management. The objective of these preliminary steps is to have a roadmap to develop an Internal Security Operations Centre for
the Bank in the future.
Core banking solution
The existing in-house built Core Banking Solution will be replaced with an advanced Core Banking package where all IT services shall be implemented as per industry best practices in a more cohesive and efficient manner. This state-of-the-art financial services solution will help us in our digital journey of delivering value and convenience to our customers.
The ground work for the solution was completed during the year under review.
Document Management System
The Document Management System was implemented in all NSB branches in 2017. This system has enabled the retrieval of documents and their verification easier and has
resulted in the increase of operational efficiency in our branch network.

98
National Savings Bank Annual Report 2017
Automation of Human Resource Management functions
The HR functions, such as recruitment, promotion, attendance, leave monitoring, performance evaluation, integrating payroll administration, and benefit administrationwill be automated and integrated to increase the Bank’s efficiency by streamlining HR
management processes and functions.
ATM Switch upgrade
The Bank implemented the ATM Switch upgrade and amalgamated a Card Management System to facilitate our expanding debit card customer base. This process has enhanced
the capabilities of our card products. Our debit card customers can now enjoy the modern-day facilities of a cashless society with the ability to link with LankaPay.
Productivity Improvement Programme (PIP)
The PIP was initiated by the R&D Division of NSB in collaboration with the National Productivity Secretariat (NPS) with the objective of improving the ambience. Manuals
are being created to facilitate the 5S concept in branches and the Head Office by the R&D Division.17 branches and two divisions were identified for the implementation of the
“Seiton” concept. The Boralesgamuwa NSB branch was developed as a Model Branch of the “Seiton” concept and currently awaiting certification from the NPS.
EMV Certificate
EMV (Europay, Mastercard, and Visa) is a worldwide authentication standard used by most major credit card issuers and networks. It is a global initiative to combat fraud
and protect sensitive payment data in the card-present environment. This technology features payment instruments with embedded microprocessor chips that store and protect
cardholder data. NSB obtained EMV certification for Mastercard. Our customers will be able to experience enhanced security in their transactions worldwide.
Credit Rating and Scoring System
The Bank has identified credit scoring as a systematic method for measuring credit risk by providing a consistent analysis of the contributing factors of credit risk. In 2017, NSB
completed the implementation of Credit Rating and Scoring System for retail loans.

99
National Savings Bank Annual Report 2017
Anti-Money Laundering (AML) solution
The Bank also partnered with a service provider to implement an AML solution to facilitate detecting and reporting any illegitimate activities. The AML solution will have a bank wide
approach to track and monitor transactions to prevent any money laundering activities.
Policies
Our policies and frameworks stemming from our tacit knowledge, skills and experience, promote consistent and integrated implementation to improve our service levels
and economic scales. The policies formulated by us; Procurement, Code of Conduct, Outsourcing, Communication, Asset and Liability Management, Investment, Information
Security Risk Management, ensure that we are true to our values and conduct our day-to-day operations in an efficient and effective manner.
Information security
Information security is of paramount importance to all IT/digital operations of the Bank. We recruited a Security Officer in March 2017 and established an independent IT Security Division. The Chief Information Security Officer directly reports to the Board Integrated
Risk Management Committee (BIRMC) and the IT Security Division undertakes IT security reviews with the assistance of the TechCERT, Sri Lanka. The Bank obtained a SIEM solution
for security event monitoring and implemented the End Point security solution for ATMs in 2017. The Bank also commenced a project for Information Security Management System
(ISMS) implementation and completed the key tasks by December 2017.
In addition, the Bank implemented the BCMS framework in 2017 and initiated actions for obtaining IT security certifications for the Bank. Payment Card Industry Data
Security Standards (PCIDSS) project which commenced in the year 2017 is expected to be completed by the third quarter of 2018.
A look into the future
Believing in the importance of digital platforms as the fastest, reliable, and most efficient means of communication with our stakeholders, our investments will continue to be made
to ensure all systems and processes are run in a secured, fast, and high quality manner. IT Projects that are planned to take place along with our tacit knowledge and expertise
will be the backbone of our transformation into a customer-centred and digitally-enabled bank. Though it will be a lengthy, complex, and expensive process, we envisage that it is
critical to our competitiveness in an increasingly digitalising world.
100
National Savings Bank Annual Report 2017
Manufactured CapitalThe Bank’s manufactured capital is the collection of physical and technological objects that are available to an organisation for use in the provision of services and therefore
in fulfilling its objectives. It includes assets that are produced by other entities and those manufactured internally and excludes intellectual capital such as software.
The manufactured capital is integral to the Bank’s success since the proper management of these assets will directly contribute to operational efficiency and profitability.
GRI 102-4, 6
NSB’s reach
Local
As a Bank that serves all segments of society, NSB possesses a wide-ranging reach with 253 branches, 4,062 post offices across the island, and an extensive ATM network that
provides Mastercard and Visa debit card facilities. In order to ensure a better supervision of the regional system, all branches were consolidated into nine regions during the year. We are part of the LankaPay Common ATM Switch (CAS), a national payment network, which is the backbone of all future payments in the country. CAS has 28 member banks
connecting over 4,000 ATMs which makes LankaPay the largest common ATM network in the country which will facilitate NSB customers to enjoy islandwide, secure ATM access.

101
National Savings Bank Annual Report 2017
Region Number of branches
Central 30
Eastern 21
North Western 30
Northern 21
Postal Admin 23
Sabaragamuwa 25
Southern 32
Western 1 34
Western 2 37
Grand Total 253
District Number of branchesAmpara 8
Anuradhapura 12
Badulla 6
Batticaloa 7
Colombo 43
Galle 13
Gampaha 25
Hambantota 10
Jaffna 14
Kalutara 12
Kandy 17
Kegalle 10
Kilinochchi 1
Kurunegala 17
Mannar 2
Matale 4
Matara 12
Monaragala 6
Mullaitivu 2
Nuwara Eliya 7
Polonnaruwa 3
Puttlam 8
Grand Total 253
20
25 17
28
1280
21
35
Western
North Western
North Central
Northern
Eastern
Central
Uva
Sabaragamuwa
Southern
15
253 branches
9
regional offices
4,062 post offices
4,000 ATMs through LankaPay
16,000 mCash retailers islandwide for NSB iSaver
300 hand-held POS machines for NSB Reach
NSB touchpoints across Sri Lanka
102
National Savings Bank Annual Report 2017
International
NSB’s reach extends beyond our national boundaries. The Bank’s relationships with global money transferring companies enable faster, cheaper, and secure remittances from all over the world. The Bank is also a member of SWIFT and Eurogiro, a low cost, secure,
and speedy money transfer system. NSB U-Trust, a remittance service attracts remittances from abroad. The Bank has relationships with 33 exchange houses and
14 correspondent Banks.
Our remittance services will be further improved with the new relationships that we have formed over the year. In 2017, we established links with the Arab National Bank, Saudi Arabia Exchange Company, and DBS Bank, Singapore. NSB plans to penetrate
international markets for Inward Remittances and for Outward Remittances in countries such as USA, Canada, UK, Japan, Australia and, New Zealand.
Physical infrastructure
Branch expansion
We have facilitated customer interaction through a large network of customer interactionpoints. The Bank has widened its physical footprint with a modernised branch network in line with industry standards. In 2017, three new NSB branches were added to the branch
network: Colombo City Plus branch, Peradeniya, and Piliyandala. The Tissamaharama branch was relocated to a new spacious premises. Expanding our reach and customer
touch points even further, we identified key strategic locations across the country.
NSB Model Branch
The rapid digitalisation in the banking sector has made it necessary for incorporating technology for modern banking. With this objective in mind, NSB launched the
“Model Branch” concept under the brand name “NSB Connect” with a smart zone for digital banking and stylistic changes to exterior and interior of the branch. The branches
will also meet the requirement of 5Ss Programme. The Model Branch concept was initially launched at the Boralesgamuwa Branch. NSB plans to implement this concept to 50 more branches in 2018. The successful implementation of this initiative will deliver better value
from our customer touch points across the island.
103
National Savings Bank Annual Report 2017
Investments in green energy
In 2017, we took steps to invest in renewable energy. There were green energy projects that were implemented in all branches. The Bank has initiated to install solar power systems to five branches in 2017. We are hoping to expand the number of branches
utilising green energy to 50 in 2018. Further, NSB engaged in awareness programmes educating the public about energy saving and the necessity of the use of solar power.
Digital infrastructure
Digitalisation is bringing about permanent changes to the banking sector. The technical infrastructure, systems and processes, and our approach to banking must be realigned
to keep pace with the rapidly changing digital world. NSB has taken comprehensive measures to improve its digital infrastructure.
NSB recognises that improving the digital infrastructure requires a greater capital
investment. We also recognise that this investment is necessary to provide our tech savvy customers with a superior level of service and convenience. The digital world has also
brought in cyber security threats. Digitalisation of the banking sector also brings about increased competition.
The key digital infrastructure development projects undertaken by the Bank include the implementation of next generation firewall system for the corporate network, upgrading of ATM network for EMV compliance, implementation of IP-based security surveillance
system in branches and head office, and providing mini computers for branches.
Launch of “smart zone”
NSB City Plus branch was the first include a smart zone for digital banking with a cash deposit machine and an interactive digital signage machine. This will go hand in
hand with our Model Branch concept and this aforesaid facility will be upgraded to all other branches.
104
National Savings Bank Annual Report 2017
Launch of iSaver
This revolutionary digital product was introduced in partnership with SLT Mobitel mCash to enable customers to conveniently deposit cash to their accounts. The service can be
accessed through over 16,000 mCash touch points islandwide.
Software and hardware upgrade
To mitigate network attacks and cyber threats and to improve our digital infrastructure, there were upgrades to memory and to the firewall. In 2017, 1,000 Mini PCs and 400 pass
book printers for Postal Banks were procured to bolster the digital infrastructure.
Oracle Exadata Database Machine
Oracle Exadata is the best-performing, most available, and most secure architecture for running Oracle Database. The system is architected, integrated, tested, and optimised to work together and it is coengineered with Oracle software for a level of cloud-ready
integration and Oracle Database performance that generic systems cannot match.
NSB procured the Oracle Exadata Database Machine to cater to the demands of different systems running at the Bank and also to meet future requirements. NSB, using a
single-vendor model, can control software licensing costs by using fewer database cores to get more work done. The Bank was also able to secure licensing for all Microsoft
products with additional benefits. Successful implementation of Oracle Exadata and Microsoft Projects will enable the Bank to take all digital initiatives forward.
Upgrade of the Card Management System (CMS)
The Bank initiated a project to issue MasterCard EMV chip debit cards. Once the CMS project is completed, the Bank will be able to send the Personal Identification Number (PIN) of debit cards to customers through secured SMS and allow customers to manage
the limits of debit cards by themselves. The Bank also automated the MasterCard and Visa debit card transactions reconciliation by acquiring a new reconciliation solution.
105
National Savings Bank Annual Report 2017
VISA Direct connectivity
Visa Direct enables real-time payments using Visa’s global payments network. This would facilitate business initiated payments as well as person-to-person payments on Visa’s
secure payment network.
A look into the future
The Bank will vigorously engage in enhancing physical and digital infrastructure to face the future challenges emerging from evolving customer requirements. The Bank will
focus on process improvement and efficiency projects that will boost customer experience and quality of service delivery. Construction of new branch buildings is under way for
Negombo, Nugegoda, Ragama, and Bandarawela branches. Moreover, new buildings are being constructed for the new branches at Deiyandara, Pannala, and Weliveriya which will
be opened in 2018.
The e-commerce sector demonstrates the rapid proliferation of online transactions across international borders. NSB will introduce a safe and secure e-commerce facility to conduct
business transactions in a safe and secure environment.

Empower women to empower the next
generation... NSB Sthree, a savings scheme designed exclusively for women, empowers Sri Lankan women in every strata of life, in diverse
financial situations, with financial freedom.

107
National Savings Bank Annual Report 2017

108
National Savings Bank Annual Report 2017
Human Capital
4,470Total workforce
216Total recruitments
(5.3% of total cadre)
824Promotions
Rs. 6,887 Mn. Employee
remuneration
6:5 Gender ratio
(male:female) at all levels
100%Employees receiving
performance evaluations
252No. of Training
programmes
Rs. 34.4 Mn.Total
investment for training
45,347Training
hours
12Training hours per employee
96.7%Retention
rate
3.3%Employee
turnover rate
99.7%Employees covered
by the collective agreement
GRI 102-8
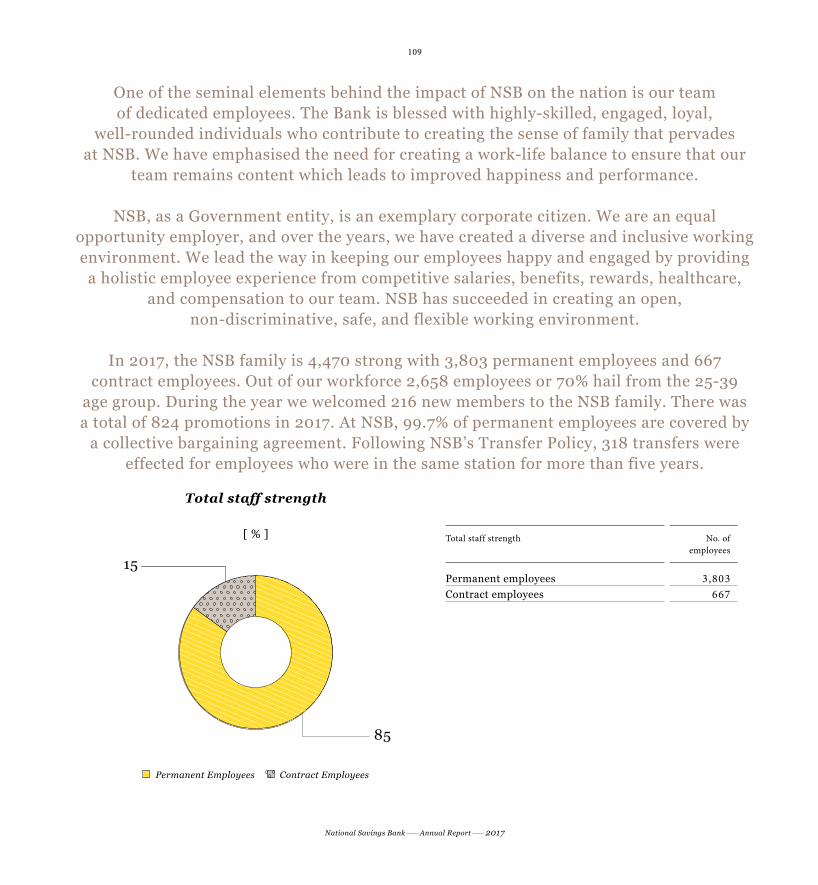
109
National Savings Bank Annual Report 2017
One of the seminal elements behind the impact of NSB on the nation is our team of dedicated employees. The Bank is blessed with highly-skilled, engaged, loyal,
well-rounded individuals who contribute to creating the sense of family that pervades at NSB. We have emphasised the need for creating a work-life balance to ensure that our
team remains content which leads to improved happiness and performance.
NSB, as a Government entity, is an exemplary corporate citizen. We are an equal opportunity employer, and over the years, we have created a diverse and inclusive working environment. We lead the way in keeping our employees happy and engaged by providing
a holistic employee experience from competitive salaries, benefits, rewards, healthcare, and compensation to our team. NSB has succeeded in creating an open,
non-discriminative, safe, and flexible working environment.
In 2017, the NSB family is 4,470 strong with 3,803 permanent employees and 667 contract employees. Out of our workforce 2,658 employees or 70% hail from the 25-39
age group. During the year we welcomed 216 new members to the NSB family. There was a total of 824 promotions in 2017. At NSB, 99.7% of permanent employees are covered by
a collective bargaining agreement. Following NSB’s Transfer Policy, 318 transfers were effected for employees who were in the same station for more than five years.
Total staff strength No. of employees
Permanent employees 3,803Contract employees 667
Total staff strength
[ % ]
Permanent Employees Contract Employees
15
85
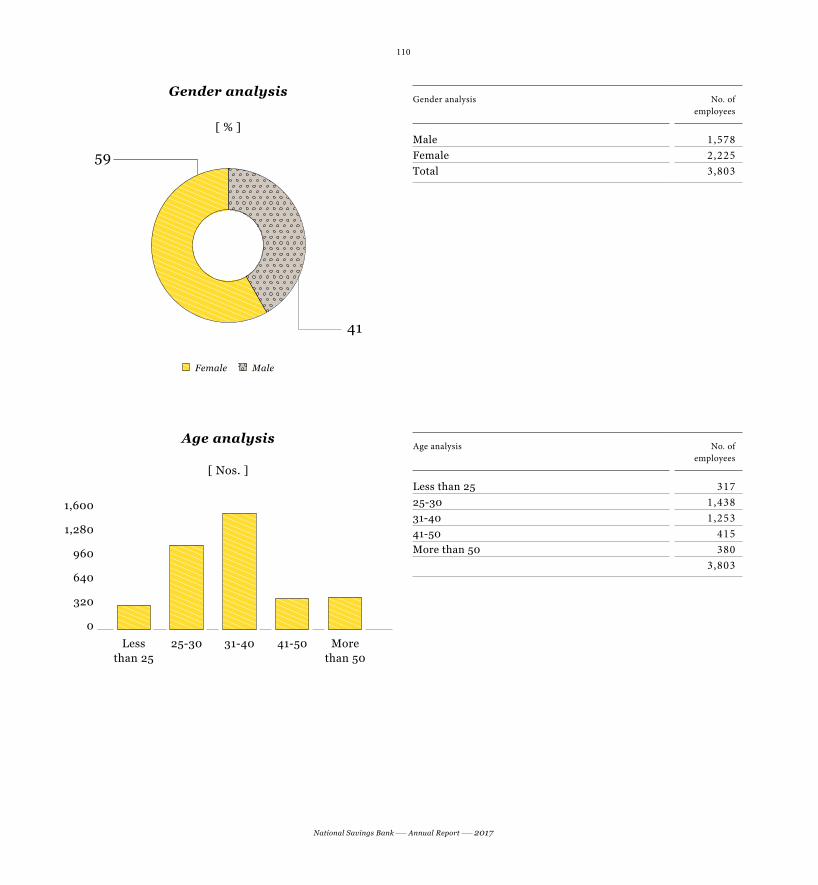
110
National Savings Bank Annual Report 2017
Gender analysis No. of employees
Male 1,578 Female 2,225 Total 3,803
Gender analysis
[ % ]
Female Male
59
41
Age analysis No. of employees
Less than 25 317 25-30 1,43831-40 1,25341-50 415 More than 50 380
3,803
Age analysis
[ Nos. ]
1,600
1,280
960
640
320
0
More than 50
41-5031-4025-30Less than 25

111
National Savings Bank Annual Report 2017
Analysis of staff grade category Nos %
Senior Grade (GM/CEO/Snr DGM/DGMs/AGMs) 20 0.5Managers (Grade I, II, III-I,III-II) 580 15.3Executive (Grade III-III, IV) 1,190 31.3Staff Assistants (Grade V/VI) 1,848 48.6Grade VII Category 165 4.3
3,803
Analysis of staff grade category
[ % ]
50
40
30
20
10
0
EDCBA
A – Senior Grade (GM/CEO/Snr DGM/DGMs/AGMs) B – Managers (Grade I, II, III-I,III-II)
C – Executive (Grade III-III, IV)D – Staff Assistants (Grade V/VI)
E – Grade VII Category
Grade by gender Male Female
Senior Grade (GM/CEO/Snr DGM/DGMs/AGMs) 13 7 Managers (Grade I, II, III-I, III-II) 299 281 Executive (Grade III-III, IV) 507 683 Staff Assistants (Grade V/VI) 598 1,250Grade VII Category 161 4
Service years analysis by age and grade Less than
3 years
3-6 years
6-10 years
More than 10
years
Senior Grade (GM/CEO/Snr DGM/DGMs/AGMs) 2 1 2 15Managers (Grade I, II, III-I, III-II) 30 16 100 434Executive (III-III, IV) 308 116 346 420Staff Assistants (V, VI) 923 571 250 104Office Assistants (Grade VII) 137 4 0 24

112
National Savings Bank Annual Report 2017
NSB follows a stringent recruitment process
NSB has a stringent recruitment process to identify prospective candidates with competent professional skills. The HR Development Division follows NSB’s recruitment
policy, by which positions are offered without biases in race, ethnicity, religion, age, gender, or physical disability. Our very healthy male to female ratio of 6:5 at all levels in
the workforce can attest to our claim of being an equal opportunity employer.
The recruitment process includes competitive exams, and subsequent interviews are held in a transparent manner. Selected candidates are required to complete a probation period of one year. Our senior management recruits are hired from local community. There were
216 new recruitments (5.3% of total cadre) in 2017 including permanent and contract based employees, with the majority of recruitments done at entry level.
Age group Male Female Grand total
Less than 25 30 76 10626-35 21 53 7436-45 9 22 31Above 45 2 3 5Grand total 62 154 216Percentage (%) 29 71 100
True professionals are created through training and development
Well-trained and an educated workforce is critical to achieve excellence, strategic goals, and gaining advantage in a highly-competitive industry. The training programmes offered at NSB help create true professionals who will meet the existing job requirements as well
as future responsibilities.
NSB offers its employees local and foreign training programmes, sponsorships, and educational incentives to facilitate their continuous professional development. We have found that training programmes also help improving overall employee
experience, engagement, and professional collegiality.
GRI 401-1 GRI 202-2
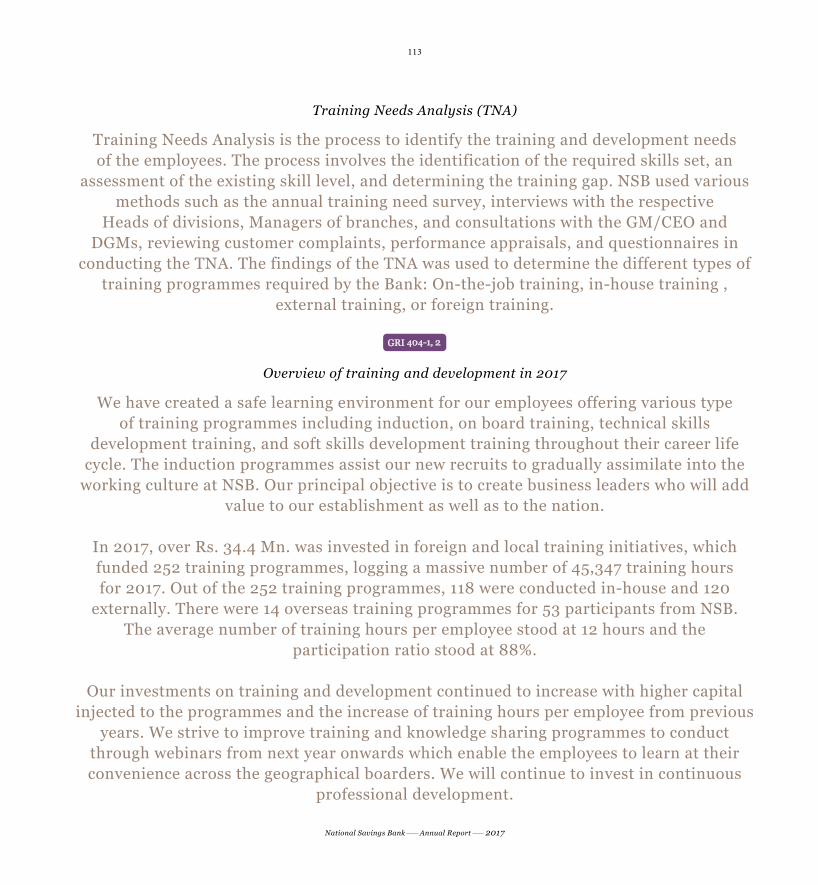
113
National Savings Bank Annual Report 2017
Training Needs Analysis (TNA)
Training Needs Analysis is the process to identify the training and development needs of the employees. The process involves the identification of the required skills set, an
assessment of the existing skill level, and determining the training gap. NSB used various methods such as the annual training need survey, interviews with the respective
Heads of divisions, Managers of branches, and consultations with the GM/CEO and DGMs, reviewing customer complaints, performance appraisals, and questionnaires in
conducting the TNA. The findings of the TNA was used to determine the different types of training programmes required by the Bank: On-the-job training, in-house training ,
external training, or foreign training.
GRI 404-1, 2
Overview of training and development in 2017
We have created a safe learning environment for our employees offering various type of training programmes including induction, on board training, technical skills
development training, and soft skills development training throughout their career life cycle. The induction programmes assist our new recruits to gradually assimilate into the
working culture at NSB. Our principal objective is to create business leaders who will add value to our establishment as well as to the nation.
In 2017, over Rs. 34.4 Mn. was invested in foreign and local training initiatives, which funded 252 training programmes, logging a massive number of 45,347 training hours for 2017. Out of the 252 training programmes, 118 were conducted in-house and 120
externally. There were 14 overseas training programmes for 53 participants from NSB. The average number of training hours per employee stood at 12 hours and the
participation ratio stood at 88%.
Our investments on training and development continued to increase with higher capital injected to the programmes and the increase of training hours per employee from previous
years. We strive to improve training and knowledge sharing programmes to conduct through webinars from next year onwards which enable the employees to learn at their convenience across the geographical boarders. We will continue to invest in continuous
professional development.
114
National Savings Bank Annual Report 2017
Employee retention and turnover: We are a coveted employer in Sri Lanka
NSB’s position as a coveted employer in Sri Lanka has been cemented over the years by our reputation, employee-friendly policies, and our corporate culture. In 2017, we
achieved a high employee retention ratio than the industry average. This is a huge achievement to us, and it signals that we have created a safe working environment and
culture at NSB which nurtures the employees. Our very impressive retention rate of permanent employees cardre stood at 96.7% while our turnover rate for the year was 3.3%.
Age group Male Female Grand total
Less than 25 1 0 126-35 2 5 736-45 1 4 5Above 45 67 23 90Grand total 71 32 103Percentage (%) 69 31 100
The secret to our high retention is the benefits and incentives and the conducive working environment provided by NSB to the team that translate into employee loyalty, and
retention. The sense of family that exists in NSB goes beyond ordinary employee loyalty. The fact that only 15 employees left the Bank during the year for reasons other than
retirement shows the sustainable working culture we have created at NSB.
GRI 401-2, 405-2GRI 202-1
NSB offers myriad benefits to its employees
We offer competitive salaries that are on a par with the wages of other State-owned banks and well above the National minimum wage. Frequent discussions are held from time to
time with unions and employees on the subject of wages and remuneration packages. There is an equal pay policy in place for determining remuneration packages. We pay annual
bonuses at the end of the year and a special target bonus if target Bank objectives are met.
The benefits to employees include a comprehensive health plan, housing, vehicle loans, computer loans, consumption loans, and distress loans at concessionary interest rates.
The Bank granted 384 housing loans to employees for a value of Rs. 1,069 Mn. during the year. Staff housing loan balance as at 31 December 2017 is Rs. 5,634 Mn.
GRI 401-1

115
National Savings Bank Annual Report 2017
There is also a pension plan and training, travelling and accommodation subsidies, professional membership, and an honoraria payment on successful completion of
examinations, at the Institute of Bankers of Sri Lanka (IBSL), and membership reimbursement for professional bodies such as Chartered Institute of Management
Accountants (CIMA), The Institute of Chartered Accountants of Sri Lanka (CA Sri Lanka), and Chartered Financial Analyst (CFA), and etc. There is also a scheme which allows employees to encash unused medical and privilege leave. We provide EPF, ETF, and
Gratuity. Finally there are retirement benefits and death gratuity provided to our employees.
GRI 201-3
Retirement benefits: All our employees are well taken care of
All permanent employees are covered by non-contributory pension schemes where terms and conditions vary depending on the date of appointment. (Employees who joined the
Bank on or after 1 October 1995 are entitled for a separate pension scheme)
There are four types of retirement benefit plan obligations given to our employees:
Pension fund (Scheme I and II), Contributory Widows/Widowers and Orphans Fund (only for Scheme II) and Contributory Retirement Medical Scheme. The fund set up to pay the pension plan’s liability is fully covered. The cost of providing benefits under the
defined benefit pension plan is determined using Projected Unit Credit actuarial valuation method and the estimate Pension Fund (Scheme I) includes employees recruited to the
Bank before 1 October 1995. Contribution to Pension Fund (Scheme I) during the year was Rs. 392 Mn. and unfunded liability stood at Rs. 2,751 Mn.
The participation for Pension Fund (Scheme II) includes employees recruited to the Bank on or after 1 October 1995. Contribution made by the Bank to Pension Fund (Scheme II) during the year was Rs. 97.2 Mn. 12% of the gross salary is contributed by the Bank for
the Pension Fund (Scheme II).
116
National Savings Bank Annual Report 2017
The Retirement Medical Scheme and Widows, Widowers and Orphans Fund are both contributory schemes. Bank contributed Rs. 96 Mn. to retirement medical scheme and
unfunded liability stood at Rs. 961 Mn. at the year end. The amount of contribution to the Retirement Medical Scheme is determined by age. The contribution of Widows, Widowers and Orphans Fund is determined by the basic salary of employees. Members of the Fund
should contribute 5% of their basic salary as contribution.
Employee engagement and well-being
Well-being programmes not only have a positive impact on employees’ wellness, they can also lead to a significant increase in the team’s engagement, cohesiveness, and
overall productivity. For the first time in history, “NSB Staff Day” participated by all NSB employees was held at Sugathadasa Stadium in February 2017.
Throughout the year, multi-religious ceremonies and events like Vesak Bakthi Gee, Avurudu Pola, and Christmas Carols are organised by the Welfare Division to spread spiritual and religious harmony among the members of the staff. We also organise an
“Avurudu Uthsawaya” every year with the participation of employees and their families. A sports meet is also held annually, with regional sports meets held before the final
sports meet held in Kandy. There are also various sports teams of our employees ranging from cricket, football, volleyball, and etc. Our employees also come together
for the numerous CSR events that are conducted throughout the year. Moreover, the Bank provides library facilities and NSB Sports Club maintains an in-house gym in the Bank’s
Head Office premises.
The annual Achievers Award Ceremony is held to felicitate academic achievements (GCE Ordinary Level, GCE Advanced Level, and Grade Five Scholarship Examinations)
and non-academic achievements in sports and extracurricular activities of the children of the employees. To thank our people for their commitment and loyalty to NSB, the Bank organises an annual felicitation ceremony to recognise employees who have completed 25 and 35 years of service. In 2017, 21 employees received the reward, 15 of whom were
honoured for their 35 years of service.

117
National Savings Bank Annual Report 2017
Concessionary rates for food from the Head Office canteen is provided to our employees and the Bank provides monetary assistance for day outings organised
by branches and divisions.
NSB supports the employees and their family members during the good times and the bad. On the occasion of a death of an employee, the Bank provides dependants
with financial support.
Promoting work-life balance
Our HR team uses smart management methodologies to achieve work-life balance which allows our employees to feel as if they are paying attention to all of the important aspects of their lives. We assist our employees by offering such opportunities as sponsoring tours,
establishing circuit bungalows to provide affordable accommodation at popular holiday destinations, and flexible working arrangements for new mothers by providing a feeding
hour for six months since child’s birth.
The Bank maintains 15 holiday resorts in different areas of the country as at December 2017: Inn Anuradhapura, Kandy, Kataragama, Ambalantota, Nuwara Eliya (two
bungalows), Mahiyanganaya, Galle, Bandarawela, Badulla, Dambulla, Chawakachcheri, Beliatta, Marawila, etc. A new bungalow at Diyathalawa was opened this year. In 2018,
we hope to expand our circuit bungalows even further by opening a new bungalow at Kataragama.
Parental leave
As per the Shop and Office Act, female employees are entitled to parental (maternity) leave. Our female employees are entitled to maternity leave and benefits without any
constraints and we facilitate their return to work. We also offer paternity leave of three days to male employees.
118
National Savings Bank Annual Report 2017
Managing performance
At NSB, we possess an equitable, transparent appraisal system. The Bank measures the performance of employees periodically on the basis of their hierarchy. It is a continuous
process. All our employees are assessed against a set of predetermined criteria each year. NSB’s policy on performance management is drawn up to identify performance gaps of employees as well as training and development needs. The feedback from the
performance appraisals is used for increments, promotions, annual bonuses, and reviews in remuneration packages.
NSB is in the process of introducing comprehensive KPI-based performance management and appraisal system to develop a performance-driven culture within the Bank. As the
first phase of implementation, the system was introduced to the Senior Management level. The system will be put into effect across the Bank from 2018 onwards. Going ahead with this objective, NSB has conducted 12 training programmes with the participation of 378
employees to create awareness of the new system.
Employee grievance handling
Grievances arise when employee expectations are not fulfilled by the Management. NSB understands the need to address grievances in a timely manner and as close as possible to the point of origin. The Bank has incorporated both the “Step Ladder” system, where
a grievance is resolved through the hierarchy, and the “Open Door” policy where the grievance is directly dealt with by an independent party nominated by the HR Committee.
All grievances are handled in a fair and impartial manner. The Bank, recognising our position as a Bank for all segments of society, addresses all staff gatherings in English, Sinhala, and Tamil. All circulars and advertising campaigns are conducted in all three
national languages.
Whistle-blowing policy
NSB’s whistle-blowing policy was established to create a proactive framework addressing the occurrence of frauds and other illegal activities which covers prevention, early
detection, reporting, monitoring, recovery, and follow-up actions. It enables employees to raise concerns about improprieties relating to accounting, financial reporting, internal
GRI 404-3

119
National Savings Bank Annual Report 2017
controls, frauds, corruption, collusion, coercion, irregularity, misappropriation, auditing matters, or other matters, without fear of reprisal in any form. The policy is designed in a way that the employees can raise their concerns without fear of victimisation, subsequent
discrimination, disadvantage or dismissal.
GRI 205-2
Code of Conduct
A Code of Conduct has been introduced to guide and educate the employees in matters relating to discipline. The Bank upholds “zero-tolerance” for all forms of corruption,
bribery, and extortion practices. The Bank takes strict disciplinary actions against employees who violate the Disciplinary Code or indulge in malpractices.
GRI 406-1
Ensuring diversity and equal opportunity
As an inclusive, equal opportunity employer with a diverse workforce, we do not discriminate on the grounds of sex, marital status, race, colour, creed, religion, physical
disability, mental health, learning difficulty, age, or sexual orientation. We are committed to providing all our employees with equal opportunities and fair treatment. Our
recruitment policy, as mentioned above, follows the same values. We are happy to report that there were no incidents of discrimination reported during the year.
Occupational health and safety
It is our responsibility to look after the health of our employees. As a part of NSB’s health initiative, we have launched several programmes to improve employee health.
There is an in-house medical centre at NSB Head Office run by a leading private hospital and managed by the Bank’s Welfare Division. Twice a month, specialised doctors
can be consulted at the medical centre. There are also medical clinics conducted by leading private hospitals.
Moreover, our employees have the opportunity to participate in regular seminars conducted by professional resource personnel on stress management, eye care, and
prevention of cardiovascular diseases. The amounts for employee medical benefit scheme are decided by collective agreement. In addition, critical illness cover is available for
employees in order to provide assistance to employees in critical illness.

120
National Savings Bank Annual Report 2017
In addition to ordinary medical coverage, all permanent employees are also covered by the Bank’s Compensation Benefit Scheme, under which the Bank will compensate
dependants of an employee up to a maximum of Rs. 1 Mn. in case of death or permanent or partial disability while at work. There was only one incident of occupational injuries
reported in 2017.
The Security Division of NSB present at every NSB branch is given strict instructions of the management of safety and procedures to follow to ensure a safe, secure workplace.
These vary from maintaining the alarm systems, CCTV systems to making the branch staff aware of handling crises. A comprehensive safety plan is in place to create
a safe workplace.
GRI 407-1GRI 102-41
Freedom of association and collective bargaining
Trade unions operating within the Bank include the Jathika Sevaka Sangamaya, Ceylon Bank Employees’ Union, Sri Lanka Independent Bank Employees’ Union, Executive
Officers’ Association, and All Ceylon Bank Employees’ Union. We are happy to report that the relationship between the Management and the Unions has been very healthy over the years. NSB conducts regular cordial meetings with the unions to ensure the happiness of our employees. At NSB, our policy for collective bargaining focuses on
encouraging employee engagement. All permanent staff members deal with collective bargaining agreements. Remuneration and benefits are determined by collective
agreement which is decided once in every three years. Due to the effective transparent policies in place, there were no incidents of violation in industrial relations and collective
bargaining during the reporting period.
Challenges faced in 2017
Management of the human capital of any organisation can be a very complicated process. It is shown that the effective management of human resources leads to a more cohesive,
more productive, more engaged corporate entity. NSB faced numerous challenges throughout the year concerning our human capital.

121
National Savings Bank Annual Report 2017
The digitalisation of the banking industry due to the advent to technological innovations is a primary challenge in the banking sector. The ageing workforce with limited exposure
to the technological advances poses a problem. NSB faced challenges in designing training programmes to prepare our employees for the digitalised environment. Our “Model Bank”
initiative with a bespoke smart zone will help the Bank and its employees to prepare for the digital transformation of the future.
Attracting and managing the millennial segment of the country’s population is another challenge that we face. The Bank introduced a suite of products aimed at the younger
generation along with marketing campaigns that are aimed at attracting the millennial segment. We hope that our initiatives will come to fruition in the near future.
The relentless demand for profitability and the increased competition in the industry pressurise financial institutions to focus only on the bottom line. We at NSB, are
aware of these trends. Our objective is to build a corporate that exemplifies all forms of sustainability.
Another challenge was faced with the introduction of the new KPI-based performance evaluation system. We are gradually implementing the system after the initial training
programmes conducted to create awareness across the NSB family.
A look into the future
Encouraging integrated thinking coupled with acquiring digital skills and continuous employee training and development through conventional as well as digital channels will be among our top priorities in the forthcoming year as we strive to anticipate to meet the
needs of a new generation of increasingly tech savvy customers. We are committed to bring out the best in every one through professional development and empowering people
to take ownership of their careers enriching employee experience and engagement.

Our impression can be measured beat by beat...
While NSB’s unique story is 45 years old, we possess a financial heritage of over 180 years. Throughout our illustrious history we learnt the Nation’s heartbeat, just as much as our unique
heartbeat is heard throughout the Nation.

123
National Savings Bank Annual Report 2017
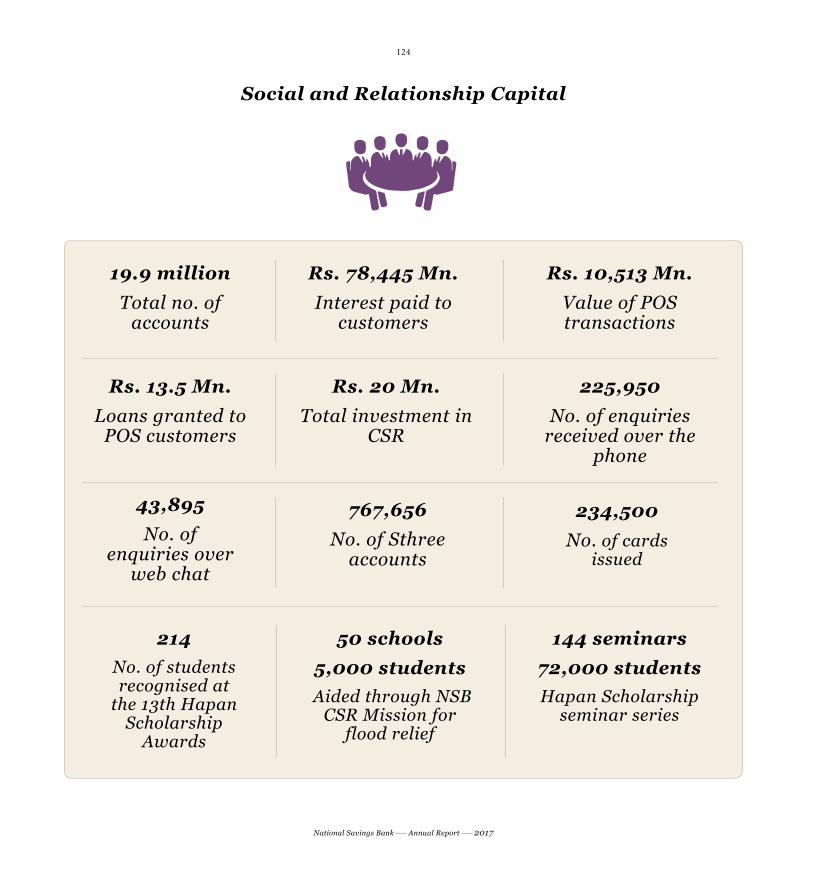
124
National Savings Bank Annual Report 2017
Social and Relationship Capital
19.9 millionTotal no. of
accounts
Rs. 78,445 Mn.Interest paid to
customers
Rs. 10,513 Mn.Value of POS transactions
Rs. 13.5 Mn. Loans granted to
POS customers
Rs. 20 Mn.Total investment in
CSR
225,950No. of enquiries
received over the phone
43,895No. of
enquiries over web chat
767,656No. of Sthree
accounts
234,500No. of cards
issued
214
No. of students recognised at
the 13th Hapan Scholarship
Awards
50 schools 5,000 students
Aided through NSB CSR Mission for
flood relief
144 seminars72,000 studentsHapan Scholarship
seminar series

125
National Savings Bank Annual Report 2017
Since our inception, building close relationships based on trust, sharing value, contributing to the community, and protecting the environment are core to the NSB ethos.
Social and relationship capital encompasses our relationships with communities, groups of stakeholders, and other networks. Interaction with key stakeholders, consideration
of their concerns and earning their trust are central to maintaining and developing this capital. We recognise that our relationship with regulators, the Government
(our principal shareholder), customers, suppliers, business partners, and other bodies are equally important to our success. Our business activities have an impact on many aspects of society and we have strategies and systems in place that ensure that our relationships
are managed effectively. We contribute to the betterment of society and community empowerment as they form an integral part of our business sustainability.
Regulator Capital At NSB, we value transparency above all else and we are dedicated to fully comply with the required practices and regulatory requirements. Being a State-owned bank, NSB is
highly regulated in terms of provisions of various acts such as the Banking Act, Finance Act, Financial Transactions Reporting Act, Exchange Control Act, NSB Act, and other
regulations issued by the Central Bank of Sri Lanka (CBSL). We have in place an efficient Regulatory Board which plays a supervisory role to ensure compliance with regulatory
requirements. NSB, in its operations, diligently follows the guidelines set by the Central Bank. Furthermore, complying with the directives of the CBSL, NSB submits periodic information related to Bank’s operations. In addition to above, the Bank maintains a
continuous dialogue with the line ministry, Ministry of Public Enterprise Development. Furthermore, the Bank engages with the Ministry of Finance, the Department of Inland
Revenue, Auditor General’s Department, Attorney General’s Department, Sri Lanka Accounting and Auditing Standards Monitoring Board, and the Parliament.
GRI 206-1GRI 205-2, 3
Culture of compliance
In the present business context, compliance has become the yardstick by which institutions gauge their preparedness with respect to unanticipated risks. Being a State bank, NSB is conscious of its role as a model corporate citizen. Our transparency and
adherence to best practices have inculcated a culture of compliance. We are committed to fully comply with the required regulatory requirements and best practices by integrating

126
National Savings Bank Annual Report 2017
high standards in governance through Board oversight and top-down communication on the culture of compliance. Educating employees with the standards and practices of
compliance supports in enhancing the compliance culture. Our proactive approaches have ensured our compliance to all statutory requirements. During the period under review,
no fines or non monitory sanctions were imposed due to non-compliance with laws and regulation relating to corruption, anticompetitive behaviour, antitrust, monopoly
practices and use of product and services.
Customer Capital Our customers form the backbone of NSB. We follow a customer-centric strategy that
is geared towards improving our customer experience. NSB is committed to deliver high-quality customer experience through improving convenience, adopting the latest
trends in banking, fulfilling customer service expectations, and tracking customer satisfaction. Over the years, NSB has created a qualitative customer experience through a multi-channel approach. Our extensive, customer-oriented product portfolio is aimed at all segments of the Sri Lankan society. Our high-quality service delivered across a wide branch network, mobile and Internet banking, and other digital platforms provide our
customers with simpler, seamless, direct engagement with the Bank.
A Bank for all Sri Lankans
NSB is the Bank for all segments of society. This is not just a motto but a reality. We stay true to the “National” aspect of NSB by serving all the citizens of our nation including
the unbanked and the underbanked. The Bank’s deposit base witnessed a stellar growth of 12.2% to reach Rs. 737.2 Bn. and the Bank’s loans and advances portfolio recorded an impressive 20.0% growth to reach Rs. 388 Bn. These impressive figures show our
commitment to fostering a savings culture in Sri Lanka and the gradual growth in customer and deposit bases epitomise the trust that our customers place on NSB.
As a leading financial institution in Sri Lanka, we have built strong multi-generational relationships with many of our customers throughout their life cycles. We offered
following products and services catering to different segments with diverse needs and objectives.
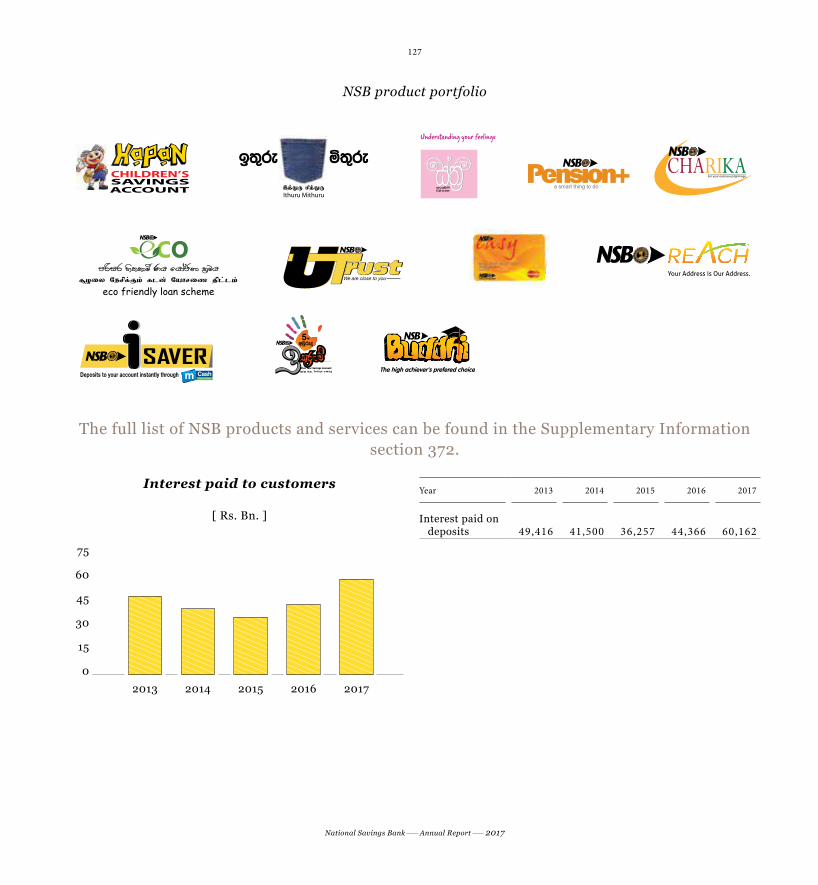
127
National Savings Bank Annual Report 2017
NSB product portfolio
The full list of NSB products and services can be found in the Supplementary Information section 372.
Year 2013 2014 2015 2016 2017
Interest paid on deposits 49,416 41,500 36,257 44,366 60,162
Interest paid to customers
[ Rs. Bn. ]
75
60
45
30
15
0
20172016201520142013

128
National Savings Bank Annual Report 2017
Product wise analysis of loans portfolio
[ % ]
Housing and Property loans Personal Loans Loans against deposits Pawning Auto Loan Staff Loans (Include Staff Housing) Loans to Banks Project Loans
201735.337.9
9.87.11.31.3
22.025.3
6.76.26.46.1
0.10.1
18.416.0
2016
Banking made convenient
NSB provides easy, accessible, and convenient banking solutions to our customers. Our customised services are designed to save time and suit individual customer requirements whether it is managing your account, obtaining easy loans, or enabling you to keep track
of your finances. We have extensive reach through our 250+ branch network, point of sale banking outlets, online and SMS banking, and a range of card options.
Point of Sale (POS) banking – NSB Reach
NSB introduced POS banking to take its unique products and services to reach underbanked people. There are over 300 hand-held POS machines in service across 253 branches of the Bank. In 2017, POS banking recorded Rs. 10.5 Bn. through 6.6 million
transactions. Equipped with POS machines, Bank officers reach remote villages, towns, and key gathering points providing access to NSB’s services in the most affordable way,
whenever and wherever these customers need these services. We have gone an extra mile providing credit facilities under “NSB Reach +” to our POS customers with the objective of encouraging self-employment and small and medium enterprises. NSB disbursed 44 such loans amounting to Rs. 13.5 Mn. since its launch in November 2017, within the short span of just one month. Further, our customers have the convenience of making the utility bill
payments through POS machines.

129
National Savings Bank Annual Report 2017
Province Number of transactions
ValueRs. Mn.
Central 677,690 1,080Eastern 610,455 781North Central 364,415 714North Western 728,490 1,370Northern 890,316 1,011Sabaragamuwa 528,034 765Southern 753,998 1,061Uva 377,005 597Western 1,727,826 3,133Grand Total 6,658,229 10,513
Digital banking
With customers and businesses preferring to bank digitally than to visit a branch, there is a higher demand for digital banking. NSB has embraced digitalisation in the banking
sector to deliver more efficient, effective digital products and services for customers across diversified lines of business. This will shift the branch-centric model to
customer-centric model and enable the customers to self-select and switch the channels seamlessly according to their personal preferences. Our online and SMS banking provide greater accessibility and convenience while our digital product portfolio is strengthened each year with new additions. The NSB iSaver is a prime example of an effective digital
product that fosters a better savings culture among Sri Lankans. We hope to expand our digital capabilities to serve the customer of the future.
Card services
NSB offers its customers a range of card options, and in 2017, the Bank kept improving its debit card product and service system and secured rapid development of its debit card business through product innovation. Our customers can deposit or withdraw cash from
accounts through our islandwide, extensive ATM network. NSB MasterCard or Visa Debit cards allow our customers to complete transactions through linked savings accounts. NSB
maintained and further strengthened the value offer for NSB Easy Card platform. Easy Cards allows credit facilities to the Bank’s fixed deposit holders without the added joining,
annual, overdue, or late-payment fees.
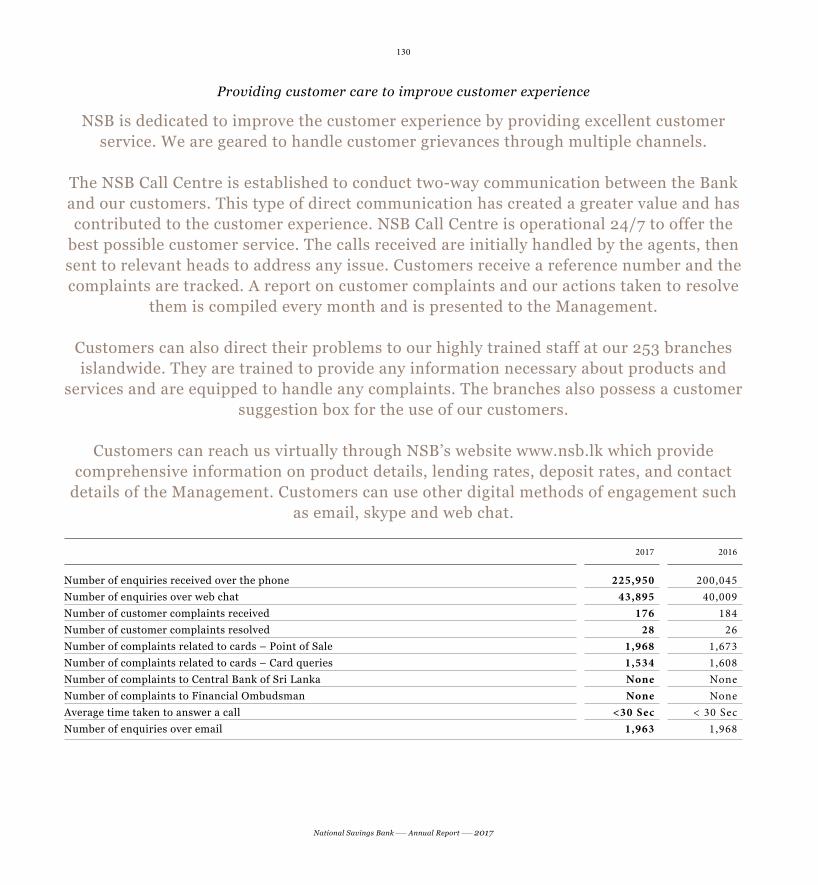
130
National Savings Bank Annual Report 2017
Providing customer care to improve customer experience
NSB is dedicated to improve the customer experience by providing excellent customer service. We are geared to handle customer grievances through multiple channels.
The NSB Call Centre is established to conduct two-way communication between the Bank and our customers. This type of direct communication has created a greater value and has contributed to the customer experience. NSB Call Centre is operational 24/7 to offer the
best possible customer service. The calls received are initially handled by the agents, then sent to relevant heads to address any issue. Customers receive a reference number and the complaints are tracked. A report on customer complaints and our actions taken to resolve
them is compiled every month and is presented to the Management.
Customers can also direct their problems to our highly trained staff at our 253 branches islandwide. They are trained to provide any information necessary about products and
services and are equipped to handle any complaints. The branches also possess a customer suggestion box for the use of our customers.
Customers can reach us virtually through NSB’s website www.nsb.lk which provide
comprehensive information on product details, lending rates, deposit rates, and contact details of the Management. Customers can use other digital methods of engagement such
as email, skype and web chat.
2017 2016
Number of enquiries received over the phone 225,950 200,045Number of enquiries over web chat 43,895 40,009Number of customer complaints received 176 184Number of customer complaints resolved 28 26Number of complaints related to cards – Point of Sale 1,968 1,673Number of complaints related to cards – Card queries 1,534 1,608Number of complaints to Central Bank of Sri Lanka None NoneNumber of complaints to Financial Ombudsman None NoneAverage time taken to answer a call <30 Sec < 30 SecNumber of enquiries over email 1,963 1,968

131
National Savings Bank Annual Report 2017
Customer privacy
While information help us to provide a superior service, our utmost priority is our customers’ trust which is achieved by keeping our customer information confidential.
We invest in the latest technologies to help us protect your information. There are also processes and training of our team to improve the existing security procedures.
Furthermore, “Customer Privacy” is embedded as an essential element in NSB Act as well as the Customer Charter. There were no complaints pertaining to the breach of customer
privacy or loss of customer data in 2017.
GRI 417-2, 3
Product and service responsibility
All related information such as interest rates on deposits and lending products, charges and exchange rates are clearly disclosed to the customers via displays at branches,
electronic media and corporate website. Terms and conditions applicable to the products and services are properly communicated to customers according to the Customer Charter
prepared in compliance with CBSL guidelines. During the period under review, there were no instances of non-compliance to any product and service labelling or marketing
communication guidelines.
GRI 102-13
Industry networks
As a leading financial institution in Sri Lanka, we play a vital role in strengthening the entire industry through continuous engagement with peers and network. We constantly
participate in the industry forums and workshops making an influence towards the social and economic betterment of the country. The Bank holds memberships in the following organizations through which it engages with industry participants and the wider public:
The National Chamber of Commerce
LankaClear Private Limited
Employers’ Federation of Ceylon
Society for Worldwide Interbank Financial Telecommunication (SWIFT)
The Sri Lanka SWIFT User Group
Eurogiro Global Payment Community
The World Savings Banking Institute
GRI 418-1

132
National Savings Bank Annual Report 2017
Special marketing campaigns held in 2017
Each year, NSB conducts a series of marketing campaigns across our numerous customer touchpoints islandwide to improve customer reach and satisfaction. Our campaigns
consist of incentives to our customers. Through research, NSB’s marketing team identifies customers’ needs and wants, and formulates a marketing strategy. Strategy is then
converted into action, where the team takes decisions on particular products and services to be marketed within the year.
In 2017, NSB held a range of special marketing initiatives to improve customer reach and
satisfaction. NSB's major marketing and digital marketing campaigns held during 2017 are mentioned below.
NSB iSaver
There was an islandwide promotional campaign held in August at all 253 NSB branches with the launching of NSB isaver.
NSB U-Trust
Our foreign currency remittance service NSB U-Trust is highly popular among the Sri Lankan expatriate community. To expand the reach of U-Trust and to increase the
number of remittances received through Valutrans, Al Rajhi Bank, Middle East exchange houses, we conducted the “Cash from there, Gifts from here” lottery draw for the second time. The publicity campaign ranged from promotional material to advertisements. The following prizes: scooters, refrigerators, washing machines, home theatre systems, tabs,
LED TVs, mobile phones, and bicycles were gifted to 60 winners.
Sthree
NSB Sthree savings account was successfully relaunched at a ceremony held in Colombo on 19 January 2017. It was relaunched with several value additions to provide a new
strength to our female customers. Gift vouchers, Life style books, and umbrellas were distributed among the top savers. An island-wide promotional campaign was also
organised to promote the Sthree savings account.

133
National Savings Bank Annual Report 2017
Hapan
Hapan is the savings product for children below 16 years. In order to popularize Hapan, Punchi Hapan, and Thepal Hapan children's savings accounts amid the competitive
market environment, the Bank launched a new gift scheme from 15 May 2017. Pencil sets, rain coats, umbrellas, and water bottles were offered to top savers.
Engaging customers digitally
The rapid digitalisation of the sector has changed the way in which we market our products and brands. It is now necessary for a brand to have a digital presence in social media networks. Digital marketing is the process of using all available digital channels
to promote a service or brand. NSB has recognised the advantages of cost-effective, targeted, measurable digital marketing and that social platforms can be a powerful tool for
connecting with your audience and converting customers into brand enthusiastsNSB offers efficient knowledge flow on banking processes to its customers via
mobile and digital banking applications through digital applications. We shares all corporate information and news on social media channels in addition to our website with
all our customers.
In 2017, we revamped our digital marketing strategy and began the process of creating an online presence. In the process, we launched campaigns through all social networking
sites like facebook, YouTube, twitter, and LinkedIn in August 2017.
www.nsb.lkwww.facebook.com/ NSBSLOfficial
https://twitter.com/NSBSLOfficial
https://www.linkedin.com/company/nsbslofficial/
https://www.youtube.com/channel/UCv5lA_fM2_L8fd9xObUlhuQ

134
National Savings Bank Annual Report 2017
Business Partner Capital
NSB considers partnerships with our constituencies a key part of the way we conduct business. Over the years, we have built solid, productive, and long-term relationships
with our customers, suppliers, outsourced service providers, correspondent banks, and other partners. As a State bank, we have a responsibility to adopt and maintain exemplary corporate practices. We follow a transparent policy in the engagement with our local and
international business partners.
Outsourcing policy
The outsourcing policy of the Bank has been developed in accordance with the Banking Act Directions No. 2 of 2012, “Outsourcing of Business Operations of Licensed Specialised Banks”.
The policy has been formulated to be followed when outsourcing its non-core operational activities that the Bank find it advantageous or deemed necessary to outsource.
The outsourcing policy discusses key factors to be considered when outsourcing the activities of the Bank including the oversight of the Board of Directors and the
Senior Management.
Communication policy
As a leading Government-owned financial institution, the corporate communication of the Bank essentially should be; timely, accurate, comprehensive, authoritative, and relevant to all aspects of banking matters. All means of correspondence by the Bank should be made with responsibility and accountability. In order to address the above objective, NSB has a
Board approved communication policy in place.
GRI 204-1
Procurement policy
The overall objective of our procurement policy is to ensure that all necessary materials, equipment, and services are available when needed to facilitate smooth functioning of operations while optimising costs. To this end, we have put in place standardised and efficient procurement procedures. To ensure compliance with the principles of
sustainability, our suppliers must meet strict standards. Our policy ensures transparency in sourcing, procurement processes, and contracts.
GRI 102-9

135
National Savings Bank Annual Report 2017
Our procurement manual is in line with the Government’s procurement guidelines. Three levels of procurement committees operate with authority under the procurement manual. As part of the process, the Bank procured all products from locally based suppliers. Each year an annual procurement plan is prepared and purchases are made in accordance with the plan. NSB obtains the services of outside suppliers for services such as the purchase
of fixed assets, consumable items, IT and software infrastructure, gift items, printing, marketing and promotional activities, maintenance and construction services, and
consultancy assistance in special cases.
Relationship management
During the year, NSB implemented several initiatives to maintain relationships with the number of business partners that the Bank associates. NSB also focused on building new
relationships. The following are the initiatives undertaken by NSB in 2017:
Visited overseas agents and exchange houses in order to strengthen the link between NSB and them. NSB’s Business Relationship Officers engaged with exchange house staff to deliver high quality customer service to the NSB customer base.
Conducted several marketing campaigns at cultural events at Sri Lankan embassies around the world and other organisations.
Conducted several training sessions at Sri Lanka Foreign Employment Bureau.
Maintained relationships with recruiting agencies to capture new markets.
Built links with automobile dealers for retail trade and financing business segments.
GRI 413-1
NSB makes a true impression on the community Being a State-owned bank, NSB has a responsibility of being an exemplary corporate citizen. To that effect we are cognisant of our impact on the society and environment and committed to create social value through engaging in sustainable business. Since
our inception in 1972, we have shared long-term values with our customers, staff, environment, and the community we operate in. As mentioned in the Chairman’s message,
sustainability takes centre stage in our strategic direction and our operations. As a Government entity, we have to set an example to the rest of the business community.

136
National Savings Bank Annual Report 2017
We consider it our obligation to consider the interests of customers, employees, communities, and the ecology and to consider the social and environmental consequences
of our business activities. All socio-economic, environmental, and social concerns are integrated into our business model, core business processes and decisions. Our ultimate
goal is to create both sustainable social value and corporate value.
Every year, a number of community outreach and development projects are organised by NSB. There exists various programmes on improving social well-being, bolstering
national healthcare, supporting education, and other various social, cultural, and religious programmes. The following are NSB’s activities during 2017:
GRI 203-1
Our impression on capacity building of the nation
The bank has granted loans for large scale infrastructure projects of Sri Lanka such as the Central Expressway. This will foster development and increase accessibility and mobility which will reduce the concentration of expanding the industries in the Western Province.
Further, construction of the Central Expressway will boost potential in Northern and Central parts of the country for economic growth.
Our impression on social well-being
The “NSB CSR Mission” for flood relief in Kalutara District
The Kalutara District was severely affected by adverse weather conditions which led to flash floods. NSB with the Ministry of Education and the Ministry of Public Enterprise
Development organised a flood relief mission to help those in need.
The NSB CSR Mission was directed at helping with the rebuilding process of over 50 schools and helping over 5,000 schoolchildren in the process. Under the Mission, we
renovated flood-affected school buildings and distributed stationery packs consisting of 24 exercise books, eight pens, 6 pencils, three erasers, and a foot ruler.
The mission also included conducting seminars for schoolchildren sitting for Grade 5 Scholarship and O/L Examinations in the Bulathsinhala, Baduraliya, and Matugama
areas. The NSB branches in the affected areas provided with a list of affected schools and their recommendations were taken into consideration before undertaking the Mission.

137
National Savings Bank Annual Report 2017
The affected schools had to submit cost estimates for the rebuilding of infrastructure with an approval from the Zonal Educational Office.
A total of Rs. 9 Mn. collected for the programme through the contribution of Rs. 5 Mn. by the Bank and the donation of a day’s salary by the Bank’s staff of
Rs. 3.8 Mn. The total cost incurred for the flood relief programme was Rs 4.2 Mn. The remaining Rs. 4.5 Mn. is available in the CSR fund which be used for another
project of national importance.
The International Elders’ Day 2017
NSB recognises that elderly people need care and comfort to lead a healthy life without worries and anxiety. The International Elders’ Day was celebrated under the theme
“Stepping into the future” on 1 October 2017 at the BMICH. This event was organised by the National Secretariat for Elders (NSE) along with the Ministry of Social Empowerment
and Welfare. NSB was the main sponsor of the event.
The event celebrated elders over the age of 100, and elderly women over the age of 75 who had given birth to more than 14 children.
The Bank sponsored Rs. 600,000.00 to the event. 235 elders over the age of 100 were offered gift vouchers worth Rs. 2,000.00 There were 10 special gifts given to 10 elders
from each category. The total cost of gifts accounted to Rs. 490,000.00.
Methsarana Scholarship
This programme was held to provide scholarships for schoolchildren who were affected by the Meethotamulla landslide. The event, organised by the Urban Planning and
Water Supply Ministry and sponsored by NSB and AIA insurance Sri Lanka, was held at the BMICH on 16 November 2017. Scholarships worth Rs. 25,000.00 were
distributed to 107 children where NSB contribution was Rs. 1.2 Mn.
Viru Sumithuru housing project for deceased and disabled war heroes
Ministry of Defence and the Ranaviru Seva Authority conducted a project to build 750 houses (300 new and 450 partly built houses) for deceased and disabled soldiers. NSB
contributed Rs. 1.2 Mn. to the project.

138
National Savings Bank Annual Report 2017
Gift pack distribution for low-income families in Borella
NSB distributed 3,000 gift packs among children of low-income families in Colombo. Gift packs were given to Grade 1 and pre-school students. NSB invested Rs. 2.1 Mn.
for the project.
Our impression on education
NSB holds Hapan Scholarship Awards for the 13th consecutive year
NSB organises this event annually to recognise the high achievers of Grade 5 Scholarship Examination. The award ceremony is the culmination of the Hapan seminar series.
The 13th Hapan Scholarship Awards was held at Nelum Pokuna on 31 October 2017.
Out of the 214 students who received awards, 13 were students with learning difficulties. NSB recognises the commitment and hard work of students with learning difficulties.
Rs. 195,000.00 was allocated to supporting students who had learning difficulties.
The 17th annual Hapan Scholarship seminar series
The Hapan Grade 5 Scholarship seminar series is part of NSB’s initiative to support the future leaders of the country and national education. In 2017, there were 144 seminars
conducted islandwide with the participation of more than 72,000 students. Participation ranged from Sinhala and Tamil medium students from around the country. The seminars
are conducted by renowned educators. This year’s total investment came to Rs. 3.4 Mn. This programme has been implemented continuously since 2001.
Nanodha educational development programme
This was a seminar series organised to assist O/L students in the districts of Kandy, Matale, and Nuwara Eliya in the Central Province covering 15 educational zones. 30
seminars were conducted. NSB contributed Rs. 2,946,400.00 to the programme.
Our impression on healthcare
HelpAge Sri Lanka
At present, more than two million Sri Lankans are over the age of 60 years of which about 500,000 live below the poverty line. They have limited access to proper medical
and eye care facilities. HelpAge Sri Lanka conducts Mobile Medical Camps for medically vulnerable elderly persons in rural areas and suburban areas in Sri Lanka. NSB sponsors HelpAge with financial assistance for selected programmes. HelpAge engages in various

139
National Savings Bank Annual Report 2017
activities including medical examinations, donation of bifocal spectacles, donation of reading glasses and facilitating cataract operations.
A bus equipped with the latest medical equipment and doctors, nurses, and orderlies travel to remote parts of the island to provide healthcare to underprivileged elders.
The bus includes a pharmacy, as well as a ready supply of free spectacles, and is able to treat about 150 people a day free of charge.
In 2017, NSB sponsored nine mobile medical and eye camps investing Rs. 1.8 Mn. helping over 1,500 senior citizens. HelpAge Sri Lanka conducted eye clinics in Kalutara, Tangalle,
Galle, Galgamuwa, Meerigama, Kurunegala, Kuliyapitiya, and Helamade.
Colombo Friend-In-Need Society mobile health camp in Oddusudan
NSB in collaboration with the Colombo Friend-In-Need Society sponsored a mobile health camp held at Oddusudan. Over 1,500 people benefited from this camp which tested eyesight, hearing and screening for diabetes. Artificial limbs were repaired and fitted for
more than 20 people. The Bank contributed Rs. 389,000.00 for the camp.
A look into the future
NSB will diligently work towards creating value through our relationships with our employees, customers, society and environment, and other stakeholders. In the coming
years, NSB hopes to further develop its multichannel approach to service delivery to enhance our customer experience. Towards that end, the Bank will establish a dedicated Customer Response Management (CRM) solution in the Call Centre which will link the
entire branch network and the Head Office. This will ensure prompt response to customer grievances. NSB will also venture further into digitalisation and develop its digital
product offering and services. Moreover, NSB’s marketing strategy will be revamped. The marketing team will use diverse channels and promotional material to make our
customers aware of our extensive product offering. A marketing plan will be unveiled by the Marketing Division covering all products and services with the objective of reaching a
greater audience, boost customer base, and to increase deposit mobilisation.
Since its inception, NSB has become an integral participant of the communities that the Bank serves islandwide. NSB will develop an in-house CSR policy and guidelines with the
help of professionals in the field to manage and streamline the Bank’s CSR activities. A policy will ensure better organisation and proper management of CSR activities. Guided
by NSB’s core values, NSB will continue to give back to the community. With a clear perception of the social, economic needs of the communities, NSB will continue to create
long-term value and drive towards economic, and social sustainability in the future.

A tree is not planted for oneself but for posterity... NSB Agroforestry, our flagship project for environmental
preservation initiated in celebration of the 93rd World Thrift Day, will distribute a million plants by 2020.

141
National Savings Bank Annual Report 2017

142
National Savings Bank Annual Report 2017
Natural Capital As a service-oriented organisation and with minimal use of physical input materials, the Bank’s operations do not have a direct impact on the environment in terms of emissions
or generation of hazardous waste. However, as a responsible public entity, we are conscious of the need to preserve the environment and natural resources, for
future generations.
We produce no goods to be transported except stationery, fixed assets, and promotional materials for marketing campaigns, and the environmental impact of this is negligible. Our business premises, too, are carefully selected and constructed in order to minimise
their impact on the environment.
Guided by the UN SDGs, the Sri Lankan Government has implemented a number of sustainable initiatives. As a State-owned entity, and as a responsible corporate member of the community, we have pledged our support to these initiatives. We are thoroughly
conscious of our impact on the ecosystem. We have adopted a multidimensional approach to preserve the environment and natural resources for future generations.
Going digital helps the environment
Over the past years, NSB has invested in digital banking by offering innovative digital products and adopting digital practices. We recognise that digitalisation will automatically
eliminate the need for paper-based systems, storage space, and help minimise the carbon footprint.
NSB iSaver
With the introduction of NSB iSaver one is able to save money with the touch of a button, which will directly eliminate paper use and will help reduce consumption of resources
in other ways.
Other digital initiatives
The following initiatives have been introduced to create a paperless business through practices which lead to the reduction of paper use.

143
National Savings Bank Annual Report 2017
We encourage customers to subscribe to e-renewal letters instead of printed statements to reduce the usage of paper.
Internet, mobile, and SMS banking is promoted to conduct all banking activities to save energy and resources.
Digital marketing through online and social media networks have increased to reduce other forms of marketing that affect the environment.
Green banking initiatives
Energy-efficient buildings
The Bank has taken several measures to ensure energy efficiency in all operations. NSB is gradually converting to use renewable energy where solar panels were installed in five
branches in 2017. A lightning arrester will be installed along with the solar power systems to secure electric appliances within a branch. We have also replaced the Split AC units
with inverter operated systems to conserve energy at the Head Office.
Green lending initiatives
NSB continued the partnership with Ceylon Electricity Board (CEB) and Lanka Electricity Company (Private) Limited (LECO), for a community-based power generation
project titled Soorya Bala Sangramaya, launched by the Ministry of Power and Renewable Energy. The NSB Eco-Loan scheme assists Sri Lankans who wish to switch to renewable
energy with the necessary financial support. The project allows its beneficiaries to save on electricity bills as well as contribute to the national grid. Customers can select one of several
options including Net Metering Scheme, Net Accounting Scheme and Net Plus Scheme.
GRI 302-1
Energy consumption
Our primary source of energy is electricity which is entirely fulfilled by the National grid and our electricity consumption for the year stood at 27,614 gigajoules Installation of solar panels in our own branches is expected to bring down the energy consumption.
Further, there are frequent internal awareness programmes highlighting the importance of reducing energy consumption and the reasonable use of materials: use of LED lights,
unplugging electronic equipment when not in use, switching off unnecessary lights, usage of printing papers, and etc.

144
National Savings Bank Annual Report 2017
Other energy saving initiatives
Our operations at the branches and office building constitute NSB’s direct environmental impact. Outlined below are our initiatives to conserving resources, including water and
paper, the efficient use of energy, and the management of waste.
Continuous communication of importance of reduction of non-renewable energy consumption and conserving resources to the staff.
When constructing branch buildings, NSB takes maximum effort to avoid impacting the natural environment.
The Bank uses LED computer screen monitors.
NSB’s promotional materials are biodegradable.
The Bank obtains legal clearance from local authorities for constructions of houses before granting loans.
Limited the use of air conditioning to regular banking hours.
The Bank only uses CFC-free air conditioning units.
NSB Agroforestry: A million plants by 2020
Trees are essential to life as we know it and our existing forests and the trees we plant work in tandem to make a better world. Trees also build soil and offer energy-saving shade
that reduces global warming and creates habitat for thousands of different species. Trees also help to reduce ozone levels in urban areas.
NSB Agroforestry is NSB’s flagship project focused towards environmental preservation. The project was initiated in celebration of the 93rd World Thrift Day. The NSB
Agroforestry plans to distribute a million plants by 2020. This programme was conducted in collaboration with the Ministry of Primary Industry’s Dhana Saviya Programme and
the Coconut Cultivation Board with the objective of creating a new source of income while protecting the environment.
145
National Savings Bank Annual Report 2017
The Bank distributed 25,000 pepper plants and coconut seedlings through its island-wide branch network. Each branch was given 100 plants to distribute among the customers.
There was an active participation of citizens irrespective of age, living conditions, or social status.
Challenges
In a sector where generating profit and financial solvency are necessary elements, the high capital investment required to implement energy-efficient methods and renewable energy systems are challenges the Bank had to face.
Implementation of proper waste management and the measurement of outcomes needs improvement.
The reduction of electronic wastage disposal.
The reduction of energy consumption in a continuously expanding business where new branches are constructed and new employees are recruited is another difficulty that NSB faced.
A Look into the future
We are committed to protecting the environment and our approach is to reduce our carbon footprint. We will continue to strengthen the Core Banking Solution, Data
Management System, and automation to take digital banking further which will have a positive impact on the environment. Further, we plant to install state-of-the-art
automated cash deposit machines that minimise the use of paper. We also hope to use teleconferencing facilities and telecommunication whenever possible and conduct online
training through webinar, and developing more energy efficient office spaces. Our initiative to use solar power in branches will be expanded to reach 50 branches in 2018.
We will continue to focus on aligning the UN SDGs to our strategy, our business decisions, and our operations.

NSB’s impression on the UN Sustainable
Development Goals

147
National Savings Bank Annual Report 2017
The United Nations Sustainability Development Goals (SDGs) were created to address global inequality, insecurity, and injustice through specific targets to be achieved by
2030. These targets integrate the economic, social, and environmental dimensions of development while prioritising the management of natural resources for sustainable
production and consumption.
As mentioned in the Chairman’s Message, sustainability is embedded in NSB’s strategy, business operations, infrastructure, and more. NSB has always recognised the role
of the financial sector in its journey towards a sustainable, low carbon, and inclusive future. Thus, the Bank welcomes a global framework which communicates clearly and
comprehensively global sustainable objectives and is working towards its achievement.
NSB has been integrating sustainability across the full breadth of our business activities. We focus on identifying and capturing opportunities that carry high potential to deliver
positive and deliberate economic, social, and environmental impact. We partner with people, organisations, and communities that share our passion for sustainable development to maximise positive impacts on economy, social, and environmental
phenomenon. We will continue to identify opportunities that contribute towards achieving UN SDGs by 2030.
The following diagram outlines NSB’s contribution to the UN SDGs. Our projects and
programmes cut across different SDGs, therefore we have grouped relevant SDGs together to provide a comprehensive outlook.

148
National Savings Bank Annual Report 2017
Colombo Friend-In-Need Society mobile health camp
in Oddusudan.
Celebration of the International Elders’
Day 2017.
NSB sponsored HelpAge Sri Lanka Mobile medical and eye camps for senior citizens.
Hapan Scholarship Awards that recognise children
with learning differences.
NSB works towards good health and well-being through various community outreach projects and investing in healthcare in the work place. For our employees and their families, we provide comprehensive health care and medical schemes and our robust occupational health and safety policy contributes to creating a safe, secure working place. We also promote work-life balance, and provide incentives and benefits to improve employee well-being. Further, we have sponsored programmes with a human-centred approach to ensure heath and well-being, particularly in the elderly, and also children with learning differences. We partnered with reputed organisations in Sri Lanka and sponsored various health camps. The following projects were conducted in 2017 to address the relevant SDGs:
As the largest licensed specialised Bank, we foster a savings culture in all Sri Lankans and work towards financial inclusion. We address these goals through the creation of new jobs, our community outreach and development projects, empowering our customers by providing access to financial support, generating rural employment opportunities, contributing indirect employment through our key business activities to improve their income capacity, and so on. The following projects were initiated throughout the year:
Disaster relief programmes: “NSB CSR Mission”, and rebuilding
of houses in Kalutara District.
Scholarship programme, agricultural loans,
sponsorships,donations.
Sonduru Piyasa loan scheme.
Sthree savings account.
Methsarana scholarship
Viru Sumithuru housing project for deceased and
disabled war heroes

149
National Savings Bank Annual Report 2017
NSB is committed to uplifting education by financing educational initiatives for advancing literacy and equal opportunities for education for all Sri Lankans. Through our specialised mandate, we foster financial literacy and are committed to educate Sri Lankans, from all segments of society, of the value of saving and managing finances. Our financial management expertise is shared with our customers through employees in our extensive branch network. Further, our product portfolio expands access and use of savings and loan products to help Sri Lankans plan for and finance education. We also conduct educational seminars annually and award top performers every year. We also invest regularly to enhance the professional qualifications of our employees through local and foreign training programmes. The following programmes, seminars, award ceremonies, and etc. were conducted in 2017 to address the SDG on Quality Education:
Training programmes provided for employees.
Buddhi loan scheme.
Donations to students in Ratnapura, Kahawatta, and
Welladura.
Kurunegala Defence Services school awards.
Nanodha Educational Development programme.
Hapan Scholarship Awards.
Hapan Grade Five Scholarship seminar series.
NSB believes that empowering women will empower the next generation. As mentioned in our General Manager’s review, we have taken a holistic approach to empower women through specialised products and empowering women within our workforce. We are an equal opportunity employer and we do not discriminate on the grounds of gender. We have ensured women’s participation in leadership, policy and decision-making processes. Our parental leave and policy towards new mothers facilitate our female workforce. We also can boast of a very healthy male to female ratio of 6:5 at all levels with a 58 % of women in our total workforce. We view the women’s market as a distinct value proposition and we deliver tailor-made products, like the Sthree savings account, to empower Sri Lankan women in every strata of life, in diverse financial situations, with financial freedom.
Equal opportunity employer
Male to female ratio of 6:5 at all levels
Promoting financial freedom through the Sthree product
Female employees accounts for 58% of the total employees

150
National Savings Bank Annual Report 2017
Serving the Nation and Sri Lankans that come from all segments of society, we have strengthened the capacity of domestic financial institutions. Through our island-wide reach of 253 branches, over 4,000 postal offices, and POS banking we have expanded access to banking and financial services to the unbanked and under-banked population of the country. We also provide employment opportunities directly and our financing of projects lead to indirect job creation. Through our partnership with the Government, we have financed major infrastructure projects in the country.
Supporting infrastructure project through loans: RDA, KDU, and etc.
NSB Reach product.
Direct employment opportunities for 216 individuals.
As mentioned in our Chairman’s Message, we evaluate the social, economical, and ecological impressions NSB has made and take action to mitigate any negative impacts on the society and environment where we operate. We have initiated various programmes which attest to our commitment to climate action and creating sustainable communities. We promote the proliferation of clean energy through green banking initiatives and supporting island-wide projects on renewable energy. We have substantially increased the share of renewable energy in our energy mix and work towards improving energy efficiency through responsible consumption practices. Our investments on digital infrastructure and our digital product offering contribute to paperless, low-carbon output. Digitalisation of the sector will also drive innovation towards creating sustainable cities and communities.
Green lending initiatives: Official Bank for Soorya Bala
Sangramaya and NSB Eco Loan.
Number of Eco Loans granted in 2017 902.
Digital initiatives: Model Branch concept,
iSaver product, and more.
The use of renewable energy: Setting up solar power in branches.
Awareness programmes: Responsible consumption
practices, awareness programmes are
conducted to the staff. Biodegradable
promotional material, energy management,
limited the use of AC to bank hours, etc.

151
National Savings Bank Annual Report 2017
NSB is committed to improving the quality of life for all through creating a peaceful and inclusive society. As an exemplary corporate citizen, we comply with all regulatory and statuary requirements and conducts our business in a fair, transparent, and ethical manner. This culture of ethical conduct translates to our transactions and communications with suppliers and other entities. As a State-owned entity, we have nurtured strong partnerships with other Government entities, the Government, private, and international bodies. We have implemented processes such as Code of Conduct, whistle-blower policy, bribery and corruption statement, and other processes and policies to ensure ethical business practices are followed.
We recognise that as a service-oriented organisation with minimal use of physical input materials, our relative impact on the environment in terms of emissions or generating waste is quite low. But we are conscious of the need to preserve life on land and below water. Our innovative financial tools like the Eco Loan and green banking initiatives contribute towards environmental preservation. We also ensure, when constructing new buildings, to minimise the impact on the environment. Moreover, in 2017, we initiated an ambitious community tree-planting project: NSB Agroforestry, which plans to distribute a million plants by 2020. NSB distributed 25,000 plants islandwide.
NSB Agroforestry: NSB distributed 25,000 pepper plants and coconut seedlings islandwide.

152
National Savings Bank Annual Report 2017
Independent Assurance Report to National Savings Bank
We have been engaged by the Directors of National Savings Bank (“Bank”) to provide reasonable assurance and limited assurance in respect of the Sustainability Indicators as identified below for the year ended 31 December 2017. The Sustainability Indicators are included in the National Savings Bank’s Integrated Annual Report for the year ended 31 December 2017 (the “Report”).
The Reasonable Assurance Sustainability Indicators covered by our reasonable assurance engagement are:
Assured Sustainability Indicators Integrated Annual Report Page
Financial Highlights 15
The Limited Assurance Sustainability Indicators covered by our limited assurance engagement are:Limited Assurance Sustainability Indicators Integrated Annual
Report Page
Sustainability performance indicators – Non-Financial Highlights 16-18
Information provided on the following capitalsFinancial 73-84Intellectual 92-99Manufactured 100-105Human 108-121Social and Relationship 124-139Natural 142-145
Our Conclusions
Our conclusion has been formed on the basis of, and is subject to, the matters outlined in this Report. We believe that the evidence we have obtained is sufficient and appropriate to provide a basis for our conclusions.
Reasonable Assurance Sustainability Indicators
In our opinion, the Reasonable Assurance Sustainability Indicators, as defined above, for the year ended 31 December 2017 are, in all material respects, prepared and presented in accordance with the Consolidated Set of Global Reporting Initiative Sustainability Reporting Standards Guidelines.
Limited Assurance Sustainability Indicators
Based on the limited assurance procedures performed and the evidence obtained, as described below, nothing has come to our attention that causes us to believe that the Limited Assurance Sustainability Indicators, as defined above, for the year ended 31 December 2017, have not in all material respects, been prepared and presented in accordance with the Consolidated Set of Global Reporting Initiative Sustainability Reporting Standards Guidelines.
KPMG Tel : +94 - 11 542 6426(Chartered Accountants) Fax : +94 - 11 244 587232A, Sir Mohamed Macan Markar Mawatha, : +94 - 11 244 6058P. O. Box 186, : +94 - 11 254 1249Colombo 00300, Sri Lanka. Internet : www.kpmg.com/lk
M.R. Mihular FCA P.Y.S. Perera FCA C.P. Jayatilake FCAT.J.S. Rajakarier FCA W.W.J.C. Perera FCA Ms. S. Joseph FCAMs. S.M.B. Jayasekara ACA W.K.D.C Abeyrathne FCA S.T.D.L. Perera FCAG.A.U. Karunaratne FCA R.M.D.B. Rajapakse FCA Ms. B.K.D.T.N. Rodrigo FCAR.H. Rajan ACA
Principals - S.R.I. Perera FCMA(UK), LLB, Attorney-at-Law, H.S. Goonewardene ACA Ms. C.T.K.N. Perera ACA
KPMG, a Sri Lankan partnership and a member firm
of the KPMG network of independent member firms
affi l iated with KPMG International Cooperative
(“KPMG International”) , a Swiss entity.
GRI 102-56

153
National Savings Bank Annual Report 2017
Management’s Responsibility
Management is responsible for the preparation and presentation of the Reasonable Assurance Sustainability Indicators and the Limited Assurance Sustainability Indicators in accordance with the Consolidated Set of Global Reporting Initiative Sustainability Reporting Standards Guidelines.
These responsibilities includes establishing such internal controls as management determines are necessary to enable the preparation of the Reasonable Assurance Sustainability Indicators and the Limited Assurance Sustainability Indicators that are free from material misstatement whether due to fraud or error.
Management is responsible for preventing and detecting fraud and for identifying and ensuring that the Bank complies with laws and regulations applicable to its activities.
Management is also responsible for ensuring that staff involved with the preparation and presentation of the description and Report are properly trained, information systems are properly updated and that any changes in reporting encompass all significant business units.
Our Responsibility
Our responsibility is to express a reasonable assurance conclusion on the Bank’s preparation and presentation of the Reasonable Assurance Sustainability Indicators and a limited assurance conclusion on the preparation and presentation of the Limited Assurance Sustainability Indicators included in the Report, as defined above.
We conducted our assurance engagement in accordance with Sri Lanka Standard on Assurance Engagements SLSAE 3000: Assurance Engagements other than Audits or Reviews of Historical Financial Information (SLSAE 3000) issued by The Institute of Chartered Accountants of Sri Lanka.
We have complied with the independence and other ethical requirements of the Code of Ethics issued by The Institute of Chartered Accountants of Sri Lanka.
SLSAE 3000 requires that we plan and perform the engagement to obtain reasonable assurance about whether the Reasonable Assurance Sustainability Indicators are free from material misstatement and limited assurance about whether the Limited Assurance Sustainability Indicators are free from material misstatement.
Reasonable Assurance Over Reasonable Assurance Sustainability Indicators
The procedures selected in our reasonable assurance engagement depend on our judgement, including the assessment of the risks of material misstatement of the Reasonable Assurance Sustainability Indicators whether due to fraud or error.
In making those risk assessments, we have considered internal controls relevant to the preparation and presentation of the Reasonable Assurance Sustainability Indicators in order to design assurance procedures that are appropriate in the circumstances, but not for the purposes of expressing a conclusion as to the effectiveness of the Bank’s internal controls over the preparation and presentation of the Report.
Our engagement also included assessing the appropriateness of the Reasonable Assurance Sustainability Indicators, the suitability of the criteria, being the Consolidated Set of Global Reporting Initiative Sustainability Reporting Standards Guidelines, used by the Bank in preparing and presenting the Reasonable Assurance Sustainability Indicators within the Report, obtaining an understanding of the compilation of the financial and non-financial information to the sources from which it was obtained, evaluating the reasonableness of estimates made by the Bank, and re-computation of the calculations of the Reasonable Assurance Sustainability Indicators.

154
National Savings Bank Annual Report 2017
Limited Assurance on the Assured Sustainability Indicators
Our limited assurance engagement on the Limited Assurance Sustainability Indicators consisted of making enquiries, primarily of persons responsible for the preparation of the Limited Assurance Sustainability Indicators, and applying analytical and other procedures, as appropriate. These procedures included:
interviews with senior management and relevant staff at corporate and selected site level concerning sustainability strategy and policies for material issues, and the implementation of these across the business;
enquiries of management to gain an understanding of the Bank’s processes for determining material issues for the Banks’s key stakeholder groups;
enquiries of relevant staff at corporate and selected site level responsible for the preparation of the Limited Assurance Sustainability Indicators;
enquiries about the design and implementation of the systems and methods used to collect and report the Limited Assurance Sustainability Indicators, including the aggregation of the reported information;
comparing the Limited Assurance Sustainability Indicators to relevant underlying sources on a sample basis to determine whether all the relevant information has been appropriately included in the Report;
reading the Limited Assurance Sustainability Indicators presented in the Report to determine whether they are in line with our overall knowledge of, and experience with, the sustainability performance of the Bank;
reading the remainder of the Report to determine whether there are any material misstatements of fact or material inconsistencies based on our understanding obtained as part of our assurance engagement.
The procedures performed in a limited assurance engagement vary in nature and timing from, and are less in extent than for, a reasonable assurance engagement, and consequently the level of assurance obtained in a limited assurance engagement is substantially lower than the assurance that would have been obtained had a reasonable assurance engagement been performed. Accordingly, we do not express a reasonable assurance conclusion on the Limited Assurance Sustainability Indicators.
Purpose of Our Report
In accordance with the terms of our engagement, this assurance report has been prepared for the Bank for the purpose of assisting the Directors in determining whether the Bank’s Reasonable and Limited Assurance Sustainability Indicators are prepared and presented in accordance with the Consolidated Set of Global Reporting Initiative Sustainability Reporting Standards Guidelines and for no other purpose or in any other context.
Restriction of Use of Our Report
Our report should not be regarded as suitable to be used or relied on by any party wishing to acquire rights against us other than the Bank, for any purpose or in any other context. Any party other than the Bank who obtains access to our report or a copy thereof and chooses to rely on our report (or any part thereof) will do so at its own risk. To the fullest extent permitted by law, we accept or assume no responsibility and deny any liability to any party other than the Bank for our work, for this independent assurance report, or for the conclusions we have reached.
Chartered AccountantsColombo
14 April 2018

Governance

156
National Savings Bank Annual Report 2017
Board of Directors
Mr Aswin De SilvaChairman
Mr Aswin De Silva’s diverse banking experience expanding well over a 16 years, includes several senior managerial positions
including been Director/Corporate Banking at American Express in Sri Lanka and Singapore. These include areas of Finance, Credit,
Corporate Finance Advisory and Corporate Banking.
He also worked as the Country Manager at Amex Travel Related Services, in Sri Lanka and the Maldives.
Mr De Silva is also the recipient of the prestigious Chairman’s award for quality at Amex. Mr De Silva has also served at
Associated Motorways Company as the Group Finance Director for four years and as GM/CEO at Ceylinco Savings Bank. Immediately preceding his appointment at NSB on 9 February 2015, he served as the General Manager of Business Intelligence at NRMA Group
in Sydney, Australia over a considerable period of time.
He also serves as the Chairman of NSB Fund Management Company, a fully-owned subsidiary.
He is a Fellow of The Institute of Chartered Accountants of Sri Lanka (FCA) – having worked at KPMG Sri Lanka,
Fellow of the Chartered Institute of Management Accountants, UK (FCMA) and fellow of the CPA FCPA (Australia).
Mr D L P R AbeyaratneDirector
Mr Abeyaratne, Sri Lanka Administrative Service – Special Grade, holds a Bachelor of Commerce (Special) Degree (1991) University
of Kelaniya, Master of Arts – Sociology (2010) University of Kelaniya, Master's Degree (M. Com).
Mr Abeyaratne is the Postmaster General of Sri Lanka since 2 December 2012. He brings to the Board, 22 years of experience
serving in the Sri Lanka Administrative Service. He held the position of Divisional Secretary, Minuwangoda from 2005-2008;
Director General of the National Gem and Jewellery Authority from 2009-2010, Senior Assistant Secretary, Ministry of Tourism, Senior
Assistant Secretary to the Ministry of Economic Development in 2010 and Social/Gender and Resettlement Specialist of Conflict
Affected Region Emergency Project (ADB).
He is also a visiting lecturer at the Institute of Human Resources Advancement, University of Colombo. He is a member of the Board of Directors of the Sri Lanka Social Security Board. He also serves
as an external member of the Advisory Committee of Department of Commerce and Financial Management, University of Kelaniya
He was appointed to the Board of Directors of NSB on 9 February 2012. He served as Acting Chairman of NSB during the period from
23 May 2012 to 5 August 2012.
He also serves on the Board of NSB Fund Management Company Limited.

157
National Savings Bank Annual Report 2017
Mr A K SeneviratneDirector
Ananda Kithsiri Seneviratne is a special grade officer of the Sri Lanka Administrative Service (SLAS). Since January 2018
Mr Seneviratne has been working as the Director General of the Department of National Budget of the Ministry of Finance and
Mass Media, Sri Lanka.
Mr Seneviratne holds a Honours Bachelors Degree specialising in Chemistry from University of Kelaniya. He has obtained a
Postgraduate Diploma in Business and Financial Administration from The Institute of Chartered Accountants of Sri Lanka and
Masters in Business Administration from the University of Colombo.
He joined the Sri Lanka Administrative Service in 1995. Upon completion of his in-service training year he was appointed as an
Assistant Director to the Department of Fiscal Policy of the Ministry of Finance in 1996. In 2006 he was assigned to the Department of
National Budget of the same Ministry as a Director. In 2015 he was appointed to Director General of the Department of Fiscal Policy. He worked there until has assumed duties of Director General of
Department of National Budget in 2018.
Presently, he serves as a Board of Director of the State Pharmaceuticals Corporation (SPC), Ceylon Shipping
Corporation Ltd., and De La Rue Lanka Currency and Security Print (Private) Limited.
Mr Suranga NaullageDirector
Mr Naullage was appointed to the NSB Board on 9 February 2015. He is a retired Bank Executive with 36 years
of experience in Banking Services.
He holds a B. Com Special Degree from the University of Kelaniya and a Certificate in Banking and Finance from the Institute of
Bankers of Sri Lanka.
He is a former Assistant Secretary on Industrial Relations, Ministry of Finance and a former member of the
National Labour Advisory Council. Mr Naullage has served in the capacity of a Director at the National Institute of
Labour Studies and Jobs Nets Limited.
He also serves as a Director of the NSB Fund Management Company Limited and as a Member of National Salaries and
Cadre Commission.

158
National Savings Bank Annual Report 2017
Mr Ajith PathiranaDirector
Mr Ajith Pathirana has served as the Secretary of the Bar Association of Sri Lanka (BASL). He had been a senior
Committee Member of BASL and held Chairmanship on many committees of the BASL.
Mr Pathirana is an Attorney-at-Law who possesses experience of more than 27 years. He is also an Unofficial Magistrate,
a Justice of Peace, and a practitioner in Criminal Law and has appeared in many prominent cases in courts
throughout the country.
Mr Pathirana was appointed to the Board on 20 March 2015.
He also serves as a Director of the NSB Fund Management Company Limited.
Mr Chandima HemachandraDirector
Mr Hemachandra was appointed to the Board on 2 November 2015. He holds a BSc. in Mathematics for Business – Mathematics and Computer Science from Middlesex University, UK. He is a Fellow of British Computer Society (FBCS). A Member of the Australian Computer Society (MACS) and
Member of the Association of Professional Bankers (APB).
He is the Chief Technology Officer at Scicom (MSC), Berhad, Malaysia, since 2011. He is an information technology professional with over
twenty-six (26) years of experience, broad-based knowledge and skills in implementing large-scale and highly technologically complex projects in
major financial institutions in UK, Malaysia, Sri Lanka and Kenya.
Prior to joining Scicom, he worked as the Chief Officer (CO) at the Government-owned Sri Lanka Insurance Corporation (SLIC), the oldest and
one of the largest insurance service providers in Sri Lanka.
He brings to the table, a sound knowledge of information and communication technology and software development skills and a highly
successful background in managing large and complex ICT projects. He has provided consultancy services to many Government/Private
institutions and has been serving as an Advisor to three National Advisory Councils in Sri Lanka.
In his early years, he worked as a System Analyst with British Hartford – Fairmount Engineering, UK. Thereafter, he held the positions of Chief Manager – ICT at Commercial Bank of Ceylon PLC, the Head of ICT and Banking Operations (Deputy General Manager/CIO) at Hatton
National Bank PLC in Sri Lanka and the Head of ICT (CIO) at CfC Stanbic Bank, Kenya, the East African Headquarters of Standard Bank Group.

159
National Savings Bank Annual Report 2017
Mr Anil RajakarunaDirector
Appointed to the NSB Board on 2 November 2015. Mr Rajakaruna holds First in Laws (LLB, Part 1) from the University
of Colombo. He is an Attorney-at-Law with 22 years experience. He holds a Diploma in External Affairs from the Bandaranayake Centre
for International Studies.
This is the 2nd term of Directorship with NSB as he was the Working Director of the Bank during 2002-2004 period.
Ms Anupama MuhandiramSecretary to the Board
Ms Anupama Muhandiram, an Attorney-at-Law holds Master of Laws Degree (LL.M) from Cardiff Metropolitan University of UK, Masters in Business Administration (MBA) Degree from Manipal University and Post Attorney Diploma in Banking and Insurance
Law from the Incorporated Council of Legal Education of Sri Lanka.
Prior to her appointment as the Secretary to the Board of Directors of National Savings Bank on 6 December 2016, she has served as
Assistant Secretary to the Board of Directors from November 2015 to December 2016. She has served as the Company Secretary of NSB Fund Management Company Limited from 2015 to 2017.
Out of 22 years experience in Banking and Finance sector, she had served more than 18 years at People’s Bank as a Legal Officer and
an Assistant Secretary to the Board of Directors.
Ms Muhandiram is also a visiting lecturer (Commercial Law) at the University of Sabaragamuwa, and she is the Founder Secretary of
Association of Board/Company Secretaries of Banks Sri Lanka.
Mr S D N PereraGeneral Manager/CEO
Mr S D N Perera was appointed as the 16th General Manager/CEO of National Savings Bank w.e.f. 12 March 2015. Prior to his
appointment, he has been serving as the Acting General Manager/CEO and he has been serving the Bank covering all functional areas
in his career for nearly three decades.
Mr Perera is a holder of a B.Com. Special Degree and a Diploma in Bank Management. He is also a Certified Information Systems
Auditor (CISA) of USA.
He is a Director of NSB Fund Management Company Limited.
Mr Perera was a Director of “Rajarata Sanwardana Bank” and ‘Regional Development Bank’ for over 10 years.

160
National Savings Bank Annual Report 2017
Mr S D N PereraGeneral Manager/CEO
Mr Jagath GamanayakeSenior Deputy General Manager
Mr K RaveendranDGM (Research and
Development)
Mr M P A W Peiris DGM (Operations)
Mr A C GamageDGM (Retail Credit)
Ms G V A D D Silva
DGM (Treasury)
Mr M Kiritharan Consultant (Legal)
Mr P A LionelConsultant (Treasury)(Up to 2 January 2018)
Corporate Management

161
National Savings Bank Annual Report 2017
Mr K B Wijeyaratne
DGM (Finance and Planning)
Ms C S JesudianDGM (Credit)
Ms B P J Gunasekera
DGM (International)
Mr P A Abeysooriya
DGM (IT)
Mr K K V V L W Karunathilake
DGM (Marketing)
Mr G W E Jayaweera
DGM (Audit) w.e.f. 1 January 2018

162
National Savings Bank Annual Report 2017
Mr P S WasanthathilakaAGM IT – (Planning and
Supporting)(Retired w.e.f. 12 February 2018)
Ms K P D M De Silva
AGM (Operations)
Ms H R SilvaAGM (Operations)
(Retired w.e.f. 20 February 2018)
Mr K M W M KarunaratneAGM (Engineering)
Mr M T A J F GomisAGM (Operations)
Ms M A GomesAGM (Planning)
Ms M N A FernandoAGM (HRD)
Mr J H T ChandraratneAGM (Engineering)
Executive Management

163
National Savings Bank Annual Report 2017
Chief Managers
Regional Managers
1
A L A HaleemRegional Manager – Eastern
2
Ms H M S L FernandoRegional Manager – Western I
3
Ms D D Wickramasinghe Acting Regional Manager –Southern
4
K KamalanathanActing Regional Manager – North Western
5
Ms H R KarunamuniActing Regional Manager –Western II
6
Ms V M S SandalathaActing Regional Manager –Central
7
U WattuhewaActing Regional Manager –Sabaragamuwa
8
N Baheerathan Acting Regional Manager –Northern
Branch Management
9
Ms W P U A de Silva Chief Manager – Branch Management
10
W M R B WeerakoonChief Manager – Branch Management
Branch Operations
11
Ms R A N N WijesingheChief Manager – Homagama Branch
12
Ms A J De MelChief Manager – Panadura Branch
13
Ms A M C AttanayakeChief Manager – Kandy Branch
14
A H ChandradasaChief Manager – Gampaha Branch
15
Ms C N EkanayakeChief Manager – City Branch
16
M M M MansoorChief Manager – Kalmunai Branch(Retired w.e.f. 22 March 2018)
17
U MunasingheChief Manager – Battaramulla Branch
18
D C OlaboduwaChief Manager – Kiribathgoda Branch
19
M N C PereraChief Manager – Chilaw Branch
20
P M Thilakarathna BandaraChief Manager – Badulla Branch
21
W A K Wijeratne Chief Manager – Matara Branch
22
S B SurangaChief Manager – Galle Branch
Audit and Vigilance
23
P A Perera Chief Manager – Audit and Vigilance
Card Centre
24
K D K K WijeyawardaneChief Manager – Card Centre
Corporate Credit/Retail Credit
25
P T A PereraChief Manager – Credit
26
Ms K G DamayanthiChief Manager – Credit(Retired w.e.f. 28 February 2018)
27
A B C R WijayapalaChief Manager – Pawning
28
Ms R C SamarasingheChief Manager – Credit

164
National Savings Bank Annual Report 2017
Finance and Planning
29
Ms S S J P S de SilvaChief Manager – Finance
30
H S P RanaweeraChief Manager – Finance
Human Resource Development
31
K S WeerasenaChief Manager – Training
32
K A P PereraChief Manager – Personnel (Retired w.e.f. 26 January 2018)
Information Technology
33
G M S P FernandoChief Manager – IT
34
M C RajapaksheChief Manager – IT 35
A K L IllesingheChief Manager – Network andCommunication
36
L C SenanayakeChief Manager – Hardware
37
A P R de ZoysaChief Manager – IS Security
International Banking
38
M V G Susil KumaraChief Manager – International Banking
Treasury
39
H M G P J Herath Chief Manager – Treasury
40
Ms S W A WeerasingheChief Manager – Treasury
Compliance, Legal, and Risk
41
Ms I K L Sasi MahendrenChief Manager –Compliance
42
Ms R P A M P RajanayakeChief Manager – Risk Management
43
Ms M A P MuhandiramSecretary to the Board of Directors
Research and Development
44
M W K C de SilvaChief Manager – Research and Development
Support Services
45
Ms C W PathiranaChief Manager – Supplies
46
K T S S Gunawardena Chief Manager – Security
47
D M C P B Dissanayake Chief Manager – General Manager's Division
48
D L P AbayasingheChief Manager – NSB Fund Management Company Limited
49
K A R Gunathilake Chief Manager – Welfare
165
National Savings Bank Annual Report 2017
Corporate Governance
Corporate governance is the process of rules under which an institution is managed on behalf of shareholders and other stakeholders. Through the framework the Bank is
developed, operated, regulated and controlled. Banks and other financial institutions are charged with upholding the public trust and protecting depositors. Corporate governance
complements the traditional supervision of financial institutions, protects the interests of the depositors and enhances the confidence in the public on the financial institution
while contributing to the integrity and credibility.
The Board of Directors (the “Board”) of National Savings Bank (“NSB”) believes that corporate governance is a vital tool which enhances its influence, efficiency and
independence while providing a sound basis for the Bank’s operations and maintaining a healthy relationship with customers, employees, shareholders and all other stakeholders.
As part of the Bank’s vision to be the most reliable and sought-after choice for savings and investment solutions, NSB sets itself high standards in corporate governance. NSB believes corporate governance should stem from the corporate culture and values of the
Bank and not restricted to written laws and standards.

166
National Savings Bank Annual Report 2017
Governance at NSBNSB is built on basic, yet vitally important founding qualities and attributes such as honesty, fair play, morals and ethics, legal/regulatory compliance, transparency and optimal proficiencies.
In carrying out its activities, NSB places the value of corporate governance at its highest priority starting from the Board of Directors and Senior Management down to all operational levels staff members. The Board of Directors and all staff members at NSB are committed to the highest business integrity and ethical values and are dedicated to fully-complying with the best Corporate Governance Practices spelt in the NSB Act, Banking Act, Finance Act, Financial Reporting Act, Prevention of Money Laundering Act, Foreign Exchange Act, and other Regulations issued by the Government of Sri Lanka and Directions of Central Bank of Sri Lanka (CBSL) along with best business practices. The guidelines and their amendments/updates issued by the CBSL from time to time are well followed by NSB for its effective governance.
The Bank publishes its quarterly and annual Financial Statements in the news papers and tables its Financial Statements annually in the Parliament. Also in complying with Banking Act the Financial Statements are placed in every branch. This ensures that the public interest in the Bank’s affairs is secured. Financial Statements are audited by the Auditor General’s Department and in addition to that selected branches are audited by firms of Chartered Accountants. This increases the transparency and reliability of the Bank’s policies and processes in discharging its accountability.
Governance framework at NSB is based on the following principles:
Assuming responsibility and accountability in respect of the management of affairs of NSB at all levels.
Ensuring the oversight of specific responsibilities assigned to the Board through Board appointed Subcommittees.
Determining the best structures of Management for the Bank to achieve its business objectives.
Striking a balance between business and the true spirit of “National Savings” and delegating Key Management Personnel appropriately.
Evaluating business activities and prudent risk management policies of the Bank to create a safe and sound environment.
Infusing and accommodating new ideas and maintaining cordial relationships at Board and Senior Management levels.
Having an active role in discussing with relevant regulatory bodies on the implementation and complying with governance regulations.
Overseeing internal control systems including internal audit, compliance and risk management functions independent of the business lines.
Adhering of all requirements of the NSB Act, laws and directions of Regulators.
Keeping social responsibility in mind when carrying out its core activities.
The Compliance Division of the Bank is committed to ensure that the Bank adheres to all provisions and guidelines applicable to the Bank. The Division is duly updated of the changing compliance environment and follows up with relevant divisions/branches in the Bank to ensure that the new directions are properly communicated among relevant staff members. The Division also conducts compliance assessments in branches and divisions. The Compliance Division follows up to ensure that the Bank’s Financial Statements are duly audited by the Auditor General and tabled at the Parliament as well as published in the media within the stipulated time frame to ensure transparency and reliability. Further, to ensure independence of the compliance function, the Division is subject to independent audits viz., Annual Government Audit and the Internal Audit. As a glance at the year 2017 Compliance Division has procured Anti-Money Laundering (AML) system and initiated implementation. Awareness on compliance was given priority and introducing of branch level training was carried out to achieve high level of awareness and a vast number of staff had been trained by the Compliance Division on General Compliance, AML and applicable laws and regulations. As for the year 2017 Compliance Division had executed its Action Plan targeting a successful compliance culture. In terms of Related Party Transaction (RPT) information, Compliance Division along with IT Division has introduced a new information capturing mechanism to obtain Directors and KMP RPT information. RPT reporting has been more effective under the introduced system and the year 2017 had been a target achieving year for the Compliance Division.
The banks have established six Board Committees as set out in the Direction 3(6) which shall directly report to the Board. These Subcommittees namely Board Audit Committee (BAC), Board Human Resources and Remuneration Committee (BHRRC), Board Nomination Committee (BNC), Board Integrated Risk Management Committee (BIRMC), Board Credit Committee (BCC), and Board IT Strategy Committee (BITSC) are given the

167
National Savings Bank Annual Report 2017
authority to make recommendations to the Board on matters under their purview. The Board Audit Committee (BAC) and Board Integrated Risk Management Committee (BIRMC) assist the Board to review and make decisions on the adequacy and integrity of internal controls, review of financial information and their integrity, principal risk elements of the industry and precise risk factors and Corporate Governance of the Bank. The Board has also retained the critical areas of operations under its purview without delegating to the operational level as per Corporate Governance practices. The authority and responsibilities of the Chairman and the Chief Executive Officer are separate as per the CBSL Directions.
The Corporate Governance organisational chart GRI 102-18
The Board of Directors of NSB who oversees and assumes overall responsibilities and accountability of the Bank by setting high level strategic directions, overseeing the risk management function etc has delegated the implementation of strategies to the CEO who exercises executive authority through the corporate management team which he heads and to which he provides leadership and direction.
Governance structure
Board Subcommittees
Management Committees
Corporate Management
General Manager/CEO
Board of Directors
Board Audit Committee
Board Integrated Risk Management
Committee
Board Nomination Committee
Board Credit Committee
Board Information Technology Strategy
Committee
Board Human Resource and Remuneration
Committee
Internal Audit
Compliance
Risk Management
Branch Management
Marketing
Finance and Planning
Human Resource
Legal
Administrative Divisions
Treasury
International Banking
Retail and Corporate Credit
Information Technology
CMC
ALCO
CC
IC
PRC
BOSC
EC
IT SC
TNIC
MKTC
ORMC
PDC
HRC
CPC Major
CPC Minor
Corporate Management Committee – CMCAsset Liability Management Committee – ALCOInvestment Committee – IC
Credit Committee – CCPerformance Review Committee – PRCBranch Operational Steering Committee – BOSC
IT Steering Committee – IT SCMarketing Committee – MKTC
Operational Risk Management Committee – ORMCProduct Development Committee – PDCHuman Resource Committee – HRC
Corporate Procurement Management Committee - Major
– CPC-Major
Corporate Procurement Committee - Minor – CPC-MinorTender and New Investment Committee – TNIC
Equity Committee – EC

168
National Savings Bank Annual Report 2017
Attendance of the Board members for Board meetings during the Year 2017
Name of Director Present Directors
Date Appointment Eligible to Attend Attended
Mr Aswin De Silva – Chairman Appointed w.e.f. 9 February 2015 16 16
Mr D L P R Abeyaratne – Ex Officio Director Appointed w.e.f. 9 February 2012 16 14
Mr Suranga Naullage – Director Appointed w.e.f. 9 February 2015 16 16
Mr Ajith Pathirana – Director Appointed w.e.f. 20 March 2015 16 14
Mr A K Seneviratne – Ex Officio Director Appointed w.e.f. 27 May 2015 16 14
Mr Chandima Hemachandra – Director Appointed w.e.f. 2 November 2015 16 13
Mr Anil Rajakaruna – Director Appointed w.e.f. 2 November 2015 16 16
Scope, functions and attendance during the year 2017 are given below for the Board appointed Subcommittees in accordance with the Banking Act Direction No. 12 of 2007.
1. Board Audit Committee (BAC)
The scope of the BAC is principally to assist the Board of Directors in fulfilling its oversight responsibilities which are to: maintain the integrity of the Bank’s Financial Statements; review financial information of the Bank in its Annual Report, accounts and quarterly reports prepared for disclosure, and to review significant financial reporting judgements contained in them.
The BAC comprises three Non-Executive Directors, who conduct Committee proceedings in accordance with the rules stipulated in 3 (6) (ii) under the Direction No. 12 of 2007 on Corporate Governance for Licensed Specialised Banks, Board approved Audit Charter and connected Board decisions. The Board Secretary functions as the Secretary to the BAC. The Board of Directors of the National Savings Bank which consists of seven Directors and being constituted under the provisions of Section 8 (1) its sub section of NSB Act No. 28 of 1995 and members for all the Subcommittees including the BAC members are being appointed out of the said seven (7) members who possess necessary qualifications, skills and experience to serve BAC. The Committee functioned within the Terms of Reference stipulated in the BAC Charter. In terms of the Charter, the scope of the Committee was to assist the Board of Directors in fulfilling its oversight
responsibilities for: (a) The integrity of the Bank’s Financial Statements; (b) The effectiveness of the Bank’s risk management function; (c) The performance of the Bank’s external audit function; and (d) The performance of the Bank’s internal audit function.
The Committee also assists the Board in assessing the risk management system of the Bank thus ensuring that the Bank has a comprehensive policy on risk management; and monitoring the effectiveness of the Bank’s risk management system.
It would also assess the Bank’s compliance with legal and regulatory requirements by reviewing the effectiveness of the system of monitoring compliance with laws and regulations and the results of Management’s investigation and follow-up of any instances of non-compliance.
The BAC Report is given on page 190 to page 192.

169
National Savings Bank Annual Report 2017
2. Board Human Resources and Remuneration Committee (BHRRC)
The Committee sets goals and targets for the Directors, CEO and the Key Management Personnel and evaluates the performance of same against the set targets and goals periodically and determines the basis for revising remuneration, benefits and other payments of performance-based incentives. Developing and reviewing HR development strategies on behalf of the Bank and maintaining a consultative role with the other Board Subcommittees and operational committees on all human resource issues, including matters relating to all staff, are among the primary responsibilities vested in the BHRRC.
The General Manager/CEO provides information to the Committee and attends all meetings of the Committee except when matters relating to the General Manager/CEO are being discussed. The Secretary to the Board functions as the Secretary to BHRRC. The Committee is responsible for determining the remuneration policy relating to the General Manager/CEO and Key Management Personnel of the Bank other than the remunerations determined by the Collective Agreement.
The Committee reviews all significant Human Resource Policies, initiatives, salary structures and terms and conditions relating to staff at senior executive level. In this process, necessary information and recommendations are obtained from the General Manager/CEO and the Senior Management of the Bank. The Committee meetings are held quarterly however based on the needs, meetings are fixed accordingly, and ten meetings had been held during the year 2017.
The BHRRC Report is given on page 193 to page 194.
3. Board Nomination Committee (BNC)
The BNC reports to the Board in respect of its activities and decisions. Secretary to the Board of Directors, functions as the Secretary to the BNC also.
The BNC is responsible for implementing a procedure to select/appoint General Manager/CEO and Key Management Personnel, setting out criteria such as qualifications, experience and key attributes required for eligibility to be considered for appointment or promotion to the post of General Manager/CEO and the Key Management Positions. BNC is also responsible for providing general oversight of policies and processes that ensure the Bank’s compliance with appointments and nominations required by
regulators in addition to monitoring, evaluating and making decisions on behalf of the Board with respect to policies and strategic matters related to nominating staff members.
The BNC Report is given on page 195.
4. Board Integrated Risk Management Committee (BIRMC)
BIRMC assesses all risks, i.e. credit, market, liquidity, operational, and strategic to the Bank through appropriate risk indicators and management information.
The Board of Directors of the Bank has established the BIRMC in compliance with the Banking Act Direction No. 12 of 2007, corporate governance for licensed specialised banks in Sri Lanka. BIRMC comprised three Non-Executive Directors, and General Manager/CEO and the Head of Risk Management who looks after the Board risk categories. The Secretary to the Board of Directors functions as the Secretary to the Committee.
The Committee reviews policies, reports and proposals on risk and compliance related to the Bank. BIRMC grants approval for proposals within its mandate and recommends proposals/reports to the Board of Directors which required to be scrutinised by the Board.
The BIRMC reviews the adequacy and effectiveness of all management level committees such as the Credit Committee and the Asset-Liability Committee to address specific risks and to manage those risks within quantitative and qualitative risk limits as specified by the Committee. The Committee is to take prompt corrective action to mitigate the effects of specific risks in the case such risks are at levels beyond the prudent levels decided by the Committee on the basis of the Bank’s policies and regulatory and supervisory requirements.
BIRMC ensures submission of a risk assessment report to the Board seeking the Board’s views, concurrence and/or specific directions on a regular basis. The Committee has established an independent compliance function to assess the Bank’s compliance with laws, regulations, regulatory guidelines, internal controls and approved policies on all areas of business operations. A dedicated compliance officer is selected from Key Management Personnel to carry out the compliance function and report to the Committee periodically.
The BIRMC Report is given on page 196 to page 197.

170
National Savings Bank Annual Report 2017
5. Board Credit Committee (BCC)
BCC is a subcommittee of the Board, which is responsible in conducting periodic reviews on the Credit Policy and the Investment Policy of the Bank and engage in approving of credit facilities and investment within the delegated limits of the Committee. BCC is consisted of three Directors appointed by the Board. The General Manager/CEO and Deputy General Managers in the credit line should attend the meeting on invitation and other senior officers to be presented at the BCC meetings when required.
BCC is empowered to: Approve and oversee the Bank’s strategic objectives with respect to Credit and Investments including Policies, Procedures and other related policy level documents.
Recommend delegated authority levels to the Board. Approval of Credit and Investment Proposals recommended by the Credit Committee and the Investment Committee within the delegated authority limits.
Recommend Credit and Investment Proposals above the delegated authority limit to the Board for approval/consideration.
Recommend/forward new asset products and procedures to the Board for approval/consideration.
Approve/advice on the pricing of Loans and Advances and Investments in consultation with/as recommended by Asset and Liability Management Committee.
Guide/advice Credit Committee/Investment Committee on all matters such as credit administration, credit recovery, foreclosure actions, sale of vested properties etc.
Monitor Loans and Advances and Investment portfolios against the limits and parameters set by the Board and regulatory authorities in line with accepted standards.
Ensure implementation of appropriate systems to manage risks and strengthen internal controls and management information systems with respect to credit aspect of the Bank.
Minutes of the meeting shall be submitted to the meeting of the Board of Directors for adoption.
The BCC report is given on page 198 to page 199.
6. Board Information Technology Strategy Committee (BITSC)
The BITSC is authorised by the Board to conduct any activity covering the entire IT Framework of the Bank, compliance with the Board approved charter and the NSB Act No. 30 of 1971 as amended and the Regulatory Framework prescribed by the Central Bank of Sri Lanka.
Membership of the BITSC shall comprise three Directors appointed by the Board. The Board Secretary functions as the Secretary to the Committee. General Manager/CEO, Deputy General Managers, who oversees the scope of IT attends every meeting on invitation.
BITSC is empowered to: Approve and oversee the Bank’s strategy objectives with respect to Information and Communication Technology (ICT), approve and review of IT strategy and policy documents, coordination with other Board Subcommittees as and when required, approve and manage new Technology Implementations within Bank’s approved strategy.
In order to meet the responsibilities, the BITSC shall delegate authority to Information Technology Steering Committee (ITSC).
The Committee meetings are held once in every two months or as required. The quorum of the Committee is two members.
The BITSC report is given on page 200.
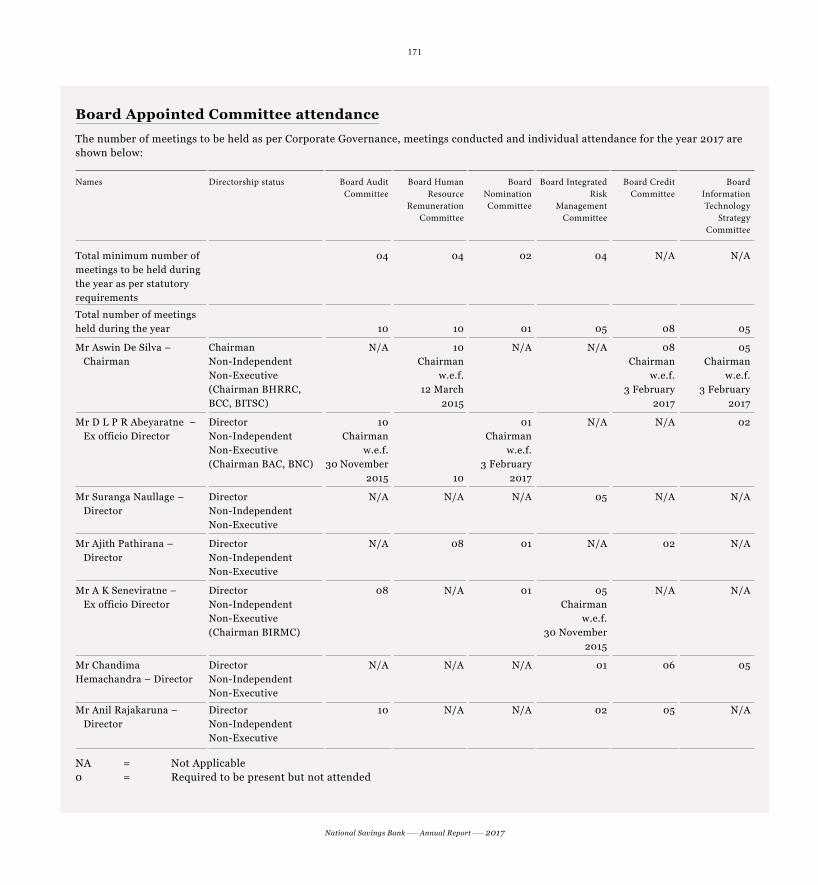
171
National Savings Bank Annual Report 2017
Board Appointed Committee attendance
The number of meetings to be held as per Corporate Governance, meetings conducted and individual attendance for the year 2017 are shown below:
Names Directorship status Board Audit Committee
Board Human Resource
Remuneration Committee
Board Nomination Committee
Board IntegratedRisk
Management Committee
Board Credit Committee
Board Information Technology
Strategy Committee
Total minimum number of meetings to be held during the year as per statutory requirements
04 04 02 04 N/A N/A
Total number of meetings held during the year 10 10 01 05 08 05
Mr Aswin De Silva – Chairman
ChairmanNon-Independent Non-Executive(Chairman BHRRC, BCC, BITSC)
N/A 10Chairman
w.e.f. 12 March
2015
N/A N/A 08Chairman
w.e.f. 3 February
2017
05Chairman
w.e.f. 3 February
2017
Mr D L P R Abeyaratne – Ex officio Director
DirectorNon-IndependentNon-Executive(Chairman BAC, BNC)
10Chairman
w.e.f. 30 November
2015 10
01Chairman
w.e.f. 3 February
2017
N/A N/A 02
Mr Suranga Naullage – Director
Director Non-Independent Non-Executive
N/A N/A N/A 05 N/A N/A
Mr Ajith Pathirana – Director
Director Non-Independent Non-Executive
N/A 08 01 N/A 02 N/A
Mr A K Seneviratne – Ex officio Director
DirectorNon-IndependentNon-Executive(Chairman BIRMC)
08 N/A 01 05Chairman
w.e.f. 30 November
2015
N/A N/A
Mr Chandima Hemachandra – Director
DirectorNon-IndependentNon-Executive
N/A N/A N/A 01 06 05
Mr Anil Rajakaruna – Director
DirectorNon-IndependentNon-Executive
10 N/A N/A 02 05 N/A
NA = Not Applicable0 = Required to be present but not attended

172
National Savings Bank Annual Report 2017
Compliance at NSB
Annual Corporate Governance Report to be published in terms of the Banking Act Direction No. 12 of 2007 and subsequent amendments thereto in the Annual Report 2017.
The Bank's adherence to the above Direction is set out as follows:
Section Principle Level of compliance in 2017
3 (1) The responsibilities of the Board
3 (1) (i) The Board shall strengthen the safety and soundness of the Bank, by ensuring the following:
3 (1) (i) (a) Approve and oversee the Bank’s strategic objectives and corporate values and ensure that these are communicated throughout the Bank.
Complied with.
The Bank’s strategic objectives and corporate values are determined by the Board as stated on page 63. These are incorporated in the Board approved Strategic Business Plan for the period of 2017-2019 and communicated to all levels of employees.
3 (1) (i) (b) Approve the overall business strategy of the Bank, the overall risk policy and risk management procedures and mechanisms with measurable goals, for at least the next three years.
Complied with.
The Board-approved three-year Strategic Business Plan (2017-2019) is being implemented, which covers business strategy, directions and measurable goals. Strategic Business Plan is a rolling plan that is updated and reviewed annually. Strategic Business Plan (2018-2020) was approved by the Board in 2017.
3 (1) (i) (c) Identify the principal risks and ensure implementation of appropriate systems to manage the risks prudently.
Complied with.
The BIRMC is entrusted with approving the Bank’s risk policy, identifying principal risks, governance structures and implementing systems to measure, monitor and manage the principal risks.
The following reports provide an insight in this regard:
Risk Management Report on pages 201 to 238.
Board Integrated Risk Management Committee Report on pages 196 to 197.
3 (1) (i) (d) Approve implementation of a policy of communication with all stakeholders, including depositors, borrowers, creditors, shareholders.
Complied with.

173
National Savings Bank Annual Report 2017
Section Principle Level of compliance in 2017
3 (1) (i) (e) Review the adequacy and the integrity of the Bank’s internal control systems and management information systems.
Complied with.
3 (1) (i) (f) Identify and designate Key Management Personnel, as defined in the International Accounting Standards.
Complied with.
3 (1) (i) (g) Define the areas of authority and key responsibilities for Directors themselves and for Key Management Personnel (KMP).
Complied with.
Board Human Resources and Remuneration Committee has defined the areas of authority and key responsibilities for the Key Management Personnel. Areas of authority of the Board of Directors are governed by Section 7 of NSB Act.
3 (1) (i) (h) Ensure that there is appropriate oversight of the affairs of the Bank by Key Management Personnel (KMP) that is consistent with Board policy.
Complied with.
3 (1) (i) (i) Periodically assess the effectiveness of the Board of Directors’ own governance practices, including: the selection, nomination and election of Directors and Key Management Personnel; the management of conflicts of interest; and the determination of weaknesses and implementation of changes, where necessary.
Complied with.
The Directors are appointed by the Minister in terms of Section 8 of NSB Act No. 30 of 1971 as amended by Act No. 28 of 1995. Annual declarations of the Board of Directors in respect of related parties and their interests are obtained from Directors to monitor conflict, if any. Related Party Transaction Policy is in place to manage conflicts of interest.
3 (1) (i) (j) Ensure that the Bank has an appropriate succession plan for Key Management Personnel.
Complied with.
3 (1) (i) (k) Meet regularly, on a need basis, with the Key Management Personnel to review policies, establish communication lines and monitor progress towards corporate objectives.
Complied with.
KMPs are regularly involved in discussions at the meetings of the Board and its Subcommittees on progress towards performance, strategy, policy and other matters pertaining to their areas of responsibility.
3 (1) (i) (l) Understand the regulatory environment and ensure that the Bank maintains an effective relationship with regulators.
Complied with.
3 (1) (i) (m) Exercise due diligence in the hiring and oversight of External Auditors.
Complied with.
As per Section 37 in NSB Act the Auditor General is appointed as the External Auditor to the Bank.
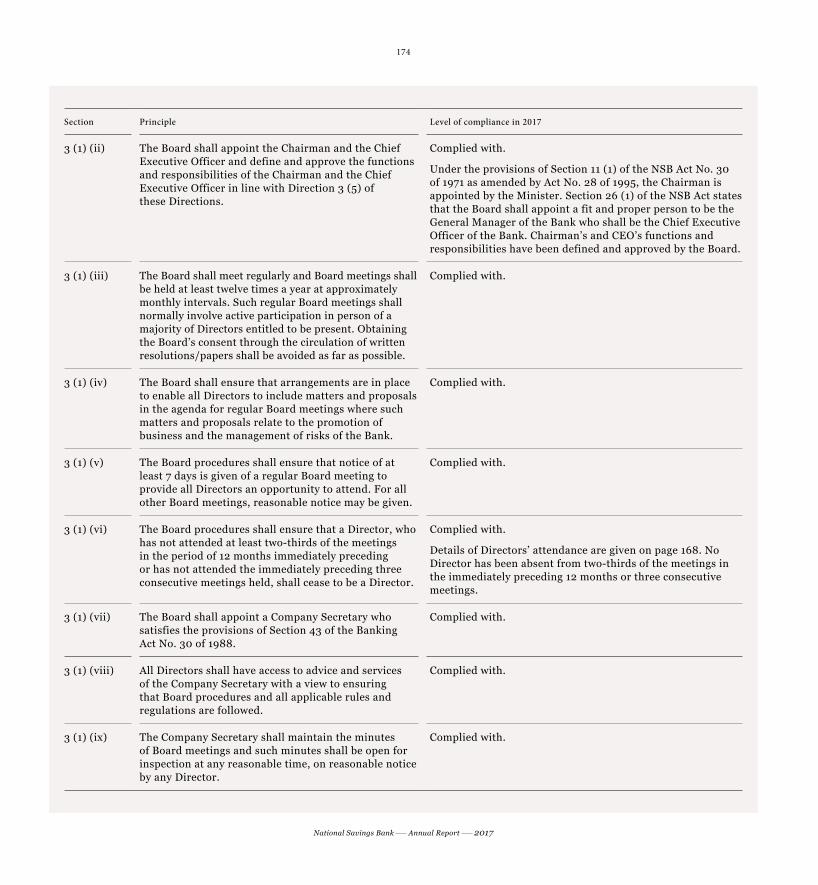
174
National Savings Bank Annual Report 2017
Section Principle Level of compliance in 2017
3 (1) (ii) The Board shall appoint the Chairman and the Chief Executive Officer and define and approve the functions and responsibilities of the Chairman and the Chief Executive Officer in line with Direction 3 (5) of these Directions.
Complied with.
Under the provisions of Section 11 (1) of the NSB Act No. 30 of 1971 as amended by Act No. 28 of 1995, the Chairman is appointed by the Minister. Section 26 (1) of the NSB Act states that the Board shall appoint a fit and proper person to be the General Manager of the Bank who shall be the Chief Executive Officer of the Bank. Chairman’s and CEO’s functions and responsibilities have been defined and approved by the Board.
3 (1) (iii) The Board shall meet regularly and Board meetings shall be held at least twelve times a year at approximately monthly intervals. Such regular Board meetings shall normally involve active participation in person of a majority of Directors entitled to be present. Obtaining the Board’s consent through the circulation of written resolutions/papers shall be avoided as far as possible.
Complied with.
3 (1) (iv) The Board shall ensure that arrangements are in place to enable all Directors to include matters and proposals in the agenda for regular Board meetings where such matters and proposals relate to the promotion of business and the management of risks of the Bank.
Complied with.
3 (1) (v) The Board procedures shall ensure that notice of at least 7 days is given of a regular Board meeting to provide all Directors an opportunity to attend. For all other Board meetings, reasonable notice may be given.
Complied with.
3 (1) (vi) The Board procedures shall ensure that a Director, who has not attended at least two-thirds of the meetings in the period of 12 months immediately preceding or has not attended the immediately preceding three consecutive meetings held, shall cease to be a Director.
Complied with.
Details of Directors’ attendance are given on page 168. No Director has been absent from two-thirds of the meetings in the immediately preceding 12 months or three consecutive meetings.
3 (1) (vii) The Board shall appoint a Company Secretary who satisfies the provisions of Section 43 of the Banking Act No. 30 of 1988.
Complied with.
3 (1) (viii) All Directors shall have access to advice and services of the Company Secretary with a view to ensuring that Board procedures and all applicable rules and regulations are followed.
Complied with.
3 (1) (ix) The Company Secretary shall maintain the minutes of Board meetings and such minutes shall be open for inspection at any reasonable time, on reasonable notice by any Director.
Complied with.

175
National Savings Bank Annual Report 2017
Section Principle Level of compliance in 2017
3 (1) (x) Minutes of Board meetings shall be recorded in sufficient detail so that it is possible to gather from the minutes, as to whether the Board acted with due care and prudence in performing its duties.
The minutes shall also serve as a reference for regulatory and supervisory authorities to assess the depth of deliberations at the Board meetings. Therefore, the minutes of a Board meeting shall clearly contain or refer to the following:
(a) a summary of data and information used by the Board in its deliberations;
(b) the matters considered by the Board;
(c) the fact-finding discussions and the issues of contention or dissent which may illustrate whether the Board was carrying out its duties with due care and prudence;
(d) the testimonies and confirmations of relevant executives which indicate compliance with the Board’s strategies and policies and adherence to relevant laws and regulations;
(e) the Board’s knowledge and understanding of the risks to which the Bank is exposed and an overview of the risk management measures adopted; and
(f) the decisions and Board resolutions.
Complied with.
3 (1) (xi) There shall be a procedure agreed by the Board to enable Directors, upon reasonable request, to seek independent professional advice in appropriate circumstances, at the Bank’s expense.
The Board shall resolve to provide separate independent professional advice to Directors to assist the relevant Director or Directors to discharge his/her/ their duties to the Bank.
Complied with.
Board approved Board Charter is in place, which enables the Directors upon reasonable request to seek independent professional advice in appropriate circumstances, at the Bank’s expense.
3 (1) (xii) Directors shall avoid conflicts of interest, or the appearance of conflicts of interest, in their activities with, and commitments to, other organisations or related parties.
Complied with.
3 (1) (xiii) The Board shall have a formal schedule of matters specifically reserved to it for decision to ensure that the direction and control of the Bank is firmly under its authority.
Complied with.

176
National Savings Bank Annual Report 2017
Section Principle Level of compliance in 2017
3 (1) (xiv) The Board shall, if it considers that the Bank is, or is likely to be, unable to meet its obligations or is about to become insolvent or is about to suspend payments due to depositors and other creditors, forthwith inform the Director of Bank Supervision of CBSL of the situation of the Bank prior to taking any decision or action.
Complied with.
No such situation has arisen during the year.
3 (1) (xv) The Board shall ensure that the Bank is capitalised at levels as required by the Monetary Board in terms of the capital adequacy ratio and other prudential grounds.
Complied with.
The Board monitors capital adequacy and other prudential measures to ensure compliance with regulatory requirements, and Bank’s defined risk appetite. The Bank is in compliance with the minimum capital requirements.
3 (1) (xvi) The Board shall publish in the Bank’s Annual Report, an annual corporate governance report setting out the compliance with Direction 3 of these Directions.
Complied with.
Corporate Governance Report is given on page 165 in the Annual Report.
3 (1) (xvii) The Board shall adopt a scheme of self-assessment to be undertaken by each Director annually, and maintain records of such assessments.
Complied with.
3 (2) Board’s composition
3 (2) (i) The number of Directors on the Board shall not be less than 7 and not more than 13.
Complied with.
As per Section 8 (1) of NSB Act the Board comprises seven Directors including the Chairman.
3 (2) (ii) (a) The total period of service of a Director other than a Director who holds the position of Chief Executive Officer shall not exceed nine years.
Complied with.
3 (2) (ii) (b) A Director who has completed nine years as at 1 January 2008, or who completes such term at any time prior to 31 December 2008, may continue for a further maximum period of 3 years commencing 1 January 2009.
Not applicable.
3 (2) (iii) An employee of a bank may be appointed, elected or nominated as a Director of the Bank (hereinafter referred to as an “Executive Director”) provided that the number of Executive Directors shall not exceed one third of the number of Directors of the Board. In such an event, one of the Executive Directors shall be the Chief Executive Officer of the Bank.
Not applicable.
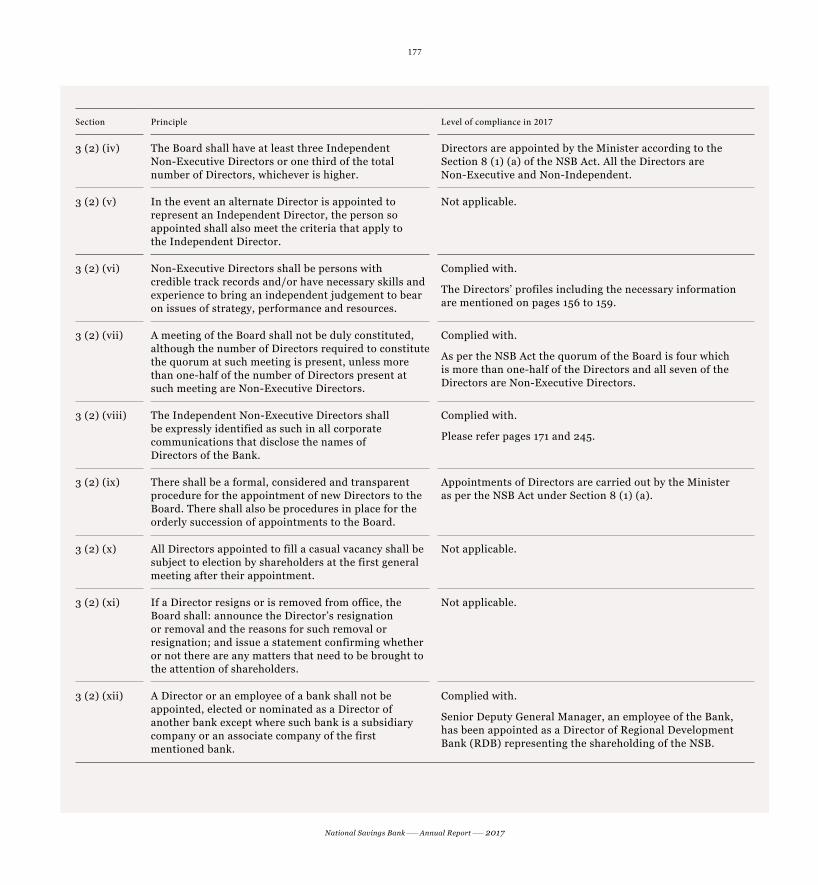
177
National Savings Bank Annual Report 2017
Section Principle Level of compliance in 2017
3 (2) (iv) The Board shall have at least three Independent Non-Executive Directors or one third of the total number of Directors, whichever is higher.
Directors are appointed by the Minister according to the Section 8 (1) (a) of the NSB Act. All the Directors are Non-Executive and Non-Independent.
3 (2) (v) In the event an alternate Director is appointed to represent an Independent Director, the person so appointed shall also meet the criteria that apply to the Independent Director.
Not applicable.
3 (2) (vi) Non-Executive Directors shall be persons with credible track records and/or have necessary skills and experience to bring an independent judgement to bear on issues of strategy, performance and resources.
Complied with.
The Directors’ profiles including the necessary information are mentioned on pages 156 to 159.
3 (2) (vii) A meeting of the Board shall not be duly constituted, although the number of Directors required to constitute the quorum at such meeting is present, unless more than one-half of the number of Directors present at such meeting are Non-Executive Directors.
Complied with.
As per the NSB Act the quorum of the Board is four which is more than one-half of the Directors and all seven of the Directors are Non-Executive Directors.
3 (2) (viii) The Independent Non-Executive Directors shall be expressly identified as such in all corporate communications that disclose the names of Directors of the Bank.
Complied with.
Please refer pages 171 and 245.
3 (2) (ix) There shall be a formal, considered and transparent procedure for the appointment of new Directors to the Board. There shall also be procedures in place for the orderly succession of appointments to the Board.
Appointments of Directors are carried out by the Minister as per the NSB Act under Section 8 (1) (a).
3 (2) (x) All Directors appointed to fill a casual vacancy shall be subject to election by shareholders at the first general meeting after their appointment.
Not applicable.
3 (2) (xi) If a Director resigns or is removed from office, the Board shall: announce the Director’s resignation or removal and the reasons for such removal or resignation; and issue a statement confirming whether or not there are any matters that need to be brought to the attention of shareholders.
Not applicable.
3 (2) (xii) A Director or an employee of a bank shall not be appointed, elected or nominated as a Director of another bank except where such bank is a subsidiary company or an associate company of the first mentioned bank.
Complied with.
Senior Deputy General Manager, an employee of the Bank, has been appointed as a Director of Regional Development Bank (RDB) representing the shareholding of the NSB.

178
National Savings Bank Annual Report 2017
Section Principle Level of compliance in 2017
3 (3) Criteria to assess the fitness and propriety of directors
3 (3) (i) a & b
The age of a person who serves as a Director shall not exceed 70 years.
Complied with.
3 (3) (ii) A person shall not hold office as a Director of more than 20 companies/entities/institutions inclusive of subsidiaries or associate companies of the Bank.
Complied with.
3 (4) Management functions delegated by the Board
3 (4) (i) The Directors shall carefully study and clearly understand the delegation arrangements in place.
Complied with.
3 (4) (ii) The Board shall not delegate any matters to a Board Committee, Chief Executive Officer, Executive Directors or Key Management Personnel, to an extent that such delegation would significantly hinder or reduce the ability of the Board as a whole to discharge its functions.
Complied with.
3 (4) (iii) The Board shall review the delegation processes in place on a periodic basis to ensure that they remain relevant to the needs of the Bank.
Complied with.
3 (5) The Chairman and Chief Executive Officer
3 (5) (i) The roles of Chairman and Chief Executive Officer shall be separated and shall not be performed by the same individual.
Complied with.
The roles of Chairman and the CEO are performed by two separate individuals.
3 (5) (ii) The Chairman shall be a Non-Executive Director and preferably an Independent Director as well.
In the case where the Chairman is not an independent Director, the Board shall designate an Independent Director as the Senior Director with suitably documented terms of reference.
The designation of the Senior Director shall be disclosed in the Bank’s Annual Report.
Not Applicable.
Chairman is a Non-Executive and Non-Independent Director. However, there is no such requirement in the NSB Act to appoint Independent Director as the Senior Director.
3 (5) (iii) The Board shall disclose in its corporate governance report, the identity of the Chairman and the Chief Executive Officer and the nature of any relationship.
Complied with.
Profiles of the members of the Board and the General Manager/CEO are available on page 156.

179
National Savings Bank Annual Report 2017
Section Principle Level of compliance in 2017
3 (5) (iv) The Chairman shall: provide leadership to the Board; ensure that the Board works effectively and discharges its responsibilities; and ensure that all key and appropriate issues are discussed by the Board in a timely manner.
Complied with.
The Chairman provides leadership to the Board and ensures that the Board functions effectively in discharging its responsibilities. The Board in a timely manner discusses all key issues.
3 (5) (v) The Chairman shall be primarily responsible for drawing up and approving the agenda for each Board meeting.
Complied with.
The Secretary to the Board draws up the agenda for the meetings in consultation with the Chairman.
3 (5) (vi) The Chairman shall ensure that all Directors are properly briefed on issues arising at Board meetings and also ensure that Directors receive adequate information in a timely manner.
Complied with.
3 (5) (vii) The Chairman shall encourage all Directors to make a full and active contribution to the Board’s affairs and take the lead to ensure that the Board acts in the best interests of the Bank.
Complied with.
Evaluation of the role of the Chairman and the overall assessment of the Board’s performance are incorporated in the Directors’ Self-evaluation Process.
3 (5) (viii) The Chairman shall facilitate the effective contribution of Non-Executive Directors in particular and ensure constructive relations between Executive and Non-Executive Directors.
Not Applicable.
Not relevant since there is no Executive Director.
3 (5) (ix) The Chairman shall not engage in activities involving direct supervision of Key Management Personnel or any other executive duties whatsoever.
Complied with.
Chairman acts in a Non-Executive capacity and he is not involved in executive functions to supervise KMPs.
3 (5) (x) The Chairman shall ensure that appropriate steps are taken to maintain effective communication with shareholders and that the views of shareholders are communicated to the Board.
Complied with.
The shareholder is being represented at the Board by the nominee of Secretary to Ministry of Finance who is appointed as a Director by the provisions of the NSB Act.
3 (5) (xi) The Chief Executive Officer shall function as the apex executive-in-charge of the day-to-day management of the Bank’s operations and business.
Complied with.

180
National Savings Bank Annual Report 2017
Section Principle Level of compliance in 2017
3 (6) Board Appointed Committees
3 (6) (i) Each bank shall have at least four Board committees as set out in Directions 3 (6) (ii), 3 (6) (iii), 3 (6) (iv) and 3 (6) (v) of these Directions. Each committee shall report directly to the Board. All committees shall appoint a secretary.
Complied with.
Six Board Committees are in place. Board Secretary acts as Secretary to all six committees. Board Audit Committee, Board Integrated Risk Management Committee, Board Human Resources and Remuneration Committee, Board Nominations Committee Board Credit Committee and Board Information Technology Strategy Committee directly submit reports through the Chairmen of the respective Board Committees to the Board.
3 (6) (ii) The following rules shall apply in relation to the Audit Committee:
3 (6) (ii) (a) The Chairman of the Committee shall be an Independent Non-Executive Director who possesses qualifications and experience in accountancy and/or audit.
Not applicable.
The Chairman of the Board Audit Committee is Non-Executive and Non-Independent.
All the members of the Board appointed as per the NSB Act.
3 (6) (ii) (b) All members of the Committee shall be Non-Executive Directors.
Complied with.
3 (6) (ii) (c) The Committee shall make recommendations on matters in connection with:
i. the appointment of the External Auditor for audit services to be provided in compliance with the relevant statutes;
ii. the implementation of the Central Bank guidelines issued to Auditors from time to time;
iii. the application of the relevant accounting standards; and
The Auditor General is appointed as per the NSB Act as the External Auditor of the Bank. And therefore, all the matters stated are taken into consideration.
iv. the service period, audit fee and any resignation or dismissal of the Auditor; provided that the engagement of the Audit partner shall not exceed five years, and that the particular Audit partner is not re-engaged for the audit before the expiry of three years from the date of the completion of the previous term.
Not applicable.
3 (6) (ii) (d) The Committee shall review and monitor the External Auditor’s independence and objectivity and the effectiveness of the audit processes in accordance with applicable standards and best practices.
Complied with.
Since the Auditor General is the External Auditor the independence and objectivity are maintained. Effectiveness of the audit process is discussed with the Superintendent of the Government Audit at Board Audit Committee meetings.
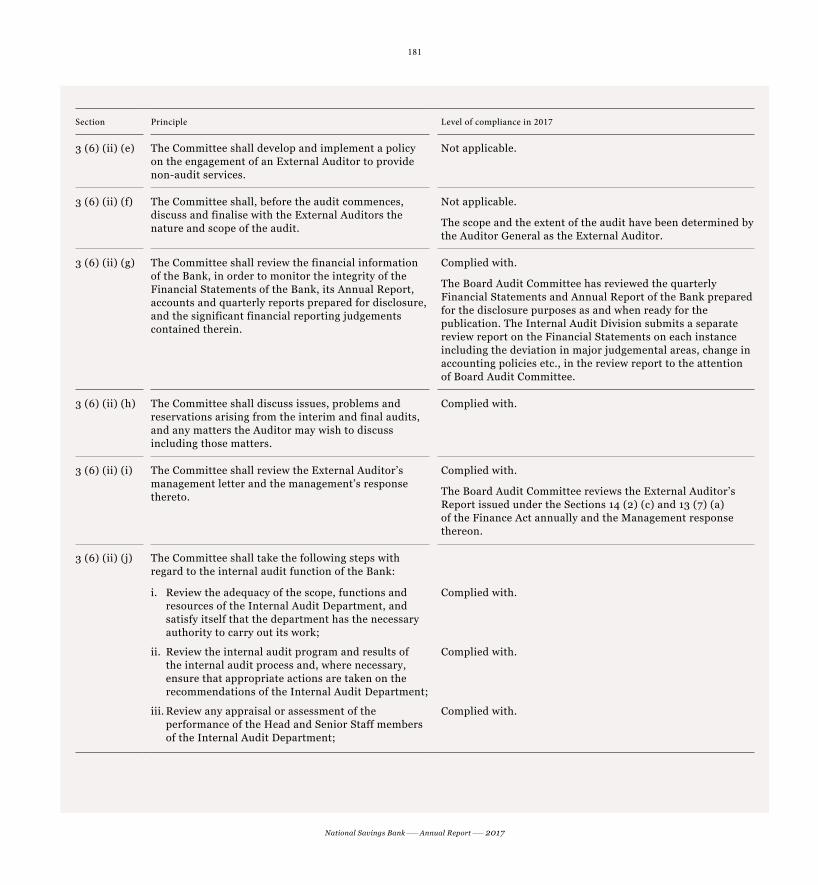
181
National Savings Bank Annual Report 2017
Section Principle Level of compliance in 2017
3 (6) (ii) (e) The Committee shall develop and implement a policy on the engagement of an External Auditor to provide non-audit services.
Not applicable.
3 (6) (ii) (f) The Committee shall, before the audit commences, discuss and finalise with the External Auditors the nature and scope of the audit.
Not applicable.
The scope and the extent of the audit have been determined by the Auditor General as the External Auditor.
3 (6) (ii) (g) The Committee shall review the financial information of the Bank, in order to monitor the integrity of the Financial Statements of the Bank, its Annual Report, accounts and quarterly reports prepared for disclosure, and the significant financial reporting judgements contained therein.
Complied with.
The Board Audit Committee has reviewed the quarterly Financial Statements and Annual Report of the Bank prepared for the disclosure purposes as and when ready for the publication. The Internal Audit Division submits a separate review report on the Financial Statements on each instance including the deviation in major judgemental areas, change in accounting policies etc., in the review report to the attention of Board Audit Committee.
3 (6) (ii) (h) The Committee shall discuss issues, problems and reservations arising from the interim and final audits, and any matters the Auditor may wish to discuss including those matters.
Complied with.
3 (6) (ii) (i) The Committee shall review the External Auditor’s management letter and the management’s response thereto.
Complied with.
The Board Audit Committee reviews the External Auditor’s Report issued under the Sections 14 (2) (c) and 13 (7) (a) of the Finance Act annually and the Management response thereon.
3 (6) (ii) (j) The Committee shall take the following steps with regard to the internal audit function of the Bank:
i. Review the adequacy of the scope, functions and resources of the Internal Audit Department, and satisfy itself that the department has the necessary authority to carry out its work;
Complied with.
ii. Review the internal audit program and results of the internal audit process and, where necessary, ensure that appropriate actions are taken on the recommendations of the Internal Audit Department;
Complied with.
iii. Review any appraisal or assessment of the performance of the Head and Senior Staff members of the Internal Audit Department;
Complied with.

182
National Savings Bank Annual Report 2017
Section Principle Level of compliance in 2017
iv. Recommend any appointment or termination of the Head, Senior Staff members and outsourced service providers to the internal audit function;
Complied with.
No such situation has arisen during the year.
v. Ensure that the Committee is appraised of resignations of Senior Staff members of the Internal Audit Department; including the Chief Internal Auditor and any outsourced service providers, and to provide an opportunity to the resigning Senior Staff members and outsourced service providers to submit reasons for resigning;
Complied with.
vi. Ensure that the internal audit function is independent of the activities it audits and that it is performed with impartiality, proficiency and due professional care.
Complied with.
3 (6) (ii) (k) The Committee shall consider the major findings of internal investigations and Management’s responses thereto.
Complied with.
The Board Audit Committee has reviewed major findings and management responses thereto. Please refer Committee Report on page 190.
3 (6) (ii) (l) The Chief Finance Officer, the Chief Internal Auditor and a representative of the External Auditors may normally attend meetings. The Committee has had at least two meetings with the External Auditors without the Executive Directors being present.
Complied with.
Ten meetings were held in the year of 2017 and a representative from Auditor General’s Department was presented for eight meetings. All Directors are non-executive.
3 (6) (ii) (m) The Committee shall have: Complied with.
As per the Board Audit Charter of the Bank, the Committee has been empowered to investigate any matter, resources to carry out its functions, access to information and authority to obtain professional advice. Refer Committee Report on page 190.
i. explicit authority to investigate into any matter within its terms of reference;
ii. the resources which it need to do so;
iii. full access to information; and
iv. Authority to obtain external professional advice and to invite outsiders with relevant experience to attend, if necessary.
3 (6) (ii) (n) The Committee shall meet regularly, with due notice of issues to be discussed and shall record its conclusions in discharging its duties and responsibilities.
Complied with.
The Committee has met 10 times during the year and minutes have been maintained.
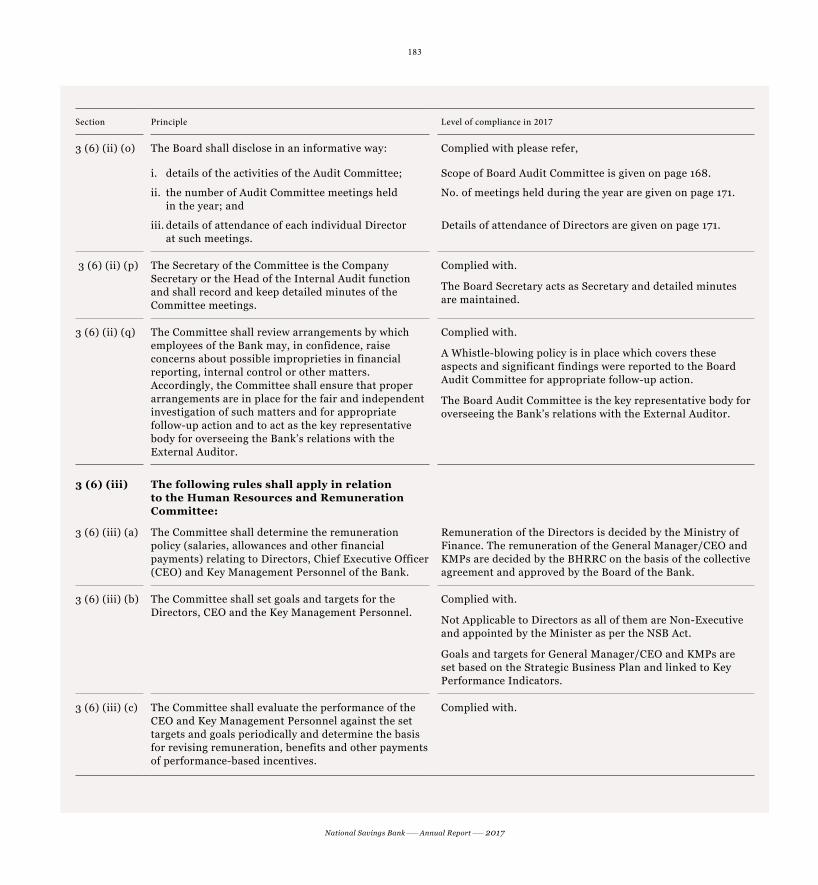
183
National Savings Bank Annual Report 2017
Section Principle Level of compliance in 2017
3 (6) (ii) (o) The Board shall disclose in an informative way: Complied with please refer,
i. details of the activities of the Audit Committee; Scope of Board Audit Committee is given on page 168.
ii. the number of Audit Committee meetings held in the year; and
No. of meetings held during the year are given on page 171.
iii. details of attendance of each individual Director at such meetings.
Details of attendance of Directors are given on page 171.
3 (6) (ii) (p) The Secretary of the Committee is the Company Secretary or the Head of the Internal Audit function and shall record and keep detailed minutes of the Committee meetings.
Complied with.
The Board Secretary acts as Secretary and detailed minutes are maintained.
3 (6) (ii) (q) The Committee shall review arrangements by which employees of the Bank may, in confidence, raise concerns about possible improprieties in financial reporting, internal control or other matters. Accordingly, the Committee shall ensure that proper arrangements are in place for the fair and independent investigation of such matters and for appropriate follow-up action and to act as the key representative body for overseeing the Bank’s relations with the External Auditor.
Complied with.
A Whistle-blowing policy is in place which covers these aspects and significant findings were reported to the Board Audit Committee for appropriate follow-up action.
The Board Audit Committee is the key representative body for overseeing the Bank’s relations with the External Auditor.
3 (6) (iii) The following rules shall apply in relation to the Human Resources and Remuneration Committee:
3 (6) (iii) (a) The Committee shall determine the remuneration policy (salaries, allowances and other financial payments) relating to Directors, Chief Executive Officer (CEO) and Key Management Personnel of the Bank.
Remuneration of the Directors is decided by the Ministry of Finance. The remuneration of the General Manager/CEO and KMPs are decided by the BHRRC on the basis of the collective agreement and approved by the Board of the Bank.
3 (6) (iii) (b) The Committee shall set goals and targets for the Directors, CEO and the Key Management Personnel.
Complied with.
Not Applicable to Directors as all of them are Non-Executive and appointed by the Minister as per the NSB Act.
Goals and targets for General Manager/CEO and KMPs are set based on the Strategic Business Plan and linked to Key Performance Indicators.
3 (6) (iii) (c) The Committee shall evaluate the performance of the CEO and Key Management Personnel against the set targets and goals periodically and determine the basis for revising remuneration, benefits and other payments of performance-based incentives.
Complied with.

184
National Savings Bank Annual Report 2017
Section Principle Level of compliance in 2017
3 (6) (iii) (d) The CEO shall be present at all meetings of the Committee, except when matters relating to the CEO are being discussed.
Complied with.
3 (6) (iv) The following rules shall apply in relation to the Nomination Committee:
3 (6) (iv) (a) The Committee shall implement a procedure to select/appoint new Directors, CEO and Key Management Personnel.
Not Applicable.
The Directors are appointed by the Minister as per the NSB Act.
Section 11 – The Minster shall nominate one of the Directors of the Board to be its Chairman.
Section 26 – The Board shall appoint a fit and proper person to be the General Manager of the Bank who shall be the Chief Executive Officer of the Bank.
Appointment of KMPs is complied with. Board of Directors appoints KMPs with the recommendation of Board Nomination Committee.
3 (6) (iv) (b) The Committee shall consider and recommend (or not recommend) the re-election of current Directors.
Not Applicable.
Directors are appointed by the Minister as per the NSB Act.
3 (6) (iv) (c) The Committee shall set the criteria for eligibility to be considered for appointment or promotion to the post of CEO and the Key Management Positions.
Complied with.
3 (6) (iv) (d) The Committee shall ensure that Directors, CEO and Key Management Personnel are fit and proper persons to hold office as specified in the criteria given in Direction 3 (3) and as set out in the statutes.
Complied with.
Signed affidavit and declarations of Directors and General Manager/CEO are obtained by the Board Secretary and the same are obtained from the KMPs by the HR Division and forwarded to the Central Bank for assessing the fitness and propriety.
3 (6) (iv) (e) The Committee shall consider and recommend from time to time, the requirements of additional/new expertise and the succession arrangements for retiring Directors and Key Management Personnel.
Complied with.
Appointment of the Chairman, Directors and the CEO is stipulated in the NSB Act. Appointments of KMPs are made by the Board of Directors.
3 (6) (iv) (f) The Committee shall be chaired by an Independent Director. The CEO may be present at meetings by invitation.
Not applicable.
The Committee is chaired by Non-Independent Director. As all Directors are Non-Independent most suitable Director was appointed to chair.

185
National Savings Bank Annual Report 2017
Section Principle Level of compliance in 2017
3 (6) (v) The Board Integrated Risk Management Committee:
3 (6) (v) (a) The Committee shall consist of at least three Non-Executive Directors, Chief Executive Officer and Key Management Personnel supervising broad risk categories,
Complied with.
3 (6) (v) (b) The Committee shall assess all risks, i.e., credit, market, liquidity, operational and strategic risks to the Bank on a monthly basis through appropriate risk indicators and management information. In the case of subsidiary companies and associate companies, risk management shall be done, both on a bank basis and group basis.
Complied with.
Risk Management Division (RMD) submits monthly risk reports to the Board and quarterly risk reports based on the Board-approved risk appetite.
3 (6) (v) (c) The Committee shall review specific quantitative and qualitative risk limits for all management level committees such as the Credit Committee and the Asset Liability Committee, and report any risk indicators periodically.
Complied with.
3 (6) (v) (d) The Committee shall take prompt corrective action to mitigate the effects of specific risks.
Complied with.
3 (6) (v) (e) The Committee shall meet at least quarterly to assess all aspects of risk management including updated Business Continuity Plans (BCP).
Complied with.
During the year, the Committee had five meetings. Details of meetings and attendance are given on page 171.
3 (6) (v) (f) The Committee shall take appropriate actions against the officers responsible for failure to identify specific risks and take prompt corrective actions as recommended by the Committee, and/or as directed by the Director of Bank Supervision.
Complied with.
No such necessity has arisen during the year.
3 (6) (v) (g) The Committee shall submit a risk assessment report within a week of each meeting to the Board seeking the Board’s views, concurrence and/or specific directions.
Complied with.
3 (6) (v) (h) The Committee shall establish a compliance function to assess the Bank’s compliance with laws, regulations, regulatory guidelines, internal controls and approved policies on all areas of business operations. A dedicated compliance officer selected from Key Management Personnel shall carry out the compliance function and report to the Committee periodically.
Complied with.
The Compliance function has been established by appointing a Compliance Officer (CO). Compliance officer submits reports periodically to the BIRMC/Board.

186
National Savings Bank Annual Report 2017
Section Principle Level of compliance in 2017
3 (7) Related party transactions
3 (7) (i) The Board shall take the necessary steps to avoid any conflicts of interest that may arise from any transaction of the Bank with any person.
Complied with.
3 (7) (ii) The type of transaction with related parties that shall be covered by this Direction.
Information in this regard is disclosed in Note 40 on “Related Party Disclosures”.
3 (7) (iii) The Board shall ensure that the Bank does not engage in transactions with related parties as defined in Direction 3 (7) (i) above, in a manner that would grant such parties “more favourable treatment” than that accorded to other constituents of the Bank carrying on the same business.
Complied with.
Annual declarations are obtained from the Directors where such transactions would be identified. System is also developed to capture any transaction with “more favourable Treatment” than that accorded to other constituents of the Bank carrying on the same business and reported to the Board periodically.
Transactions (if any) carried out with Related Parties in the normal course of business and disclosed in Note 40 to the Financial Statements “Related Party Disclosures” on page 345.
3 (7) (iv) A bank shall not grant any accommodation to any of its Directors or to a close relation of such Director unless such accommodation is sanctioned at a meeting of its Board of Directors, with not less than two-thirds of the number of Directors other than the Director concerned, voting in favour of such accommodation.
Complied with.
No such instances were recorded.
3 (7) (v) (a) Where any accommodation has been granted by a bank to a person or a close relation of a person or to any concern in which the person has a substantial interest, and such person is subsequently appointed as a Director of the Bank, steps shall be taken by the Bank to obtain the necessary security as may be approved for that purpose by the Monetary Board, within one year from the date of appointment of the person as a Director.
Complied with.
No such instances were recorded.
3 (7) (vi) A bank shall not grant any accommodation or “more favourable treatment” other than on the basis of a scheme applicable to the employees of such bank.
Complied with.
No such instances were recorded.
3 (7) (vii) No accommodation granted by a bank under Direction 3 (7) (v) and 3 (7) (vi) above, nor any part of such accommodation, nor any interest due thereon shall be remitted without the prior approval of the Monetary Board and any remission without such approval shall be void and of no effect.
Complied with.
No such instances were recorded.
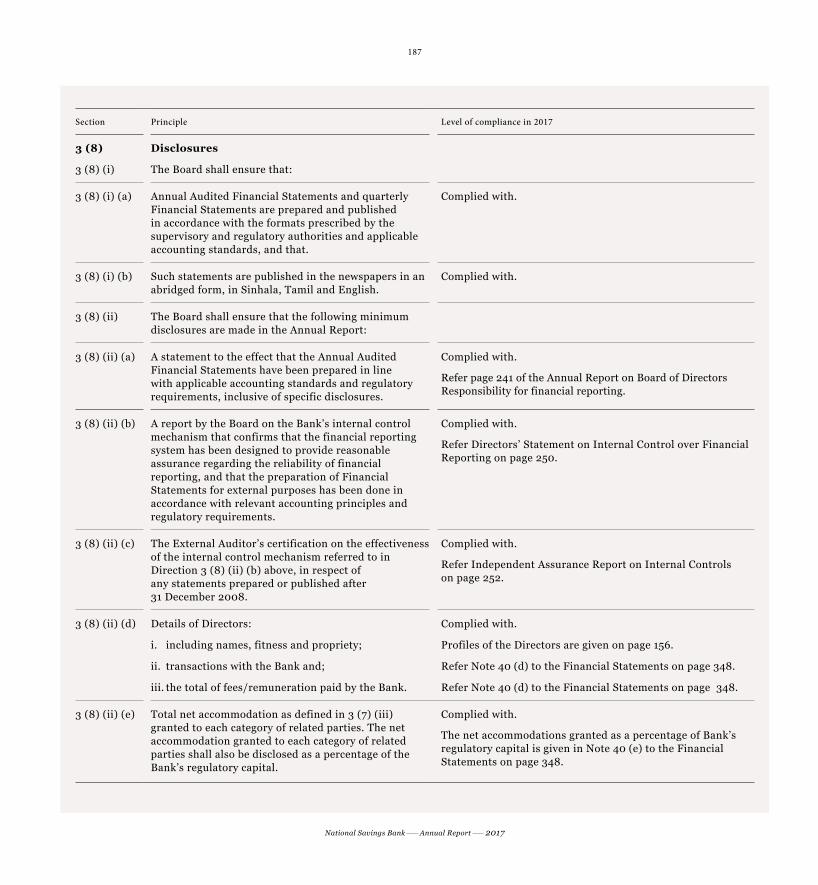
187
National Savings Bank Annual Report 2017
Section Principle Level of compliance in 2017
3 (8) Disclosures
3 (8) (i) The Board shall ensure that:
3 (8) (i) (a) Annual Audited Financial Statements and quarterly Financial Statements are prepared and published in accordance with the formats prescribed by the supervisory and regulatory authorities and applicable accounting standards, and that.
Complied with.
3 (8) (i) (b) Such statements are published in the newspapers in an abridged form, in Sinhala, Tamil and English.
Complied with.
3 (8) (ii) The Board shall ensure that the following minimum disclosures are made in the Annual Report:
3 (8) (ii) (a) A statement to the effect that the Annual Audited Financial Statements have been prepared in line with applicable accounting standards and regulatory requirements, inclusive of specific disclosures.
Complied with.
Refer page 241 of the Annual Report on Board of Directors Responsibility for financial reporting.
3 (8) (ii) (b) A report by the Board on the Bank’s internal control mechanism that confirms that the financial reporting system has been designed to provide reasonable assurance regarding the reliability of financial reporting, and that the preparation of Financial Statements for external purposes has been done in accordance with relevant accounting principles and regulatory requirements.
Complied with.
Refer Directors’ Statement on Internal Control over Financial Reporting on page 250.
3 (8) (ii) (c) The External Auditor’s certification on the effectiveness of the internal control mechanism referred to in Direction 3 (8) (ii) (b) above, in respect of any statements prepared or published after 31 December 2008.
Complied with.
Refer Independent Assurance Report on Internal Controls on page 252.
3 (8) (ii) (d) Details of Directors: Complied with.
i. including names, fitness and propriety; Profiles of the Directors are given on page 156.
ii. transactions with the Bank and; Refer Note 40 (d) to the Financial Statements on page 348.
iii. the total of fees/remuneration paid by the Bank. Refer Note 40 (d) to the Financial Statements on page 348.
3 (8) (ii) (e) Total net accommodation as defined in 3 (7) (iii) granted to each category of related parties. The net accommodation granted to each category of related parties shall also be disclosed as a percentage of the Bank’s regulatory capital.
Complied with.
The net accommodations granted as a percentage of Bank’s regulatory capital is given in Note 40 (e) to the Financial Statements on page 348.
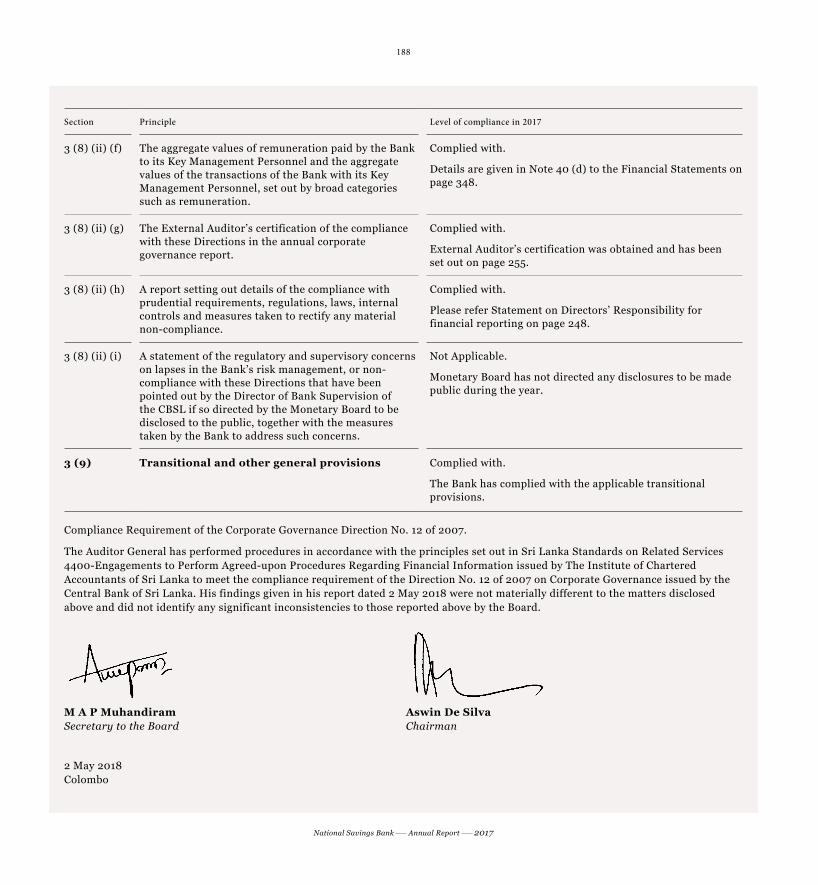
188
National Savings Bank Annual Report 2017
Section Principle Level of compliance in 2017
3 (8) (ii) (f) The aggregate values of remuneration paid by the Bank to its Key Management Personnel and the aggregate values of the transactions of the Bank with its Key Management Personnel, set out by broad categories such as remuneration.
Complied with.
Details are given in Note 40 (d) to the Financial Statements on page 348.
3 (8) (ii) (g) The External Auditor’s certification of the compliance with these Directions in the annual corporate governance report.
Complied with.
External Auditor’s certification was obtained and has been set out on page 255.
3 (8) (ii) (h) A report setting out details of the compliance with prudential requirements, regulations, laws, internal controls and measures taken to rectify any material non-compliance.
Complied with.
Please refer Statement on Directors’ Responsibility for financial reporting on page 248.
3 (8) (ii) (i) A statement of the regulatory and supervisory concerns on lapses in the Bank’s risk management, or non-compliance with these Directions that have been pointed out by the Director of Bank Supervision of the CBSL if so directed by the Monetary Board to be disclosed to the public, together with the measures taken by the Bank to address such concerns.
Not Applicable.
Monetary Board has not directed any disclosures to be made public during the year.
3 (9) Transitional and other general provisions Complied with.
The Bank has complied with the applicable transitional provisions.
Compliance Requirement of the Corporate Governance Direction No. 12 of 2007.
The Auditor General has performed procedures in accordance with the principles set out in Sri Lanka Standards on Related Services 4400-Engagements to Perform Agreed-upon Procedures Regarding Financial Information issued by The Institute of Chartered Accountants of Sri Lanka to meet the compliance requirement of the Direction No. 12 of 2007 on Corporate Governance issued by the Central Bank of Sri Lanka. His findings given in his report dated 2 May 2018 were not materially different to the matters disclosed above and did not identify any significant inconsistencies to those reported above by the Board.
M A P Muhandiram Aswin De SilvaSecretary to the Board Chairman
2 May 2018 Colombo
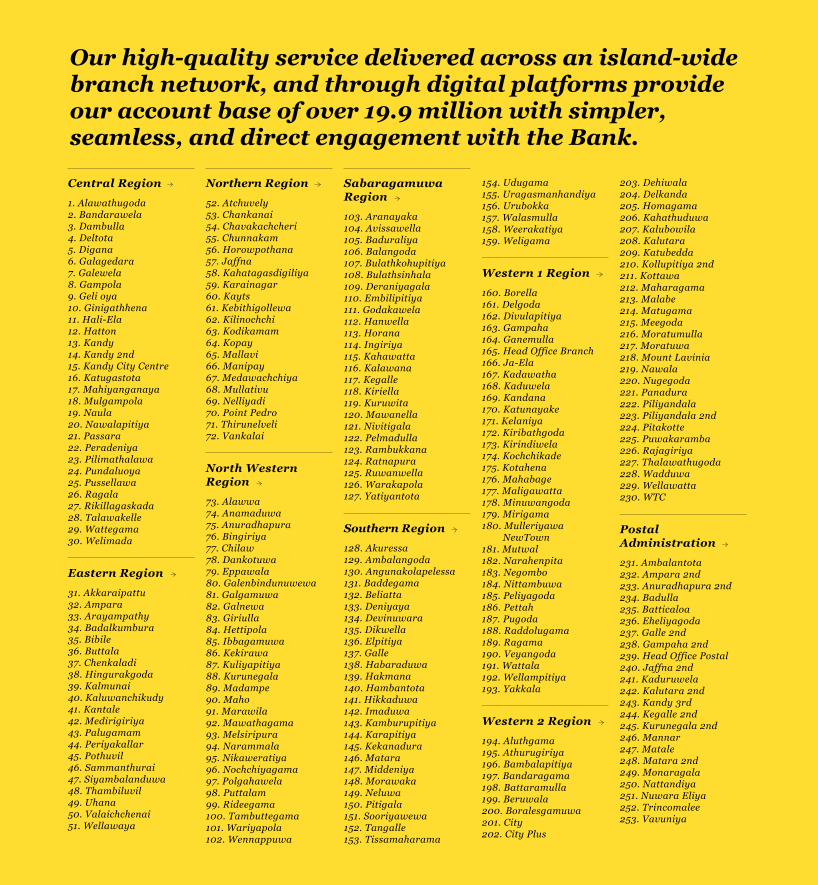
189
National Savings Bank Annual Report 2017
Our high-quality service delivered across an island-wide branch network, and through digital platforms provide our account base of over 19.9 million with simpler, seamless, and direct engagement with the Bank.
Central Region
1. Alawathugoda2. Bandarawela3. Dambulla4. Deltota5. Digana6. Galagedara7. Galewela8. Gampola9. Geli oya10. Ginigathhena11. Hali-Ela12. Hatton13. Kandy14. Kandy 2nd15. Kandy City Centre16. Katugastota17. Mahiyanganaya18. Mulgampola19. Naula20. Nawalapitiya21. Passara22. Peradeniya23. Pilimathalawa24. Pundaluoya25. Pussellawa26. Ragala27. Rikillagaskada28. Talawakelle29. Wattegama30. Welimada
Eastern Region
31. Akkaraipattu32. Ampara33. Arayampathy34. Badalkumbura35. Bibile36. Buttala37. Chenkaladi38. Hingurakgoda39. Kalmunai40. Kaluwanchikudy41. Kantale42. Medirigiriya43. Palugamam44. Periyakallar45. Pothuvil46. Sammanthurai47. Siyambalanduwa48. Thambiluvil49. Uhana50. Valaichchenai51. Wellawaya
Northern Region
52. Atchuvely53. Chankanai54. Chavakachcheri55. Chunnakam56. Horowpothana57. Jaffna58. Kahatagasdigiliya59. Karainagar60. Kayts61. Kebithigollewa62. Kilinochchi63. Kodikamam64. Kopay65. Mallavi66. Manipay67. Medawachchiya68. Mullativu69. Nelliyadi70. Point Pedro71. Thirunelveli72. Vankalai
North Western Region
73. Alawwa74. Anamaduwa75. Anuradhapura76. Bingiriya77. Chilaw78. Dankotuwa79. Eppawala80. Galenbindunuwewa81. Galgamuwa82. Galnewa83. Giriulla84. Hettipola85. Ibbagamuwa86. Kekirawa87. Kuliyapitiya88. Kurunegala89. Madampe90. Maho91. Marawila92. Mawathagama93. Melsiripura94. Narammala95. Nikaweratiya96. Nochchiyagama97. Polgahawela98. Puttalam99. Rideegama100. Tambuttegama101. Wariyapola102. Wennappuwa
Sabaragamuwa Region
103. Aranayaka104. Avissawella105. Baduraliya106. Balangoda107. Bulathkohupitiya108. Bulathsinhala109. Deraniyagala110. Embilipitiya111. Godakawela112. Hanwella113. Horana114. Ingiriya115. Kahawatta116. Kalawana117. Kegalle118. Kiriella119. Kuruwita120. Mawanella121. Nivitigala122. Pelmadulla123. Rambukkana124. Ratnapura125. Ruwanwella126. Warakapola127. Yatiyantota
Southern Region
128. Akuressa129. Ambalangoda130. Angunakolapelessa131. Baddegama132. Beliatta133. Deniyaya134. Devinuwara135. Dikwella136. Elpitiya137. Galle138. Habaraduwa139. Hakmana140. Hambantota141. Hikkaduwa142. Imaduwa143. Kamburupitiya144. Karapitiya145. Kekanadura146. Matara147. Middeniya148. Morawaka149. Neluwa150. Pitigala151. Sooriyawewa152. Tangalle153. Tissamaharama
154. Udugama155. Uragasmanhandiya156. Urubokka157. Walasmulla158. Weerakatiya159. Weligama
Western 1 Region
160. Borella161. Delgoda162. Divulapitiya163. Gampaha164. Ganemulla165. Head Office Branch166. Ja-Ela167. Kadawatha168. Kaduwela169. Kandana170. Katunayake171. Kelaniya172. Kiribathgoda173. Kirindiwela174. Kochchikade175. Kotahena176. Mahabage177. Maligawatta178. Minuwangoda179. Mirigama180. Mulleriyawa NewTown181. Mutwal182. Narahenpita183. Negombo184. Nittambuwa185. Peliyagoda186. Pettah187. Pugoda188. Raddolugama189. Ragama190. Veyangoda191. Wattala192. Wellampitiya193. Yakkala
Western 2 Region
194. Aluthgama195. Athurugiriya196. Bambalapitiya197. Bandaragama198. Battaramulla199. Beruwala200. Boralesgamuwa201. City202. City Plus
203. Dehiwala204. Delkanda205. Homagama206. Kahathuduwa207. Kalubowila208. Kalutara209. Katubedda210. Kollupitiya 2nd211. Kottawa212. Maharagama213. Malabe214. Matugama215. Meegoda216. Moratumulla217. Moratuwa218. Mount Lavinia219. Nawala220. Nugegoda221. Panadura222. Piliyandala223. Piliyandala 2nd224. Pitakotte225. Puwakaramba226. Rajagiriya227. Thalawathugoda228. Wadduwa229. Wellawatta230. WTC
Postal Administration
231. Ambalantota232. Ampara 2nd233. Anuradhapura 2nd234. Badulla235. Batticaloa236. Eheliyagoda 237. Galle 2nd238. Gampaha 2nd239. Head Office Postal240. Jaffna 2nd241. Kaduruwela242. Kalutara 2nd243. Kandy 3rd244. Kegalle 2nd245. Kurunegala 2nd246. Mannar247. Matale248. Matara 2nd249. Monaragala250. Nattandiya251. Nuwara Eliya252. Trincomalee253. Vavuniya

190
National Savings Bank Annual Report 2017
Report of the Board Audit Committee
The Board Audit Committee (BAC) of the Bank was constituted in accordance with the Banking Act Direction No. 12 of 2007 on “Corporate Governance for Licensed Specialised Banks” issued by the Central Bank of Sri Lanka under Section 3 (6) (ii) and its subsequent amendments, provision of the Public Enterprises Guidelines for Good Governance and “Code of Best Practice on Corporate Governance” issued by The Institute of Chartered Accountants of Sri Lanka.
The Board Secretary functions as the Secretary to the BAC as per the Board decision dated 11 July 2013. The Board of Directors of the National Savings Bank which consists of seven Directors and being constituted under the provisions of Section 8 (1), sub-section of National Savings Bank Act No. 30 of 1971 as amended. Members for all the Subcommittees including the BAC are being appointed out of the said seven (07) members. The members possess necessary qualifications, skills and experience to serve in the BAC.
The Superintendent of the Government Audit as the representative of the Auditor General attended eight BAC meetings on invitation as an Observer. The General Manager/CEO, Deputy General Manager (Finance & Planning) and Acting Deputy General Manager (Audit) have attended meetings of BAC during the year 2017 on invitation ensuring optimum independency of the BAC.
Board Audit Committee CharterThe Charter of the BAC has been approved by the Board of Directors and reviewed regularly, clearly defines the Terms of Reference of the Committee. The Committee assists the Board of Directors in discharging its responsibilities and fulfilling its oversight responsibilities for –
(a) The integrity of the Bank’s Financial Statements; (b) The effectiveness of the Bank’s risk management function;(c) The performance of the Bank’s internal audit function; and (d) The performance of the Bank’s external audit function.
The Charter also stipulates the functions and responsibilities, and the authority of the Committee. The Charter Checklist was used to assist the Committee to assess its compliance to the Charter in performing Committee’s functions and discharging its responsibilities.
Composition of the CommitteeBoard Audit Committee (BAC) consists of following members whose profiles are given on the page 156 of this Annual Report.
Mr D L P R Abeyaratne – ChairmanMr A K Seneviratne – MemberMr Anil Rajakaruna – Member
Secretary to the Board of Directors, functions as the Secretary to the Board Audit Committee.
MeetingsThe quorum for a meeting is two (2) members.
Attendance of the Committee members during the year are as follows:
Name Eligible to attend
Attended
Mr D L P R Abeyaratne 10 10Mr A K Seneviratne 10 8
Mr Anil Rajakaruna 10 10

191
National Savings Bank Annual Report 2017
Financial reportingThe Committee reviews the Financial Statements of the Bank, in order to monitor the integrity of the Financial Statement of the Bank, and quarterly reports prepared for disclosure, and the significant financial reporting judgement contained therein prior to their release. The Committee shall focus on major judgement areas, any changes in accounting policies and practices, significant adjustments arising from the audit, the going concern assumption and compliance with relevant accounting standards and other legal requirements. The Committee reviewed the “Report on the review of Financial Statement for the year ended 2017” which was submitted along with findings by the Internal Audit Division and reviewed the draft Financial Statement submitted on quarterly basis.
Progress of implementation of SLFRS 9The Committee monitored the progress of implementation of SLFRS 9 on “Financial Instruments” as per the Sri Lanka Accounting Standards which will be effective from 1 January 2018.
Identification of risks and control measuresThe Directors of the Bank and its subsidiaries are responsible for identifying and evaluating risk and its impact on business operations and financial reporting.
BAC reviews and assesses the Bank’s risk management process, including the adequacy of the overall control environment and controls in areas of significant risks. Further BAC reviews and assesses the Bank’s system of internal controls for detecting accounting and financial reporting errors and misappropriation of assets, legal violations, and non-compliance with the corporate code of conduct. In this regard, reviews the related findings and recommendations of the External and Internal Auditors, together with Management’s responses.
The Bank adapts risk base audit approach and the Committee assessed the effectiveness of the Bank’s internal control over financial reporting in line with the Banking Act Direction No. 12 of 2007, Section 3 (8) (ii) (b), and prepared based on the guidelines issued by The Institute of Chartered Accountants of Sri Lanka (CA Sri Lanka).
Internal audit and inspectionThe BAC ensures that, the internal audit function is independent of the activities it audits. It reviews the internal audit budget, resource plan, activities, and organisational structure of the internal audit function with the Acting Deputy General Manager Audit and also satisfies itself that the Division has the necessary authority to carry out its work.
The Internal Audit Division of the Bank carries out audit of Branches, Divisions and other Units as per the Annual Audit Plan. The frequency of audit is determined by the level of risk assessed. The Audit Plan is approved by the BAC for implementation. The approved audit plan for the year 2017 has been achieved by the end of 2017.
The Internal Audit Division carries out audit checks to ensure compliance with policies and procedures and the effectiveness of the internal control systems and reports its findings in respect of any non-compliance and provides recommendations for improvements. Audits are carried out to provide an independent and objective report on operational and Management activities.
BAC reviewed findings of regular audit examinations and information system audits carried out by the Internal Audit Division. Further, reviewed the reports on internal investigations carried out during the period from November 2016 to November 2017, report on Fraudulent Withdrawals of the Bank and reviewed the performance of Acting Deputy General Manager (Audit) and senior staff members of the Audit Division for the year.
The Internal Audit Manual of the Bank summarizes the operations of the internal audit function and delineates the policies, standards and procedures which will generally govern the internal audit function.
The Internal Audit Charter is used in order to assist the Internal Audit Division to discharge its duties effectively and independently. The Charter includes the scope, functions, responsibilities, authorities, reporting procedure and independence and objectivity of the Internal Audit Division.

192
National Savings Bank Annual Report 2017
External auditBy statute, the Auditor General is the External Auditor of the Bank. Meetings with the External Auditor were held at least twice during the engagement. They were also provided with the opportunities of meeting the Committee independently, to discuss and express their views on any matter of significance. Board Audit Committee had ten meetings in the year 2017 and a representative from Auditor General’s Department attended to eight meetings.
Effectiveness of the audit process was discussed with the Superintendent of the Government Audit at Board Audit Committee meetings. The Committee ensured the provision of all information and documents required by the External Auditor for the purpose of audit.
Ethics and good governanceThis Fraud Risk Management and Whistle-blowing policy of the National Savings Bank is a key element for safeguarding the Bank’s integrity. It is aimed at enhancing the Bank’s transparency and underpinning its system for combating practices that might damage its activities and reputation and provides a means for early detection of fraud and other problematic situations.
The Board Audit Committee (BAC) shall review on a quarterly basis all the cases of frauds. During the quarterly review, the Board Audit Committee will scrutinise statistical information as well as details of each fraud, action taken thereon, and issue directions on the punitive and preventive aspects of frauds, where necessary. The Board Audit Committee shall have the right to, at any time; request a briefing regarding any preliminary investigation and findings.
ComplianceThe Committee reviewed the effectiveness of the system for monitoring compliance with laws and regulations and the results of Management's investigation and follow-up (including disciplinary action) of any instances of non-compliance.
Committee evaluationThe Committee completed the evaluation process with self-assessment for the year 2017 and concluded that its performance was effective.
ReportingThe Committee is directly reporting to the Board of Directors about its activities, issues and related recommendations along with the minutes of the meetings. BAC provides Open Avenue of communication between internal audit, external audit and the Board of Directors. The Committee is of the view that the terms of reference of the Committee were compiled within all material aspects.
D L P R Abeyaratne
Chairman – Board Audit Committee
12 March 2018Colombo

193
National Savings Bank Annual Report 2017
Report of the Board Human Resource and Remuneration Committee
The Board Human Resource and Remuneration Committee (BHRRC) constituted in terms of the provisions of Sections 3 (6) (i) and (iii) of Banking Act Direction No. 12 of 2007 issued by the Monetary Board of the Central Bank of Sri Lanka (CBSL) under Section 76 J (1) of the Banking Act No. 30 of 1988, as amended. The Committee reports directly to the Board of Directors.
Role and responsibilities of the CommitteeThe Committee is responsible for determining the remuneration policy (salaries, allowances and other financial payments) relating to the General Manager/CEO and Key Management Personnel of the Bank other than the remunerations determined by the Collective Agreement. The Committee set Key Performance Indicators for General Manager/CEO and the Key Management Personnel. Further evaluate the performance of the General Manager/CEO and Key Management Personnel against the set targets and goals periodically and determine the basis for revising remuneration, benefits and other payments of performance-based incentives.
The Committee reviews all significant human resource policies, initiatives, salary structures, besides terms and conditions relating to staff at senior executive level. In this process, necessary information and recommendations are obtained from the General Manager/CEO and the Senior Management of the Bank.
Composition of the CommitteeThe Committee (BHRRC) comprises of following Non-Executive Directors whose profiles are given on page 156 of this Annual Report.
Mr Aswin De Silva – Chairman Mr D L P R Abeyaratne – Member Mr Ajith Pathirana – Member
The General Manager/CEO attends meetings of the Committee when taking up of Human Resource and Remuneration matters. The Secretary to the Board of Directors, functions as the Secretary to the BHRRC.
MeetingsThe Committee meetings are held quarterly however based on the needs, meetings are being fixed accordingly. The quorum for a meeting is two (2) members.
Attendance of the Committee members during the year are as follows:
Name Eligible to attend
Attended
Mr Aswin De Silva 10 10Mr D L P R Abeyaratne 10 10
Mr Ajith Pathirana 10 8
194
National Savings Bank Annual Report 2017
Activities during the year 2017Activities attended and carried out by the Committee during the year 2017, were as follows:
Reviewed the Human Resources Policy and the Disciplinary Code of the Bank.
Evaluation of Key Performance Indicators (KPI) of Key Management Personnel (KMPs) for 2016 (General Manager/CEO, Senior DGM, all DGMM, all Consultants, Compliance Officer and all AGMM).
Reviewed recruitment and selection methodology of the Bank.
Reviewed the recruitment, promotion and upgrading of staff based on the requirement of the Bank.
Revisited and provided a value addition to staff welfare benefit scheme of the Bank.
Consideration of appeals submitted by staff on HR-related matters.
The proceedings of Committee meetings have been regularly reported to the Board of Directors.
Committee evaluationThe Committee completed the evaluation process with self-assessment for the year 2017 and concluded that its performance was effective.
Aswin De SilvaChairman – Board Human Resource and Remuneration Committee
12 March 2018Colombo

195
National Savings Bank Annual Report 2017
Report of the Board Nomination Committee
The Board of Directors has established the Board Nomination Committee (BNC) in compliance with the Banking Act Direction No. 12 of 2007, Corporate Governance for Licensed Specialised Banks in Sri Lanka issued by the Monetary Board of the Central Bank of Sri Lanka under Section 76 J (1) of the Banking Act No. 30 of 1988 as amended, to ensure Board oversight and control over the selection of Key Management Personnel.
Role and responsibilities of the CommitteeThe Board Nomination Committee is responsible for implementing a procedure to select/appoint General Manager/CEO and Key Management Personnel, setting out criteria such as qualifications, experience and key attributes required for eligibility to be considered for appointment or promotion to the post of General Manager/CEO and the Key Management Positions.
Further, the Committee shall ensure that the Directors, General Manager/CEO and Key Management Personnel are fit and proper persons to hold office specified in the criteria given in Direction No. 3 (3) and as set out in the Statutes. The Committee shall also consider and recommend from time to time, the requirements of additional/new expertise and succession arrangements for retiring Key Management Personnel.
Activities during the year 2017Important activities attended and carried out by the Committee during the year were as follows:
Review and approval for proposed cadre for the Bank – 2017. Review the Succession Plan of the Bank. Interviews for posts of Special Grades in banking and non-banking
streams, and Key Management Personnel (KMPs) – initiate interviews for Posts of Assistant General Managers (Special Grade)
Committee evaluationThe Committee completed the evaluation process with self-assessment for the year 2017 and concluded that its performance was effective.
D L P R AbeyaratneChairman – Board Nomination Committee
12 March 2018Colombo
Composition of the CommitteeBoard Nomination Committee (BNC) consists of following members whose profiles are given on the page 156 of this Annual Report:
Mr D L P R Abeyaratne – Chairman (Appointed w.e.f. 03.02.2017 and member up to 02.02.2017)
Mr Aswin De Silva – Chairman (Resigned w.e.f. 03.02.2017)
Mr Ajith Pathirana – Member
Mr A K Seneviratne – Member (Appointed w.e.f. 03.02.2017)
The Secretary to the Board of Directors, functions as the Secretary to the BNC.
MeetingsThe quorum for a meeting is two members. Attendance of the Committee members during the year is as follows:
Name Eligible to attend
Attended
Mr D L P R Abeyaratne 1 1Mr Ajith Pathirana 1 1
Mr A K Seneviratne 1 1

196
National Savings Bank Annual Report 2017
Report of the Board Integrated Risk Management Committee
The Board of Directors has established the Board Integrated Risk Management Committee (BIRMC) in compliance with the Banking Act Direction No. 12 of 2007, Corporate Governance for Licensed Specialised Banks in Sri Lanka, issued by the Monetary Board of Central Bank of Sri Lanka under the power vested in the Monetary Board, in terms of the Banking Act No. 30 of 1988.
Role and responsibilities of the CommitteeThe Terms of Reference set out by the Board of Directors, includes the following:
Assist the Board of Directors in fulfilling its responsibilities relating to risk management and establishing an effective risk management framework.
Implement the Integrated Risk Management Policy and other risk-related policies approved by the Bank and periodic updating of the Bank-wide Risk Management Framework.
Ensure that all credit, market, operational and strategic risks faced by the Bank are identified, measured, monitored, and managed adequately.
Work with Key Management Personnel very closely on all critical risk areas and make suitable recommendation to the Board within the framework of the authority and responsibility assigned to the Committee.
Composition of the CommitteeThe BIRMC comprised three Non-Executive Directors, General Manager/CEO and Head of Risk Management as members of the Management.
The following Directors have been functioning as members of BIRMC whose profiles are given on page 156 of this Annual Report:
Mr A K Seneviratne – Chairman
Mr Suranga Naullage – Member
Mr Chandima Hemachandra – Member (Resigned w.e.f. 14.08.2017)
Mr Anil Rajakaruna – Member (Appointed w.e.f. 14.08.2017)
The Secretary to the Board of Directors functions as the Secretary to the BIRMC.
MeetingsThe Committee meetings are held quarterly however based on the needs, meetings are being fixed accordingly. The quorum for a meeting is two (2) members.
Attendance of the Committee members during the year is as follows:
Name Eligible to attend
Attended
Mr A K Seneviratne 5 5Mr Chandima Hemachandra 3 1
Mr Suranga Naullage 5 5
Mr Anil Rajakaruna 2 2
197
National Savings Bank Annual Report 2017
Identify, review, report and recommend on risk of new operational developments and compliance related to those concerns.
Review implementation and compliance with the Basel III directions issued by CBSL.
During the year 2017, the BIRMC has reviewed the Charter. The Committee reviews policies, reports, and proposals on risk and compliance related to the Bank. BIRMC grants approval for proposals within its mandate and recommends proposals/reports to the Board of Directors which is required to be scrutinised by the Board. Respective chapter/segment on risk management presents detailed introduction over risk management functions of the Bank and its significance. BIRMC is supported by Risk Management, Compliance Divisions and other operational divisions in discharging its responsibilities.
Activities during the year 2017The Committee assesses all main risks such as operational, credit, market, liquidity etc., which can adversely affect the Bank. It maintains close relationship with the Key Management Personnel and the Board to fulfil its statutory, fiduciary and regulatory responsibilities for risk management.
Important activities attended and carried out by the Committee during the year were as follows:
Review of reports on Risk Appetite of the Bank, Tolerance Limits and other reports highlighting different aspects of risk of the Bank (i.e. credit risk, market risk, operational risk, HR risk, technical risk etc.).
Review of different risk limits and grant necessary approvals.
Reviewing of adequacy of measures and standards maintained by the Bank to meet internationally-recognised norms in the industry, regulations/guidelines of the regulator - Central Bank of Sri Lanka and Internal Capital Adequacy Assessment Process (ICAAP) in line with audit concerns on ICAAP document.
Follow-up progress of rectification process of supervisory concerns raised by the Central Bank of Sri Lanka at their examination.
Review periodic reports on Related Party Transactions, key issues of the Bank such as financial frauds, Fraud Risk Management – Whistle-blowing policy.
Review of compliance assessments on Bank and its core functions such as pawning, credit, human resource management, maintaining KYC (Know Your Customer) requirement etc.
Continuous monitoring and review over status of Bank's compliance with Basel III standards.
Annual review of Compliance Programme and Compliance Manual.
Committee evaluationThe Committee completed the evaluation process with self-assessment for the year 2017 and concluded that its performance was effective.
A K SeneviratneChairman – Board Integrated Risk Management Committee
12 March 2018Colombo

198
National Savings Bank Annual Report 2017
Report of the Board Credit Committee
The Board of Directors has established the Board Credit Committee (BCC) in compliance with the Banking Act Direction No 12 of 2007, Corporate Governance for Licensed Specialised Banks in Sri Lanka issued by the Monetary Board of the Central Bank of Sri Lanka under Section 76 J (1) of the Banking Act No. 30 of 1988 as amended and National Savings Bank Act No. 30 of 1971 as amended, to conduct periodic reviews on the Credit Policy and Investment Policy of the Bank as and when required, and to engage in approving of credit facilities and investments within the limits delegated to.
Role and responsibilities of the CommitteeReviews and recommends the Banks strategic objectives with respect to credit and investment including policies, procedures and other related policy level documents.
Assists the Board of Directors through efficient and effective management relating to Credit Policy and Investment Policy of the Bank in order to promoting and reinforcing a sound, robust and healthy credit risk acceptance and management culture.
Approves and advises on the pricing of Loans and Advance and Investments in accordance with the recommendations by Assets and Liability Management Committee (ALCO).
Ensuring implementation of appropriate systems to manage risks and strengthen internal controls and management information systems with respect to credit aspect of the Bank.
Composition of the CommitteeThe BCC comprised three Non-Executive Directors and General Manager/CEO, DGM (Credit) and DGM (Retail Credit) shall attend as invitees.
The following Directors have been functioning as members of BCC whose profiles are given on the pages 156 of this Annual Report.
Mr Aswin De Silva – Chairman
Mr Anil Rajakaruna – Member (Appointed w.e.f. 03.02.2017 and Resigned w.e.f. 14.08.2017)
Mr Ajith Pathirana – Member (Appointed w.e.f. 14.08.2017)
Mr Chandima Hemachndra – Member
The Secretary to the Board of Directors, functions as the Secretary to the BCC.
MeetingsThe quorum for a meeting is two members. Attendance of the Committee members during the years as follows :
Name Eligible to attend
Attended
Mr Aswin De Silva 8 8Mr Anil Rajakaruna 5 5
Mr Ajith Pathirana 3 2
Mr Chandima Hemachandra 8 6

199
National Savings Bank Annual Report 2017
Activities during the year 2017The committee approved the credit and investment proposals and other specific reports which prerequisite the approval of the Board in line with the lending and investment policies and credit risk appetite of the Bank in order to ensure the efficient and effective performance over the credit and investment direction of the Bank.
Committee evaluationThe Committee completed the evaluation process with self-assessment for the year 2017 and concluded that its performance was effective.
Aswin De SilvaChairman – Board Credit Committee
12 March 2018Colombo
200
National Savings Bank Annual Report 2017
Report of the Board Information Technology Strategy Committee
The Board of Directors of the Bank has established the Board Information Technology Strategy Committee (BITSC) in compliance with the Banking Act Direction No. 12 of 2007, Corporate Governance for Licensed Specialised Banks in Sri Lanka issued by the Monetary Board of the Central Bank of Sri Lanka under Section 76 J (1) of the Banking Act No. 30 of 1988 as amended.
The BITSC was established in order to ensure the Banks reliance over Information Technology and oversee the Bank’s strategic objectives in accordance with the Information and Communication Technology (ICT).
Role and responsibilities of the CommitteeEstablish and review Information Technology Governance Framework to ensure leadership support, organisational structure and Bank’s IT process, value delivery, IT risk management, resource management and performance management.
Ensure adequacy and effectiveness of Business Continuity Management and Disaster Recovery of Information Communication Technology systems of the Bank.
Ensure adequacy and effectiveness of Information Systems Security according to CBSL directions and international best practices.
Activities during the year 2017The Committee approved policies and procedures in order to enhance information technology infrastructure, enabling the banking functions more linked with the emerging technologies to ensure efficient and effective implementation over the strategies of the Bank. Moreover, the Committee foresees the need of customer’s data protection and ensures all necessary policies and procedures have been taken against the information security.
Committee evaluationThe Committee completed the evaluation process with self-assessment for the year 2017 and concluded that its performance was effective.
Aswin De SilvaChairman – Board Information Technology Strategy Committee
12 March 2018Colombo
Composition of the CommitteeThe Board Information Technology Strategy Committee (BITSC) comprised of three Non-Executive Directors and General Manager/CEO shall attend as invitee.
The following Directors have been functioning as members of BITSC whose profiles are given on the page 156 of this Annual Report.
Mr Aswin De Silva – ChairmanMr D L P R Abeyaratne – MemberMr Chandima Hemachnadra – Member
MeetingsThe quorum for a meeting is two ( 2) members. Attendance of the Committee members during the year is as follows:
Name Eligible to attend
Attended
Mr Aswin De Silva 5 5Mr D L P R Abeyaratne 5 2
Mr Chandima Hemachandra 5 5

201
National Savings Bank Annual Report 2017
Risk Management Report
The foremost among the challenges faced by the banking sector today is the challenge of understanding and managing the risk as it is an inherent part of all business and supportive activities. Thus the NSB’s overall objective is to manage its operations and the associated risks in a manner that balances serving the interests of its customers & investors and solvency.
Risk management function of the Bank requires to identify, assess, measure, aggregate & manage risks and to monitor optimum capital allocation among business operations.
Risk management framework is implemented in an integrated manner to cover a broad spectrum of economic and other main risk areas such as credit, market, liquidity, operational, compliance, reputation and strategic with controls and governance established for each area as appropriate. A comprehensive risk management framework is applied throughout the Bank with effective governance and corresponding risk mitigation tools.
The scope of risk management is not limited to the Bank, but also to the fully-owned subsidiary, NSB Fund Management Company. The subsidiary company engages in Primary Dealer functions. This report mainly elaborates risk management in the Bank considering the materiality of the Bank’s operation in the NSB Group. (Bank contributes 99.3% to consolidated assets and 97.5% to consolidated capital).
Material existing and emerging risks to the performance
Material existing and emerging risks would significantly affect the current and future performance of the Bank if crystallised, may cause deviation from the current prospects and adversely impact on the key performing areas such as profitability, liquidity and capital adequacy.
These risks can be identified as risks which would directly impact on specific principal risk or likely to impact on more than one principal risk. NSB considers Credit Risk, Market Risk, Operational Risk and Liquidity Risk as principal risks.
Existing risks in relation to micro and macro contexts are identified, assessed and mitigated/minimised within the risk management framework. Emerging risks can be new and unforeseen where potential loss is not fully known and the time horizon for realisation is extremely difficult to predict.
NSB keeps updating on emerging risks which are crucial to navigate the changing and complex risk environment. During the year 2017, to improve the risk assessment models, the Bank procured credit rating and scoring system which consist of credit rating and scoring models. Regulatory developments such as capital requirements under Basel III, foreign currency borrowing, financial derivatives and changes in tax laws may increase the pressure on the Bank to comply.
The role of risk management function will be reshaped with emerging trends such as broadening and deepening regulations, rising customer expectations due to advancement of technology, evolving advance analytics due to dynamic technology etc. These risks continued to grow across the banking industry due to unprecedented volatility in the environment and rapidly changing market conditions.
The Bank analyses the emerging risks to take necessary steps to manage the adversities to business results and financial conditions. This report discusses in detail existing principal and material existing and emerging risks and the Bank’s approach in management of such risks.
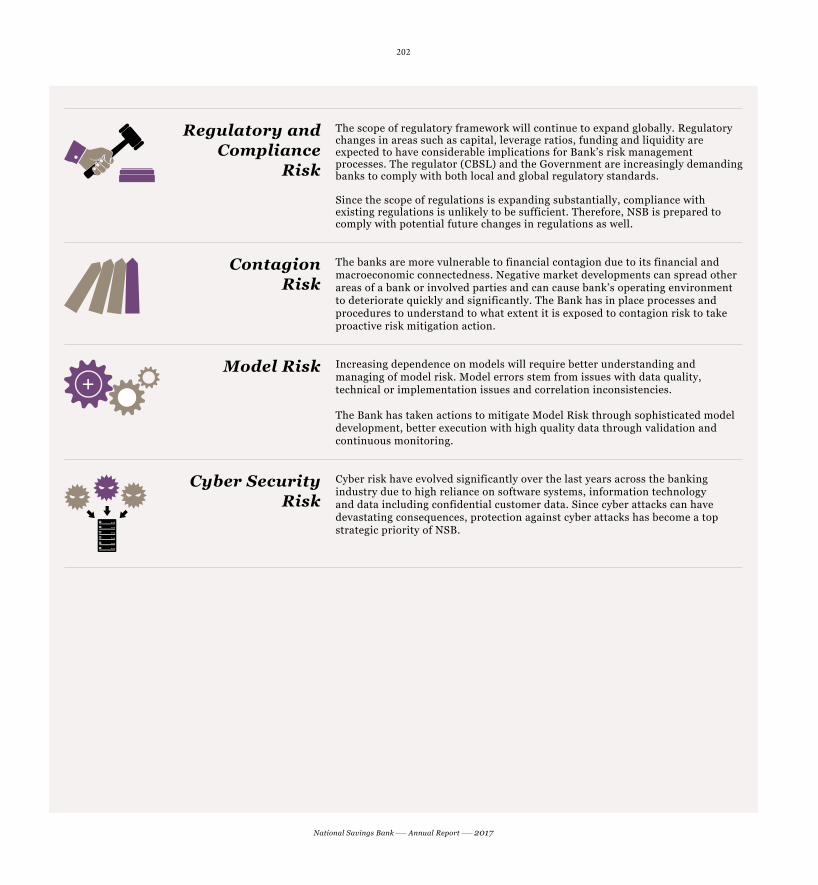
202
National Savings Bank Annual Report 2017
Regulatory and Compliance
Risk
The scope of regulatory framework will continue to expand globally. Regulatory changes in areas such as capital, leverage ratios, funding and liquidity are expected to have considerable implications for Bank’s risk management processes. The regulator (CBSL) and the Government are increasingly demanding banks to comply with both local and global regulatory standards.
Since the scope of regulations is expanding substantially, compliance with existing regulations is unlikely to be sufficient. Therefore, NSB is prepared to comply with potential future changes in regulations as well.
Contagion Risk
The banks are more vulnerable to financial contagion due to its financial and macroeconomic connectedness. Negative market developments can spread other areas of a bank or involved parties and can cause bank’s operating environment to deteriorate quickly and significantly. The Bank has in place processes and procedures to understand to what extent it is exposed to contagion risk to take proactive risk mitigation action.
Model Risk Increasing dependence on models will require better understanding and managing of model risk. Model errors stem from issues with data quality, technical or implementation issues and correlation inconsistencies.
The Bank has taken actions to mitigate Model Risk through sophisticated model development, better execution with high quality data through validation and continuous monitoring.
Cyber Security Risk
Cyber risk have evolved significantly over the last years across the banking industry due to high reliance on software systems, information technology and data including confidential customer data. Since cyber attacks can have devastating consequences, protection against cyber attacks has become a top strategic priority of NSB.

203
National Savings Bank Annual Report 2017
Credit Risk
Counterparty Default Risk
Concentration Risk
Settlement Risk
Market Risk
Residual Risk
Interest Rate Risk
Currency Risk
Equity Risk
Operational Risk Liquidity Risk
Statutory Liquidity Risk
Physical Liquidity Risk
Asset and Liability Management Risk
Information Security/IT Risk
Legal Risk
Compliance Risk
Fraud Risk
ReputationRisk
ModelRisk
RegulatoryRisk
StrategicRisk
BusinessRisk
Trend in Risk Categories High Medium Low
ContagionRisk
Cyber Security Risk
Figure 1: Material Existing and Emerging Risks based on Principal Risks
Integrated risk governanceOwnership and responsibility for risk management lies with all individuals engaged in business operations of NSB. Sound corporate governance principles coupled with the “Three Lines of Defence” model are entrenched to risk governance framework of the Bank.
Risk governance originates at the Board level and flows throughout the business functions of the Bank via risk appetite statement, policies, delegated authority and committee structures. This ensures the Board level oversight and clear segregation of duties between those who originate and those who approve risk exposures. The Board and its risk committees operate within the purview of their respective charters.
Risk Governance
Ownership
Responsibility
Ownership of risk identification, assessment, data and management within each of the lines of business functions
Acceptance of responsibility, including identification and escalation of risk issues by all individuals of the Bank
Figure 2: Bank’s Ownership and Responsibility for Risk Management

204
National Savings Bank Annual Report 2017
Board Board, through the risk oversight role ensures that Senior Management of the Bank has established an integrated framework to manage various risk exposures and to ensure internal policies are appropriately established and complied with.
The Board approves the Bank’s overall risk appetite and oversees its implementation while reviewing the same to ensure that it continues to be relevant to reflect all types of risks and market conditions.
Further, the Board ensures that sound internal control and assurance framework exists within the Bank and is responsible for taking necessary steps to foster a culture of risk awareness and risk adjusted decision-making.
BIRMC Board Integrated Risk Management Committee (BIRMC) assists the Board in fulfilling its risk related responsibilities to recommend an effective risk management framework to the Board. Key purposes of BIRMC is to establish risk appetite and recommend the Internal Capital Adequacy Assessment Process (ICAAP).
BIRMC monitors the Bank’s compliance with risk management framework. It reviews adequacy of all management level committees, significant correspondence with the regulator and the risk profile of the Bank.
BAC The policies and practices used by the Bank to manage risks are typically debated by the Board Audit Committee (BAC). It monitors the effectiveness and efficiency of internal control processes and internal audit function.
BAC ensures integrity of information, usage of appropriate accounting policies and monitor legal or regulatory compliance issues. It recommends interim and year-end financial statements to the Board for approval before publication. External Auditors report their findings to the BAC.
Management Committees
Management level committees, directly involved in managing the principal risks, include Credit Committee (CC), Asset and Liability Management Committee (ALCO), Investment Committee (IC) and Operational Risk Management Committee (ORMC).
Other management committees such as IT Steering Committee, Corporate Management Committee (CMC), Operational Performance Review Committee (OPRC), Marketing Committee (MC), Product Development Committee (PDC), Human Resource Committee (HRC), Action Plan Review (APR), IT Review and Card Centre (ITR and CC) manage material risks to the Bank from people, processes, systems and external risk drivers.
NSB has introduced improvements essential to strengthen the risk management framework to evaluate, monitor and manage principal and material risks assumed in the course of its operations. Risk management policies, procedures and systems of the Bank are established in line with the guidelines issued by the CBSL and the international best practices introduced by BASEL.
Risk Management Policy Framework consists of the following:
Integrated Risk Management Policy Credit Risk Management Policy Market and Liquidity Risk Management Policy Operational Risk Management Policy Risk Management Disclosure Policy Stress Testing Policy ICAAP Policy
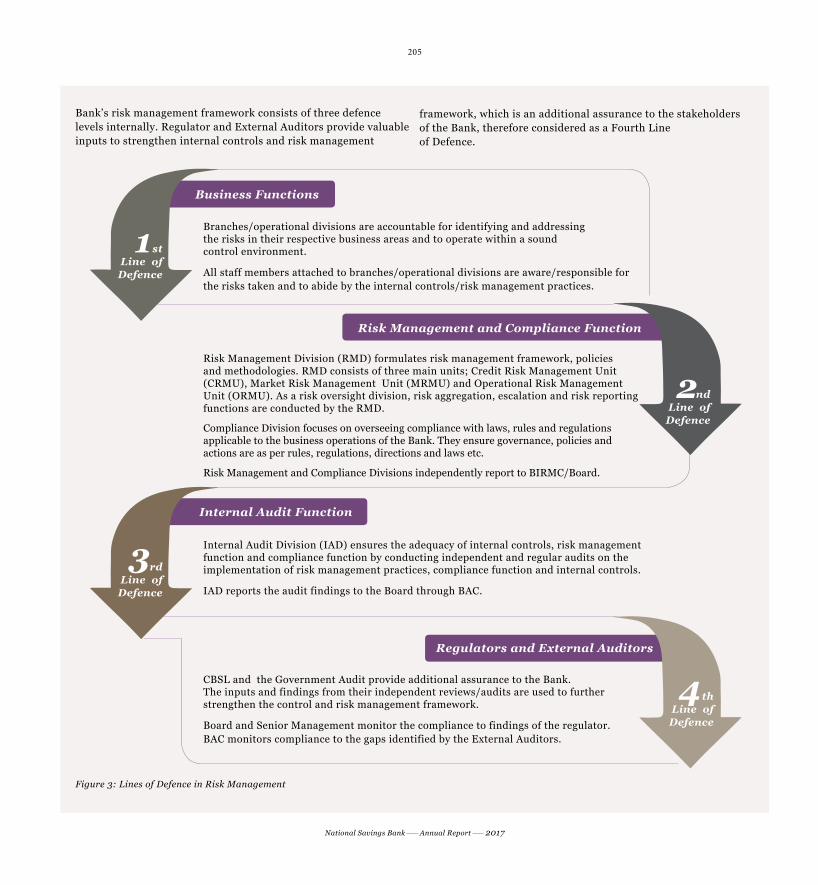
205
National Savings Bank Annual Report 2017
Bank’s risk management framework consists of three defence levels internally. Regulator and External Auditors provide valuable inputs to strengthen internal controls and risk management
Branches/operational divisions are accountable for identifying and addressing the risks in their respective business areas and to operate within a sound control environment.
All staff members attached to branches/operational divisions are aware/responsible for the risks taken and to abide by the internal controls/risk management practices.
Risk Management Division (RMD) formulates risk management framework, policies and methodologies. RMD consists of three main units; Credit Risk Management Unit (CRMU), Market Risk Management Unit (MRMU) and Operational Risk Management Unit (ORMU). As a risk oversight division, risk aggregation, escalation and risk reporting functions are conducted by the RMD.
Compliance Division focuses on overseeing compliance with laws, rules and regulations applicable to the business operations of the Bank. They ensure governance, policies and actions are as per rules, regulations, directions and laws etc.
Risk Management and Compliance Divisions independently report to BIRMC/Board.
CBSL and the Government Audit provide additional assurance to the Bank. The inputs and findings from their independent reviews/audits are used to further strengthen the control and risk management framework.
Board and Senior Management monitor the compliance to findings of the regulator. BAC monitors compliance to the gaps identified by the External Auditors.
Internal Audit Division (IAD) ensures the adequacy of internal controls, risk management function and compliance function by conducting independent and regular audits on the implementation of risk management practices, compliance function and internal controls.
IAD reports the audit findings to the Board through BAC.
stLine of
Defence
1
ndLine of
Defence
2
thLine of
Defence
4
rdLine of
Defence
3
Risk Management and Compliance Function
Internal Audit Function
Regulators and External Auditors
Business Functions
Figure 3: Lines of Defence in Risk Management
framework, which is an additional assurance to the stakeholders of the Bank, therefore considered as a Fourth Line of Defence.

206
National Savings Bank Annual Report 2017
Risk appetite
Risk Appetite Statement is a key component of the risk management framework. Risk appetite is the level of risk the Bank desires to take when achieving objectives. It reflects the key aspects of business and stakeholder expectations.
Risk appetite is an integral element of NSB’s business planning process. Risk Appetite Statement of the Bank enhances value by aligning business operations and risks. It facilitates the staff at business divisions to understand the level of risk they are prepared to take in pursuit of daily business operations, so that they can take more risk-aware decisions.
The Bank uses top-down approach in setting risk appetite at corporate level using qualitative and quantitative parameters that minimise adverse impacts to the Bank’s values and financial condition. Quantitative risk appetite at corporate level focuses mainly on capital adequacy, liquidity, profitability and other prudential requirements.
Strategic Business Plan and Budget 1
Statement and Limits
Articulate Risk Appetite 2
3
4Monitor and R
epor
t
C
ontro
l an
d M
itig
ate
Figure 4: Implementing Risk Appetite Framework
The qualitative statements mainly include risks for which the Bank has zero risk appetite. At business line level, risk appetite limits are by risk types namely Credit, Equity, Interest Rate, Forex and Operational.
Convergence of top-down and bottom-up approach is used at divisional and product line level to set more prudent risk appetite levels using Limit Structures, Budgeted levels and Key Operational Risk Indicators (KORIs).
NSB’s Risk Appetite Statement is approved by the Board of Directors on an annual basis or more frequently in the event of unexpected changes to the risk environment, with the aim of ensuring that they are consistent with the Bank’s business strategy, regulatory environment and stakeholders’ requirements. The Board has the ultimate responsibility to manage risks within the risk appetite levels and has delegated the responsibility to BIRMC.
Risk Appetite Dash Board – Corporate Level
[ % ]
Tier 1 Total Capital
SLAR LCR ROE ROA
Actual Position Risk Tolerance
11.93
7.7511.75
20 100
1.35
2815.31 1.46
26.52
37673.44
Capital Adequacy Liquidity Profitability
Figure 5
RMD monitors actual performance against qualitative and quantitative risk appetite parameters and reports to BIRMC/Board.
Risk appetite of the Bank permits accepting credit, market and operational risks as a part of its business operations. These principal risks are managed within the levels defined in the Risk Appetite Framework.

207
National Savings Bank Annual Report 2017
Credit risk Credit risk is the risk of potential financial loss resulting from the failure or delaying of a customer or a counterparty to a financial instrument to honour its financial or contractual obligations to the Bank.
The Bank is exposed to credit risk both from on-balance sheet credit exposures; principally the loans & receivables and investments in debt securities and off-balance sheet credit exposures such as letters of credit, guarantees etc. Credit risk comprises counterparty default risk, concentration risk, settlement risk and residual credit risk.
On and Off Balance Sheet Exposure
[ % ]
100
80
60
40
20
0
On Balance Sheet Off Balance Sheet
2017
4.2%
95.8%
2016
7.0%
93.0%
Figure 6
As at 31 December
Maximum exposure
2017Rs. ’000
Maximum exposure
2016Rs. ’000
Change%
Cash and cash equivalents 3,849,627 4,619,699 (17)Placements with banks 23,438,104 19,013,572 23Derivative financial instruments 1,360,714 2,728,445 (50)Other financial assets – Held for Trading (HFT) 6,472,314 20,290,588 (68)Loans and receivables to banks 27,714,565 31,834,072 (13)Loans and receivables to other customers 360,309,866 291,976,942 23Financial assets – Available for Sale (AFS) 5,693,829 6,227,764 (9)Financial assets – Held to Maturity (HTM) 544,273,077 505,824,398 8On-balance sheet exposure 973,112,096 882,515,480 10Off-balance sheet exposure 17,060,099 24,501,480 (30)Credit exposure 990,172,195 907,016,960 9
Table 1: Maximum Credit Risk Exposure
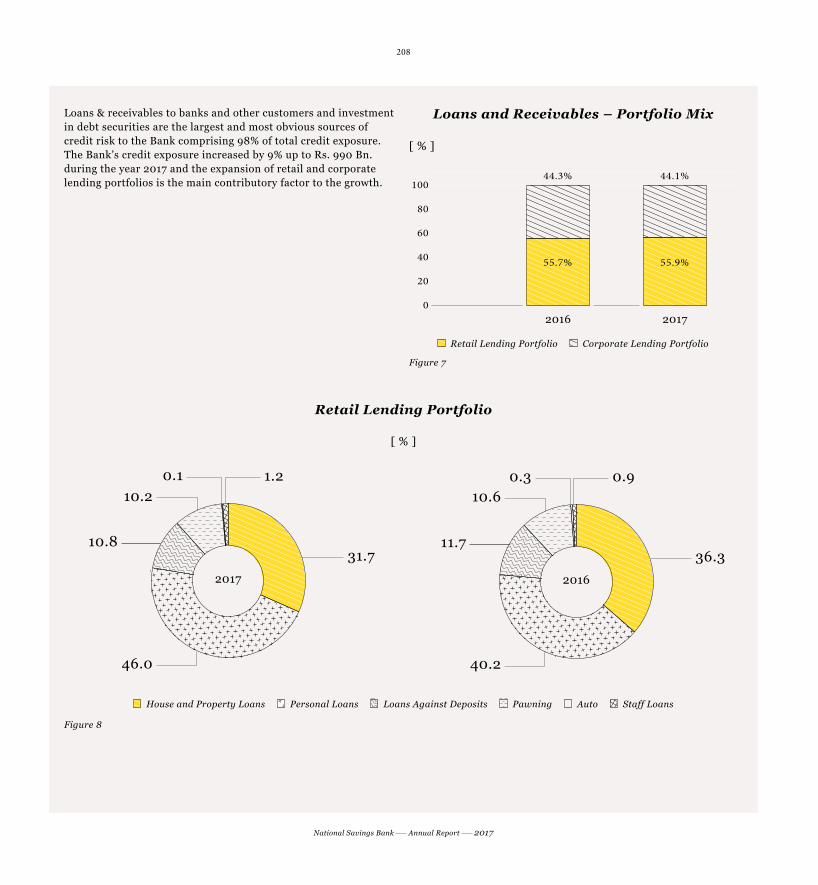
208
National Savings Bank Annual Report 2017
Loans & receivables to banks and other customers and investment in debt securities are the largest and most obvious sources of credit risk to the Bank comprising 98% of total credit exposure. The Bank’s credit exposure increased by 9% up to Rs. 990 Bn. during the year 2017 and the expansion of retail and corporate lending portfolios is the main contributory factor to the growth.
Retail Lending Portfolio
[ % ]
House and Property Loans Personal Loans Loans Against Deposits Pawning Auto Staff Loans
10.8
46.0
0.1 1.210.2
31.72017
11.7
40.2
0.3 0.910.6
36.32016
Figure 8
Loans and Receivables – Portfolio Mix
[ % ]
100
80
60
40
20
0
Retail Lending Portfolio Corporate Lending Portfolio
2016
44.3%
55.7%
2017
44.1%
55.9%
Figure 7

209
National Savings Bank Annual Report 2017
Corporate Lending Portfolio
[ % ]
Corporate Loans – SOEs and GOSL Loans to Banks Corporate Loans-Other Other Instruments
29.4
13.3
6.4
50.92017 25.0
18.7
7.6
48.72016
Figure 9
Risk review
Risk Component Description Monitoring/Management tools Exposure Impact*
Counterparty default risk
Possible impact due to failure of counterparties to meet contractual obligations with the Bank according to the agreed terms.
Monitoring of early warning indicators, NPA trends
Loan Review Mechanism (LRM)High Moderate
Concentration risk Uneven distribution of counterparties in credit to an industry sector or geographical region.
Herfindahl – Hirschman Index (HHI) Limit monitoring Stress testing
Moderate Moderate
Settlement risk Possible impact due to failure of delivering on the terms of a contract at the time of settlement.
Credit rating/scoring, stress testing Limit monitoring Moderate Low
Residual risk Possible impact from remaining risks after all other risks have been eliminated, hedged or otherwise accounted.
Collateralisation Monitoring of valuation/revaluation Monitoring of Loan to Value (LTV) ratios
Moderate Low
* Possible impact on earnings and capital in a high stress situation
Table 2: Credit Risk Review

210
National Savings Bank Annual Report 2017
Counterparty default risk
Counterparty default risk, the most significant element of credit risk is the risk that counterparties fail to meet contractual obligations with the Bank according to the agreed terms.
Robust and stringent credit risk management practices for mitigating counterparty default risk are evident from the well managed Non-Performing Loan (NPL) ratio of the Bank over the past few years. The Bank further improved the gross NPL ratio from 2.6% in 2016 to 1.34% in 2017.
Loan Amount vs NPL
[ Rs. Billion ] [ % ]
450
360
270
180
90
0
10
8
6
4
2
020172016201520142013
Loan Amount (Rs. Billion) NPL (%)
Figure 10
Age Analysis of NPL
[ % ]
75
60
45
30
15
0Q1 Q1 Q1Q2 Q2 Q2Q3 Q3 Q3Q4 Q4 Q4
2015 2016 2017
3 months>Special Mention<6 months 6 months>Sub Standard<12 months 12 months>Doubtful<18 months 18 months>Loss
Figure 11
Concentration risk
Concentration risk in credit arises when a number of counterparties or exposures with comparable economic characteristics or such counterparties are engaged in similar activities or operate in the same geographical areas or industry sectors so that their collective ability to meet contractual obligations are uniformly affected by changes in economic, political or other conditions.
To assess the concentration in the credit portfolio, NSB uses the HHI. The Bank has a moderate risk appetite towards sector concentration considering contribution to achieve the development goals of the Government. High geographical concentration to the Western Region is due to all large loans being booked at the Head Office Credit Division.
The Bank has taken measures such as monitoring portfolio concentration limits and stress testing to manage concentration risk.

211
National Savings Bank Annual Report 2017
Geographical Concentration
[ % ]
Central Province Eastern Province North Central Province North Western Province Northern Province Sabaragamuwa Province Southern Province Uva Province Western Province
70.2
5.11.7
3.25.2
2.43.8
4.93.5
2017 71.6
4.81.5
2.75.0
2.33.8
4.93.42016
Figure 12
Sector Concentration
[ % ]
Agriculture and fishing Tourism Transport Construction Financial and Business Services Infrastructure Other Services Pawning Other Customers
38.4
3.1
4.40.3
18.0
5.8
21.8
8.2
2017 201635.1
3.5
4.0
20.6
7.7
21.8
7.3
Figure 13

212
National Savings Bank Annual Report 2017
Settlement risk
Settlement risk is the risk that a counterparty to a transaction will fail to deliver on the terms of a contract at the time of settlement. This risk can associate with defaults, along with any timing differences in settlement between the two parties.
Usually settlement risk arises when settlement in a transfer system does not take place as expected. This happens because one party defaults on its clearing obligations to one or more counterparties.NSB has established a comprehensive limit framework to monitor settlement risk.
Residual risk
Strong control mechanism and risk mitigation techniques are incorporated to risk governance framework in order to maintain the residual risk at an acceptable level considering cost and time consumption for mitigating such risks.
Robust internal controlling environment comprising risk mitigation processes and procedures such as collateralisation, maintenance of LTV ratios as per the Retail Credit Policy (RCP) and stringent recovery actions ensure that residual risk of the Bank is managed within the risk appetite.
Further, the Bank measures credit risk using prudential ratios and in terms of capital allocation under Standardised Approach. From the total credit exposure more than 69.4% are risk weighted at 0% and only 3.7% are risk weighted at 100% or above under Standardised Approach.
Credit Risk is monitored through the risk appetite limit framework and delegated authority limits of the Bank. Credit risk is managed through a robust risk governance framework with clear and consistent policies and guidelines.
Governance Structure
Cre
dit
Ris
k M
an
ag
emen
t
KRI Analysis and Reporting
Stress Testing
Capital Computation for Credit Risk
LRM
Retail Credit
Portfolio Analysis and Monitoring
Corporate Credit
Rating Validation
Cre
dit
Ris
k G
ove
rna
nce
Board of Directors
Credit Committee (CC)
Investment Committee(IC)
Asset and Liability Management Committee (ALCO)
Board Integrated Risk Management Committee (BIRMC) Board Credit Committee (BCC)
Credit Risk Management Policy and Risk Appetite Framework
Figure 14: Credit Risk Governance Structure

213
National Savings Bank Annual Report 2017
Credit risk governance stems from the Board and cascades through different layers of management providing cohesive credit risk governance to delineate the responsibilities and control of the credit risk management.
The Board provides the oversight on credit risk exposure via the credit risk strategy which outlines the risk appetite and limit structure, credit risk management policies, delegated authority limits and committee structure of the Bank.
Senior Management has the responsibility for implementing the credit risk strategy approved by the Board and for developing policies and procedures for identifying, measuring, monitoring and controlling the credit risk.
Board has delegated the credit risk management oversight responsibility to BIRMC and BCC, which is further reinforced by the senior management level committees i.e. CC and IC.
CRMU of RMD is accountable to monitor and manage credit risk within the risk appetite and policy framework of the Bank. The responsibilities of CRMU include:
Renew/update policies. Develop and maintain quantitative risk models. Risk appetite limit monitoring. Credit risk review at transaction and portfolio level. Conduct LRM. Monitor Key Risk Indicators (KRIs) and early warning indicators.
Report to CC, IC and Board through BIRMC.
Credit risk management process
Effective management of credit risk is a critical component of a comprehensive risk management approach and essential for the long-term success of any bank.
The goal of credit risk management of NSB is to maximise the Bank’s risk adjusted rate of return by maintaining credit quality and credit risk exposure within the risk appetite levels.
The Bank exerts a set of risk management tools and techniques to manage the credit risk inherent at portfolio level as well as at transaction level.
During the year 2017, the Bank has taken initiatives to further strengthen the credit risk management by:
Formulating a BCC to strengthen the oversight function of the Board towards credit operation and credit risk management.
Established a dedicated Credit Administration Unit to independently handle retail credit administration functions.
Implementation of an internal risk rating and scoring systems to strengthen and standardise credit evaluation with a view to promote risk based pricing decisions.
Risk rating
The Bank uses credit rating to assess the creditworthiness of counterparties. Creditworthiness is assessed using internal rating models which consist of qualitative and quantitative risk parameters assessing the obligor and facility risk and assign with a rating grade from a scale of nine internal rating grades. External ratings are also considered together with internal rating as an endorsement until undertaking a comprehensive validation of the internal rating for corporate lending. The Bank uses credit scoring to assess the creditworthiness in retail lending. All customers are mapped to a scoring scale of eight considering the creditworthiness and risk. This system is implemented across the branch network covering all the retail loan products of the Bank. The Bank considers the credit score as the single depiction of creditworthiness and risk from retail counterparty to a specific product. The system acts as a facilitator to streamline the credit approval and risk based pricing.
Collateral management and valuation
The Bank accepts collateral to secure credit facilities and considers sufficient value at liquidation to fully cover the principal, interest, legal charges and other charges.
The Bank has defined security cover limits for credit facilities granted against immovable properties. All immovable properties are valued by panel valuers. Panel of professional valuers are obliged to take all standard valuation criteria for valuation and revaluation of immovable properties. Policy on Valuation and Revaluation of Immovable Property of the Bank is set based on the guidelines issued by the CBSL.

214
National Savings Bank Annual Report 2017
CRMU monitors the revaluation due loans as early warning indicator to take immediate actions to mitigate risk. Further, LTV ratio of immovable property, pawning and cash backed lending are monitored and report to the CC.
In the year 2017, 78% of the loan portfolio was backed by immovable properties with LTV ratio of less than 50%.
Loan Portfolio – Collateral Wise
[ % ]
Cash Gold Immovable Property Movable Property Treasury Guarantee Corporate Guarantee Personal Guarantee Other
22.6
14.2
27.9
6.7
6.3
20.3
2.0
2017 26.5
10.8
30.0
6.2
6.2
17.9
2.5
2016
Figure 15
As at 31 December 2017 2016
Rs. ’000Composition
(%) Rs. ’000Composition
(%)
LTV ratioLess than 50% 51,515,268 78.5 48,438,163 78.351-75% 12,160,610 18.5 11,334,198 18.3More than 75% 1,988,195 3.0 2,110,331 3.4
65,664,073 100.0 61,882,692 100.0
Table 3: LTV Distribution of Loans backed by Immovable Property
Loan review mechanism
The Bank uses LRM as an effective tool to mitigate the credit risk by prompt identification and rectification of gaps in credit granting and documentation process. This process ensures quality assurance of the credit process and the credit quality.
The Bank’s LRM process ensures covering of credit operation at Head Office and branch level and CRMU reviews high value loans within three months of sanction and reports to the CC.

215
National Savings Bank Annual Report 2017
Impairment provision
Impairment provision of the Bank is calculated according to the Sri Lanka Accounting Standards based on the incurred loss methodology. Provision for collective impairment has increased by 33% compared to the previous year despite the improvement in credit quality. Provision cover for the year 2017 is 46% which is in line with the internal limits.
In 2018, SLFRS 9 will have the first direct touch on income statements of banks, making the balance sheet assets and liabilities to represent the fair value with the expectation to improve the transparency of the financial reporting. This will increase loan loss provisions due to identifying of expected loan losses in the financial statements. This will drive financial statements into forward looking rather than historical reporting.
NPL vs Impairment Provision
[ Rs. Billion ] [ % ]
20
16
12
8
4
0
50
40
30
20
10
020172016201520142013
Impairment Provision (Rs. Billion) Non-Performing Loans (Rs. Billion) Provision Cover (%)
Figure 16
Risk transfer
The Bank uses insurance as a risk transfer strategy which involves in a contractual shift of risk to an insurer. The Bank uses Decreasing Term Assurance (DTA) as an additional cover for loan repayments considering the creditworthiness of the borrower. Further, title insurance and fire insurance are also used to transfer the risk in both retail and corporate lending backed by immovable property.
Scenario analysis and stress testing
The Bank uses scenario analysis and stress testing to assess the credit risk to the Bank from unforeseen events of varying severity due to adverse economic, political and physical changes in the environment. Stress test for credit risk assesses the impact of an economic downturn on the Bank’s capital adequacy position under Basel III. This test assesses the increased level of Probability of Default (PD). This could have a two way impact. The Bank’s risk weighted assets will increase due to deterioration in asset quality along with additional provisioning requirements.
ParticularsImpact on Total Capital Adequacy Ratio
Favourable/(Adverse) (%) Low Medium High
Credit Risk – Increase in PD due to an economic down-turn (Low 10% – Medium 20% – High 30%)
(0.12) (0.24) (0.36)
Table 4: Stress Testing-Credit Risk
Market riskMarket risk is the risk that the value of both on-balance sheet and off-balance sheet financial assets and liabilities will fluctuate as a result of market price changes, regardless of whether these price changes are originated by factors typical for individual instruments or their issuer or counterparty or by factors pertaining to all the instruments traded on the market. Hence, the market risk is connected with the price instability on four main economic markets i.e. Debt security market, Stock market, Currency market and Commodity market.
Price fluctuations in these markets result in interest rate risk, equity price risk, foreign exchange risk and commodity price risk in both trading and banking book.
The Bank has no direct exposure for commodity price risk as the Bank has no investments in commodities. However, changes in world commodity prices such as gold prices and crude oil prices indirectly affect the Bank’s business activities.
Unfavourable movements in interest rates, equity prices and exchange rates cause decline of market value of financial instruments, actual & effective earnings and future cash flows of a portfolio of financial instruments.

216
National Savings Bank Annual Report 2017
As at 31 December 2017 Rs’000 (Audited)
Primary marketRisk factor
Carrying amount Market risk measurements
Trading portfolio Non-trading portfolio
Assets subject to market risk
Cash and cash equivalents IRR* 3,849,627 – 3,849,627
Placements with banks IRR, FX** 23,438,104 – 23,438,104
Derivative financial instruments FX 1,360,714 1,360,714 –
Other financial assets Held for Trading (HFT) IRR, Equity 6,472,314 6,472,314 –
Loans and receivables to banks IRR 27,714,565 – 27,714,565
Loans and receivables to other customers IRR 360,309,866 – 360,309,866
Financial investments – Available for Sale (AFS) IRR, Equity 5,693,829 5,693,829 –
Financial investments – Held to Maturity (HTM) IRR 544,273,077 – 544,273,077
973,112,096 13,526,857 959,585,239
Liabilities subject to market risk
Due to banks IRR 180,439 – 180,439
Derivative financial instruments FX 956,937 956,937
Due to other customers IRR 737,212,640 – 737,212,640
Other borrowings IRR, FX 217,955,777 – 217,955,777
Subordinated liabilities IRR 6,006,411 – 6,006,411 962,312,204 956,937 961,355,267
Table 5: Market Risk Exposure* Interest Rate Risk** Foreign Exchange Risk
The Bank has a mandatory requirement to hold 60% of the deposits in Government Securities. In the year 2017, the Bank held 67% of deposits and 49% of total assets in Government Securities (Trading and Banking Book) exposing the Bank to interest rate risk due to the fluctuations in Government Securities market.
Equity is relatively a small part of the Bank’s total investments where 53% of equity is in trading investments and 47% in strategic investments. The Bank’s total equity investments were below 1% of total assets in year 2017.
The Bank’s foreign currency operations include foreign currency trading, accepting deposits, remittances, lending, placements, derivatives and settlement of obligations due to USD bond issues.
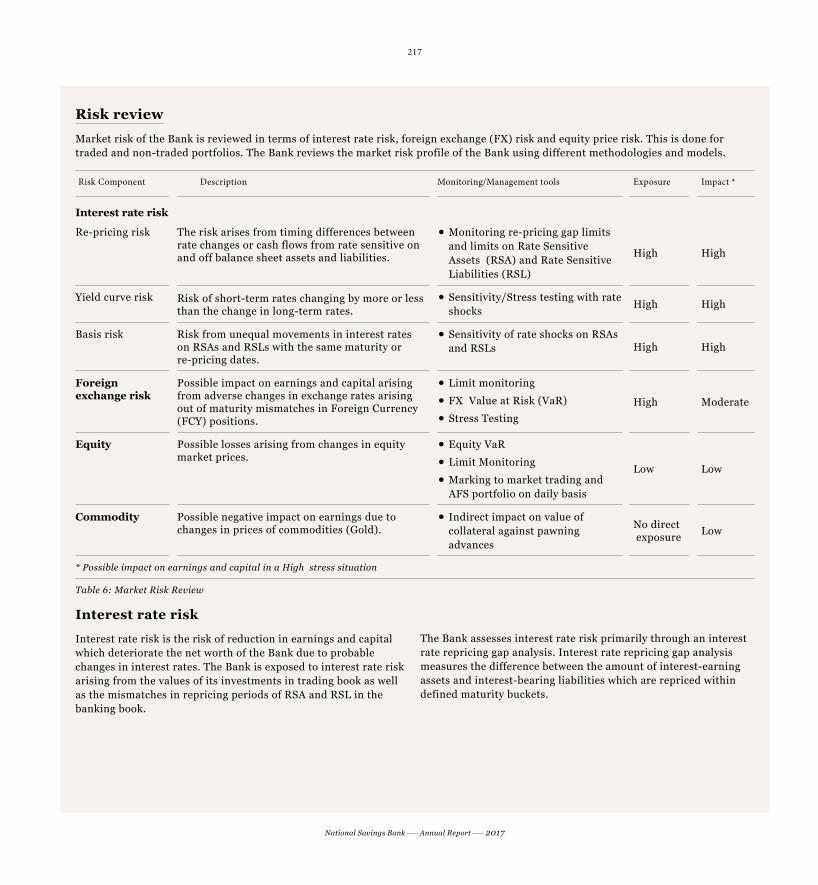
217
National Savings Bank Annual Report 2017
Risk review
Market risk of the Bank is reviewed in terms of interest rate risk, foreign exchange (FX) risk and equity price risk. This is done for traded and non-traded portfolios. The Bank reviews the market risk profile of the Bank using different methodologies and models.
Risk Component Description Monitoring/Management tools Exposure Impact *
Interest rate risk
Re-pricing risk The risk arises from timing differences between rate changes or cash flows from rate sensitive on and off balance sheet assets and liabilities.
Monitoring re-pricing gap limits and limits on Rate Sensitive Assets (RSA) and Rate Sensitive Liabilities (RSL)
High High
Yield curve risk Risk of short-term rates changing by more or less than the change in long-term rates.
Sensitivity/Stress testing with rate shocks
High High
Basis risk Risk from unequal movements in interest rates on RSAs and RSLs with the same maturity or re-pricing dates.
Sensitivity of rate shocks on RSAs and RSLs High High
Foreign exchange risk
Possible impact on earnings and capital arising from adverse changes in exchange rates arising out of maturity mismatches in Foreign Currency (FCY) positions.
Limit monitoring FX Value at Risk (VaR) Stress Testing
High Moderate
Equity Possible losses arising from changes in equity market prices.
Equity VaR Limit Monitoring Marking to market trading and AFS portfolio on daily basis
Low Low
Commodity Possible negative impact on earnings due to changes in prices of commodities (Gold).
Indirect impact on value of collateral against pawning advances
No direct exposure Low
* Possible impact on earnings and capital in a High stress situation
Table 6: Market Risk Review
Interest rate risk
Interest rate risk is the risk of reduction in earnings and capital which deteriorate the net worth of the Bank due to probable changes in interest rates. The Bank is exposed to interest rate risk arising from the values of its investments in trading book as well as the mismatches in repricing periods of RSA and RSL in the banking book.
The Bank assesses interest rate risk primarily through an interest rate repricing gap analysis. Interest rate repricing gap analysis measures the difference between the amount of interest-earning assets and interest-bearing liabilities which are repriced within defined maturity buckets.

218
National Savings Bank Annual Report 2017
<1 monthRs. Mn.
1-3 monthRs. Mn.
3-6 monthRs. Mn.
6-12 monthRs. Mn.
1-3 yearRs. Mn.
3-5 yearRs. Mn.
>5 yearRs. Mn.
RSA 24,624 30,922 61,835 199,780 178,933 155,174 310,219RSL 199,861 256,153 129,752 316,234 47,012 10,138 2,206Period GAP (RSA-RSL) (175,237) (225,231) (67,917) (116,454) 131,921 145,036 308,013Cumulative Gap (175,237) (400,468) (468,385) (584,839) (452,918) (307,882) 131Actual gap as a percentage of RSL – 2017 (88%) (88%) (52%) (37%) 281% 1,431% 13,966%Actual gap as a percentage of RSL – 2016 (74%) (89%) (32%) (64%) 76% 1,111% –
Table 7: Interest Rate Sensitivity Analysis
Interest rate risk in trading book
Government Securities trading and AFS portfolio consist of Treasury Bonds and Treasury Bills which at the end of the year amounted to Rs. 4.2 Bn. and Rs. 1.2 Bn. respectively. Interest rate risk in Government Securities trading portfolio is assessed through mark-to-market valuation of the portfolio. Further, portfolio duration is monitored on a quarterly basis.
Interest Rate Risk in Banking Book (IRRBB)
Main aspect of the banking book related to market risk management principally involves in minimising the potential adverse effect of interest rate movements on earnings such as net interest income and the economic value of equity. This risk results from different repricing characteristics of banking book assets and liabilities.
Equity risk
Equity risk refers to the risk that NSB’s investments will depreciate due to stock market dynamics exposing the Bank to potential variation in income and reserves. The Bank is exposed to equity position risk from its investments in listed and unlisted equity instruments both ordinary shares and in unit trusts.
The Bank’s listed equity portfolio comprises both trading and AFS portfolios and the extent of investment in equities is wedged by its limit structure and by its Investment Policy Statement (IPS).
2017 2016 Unrealised gain/(loss)
Rs. ’000
Book valueRs. ’000
Market valueRs. ’000
Book valueRs. ’000
Market valueRs. ’000
Trading Portfolio 3,521,949 2,357,336 4,533,006 3,095,911 (738,575)AFS Portfolio 3,107,875 4,440,951 2,753,905 4,123,733 317,218Total 6,629,824 6,798,287 7,286,911 7,219,644 (421,357)
Table 8: Equity Portfolio Position

219
National Savings Bank Annual Report 2017
During the year under review, stock market was active and witnessed an improved local and foreign investor sentiment towards investments in listed equities. Accordingly, main indices namely ASPI and S&P SL 20 improved by 2% and 5% respectively reaping a favourable return on the Bank’s equity investments. During the year, the Bank realised Rs. 225.9 Mn and Rs. 297.1 Mn. as capital gains and dividends from equity investments (excluding unlisted investments) which are significantly higher than that of recorded in previous year.
Year 2017 was full of Right issues and debenture issues of Banks & Financial Institutions (B & FI) to raise capital in comply with Basel III capital requirement. Thus, the improved investor interest towards the high liquid B & FI shares were appreciated during the year 2017 and reported mark-to-market gains.
Equity Portfolio Composition
[ % ]
60
48
36
24
12
0Market Value 2017Book Value 2017
Listed Equity Trading Unit Trusts Listed Equity AFS Unlisted Equity
Figure 17
Portfolio Return Vs Market Returns
[ % ]
15
10
5
0
-5
-10Q4
2017Q3
2017Q2
2017Q4
2016Q1
2017Q3
2016
Return on S&P SL 20 NSB Portfolio Return Return on ASPI
Figure 18
Foreign Currency Risk
FX risk is the risk that an asset or investment and transactions denominated in a foreign currency will loose value as a result of unanticipated and unfavourable fluctuations in exchange rates. During 2017, USD/LKR average rate fluctuated in the range of Rs. 149.81-153.70 (Source: CBSL). The rupee depreciation was 2.3% for the year.
The Bank expanded its foreign currency operations with the regulatory approval for trading and other business operations.
The issuance of USD denominated bonds totaling to USD 1,000 Mn. increased the foreign currency exposures of the Bank. Foreign currency risk in capital redemption is covered via SWAP agreements with the CBSL and investments in Sri Lanka Development Bonds (SLDB) and USD lending to SOEs which will facilitate the bullet payments due in 2018 and 2019 respectively.

220
National Savings Bank Annual Report 2017
Currency <1 month Rs. ’000
1-3 month Rs. ’000
3-6 month Rs. ’000
6-12 month Rs. ’000
1-3 year Rs. ’000
>3 year Rs. ’000
Total Rs. ’000
USD 69,623,008 1,669,527 4,672,413 (22,577,603) (38,257,264) – 15,130,081EURO (262,453) 405,044 350,989 307,925 – – 801,505GBP (122,887) 364,061 217,589 (371,954) – – 86,809SGD 75 – – – – – 75AUD (53,672) 77,254 238,141 (215,090) – – 46,633JPY (121) – – – – – (121)
Table 9: Foreign Currency Maturity Gaps
FX risk is associated with the un-hedged position in all the foreign currencies. The Bank, under Standardised Measurement Approach (SMA) allocates capital for foreign currency risk considering the Net Foreign Currency Exposure (NFCE). Daily Net Open Position
(NOP), which is one of the main indicators of foreign currency risk in treasury operations are monitored and properly adhered throughout the year with no or limited exceptions which are approved by relevant authorities.
Daily NOP Against Internal Limit
[ USD '000 ]
5,000
4,000
3,000
2,000
1,000
0
-1,000
-2,000
Internal Limit NOP
2017
Dec.Nov.Oct.Sep.Aug.
Figure 19

221
National Savings Bank Annual Report 2017
Governance structure
The Bank is equipped with prudent and independent market risk governance framework which is an integral part of the risk management of the Bank. Market risk governance is a principal responsibility of the Board and management committees of the Bank.
The Bank’s market risk appetite, principles, policies, procedures, controls and reporting are fully in line with regulations and industry best-practices, to manage the impact of market risk factors on the Bank’s profitability, capital levels and the risk profile.
ALCO is the apex committee at management level, responsible for managing the balance sheet within the performance/risk parameters based on the risk appetite of the Bank. The IC appraises the Board of Directors by recommending actions if considered necessary or desirable to invest or divest the Bank’s investment portfolio or part of it in order to manage the risk in investments.
MRMU of the RMD is responsible for providing with a clear and comprehensive understanding of the market risks to the Board, BIRMC and the Senior Management. The responsibilities of MRMU include;
Update policies Develop and maintain quantitative risk models Monitor treasury operations, exposures and position limits against the risk appetite and treasury limits
Conduct daily reviews and analysis of trading portfolios Monitor material risk exposures at transaction and portfolio level
Treasury Middle Office (TMO) which is a part of MRMU, functions independently from the Bank’s Treasury Front Office (TFO) and Treasury Back Office (TBO) to monitor, measure, analyse and report inherent risk and trading risk in treasury operations of the Bank against pre-defined limits on a daily basis. The observations are directly reported to the IC, ALCO and to the Board providing an independent opinion.
Ma
rket
Ris
k G
ove
rna
nce
Board of Directors
Investment Committee (IC) Asset and Liability Management Committee (ALCO)
Board Integrated Risk Management Committee (BIRMC)
Market and Liquidity Risk Management Policy and Risk Appetite Framework
Ma
rket
Ris
k M
an
ag
emen
t
Model Development, Validation and Back Testing
Risk Measurement Analysis and Reporting/Dashboard
Treasury Limit Monitoring and Internal Control
Capital Computation for Market Risk
Stress Testing/Scenario Analysis
Treasury Middle Office
Trading Book
Risk Appetite and Limits
Banking Book
Figure 20: Market Risk Governance Structure
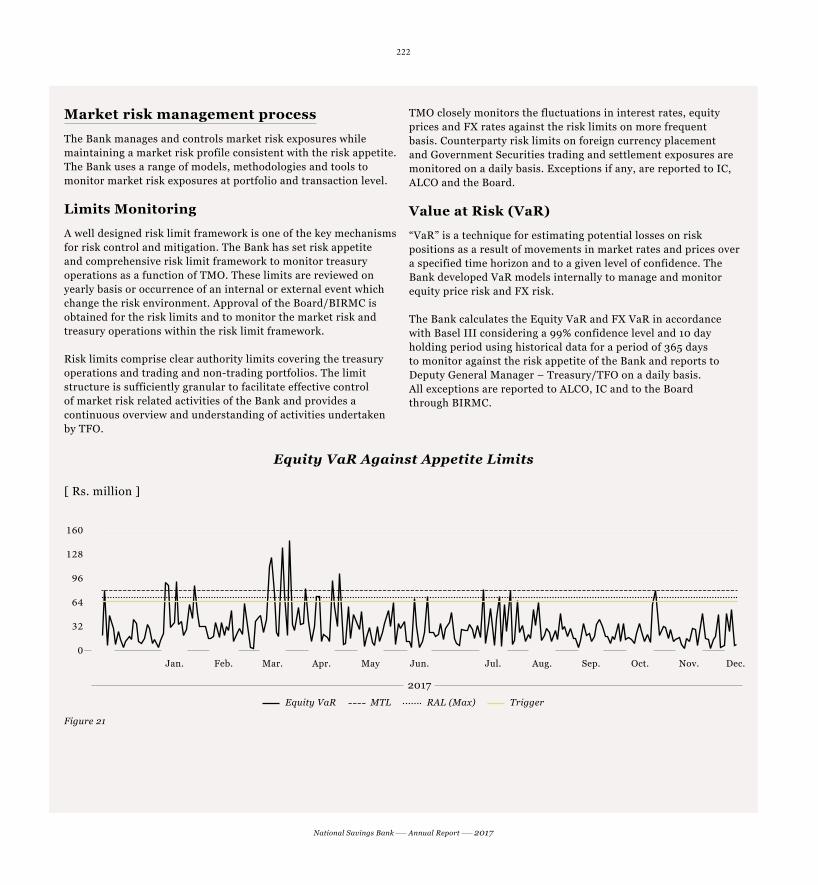
222
National Savings Bank Annual Report 2017
Market risk management process
The Bank manages and controls market risk exposures while maintaining a market risk profile consistent with the risk appetite. The Bank uses a range of models, methodologies and tools to monitor market risk exposures at portfolio and transaction level.
Limits Monitoring
A well designed risk limit framework is one of the key mechanisms for risk control and mitigation. The Bank has set risk appetite and comprehensive risk limit framework to monitor treasury operations as a function of TMO. These limits are reviewed on yearly basis or occurrence of an internal or external event which change the risk environment. Approval of the Board/BIRMC is obtained for the risk limits and to monitor the market risk and treasury operations within the risk limit framework.
Risk limits comprise clear authority limits covering the treasury operations and trading and non-trading portfolios. The limit structure is sufficiently granular to facilitate effective control of market risk related activities of the Bank and provides a continuous overview and understanding of activities undertaken by TFO.
TMO closely monitors the fluctuations in interest rates, equity prices and FX rates against the risk limits on more frequent basis. Counterparty risk limits on foreign currency placement and Government Securities trading and settlement exposures are monitored on a daily basis. Exceptions if any, are reported to IC, ALCO and the Board.
Value at Risk (VaR)
“VaR” is a technique for estimating potential losses on risk positions as a result of movements in market rates and prices over a specified time horizon and to a given level of confidence. The Bank developed VaR models internally to manage and monitor equity price risk and FX risk.
The Bank calculates the Equity VaR and FX VaR in accordance with Basel III considering a 99% confidence level and 10 day holding period using historical data for a period of 365 days to monitor against the risk appetite of the Bank and reports to Deputy General Manager – Treasury/TFO on a daily basis. All exceptions are reported to ALCO, IC and to the Board through BIRMC.
Equity VaR Against Appetite Limits
[ Rs. million ]
160
128
96
64
32
0
Equity VaR MTL RAL (Max) Trigger
2017
Oct. Nov. Dec.Jan. Feb. Mar. Apr. May Jun. Jul. Aug. Sep.
Figure 21

223
National Savings Bank Annual Report 2017
FX VaR
[ USD ]
3,500
2,800
2,100
1,400
700
0Dec.Nov.Oct.Sep.Aug.
2017
Figure 22
Sensitivity analysis
Sensitivity analysis measures the impact of individual market factor movements on specific instruments or portfolios, including interest rates, foreign exchange rates and equity prices, such as the effect of one basis point change in yield.
The Bank mainly uses sensitivity analysis to identify the impact on trading and banking book due to adverse interest rate fluctuations and reports are submitted to ALCO on a periodic basis. These reports are instrumental in Asset and Liability Management and pricing decisions of the Bank.
Stress testing
Stress testing is an important measure that is integrated into market risk management framework to evaluate the potential impact on portfolio values from more extreme, although plausible events or market movements.
MRMU conducts stress tests according to the Stress Testing Policy of the Bank. Market risk stress testing assesses the impact to the Capital Adequacy Ratio (Basel III) due to adverse movements in market variables such as interest rates, equity prices and foreign exchange rates. Stress testing exercise enables the Bank to identify potential adverse impacts which enables to take planned decisions and mitigations.
TradingRs. '000
AFSRs. '000
TotalRs. '000
Unrealised gain/(loss) of G Sec portfolio against cost at the end of 2017 220,485 96,503 316,988
Change in M2M value100 bps increase in yield (96,657) (6,267) (102,924)200 bps increase in yield (190,187) (12,394) (202,581)100 bps decrease in yield 99,786.6 6,415 106,202200 bps decrease in yield 202,949.4 12,998 215,947
Table 10: Stress Testing-Interest Rate Risk in Trading Book – Government Securities

224
National Savings Bank Annual Report 2017
100bp rate shock on negative gaps Up to 1 month 1-3 months 3-6 months 6-12 months 1-3 years 3-5 years Over 5 years Total
Stand-alone Level
Gap (175,237) (225,232) (67,917) (116,454) 131,921 145,036 308,013 131Impact on NII (Rs. Mn) (1,680) (1,882) (428) (303) – – – (4,293)
Consolidated Level
Gap (177,093) (227,378) (67,706) (117,598) 133,636 148,347 309,759 1,968Impact on NII (Rs. Mn) (1,698) (1,900) (427) (306) – – – (4,331)
Table 11: Stress Testing Assessment of Yield Curve Risk in Banking Book
ParticularsImpact on Total Capital Adequacy Ratio
Favourable/(Adverse) (%)
Low Medium High
Interest rate risk: Increase in market yield (Low 50bps, Medium 100bps, High 200bps) (0.02) (0.04) (0.08)Equity price risk: Decline in market prices (Low 15%, Medium 20%, High 25%) 0.14 0.47 0.57FX Risk: Rupees depreciation (Low 5%, Medium 10%, High 15%) (0.57) (0.87) (1.16)
Table 12: Stress Testing – Market Risk
Liquidity riskLiquidity risk is defined as the risk that the Bank, although solvent, cannot maintain or generate adequate liquid funds to meet its payment obligations in full as they fall due, or can only do so at materially disadvantageous terms.
The Bank maintained the liquidity positions well above the regulatory minimum levels during the year under review. Appropriate liquidity buffers were held in line with regulatory, prudential and internal stress testing requirements, taking into account the Bank’s risk profile and market conditions.
Depositor Concentration
[ % ]
Individual Deposits Institutional Deposits
16.0
84.02017
17.0
83.02016
Figure 23

225
National Savings Bank Annual Report 2017
Funding Diversification by Product
[ % ]
Savings Deposits Fixed Deposits Repo Borrowings USD Borrowings Subordinated Debt
0.7
17.6
6.2
55.2
20.3
20162017
0.6
16.3
6.4
57.1
19.6
Figure 24
The Bank continues to focus on building its deposit base as a key component of the funding mix. Primary funding sources are in the form of deposits across a spectrum of retail and institutional depositors. In 2017, total funding related liabilities grew by 10.4% to Rs. 961.2 Bn. of which 76.7% consists of deposits.
The Bank’s concentration of funding remains low due to high concentration towards retail deposits since 84% of the deposits are funded by retail depositors. The Bank has set concentration limits to ensure that funding diversification is maintained across products and to ensure adherence to appetite limits.
The Bank’s subsidiary mainly engages in highly regulated primary dealer activities with high composition of liquid assets.
Governance structure
At Senior Management level, ALCO oversees the liquidity risk of the Bank. The principal liquidity risk governance document is the Liquidity and Market Risk Management Policy of the Bank approved by the Board.
MRMU monitors liquidity risk using stock approach, flow approach and regulatory ratios. Further, stress tests are performed on a periodic basis considering scenarios of different severities for a liquidity crisis, credit tightening and speed/time to act in a crisis situation.
The stress test results and liquidity ratios are communicated to ALCO and to the Board through BIRMC.
Liquidity risk management process
The Bank manages liquidity in compliance with respective statutory regulations set by the regulator and within the risk appetite framework. Liquidity risk management ensures that the Bank has appropriate amount, diversification and tenor of liquidity to support its asset base at all times.
The Bank manages liquidity risk using statutory ratios and best practices aligned to Basel III requirements.

226
National Savings Bank Annual Report 2017
Tactical (Short-term) liquidity risk management Structural (Long-term) liquidity risk management Contingency liquidity risk management
Manage intraday liquidity positions Ensure a structurally sound financial position Monitor and manage early warningliquidity indicators
Ensure LCR and NSFR within the risk appetite Monitor interbank and repo shortage levels
Identify and manage structural liquidity mismatches
Establish and maintain contingency funding plans
Monitor daily cash flow requirements Determine and apply behavioural profiling Undertake regular liquidity stress testing and scenario analysis
Manage short-term cash flows Manage long-term cash flows Convene liquidity crisis management committees, if needed
Manage daily foreign currency liquidity Preserve a diversified funding base Set liquidity buffer levels in accordance with anticipated stress events
Set deposit rates in accordance with structural and contingent liquidity requirements as informed by ALCO
Inform term funding requirements Advise on the diversification of liquidity buffer portfolios
Assess foreign currency liquidity Ensure compliance with Basel III liquidity requirementsEstablish liquidity risk appetite
Ensure appropriate transfer pricing of liquidity costs
Table 13: Liquidity Management Process
Regulatory ratios
The Bank monitors liquidity risk using ratios under Stock Approach, Flow Approach and regulatory ratios.
Statutory Liquid Asset Ratio (SLAR) and Liquidity Coverage Ratio (LCR) are monitored on monthly basis under statutory ratios.
The Bank has successfully maintained Basel III LCR in excess of 100% and SLAR in excess of 20% to ensure compliance with
the minimum regulatory requirement. According to the draft calculation on Basel III Net Stable Funding Ratio (NSFR), the Bank is well above the regulatory minimum requirement.
Flow approach
Under the flow approach, Liquidity gap analysis is one of the methods used by the Bank to assess liquidity risk. Liquidity gap results are periodically calculated, monitored and used for sensitivity analysis and stress testing.
December2017
%
December 2016
%
Regulatory minimum
%
SLAR – DBU 73.44 72.56 20LCR – Rupee 377.57 379.26 100LCR – All currencies 376.18 393.96 100
Oct. Nov. Dec.Mar. Apr. May Jun. Jul. Aug. Sep.Feb.Jan.
Trends in Regulatory Ratios
[ % ]
450
425
400
375
350
325
80
77
74
71
68
65
LCR – All Currency (LHS) LCR – Rupee (LHS) SLAR (RHS)
2017
Figure 25
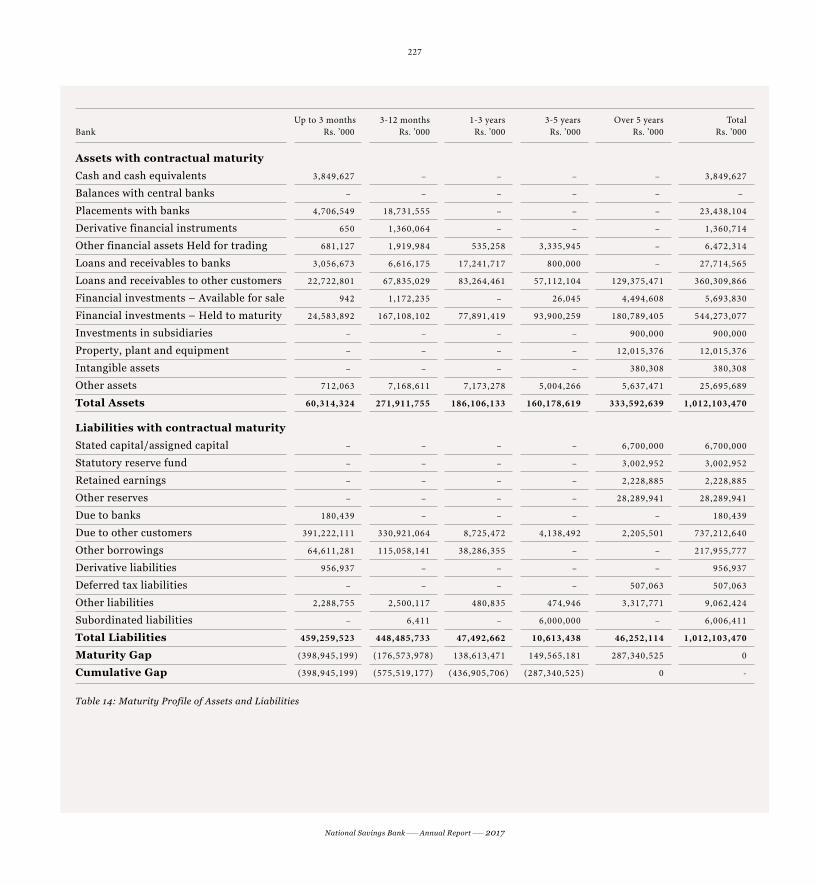
227
National Savings Bank Annual Report 2017
BankUp to 3 months
Rs. ’0003-12 months
Rs. ’0001-3 years
Rs. ’0003-5 years
Rs. ’000Over 5 years
Rs. ’000Total
Rs. ’000
Assets with contractual maturity
Cash and cash equivalents 3,849,627 – – – – 3,849,627
Balances with central banks – – – – – –
Placements with banks 4,706,549 18,731,555 – – – 23,438,104
Derivative financial instruments 650 1,360,064 – – – 1,360,714
Other financial assets Held for trading 681,127 1,919,984 535,258 3,335,945 – 6,472,314
Loans and receivables to banks 3,056,673 6,616,175 17,241,717 800,000 – 27,714,565
Loans and receivables to other customers 22,722,801 67,835,029 83,264,461 57,112,104 129,375,471 360,309,866
Financial investments – Available for sale 942 1,172,235 – 26,045 4,494,608 5,693,830
Financial investments – Held to maturity 24,583,892 167,108,102 77,891,419 93,900,259 180,789,405 544,273,077
Investments in subsidiaries – – – – 900,000 900,000
Property, plant and equipment – – – – 12,015,376 12,015,376
Intangible assets – – – – 380,308 380,308
Other assets 712,063 7,168,611 7,173,278 5,004,266 5,637,471 25,695,689
Total Assets 60,314,324 271,911,755 186,106,133 160,178,619 333,592,639 1,012,103,470
Liabilities with contractual maturity
Stated capital/assigned capital – – – – 6,700,000 6,700,000
Statutory reserve fund – – – – 3,002,952 3,002,952
Retained earnings – – – – 2,228,885 2,228,885
Other reserves – – – – 28,289,941 28,289,941
Due to banks 180,439 – – – – 180,439
Due to other customers 391,222,111 330,921,064 8,725,472 4,138,492 2,205,501 737,212,640
Other borrowings 64,611,281 115,058,141 38,286,355 – – 217,955,777
Derivative liabilities 956,937 – – – – 956,937
Deferred tax liabilities – – – – 507,063 507,063
Other liabilities 2,288,755 2,500,117 480,835 474,946 3,317,771 9,062,424
Subordinated liabilities – 6,411 – 6,000,000 – 6,006,411
Total Liabilities 459,259,523 448,485,733 47,492,662 10,613,438 46,252,114 1,012,103,470
Maturity Gap (398,945,199) (176,573,978) 138,613,471 149,565,181 287,340,525 0
Cumulative Gap (398,945,199) (575,519,177) (436,905,706) (287,340,525) 0 -
Table 14: Maturity Profile of Assets and Liabilities
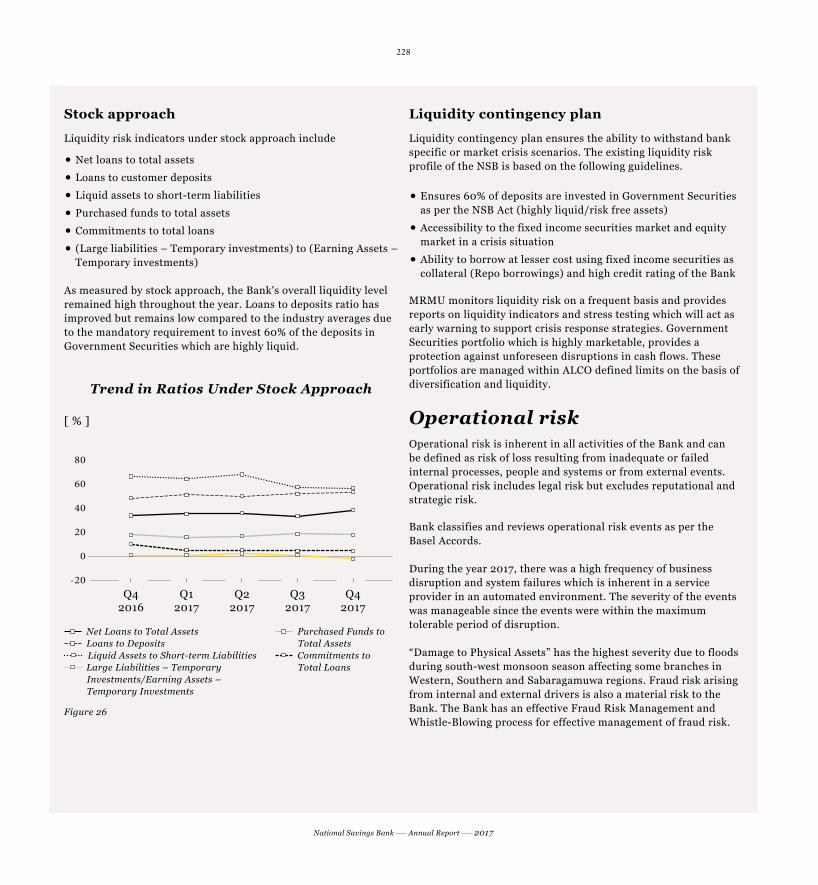
228
National Savings Bank Annual Report 2017
Stock approach
Liquidity risk indicators under stock approach include
Net loans to total assets Loans to customer deposits Liquid assets to short-term liabilities Purchased funds to total assets Commitments to total loans (Large liabilities – Temporary investments) to (Earning Assets – Temporary investments)
As measured by stock approach, the Bank's overall liquidity level remained high throughout the year. Loans to deposits ratio has improved but remains low compared to the industry averages due to the mandatory requirement to invest 60% of the deposits in Government Securities which are highly liquid.
Trend in Ratios Under Stock Approach
[ % ]
Q4 2017
Q3 2017
Q2 2017
Q4 2016
Q1 2017
80
60
40
20
0
-20
Net Loans to Total Assets Loans to Deposits Liquid Assets to Short-term Liabilities Large Liabilities – Temporary
Investments/Earning Assets – Temporary Investments
Purchased Funds to Total Assets
Commitments to Total Loans
Figure 26
Liquidity contingency plan
Liquidity contingency plan ensures the ability to withstand bank specific or market crisis scenarios. The existing liquidity risk profile of the NSB is based on the following guidelines.
Ensures 60% of deposits are invested in Government Securities as per the NSB Act (highly liquid/risk free assets)
Accessibility to the fixed income securities market and equity market in a crisis situation
Ability to borrow at lesser cost using fixed income securities as collateral (Repo borrowings) and high credit rating of the Bank
MRMU monitors liquidity risk on a frequent basis and provides reports on liquidity indicators and stress testing which will act as early warning to support crisis response strategies. Government Securities portfolio which is highly marketable, provides a protection against unforeseen disruptions in cash flows. These portfolios are managed within ALCO defined limits on the basis of diversification and liquidity.
Operational riskOperational risk is inherent in all activities of the Bank and can be defined as risk of loss resulting from inadequate or failed internal processes, people and systems or from external events. Operational risk includes legal risk but excludes reputational and strategic risk.
Bank classifies and reviews operational risk events as per the Basel Accords.
During the year 2017, there was a high frequency of business disruption and system failures which is inherent in a service provider in an automated environment. The severity of the events was manageable since the events were within the maximum tolerable period of disruption.
“Damage to Physical Assets” has the highest severity due to floods during south-west monsoon season affecting some branches in Western, Southern and Sabaragamuwa regions. Fraud risk arising from internal and external drivers is also a material risk to the Bank. The Bank has an effective Fraud Risk Management and Whistle-Blowing process for effective management of fraud risk.

229
National Savings Bank Annual Report 2017
Frequency of Loss Events
[ % ]
60
48
36
24
12
0EDPMBDSFDPACPBPEFIF
2016 2017
Severity of Loss Events
[ % ]
75
60
45
30
15
0EDPMDPACPBPEFIF
2016 2017
Figure 27 Figure 28
IF – Internal Fraud EF – External Fraud DPA – Damage to Physical Assets BDSF – Business Disruption and System Failures
EPWS – Employment Practices and Workplace Safety*CPBP – Clients, Products and Business PracticesEPPM – Execution, Delivery and Process Management
Frequency – 0% – 2017: EPWS 2016: CPBP, EPWS Severity – 0% – 2017: BDSF, EPWS 2016: BDSF, EPWS, CPBP
Actual Operational Losses against Risk Appetite and Tolerance Limit
[ % ]
2017201620152013 2014
2.5
2.0
1.5
1.0
0.5
0
Actual Risk Appetite Risk Tolerance Level
Figure 29
Operational losses for the financial year 2017 was 0.19% from the average audited gross income for last three years, which is far below the internal alert level reflecting the “tone at the top” effectiveness of the governance structures, processes and procedures in place to manage operational risk. The trend line also demonstrates the Bank’s consistency in maintaining losses at minimal levels over the last five-year period. Continuous endeavours are taken by the Bank to manage and minimise the operational risks within the risk appetite.

230
National Savings Bank Annual Report 2017
Risk review
Risk Component Description Monitoring /Management tools Exposure Impact *
Fraud risk Fraudulent activities by internal or external party
Fraud Risk Management and Whistle-Blowing process
Internal controls Key Operational Risk Indicators (KORIs) monitoring
Loss event monitoring Risk and Control Self-Assessment (RCSA)
High Moderate
System/ Information Technology/ Information Security Risk
Failed, inadequate processes, Systems and Information Technology
Internal controls Information Security Management System (ISMS)
Business Continuity Management System (BCMS)
KORIs monitoring Incident reporting
High Moderate
Compliance risk Failure in meeting regulatory requirements Compliance programmes and examinations
KORIs monitoring Compliance risk scorecard
High Moderate
Legal risk Inadequate/Failure to comply with legal requirements
Legal clearance on all contractual obligations
KORIs monitoringModerate Low
*Possible impact on earnings and capital in a high stress situation
Figure 30: Operational Risk Review
Governance structure
The Bank has a comprehensive Operational Risk Management Framework (ORMF) which is sensitive to the existing and emerging operational risks. It strives to achieve more efficient, transparent, profitable and sustainable business operations. ORMF is codified in the Board approved Operational Risk Management Policy which describes a formal governance structure and NSB’s approach in identifying, assessing, monitoring and controlling operational risk. Further, following policies supplement Operational Risk Management Policy framework:
Information Security Management Policy Business Continuity Management Policy Fraud Risk Management and Whistle-Blowing Policy Outsourcing Policy
ORMF is reinforced by the effective governance structure and Senior Management oversight. Responsibility to operational risk management lies with the Board with the assistance of the BIRMC.

231
National Savings Bank Annual Report 2017
Op
era
tio
na
l R
isk
Ma
na
gem
ent
Risk and Control
Self-Assessment
Scenario Analysis
Key Operational
Risk Indicators
Capital Computation for Operational Risk
Internal Loss Data
External Loss Data
Op
era
tio
na
l R
isk
Go
vern
an
ceBoard of Directors
Operational Risk Management Committee (ORMC)
Board Integrated Risk Management Committee (BIRMC)
Operational Risk Management Policy and Risk Appetite Framework
Operational Risk Management Unit
Operational Risk Analysis, Reporting, Monitoring and Reviewing
Figure 31: Operational Risk Governance Structure
ORMC is the apex level management committee to oversee the operational risk management.
ORMU of RMD has the responsibility for the design, implementation and maintenance of the ORMF including the associated governance structure. The responsibilities of ORMU include:
Reviewing/updating policies Operational risk assessment using RCSA, KORI and loss event data.
Monitoring implementation of BCMS Monitoring ISMS Monitoring the risk of outsourcing of activities New products/process reviews Reporting to ORMC and Board through BIRMC
232
National Savings Bank Annual Report 2017
Operational risk management process
The Bank manages operational risk based on a bank-wide consistent framework that enables determination of its operational risk profile in comparison to its risk appetite.
As operational risk is inherent in every person, process and system, a specific group or a committee itself cannot effectively manage such risk.
NSB has created a risk management culture which begins with unwavering commitment of the Board and Senior Management and drives through awareness at all levels.
Branches and operational divisions are recognised as the primary owners of the operational risk. They are provided with adequate training to be clear about inherent risks in their area of responsibility.
Thus, the Bank has put in place extensive internal controls as the First Line of Defence for operational risk which include system controls, access controls, segregation of duties, dual checks through authorisation and verification of transactions, reconciliations, audit trails and audit logs and above all educating the risk owners through proper training programmes.
RMD and Compliance Division act as Second Line of Defence and IAD act as the Third Line of Defence in operational/risk management.
Operational Risk Management Process begins with identification and assessment of operational risk profile of the Bank using different tools and techniques to manage and minimise risk exposures.
Loss event data collection and analysis
Internal and external loss event data collection is a key requirement of moving into advanced approaches in operational risk capital charge calculation.
ORMU continuously collects loss event data over a period and such operational losses are categorised into seven loss event types as per Basel classification to facilitate regulatory and other reporting.
Loss event data is subject to stringent analysis to identify the nature, root causes and the probability of occurrence in order to take prompt corrective and preventive actions.
NSB has a low appetite for operational risk and has established tolerance levels for all material operational risk types.
Key operational risk indicators monitoring
KORI matrix enables monitoring changes in levels of a risk exposure and acts as early warning indicators to take prompt risk mitigation actions.
The Bank’s KORI dashboard covers key business operations and support services of the Bank in order to identify and assess operational risk profile by a risk matrix covering Audit Issue Management, Business Continuity Management, Information Security Management, Product Quality, Process Quality and Compliance.
KORIs are defined under each area to assess the risk based on predefined threshold limits. These threshold limits are revised annually or more frequently considering the changes in operational environment.
ORMU monitors the operational risk profile using KORIs and reports to ORMC and the Board through BIRMC.
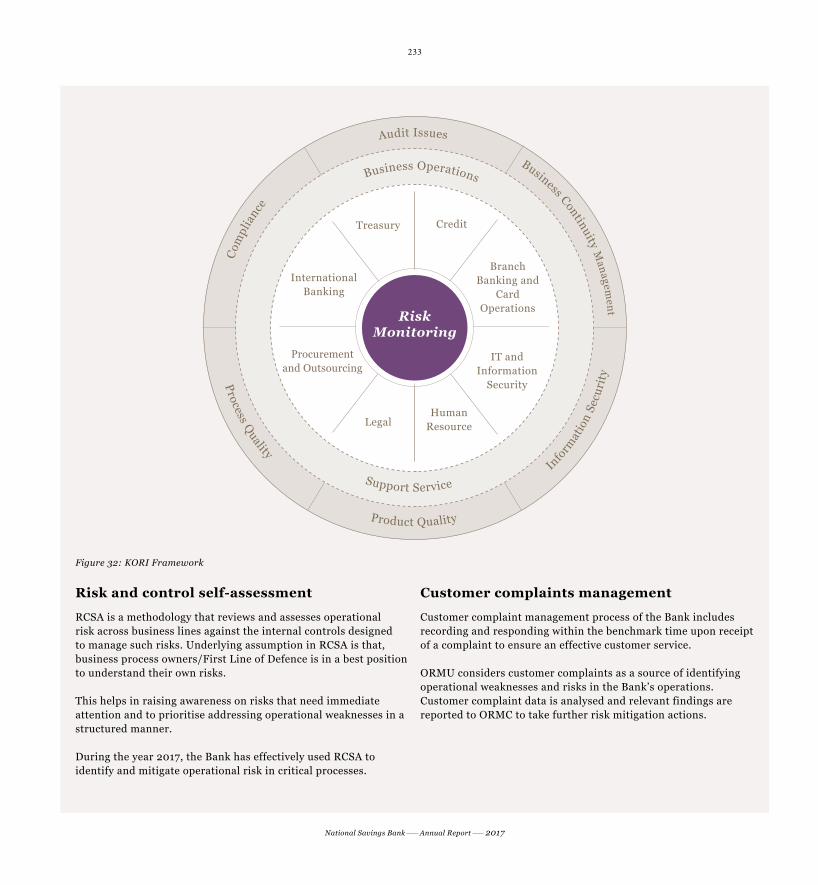
233
National Savings Bank Annual Report 2017
Risk Monitoring
Credit
Branch Banking and
CardOperations
IT and Information
Security
Human ResourceLegal
Procurement and Outsourcing
International Banking
Business Operations
Product Quality
Process Quality
Com
plia
nce
Audit Issues
Business Continuity Managem
ent
Info
rmat
ion
Secu
rity
Support Service
Treasury
Figure 32: KORI Framework
Risk and control self-assessment
RCSA is a methodology that reviews and assesses operational risk across business lines against the internal controls designed to manage such risks. Underlying assumption in RCSA is that, business process owners/First Line of Defence is in a best position to understand their own risks.
This helps in raising awareness on risks that need immediate attention and to prioritise addressing operational weaknesses in a structured manner.
During the year 2017, the Bank has effectively used RCSA to identify and mitigate operational risk in critical processes.
Customer complaints management
Customer complaint management process of the Bank includes recording and responding within the benchmark time upon receipt of a complaint to ensure an effective customer service.
ORMU considers customer complaints as a source of identifying operational weaknesses and risks in the Bank’s operations. Customer complaint data is analysed and relevant findings are reported to ORMC to take further risk mitigation actions.

234
National Savings Bank Annual Report 2017
New product and process risk assessment
With the recent global financial crisis, it is evident that the transition from the test phase of a new product or system to the operative business is particularly risky due to the lack of experience and expertise in an unfamiliar environment. ORMU assesses the sources of operational risk that stems from new products, channels and processes prior to introducing/implementing within the Bank. Also post introduction/implementation reviews are conducted by ORMU to further minimise operational risk to the Bank.
Information security risk management
The laws and regulations relating to Information and Communication Technology (ICT) are evolving to provide a safe banking service to customers in terms of accuracy, control, integrity and confidentiality of the information from the emerging vulnerabilities in ICT.
Bank has taken steps to comply with the Baseline Security Standards (BSS) with the assistance of industry expertise and monitored through the IT Steering Committee. Accordingly, NSB’s improved ICT infrastructure and ISMS are reviewed based on ISO 27001:2013. Under this, Information Security Policies and procedures are reviewed with expert opinions to streamline the current practices.
ORMU monitors implementation of information security through progress reviews and provides recommendations if any for further improvements.
Business continuity management system
Business Continuity Plan (BCP) and Disaster Recovery Plan (DRP) recognise that services, products or operations must be continuously delivered without interruption. The Bank has established a BCP which includes:
Business Impact Assessment Plans, measures and arrangements to ensure the continuous delivery of critical services and products.
Identification of necessary resources to support business continuity, including personnel, information, equipment, financial allocations, legal counsel and infrastructure protection.
Business continuity planning is a proactive planning process that ensures critical services/products, systems or operations are delivered despite disruption and are based on outcomes of an annually reviewed business impact assessment.
Creating and maintaining a BCP ensures that the Bank has the resources and information needed to deal with emergencies such as natural disasters, accidents, power and energy disruptions, communications, transportation, safety and service sector failure, environmental disasters such as pollution and hazardous materials spills, cyberattacks and hacker activities. Having a BCP minimises financial, operational and reputational losses to the Bank.
DRP is generally a part of BCP. Hence, the Bank has developed a DRP in conjunction with BCP. The Bank’s Disaster Recovery Centre is located outside Colombo with alternative arrangements for unexpected events. DRP is adaptable and routinely updated.
Risk transfer
Outsourcing is used as an effective cost saving and a risk transfer strategy. The Bank outsourcing function is based on the Board approved Outsourcing Policy prepared as per the CBSL guidelines. This is further supplemented by the Bank’s procurement guidelines.
The risk arising from outsourcing of business operations are managed by a separate outsourcing unit, established in order to streamline the function and reporting. The Bank conducts comprehensive due diligence exercises to ensure the service providers’ capability to perform the activities outsourced.
Insurance plays a key role as an operational risk mitigant to transfer key insurable risk to an insurance service provider. Insurance policies are used to cover “low frequency high impact” events such as damage to physical assets due to natural disasters, fire, etc.
The adequacy of the insurance policies is continuously reviewed considering the existing and emerging risks to the Bank. ORMU monitors the insurance policy, process and recovery trend and reports to ORMC. During the year 2017, insurance process was centralised to optimise the insurance benefits to the Bank.

235
National Savings Bank Annual Report 2017
Stress testing and scenario analysis
Stress testing and scenario analysis help to identify the impact of plausible operational risk events.
Scenario analysis is used for evaluating the impact of specified operational risk scenarios whereas stress testing exercise assists in identifying the impact on more than one scenario to the Bank’s financial and solvency position. The results are communicated to ORMC and the Board through BIRMC to assist in taking pre-emptive risk mitigation actions.
Particulars Impact on Total Capital Adequacy Ratio Favourable/(Adverse) (%)
Low Medium HighOperational Loss – increase in severity of actual Operational Losses (maximum of actual total severity occurred during last three years)
(0.03) (0.05) (0.07)
Low – Maximum severityModerate – 1.5 times of maximum severityHigh – Twice severe than the maximum severity
Legal risk
Basel defines legal risk as a part of operational risk. Legal risk includes, but not limited to risk of losses due to inaccurately drafted contracts and their execution, absence of written agreements or inadequate agreement resulting in fines, penalties and punitive damages. Legal risk is managed through:
Ensuring all applicable laws are fully taken into consideration in business operations when entering into contractual relationships with third parties such as customers or service providers
Ensuring all such contractual relationships are supported by required documentation
Establishing mechanisms to ensure conformity to laws and regulations when introducing/reviewing products and processes.
The responsibilities of managing legal risk is delegated to the business owners with the guidance of Legal Division. Legal Division engages in strategic management of legal risk of the Bank.
ORMU monitors the plausible operational loss events arising due to legal risk on a periodical basis.
Compliance risk
Compliance risk is deemed crucial because the Bank’s financial status and reputation will be directly affected due to non- compliance with applicable laws and regulations, Code of Conduct and standards of practice in the banking industry. As such, the Compliance Division headed by the Compliance Officer directly reports to the Board through BIRMC and takes measures to mitigate the compliance risk of the Bank.
Initiatives taken by the Compliance Division with the intention of creating a better compliance environment and mitigating the compliance risk during 2017:
Implementation of Risk Based Approach (RBA) to compliance under Customer Due Diligence (CDD) rules by the CBSL.
Expanding compliance focus within the scope of Foreign Exchange Act No. 12 of 2017
Conducting compliance assessment on long distance branches and critical divisions.
Conduct compliance training and awareness programmes at regional and head office level.
Policies and Procedures
Oversight and Leadership
Education and Training
Risk Assessment
Assessing and Monitoring
Reporting and Investigating
Response and Prevention
Figure 33: Compliance Risk Management Process

236
National Savings Bank Annual Report 2017
Reputational risk
Reputational risk is the risk of adversities to earnings or solvency of the Bank due to negative stakeholder perception on business practices and financial conditions. In general, reputational risk is broadly managed through systems and controls adopted for all other risk as reputational risk is driven by a wide range of other business risks which are managed by the policies, procedures, Code of Conduct and business ethics.
Board oversees the reputational risk management which is carried out by the CEO/GM and Corporate Management.
The Bank has a zero risk appetite for reputational losses. Thus, RMD monitors the reputational vulnerabilities using tools such as KORIs, and customer complaint analysis. The Bank uses a scorecard-based model to assess reputation risk for ICAAP.
Strategic risk
Strategic risk can be considered as the risk of losses arising from unsuccessful business plan or inability to implement suitable business plan, failure to respond promptly to the changes in the business environment and inadequate resource allocation causing adverse impact on earnings and capital of the Bank. Missing out on potential upside opportunities can also be considered under strategic risk.
Responsibility for strategy development rests with the divisional heads through the strategic planning and budgeting process which aligns with NSB’s vision, mission and the risk appetite. Strategic risk could arise due to worsening of general economic and market conditions locally and globally. The inputs from the Research and Development Division are incorporated in formulating business strategies.
The Board has the oversight responsibility towards the strategic risk of the Bank. Senior Management continuously monitors strategic risk through frequent reviews. A scorecard based model is used to assess the strategic risk for the ICAAP.
Strategic Risk
Strategic Consequence
Risk
Strategic Execution
Risk
Strategic Positioning
Risk
Figure 34: Elements of Strategic Risk
Capital management Managing capital is an integral part of the risk management framework to assure resilience of the Bank while generating stakeholder return. Capital management process is in line with the guidelines issued by the CBSL.
Minimum capital requirements and buffers – Pillar I
The Banking Act Direction No. 01 of 2016, introduced capital requirements under Basel III for licensed banks commencing from 1 July 2017 with specified timelines to increase minimum capital ratios which is to be fully implemented by 1 January 2019.
The Bank achieved the regulatory minimum requirements set for capital adequacy during the year 2017. Common Equity Tier 1 (CET1) ratio marginally improved during the year to 11.93% as at 31 December 2017, from 11.31% as at 31 December 2016. This is mainly due to increase of equity capital and reduction of contribution to consolidated fund/dividend to Rs.5. 1 Bn. in the year 2017 against Rs. 12.02 Bn. in the year 2016. In the absence of qualifying Additional Tier 1 capital instruments, the Bank’s CET 1 ratio is equal to Total Tier 1 Capital Ratio.

237
National Savings Bank Annual Report 2017
The Bank took initiatives to monitor and maintain the Risk Weighted Assets (RWA) within the risk appetite levels. Total Capital Ratio increased to 15.31% as at 31 December 2017 against 13.86% as at 31 December 2016.
The Bank’s subsidiary, NSB Fund Management Company contributes positively to the Capital Adequacy Ratio at group level. Group CET 1/Tier 1 Ratio is 12.65% and Total Capital Ratio is 16.00% as at 31 December 2017.
Capital Level – Bank and Group
[ % ]
20
16
12
8
4
0Total CapitalCET 1/Tier 1
Bank (%) Group (%)
CET 1/Tier 1 Total Capital2016 2017
Figure 35
As the 100% State-owned savings bank, there are limited options available to raise capital externally. The only regulatory capital instrument available under Basel III is the shares issued to the Secretary to the Treasury. According to the National Savings Bank Act No. 30 of 1971, the Bank cannot raise Tier 2 Capital that fulfil criteria to qualify as regulatory capital under the Basel III guidelines.
Initiatives to improve the capital levels of the Bank:
Conserve capital by reducing dividend payments until improving CAR to Risk Appetite Levels.
Ensure internal capital generation through monitoring of portfolios and high value investments against the risk adjusted return.
Monitoring of RWA mix and changes in the risk profile to minimise adverse impacts to capital levels.
Increase stakeholder awareness on the challenges in achieving the strategic business objectives due to increased demand for capital imposed by Basel III with the intention to obtain stake holder backing to improve capital levels.
Ratios (%) Actual as at 31.12.2017 Actual as at 31.12.2016 Regulatory minimum
01.07.2017
Regulatory minimum
01.01.2018
Regulatory minimum
01.01.2019 Bank Group Bank Group
CET1 plus CCB and Capital surcharge for D-SIBs 11.93 12.65 11.31 12.03 6.25 7.375 8.50Tier1 plus CCB and Capital surcharge for D-SIBs 11.93 12.65 11.31 12.03 7.75 8.875 10.00Total Capital plus CCB and Capital surcharge for D-SIBs 15.31 16.00 13.86 14.54 11.75 12.875 14.00
Table 14 : Regulatory Ratios-Actual vs. Regulatory Minimum
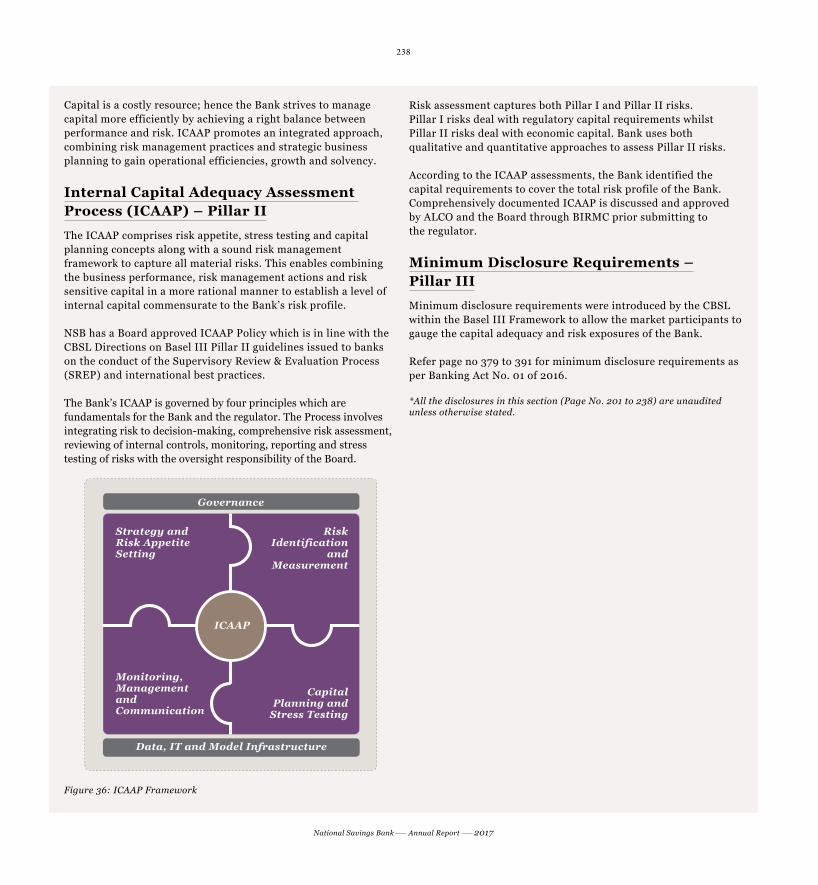
238
National Savings Bank Annual Report 2017
Capital is a costly resource; hence the Bank strives to manage capital more efficiently by achieving a right balance between performance and risk. ICAAP promotes an integrated approach, combining risk management practices and strategic business planning to gain operational efficiencies, growth and solvency.
Internal Capital Adequacy Assessment Process (ICAAP) – Pillar II
The ICAAP comprises risk appetite, stress testing and capital planning concepts along with a sound risk management framework to capture all material risks. This enables combining the business performance, risk management actions and risk sensitive capital in a more rational manner to establish a level of internal capital commensurate to the Bank’s risk profile.
NSB has a Board approved ICAAP Policy which is in line with the CBSL Directions on Basel III Pillar II guidelines issued to banks on the conduct of the Supervisory Review & Evaluation Process (SREP) and international best practices.
The Bank’s ICAAP is governed by four principles which are fundamentals for the Bank and the regulator. The Process involves integrating risk to decision-making, comprehensive risk assessment, reviewing of internal controls, monitoring, reporting and stress testing of risks with the oversight responsibility of the Board.
Strategy and Risk Appetite Setting
Monitoring, Management and Communication
Risk Identification
and Measurement
Capital Planning and
Stress Testing
ICAAP
Governance
Data, IT and Model Infrastructure
Figure 36: ICAAP Framework
Risk assessment captures both Pillar I and Pillar II risks. Pillar I risks deal with regulatory capital requirements whilst Pillar II risks deal with economic capital. Bank uses both qualitative and quantitative approaches to assess Pillar II risks.
According to the ICAAP assessments, the Bank identified the capital requirements to cover the total risk profile of the Bank. Comprehensively documented ICAAP is discussed and approved by ALCO and the Board through BIRMC prior submitting to the regulator.
Minimum Disclosure Requirements – Pillar III
Minimum disclosure requirements were introduced by the CBSL within the Basel III Framework to allow the market participants to gauge the capital adequacy and risk exposures of the Bank.
Refer page no 379 to 391 for minimum disclosure requirements as per Banking Act No. 01 of 2016.
*All the disclosures in this section (Page No. 201 to 238) are unaudited unless otherwise stated.

Financial Reports
Financial Calendar - 240
Annual Report of Board of Directors - 241
Statement of Directors’ Responsibility for Financial Reporting - 248
Directors’ Statement on Internal Control Over Financial Reporting - 250
Independent Assurance Report on Internal Controls - 252
General Manager/CEO’s and Deputy General Manager’s (Finance and Planning) Statement of Responsibility - 253
Auditor General’s Report - 255
Statement of Comprehensive Income - 256
Statement of Financial Position - 258
Statement of Changes in Equity - 260
Statement of Cash Flows - 264
Notes to the Financial Statements - 265

Financial calendar
Financial calendar 2017
Publication of Interim Financial Statements for the quarter ended 31 March 2017 27 May 2017
Publication of Interim Financial Statements for the quarter ended 30 June 2017 31 August 2017
Publication of Interim Financial Statements for the quarter ended 30 September 2017 30 November 2017
Publication of Financial Statements (Audited) for the year ended 31 December 2017 15 March 2018
Proposed financial calendar 2018
Publication of Interim Financial Statements for the quarter ended 31 March 2018 31 May 2018
Publication of Interim Financial Statements for the quarter ended 30 June 2018 31 August 2018
Publication of Interim Financial Statements for the quarter ended 30 September 2018 30 November 2018
Publication of Financial Statements (Audited) for the year ended 31 December 2018 29 March 2019

241
National Savings Bank Annual Report 2017
Annual Report of Board of DirectorsAnnual Report of Board of Directors
GeneralGeneral
The Directors of the National Savings Bank have pleasure in presenting their Integrated Annual Report on the affairs of the Bank together with the Audited Financial Statements of the Bank and Consolidated Financial Statements for the year ended 31 December 2017. We ascertain that it gives the strategic picture of the Bank’s business that explains how the Bank creates and sustains value over the years and in the future.
The draft Financial Statements were approved by the Board of Directors at the Board meeting held on 8 February 2018 and submitted to the Auditor General on 9 February 2018. The Audited Financial Statements were authorised to be issued on 12 March 2018. The Report also includes certain disclosures required to be made under the Banking Act No. 30 of 1988 and amendments thereto and the Direction on Corporate Governance. The Annual Report and Financial Statements, together with the Auditor General’s Report will be submitted to the Minister of Finance, on or before 31 May 2018 as per Circular No. PED/27 of 27 January 2005, issued by the Director General of the Department of Public Enterprises to be placed before the Parliament of Sri Lanka.
National Savings Bank is incorporated in Sri Lanka by National Savings Bank Act No. 30 of 1971 and was granted the status of Licensed Specialised Bank in terms of Banking Act No. 30 of 1988. The Bank has been assigned AAA (lka) long-term credit rating by the Fitch Rating Lanka (Pvt) Ltd. for the 15th consecutive year. It has also been awarded international credit ratings of B+ Stable by Fitch Inc. and B+ Stable by Standard and Poor Rating services.
Vision, Mission and ValuesVision, Mission and Values
The Bank’s Vision, Mission and Values are given on page 3 of this Annual Report. All permanent employees are being abided by the Code of Conduct of the Bank and the Government Oath with the view of reaching the Vision and Mission of the Bank.
Principal ActivitiesPrincipal Activities
Bank
The principal activity of the National Savings Bank is promotion of savings among the people of Sri Lanka and profitable investments of savings so mobilised.
Subsidiary
NSB Fund Management Company Ltd., is the Bank’s only Subsidiary and the principal activity of the Company is dealing in Government Securities as a primary dealer authorised by the Central Bank of Sri Lanka. Details of the transactions are given in Note 40(b) to the Financial Statements.
There were no significant changes in the nature of the principal activities of the Bank and the Group.
Review of Business PerformanceReview of Business Performance
The overall financial performance of the Bank for the financial year 2017 and its financial position as at 31 December 2017 were reviewed in the Chairman’s Message (page 21), General Manager/CEO’s Review (page 27), the 2017 Story (page 12) and Audited Financial Statements (page 256). These reports form an integral part of the Annual Report.
NSB has joined hands with Mobitel, the national mobile service provider, to create new digital environment of convenience and flexibility through mCash outlets. This facility has been branded as NSB “i-Saver” which is expected to further inculcate the habit of savings amongst Sri Lankan’s populace, thus resulting in wealth creation and mobility of funds for investment.
Network Expansions and Future Network Expansions and Future DevelopmentsDevelopments
Widening the Bank’s presence in the island, three branches were added to the network during the year under review. At the end of the year the Bank has 253 branches in its

242
National Savings Bank Annual Report 2017
Annual Report of Board of Directors
network. The ATM network was further expanded enhancing customer convenience. The Bank installed seven ATMs during the year across the island bringing out the total ATMs to 286 excluding peer banks’ ATMs through which customers of NSB can transact. The customers could also access the Bank through over 16,000 mCash outlets.
The Bank intends to tie-up with technological advancements in the coming years. This will enhance the convenience to customer base of the Bank. An overview of the future developments of the Bank is given in the Chairman’s Message (page 21), General Manager/CEO’s Review (page 27) and the 2017 Story (page 12).
Going ConcernGoing Concern
The Board of Directors have reviewed and satisfied that the Bank has ample resources to continue its operations in the foreseeable future. Furthermore, the Directors are not aware of any material uncertainties that may cast significant doubt upon the Bank’s ability to continue as a going concern, such as restrictions or plan to curtail operations.
Financial StatementsFinancial Statements
The Financial Statements are prepared in accordance with the Sri Lanka Financial Reporting Standards/Sri Lanka Accounting Standards (SLFRSs/LKASs) laid down by The Institute of Chartered Accountants of Sri Lanka and comply with the requirements of Banking Act No. 30 of 1988 as amended. The Financial Statements of the Bank and the Group for the year ended 31 December 2017 duly certified by the Deputy General Manager – Finance and Planning and approved and signed by the General Manager/CEO and two Directors including Chairman of the Bank are given on page 256 which form an integral part of the Annual Report of the Bank.
Directors’ Responsibilities for Directors’ Responsibilities for Financial ReportingFinancial Reporting
The Directors are responsible for the preparation of the Financial Statements that will reflect a true and fair view of the state of affairs of the Bank as at 31 December 2017 and its profit for the year then ended. The Directors are of the
view that Statements of Comprehensive Income, Statement of Financial Position, Statement of Changes in Equity, Cash Flow Statement, Significant Accounting Policies and Notes there to have been prepared in conformity with the requirements of the Sri Lanka Accounting Standards (SLFRSs/LKASs) and the Banking Act No. 30 of 1988 and its amendments. The Statement of Directors’ Responsibility for Financial Reporting appearing on page 248 of this Annual Report describes in detail the Directors’ Responsibilities in relation to Financial Statements, which form an integral part of the Annual Report of the Board of Directors.
Auditors’ ReportAuditors’ Report
The Auditor General had carried out the audit of the Financial Statements of the Bank, its subsidiary of NSB Fund Management Company and the Consolidated Financial Statements of the Group for the year ended 31 December 2017. In 2017, the continuous audit was carried out throughout the year for the Bank. Issues identified in their reports were submitted to the management regularly for prompt action. Having confirmed the accuracy of the financial reporting, the Financial Statements, together with the necessary data and information were made available to the Auditor General for examination. The Auditor General’s opinion on the Financial Statements appears on page 255 of this Annual Report.
As a regulatory supervisory body, the Central Bank of Sri Lanka carried out a periodic examination of the records and affairs of the Bank to ascertain compliance with directives issued by the Central Bank of Sri Lanka. It also determines whether required financial indicators are being maintained at the required level so that the interests of the stakeholders, particularly depositors are safeguarded.
Significant Accounting Policies andSignificant Accounting Policies and Changes during the YearChanges during the Year
The Bank prepared its Financial Statements in accordance with Sri Lanka Accounting Standards (SLFRSs/LKASs). Significant Accounting Policies adopted in the preparation of Financial Statements for the year are given on page 265. Significant changes to accounting policies if any in the preparation of the Financial Statements are also stated therein.

243
National Savings Bank Annual Report 2017
Annual Report of Board of Directors
Strategic Business PlanStrategic Business Plan
The Bank developed its latest Strategic Business Plan for 2018-2020 through roll-out of the SBP 2017-2019 during the year 2017. Focusing areas and Strategic Initiatives were identified in this process. The Bank will strive to operate within the parameters set out in the new Business Plan, which will help to accelerate the future momentum of NSB. In line with Strategic Business Plan, Balance Score Card with KPI was introduced for each operation and service unit for the purpose of easy monitoring.
IncomeIncome
The gross income of the Bank for 2017 was Rs. 107,817 Mn. (2016 – Rs. 87,399 Mn.) while the Group’s income was Rs. 108,056 Mn. (2016 – Rs. 88,039 Mn.). Details of the income are given in Note 3 to the Financial Statements.
Results and AppropriationResults and Appropriation
The profit before income tax of Bank and Group amounted to Rs. 14,029 Mn. and Rs. 13,645 Mn. (2016 – Rs. 13,303 Mn. and Rs. 13,397 Mn.). This is an increase of 5.45% for the Bank and 1.85% for the Group (2016 – 2.07% and 0.94% increase).
The profit after tax of the Bank and Group stood at Rs. 9,610 Mn. and Rs. 9,050 Mn. respectively (2016 – Rs. 9,498 Mn. and Rs. 9,562 Mn.). This is an increase of 1.18% for the Bank and decreased of 5.36% for the Group (2016 – 9.52% and 8.27%). Details of profit relating to the Bank are given in the following Table:
Provision for TaxationProvision for Taxation
The Income Tax rate applicable for the Bank on its operation is 28%, the Bank’s operations are liable for Value Added Tax on Financial Services at the rate of 15% and Nation Building Tax at the rate of 2%.
The Bank provided deferred tax on all known temporary differences under the liability method in accordance with Sri Lanka Accounting Standard (LKAS) 12 – “Income Taxes”. Information of Income Tax expenditure and Deferred Taxation are given in Notes 13 and 29 respectively on pages 289 and 324.
Stated CapitalStated Capital
The authorised share capital of the Bank is Rs. 10 Bn. which is made of One Bn. ordinary shares of Rs. 10.00 each. The Bank has issued 50 Mn. ordinary shares of Rs. 10.00 using unclaimed deposit reserve to the Secretary to the Treasury on 31 December 2017. The issued share capital of the Bank as at 31 December 2017 stood at Rs. 6.7 Bn. The Secretary to the Treasury in his official capacity holds the entirety of the issued share capital.
Borrowed CapitalBorrowed Capital
The Bank issued an International Bond for a value of USD 750 Mn. and USD 250 Mn. in the years 2013 and 2014 respectively. This was the highest amount of foreign funds raised in a single issue by a bank so far from foreign investors. Information of Borrowed capital is given in Note 33 respective on page 327.
2017Rs. Mn.
2016 Rs. Mn.
Profit for the Year after Payment of all Expenses and Providing for Depreciation, Possible Loan Losses and Contingencies before VAT, NBT and Tax 17,523 16,094VAT on Financial Services 3,083 2,405NBT on Financial Services 411 386Provision for Income Tax 4,419 3,805Net Profit 9,610 9,498
244
National Savings Bank Annual Report 2017
Annual Report of Board of Directors
Subordinated liabilities of the Bank as at 31 December 2017 consisted Rs. 6 Bn. rated, unsecured subordinated and redeemable debenture of Rs.100.00 issued on 29 December 2016 on private placement. Information is given in Note 35 respective on page 339.
ShareholdingShareholding
The Government of Sri Lanka is the sole shareholder of the National Savings Bank.
ReservesReserves
The Bank’s Reserves consist of –
2017Rs. Mn.
2016 Rs. Mn.
Statutory Reserve Fund 3,003 2,522Revaluation Reserve 7,793 3,297Retain Earnings 2,229 2,379
Other Reserves 20,497 17,848
33,522 26,046
Information on changes of reserves is given in the Statement of Changes in Equity on page 260.
Contribution to the GovernmentContribution to the Government
The Bank contributed Rs. 13,440 Mn. by way of taxes and levies to the Government in 2017 (2016 – Rs. 19,251 Mn.). This consisted of Rs. 4,419 Mn. of Income Tax (2016 – Rs. 3,805 Mn.), Rs. 3,083 Mn. of Value Added Tax (2016 – Rs. 2,406 Mn.), Rs. 411 Mn. of Nation Building Tax (2016 – Rs. 386 Mn.), Rs. 320 Mn. of Special Fee (2016 – Rs. 533 Mn.), Rs. 5,111 Mn. of contribution to the Consolidated Fund (2016 – Rs. 12,026 Mn.) and Rs. 96 Mn. of contributions to National Insurance Trust Fund (2016 – Rs. 95 Mn.).
Service Charges to PostmasterService Charges to Postmaster General (PMG)General (PMG)
Service charges to the PMG for 2017 amounting to Rs. 141 Mn. has been provided for on the same basis as in 2016.
Pension FundPension Fund
A sum of Rs. 489 Mn. (2016 – Rs. 829 Mn.) has been provided in the Financial Statements on account of 6,423 employees (including retired employees) who are eligible for the Non-Contributory Pension Scheme.
Corporate Sustainability and Corporate Sustainability and ResponsibilityResponsibility
The programmes carried out under the Corporate Social Responsibility (CSR) are detailed on pages 135 to 139 in this Annual Report.
Property, Plant and Equipment andProperty, Plant and Equipment and Intangible AssetsIntangible Assets
The value of Property, Plant & Equipment and Intangible Assets as at the year end 2017 was Rs. 15,108 Mn. and Rs. 959 Mn. respectively (Rs. 10,188 Mn. and Rs. 639 Mn. in 2016).
The total capital expenditure incurred by the Bank on the acquisition of Property, Plant & Equipment and Intangible Assets (including building work-in-progress and improvements to rent/leasehold buildings) during the year amounted to Rs. 1,109 Mn. (2016 – Rs. 750 Mn.) and Group amounted to Rs. 1,111 Mn. (2016 – Rs. 751 Mn.), the details of which are given in Notes 27 and 28 to the Financial Statements on pages 315 to 322 of this Annual Report.
Market Value of Freehold PropertyMarket Value of Freehold Property
The Bank carried out a revaluation on entire class of freehold land and buildings of the Bank as of 31 December 2017 in accordance with the Section 3 of the Central Bank Direction No. 01 of 2014 on “Valuation of Immovable Properties of Licensed Specialised Banks”.
The revaluation process of the land and buildings of the Bank was carried out by professionally-qualified independent valuers as per above Direction. The Board of Directors is on the view that revalued amounts of freehold land and buildings are not in excess of its market value.
245
National Savings Bank Annual Report 2017
Annual Report of Board of Directors
Events after the Reporting DateEvents after the Reporting Date
No circumstances have arisen since the Reporting date which would require adjustments to, or disclosure in the accounts, other than those disclosed in Note 46 to the Financial Statements.
Outstanding LitigationOutstanding Litigation
In the opinion of the Directors and the Bank’s lawyers, outstanding litigation against the Bank disclosed in Note 45 to the Financial Statements will not have a material impact on the financial position of the Bank or its future operations.
Board of DirectorsBoard of Directors
The Board of Directors comprises seven Directors including the Chairman and two Ex Officio Members representing the Ministry of Finance and the Postmaster General. Under the provisions of Section 11 (1) of the NSB Act No. 30 of 1971 as amended by Act No. 28 of 1995 the Chairman and other four Directors are appointed by the Minister. The following were the Directors during the year and their brief profiles appear on page 156 of this Annual Report.
Name of the Director Period Status
Mr Aswin De Silva, Chairman Appointed w.e.f. 09.02.2015 NED/NIND
Mr D L P R Abeyaratne, Director (Ex Officio)
Appointed w.e.f. 09.02.2012 NED/NIND
Mr Suranga Naullage, Director Appointed w.e.f. 09.02.2015 NED/NIND
Mr Ajith Pathirana, Director Appointed w.e.f. 20.03.2015 NED/NIND
Mr A K Seneviratne, Director (Ex Officio)
Appointed w.e.f. 27.05.2015 NED/NIND
Mr Chandima Hemachandra, Director
Appointed w.e.f. 02.11.2015 NED/NIND
Mr Anil Rajakaruna, Director Appointed w.e.f. 02.11.2015 NED/NIND
NIND - Non-Independent Directors’, IND - Independent, NED - Non-Executive Director
Directors’ Remuneration and Directors’ Remuneration and Other BenefitsOther Benefits
Details of Directors’ emoluments and other benefits in respect of the Bank and Group for the financial year 2017 are given in Note 40 to the Financial Statements.
Board SubcommitteesBoard Subcommittees
The Board while assuming the overall responsibility and accountability has also appointed the following Board Subcommittees to ensure conformity with Corporate Governance Standards of the Central Bank and other statutory compliances.
Composition of the Board Subcommittees including the mandatory four as at 31 December 2017 are as follows:
Board Audit CommitteeBoard Audit Committee
Mr D L P R Abeyaratne Chairman (Appointed w.e.f. 30.11.2015)
Mr A K Seneviratne Member (Appointed w.e.f. 04.06.2015)
Mr Anil Rajakaruna Member (Appointed w.e.f. 30.11.2015)
The Report of the Board Audit Committee is given on pages 190 and 191.
Board Human Resource and Board Human Resource and Remuneration CommitteeRemuneration Committee
Mr Aswin De Silva Chairman (Appointed w.e.f. 12.03.2015)
Mr D L P R Abeyaratne Member (Appointed w.e.f. 12.03.2015)
Mr Ajith Pathirana Member (Appointed w.e.f. 30.11.2015)
The Report of the Board Human Resource and Remuneration Committee is given on pages 193 and 194.

246
National Savings Bank Annual Report 2017
Annual Report of Board of Directors
Board Nomination CommitteeBoard Nomination Committee
Mr D L P R Abeyaratne
Chairman (Appointed w.e.f. 03.02.2017 and member
from 30.11.2015 upto 03.02.2017)
Mr Aswin de Silva Chairman (Resigned w.e.f. 03.02.2017)
Mr Ajith Pathirana Member (Appointed w.e.f. 30.04.2015)
Mr A K Seneviratne Member (Appointed w.e.f. 03.02.2017)
The Report of the Board Nomination Committee is given on page 195.
Board Integrated Risk Management Board Integrated Risk Management CommitteeCommittee
Mr A K Seneviratne Chairman (Appointed w.e.f. from 30.11.2015)
Mr Suranga Naullage Member (Appointed w.e.f. 30.11.2015)
Mr Chandima Hemachandra Member (Resigned w.e.f. 14.08.2017)
Mr Anil Rajakaruna Member (Appointed w.e.f. 14.08.2017)
The Report of the Board Integrated Risk Management Committee is given on pages 196 and 197.
Board Credit CommitteeBoard Credit Committee
Mr Aswin De Silva Chairman (Appointed w.e.f. 03.02.2017)
Mr Anil Rajakaruna Member (Appointed w.e.f. 03.02.2017
and Resigned w.e.f. 14.08.2017)
Mr Chandima Hemachandra Member (Appointed w.e.f. 03.02.2017)
Mr Ajith Pathirana Member (Appointed w.e.f. 14.08.2017)
The Report of the Board Credit Committee is given on pages 198 and 199.
Board Information TechnologyBoard Information Technology Strategy CommitteeStrategy Committee
Mr Aswin De Silva Chairman (Appointed w.e.f. 03.02.2017)
Mr D L P R Abeyaratne Member (Appointed w.e.f. 03.02.2017)
Mr Chandima Hemachandra Member (Appointed w.e.f. 03.02.2017)
The Report of the Board Information Technology Strategy Committee is given on page 200.
Directors’ MeetingsDirectors’ Meetings
The number of meetings held by Board of Directors, Board Audit Committee, Board Nomination Committee, Board Integrated Risk Management Committee, Board Human Resource and Remuneration Committee, Board Credit Committee and Board Information Technology Strategy Committee and the attendance of Directors for the aforesaid meetings are given on Corporate Governance Report (page 171) of this Annual Report.
Directors’ Interests in ContractsDirectors’ Interests in Contracts
Directors’ interests in contracts with the Bank, both direct and indirect are referred to in Note 40 to the Financial Statements. These interests have been declared at the Board meetings. The Directors do not have any direct or indirect interest in other contracts or proposed contracts with the Bank.
Related Party TransactionsRelated Party Transactions
The Directors have also disclosed the transactions if any, that could be classified as related party transactions in terms of Sri Lanka Accounting Standard (LKAS) 24 – “Related Party Disclosures” which is adopted in the preparation of the Financial Statements. Those transactions disclosed by the Directors are given in Note 40 to the Financial Statements forming part of the Annual Report of the Board of Directors.
247
National Savings Bank Annual Report 2017
Annual Report of Board of Directors
Chief Executive Officer (CEO)Chief Executive Officer (CEO)
The General Manager is the Chief Executive Officer of the Bank and is appointed by the Board of Directors. The General Manager has the right to be present at, and to participate in the meetings of the Board of Directors.
Human ResourcesHuman Resources
The Bank continued to develop and maintain dedicated and highly-motivated employees who are committed to create sustainable value through high quality service. Significant investments have been made in the development of quality of Human Capital of the Bank. The policies and procedures adopted by the Bank to upgrade Human Capital is described the 2017 Story on page 108.
Environmental ProtectionEnvironmental Protection
The Bank has taken initiatives to safeguard and enhance the environment which are vital for sustainable development and growth of the Bank. The Bank and the Group have not engaged in any activity that is harmful or hazardous to environment.
Statutory PaymentsStatutory Payments
The Directors, to the best of their knowledge and belief, are satisfied that all statutory payments due to the Government and in relation to the employees have been made in time.
Risk Management, Internal Controls and Risk Management, Internal Controls and Management Information SystemsManagement Information Systems
The Board of Directors assumes overall responsibility for managing risk. For this purpose, the Board of Directors has instituted and implemented an effective and comprehensive system of internal controls and management information systems in the Bank. Internal control systems have been redesigned to mitigate the risks to which the Bank is exposed, to provide reasonable assurance against material misstatements or loss. There is an ongoing process for identifying, evaluating and managing the risks that are faced by the Bank. The specific measures taken by the Bank
in mitigating the risk are detailed on pages 201 to 238 of this Report.
Corporate GovernanceCorporate Governance
In the Management of the Bank, the Directors have placed emphasis on conforming with, the best Corporate Governance Practices and Procedures. Accordingly, systems and structures have been introduced/improved from time to time to enhance risk management measures and to improve accountability and transparency.
Compliance with Laws, Regulations and Compliance with Laws, Regulations and Prudential RequirementsPrudential Requirements
The Bank has at all times ensured that it complied with National Savings Bank Act and all other applicable laws, regulations and prudential requirements.
Government GuaranteeGovernment Guarantee
The Government of Sri Lanka guarantees the repayment of the monies deposited with the Bank together with interest thereon.
AuditorsAuditors
The Auditor General carried out the audit of the Financial Statements of the Bank for the financial year ended 31 December 2017.
By Order of the Board,
Aswin De Silva M A P MuhandiramChairman Secretary to the Board
12 March 2018Colombo

248
National Savings Bank Annual Report 2017
The responsibility of the Directors in relation to the Financial Statements of the National Savings Bank (Bank) and Consolidated Financial Statements of the Bank and its Subsidiary (Group) is set out in this statement.
Financial StatementsFinancial Statements
The Directors of the Bank are responsible for ensuring that the Bank and the Group keep proper books of accounts of all the transactions and prepare Financial Statements in accordance with Generally Accepted Accounting Principles, Sri Lanka Accounting Standards’ and Sri Lanka Financial Reporting Standards that give a true and fair view of the financial position of the Bank and the Group at the end of each financial year in compliance with the relevant statutory requirements. The Financial Statements comprise of Statement of Comprehensive Income, Statement of Financial Position as at 31 December 2017, Statement of Changes in Equity, Statement of Cash Flows, Significant Accounting Policies and Notes thereto.
The Financial Statements of the Bank and its Subsidiary give a true and fair view of:
1. Financial position of the Bank and its Subsidiary as at 31 December 2017; and
2. Financial performance of the Bank and its Subsidiary for the financial year ended 31 December 2017.
In preparing these Financial Statements, the Directors are required to ensure that:
1. The accounting policies adopted to prepare the Financial Statements which are depicted in pages 265 to 370 were appropriate according to the existing financial reporting frame work. These policies were consistently applied and adequately disclosed.
2. Reasonable and prudent judgements have been made where necessary to ensure the proper reflection of the form and substance of transaction when preparing the Financial Statements.
3. All applicable Accounting Standards as relevant have been followed.
As per the Provisions of the Finance Act No. 38 of 1971, the Banking Act No. 30 of 1988 and Section 7 (i) of NSB Act No. 30 of 1971, the Board of Directors is required to control and administer the affairs and the business of the Bank.
The Board of Directors ensures that the Financial Statements comply with the prescribed format issued by the Central Bank for Licensed Specialised Banks.
The Board of Directors are also responsible for ensuring that proper accounting records which correctly record and explain the Bank’s financial position, with reasonable accuracy at any point of time is determined by the Bank, enabling preparation of the Financial Statements.
The Board of Directors accepts the responsibility for the integrity and objectivity of the Financial Statements presented in this Annual Report. (Financial Statements are exhibited on page 256.) The Financial Statements for the year 2017 prepared and presented in this Annual Report are consistent with the underlying books of accounts and are in conformity with the requirements of Sri Lanka Accounting Standards, Sri Lanka Accounting and Auditing Standards Act No. 15 of 1995 and Banking Act No. 30 of 1988 and amendments thereto.
Internal ControlsInternal Controls
The Board of Directors has been responsible for taking reasonable measures and care to safeguard the assets of the Bank and the Group, detect frauds and other irregularities and has also instituted an effective and comprehensive system of internal controls and an effective system of monitoring its effectiveness which includes internal audit. The Directors ensure that the Financial Statements are reviewed by them directly at their regular meetings and also through the Board Audit Committee. The Directors’ Statement on Internal Control Over Financial Reporting is given on page 250 of this Annual Report and Auditor General’s Assurance Report on the Bank’s Internal Control is given on page 252.
Statement of DirectorsStatement of Directors’’ Responsibility for Responsibility forFinancial ReportingFinancial Reporting
249
National Savings Bank Annual Report 2017
Audit ReportAudit Report
The Auditor General has been made available with all records of the Bank including the Financial Statements by the Board of Directors and provided every opportunity to undertake the inspections they considered appropriate all of which the Auditor General’s Department has examined and have expressed the Auditor General’s opinion which appears as reported by him on page 255 of this Annual Report.
Compliance ReportCompliance Report
The Directors confirm that to the best of their knowledge and belief that all taxes payable by the Bank and the Group and all contributions and taxes payable on behalf of and in respect of employees of the Bank and the Group, and all other known statutory dues to the Government and the other relevant regulatory and statutory authorities which were due and payable by the Bank and the Group as at the date of Statement of Financial Position have been paid or where relevant provided for. Further, the Directors have confirmed that after considering the financial position, operating conditions and regulatory and other factors required to be addressed in the “Corporate Governance Code” issued jointly by The Institute of Chartered Accountants of Sri Lanka (CA Sri Lanka) and the Securities and Exchange Commission of Sri Lanka (SEC), the Bank and the Group have adequate resources to continue in operation for the foreseeable future and to justify the application of the going concern basis in preparing these Financial Statements and the Board has taken all necessary measures to comply with the directives issued by the Central Bank of Sri Lanka.
By Order of the Board,
M A P MuhandiramSecretary to the Board
12 March 2018Colombo
Statement of Directors Responsibility for Financial Reporting

250
National Savings Bank Annual Report 2017
This report has been issued in line with the Banking Act Direction No. 12 of 2007, Section 3 (8) (ii) (b), and prepared based on the guidelines issued by The Institute of Chartered Accountants of Sri Lanka (CA Sri Lanka).
The Board of Directors (Board) is responsible for ensuring that an adequate and effective system of internal control is established and maintained at the National Savings Bank. However, such a system is designed to manage the Bank’s significant risk areas within acceptable risk parameters, rather than eliminating the risk of failure to achieve business objectives of the Bank. Accordingly, the system of internal controls can only provide reasonable but not absolute assurance against material misstatement of management and financial information and records or against financial losses or frauds.
The Board has established an ongoing process for identifying, evaluating and managing the significant risks faced by the Bank and this process includes enhancing the system of internal controls as and when there are changes to business environment or regulatory requirements and other guidelines. The process is regularly reviewed by the Board and confirmed the compliance with the Guidance for Directors of the Bank’s on the Directors Statement on Internal Controls issued by The Institute of Chartered Accountants of Sri Lanka. The Board has assessed the internal control system taking into principles for the assessment of Internal Control System as given in that guidance.
The Board is of the view that the system of internal controls in place is sound and adequate to provide reasonable assurance regarding the reliability of financial reporting, and the preparation of Financial Statements for external purposes and is in accordance with the relevant accounting principles and regulatory requirements.
The Management assists the Board in the implementation of the Board’s policies and procedures on risk and control by identifying and assessing the risks faced by the Bank, and in the design, operation and monitoring of suitable internal controls to mitigate and control these risks.
The Board has also put in place the system of reviewing the design and the effectiveness of system of internal control periodically. The key processes, among other things include the following:
zz The Board Subcommittees have been established with defined scopes and functions to assist the Board in ensuring the effectiveness of the Bank’s operations and that the Bank’s operations are in accordance with the corporate objectives, strategies, and policies and business directions that have been approved.
zz The Board Audit Committee (BAC) reviews periodically the internal control issues identified by the Internal Audit Division of the Bank, the External Auditors, Regulatory Authorities and corrective actions taken to rectify such deficiencies. The Auditor General carries out the external audit of the Bank. The Superintendent of the Government Audit is generally invited to BAC meetings.
zz The BAC reviews the internal audit function with particular emphasis on the scope of audits and quality of the same. The activities attended to by the BAC during the year 2017 are set out in the Board Audit Committee report appearing on page 190 of this Annual Report. The Internal Audit Division of the Bank carries out audit of branches, divisions and other units as per the Annual Audit Plan. The frequency of audit is determined by the level of risk assessed. The Audit Plan is approved by the BAC for implementation. The Internal Audit Division carries out audit checks to ensure compliance with policies and procedures and the effectiveness of the internal control systems and reports its findings in respect of any non-compliance. Audits are carried out to provide an independent and objective report on operational and management activities. The findings of the audits are submitted to the BAC for review at their periodic meetings. The activities of the BAC, along with minutes of the Committee meetings are submitted for information of the Board on a periodic basis.
zz The Board Integrated Risk Management Committee (BIRMC) has been established by the Board to assist the Board to oversee the overall management of principal areas of risk of the Bank. The Board has also established an independent Compliance Unit which ensures that Bank’s activities are conducted in accordance with
Directors’ Statement on Internal Control Directors’ Statement on Internal Control Over Financial ReportingOver Financial Reporting
251
National Savings Bank Annual Report 2017
applicable laws, regulations and regulatory directives and any issues of non-compliance are reported to BIRMC periodically. The report on the Risk Assessment is submitted by the BIRMC to the Board periodically.
zz Management level committees have also been functioning with appropriate empowerment to ensure effective management and supervision of Bank’s core areas in the day-to-day business operations. The assessment covered only the process applied by the Bank and did not include the processes carried out by its Subsidiary.
The Bank adopted the new Sri Lanka Accounting Standards comprising LKAS and SLFRS in 2012. Since adoption of such Sri Lanka Accounting Standards, continuous monitoring and progressive enhancement on processes to comply with new requirements of recognition, measurement, classification and disclosure are being made. The Board has given due consideration to the effect of SLFRS 9 – “Financial Instruments”, which becomes applicable for financial reporting periods beginning on or after 1st January 2018. This will have a significant impact on the calculation of impairment on financial instruments as it uses forward looking “expected credit loss model” compared to the previously applied “incurred credit loss model” under LKAS 39. The Bank has obtained the services of an External Consultant for SLFRS 9 implementation and performed the Diagnostic Phase (Preliminary impact assessment exercise) and implementation phase (solution development) on SLFRS 9. The Bank has undertaken a significant analysis of how SLFRS 9 should be implemented and has taken tentative accounting policy decisions.
ConfirmationConfirmation
Based on the above processes, the Board of Directors confirms that the financial reporting system of the Bank has been designed to provide reasonable assurance regarding their liability of financial reporting and the preparation of Financial Statements for external purposes has been done in accordance with Sri Lanka Accounting Standards and regulatory requirements of the Central Bank of Sri Lanka.
Review of the Statement by Review of the Statement by the External Auditorsthe External Auditors
The External Auditors, the Auditor General will review the above Directors’ Statement on Internal Control over Financial Reporting for the year ended 31 December 2017 and report to the Board of Directors. Their Report on the Statement of Internal Control Over Financial Reporting is given on page 252 of this annual report.
By Order of the Board,
Aswin De SilvaChairman
D L P R AbeyaratneChairman – Board Audit Committee/Director
Suranga NaullageDirector
12 March 2018Colombo
Directors’ Statement on Internal Control Over Financial Reporting

252
Independent Assurance Report on Internal ControlIndependent Assurance Report on Internal Control
The Chairman
National Savings Bank
Assurance Report of the Auditor General Assurance Report of the Auditor General to the Board of Directors on the Directors’ to the Board of Directors on the Directors’ Statement on Internal Control of National Statement on Internal Control of National Savings BankSavings Bank
Introduction
This report is to provide assurance on the Directors’ Statement on Internal Control (“Statement”) of National Savings Bank included in the annual report for the year ended 31st December 2017.
Management’s Responsibility
Management is responsible for the preparation and presentation of the Statement in accordance with the “Guidance for Directors of Bank on the Directors’ Statement on Internal Control” issued in compliance with the Section 3 (8) (ii) (b) of the Banking Act Direction No. 12 of 2007, by the Institute of Chartered Accountants of Sri Lanka.
My Responsibilities and Compliance with SLSAE 3050
My responsibility is to issue a report to the Board of Directors on the Statement based on the work performed. I conducted my engagement in accordance with Sri Lanka Standard on Assurance Engagements SLSAE 3050 – Assurance Report for Banks on Directors’ Statement on Internal Control issued by the Institute of Chartered Accountants of Sri Lanka.
Summary of Work Performed
My engagement has been conducted to assess whether the Statement is both supported by the documentation prepared by or for Directors and appropriately reflects the process the Directors have adopted in reviewing the system of internal control for the Bank.
The procedures performed are limited primarily to inquiries of bank personnel and the existence of documentation on a sample basis that supports the process adopted by the Board of Directors.
SLSAE 3050 does not require me to consider whether the Statement covers all risks and controls, or to form an opinion on the effectiveness of the Bank’s risk and control procedures. SLSAE 3050 also does not require me to consider whether the processes described to deal with material internal control aspects of any significant problems disclosed in the annual report will, in fact, remedy the problems.
My Conclusion
Based on the procedures performed, nothing has come to my attention that causes me to believe that the Statement included in the annual report is inconsistent with my understanding of the process the Board of Directors has adopted in the review of the design and effectiveness of internal control over financial reporting of the Bank.
H M Gamini WijesingheAuditor General

253
National Savings Bank Annual Report 2017
The Financial Statements of the National Savings Bank and the Consolidated Financial Statements of the Bank and its Subsidiary (Group) as at 31 December 2017 are prepared and presented in compliance with following:
zz National Savings Bank Act No. 30 of 1971 and amendments thereto.
zz Finance Act No. 38 of 1971.
zz Sri Lanka Financial Reporting Standards (SLFRSs/LKASs) issued by The Institute of Chartered Accountants of Sri Lanka.
zz Sri Lanka Accounting and Auditing Standards Act No. 15 of 1995.
zz Banking Act No. 30 of 1988 as amended and Directions issued by Central Bank of Sri Lanka there under relating to Financial Statements formats and disclosure of information.
zz Code of Best Practices on Corporate Governance issued by The Institute of Chartered Accountants of Sri Lanka.
zz The Banking Act Direction No. 12 of 2007 on Corporate Governance issued by Central Bank of Sri Lanka.
The formats used in the preparation of the Financial Statements and disclosures made, comply with the specified formats prescribed by the Central Bank of Sri Lanka which are also in compliance with the disclosure requirements of the Sri Lanka Accounting Standard – LKAS 1 on “Presentation of Financial Statements”. The Group presents the financial results to its users on a quarterly basis.
The Significant Accounting Policies have been consistently applied by the Group. Application of Significant Accounting Policies and estimates that involved a high degree of judgement and complexity were discussed with the Bank’s External Auditors and the Board Audit Committee. Comparative information has been reclassified wherever necessary to comply with the current presentation and material departures, if any, have been disclosed and explained.
We confirm that to the best of our knowledge, the Financial Statements, Significant Accounting Policies and other financial information included in this Annual Report, fairly present in all material aspects of the financial position, results of the operations and the cash flows of the Group during the period under review. We also confirm that the Group has adequate resources to continue in operation and has applied the going concern basis in preparing these Financial Statements.
We are responsible for establishing, implementing and maintaining Internal Controls and Procedures of the Bank and its Subsidiary. We ensure that effective Internal Controls and Procedures are in place ensuring material information relating to the Group is made known to us for safeguarding assets, preventing and detecting fraud and/or error as well as other irregularities, which are reviewed, evaluated and updated on an ongoing basis. We are satisfied that there were no significant deficiencies and weaknesses in the design or operation of the Internal Controls and Procedures, to the best of our knowledge. We confirm, based on our evaluations, that there were no significant deficiencies and material weaknesses in the design or operation of internal controls and any fraud that involved management or other employees. The Bank’s Internal Auditors also conduct periodic reviews to ensure that the Internal Controls and Procedures are consistently followed.
Directors’ Statement on Internal Control over Financial Reporting is provided on page 250 of this Annual Report. The Auditor General have audited the effectiveness of the Internal Control adapted by the Bank and have given unqualified opinion is provided on page 252.
The Financial Statements of the Bank and its Subsidiary were audited by the Auditor General. The Auditor General’s Report on the Bank’s Consolidated Financial Statements is given on page 255 of this Annual Report. The Board Audit Committee, inter alia, reviewed all Internal Audit and Inspection Programmes, the efficiency of Internal Control
General Manager/CEO’s and Deputy General Manager’s General Manager/CEO’s and Deputy General Manager’s (Finance and Planning) Statement of Responsibility(Finance and Planning) Statement of Responsibility

254
National Savings Bank Annual Report 2017
Systems and Procedures and also reviewed the Significant Accounting Policies and their adherence to statutory and regulatory requirements, the details of which are given in the Board Audit Committee report on pages 190 and 191 of this Annual Report. To ensure complete independence, the Auditor General and the Internal Auditors have full and free access to the members of the Board Audit Committee to discuss any matter of substance. However, there are inherent limitations that should be recognised in weighing the assurances provided by any system of internal control and accounting.
We confirm that to the best of our knowledge –
zz The Bank and Group have complied with all applicable laws and regulations and guidelines and there are no material litigations against the Group other than those disclosed in Note 45 on page 351 of the Financial Statements;
zz There are no material non-compliance;
zz All taxes, duties, levies and all statutory payments payable by the Bank and the Group and all contributions, levies and taxes payable on behalf of and in respect of the employees of the Bank and the Group as at 31 December 2017 have been paid, or where relevant, provided for.
S D N Perera General Manager/CEO
K B WijeyaratneDeputy General Manager (Finance and Planning)
12 March 2018Colombo
General Manager/CEO’s and Deputy General Manager’s (Finance and Planning) Statement of Responsibility
255
Auditor General’s ReportAuditor General’s Report
The Chairman
National Savings Bank
Report of the Auditor General on the Financial Report of the Auditor General on the Financial Statements of the National Savings Bank and its Statements of the National Savings Bank and its subsidiary for the year ended 31 December 2017subsidiary for the year ended 31 December 2017
The audit of the Financial Statements of the National Savings Bank (“Bank”) and the Consolidated Financial Statements of the Bank and its subsidiary (“Group”) for the year ended 31 December 2017 comprising the Statement of Financial Position as at 31 December 2017, the Statement of Comprehensive Income, Statement of Changes in Equity and Statement of Cash Flows for the year then ended, and a summary of significant accounting policies and other explanatory information, was carried out under my direction in pursuance of provisions in Article 154(1) of the Constitution of the Democratic Socialist Republic of Sri Lanka.
Board’s Responsibility for the Financial Statements
The Board of Directors (“Board”) is responsible for the preparation and fair presentation of these Financial Statements in accordance with Sri Lanka Accounting Standards and for such internal control as Board determines is necessary to enable the preparation of Financial Statements that are free from material misstatements, whether due to fraud or error.
Auditor’s Responsibility
My responsibility is to express an opinion on these Financial Statements based on my audit. I conducted my audit in accordance with Sri Lanka Auditing Standards consistent with International Standards of Supreme Audit Institutions (ISSAI 1000-1810). Those Standards require that I comply with ethical requirements and plan and perform the audit to obtain reasonable assurance about whether the Financial Statements are free from material misstatements.
An audit involves performing procedures to obtain audit evidence about the amounts and disclosures in the Financial Statements. The procedures selected depend on the Auditor’s judgement, including the assessment of the risk of material misstatement of the Financial Statements, whether due to fraud or error. In making those risk assessments, the Auditor considers internal control relevant to
the Bank’s preparation and fair presentation of the Financial Statements in order to design audit procedures that are appropriate in the circumstances, but not for the purpose of expressing an opinion on the effectiveness of the Bank’s internal control. An audit also includes evaluating the appropriateness of Accounting Policies used and the reasonableness of accounting estimates made by Board, as well as evaluating the overall presentation of the Financial Statements.
I believe that the audit evidence I have obtained is sufficient and appropriate to provide a basis for my audit opinion.
Opinion – Bank
In my opinion, the Financial Statements give a true and fair view of the financial position of the Bank as at 31 December 2017 and its financial performance and its cash flows for the year then ended in accordance with Sri Lanka Accounting Standards.
Opinion – Group
In my opinion the Consolidated Financial Statements give a true and fair view of the financial position of the Bank and its subsidiary as at 31 December 2017 and its financial performance and its cash flows for the year then ended in accordance with Sri Lanka Accounting Standards.
Report on Other Legal and Regulatory Requirement
These Financial Statements had been presented the information required by the Banking Act No. 30 of 1988 and subsequent amendments thereto.
Report to Parliament
My report to Parliament in pursuance of provisions in Article 154 (6) of the Constitution will be tabled in due course.
H M Gamini WijesingheAuditor General

256
National Savings Bank Annual Report 2017
Bank Group
For the year ended 31 DecemberNote
2017Rs. ’000
2016Rs. ’000
Change %
2017Rs. ’000
2016Rs. ’000
Change %
Gross income 3 107,816,909 87,399,144 23 108,055,746 88,038,610 23
Interest income 103,399,962 86,390,039 20 104,245,541 87,142,784 20Less: Interest expenses 78,444,825 60,923,221 29 78,987,596 61,453,898 29
Net interest income 4 24,955,137 25,466,818 (2) 25,257,945 25,688,886 (2)Fee and commission income 782,776 650,164 20 785,077 651,160 21Less: Fee and commission expenses 109,082 137,432 (21) 113,037 140,122 (19)
Net fee and commission income 5 673,694 512,732 31 672,040 511,038 32Net gain/(loss) from trading 6 1,206,408 (39,270) 3,172 1,520,740 (136,897) 1,211Net gain/(loss) from financial instruments designated at fair value through profit or loss 7 – – – – – –Net gain/(loss) from financial investments 8 707,491 40,923 1,629 707,491 40,923 1,629Other operating income (net) 9 1,720,272 357,288 381 796,897 340,640 134
Total operating income 29,263,002 26,338,490 11 28,955,113 26,444,590 9Less: Impairment charge for loans and other losses 10 693,233 (99,693) 795 693,233 (99,693) 795
Net operating income 28,569,769 26,438,183 8 28,261,880 26,544,283 6
Less: Expenses Personnel expenses 11 6,886,505 6,235,370 10 6,918,813 6,266,515 10Other expenses 12 4,160,911 4,108,538 1 4,107,116 4,068,918 1
Operating profit before value added tax (VAT) and nation building tax (NBT) 17,522,354 16,094,275 9 17,235,951 16,208,850 6Less: Value added tax on financial services 3,082,619 2,405,618 28 3,168,299 2,423,091 31 Nation building tax on financial services 411,016 385,670 7 422,440 388,482 9
Operating profit after value added tax (VAT) and nation building tax (NBT) 14,028,719 13,302,987 5 13,645,212 13,397,277 2
Profit before income tax 14,028,719 13,302,987 5 13,645,212 13,397,277 2Less: Income tax expenses 13 4,419,019 3,805,271 16 4,595,065 3,834,995 20
Profit for the year 9,609,700 9,497,716 1 9,050,147 9,562,282 (5)
Profit attributable to:Equity holders of the Bank 9,609,700 9,497,716 1 9,050,147 9,562,282 (5)
Profit for the year 9,609,700 9,497,716 1 9,050,147 9,562,282 (5)
Earnings per share on profit Basic earnings per ordinary share (Rs.) 14 15.50 29.68 (48) 14.60 29.88 (51)Diluted earnings per ordinary share (Rs.) 15.50 29.68 (48) 14.60 29.88 (51)
Statement of Comprehensive IncomeStatement of Comprehensive Income
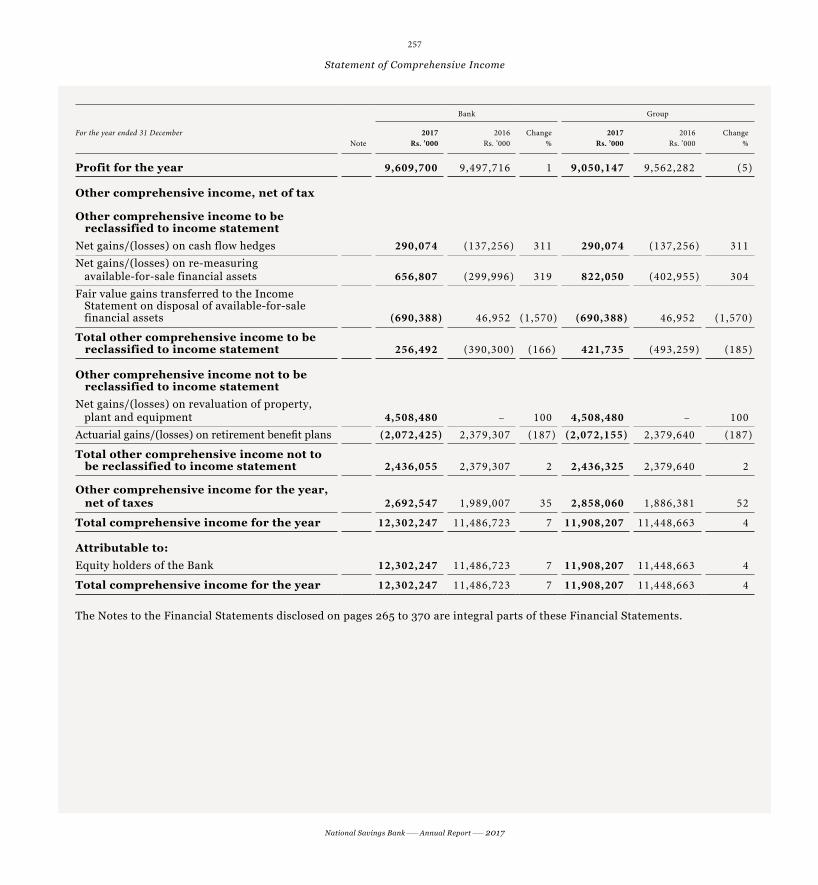
257
National Savings Bank Annual Report 2017
Bank Group
For the year ended 31 DecemberNote
2017Rs. ’000
2016Rs. ’000
Change %
2017Rs. ’000
2016Rs. ’000
Change %
Profit for the year 9,609,700 9,497,716 1 9,050,147 9,562,282 (5)
Other comprehensive income, net of tax
Other comprehensive income to be reclassified to income statementNet gains/(losses) on cash flow hedges 290,074 (137,256) 311 290,074 (137,256) 311Net gains/(losses) on re-measuring available-for-sale financial assets 656,807 (299,996) 319 822,050 (402,955) 304Fair value gains transferred to the Income Statement on disposal of available-for-sale financial assets (690,388) 46,952 (1,570) (690,388) 46,952 (1,570)
Total other comprehensive income to be reclassified to income statement 256,492 (390,300) (166) 421,735 (493,259) (185)
Other comprehensive income not to be reclassified to income statementNet gains/(losses) on revaluation of property, plant and equipment 4,508,480 – 100 4,508,480 – 100Actuarial gains/(losses) on retirement benefit plans (2,072,425) 2,379,307 (187) (2,072,155) 2,379,640 (187)
Total other comprehensive income not to be reclassified to income statement 2,436,055 2,379,307 2 2,436,325 2,379,640 2
Other comprehensive income for the year, net of taxes 2,692,547 1,989,007 35 2,858,060 1,886,381 52
Total comprehensive income for the year 12,302,247 11,486,723 7 11,908,207 11,448,663 4
Attributable to:Equity holders of the Bank 12,302,247 11,486,723 7 11,908,207 11,448,663 4
Total comprehensive income for the year 12,302,247 11,486,723 7 11,908,207 11,448,663 4
The Notes to the Financial Statements disclosed on pages 265 to 370 are integral parts of these Financial Statements.
Statement of Comprehensive Income

258
National Savings Bank Annual Report 2017
Bank Group
As at 31 December Note 2017Rs. ’000
2016Rs. ’000
Change%
2017Rs. ’000
2016Rs. ’000
Change %
AssetsCash and cash equivalents 16 3,849,627 4,619,699 (17) 3,854,086 4,627,629 (17)Balances with central banks 17 – – – 94 477 (80)Placements with banks 18 23,438,104 19,013,572 23 23,438,104 19,013,572 23Derivative financial instruments 19 1,360,714 2,728,445 (50) 1,360,714 2,728,445 (50)Other financial assets held for trading 20 6,472,314 20,290,588 (68) 9,389,950 27,303,207 (66)Financial assets designated at fair value through profit or loss 21 – – – – – –Loans and receivables to banks 22 27,714,565 31,834,072 (13) 27,971,234 31,834,072 (12)Loans and receivables to other customers 23 360,309,866 291,976,942 23 358,766,093 291,178,121 23Financial investments – available for sale 24 5,693,829 6,227,764 (9) 7,713,852 8,122,516 (5)Financial investments – held to maturity 25 544,273,077 505,824,398 8 547,924,390 507,624,954 8Investments in subsidiaries 26 900,000 150,000 500 – – –Property, plant and equipment 27 12,015,376 7,119,651 69 12,018,679 7,121,823 69Intangible assets 28 380,308 157,271 142 380,655 157,271 142Deferred tax assets 29 – – – – 588 (100)Other assets 30 25,695,689 21,761,440 18 25,976,944 21,890,777 19
Total assets 1,012,103,470 911,703,842 11 1,018,794,797 921,603,453 11
LiabilitiesDue to banks 31 180,439 115,391 56 828,433 2,858,673 (71)Derivative financial instruments 19 956,937 – 100 956,937 – 100Due to other customers 32 737,212,640 657,280,315 12 737,212,640 657,280,315 12Other borrowings 33 217,955,777 207,039,909 5 222,771,969 212,629,427 5Current tax liabilities – – – 137,344 17,153 701Deferred tax liabilities 29 507,063 416,180 22 507,138 416,180 22Other liabilities 34 9,062,425 8,600,056 5 9,107,460 8,608,506 6Subordinated liabilities 35 6,006,411 6,006,411 – 6,006,411 6,006,411 –
Total liabilities 971,881,692 879,458,262 11 977,528,332 887,816,665 10
EquityStated capital/Assigned capital 36 6,700,000 6,200,000 8 6,700,000 6,200,000 8Statutory reserve fund 37 3,002,952 2,522,467 19 3,002,952 2,522,467 19Retained earnings 2,228,885 2,379,307 (6) 2,805,727 3,708,614 (24)Other reserves 38 28,289,941 21,143,806 34 28,757,786 21,355,707 35
Total equity of the owners of the Parent 40,221,778 32,245,580 25 41,266,465 33,786,788 22
Total equity 40,221,778 32,245,580 25 41,266,465 33,786,788 22
Total equity and liabilities 1,012,103,470 911,703,842 11 1,018,794,797 921,603,453 11
Contingent liabilities and commitments 39 18,320,312 24,970,060 (27) 18,320,312 24,970,060 (27)
The Notes to the Financial Statements disclosed on pages 265 to 370 are integral parts of these Financial Statements.
Statement of Financial PositionStatement of Financial Position
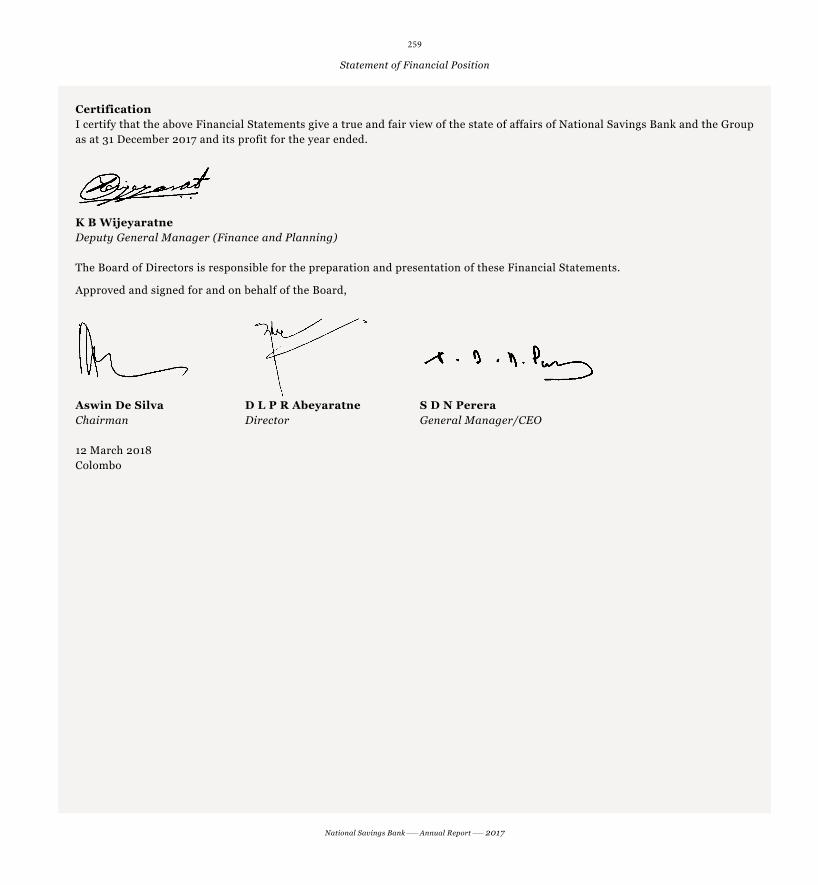
259
National Savings Bank Annual Report 2017
CertificationI certify that the above Financial Statements give a true and fair view of the state of affairs of National Savings Bank and the Group as at 31 December 2017 and its profit for the year ended.
K B WijeyaratneDeputy General Manager (Finance and Planning)
The Board of Directors is responsible for the preparation and presentation of these Financial Statements.
Approved and signed for and on behalf of the Board,
Aswin De Silva D L P R Abeyaratne S D N PereraChairman Director General Manager/CEO
12 March 2018Colombo
Statement of Financial Position

260
National Savings Bank Annual Report 2017
BankBank
Stated capital/ Assigned capital
Rs. ’000
Statutory reserve fund
Rs. ’000
Revaluation reserve
Rs. ’000
Available-for-sale reserve
Rs. ’000
Cash flow hedging reserve
Rs. ’000
Other reserves
Rs. ’000
Retained earnings
Rs. ’000
Total equity
Rs. ’000
Balance as at 1 January 2016 3,200,000 2,047,581 3,296,565 1,631,862 139,106 22,108,709 – 32,423,827
Profit for the year 2016 – – – – – – 9,497,716 9,497,716
Other comprehensive income (net of tax) – – – (253,044) (137,256) – 2,379,307 1,989,007
Total comprehensive income for the year – – – (253,044) (137,256) – 11,877,023 11,486,723
Transaction with equity holders, recognised directly in equity
Transfers to reserves during the period – 474,886 – – – (3,098,147) 2,623,262 –
Contribution to consolidated fund – dividend/levy – – – – – – (12,026,000) (12,026,000)
Contribution to national insurance trust fund – – – – – – (94,977) (94,977)
Transfers to unclaimed deposits reserve/issued share capital 3,000,000 – – – – (2,543,992) – 456,008
Total transactions with equity holders 3,000,000 474,886 – – – (5,642,139) (9,497,716) (11,664,969)
Balance as at 31 December 2016 6,200,000 2,522,467 3,296,565 1,378,818 1,850 16,466,570 2,379,307 32,245,580
Profit for the year 2017 – – – – – – 9,609,700 9,609,700
Other comprehensive income (net of tax) – – 4,508,480 (33,581) 290,074 – (2,072,425) 2,692,547
Total comprehensive income for the year – – 4,508,480 (33,581) 290,074 – 7,537,274 12,302,247
Transaction with equity holders, recognised directly in equity
Transfers to/from reserves during the period – 480,485 (11,728) – – 2,000,000 (2,480,485) (11,728)
Contribution to consolidated fund – dividend/levy – – – – – – (5,111,114) (5,111,114)
Contribution to national insurance trust fund – – – – – – (96,097) (96,097)
Transfers to unclaimed deposits reserve/issued share capital 500,000 – – – – 392,891 – 892,891
Total transactions with equity holders 500,000 480,485 (11,728) – – 2,392,891 (7,687,696) (4,326,048)
Balance as at 31 December 2017 6,700,000 3,002,952 7,793,317 1,345,237 291,924 18,859,461 2,228,885 40,221,778
Statement of Changes in EquityStatement of Changes in Equity

261
National Savings Bank Annual Report 2017
BankBank
Stated capital/ Assigned capital
Rs. ’000
Statutory reserve fund
Rs. ’000
Revaluation reserve
Rs. ’000
Available-for-sale reserve
Rs. ’000
Cash flow hedging reserve
Rs. ’000
Other reserves
Rs. ’000
Retained earnings
Rs. ’000
Total equity
Rs. ’000
Balance as at 1 January 2016 3,200,000 2,047,581 3,296,565 1,631,862 139,106 22,108,709 – 32,423,827
Profit for the year 2016 – – – – – – 9,497,716 9,497,716
Other comprehensive income (net of tax) – – – (253,044) (137,256) – 2,379,307 1,989,007
Total comprehensive income for the year – – – (253,044) (137,256) – 11,877,023 11,486,723
Transaction with equity holders, recognised directly in equity
Transfers to reserves during the period – 474,886 – – – (3,098,147) 2,623,262 –
Contribution to consolidated fund – dividend/levy – – – – – – (12,026,000) (12,026,000)
Contribution to national insurance trust fund – – – – – – (94,977) (94,977)
Transfers to unclaimed deposits reserve/issued share capital 3,000,000 – – – – (2,543,992) – 456,008
Total transactions with equity holders 3,000,000 474,886 – – – (5,642,139) (9,497,716) (11,664,969)
Balance as at 31 December 2016 6,200,000 2,522,467 3,296,565 1,378,818 1,850 16,466,570 2,379,307 32,245,580
Profit for the year 2017 – – – – – – 9,609,700 9,609,700
Other comprehensive income (net of tax) – – 4,508,480 (33,581) 290,074 – (2,072,425) 2,692,547
Total comprehensive income for the year – – 4,508,480 (33,581) 290,074 – 7,537,274 12,302,247
Transaction with equity holders, recognised directly in equity
Transfers to/from reserves during the period – 480,485 (11,728) – – 2,000,000 (2,480,485) (11,728)
Contribution to consolidated fund – dividend/levy – – – – – – (5,111,114) (5,111,114)
Contribution to national insurance trust fund – – – – – – (96,097) (96,097)
Transfers to unclaimed deposits reserve/issued share capital 500,000 – – – – 392,891 – 892,891
Total transactions with equity holders 500,000 480,485 (11,728) – – 2,392,891 (7,687,696) (4,326,048)
Balance as at 31 December 2017 6,700,000 3,002,952 7,793,317 1,345,237 291,924 18,859,461 2,228,885 40,221,778
Statement of Changes in Equity
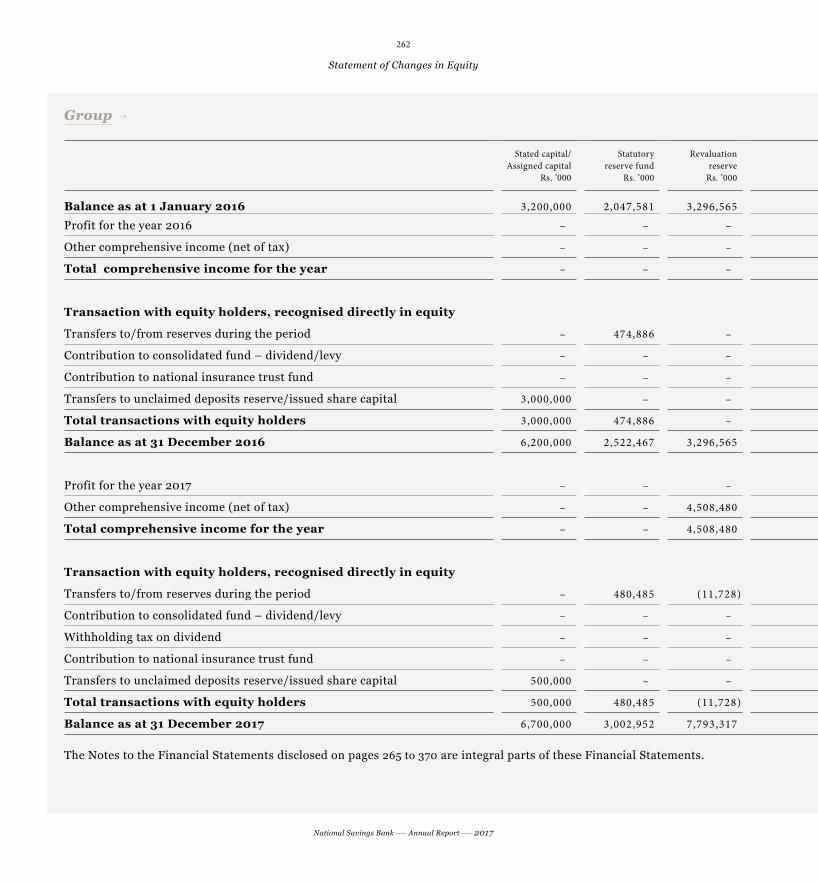
262
National Savings Bank Annual Report 2017
Statement of Changes in Equity
GroupGroup
Stated capital/ Assigned capital
Rs. ’000
Statutory reserve fund
Rs. ’000
Revaluation reserve
Rs. ’000
Available-for-sale reserve
Rs. ’000
Cash flow hedging reserve
Rs. ’000
Other reserves
Rs. ’000
Retained earnings
Rs. ’000
Total equity
Rs. ’000
Balance as at 1 January 2016 3,200,000 2,047,581 3,296,565 1,452,761 139,106 22,582,817 1,285,911 34,004,744
Profit for the year 2016 – – – – – – 9,562,282 9,562,282
Other comprehensive income (net of tax) – – – (356,003) (137,256) – 2,379,640 1,886,381
Total comprehensive income for the year – – – (356,003) (137,256) – 11,941,922 11,448,663
Transaction with equity holders, recognised directly in equity
Transfers to/from reserves during the period – 474,886 – – – (3,078,293) 2,603,408 –
Contribution to consolidated fund – dividend/levy – – – – – – (12,027,650) (12,027,650)
Contribution to national insurance trust fund – – – – – – (94,977) (94,977)
Transfers to unclaimed deposits reserve/issued share capital 3,000,000 – – – – (2,543,992) – 456,008
Total transactions with equity holders 3,000,000 474,886 – – – (5,622,285) (9,519,219) (11,666,619)
Balance as at 31 December 2016 6,200,000 2,522,467 3,296,565 1,096,758 1,850 16,960,532 3,708,614 33,786,788
Profit for the year 2017 – – – – – – 9,050,147 9,050,147
Other comprehensive income (net of tax) – – 4,508,480 131,662 290,074 – (2,072,155) 2,858,060
Total comprehensive income for the year – – 4,508,480 131,662 290,074 – 6,977,992 11,908,207
Transaction with equity holders, recognised directly in equity
Transfers to/from reserves during the period – 480,485 (11,728) – – 2,090,699 (2,571,184) (11,728)
Contribution to consolidated fund – dividend/levy – – – – – – (5,111,114) (5,111,114)
Withholding tax on dividend – – – – – – (102,483) (102,483)
Contribution to national insurance trust fund – – – – – – (96,097) (96,097)
Transfers to unclaimed deposits reserve/issued share capital 500,000 – – – – 392,891 – 892,891
Total transactions with equity holders 500,000 480,485 (11,728) – – 2,483,590 (7,880,878) (4,428,531)
Balance as at 31 December 2017 6,700,000 3,002,952 7,793,317 1,228,420 291,924 19,444,122 2,805,727 41,266,465
The Notes to the Financial Statements disclosed on pages 265 to 370 are integral parts of these Financial Statements.

263
National Savings Bank Annual Report 2017
Statement of Changes in Equity
GroupGroup
Stated capital/ Assigned capital
Rs. ’000
Statutory reserve fund
Rs. ’000
Revaluation reserve
Rs. ’000
Available-for-sale reserve
Rs. ’000
Cash flow hedging reserve
Rs. ’000
Other reserves
Rs. ’000
Retained earnings
Rs. ’000
Total equity
Rs. ’000
Balance as at 1 January 2016 3,200,000 2,047,581 3,296,565 1,452,761 139,106 22,582,817 1,285,911 34,004,744
Profit for the year 2016 – – – – – – 9,562,282 9,562,282
Other comprehensive income (net of tax) – – – (356,003) (137,256) – 2,379,640 1,886,381
Total comprehensive income for the year – – – (356,003) (137,256) – 11,941,922 11,448,663
Transaction with equity holders, recognised directly in equity
Transfers to/from reserves during the period – 474,886 – – – (3,078,293) 2,603,408 –
Contribution to consolidated fund – dividend/levy – – – – – – (12,027,650) (12,027,650)
Contribution to national insurance trust fund – – – – – – (94,977) (94,977)
Transfers to unclaimed deposits reserve/issued share capital 3,000,000 – – – – (2,543,992) – 456,008
Total transactions with equity holders 3,000,000 474,886 – – – (5,622,285) (9,519,219) (11,666,619)
Balance as at 31 December 2016 6,200,000 2,522,467 3,296,565 1,096,758 1,850 16,960,532 3,708,614 33,786,788
Profit for the year 2017 – – – – – – 9,050,147 9,050,147
Other comprehensive income (net of tax) – – 4,508,480 131,662 290,074 – (2,072,155) 2,858,060
Total comprehensive income for the year – – 4,508,480 131,662 290,074 – 6,977,992 11,908,207
Transaction with equity holders, recognised directly in equity
Transfers to/from reserves during the period – 480,485 (11,728) – – 2,090,699 (2,571,184) (11,728)
Contribution to consolidated fund – dividend/levy – – – – – – (5,111,114) (5,111,114)
Withholding tax on dividend – – – – – – (102,483) (102,483)
Contribution to national insurance trust fund – – – – – – (96,097) (96,097)
Transfers to unclaimed deposits reserve/issued share capital 500,000 – – – – 392,891 – 892,891
Total transactions with equity holders 500,000 480,485 (11,728) – – 2,483,590 (7,880,878) (4,428,531)
Balance as at 31 December 2017 6,700,000 3,002,952 7,793,317 1,228,420 291,924 19,444,122 2,805,727 41,266,465
The Notes to the Financial Statements disclosed on pages 265 to 370 are integral parts of these Financial Statements.

264
National Savings Bank Annual Report 2017
Bank Group
For the year ended 31 December Note 2017Rs. ’000
2016Rs. ’000
2017Rs. ’000
2016Rs. ’000
Cash flows from operating activitiesProfit before tax 14,028,719 13,302,987 13,645,212 13,397,277Adjustment for:
Non-cash items included in profit before tax 42 (1,176,426) 1,153,639 (731,037) 1,271,628Change in operating assets 43 (90,981,284) (54,762,416) (88,112,777) (56,499,933)Change in operating liabilities 44 81,073,681 61,611,498 79,015,251 64,316,597Placements with banks (4,424,532) (6,387,063) (4,424,532) (6,387,063)Contribution paid to defined benefit plans (881,812) (1,390,261) (881,812) (1,390,261)Tax paid (4,328,136) (3,893,514) (4,383,329) (4,005,853)Interest expense on subordinated debt 780,000 – 780,000 –Contribution to national insurance trust fund (87,253) (104,375) (87,253) (104,375)Dividends received from investment in subsidiaries (172,350) (14,850) – –
Net cash generated in operating activities (6,169,393) 9,515,645 (5,180,277) 10,598,017
Cash flows from investing activitiesPurchase of property, plant and equipment (730,492) (450,150) (732,376) (450,732)Proceeds from the sale of property, plant and equipment 7,189 1,948 7,189 1,948Net (increase)/decrease in investment in available for sale 1,228,954 (2,052,611) 1,268,928 (2,029,052)Net purchase of intangible assets (319,428) (134,926) (319,828) (134,926)Net increase/(decrease) in unclaimed reserve fund (49,054) 456,008 (49,054) 456,008Dividends received from investment in subsidiaries 172,350 14,850 – –
Net cash (used in)/from investing activities 309,519 (2,164,881) 174,858 (2,156,754)
Cash flows from financing activitiesInterest paid on subordinated debt (780,000) – (780,000) –Other borrowings 10,915,868 14,384 10,142,542 (1,074,004)Withholding tax on dividend paid – – (84,983) –Contribution to consolidated fund – dividend/levy (5,111,114) (12,026,000) (5,111,114) (12,027,650)Proceeds from the issue of subordinated debt – 6,000,000 – 6,000,000
Net cash from financing activities 5,024,754 (6,011,616) 4,166,445 (7,101,654)Net (decrease)/increase in cash and cash equivalents (835,120) 1,339,148 (838,974) 1,339,610Cash and cash equivalents at the beginning of the year 4,504,308 3,165,160 4,512,715 3,173,105
Cash and cash equivalents at the end of the year 3,669,188 4,504,308 3,673,741 4,512,715
Reconciliation of cash and cash equivalentsCash in hand 944,759 691,527 944,769 691,537Balances with banks 2,892,643 3,881,589 2,897,093 3,889,509Money at call and short notice 12,224 46,583 12,224 46,583Balances with central banks – – 94 477Due to Banks – Other facilities (180,439) (115,391) (180,439) (115,391)
Cash and cash equivalents at the end of the year 3,669,188 4,504,308 3,673,741 4,512,715
The Notes to the Financial Statements disclosed on pages 265 to 370 are integral parts of these Financial Statements.
Statement of Cash FlowsStatement of Cash Flows

265
National Savings Bank Annual Report 2017
1. 1. ReportingReporting entity entity
1.1 Corporate information
National Savings Bank (NSB) is a licensed specialised bank incorporated in 1972 under the National Savings Bank Act No. 30 of 1971 and domiciled in Sri Lanka. The registered office of the Bank is located at No. 255, “Saving House”, Galle Road, Colombo 03, Sri Lanka. The staff strength of the Bank as at 31 December 2017 was 4,470 (2016 – 4,384).
The Bank possesses 253 branches, 28 School bank units and 286 ATMs of its service outlets and 653 post offices and 3,409 sub-post offices as its agency network.
1.2 Consolidated Financial Statements
The Consolidated Financial Statements for the year ended 31 December 2017 comprise the Bank (Parent) and its fully-owned subsidiary, NSB Fund Management Company Limited. The Bank is fully-owned by the Government of Sri Lanka. The Bank is the ultimate Parent of the Group.
The Financial Statements of the Bank and its subsidiary have a common financial year which ends on 31 December.
The Financial Statements of the “Bank” and the “Group” are prepared for the twelve months period ended 31 December each year to be table in the Parliament.
1.3 Principal activities and nature of operations
Bank
The principal activities of the Bank continued to be the promotion of savings among the people of Sri Lanka and profitable investment of savings so mobilised. NSB is providing wide range of solutions such as accepting
GRI 102-2
deposits, corporate and retail credit, trade financing, loans to government project, pawning, Internet banking, SMS banking etc.
Subsidiary
Bank’s fully-owned subsidiary, namely, NSB Fund Management Company Limited, acts as a primary dealer and engaged in dealing in Government Securities.
1.4 Basis of preparation
1.4.1 Statement of compliance
The Financial Statements of the Bank and the Group which comprise Statement of Financial Position, Statement of Comprehensive Income, Statement of Changes in Equity, Statement of Cash Flows and Notes to the Financial Statements have been prepared and presented in accordance with Sri Lanka Accounting Standards (LKASs/SLFRSs) issued by The Institute of Chartered Accountants of Sri Lanka and are in compliance with the information required by the Banking Act No. 30 of 1988 and subsequent amendments thereto. These Financial Statements, except for the information in cash flow have been prepared following the accrual basis of accounting. The formats used in the preparation of Financial Statements and the disclosures made therein also comply with the specified formats prescribed by the Central Bank of Sri Lanka for the preparation, presentation and publication of Annual Audited Financial Statements of Licensed Specialised Banks. 1.4.2 Responsibility for Financial Statements
The Board of Directors is responsible for the preparation and presentation of the Financial Statements of the Group and the Bank as per the provisions of the National Savings Bank Act No. 30 of 1971 and amendments thereto and Sri Lanka Accounting Standards.
Notes to the Financial StatementsNotes to the Financial Statements

266
National Savings Bank Annual Report 2017
Notes to the Financial Statements
1.4.3 Approval of Financial Statements by the Board of Directors
The Financial Statements of the Bank and the Group for the year ended 31 December 2017 were approved on 12 March 2018, by the Board of Directors. 1.4.4 Basis of measurement
The Consolidated Financial Statements have been prepared on a historical cost basis, except for the following material items, which are measured at fair value:
(i) Available-for-sale investments,
(ii) Derivative financial instruments,
(iii) Other financial assets and liabilities held for trading,
(iv) Financial assets and liabilities designated at fair value through profit or loss,
(v) Land and buildings,
(vi) Liability for employee defined benefits.
1.4.5 Functional and presentation currency
The Consolidated Financial Statements are presented in Sri Lankan Rupees (Rs.) which is the currency of the primary economic environment in which Group operates and all values are rounded to the nearest thousand Rupees, unless indicated otherwise.
1.4.6 Presentation of Financial Statements
The assets and liabilities of the Bank and the Group presented in the Statement of Financial Position are grouped by their nature and listed in the order of their relative liquidity and maturity pattern. An analysis of maturity patterns of assets and liabilities of the Bank and the Group is presented in Note 49.
Financial assets and financial liabilities are offset and the net amount reported in the Statement of Financial Position if and only if there is a legally enforceable right to offset the recognised amounts and there is an intention to settle on a net basis, or to realise the assets and settle the liability
simultaneously. Income and expenses are not offset in the Income Statement unless required or permitted by any accounting standard or interpretation and as specifically disclosed in the accounting policies of the Group. 1.4.7 Materiality and aggregation
Each material class of similar items are presented separately in the Financial Statements. Items of dissimilar nature or functions are presented separately unless they are immaterial as permitted by the Sri Lanka Accounting Standard – LKAS 01 on “Presentation of Financial Statements”. 1.4.8 Comparative information
Comparative information including quantitative, narrative and descriptive information is disclosed in respect of the previous period in the financial statements in order to enhance the understanding of the current period’s financial statements and to enhance the inter period comparability. The comparative information is reclassified where necessary for the better presentation and to conform to the current year’s presentation. The details are given in Note 47 to the Financial Statements on page 352.
1.4.9 Significant accounting judgements, estimates and assumptions
The preparation of financial statements of the Group and the Bank in conformity with Sri Lanka Accounting Standards requires the Management to make judgements, estimates and assumptions that affect the application of accounting policies and the reported amounts of assets, liabilities, income and expenses. Actual results may differ from these estimates.
Estimates and underlying assumptions are reviewed on an ongoing basis. Revisions to accounting estimates are recognised in the period in which the estimate is revised and in any future periods affected.
The significant areas of estimation, critical judgements and assumptions in applying accounting policies that have most significant effect on the amounts recognised in the Financial Statements of the Group and the Bank are as follows:
267
National Savings Bank Annual Report 2017
Notes to the Financial Statements
1.4.9.1 Going concern
The Board of Directors/Management of the Bank has made an assessment of its ability to continue as a going concern and is satisfied that it has the resources to continue in business for the foreseeable future. Furthermore, the Management is not aware of any material uncertainties that may cast significant doubt upon the Group’s ability to continue as a going concern. Therefore, the Financial Statements are prepared on the going concern basis.
1.4.9.2 Fair value of financial instruments
Where the fair value of financial assets and financial liabilities recorded in the Statement of Financial Position cannot be derived from active markets, they are determined using the valuation techniques that include the use of mathematical models. The inputs to these models are derived from observable market data where possible, but where observable market data are not available, judgement is required to establish fair values. Methodologies used for valuation of financial instruments and Fair Value Hierarchy are described in more detail in Note 50 to the Financial Statements on page 364. 1.4.9.3 Impairment losses on loans and receivables
Individual impairment assessment
The Group reviews its individually significant loans and advances at each reporting date to assess whether an impairment loss should be recorded in the Income Statement. In particular, the Management judgement is required in the estimation of the amount and timing of future cash flows when determining the impairment loss. These estimates are based on the assumptions about number of factors and the actual results may differ, resulting in future changes to the allowance made.
Collective impairment assessment
Loans and receivables that have been assessed individually and found not to be impaired and all individually insignificant loans and receivables are then assessed collectively, by categorising them into groups of assets with
similar risk characteristics, to determine whether provision is required due to incurred loss events for which there is objective evidence, but whose effects are not yet evident. The collective assessment takes account of data from the loan portfolio (such as levels of arrears, credit utilisation, loan to collateral ratios, etc.) and judgements to the effect of concentrations of risks and economic data (including levels of unemployment, real estate prices indices, country risk and the performance of different individual groups).
Impairment of financial assets is further discussed in Note 2.3.6 in page 273.
1.4.9.4 Impairment of financial investments – available for sale
Debt securities
The Group reviews its debt securities classified as available-for-sale investments at each reporting date to assess whether they are impaired. This requires similar judgement as applied to the individual assessment of loans and advances.
Equity investments
The Group also records impairment charges on available-for-sale equity investments when there has been a significant or prolonged decline in the fair value below their cost. The determination of what is “significant” or “prolonged” requires judgement. In making this judgement, the Group evaluates, among other factors, historical share price movements and duration and extent to which the fair value of an investment is less than its cost.
1.4.9.5 Revaluation of property, plant and equipment
The freehold land and buildings of the Bank and the Group are reflected at revalued amounts. The Group engaged independent professional valuers to determine the fair value of freehold land and buildings in terms of Sri Lanka Accounting Standard – SLFRS 13 on “Fair Value Measurement”.
The methods and key assumptions used to determine the fair value of the freehold land and buildings are further explained in Note 2.4 to the Financial Statements.
268
National Savings Bank Annual Report 2017
Notes to the Financial Statements
1.4.9.6 Useful life time of property, plant and equipment
The Group review the residual values, useful lives and methods of depreciation of property, plant and equipment at each reporting date. Judgement of the Management is exercised in the estimation of these values, rates, methods and hence they are subject to uncertainty.
1.4.9.7 Deferred tax asset
Deferred tax assets are recognised in respect of tax losses to the extent that it is probable that future taxable profits will be available against which such tax losses can be utilised. Judgement is required to determine the amount of deferred tax assets that can be recognised, based upon the likely timing and level of future taxable profits, together with the future tax-planning strategies.
1.4.9.8 Defined benefit obligation
The cost of the defined benefit plans and the present value of their obligations are determined using actuarial valuations. The actuarial valuation involves making assumptions about discount rates, expected rates of return on assets, future salary increases, mortality rates and future pension increases.
In determining the appropriate discount rate, the Management considers the interest rates of Sri Lanka Government Bonds with extrapolated maturities corresponding to the expected duration of the defined benefit obligation.
The mortality rate is based on publicly available mortality tables. Future salary increases and pension increases are based on expected future inflation rates and expected future salary increase rate of the Bank.
Due to the long-term nature of these plans, such estimates are subject to significant uncertainty.
1.4.9.9 Provisions, commitments and contingencies
The Group receives legal claims against it in the normal course of business. The Management makes judgements as to the likelihood of any claim succeeding in making provisions. The time of concluding legal claims is uncertain, as is the amount of possible outflow of economic benefits. Timing and cost ultimately depend on the due process in respective legal jurisdiction.
2. Significant accounting policies2. Significant accounting policies
The accounting policies set out below have been applied consistently to all periods presented in these Financial Statements, unless otherwise indicated. The accounting policies of the Bank are also consistently applied by the Group entities where applicable and deviations if any have been disclosed accordingly.
2.1 Basis of consolidation
The financial statements of the Bank and the Group comprise the Financial Statements of the Bank and its subsidiary in terms of the SLFRS – 10 on “Consolidated Financial Statements” and LKAS – 27 on “Separate Financial Statements”.
2.1.1 Subsidiary
The Financial Statements of the subsidiary is fully consolidated from the date on which control is transferred to the Bank and continued to be consolidated until the date when such control ceases. The control exists where the Bank has the power to govern the financial and operating policies of an entity so as to obtain benefits from its activities. The Financial Statements of the Bank’s subsidiary for the purpose of consolidation are prepared for the same reporting period as that of National Savings Bank, using consistent accounting policies.

269
National Savings Bank Annual Report 2017
Notes to the Financial Statements
2.1.2 Transactions eliminated on consolidation
All intra-group balances, income and expenses and unrealised gains and losses resulting from intra-group transactions are eliminated in full in preparing the Consolidated Financial Statements.
2.2 Foreign currency transactions and balances
All foreign currency transactions are translated into the functional currency, which is Sri Lankan Rupees, using the exchange rates prevailing at the dates on which the transactions were affected.
Monetary assets and liabilities denominated in foreign currencies at the reporting date are retranslated to Sri Lankan Rupees using the middle exchange rate ruling at that date. All exchange differences arising on the settlement of monetary items or on translating monetary items at rates different to those at which they are initially recorded are recognised in the Income Statement in the period in which they arise. Non-monetary items that are measured in terms of historical cost in a foreign currency are translated using the exchange rates at the dates of the initial transactions. Non-monetary items measured at fair value in foreign currency are translated using the exchange rates at the date when the fair value was determined. The Statement of Financial Position of Foreign Currency Banking Unit is translated to Sri Lankan Rupees at the middle rate of exchange ruling at the reporting date. The transactions of the Foreign Currency Banking Unit have been recorded in accordance with the above policy and the resulting gains/losses are recognised in the Income Statement.
2.3 Financial instruments
2.3.1 Financial instruments – Initial recognition, classification and subsequent measurement
i. Date of recognition
All financial assets and liabilities are initially recognised on the trade date, i.e., the date that the Group becomes a party to the contractual provisions of the instrument. Government Securities are recognised in the books of accounts on the settlement date which falls due after three days from the date of trade. The position is rectified at the date of reporting in preparation of the Financial Statements.
ii. Recognition and initial measurement of financial instruments
The classification of financial instruments at initial recognition depends on the purpose and the Management’s intention for which the financial instruments were acquired and their characteristics. All financial instruments are measured initially at their fair value plus transaction costs that are directly attributable to the acquisition or issue of the financial instrument, except in the case of financial assets and financial liabilities recorded at fair value through profit or loss, as per Sri Lanka Accounting Standards – LKAS 39 on “Financial Instruments: Recognition and Measurement”.
Transaction costs in relation to financial assets and financial liabilities at fair value through profit or loss are dealt with through profit or loss.

270
National Savings Bank Annual Report 2017
Notes to the Financial Statements
iii. “Day 1” profit or loss
When the transaction price differs from the fair value of other observable current market transactions in the same instrument, or fair value based on a valuation technique whose variables include only data from observable markets, the Group immediately recognises the difference between the transaction price and fair value (a “Day 1” profit or loss) in “Interest Income and Personnel Expenses”. In cases where fair value is determined using data which is not observable, the difference between the transaction price and model value is only recognised in the Statement of Comprehensive Income when the inputs become observable or when the instrument is derecognised. The “Day 1” loss arising in the case of loans granted to employees at concessionary rates under uniformly applicable schemes is deferred and amortised using Effective Interest Rates (EIR) over the remaining service period of the employees or tenure of the loan whichever is shorter.
2.3.2 Classification and subsequent measurement of financial assets
At inception a financial asset is classified in one of the following categories:
zz Financial assets at fair value through profit or loss
(a) Financials assets held for trading
(b) Financials assets designated at fair value through profit or loss
zz Held-to-maturity financial assets
zz Loans and receivables
zz Available-for-sale financial assets
The subsequent measurement of financial assets depends on their classification.
Detailed analysis of classification and subsequent measurement of financial assets is given in Note 15 on page 292.
2.3.2.1 Financial assets at fair value through profit or loss (FVTPL)
Financial assets at fair value through profit or loss include financial assets held for trading and financial assets designated at fair value through profit or loss. (a) Financials assets held for trading
Details of financial assets held for trading are given in Note 20 on page 301.
Derivatives recorded at fair value through profit or lossDetails of derivatives recorded at fair value through profit or loss are discussed in Note 19 on page 297.
Derivatives used as hedge instrumentsDetails of derivatives used as hedge instruments are given in Note 19 on page 297.
(b) Financial assets designated at fair value through profit or loss
The Group has not designated any financial assets upon initial recognition on designated at fair value through profit or loss.
2.3.2.2 Held to maturity financial investments
Details of held to maturity financial investments are given in Note 25 on page 314.
2.3.2.3 Loans and receivables to banks and other customers
Details of loans and receivables to banks and other customers are given in Note 22 and Note 23 respectively on pages 305 and 306.

271
National Savings Bank Annual Report 2017
Notes to the Financial Statements
(i) Securities purchased under resale agreements
Securities purchased under agreements to resell at a specified future date are not recognised in the Statement of Financial Position. The consideration paid, including accrued interest, is recorded in the Statement of Financial Position, within “securities purchased under resale agreements”, reflecting the transaction’s economic substance as a loan granted by the Group. The difference between the purchase and resale prices is recorded in “net interest income” and is accrued over the life of the agreement using the EIR.
Details of securities purchased under resale agreements are given in Note 22 and Note 23, respectively on pages 305 and 306.
2.3.2.4 Available-for-sale financial investments (AFS)
Details of available-for-sale financial investments are given in Note 24 on page 310. 2.3.2.5 Cash and cash equivalents
Details of cash and cash equivalents are given in Note 16 on page 296.
2.3.3 Classification and subsequent measurement of financial liabilities
At the inception the Group determines the classification of its financial liabilities into one of the following categories:
zz Financial liabilities at fair value through profit or loss (FVTPL):
(a) Financial liabilities held for trading
(b) Financial liabilities designated at fair value through profit or loss
zz Financial liabilities at amortised cost
The subsequent measurement of financial liabilities depends on their classification. Please refer Notes 2.3.3.1 and 2.3.3.2 as detailed below:
2.3.3.1 Financial liabilities at fair value through profit or loss (FVTPL)
Financial liabilities at FVTPL include financial liabilities held for trading and financial liabilities designated upon initial recognition as at fair value through profit or loss. Subsequent to initial recognition, financial liabilities at FVTPL are measured at fair value and changes therein recognised in profit or loss.
Financial liabilities are classified as held for trading if they are acquired principally for the purpose of selling or repurchasing in the near term or holds as a part of a portfolio that is managed together for short-term profit or position taking. This category includes derivatives financial instruments entered into by the Group that are not designated as hedging instruments in hedge relationships as defined by the Sri Lanka Accounting Standard – LKAS 39 on “Financial Instruments: Recognition and Measurement”.
Gains or losses on liabilities held for trading are recognised in the Income Statement.
The Group has not designated any financial liabilities upon initial recognition as at fair value through profit or loss.
2.3.3.2 Financial liabilities at amortised cost
Financial instruments issued by the Group that are not designated at fair value through profit or loss, are classified as liabilities under “due to banks”, “due to other customers”, “securities sold under repurchase agreements” and “debt issued and other borrowed funds” as appropriate, where the substance of the contractual arrangement results in the Group having an obligation either to deliver cash or another financial asset to the holder, or to satisfy the obligation other than by the exchange of a fixed amount of cash or another financial asset for a fixed number of own equity shares at amortised cost using the EIR method.
272
National Savings Bank Annual Report 2017
Notes to the Financial Statements
After initial recognition, such financial liabilities are substantially measured at amortised cost using the EIR method. Amortised cost is calculated by taking into account any discount or premium on the issue and costs that are an integral part of the EIR. The EIR amortisation is included in “interest expenses” in the Income Statement. Gains and losses are recognised in the Income Statement when the liabilities are derecognised as well as through the EIR amortisation process.
(i) Due to banks
Details of due to banks are given in Note 31 on page 325.
(ii) Due to other customers
Details of due to other customers are given in Note 32 on page 325.
(iii) Securities sold under repurchase agreements
Details of securities sold under repurchase agreements are given in Note 33 on page 327.
(iv) Other borrowings – debt securities issued
Details of other borrowings – debt securities issued are given in Note 33 on page 327.
(v) Subordinate liabilities
Details of “subordinated liabilities” are given in Note 35 on page 339.
2.3.4 Reclassification of financial instruments
The Group reclassifies non-derivative financial assets out of the “held-for-trading” category and into the“available for sale”, “loans and receivables” or “held-to-maturity” categories as permitted by the Sri Lanka Accounting Standard – LKAS 39 on “Financial Instruments: Recognition and Measurement”. In certain circumstances the Group is also permitted to reclassify financial assets out of the “available-for-sale” category and into the “loans and receivables”, “held-for-trading” or “held-to-maturity” categories.
Reclassifications are recorded at fair value at the date of reclassification, which becomes the new amortised cost.
For a financial asset with a fixed maturity reclassified out of the “available-for-sale” category, any previous gain or loss on that asset that has been recognised in equity is amortised to profit or loss over the remaining life of the investment using the effective interest rate (EIR). Any difference between the new amortised cost and the expected cash flows is also amortised over the remaining life of the asset using the EIR.
In the case of a financial asset does not have a fixed maturity, the gain or loss is recognised in the profit or loss when such financial asset is sold or disposed of. If the asset is subsequently determined to be impaired, then the amount recorded in equity is recycled to the Income Statement.
The Group may reclassify a non-derivative trading asset out of the “held-for-trading” category and into the “loans and receivables” category if it meets the definition of loans and receivables and the Group has the intention and ability to hold the financial asset for the foreseeable future or until maturity. If a financial asset is reclassified, and if the Group subsequently increases its estimates of future cash receipts as a result of increased recoverability of those cash receipts, the effect of that increase is recognised as an adjustment to the EIR from the date of the change in estimate.
Reclassification is at the election of management, and is determined on an instrument by instrument basis.
The Group does not reclassify any financial instrument into the “fair value through profit or loss” category after initial recognition. Also the Group does not reclassify any financial instrument out of the “fair value through profit or loss” category if upon initial recognition it was designated as at fair value through profit or loss.

273
National Savings Bank Annual Report 2017
Notes to the Financial Statements
2.3.5 Derecognition of financial instruments
(a) Financial assets
The Group derecognises a financial asset (or, where applicable a part of a financial asset or part of a group of similar financial assets) when:
zz the rights to receive cash flows from the asset have expired; or
zz the Group has transferred its rights to receive cash flows from the asset or has assumed an obligation to pay the received cash flows in full without material delay to a third party under a “pass-through” arrangement and either the Group has transferred substantially all the risks and rewards of the asset or the Group has neither transferred nor retained substantially all the risks and rewards of the asset, but has transferred control of the asset.
When the Group has transferred its rights to receive cash flows from an asset or has entered into a pass-through arrangement, and has neither transferred nor retained substantially all of the risks and rewards of the asset nor transferred control of the asset, the asset is recognised to the extent of the Group’s continuing involvement in the asset. In that case, the Group also recognises an associated liability. The transferred asset and the associated liability are measured on a basis that reflects the rights and obligations that the Group has retained.
Continuing involvement that takes the form of a guarantee over the transferred asset is measured at the lower of the original carrying amount of the asset and the maximum amount of consideration that the Group could be required to repay.
(b) Financial liabilities
A financial liability is derecognised when the obligation under the liability is discharged or cancelled or expired.
Where an existing financial liability is replaced by another from the same lender on substantially different terms, or the terms of an existing liability are substantially modified, such an exchange or modification is treated as a derecognition of the original liability and the recognition of a new liability. The difference between the carrying value of the original financial liability and the consideration paid is recognised in profit or loss. 2.3.6 Impairment of financial assets
The Group assesses at each reporting date whether there is any objective evidence that a financial asset or a group of financial assets is impaired. A financial asset or a group of financial assets is deemed to be impaired if, and only if, there is objective evidence of impairment as a result of one or more events that has occurred after the initial recognition of the asset (an incurred “loss event”) and that loss event (or events) has a impact on the estimated future cash flows of the financial asset or the group of financial assets that can be reliably estimated.
Objective evidence of impairment includes indications that the borrower or a group of borrowers is experiencing significant financial difficulty, the probability that they will enter bankruptcy or other financial restructuring, default or delinquency in interest or principal payments and also other observable data indicating that there is a measurable decrease in the estimated future cash flows, or economic conditions that correlate with defaults.

274
National Savings Bank Annual Report 2017
Notes to the Financial Statements
Objective evidence that financial assets (including equity securities) are impaired can include –
zz Significant financial difficulty of the borrower or issuer,
zz Reschedulement of credit facilities,
zz Adverse financial ratio and gearing ratios
zz Downgrading of the external credit rating
zz Default or delinquency by a borrower,
zz Restructuring of a loan or advance by the Group on terms that the Group would not otherwise consider,
zz Indications that a borrower or issuer will enter bankruptcy,
zz The disappearance of an active market for a security, or
zz Other observable data relating to a group of assets such as adverse changes in the payment status of borrowers or issuers in the Group or economic conditions that correlate with defaults in the Group.
In general, the Group considers a decline of 20% to be “significant” and a period of six months to be “prolonged”. However, in specific circumstances a smaller decline or a shorter period may be appropriate. i. Impairment of financial assets carried at amortised cost
Details of the individual and collective assessment of impairments are given in Note 10 on page 286.
ii. Impairment of available-for-sale financial investments
Detailed discussion on impairment of available-for-sale financial investments is given in Note 24 on page 310.
2.3.7 Recognition of income and expenses for financial instruments
Revenue is recognised to the extent that it is probable that the economic benefits will flow to the Bank and the revenue can be reliably measured. Details of “income and expenses” are given in Notes 3 to 14 on pages 282 to 291.
i. Interest and similar income and expense
Details of “interest income and expenses” are given in Notes 3 and 4 on pages 282 to 291.
ii. Fee and commission income
Details of “commission income and expenses” are given in Note 5 on page 284.
iii. Net trading income
Details of “net gains/(losses) from trading” are given in Note 6 on page 285.
iv. Dividend income
Dividend income is recognised when the right to receive income is established. Usually, this is the ex-dividend date for quoted equity securities. Details of “dividend income” is given in Note 9 on page 286.
2.4 Property, plant and equipment (PPE)
Details of property, plant and equipment are given in Note 27 on page 315.
2.5 Intangible assets
Details of intangible assets are given in Note 28 on page 322.
2.6 Impairment of non-financial assets
The Group assess at each reporting date whether there is an indication that an asset other than deferred tax asset, may be impaired. If any indication exists or when annual impairment testing for an asset is required, the Group estimates the asset’s recoverable amount. Where the carrying amount of an asset exceeds its recoverable amount, the asset is considered impaired and is written down to its recoverable amount.

275
National Savings Bank Annual Report 2017
Notes to the Financial Statements
2.7 Employee benefits
2.7.1 Defined benefit pension plans
2.7.1.1 Staff Pension Fund I
The Bank operates a defined benefit pension plan, for the permanent staff members who have joined the Bank prior to 1 October 1995, which requires contributions to be made to a separately administered fund. The cost of providing benefits under the defined benefit pension plan – I is determined using the Projected Unit Credit actuarial valuation method. Actuarial gains and losses are recognised in the Other Comprehensive Income in the period in which they arise.
The defined benefit asset or liability is calculated as the present value of the defined benefit obligation less past service costs not yet recognised and less the fair value of planned assets out of which the obligations are to be settled directly, less actuarial losses not yet recognised. The value of the defined benefit liability is borne by the Bank and recognised in the profit or loss. The value of any asset is restricted to the sum of any actuarial losses and past service cost not yet recognised and the present value of any economic benefits available in the form of refunds from the plan or reductions in the future contributions to the plan.
The latest actuarial valuation was carried out as of 31 December 2017, by Mr Piyal S Gunatilleke F.S.A. (USA), Member of the American Academy of Actuaries and Consulting Actuaries.
The principal financial assumptions used in the valuation as at 31 December 2017 are as follows:
Interest/discount rate 11.00% p.a.Increase in cost of living allowances 4.50% p.a.Increase in average basic salary 6.50% p.a.
The assets of the fund are held separately from these of the Bank and are independently administrated by the Trustees as per the provisions of the Trust Deed and are subject to annual audit by Independent External Auditors. The Financial Statements as well as the Auditor’s Report are tabled and reviewed by the Board of Trustees. They are also submitted for review of the disclosure of the Bank, as the
Bank has an obligation of ensuring that funding is made at optimum levels. Pension is payable monthly as long as the participant is alive.
Details of Staff Pension Fund I are given in Note 34. (a) 1. on pages 328 to 331.
2.7.1.2 Unfunded pension liability
The past service cost not funded is recognised in Other Comprehensive Income immediately upon actuarial valuation. The actuarial valuation as at 31 December 2017 indicated a past service cost deficit of Rs. 2,750 Mn. which has been provided in full. The details of unfunded pension liability are given in Note 34. (a) 1 on pages 328 to 331.
2.7.1.3 Staff Pension Fund II
The Bank, established and operates a defined benefit pension plan, for the permanent staff members who have joined the Bank on or after 1 October 1995, which requires the Bank to monthly contribute 12% of members’ gross salary to a separately administered fund. The cost of providing benefits under the defined benefit pension plan is determined using the Projected Unit Credit actuarial valuation method. Actuarial gains and losses are recognised in the Other Comprehensive Income in the period in which they arise.
The defined benefit asset or liability is calculated as the present value of the defined benefit obligation less past service costs not yet recognised and less the fair value of planned assets out of which the obligations are to be settled directly, less actuarial losses not yet recognised. The value of the defined benefit liability is borne by the Bank and recognised in the profit or loss. The value of any asset is restricted to the sum of any actuarial losses and past service cost not yet recognised and the present value of any economic benefits available in the form of refunds from the plan or reductions in the future contributions to the plan.
The latest actuarial valuation was carried out as of 31 December 2017, by Mr Piyal S Gunatilleke F.S.A. (USA), Member of the American Academy of Actuaries and Consulting Actuaries.

276
National Savings Bank Annual Report 2017
Notes to the Financial Statements
The principal financial assumptions used in the valuation as at 31 December 2017 are as follows:
Interest/discount rate 11.00% p.a.
Increase in cost of living allowances 4.50% p.a.
Increase in average basic salary 6.50% p.a.
The assets of the fund are held separately from these of the Bank and are independently administrated by the Trustees as per the provisions of the Trust Deed and are subject to annual audit by Independent External Auditors. The Financial Statements as well as the Auditor’s Report are tabled and reviewed by the Board of Trustees. They are also submitted for review of the disclosure of the Bank, as the Bank has an obligation of ensuring that funding is made at optimum levels. Pension is payable monthly as long as the participant is alive.
Details of Staff Pension Fund II are given in Note 34. (a) 2. on pages 332 to 334.
2.7.1.4 Widows’/Widowers’ and Orphans’ Pension Fund
Effective from 2013 December, the Bank has established a “Widows’/Widowers’ and Orphans” Pension Scheme for the members of Pension Scheme II. Members of Pension Scheme II are opts for be members of the Widows’/Widowers’ and Orphans’ Pension Scheme. The Bank does not contribute to the Fund while Bank’s employees monthly contribute 5% of their basic salary, to the Fund.
2.7.2 Gratuity
With the establishment of Staff Pension Scheme II, employees who joined the Bank on or after 1 October 1995 become members of the Pension Scheme II, thus they are not entitle to the rights and privileges under Service Gratuity Scheme. However, a minimum period of 120 months uninterrupted active service in the Bank at the time of retirement is required to be eligible for any retirement benefit under this pension scheme. Therefore, employees who retires before 10 years of service and whose services are terminated after five years other than by retirement are eligible to receive a terminal gratuity under the Payment of Gratuity Act No. 12 of 1983, at the rate of one-half of
the gross salary applicable to the last month of the financial year, for each year of continuous service.
Probability of occurrence of such event is rare according to the Management’s judgement and past experiences. A gratuity provision is not maintained in the Financial Statements unless a significant liability is estimated at reporting date. Where a gratuity is paid to an employee in such event under Payment of Gratuity Act No. 12 of 1983, it is recognised as a gratuity expense in the Income Statement in the same year.
2.7.3 Post-employment medical benefits
The Bank has a contributory medical assistance scheme for the retired employees. The assets of the plan are held independently of the Bank’s assets and administered by Boards of Trustees, representing the Management and the employees, as provided in the trust deed of the fund.
The Bank contributes to the contributory medical scheme an amount determined by the Management of the Bank based on actuarial recommendation made from time to time. Accordingly, a sum of Rs. 96.1 Mn. has been provided from the profit of 2017.
Details of post-employment medical benefits are given in Note 34. (a) 3. on pages 335 to 336.
2.7.4 Defined contribution plans
Details of defined contribution plans are given in Note 11 on page 287.
2.8 Other liabilities
Details of other liabilities are given in Note 34 on page 328.
2.9 Provisions
Provisions are recognised when the Group has a present obligation (legal or constructive) as a result of a past event and it is probable that an outflow of resources embodying economic benefits will be required to settle the obligation and a reliable estimate can be made of the amount of the obligation. The expenses relating to any
277
National Savings Bank Annual Report 2017
Notes to the Financial Statements
provision is presented in the Income Statement net of any reimbursement.
2.9.1 Provision for fraudulent withdrawals
The total value of fraudulent withdrawals identified as at 31 December 2017 was Rs. 94.7 Mn. A provision of Rs. 85.7 Mn. already exists in the account.
2.10 Contingent liabilities and commitments
Details of contingent liabilities and commitments are given in Note 39 on pages 344 to 345.
2.11 Taxation
2.11.1 Current taxation
Details of current taxation are given in Note 13 on page 289.
2.11.2 Deferred taxation
Details of deferred taxation are given in Note 13 and Note 29 on page 289 and page 324 respectively.
2.11.3 Value added tax (VAT) on financial services
VAT on financial services is calculated in accordance with Section 25 A of Value Added Tax Act No. 14 of 2002 and subsequent amendments thereto.
VAT on financial services is payable at 15% on operating profit before value added tax and nation building tax on financial services adjusted for emoluments of employees and economic depreciation.
2.11.4 Nation building tax (NBT) on financial services
NBT on financial services is calculated in accordance with Nation Building Tax (Amendment) Act No. 10 of 2014. NBT on financial services is payable at 2% on same base subjected to value added tax on financial services.
2.11.5 Economic service charge (ESC)
Economic Service Charge (ESC) has been administered since 1 April 2006 under the Economic Service Charge (ESC) Act No. 13 of 2006, as amendments thereafter. Prior to this, it has been administered under Finance Acts 11 of 2004 and 11 of 2005 from 1 April 2004 up to 1 April 2006. The rate applicable is 0.25% on relevant turnover. Unclaimed ESC, if any, can be carried forward and set-off against the income tax payable in the five subsequent years. As per budget proposal 2017, the applicable rate is increased to 0.50% on relevant turnover and claimable period limited to 3 years including existing year effective from 1 January 2017.
As per the provisions of the Finance Act No. 11 of 2004 and amendments thereto, the ESC was introduced with effect from 1 April 2004. Currently, the ESC is payable at 0.25% on “Exempt Turnover” and is deductible from the income tax payments. Unclaimed ESC, if any, can be carried forward and set-off against the income tax payable in the five subsequent years.
2.12 Statement of cash flows
The Statement of Cash Flows has been prepared by using the “Indirect Method” of preparing cash flows in accordance with the LKAS 7. Cash and cash equivalents comprise short-term highly liquid investment that is readily convertible to known amounts of cash and are subject to an insignificant risk of changes in value. The cash and cash equivalents include cash in hand, balances with banks and money at call and short notice.
2.13 Regulatory provisions
2.13.1 Deposit insurance scheme
The Bank calculates the insurance premium on eligible deposit base at the rate of 0.10% which is the applicable statutory rate based on capital adequacy ratio of the Bank. The Bank has remitted the applicable premium within a period of 15 days from the end of each quarter as stipulated by the Direction.

278
National Savings Bank Annual Report 2017
Notes to the Financial Statements
2.13.2 Crop insurance levy (CIL)
As per the provisions of the Section 14 of the Finance Act No. 12 of 2013, the CIL was introduced with effect from 1 April 2013 and is payable to the National Insurance Trust Fund. Currently, the CIL is payable at 1% of the profit after tax.
2.14 Events after the reporting period
Details of events after reporting date are given in Note 46 on page 351.
2.15 Accounting standards issued but not yet effective as at reporting date
The following SLFRSs have been issued by The Institute of Chartered Accountants of Sri Lanka that have an effective date in the future and have not been applied in preparing these Financial Statements. Those SLFRS will have an effect on the accounting policies currently adopted by the Bank and the Group and may have an impact on the future financial statements.
2.15.1 Sri Lanka Accounting Standard (SLFRS 9) – Financial Instruments: Classification and Measurement
In July 2014, The Institute of Chartered Accountants of Sri Lanka issued SLFRS 9 on “Financial Instrument” (on a par with International Accounting Standards Board), the standard that will replace LKAS 39 for annual periods on or after 1 January 2018, with early adoption permitted.
Bank performed the Diagnostic Phase (Preliminary Impact Assessment exercise) and Implementation Phase (solution development) on SLFRS 9 Financial Instruments. The Bank has undertaken a significant analysis of how SLFRS 9 should be implemented and has taken tentative accounting policy decisions.
The key aspects of SLFRS 9 are:
2.15.1.1 Classification and measurement
From a classification and measurement perspective, the new standard will require all financial assets, except equity instruments and derivatives, to be assessed based on a combination of the entity’s business model for managing the assets and the instruments’ contractual cash flow characteristics.
Business model assessment
Bank determines its business model at the level that best reflects how it manages the financial assets to achieve its objectives. The Bank's business model is not assessed on an instrument by instrument basis, but at a higher level of aggregated portfolios and is based on observable factors such as:
zz How the performance of the business model and the financial asset held within that business model are evaluated and reported to the entity's Key Management Personal.
zz The risks that affects the performance of the business model (and the financial asset held within that business model) and, in particular, the way those risks are managed
zz How managers of the business are compensated (for example, whether the compensation is based on the fair value of the assets managed or on the contractual cash flow collected)
zz The expected frequency, value and timing of sales are also important aspect of Bank’s assessment.
The business model assessment is based on reasonably expected scenarios without taking Worst case or Stress Case scenarios in to account. If cash flows after initial recognition are realised in away that is different from the Bank’s original expectation, the Bank does not change the classification of the remaining financial assets held in that business model, but incorporates such information when assessing newly originated or newly purchased financial assets.

279
National Savings Bank Annual Report 2017
Notes to the Financial Statements
Contractual cash flow characteristic test
As the second test of the classification process the Bank assesses the contractual terms of the financial asset to identify whether they meet solely the Payment of Principle and Interest (SPPI). “Principle˜ for the purpose of this test is defined as the fair value of the financial asset at initial recognition and may change over the life of the financial asset (for example, if there are repayments of principle or amortisation of the premium/discount).
The most significant elements of interest within a lending arrangement are typically the consideration for the time value of money and credit risk. To make SPPI assessment, the Bank applies judgement and considers relevant factors such as currency in which the financial asset is denominated and the period for which the interest rate is set.
In contrast to contractual exposures that introduce a more than deminimise exposure to risk or volatility in the contractual cash flows that are unrelated to a basic lending arrangement do not give rise to contractual cash flows that are solely the payment of principle and interest on the amount outstanding. In such cases the financial asset is required to be measured at FVPL.
According to the Preliminary impact assessment exercise there no significant impact to Financial Statement of the Bank with regard to the financial asset classification.
2.15.1.2 Impairment of financial assets
Overview of expected credit loss principle (ECL)
SLFRS 9 will principally change the Bank’s impairment provision method by replacing LKAS 39 on “Financial Instruments: Recognition and Measurement” incurred loss approach with a forward looking ECL approach.
ECL allowance will be based on credit losses expected to arise over the life of the asset (Lifetime expected credit loss or LTECL), unless there has been no significant increase in credit risk since origination in which case the loss allowance will be 12 month expected credit loss (12mECL).
12mECL is the portion of LTECL that represent the ECL that results from default events on a financial instrument that are possible within 12 months after the reporting date. The Bank has established a policy to perform an assessment, at the end of each reporting period of whether a financial instrument's credit risk has increased significantly since initial recognition. Based on such process the Bank groups loans into stage 1, Stage 2, Stage 3 as described below:
Stage1
When loans are first recognised, the Bank recognises an allowance based on 12mECL. Stage 1 loans also include the facilities where the credit risk has improved and the loans has been re classified from Stage 2. Assessment of Stage 1 will be performed collectively.
Stage2
When a loan has shown a significant increase in credit risk since origination, the Bank records an allowance for the LTECL. Stage 2 loans also include facilities, where the credit risk has improved and the loan has been reclassified from Stage 2. Assessment of Stage 2 will be performed collectively.
Stage3
Loan considered to be credit impaired/contains objective evidence of incurred losses records an allowance for the LTECL. Stage 3 assessment will be performed individual/collectively.
Significant increase in credit risk
The Bank continuously monitors all assets subject to ECL, in order to determine whether an instrument or a portfolio of instruments is subject to 12mECL or LTECL, the Bank assess whether there has been a significant increase in credit risk since initial recognition. The Bank considers an exposure to have significantly increased in credit risk when either of the following criteria’s are met:
zz Facilities exceeding 30 days past due
zz Re-structured facilities
zz Secondary qualitative indicators triggering a significant increase in credit risk for an asset, such as moving a customer/facility to watch list

280
National Savings Bank Annual Report 2017
Notes to the Financial Statements
Individually significant assessment and not impaired individually
Loans which are individually significant but not impaired will be assessed collectively for impairment either under Stage 1 or Stage 2 based on the criteria whether there have been significant credit deterioration since origination.
While establishing significant credit deterioration the Bank will consider the following criterias:
zz Other changes in the rates or terms of an existing financial instrument that would be significantly different if the instrument was newly originated.
zz Significant changes in external market indicators of credit risk for a particular financial instrument or similar financial instrument.
zz Other Information related to the borrower, such as changes in the price of a borrower’s debt/equity instrument.
zz An actual/expected internal credit rating downgrade for the borrower or decrease in behavioural score used to assess credit risk internally.
zz Existing or forecast adverse changes in business, financial or economic condition that are expected to causes significant change in the borrower’s ability to meet its obligation.
zz An actual or expected significant change in the operating results of the borrower in relating to actual/expected decline in revenue, increase in operating risk, working capital deficiency, decrease in asset quality, increase in gearing, liquidity management problems.
zz Significant increase in credit risk on other financial instruments of the same borrower.
zz An actual or expected significant adverse change in the regulatory, economic or technological environment of the borrower that result in a significant change in the borrower’s ability to meet the debt obligation.
The calculation of ECL
The Bank calculates ECL based on three probability weighted scenarios to measure expected cash shortfalls, discounted at an approximation to the EIR. A cash shortfall is the difference between the cash flows that are due to an entity in accordance with the contract and the cash flows that the entity expects to receive.
The mechanics of the ECL calculation are outlined below and the key elements are as follows:
PD: The Probability of Default is an estimate of the likelihood of default over a given time horizon. A default may only happen at a certain time over the assessed period, if the facility has not been previously derecognised and is still in the portfolio
EAD: Exposure at Default is the estimate of the exposure at a future default date, taking into account expected changes in the exposure after the reporting date, including repayments of the principle and interest, whether scheduled by contract or otherwise, expected draw downs on committed facilities.
LGD: Loss Given Default is an estimate of the loss arising in the case where a default occurs at a given time. It is based on the difference between the contractual cash flows due and those that the lenders would expect to receive, including realisation of any collateral. It is usually expressed as a percentage of the EAD.
Forward Looking Information
In its ECL model the Bank relies on broad range qualitative/quantitative forward looking information as economic input such as:
Quantitative Qualitative
GDP Growth Government PoliciesInflation Status of the Industry BusinessUnemployment Regulatory ImpactInterest RatesExchange Rates

281
National Savings Bank Annual Report 2017
Notes to the Financial Statements
2.15.2 Sri Lanka Accounting Standard (SLFRS 15) – “Revenue from Contracts with Customers”
SLFRS 15 establishes a comprehensive framework for determining whether, how much and when revenue is recognised. It replaces existing revenue recognition guidance including Sri Lanka Accounting Standard LKAS 18 – on “Revenue”, Sri Lanka Accounting Standard LKAS 11 – on “Construction Contracts” and IFRIC 13 – on “Customer Loyalty Programmes”. This Standard is effective for the annual periods beginning on or after 01 January 2018.
The Bank and the Group will adopt these standards when they become effective. Pending the completion of detailed review, the financial impact is not reasonably estimable as at the date of publication of these Financial Statements.
2.15.3 Sri Lanka Accounting Standard (SLFRS 16) – “Leases”
This Standard sets out the principles for the recognition, measurement, presentation and disclosure of leases. The objective is to ensure that lessees and lessors provide relevant information in a manner that faithfully represents those transactions. This information gives a basis for users of financial statements to assess the effect that leases have on the financial position, financial performance and cash flows of an entity. This Standard supersedes the following Standards and Interpretations:
(a) LKAS 17 “Leases”;
(b) IFRIC 4 Determining whether an Arrangement Contains a “Leases”;
(c) SIC-15 Operating Leases – Incentives; and
(d) SIC-27 Evaluating the Substance of Transactions Involving the Legal form of a Lease.
An entity shall apply this standard for annual reporting periods beginning on or after 1 January 2019. The Bank and the Group will adopt these standards when they become effective. Pending the completion of detailed review, the financial impact is not reasonably estimable as at the date of publication of these Financial Statements.

282
National Savings Bank Annual Report 2017
Notes to the Financial Statements
3. Gross income3. Gross income
Accounting policy
Gross revenue is recognised to the extent that it is probable that the economic benefits will flow to the Group and the Gross revenue is recognised to the extent that it is probable that the economic benefits will flow to the Group and the revenue can be reliably measured. The specific recognition criteria must also be met before revenue recognition is revenue can be reliably measured. The specific recognition criteria must also be met before revenue recognition is discussed under respective income notes.discussed under respective income notes.
Bank Group
For the year ended 31 December 2017Rs. ’000
2016Rs. ’000
2017Rs. ’000
2016Rs. ’000
Interest income 103,399,962 86,390,039 104,245,541 87,142,784Fee and commission income 782,776 650,164 785,077 651,160Net gain/(loss) from trading 1,206,408 (39,270) 1,520,740 (136,897)Net gain/(loss) from financial investments 707,491 40,923 707,491 40,923Other operating income (net) 1,720,272 357,288 796,897 340,640
Gross income 107,816,909 87,399,144 108,055,746 88,038,610
4. Net interest income4. Net interest income
Accounting policy
Recognition of interest income and interest expenses
For all financial instruments measured at amortised cost, interest-bearing financial assets classified as available for sale For all financial instruments measured at amortised cost, interest-bearing financial assets classified as available for sale and financial instruments designated at fair value through profit or loss, inand financial instruments designated at fair value through profit or loss, interest income or expense is recorded using the terest income or expense is recorded using the EIR, which is the rate that exactly discounts estimated future cash payments or receipts through the expected life of the EIR, which is the rate that exactly discounts estimated future cash payments or receipts through the expected life of the financial instrument or a shorter period, where appropriate, to the net carrying amount of the financial asset or financial financial instrument or a shorter period, where appropriate, to the net carrying amount of the financial asset or financial liability. The calculation takes into account all contractual terms of the financial instrument (for example: prepayment liability. The calculation takes into account all contractual terms of the financial instrument (for example: prepayment options) and includes any fees or incremental costs that are directly attributaoptions) and includes any fees or incremental costs that are directly attributable to the instrument and are an integral part ble to the instrument and are an integral part of the EIR, but not future credit losses.of the EIR, but not future credit losses.
The carrying amount of the financial asset or financial liability is adjusted if the Group revises its estimates of payments The carrying amount of the financial asset or financial liability is adjusted if the Group revises its estimates of payments or receipts. The adjusted carrying amount is calculated based on the original EIR and the change in carrying amount is or receipts. The adjusted carrying amount is calculated based on the original EIR and the change in carrying amount is recorded as interest income for financial assets and interest expense for financial liabilities. However, for a reclassified recorded as interest income for financial assets and interest expense for financial liabilities. However, for a reclassified financial asset for which the Bank subsequently increases its estimates of future cash receipts as a result of increased financial asset for which the Bank subsequently increases its estimates of future cash receipts as a result of increased recoverability of those cash receipts, the effect of that increase are recognised as an adjustment to the EIR from the date recoverability of those cash receipts, the effect of that increase are recognised as an adjustment to the EIR from the date of the change in estimate.of the change in estimate.
Once the recorded value of a financial asset or a group of similar financial assets has been reduced due to an impairment Once the recorded value of a financial asset or a group of similar financial assets has been reduced due to an impairment loss, interest income continues to be recognised using the rate of interest used to discount the future cash flows for the loss, interest income continues to be recognised using the rate of interest used to discount the future cash flows for the purpose of measuring the impairment loss.purpose of measuring the impairment loss.

283
National Savings Bank Annual Report 2017
Notes to the Financial Statements
4. Net interest income (contd.)4. Net interest income (contd.)
Bank Group
For the year ended 31 December 2017Rs. ’000
2016Rs. ’000
2017Rs. ’000
2016Rs. ’000
4. (a) Interest income
Cash and cash equivalents 51,967 37,992 51,967 37,992Placements with banks 710,462 597,916 710,462 597,916Derivative financial instruments – – – –Other financial assets – held for trading 1,337,694 1,370,010 1,854,041 1,816,446Loans and receivables to banks 3,178,875 2,751,558 3,180,780 2,756,295Loans and receivables to other customers 40,580,453 29,937,593 40,411,921 29,916,980Financial investments – available for sale 568,219 36,612 725,318 195,556
Financial investments – held to maturity 56,972,292 51,658,359 57,311,051 51,821,600
Total interest income 103,399,962 86,390,039 104,245,541 87,142,784
4. (b) Interest expenses
Due to bank – – 267,689 44,951Due to other customers 60,161,942 44,365,840 60,161,942 44,365,840Other borrowings 17,502,883 16,550,970 17,777,965 17,036,696Subordinated liabilities 780,000 6,411 780,000 6,411
Total interest expenses 78,444,825 60,923,221 78,987,596 61,453,898
Net interest income 24,955,137 25,466,818 25,257,945 25,688,886
4. (c) Net interest income from Sri Lanka Government Securities
Interest income 58,878,205 53,064,981 59,890,410 53,833,602(Less): Interest expenses – – – –
Net interest income 58,878,205 53,064,981 59,890,410 53,833,602
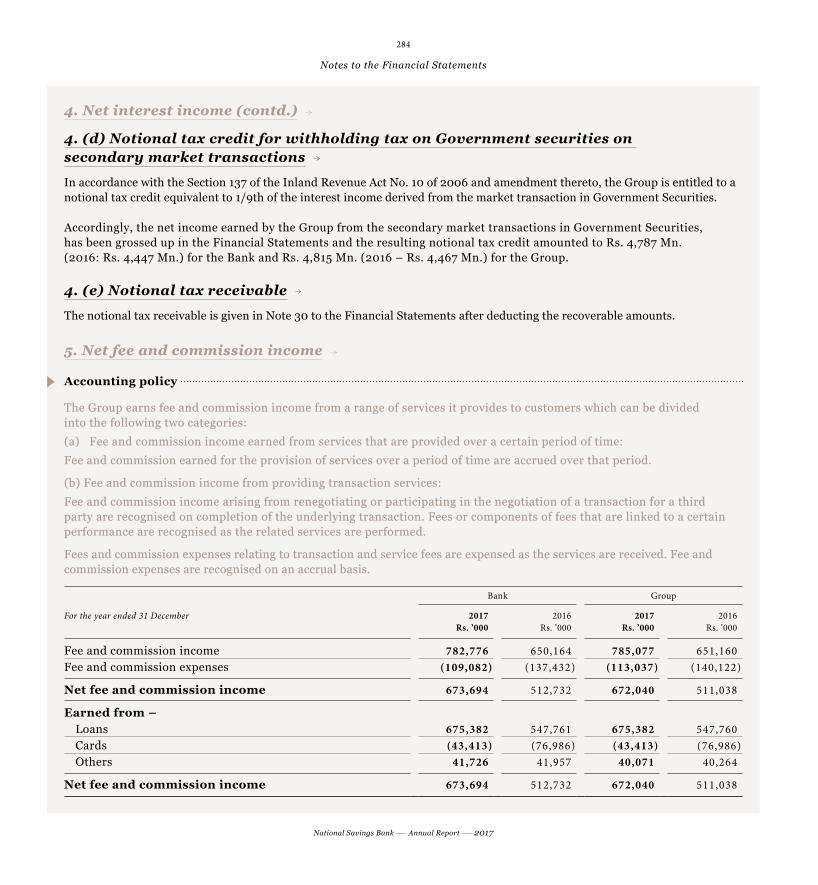
284
National Savings Bank Annual Report 2017
Notes to the Financial Statements
4. Net interest income (contd.)4. Net interest income (contd.)
4. (d) Notional tax credit for withholding tax on Government securities on secondary market transactions
In accordance with the Section 137 of the Inland Revenue Act No. 10 of 2006 and amendment thereto, the Group is entitled to a notional tax credit equivalent to 1/9th of the interest income derived from the market transaction in Government Securities.
Accordingly, the net income earned by the Group from the secondary market transactions in Government Securities, has been grossed up in the Financial Statements and the resulting notional tax credit amounted to Rs. 4,787 Mn. (2016: Rs. 4,447 Mn.) for the Bank and Rs. 4,815 Mn. (2016 – Rs. 4,467 Mn.) for the Group.
4. (e) Notional tax receivable
The notional tax receivable is given in Note 30 to the Financial Statements after deducting the recoverable amounts.
5. Net fee and commission income5. Net fee and commission income
Accounting policy
The Group earns fee and commission income from a range of services it provides to customers which can be divided The Group earns fee and commission income from a range of services it provides to customers which can be divided into the following two categories:into the following two categories:
(a) Fee and commission income earned from services that are provided over a certain period of time:(a) Fee and commission income earned from services that are provided over a certain period of time:
Fee and commission earned for the provision of services over a period of time are accrued over that period.Fee and commission earned for the provision of services over a period of time are accrued over that period.
(b) Fee and commission income from providing transaction services:(b) Fee and commission income from providing transaction services:
Fee and commission income arising from renegotiating or participating in the negotiation of a transaction for a third Fee and commission income arising from renegotiating or participating in the negotiation of a transaction for a third party are recognised on completion of the underlying transaction. Fees or components of fees that are linked to a certain party are recognised on completion of the underlying transaction. Fees or components of fees that are linked to a certain performance are recognised as the related services are performed.performance are recognised as the related services are performed.
Fees and commission expenses relating to transaction and service fees are expensed as the services are received. Fee and Fees and commission expenses relating to transaction and service fees are expensed as the services are received. Fee and commission expenses are recognised on an accrual basis.commission expenses are recognised on an accrual basis.
Bank Group
For the year ended 31 December 2017Rs. ’000
2016Rs. ’000
2017Rs. ’000
2016Rs. ’000
Fee and commission income 782,776 650,164 785,077 651,160Fee and commission expenses (109,082) (137,432) (113,037) (140,122)
Net fee and commission income 673,694 512,732 672,040 511,038
Earned from –Loans 675,382 547,761 675,382 547,760Cards (43,413) (76,986) (43,413) (76,986)Others 41,726 41,957 40,071 40,264
Net fee and commission income 673,694 512,732 672,040 511,038

285
National Savings Bank Annual Report 2017
Notes to the Financial Statements
6. Net gain/(loss) from trading6. Net gain/(loss) from trading
Accounting policy
Net trading income includes all gains and losses from changes in fair value and related dividend for financial assets and Net trading income includes all gains and losses from changes in fair value and related dividend for financial assets and financial liabilities ‘held for trading’ other than interest income/income from foreign exchange.financial liabilities ‘held for trading’ other than interest income/income from foreign exchange.
Dividend income is recognised when the Group’s right to receive the payment is established.Dividend income is recognised when the Group’s right to receive the payment is established.
Bank Group
For the year ended 31 December 2017Rs. ’000
2016Rs. ’000
2017Rs. ’000
2016Rs. ’000
Foreign exchange from other customers 200,639 296,380 200,639 296,380Interest rates – mark-to-market gain/(loss) and others 973,468 (72,705) 1,287,800 (170,332)Equities – mark-to-market gain/(loss) and others 334,601 (314,945) 334,601 (314,945)Others – forward swap/contract (302,300) 52,000 (302,300) 52,000
Total 1,206,408 (39,270) 1,520,740 (136,897)
7. Net gain/(loss) from financial instruments designated at fair value through 7. Net gain/(loss) from financial instruments designated at fair value through profit or lossprofit or loss
Bank/Group has not designated any financial assets at fair value through profit or loss as at the reporting date.
8. Net gain/(loss) from financial investments8. Net gain/(loss) from financial investments
Accounting policy
‘Net gains/(losses) from financial investments’ comprise gains less losses related to available-for-sale investments and ‘Net gains/(losses) from financial investments’ comprise gains less losses related to available-for-sale investments and loans and receivables, and include all realised and unrealised fair value changes.loans and receivables, and include all realised and unrealised fair value changes.
Bank Group
For the year ended 31 December 2017Rs. ’000
2016Rs. ’000
2017Rs. ’000
2016Rs. ’000
Assets available-for-sale Sri Lanka Government Securities – Treasury Bonds/Bills 707,491 40,923 707,491 40,923
Total 707,491 40,923 707,491 40,923
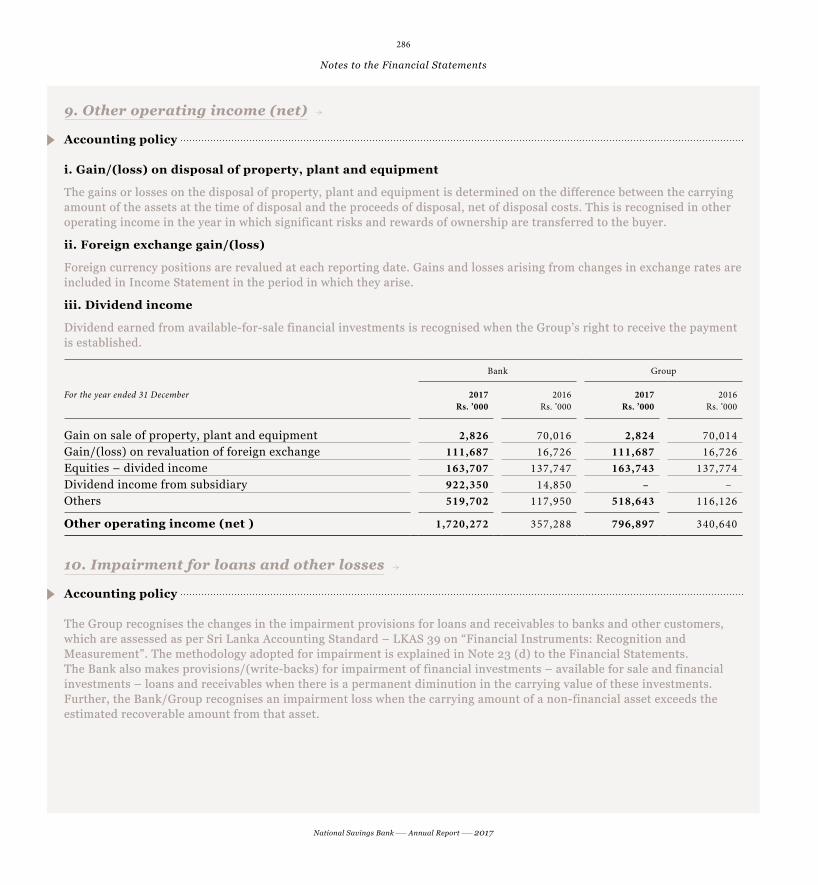
286
National Savings Bank Annual Report 2017
Notes to the Financial Statements
9. Other operating income (net)9. Other operating income (net)
Accounting policy
i. Gain/(loss) on disposal of property, plant and equipment
The gains or losses on the disposal of property, plant and equipment is determined on the difference between the carrying The gains or losses on the disposal of property, plant and equipment is determined on the difference between the carrying amount of the assets at the time of disposal and the proceeds of disposal, net of disposal costs. This is recognised in other amount of the assets at the time of disposal and the proceeds of disposal, net of disposal costs. This is recognised in other operating income in the year in which significant risks and rewards of ownership are transferred to the buyer.operating income in the year in which significant risks and rewards of ownership are transferred to the buyer.
ii. Foreign exchange gain/(loss)
Foreign currency positions are revalued at each reporting date. Gains and losses arising from changes in exchange rates are Foreign currency positions are revalued at each reporting date. Gains and losses arising from changes in exchange rates are included in Income Statement in the period in which they arise.included in Income Statement in the period in which they arise.
iii. Dividend income
Dividend earned from available-for-sale financial investments is recognised when the Group’s right to receive the payment Dividend earned from available-for-sale financial investments is recognised when the Group’s right to receive the payment is established.is established.
Bank Group
For the year ended 31 December 2017Rs. ’000
2016Rs. ’000
2017Rs. ’000
2016Rs. ’000
Gain on sale of property, plant and equipment 2,826 70,016 2,824 70,014Gain/(loss) on revaluation of foreign exchange 111,687 16,726 111,687 16,726Equities – divided income 163,707 137,747 163,743 137,774Dividend income from subsidiary 922,350 14,850 – –Others 519,702 117,950 518,643 116,126
Other operating income (net ) 1,720,272 357,288 796,897 340,640
10. Impairment for loans and other losses10. Impairment for loans and other losses
Accounting policy
The Group recognises the changes in the impairment provisions for loans and receivables to banks and other customers, The Group recognises the changes in the impairment provisions for loans and receivables to banks and other customers, which are assessed as per Sri Lanka Accounting Standard – LKAS 39 on “Financial Instruments: Recognition and which are assessed as per Sri Lanka Accounting Standard – LKAS 39 on “Financial Instruments: Recognition and Measurement”. The methodology adopted for impairment is explained in Note 23 (d) to the Financial Statements. Measurement”. The methodology adopted for impairment is explained in Note 23 (d) to the Financial Statements. The Bank also makes provisions/(write-backs) for impairment of financial investments – available for sale and financial The Bank also makes provisions/(write-backs) for impairment of financial investments – available for sale and financial investments – loans and receivables when there is a permanent diminution in the carrying value of these investments. investments – loans and receivables when there is a permanent diminution in the carrying value of these investments. Further, the Bank/Group recognises an impairment loss when the carrying amount of a non-financial asset exceeds the Further, the Bank/Group recognises an impairment loss when the carrying amount of a non-financial asset exceeds the estimated recoverable amount from that asset.estimated recoverable amount from that asset.

287
National Savings Bank Annual Report 2017
Notes to the Financial Statements
10. Impairment for loans and other losses (contd.)10. Impairment for loans and other losses (contd.)
Bank Group
For the year ended 31 December 2017Rs. ’000
2016Rs. ’000
2017Rs. ’000
2016Rs. ’000
Loans and receivables to other customers [refer Note 23. (d)] 693,233 (99,693) 693,233 (99,693)
Total 693,233 (99,693) 693,233 (99,693)
11. Personnel expenses11. Personnel expenses
Accounting policy
i. Defined contribution plans
The Group operates a defined contribution plan. The contribution payable to a defined contribution plan is in proportion The Group operates a defined contribution plan. The contribution payable to a defined contribution plan is in proportion to the services rendered to the Group by the employees and is recorded as an expense under “Personnel expenses”. Unpaid to the services rendered to the Group by the employees and is recorded as an expense under “Personnel expenses”. Unpaid contributions are recorded as a liability. The Group contributes to the following defined contribution plans:contributions are recorded as a liability. The Group contributes to the following defined contribution plans:
(a) Employees’ Provident Fund
The Bank and employees contribute 12% and 8% respectively of the employee’s monthly gross salary (excluding overtime) The Bank and employees contribute 12% and 8% respectively of the employee’s monthly gross salary (excluding overtime) to the Provident Fund. The Bank’s Provident Fund is an approved fund under the Employees’ Provident Fund Act. The to the Provident Fund. The Bank’s Provident Fund is an approved fund under the Employees’ Provident Fund Act. The Bank guarantees 8% p.a. return to the members of the Employees’ Provident Fund.Bank guarantees 8% p.a. return to the members of the Employees’ Provident Fund.
NSB Fund Management Company and its employees contribute 12% and 8% respectively to the Employees’ Provident Fund NSB Fund Management Company and its employees contribute 12% and 8% respectively to the Employees’ Provident Fund (EPF) maintained by Central Bank of Sri Lanka.(EPF) maintained by Central Bank of Sri Lanka.
(b) Employees’ Trust Fund
The Group contributes 3% of the employee’s monthly gross salary (excluding overtime) to the Employees’ Trust Fund The Group contributes 3% of the employee’s monthly gross salary (excluding overtime) to the Employees’ Trust Fund maintained by the Employees’ Trust Fund Board.maintained by the Employees’ Trust Fund Board.

288
National Savings Bank Annual Report 2017
Notes to the Financial Statements
11. Personnel expenses (contd.)11. Personnel expenses (contd.)
ii. Defined benefit plans
Contribution to defined benefit plans are recognised in the Income Statement based on an Actuarial Valuation carried out Contribution to defined benefit plans are recognised in the Income Statement based on an Actuarial Valuation carried out separately for each defined benefit plan in accordance with Sri Lanka Accounting Standard – LKAS 19 on “Employee Benefits”.separately for each defined benefit plan in accordance with Sri Lanka Accounting Standard – LKAS 19 on “Employee Benefits”.
Bank Group
For the year ended 31 December 2017Rs. ’000
2016Rs. ’000
2017Rs. ’000
2016Rs. ’000
Salary and bonus 5,576,762 4,701,071 5,604,513 4,728,359Contribution – Staff Provident Fund 404,151 354,545 404,994 355,301Contribution – Employees’ Trust Fund 101,038 88,637 101,249 88,826Contribution – staff pension fund I [Note 11. (a) and 34. (a) 1] 392,077 577,594 392,077 577,797Contribution – staff pension fund II [Note 11. (b) and 34. (a) 2] 97,240 251,758 97,572 252,043Gratuity on termination of service [Note 34. (a) 4] 5,571 14,590 5,815 14,837Retired Staff Medical Assistance Scheme [Note 34. (a) 3] 96,108 71,698 96,108 71,698Others 213,558 175,477 216,486 177,653
Total 6,886,505 6,235,370 6,918,813 6,266,515
11. (a) Contribution – Staff pension fund – I
Bank Group
For the year ended 31 December 2017Rs. ’000
2016Rs. ’000
2017Rs. ’000
2016Rs. ’000
Amount recognised as expense 392,077 577,594 392,077 577,797
Actuarial valuation was carried out by Mr Piyal S Goonetilleke, Fellow of Society of Actuaries (USA) of Piyal S Goonetilleke & Associates, on 31 December 2017 [Refer Note 34. (a)].
11. (b) Contribution – Staff pension fund – II
Bank Group
For the year ended 31 December 2017Rs. ’000
2016Rs. ’000
2017Rs. ’000
2016Rs. ’000
Amount recognised as expense 97,240 251,758 97,572 252,043
Pension scheme II has been established for the employees who joined the Bank on or after 1 October 1995. Actuarial valuation was carried out by Mr Piyal S Goonetilleke, Fellow of Society of Actuaries (USA) of Piyal S Goonetilleke & Associates, on 31 December 2017 [Refer Note 34 (a)].
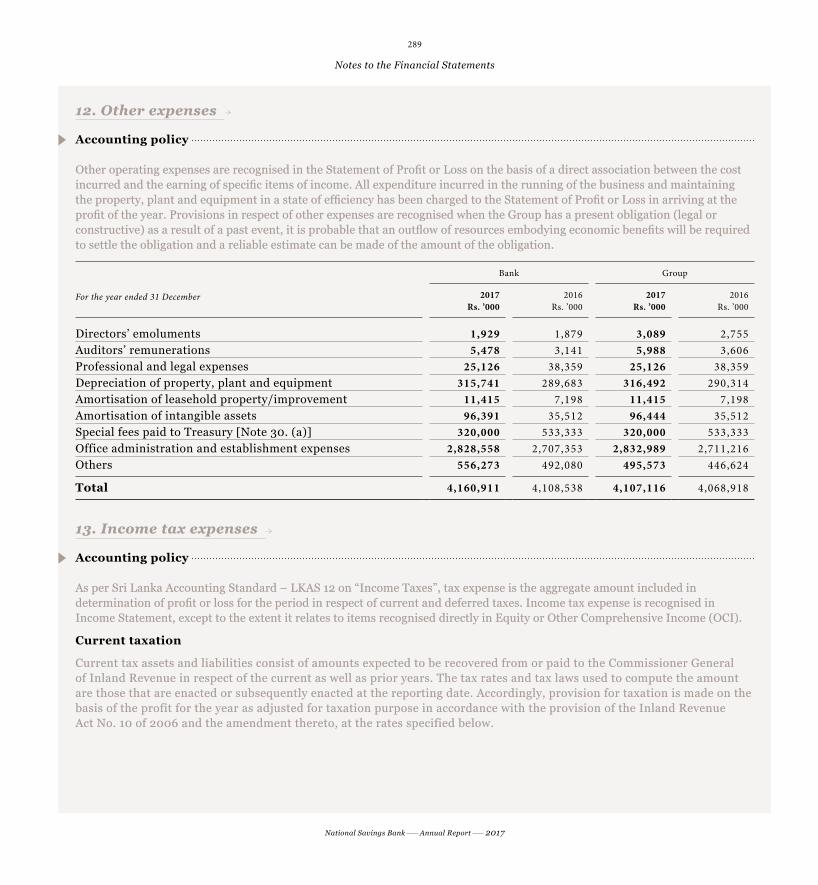
289
National Savings Bank Annual Report 2017
Notes to the Financial Statements
12. Other expenses 12. Other expenses
Accounting policy
Other operating expenses are recognised in the Statement of Profit or Loss on the basis of a direct association between the cost Other operating expenses are recognised in the Statement of Profit or Loss on the basis of a direct association between the cost incurred and the earning of specific items of income. All expenditure incurred in the running of the business and maintaining incurred and the earning of specific items of income. All expenditure incurred in the running of the business and maintaining the property, plant and equipment in a state of efficiency has been charged to the Statement of Profit or Loss in arriving at the the property, plant and equipment in a state of efficiency has been charged to the Statement of Profit or Loss in arriving at the profit of the year. Provisions in respect of other expenses are recognised when the Group has a present obligation (legal or profit of the year. Provisions in respect of other expenses are recognised when the Group has a present obligation (legal or constructive) as a result of a past event, it is probable that an outflow of resources embodying economic benefits will be required constructive) as a result of a past event, it is probable that an outflow of resources embodying economic benefits will be required to settle the obligation and a reliable estimate can be made of the amount of the obligation.to settle the obligation and a reliable estimate can be made of the amount of the obligation.
Bank Group
For the year ended 31 December 2017Rs. ’000
2016Rs. ’000
2017Rs. ’000
2016Rs. ’000
Directors’ emoluments 1,929 1,879 3,089 2,755Auditors’ remunerations 5,478 3,141 5,988 3,606Professional and legal expenses 25,126 38,359 25,126 38,359Depreciation of property, plant and equipment 315,741 289,683 316,492 290,314Amortisation of leasehold property/improvement 11,415 7,198 11,415 7,198Amortisation of intangible assets 96,391 35,512 96,444 35,512Special fees paid to Treasury [Note 30. (a)] 320,000 533,333 320,000 533,333Office administration and establishment expenses 2,828,558 2,707,353 2,832,989 2,711,216Others 556,273 492,080 495,573 446,624
Total 4,160,911 4,108,538 4,107,116 4,068,918
13. Income tax expenses 13. Income tax expenses
Accounting policy
As per Sri Lanka Accounting Standard – LKAS 12 on “Income Taxes”, tax expense is the aggregate amount included in As per Sri Lanka Accounting Standard – LKAS 12 on “Income Taxes”, tax expense is the aggregate amount included in determination of profit or loss for the period in respect of current and deferred taxes. Income tax expense is recognised in determination of profit or loss for the period in respect of current and deferred taxes. Income tax expense is recognised in Income Statement, except to the extent it relates to items recognised directly in Equity or Other Comprehensive Income (OCI).Income Statement, except to the extent it relates to items recognised directly in Equity or Other Comprehensive Income (OCI).
Current taxation
Current tax assets and liabilities consist of amounts expected to be recovered from or paid to the Commissioner General Current tax assets and liabilities consist of amounts expected to be recovered from or paid to the Commissioner General of Inland Revenue in respect of the current as well as prior years. The tax rates and tax laws used to compute the amount of Inland Revenue in respect of the current as well as prior years. The tax rates and tax laws used to compute the amount are those that are enacted or subsequently enacted at the reporting date. Accordingly, provision for taxation is made on the are those that are enacted or subsequently enacted at the reporting date. Accordingly, provision for taxation is made on the basis of the profit for the year as adjusted for taxation purpose in accordance with the provision of the Inland Revenue basis of the profit for the year as adjusted for taxation purpose in accordance with the provision of the Inland Revenue Act No. 10 of 2006 and the amendment thereto, at the rates specified below.Act No. 10 of 2006 and the amendment thereto, at the rates specified below.

290
National Savings Bank Annual Report 2017
Notes to the Financial Statements
13. Income tax expenses (contd.)13. Income tax expenses (contd.)
Deferred taxation
Deferred tax is provided using the liability method on temporary differences at the reporting date between the tax bases of Deferred tax is provided using the liability method on temporary differences at the reporting date between the tax bases of assets and liabilities and their carrying amounts for financial reporting purpose.assets and liabilities and their carrying amounts for financial reporting purpose.
Deferred tax assets are recognised for all deductible differences. Carry forward of unused tax credits and unused tax losses, Deferred tax assets are recognised for all deductible differences. Carry forward of unused tax credits and unused tax losses, to the extent that it is probable that taxable profits will be available against which the deductible temporary differences and to the extent that it is probable that taxable profits will be available against which the deductible temporary differences and the carry forward of unused tax credits and unused tax losses can be utilised.the carry forward of unused tax credits and unused tax losses can be utilised.
The carrying amount of a deferred tax asset is reviewed at each reporting date and reduced to the extent it is no longer The carrying amount of a deferred tax asset is reviewed at each reporting date and reduced to the extent it is no longer probable that sufficient taxable profit will be available to allow all or part of the deferred tax asset to be utilised. probable that sufficient taxable profit will be available to allow all or part of the deferred tax asset to be utilised. Unrecognised deferred tax assets are reassessed at each reporting date and are recognised to the extent that is probable Unrecognised deferred tax assets are reassessed at each reporting date and are recognised to the extent that is probable that future taxable profit will allow the deferred tax asset to be recovered.that future taxable profit will allow the deferred tax asset to be recovered.
Deferred tax assets and liabilities are measured at the tax rate that are expected to apply in the year when the assets are Deferred tax assets and liabilities are measured at the tax rate that are expected to apply in the year when the assets are realised or the liabilities are settled, based on tax rates and tax laws that have been enacted or subsequently enacted at the realised or the liabilities are settled, based on tax rates and tax laws that have been enacted or subsequently enacted at the reporting date.reporting date.
Bank Group
For the year ended 31 December 2017Rs. ’000
2016Rs. ’000
2017Rs. ’000
2016Rs. ’000
Current tax expensesCurrent year tax expenses 4,328,136 3,896,240 4,503,829 3,930,455Prior years (over)/under provision – (2,726) (310) (6,856)
Deferred tax expensesTemporary differences [refer Note 13. (b)] 90,883 (88,243) 91,546 (88,604)
Total 4,419,019 3,805,271 4,595,065 3,834,995
Effective tax rate (%) 31.50 28.60 33.68 28.63Effective tax rate (excluding deferred tax) (%) 30.85 29.27 33.00 29.29
13. (a) Reconciliation of tax expenses
Profit before tax 14,028,719 13,302,987 13,645,212 13,397,277Income tax for the period (Accounting profit @ 28%) 3,928,041 3,724,836 3,820,659 3,751,238Add: Tax effect of expenses that are not deductible for tax purposes 2,854,015 2,089,332 2,881,503 2,100,179(Less): Tax effect of expenses that are deductible for tax purposes 2,453,920 1,917,928 2,198,334 1,920,962
Tax expense for the period 4,328,136 3,896,240 4,503,829 3,930,455

291
National Savings Bank Annual Report 2017
Notes to the Financial Statements
13. Income tax expenses (contd.)13. Income tax expenses (contd.)
13. (b) The deferred tax charge in the Income Statement comprises the following:
Bank Group
For the year ended 31 December 2017Rs. ’000
2016Rs. ’000
2017Rs. ’000
2016Rs. ’000
Deferred tax assets – – (663) 361Deferred tax liabilities 90,883 (88,243) 90,883 (88,243)
Deferred tax (credit)/charge to Income Statement 90,883 (88,243) 91,546 (88,604)
14. Earnings per share (EPS)14. Earnings per share (EPS)
Accounting policy
The Group presents basic and diluted earnings per share (EPS) data for its ordinary shares. Basic EPS is calculated by The Group presents basic and diluted earnings per share (EPS) data for its ordinary shares. Basic EPS is calculated by dividing the profit or loss for the year attributable to ordinary shareholders of the Bank by the weighted average number dividing the profit or loss for the year attributable to ordinary shareholders of the Bank by the weighted average number of ordinary shares outstanding during the year. Diluted EPS is determined by adjusting the profit or loss attributable to of ordinary shares outstanding during the year. Diluted EPS is determined by adjusting the profit or loss attributable to the ordinary shareholders and the weighted average number of ordinary shares outstanding for the effects of all dilutive the ordinary shareholders and the weighted average number of ordinary shares outstanding for the effects of all dilutive potential ordinary shares, if any.potential ordinary shares, if any.
Bank Group
For the year ended 31 December 2017Rs. ’000
2016Rs. ’000
2017Rs. ’000
2016Rs. ’000
Net profit attributable to ordinary equity holders 9,609,700 9,497,716 9,050,147 9,562,282Adjustment for the effect of dilution – – – –Net profit attributable to ordinary equity holders adjusted for the effect of dilution 9,609,700 9,497,716 9,050,147 9,562,282Weighted average number of ordinary shares for basic earnings per share 620,000 320,000 620,000 320,000Effect of dilution – – – –Weighted average number of ordinary shares adjusted for the effect of dilution 620,000 320,000 620,000 320,000
Basic earnings per ordinary share (Rs.) 15.50 29.68 14.60 29.88
Diluted earnings per ordinary share (Rs.) 15.50 29.68 14.60 29.88

292
National Savings Bank Annual Report 2017
Notes to the Financial Statements
14. Earnings per share (EPS) (contd.)14. Earnings per share (EPS) (contd.)
14. (a) Weighted average number of ordinary shares for basic and diluted earnings per share
Outstanding number of shares Weight average number of shares
2017Rs. ’000
2016Rs. ’000
2017Rs. ’000
2017Rs. ’000
Number of shares in issue as at January 1, 620,000 320,000 620,000 320,000Add: Number of shares issued during the year (refer Note 36) 50,000 300,000 – –
Weighted average number of ordinary shares basic and diluted earning per shares 670,000 620,000 620,000 320,000
15. Analysis of financial instruments by measurement basis15. Analysis of financial instruments by measurement basis
Accounting policy
The carrying amounts of financial instruments by category as defined in Sri Lanka Accounting Standard – LKAS 39 The carrying amounts of financial instruments by category as defined in Sri Lanka Accounting Standard – LKAS 39 on “Financial Instruments: Recognition and Measurement” under headings of the Statement of Financial Position on “Financial Instruments: Recognition and Measurement” under headings of the Statement of Financial Position are summarised below:are summarised below:
15. (a) Bank – 2017
HFTRs. ’000
HTMRs. ’000
Amortised costRs. ’000
AFSRs. ’000
FVTPLRs. ’000
HedgingRs. ’000
TotalRs. ’000
AssetsCash and cash equivalents – – 3,849,627 – – – 3,849,627Balances with central banks – – – – – – –Placements with banks – – 23,438,104 – – – 23,438,104Derivative financial instruments – – – – – 1,360,714 1,360,714Other financial assets held for trading 6,472,314 – – – – – 6,472,314Other financial assets at fair value through profit or loss – – – – – – –Loans and receivables to banks – – 27,714,565 – – – 27,714,565Loans and receivables to other customers – – 360,309,866 – – – 360,309,866Financial investments – 544,273,077 – 5,693,829 – – 549,966,906
Total financial assets 6,472,314 544,273,077 415,312,162 5,693,829 – 1,360,714 973,112,095

293
National Savings Bank Annual Report 2017
Notes to the Financial Statements
15. Analysis of financial instruments by measurement basis (contd.)15. Analysis of financial instruments by measurement basis (contd.)
15. (a) Bank – 2017 (contd.)
HFT
Rs. ’000
Designated at fair value
Rs. ’000
Amortised cost
Rs. ’000
FVTPL
Rs. ’000
Hedging
Rs. ’000
Total
Rs. ’000
LiabilitiesDue to banks – – 180,439 – – 180,439Derivative financial instruments – – – – 956,937 956,937Other financial liabilities at fair value through profit or loss – – – – – –Due to other customers – – 737,212,640 – – 737,212,640Other borrowings – – 217,955,777 – – 217,955,777Subordinated liabilities – – 6,006,411 – – 6,006,411
Total financial liabilities – – 961,355,267 – 956,937 962,312,204
Held-for-trading – HFTDesignated at fair value through profit or loss – Designated at fair value – FVTPLLoans and receivables/deposits at amortised cost – Amortised costHeld to maturity – HTMAvailable for sale – AFSInstruments of fair value and cash flow hedging – Hedging
15. (b) Bank – 2016
HFTRs. ’000
HTMRs. ’000
Amortised costRs. ’000
AFSRs. ’000
FVTPLRs. ’000
HedgingRs. ’000
TotalRs. ’000
AssetsCash and cash equivalents – – 4,619,699 – – – 4,619,699Balances with central banks – – – – – – –Placements with banks – – 19,013,572 – – – 19,013,572Derivative financial instruments – – – – – 2,728,445 2,728,445Other financial assets held for trading 20,290,588 – – – – – 20,290,588Other financial assets at fair value through profit or loss – – – – – – –Loans and receivables to banks – – 31,834,072 – – – 31,834,072Loans and receivables to other customers – – 291,976,942 – – – 291,976,942Financial investments – 505,824,398 – 6,227,764 – – 512,052,162
Total financial assets 20,290,588 505,824,398 347,444,284 6,227,764 – 2,728,445 882,515,480

294
National Savings Bank Annual Report 2017
Notes to the Financial Statements
15. Analysis of financial instruments by measurement basis (contd.)15. Analysis of financial instruments by measurement basis (contd.)
15. (b) Bank – 2016 (contd.)
HFT
Rs. ’000
Designated at fair value
Rs. ’000
Amortised cost
Rs. ’000
FVTPL
Rs. ’000
Hedging
Rs. ’000
Total
Rs. ’000
LiabilitiesDue to banks – – 115,391 – – 115,391Derivative financial instruments – – – – – –Other financial liabilities at fair value through profit or loss – – – – – –Due to other customers – – 657,280,315 – – 657,280,315Other borrowings – – 207,039,909 – – 207,039,909
Subordinated liabilities – – 6,006,411 – – 6,006,411
Total financial liabilities – – 870,442,026 – – 870,442,026
15. (c) Group – 2017
HFTRs. ’000
HTMRs. ’000
Amortised costRs. ’000
AFSRs. ’000
FVTPLRs. ’000
HedgingRs. ’000
TotalRs. ’000
AssetsCash and cash equivalents – – 3,854,086 – – – 3,854,086Balances with central banks – – 94 – – – 94Placements with banks – – 23,438,104 – – – 23,438,104Derivative financial instruments – – – – – 1,360,714 1,360,714Other financial assets held for trading 9,389,950 – – – – – 9,389,950Other financial assets at fair value through profit or loss – – – – – – –Loans and receivables to banks – – 27,971,234 – – – 27,971,234Loans and receivables to other customers – – 358,766,093 – – – 358,766,093Financial investments – 547,924,390 – 7,713,852 – – 555,638,242
Total financial assets 9,389,950 547,924,390 414,029,611 7,713,852 – 1,360,714 980,418,516
HFT
Rs. ’000
Designated at fair value
Rs. ’000
Amortised cost
Rs. ’000
FVTPL
Rs. ’000
Hedging
Rs. ’000
Total
Rs. ’000
LiabilitiesDue to banks – – 828,433 – – 828,433Derivative financial instruments – – – – 956,937 956,937Other financial liabilities at fair value through profit or loss – – – – – –Due to other customers – – 737,212,640 – – 737,212,640Other borrowings – – 222,771,969 – – 222,771,969Subordinated liabilities – – 6,006,411 – – 6,006,411
Total financial liabilities – – 966,819,453 – 956,937 967,776,390

295
National Savings Bank Annual Report 2017
Notes to the Financial Statements
15. Analysis of financial instruments by measurement basis (contd.)15. Analysis of financial instruments by measurement basis (contd.)
15. (d) Group – 2016
HFTRs. ’000
HTMRs. ’000
Amortised costRs. ’000
AFSRs. ’000
FVTPLRs. ’000
HedgingRs. ’000
TotalRs. ’000
AssetsCash and cash equivalents – – 4,627,629 – – – 4,627,629Balances with central banks – – 477 – – – 477Placements with banks – – 19,013,572 – – – 19,013,572Derivative financial instruments – – – – – 2,728,445 2,728,445Other financial assets held for trading 27,303,207 – – – – – 27,303,207Other financial assets at fair value through profit or loss – – – – – – –Loans and receivables to banks – – 31,834,072 – – – 31,834,072Loans and receivables to other customers – – 291,178,121 – – – 291,178,121Financial investments – 507,624,954 – 8,122,516 – – 515,747,470
Total financial assets 27,303,207 507,624,954 346,653,871 8,122,516 – 2,728,445 892,432,992
HFT
Rs. ’000
Designated at fair value
Rs. ’000
Amortised cost
Rs. ’000
FVTPL
Rs. ’000
Hedging
Rs. ’000
Total
Rs. ’000
LiabilitiesDue to banks – – 2,858,673 – – 2,858,673Derivative financial instruments – – – – – –Other financial liabilities at fair value through profit or loss – – – – – –Due to other customers – – 657,280,315 – – 657,280,315Other borrowings – – 212,629,427 – – 212,629,427Subordinated liabilities – – 6,006,411 – – 6,006,411
Total financial liabilities – – 878,774,826 – – 878,774,826

296
National Savings Bank Annual Report 2017
Notes to the Financial Statements
16. Cash and cash equivalents16. Cash and cash equivalents
Accounting policy
Cash and cash equivalents include cash in hand, balances with banks, money at call and short notice that are subject to Cash and cash equivalents include cash in hand, balances with banks, money at call and short notice that are subject to an insignificant risk of change in their value. Cash and cash equivalents are carried at amortised cost in the Statement of an insignificant risk of change in their value. Cash and cash equivalents are carried at amortised cost in the Statement of Financial Position.Financial Position.
Bank Group
As at 31 December 2017Rs. ’000
2016Rs. ’000
2017Rs. ’000
2016Rs. ’000
Cash in hand 944,759 691,527 944,769 691,537Balances with banks 2,892,643 3,881,589 2,897,093 3,889,509Money at call and short notice 12,224 46,583 12,224 46,583
Total 3,849,627 4,619,699 3,854,086 4,627,629
17. Balances with central banks17. Balances with central banks
Bank Group
As at 31 December 2017Rs. ’000
2016Rs. ’000
2017Rs. ’000
2016Rs. ’000
Balances with Central Bank of Sri Lanka – – 94 477
Total – – 94 477
18. Placements with Banks18. Placements with Banks
Accounting policy
Placement with banks include short-term deposits placed in banks that are subjected to insignificant risk of changes in Placement with banks include short-term deposits placed in banks that are subjected to insignificant risk of changes in fair value, and are used by the Bank and the Group in the management of its short-term commitments. They are recorded fair value, and are used by the Bank and the Group in the management of its short-term commitments. They are recorded in the Financial Statements at their face values or the gross values, where appropriate.in the Financial Statements at their face values or the gross values, where appropriate.
Bank Group
As at 31 December 2017Rs. ’000
2016Rs. ’000
2017Rs. ’000
2016Rs. ’000
Placements with banks – Sri Lanka 23,438,104 19,013,572 23,438,104 19,013,572
Total 23,438,104 19,013,572 23,438,104 19,013,572
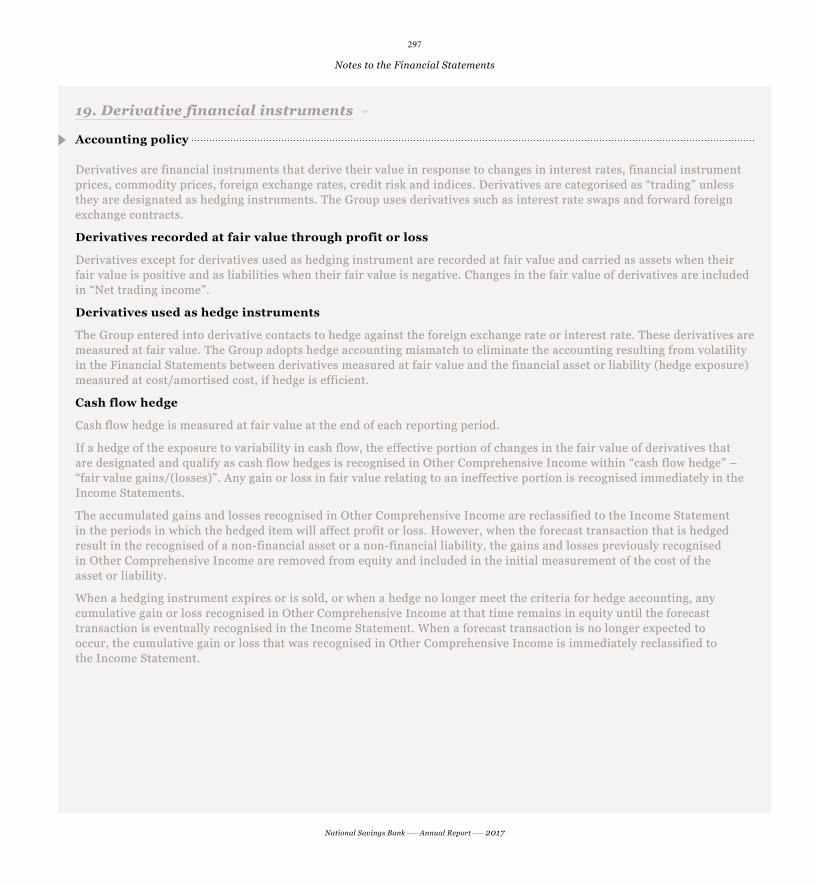
297
National Savings Bank Annual Report 2017
Notes to the Financial Statements
19. Derivative financial instruments19. Derivative financial instruments
Accounting policy
Derivatives are financial instruments that derive their value in response to changes in interest rates, financial instrument Derivatives are financial instruments that derive their value in response to changes in interest rates, financial instrument prices, commodity prices, foreign exchange rates, credit risk and indices. Derivatives are categorised as “trading” unless prices, commodity prices, foreign exchange rates, credit risk and indices. Derivatives are categorised as “trading” unless they are designated as hedging instruments. The Group uses derivatives such as interest rate swaps and forward foreign they are designated as hedging instruments. The Group uses derivatives such as interest rate swaps and forward foreign exchange contracts.exchange contracts.
Derivatives recorded at fair value through profit or loss
Derivatives except for derivatives used as hedging instrument are recorded at fair value and carried as assets when their Derivatives except for derivatives used as hedging instrument are recorded at fair value and carried as assets when their fair value is positive and as liabilities when their fair value is negative. Changes in the fair value of derivatives are included fair value is positive and as liabilities when their fair value is negative. Changes in the fair value of derivatives are included in “Net trading income”.in “Net trading income”.
Derivatives used as hedge instruments
The Group entered into derivative contacts to hedge against the foreign exchange rate or interest rate. These derivatives are The Group entered into derivative contacts to hedge against the foreign exchange rate or interest rate. These derivatives are measured at fair value. The Group adopts hedge accounting mismatch to eliminate the accounting resulting from volatility measured at fair value. The Group adopts hedge accounting mismatch to eliminate the accounting resulting from volatility in the Financial Statements between derivatives measured at fair value and the financial asset or liability (hedge exposure) in the Financial Statements between derivatives measured at fair value and the financial asset or liability (hedge exposure) measured at cost/amortised cost, if hedge is efficient.measured at cost/amortised cost, if hedge is efficient.
Cash flow hedge
Cash flow hedge is measured at fair value at the end of each reporting period.Cash flow hedge is measured at fair value at the end of each reporting period.
If a hedge of the exposure to variability in cash flow, the effective portion of changes in the fair value of derivatives that If a hedge of the exposure to variability in cash flow, the effective portion of changes in the fair value of derivatives that are designated and qualify as cash flow hedges is recognised in Other Comprehensive Income within “cash flow hedge” – are designated and qualify as cash flow hedges is recognised in Other Comprehensive Income within “cash flow hedge” – “fair value gains/(losses)”. Any gain or loss in fair value relating to an ineffective portion is recognised immediately in the “fair value gains/(losses)”. Any gain or loss in fair value relating to an ineffective portion is recognised immediately in the Income Statements.Income Statements.
The accumulated gains and losses recognised in Other Comprehensive Income are reclassified to the Income Statement The accumulated gains and losses recognised in Other Comprehensive Income are reclassified to the Income Statement in the periods in which the hedged item will affect profit or loss. However, when the forecast transaction that is hedged in the periods in which the hedged item will affect profit or loss. However, when the forecast transaction that is hedged result in the recognised of a non-financial asset or a non-financial liability, the gains and losses previously recognised result in the recognised of a non-financial asset or a non-financial liability, the gains and losses previously recognised in Other Comprehensive Income are removed from equity and included in the initial measurement of the cost of the in Other Comprehensive Income are removed from equity and included in the initial measurement of the cost of the asset or liability.asset or liability.
When a hedging instrument expires or is sold, or when a hedge no longer meet the criteria for hedge accounting, any When a hedging instrument expires or is sold, or when a hedge no longer meet the criteria for hedge accounting, any cumulative gain or loss recognised in Other Comprehensive Income at that time remains in equity until the forecast cumulative gain or loss recognised in Other Comprehensive Income at that time remains in equity until the forecast transaction is eventually recognised in the Income Statement. When a forecast transaction is no longer expected to transaction is eventually recognised in the Income Statement. When a forecast transaction is no longer expected to occur, the cumulative gain or loss that was recognised in Other Comprehensive Income is immediately reclassified to occur, the cumulative gain or loss that was recognised in Other Comprehensive Income is immediately reclassified to the Income Statement.the Income Statement.
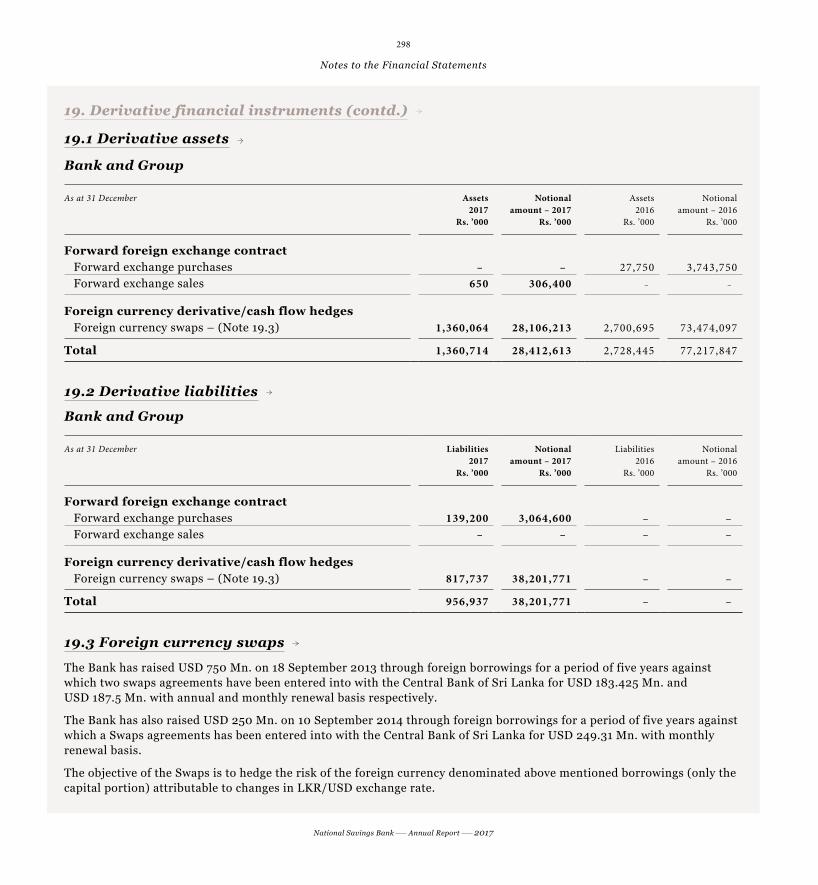
298
National Savings Bank Annual Report 2017
Notes to the Financial Statements
19. Derivative financial instruments (contd.)19. Derivative financial instruments (contd.)
19.1 Derivative assets
Bank and Group
As at 31 December Assets 2017
Rs. ’000
Notional amount – 2017
Rs. ’000
Assets 2016
Rs. ’000
Notional amount – 2016
Rs. ’000
Forward foreign exchange contract Forward exchange purchases – – 27,750 3,743,750 Forward exchange sales 650 306,400 – –
Foreign currency derivative/cash flow hedges Foreign currency swaps – (Note 19.3) 1,360,064 28,106,213 2,700,695 73,474,097
Total 1,360,714 28,412,613 2,728,445 77,217,847
19.2 Derivative liabilities
Bank and Group
As at 31 December Liabilities 2017
Rs. ’000
Notional amount – 2017
Rs. ’000
Liabilities 2016
Rs. ’000
Notional amount – 2016
Rs. ’000
Forward foreign exchange contract Forward exchange purchases 139,200 3,064,600 – – Forward exchange sales – – – –
Foreign currency derivative/cash flow hedges Foreign currency swaps – (Note 19.3) 817,737 38,201,771 – –
Total 956,937 38,201,771 – –
19.3 Foreign currency swaps
The Bank has raised USD 750 Mn. on 18 September 2013 through foreign borrowings for a period of five years against which two swaps agreements have been entered into with the Central Bank of Sri Lanka for USD 183.425 Mn. and USD 187.5 Mn. with annual and monthly renewal basis respectively.
The Bank has also raised USD 250 Mn. on 10 September 2014 through foreign borrowings for a period of five years against which a Swaps agreements has been entered into with the Central Bank of Sri Lanka for USD 249.31 Mn. with monthly renewal basis.
The objective of the Swaps is to hedge the risk of the foreign currency denominated above mentioned borrowings (only the capital portion) attributable to changes in LKR/USD exchange rate.

299
National Savings Bank Annual Report 2017
Notes to the Financial Statements
19. Derivative financial instruments (contd.)19. Derivative financial instruments (contd.)
19.3 Foreign currency swaps (contd.)
A brief description of the swaps is given below:
19.3 (a) Swap agreements 1 and 2
Details Description of the hedge
Hedge instrument Swap contract – 1 Counterparty – Central Bank of Sri Lanka
Notional amount – USD 183.425 Mn.
24.5% of the total foreign borrowings.
Swap contract – 2 USD 187.5 Mn. agreement was expired on 9 May 2017
Hedge Item 5 years USD denominated senior note – USD 750 Mn. with interest payable semi-annually.
Capital is repayable in 18 September 2018 in full.
The period when the cash flows are expected to occur Swap contract – 1 Annually
The amount recognised in Other Comprehensive Income during the year
Swap contract – 1 Annually
Swap contract – 1 Rs. 290.074 Mn. credit to the cash flow hedge reserve
Fair value of hedged item as at 31 December 2017 Rs. 114,922.5 Mn.
Fair value of hedged instrument as at 31 December 2017 Swap contract – 1 Rs. 1,360 Mn.
Any forecast transaction for which hedge accounting had previously been used but which is no longer expected to occur
None
The amount that was reclassified from equity to profit or loss during the period
None
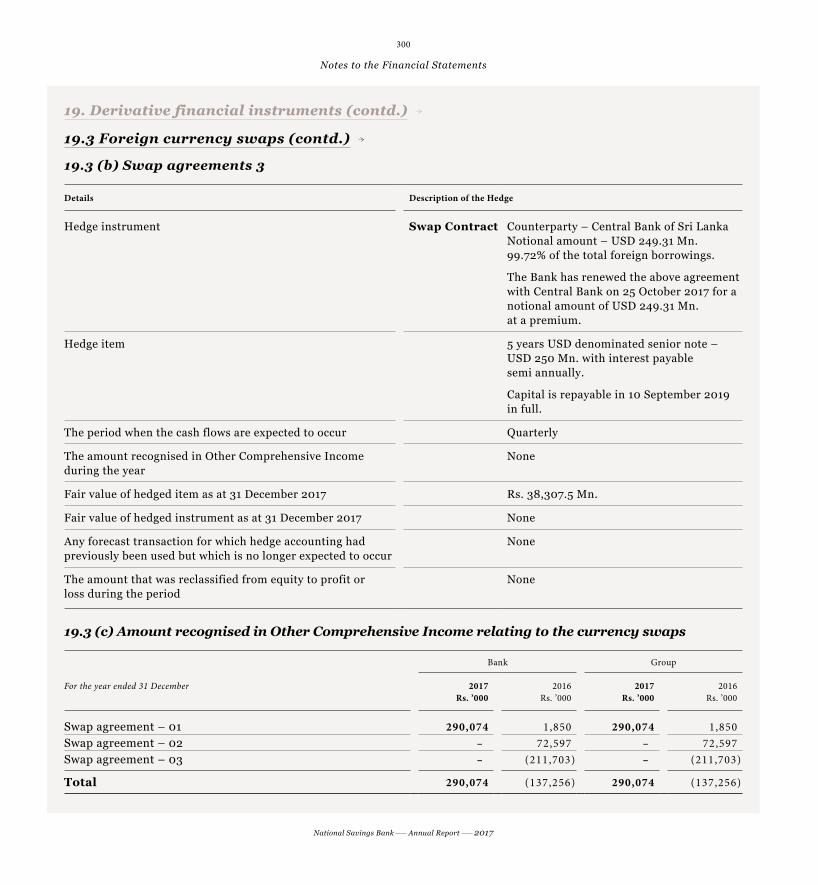
300
National Savings Bank Annual Report 2017
Notes to the Financial Statements
19. Derivative financial instruments (contd.)19. Derivative financial instruments (contd.)
19.3 Foreign currency swaps (contd.)
19.3 (b) Swap agreements 3
Details Description of the Hedge
Hedge instrument Swap Contract Counterparty – Central Bank of Sri Lanka Notional amount – USD 249.31 Mn. 99.72% of the total foreign borrowings.
The Bank has renewed the above agreement with Central Bank on 25 October 2017 for a notional amount of USD 249.31 Mn. at a premium.
Hedge item 5 years USD denominated senior note – USD 250 Mn. with interest payable semi annually.
Capital is repayable in 10 September 2019 in full.
The period when the cash flows are expected to occur Quarterly
The amount recognised in Other Comprehensive Income during the year
None
Fair value of hedged item as at 31 December 2017 Rs. 38,307.5 Mn.
Fair value of hedged instrument as at 31 December 2017 None
Any forecast transaction for which hedge accounting had previously been used but which is no longer expected to occur
None
The amount that was reclassified from equity to profit or loss during the period
None
19.3 (c) Amount recognised in Other Comprehensive Income relating to the currency swaps
Bank Group
For the year ended 31 December 2017Rs. ’000
2016Rs. ’000
2017Rs. ’000
2016Rs. ’000
Swap agreement – 01 290,074 1,850 290,074 1,850Swap agreement – 02 – 72,597 – 72,597Swap agreement – 03 – (211,703) – (211,703)
Total 290,074 (137,256) 290,074 (137,256)

301
National Savings Bank Annual Report 2017
Notes to the Financial Statements
20. Other financial assets held for trading20. Other financial assets held for trading
Accounting policy
Financial assets are classified as held for trading if they are acquired principally for the purpose of selling or repurchasing Financial assets are classified as held for trading if they are acquired principally for the purpose of selling or repurchasing in the near term or holds as a part of a portfolio that is managed together for short-term profit or position taking as per in the near term or holds as a part of a portfolio that is managed together for short-term profit or position taking as per Sri Lanka Accounting Standard – LKAS 39 on “Financial Instruments: Recognition and Measurement”. This category also Sri Lanka Accounting Standard – LKAS 39 on “Financial Instruments: Recognition and Measurement”. This category also includes derivative financial instruments entered into by the Group that are not designated as hedging instruments in includes derivative financial instruments entered into by the Group that are not designated as hedging instruments in hedge relationships.hedge relationships.
Financial assets held for trading are recorded in the Statement of Financial Position at fair value. Changes in fair value are Financial assets held for trading are recorded in the Statement of Financial Position at fair value. Changes in fair value are recognised in “Net trading income”. Dividend income is also recorded in “Net trading income” while interest income and recognised in “Net trading income”. Dividend income is also recorded in “Net trading income” while interest income and expenses are recorded in “Net interest income” according to the terms of the contract, or when the right to the payment has expenses are recorded in “Net interest income” according to the terms of the contract, or when the right to the payment has been established.been established.
The Group evaluates its financial assets held for trading, other than derivatives, to determine whether the intention to sell The Group evaluates its financial assets held for trading, other than derivatives, to determine whether the intention to sell them in the near term is still appropriate. When the Group is unable to trade these financial assets due to inactive markets them in the near term is still appropriate. When the Group is unable to trade these financial assets due to inactive markets and Management’s intention to sell them in the foreseeable future significantly changes, the Group may elect to reclassify and Management’s intention to sell them in the foreseeable future significantly changes, the Group may elect to reclassify these financial assets, in rare circumstances.these financial assets, in rare circumstances.
Financial assets held for trading includes Government Securities held for trading and dealing securities.Financial assets held for trading includes Government Securities held for trading and dealing securities.
Bank Group
As at 31 December 2017Rs. ’000
2016Rs. ’000
2017Rs. ’000
2016Rs. ’000
Held-for-trading Sri Lanka Government Securities Treasury Bills – – 499,798 1,438,757 Treasury Bonds 4,114,978 17,194,677 6,532,816 22,768,539 Equity securities – [Refer Note 20. (a)] 2,357,336 3,095,911 2,357,336 3,095,911
Total 6,472,314 20,290,588 9,389,950 27,303,207

302
National Savings Bank Annual Report 2017
Notes to the Financial Statements
20. Other financial assets held for trading (contd.)20. Other financial assets held for trading (contd.)
20. (a) Equity securities (quoted) – Bank and Group
As at 31 December 2017 2016
Number of shares
CostRs. ’000
Market valueRs. ’000
Number of shares
CostRs. ’000
Market valueRs. ’000
1. Banks, finance and insuranceCommercial Bank of Ceylon PLC 485,180 76,303 65,245 435,587 71,292 62,453Commercial Bank of Ceylon PLC (NV) 268,731 33,862 27,901 240,504 31,644 27,467DFCC Bank 430,000 85,787 52,723 430,000 85,787 52,085Hatton National Bank PLC (NV) 284,964 49,599 54,946 240,468 41,864 45,177Lanka ORIX Leasing Company PLC 28,060 3,171 3,191 606,900 68,594 43,507Lanka ORIX Finance PLC 4,550,000 50,340 17,096 4,550,000 50,340 11,698Sampath Bank PLC (NV) 128,723 31,222 40,106 1,230,988 310,433 318,298Union Bank PLC 245,000 6,009 3,174 245,000 6,009 3,803
336,293 264,382 665,963 564,488
2. Beverage, food and tobaccoCargills (Ceylon) PLC 114,320 21,003 22,608 598,040 109,872 115,312
21,003 22,608 109,872 115,312
3. Chemical and pharmaceuticalsCIC Holdings PLC 135,839 15,558 8,959 135,839 15,558 12,089CIC Holdings PLC (NV) 13,700 1,183 704 13,700 1,183 921Haycarb PLC 447,211 83,786 64,341 447,211 83,786 66,330
100,527 74,004 100,527 79,340
4. Construction and engineeringAccess Engineering PLC 3,470,023 132,692 80,975 3,470,023 132,692 85,093Colombo Dockyard PLC 1,234,706 275,603 107,193 1,234,706 275,603 92,787
408,295 188,168 408,295 177,880

303
National Savings Bank Annual Report 2017
Notes to the Financial Statements
As at 31 December 2017 2016
Number of shares
CostRs. ’000
Market valueRs. ’000
Number of shares
CostRs. ’000
Market valueRs. ’000
5. Diversified holdingsAitken Spence PLC 2,593,516 306,499 138,738 2,593,516 306,499 166,690Browns Capital PLC – – – 2,900,000 13,279 3,441Browns Investments PLC 14,367,669 71,838 36,938 33,606,200 168,031 43,199C T Holdings PLC 74,585 13,073 13,282 750,265 131,498 92,881Hayleys PLC 123,026 41,512 29,196 114,294 39,199 30,514John Keells Holdings PLC 2,660,190 465,818 391,140 2,660,190 465,818 381,407Richard Pieris & Company PLC 6,463,907 60,911 82,450 12,001,659 113,095 96,125Vallibel One PLC 3,143,693 72,975 55,020 3,143,693 72,975 57,507
1,032,626 746,764 1,310,394 871,764
6. Hotels and travelsAsian Hotels & Properties PLC 1,366,132 106,609 71,324 1,366,132 106,609 76,997Aitken Spence Hotel Holdings PLC 2,102,133 188,903 61,110 2,102,133 188,903 90,003Ceylon Hotels Corporation PLC 3,975,017 128,776 62,888 3,793,842 128,776 78,403John Keells Hotels PLC 5,541,205 103,475 48,216 5,541,205 103,475 58,627Lighthouse Hotels PLC 1,175,667 71,492 52,080 1,175,667 71,492 61,729Mahaweli Reach Hotels PLC 133,300 4,884 2,373 133,300 4,884 2,742Marawila Resorts PLC 1,900 16,063 3,569 1,899,556 16,063 4,508The Kingsbury PLC 4,669,876 105,764 62,337 4,669,876 105,765 71,572Jetwing Symphony Limited 1,300,000 19,500 19,500 – – –
745,466 383,397 725,967 444,581
7. Investment trustsRenuka Holdings PLC – – – 5,356,146 235,077 111,749Renuka Holdings PLC (NV) 466,438 11,307 8,302 466,438 11,307 8,210
11,307 8,302 246,384 119,959
8. Land and propertyOverseas Reality (Ceylon) PLC 943,473 23,777 16,419 943,473 23,777 18,658
23,777 16,419 23,777 18,658
20. Other financial assets held for trading (contd.)20. Other financial assets held for trading (contd.)
20. (a) Equity securities (Quoted) – Bank and Group (Contd.)

304
National Savings Bank Annual Report 2017
Notes to the Financial Statements
As at 31 December 2017 2016
Number of shares
CostRs. ’000
Market valueRs. ’000
Number of shares
CostRs. ’000
Market valueRs. ’000
9. ManufacturingTeejay Lanka PLC 40,095 1,480 1,348 – – –Lanka Ceramic PLC 89,191 12,069 13,229 445,955 60,344 54,062Royal Ceramics Lanka PLC 1,748,679 221,888 197,981 1,834,159 232,734 210,380Tokyo Cement Company (Lanka) PLC 688,992 29,029 44,964 574,160 29,030 33,780Tokyo Cement Company (Lanka) PLC (NV) 611,060 22,602 35,649 509,217 22,602 25,931
Alumex PLC 16,150 277 294 46,150 791 913
287,345 293,465 345,501 325,066
10. PlantationNamunukula Plantations PLC – – – 150,000 12,432 10,931
– – 12,432 10,931
11. Power and energyResus Energy PLC 203,341 4,653 3,639 203,341 4,653 4,323
LVL Energy Fund 4,606,600 46,066 46,066 – – –
50,719 49,705 4,653 4,323
12. TelecommunicationDialog Axiata PLC 3,790,960 94,332 49,105 6,790,960 168,982 70,506
94,332 49,105 168,982 70,506
13. TradingBrown & Company PLC 985,000 315,149 77,820 985,000 315,149 81,229
315,149 77,820 315,149 81,229
14. Unit trustComtrust Equity Fund 556,793 10,000 11,139 556,793 10,000 11,147Ceybank Unit Trust 7,604,797 85,110 172,058 7,604,797 85,110 200,729
95,110 183,197 95,110 211,876
Total 3,521,949 2,357,336 4,533,006 3,095,911
20. Other financial assets held for trading (contd.)20. Other financial assets held for trading (contd.)
20. (a) Equity securities (Quoted) – Bank and Group (contd.)

305
National Savings Bank Annual Report 2017
Notes to the Financial Statements
21. Financial assets designated at fair value through profit or loss21. Financial assets designated at fair value through profit or loss
Accounting policy
The Group designates financial assets as fair value through profit or loss when –The Group designates financial assets as fair value through profit or loss when –
zz The designation eliminates or significantly reduces measurement or recognition inconsistency that would otherwise arise The designation eliminates or significantly reduces measurement or recognition inconsistency that would otherwise arise from measuring the assets on a different basis.from measuring the assets on a different basis.
zz The assets are part of a group of financial assets, financial liabilities or both, which are managed and their performance The assets are part of a group of financial assets, financial liabilities or both, which are managed and their performance evaluated on a fair value basis, in accordance with a documented risk management or investment strategy.evaluated on a fair value basis, in accordance with a documented risk management or investment strategy.
zz The asset contains one or more embedded derivatives which significantly modify the cash flows that would otherwise be The asset contains one or more embedded derivatives which significantly modify the cash flows that would otherwise be required by the contract.required by the contract.
Financial assets designated at fair value through profit or loss are recorded in the Statement of Financial Position at fair value. Financial assets designated at fair value through profit or loss are recorded in the Statement of Financial Position at fair value. Changes in fair value are recorded in “Net gain or loss on financial assets and liabilities designated at fair value through profit or Changes in fair value are recorded in “Net gain or loss on financial assets and liabilities designated at fair value through profit or loss”. Interest earned or incurred is accrued in “Interest income” or “Interest expense”, respectively using the effective interest loss”. Interest earned or incurred is accrued in “Interest income” or “Interest expense”, respectively using the effective interest rate (EIR), while dividend income is recorded in “Other operating income” when the right to the payment has been established.rate (EIR), while dividend income is recorded in “Other operating income” when the right to the payment has been established.
The Group has not designated any financial assets upon initial recognition as designated at fair value through profit or loss.The Group has not designated any financial assets upon initial recognition as designated at fair value through profit or loss.
22. Loans and receivables to Banks 22. Loans and receivables to Banks
Accounting policy
Loans and receivables to banks include non-derivative financial assets with fixed or determinable payments that are not Loans and receivables to banks include non-derivative financial assets with fixed or determinable payments that are not quoted in an active market, other than –quoted in an active market, other than –
zz Those that the Group intends to sell immediately or in the near term and those that the Group, upon initial recognition, Those that the Group intends to sell immediately or in the near term and those that the Group, upon initial recognition, designates as at fair value through profit or loss.designates as at fair value through profit or loss.
zz Those that the Group, upon initial recognition, designates as available for sale.Those that the Group, upon initial recognition, designates as available for sale.
zz Those for which the Group may not recover substantially all of its initial investment, other than due to credit deterioration.Those for which the Group may not recover substantially all of its initial investment, other than due to credit deterioration.
“Loans and receivables to banks” include amounts due from banks. After initial measurement, loans and receivables are “Loans and receivables to banks” include amounts due from banks. After initial measurement, loans and receivables are subsequently measured at amortised cost using the EIR, less allowance for impairment. Amortised cost is calculated by subsequently measured at amortised cost using the EIR, less allowance for impairment. Amortised cost is calculated by taking into account any discount or premium on acquisition and fees and costs that are an integral part of the EIR. The taking into account any discount or premium on acquisition and fees and costs that are an integral part of the EIR. The amortisation is included in ‘Interest income’ in the Income Statement. The losses arising from impairment are recognised amortisation is included in ‘Interest income’ in the Income Statement. The losses arising from impairment are recognised in ‘Impairment charge for loans and other losses’ in the Income Statement.in ‘Impairment charge for loans and other losses’ in the Income Statement.
Bank Group
As at 31 December 2017Rs. ’000
2016Rs. ’000
2017Rs. ’000
2016Rs. ’000
Gross loans and receivables 27,714,565 31,834,072 27,971,234 31,834,072(Less): Individual impairment – – – –
Net loans and receivables 27,714,565 31,834,072 27,971,234 31,834,072
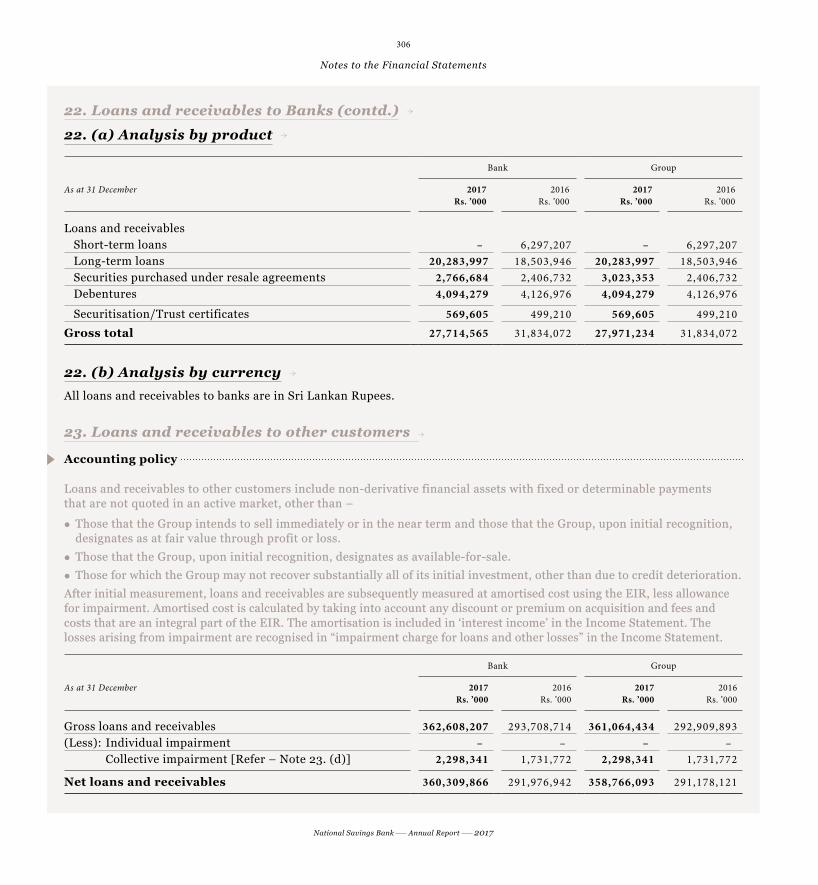
306
National Savings Bank Annual Report 2017
Notes to the Financial Statements
22. Loans and receivables to Banks (contd.)22. Loans and receivables to Banks (contd.)
22. (a) Analysis by product
Bank Group
As at 31 December 2017Rs. ’000
2016Rs. ’000
2017Rs. ’000
2016Rs. ’000
Loans and receivables Short-term loans – 6,297,207 – 6,297,207 Long-term loans 20,283,997 18,503,946 20,283,997 18,503,946 Securities purchased under resale agreements 2,766,684 2,406,732 3,023,353 2,406,732 Debentures 4,094,279 4,126,976 4,094,279 4,126,976
Securitisation/Trust certificates 569,605 499,210 569,605 499,210
Gross total 27,714,565 31,834,072 27,971,234 31,834,072
22. (b) Analysis by currency All loans and receivables to banks are in Sri Lankan Rupees.
23. Loans and receivables to other customers 23. Loans and receivables to other customers
Accounting policy
Loans and receivables to other customers include non-derivative financial assets with fixed or determinable payments Loans and receivables to other customers include non-derivative financial assets with fixed or determinable payments that are not quoted in an active market, other than –that are not quoted in an active market, other than –
zz Those that the Group intends to sell immediately or in the near term and those that the Group, upon initial recognition, Those that the Group intends to sell immediately or in the near term and those that the Group, upon initial recognition, designates as at fair value through profit or loss.designates as at fair value through profit or loss.
zz Those that the Group, upon initial recognition, designates as available-for-sale.Those that the Group, upon initial recognition, designates as available-for-sale.
zz Those for which the Group may not recover substantially all of its initial investment, other than due to credit deterioration.Those for which the Group may not recover substantially all of its initial investment, other than due to credit deterioration.
After initial measurement, loans and receivables are subsequently measured at amortised cost using the EIR, less allowance After initial measurement, loans and receivables are subsequently measured at amortised cost using the EIR, less allowance for impairment. Amortised cost is calculated by taking into account any discount or premium on acquisition and fees and for impairment. Amortised cost is calculated by taking into account any discount or premium on acquisition and fees and costs that are an integral part of the EIR. The amortisation is included in ‘interest income’ in the Income Statement. The costs that are an integral part of the EIR. The amortisation is included in ‘interest income’ in the Income Statement. The losses arising from impairment are recognised in “impairment charge for loans and other losses” in the Income Statement.losses arising from impairment are recognised in “impairment charge for loans and other losses” in the Income Statement.
Bank Group
As at 31 December 2017Rs. ’000
2016Rs. ’000
2017Rs. ’000
2016Rs. ’000
Gross loans and receivables 362,608,207 293,708,714 361,064,434 292,909,893(Less): Individual impairment – – – – Collective impairment [Refer – Note 23. (d)] 2,298,341 1,731,772 2,298,341 1,731,772
Net loans and receivables 360,309,866 291,976,942 358,766,093 291,178,121

307
National Savings Bank Annual Report 2017
Notes to the Financial Statements
23. Loans and receivables to other customers (contd.)23. Loans and receivables to other customers (contd.)
23. (a) Analysis by product
Bank Group
As at 31 December 2017Rs. ’000
2016Rs. ’000
2017Rs. ’000
2016Rs. ’000
Loans and receivables Pawning 23,939,944 20,852,188 23,939,944 20,852,188 Staff loans 5,057,767 4,090,448 5,057,767 4,090,448
Term loans Short term 684,797 – 684,797 – Long term 321,221,287 257,549,045 321,221,287 257,549,045 Securities purchased under resale agreements 2,826,289 2,496,838 1,282,516 1,698,017
Others Securitisation/Trust certificates 3,083,997 2,695,185 3,083,997 2,695,185 Loan to Government 2,075,000 2,075,000 2,075,000 2,075,000 Others 3,719,127 3,950,010 3,719,127 3,950,010
Gross total 362,608,207 293,708,714 361,064,434 292,909,893
23. (b) Analysis by industry
Bank Group
As at 31 December 2017Rs. ’000
2016Rs. ’000
2017Rs. ’000
2016Rs. ’000
Agriculture and fishing 14,282,395 10,869,217 14,282,395 10,869,217Manufacturing 505,113 505,113 505,113 505,113Tourism 49,042 81,090 49,042 81,090Transport 1,042,138 983,022 1,042,138 983,022Construction/housing 67,530,740 65,006,143 67,530,740 65,006,143Traders 1,239,568 1,237,814 1,239,568 1,237,814
Others Financial and business services 10,169,034 6,899,422 10,169,034 6,899,422 Infrastructure 76,080,169 60,412,604 76,080,169 60,412,604 Power and energy 8,525,567 10,254,573 8,525,567 10,254,573 Education 31,844,099 23,701,503 31,844,099 23,701,503 Government 2,075,000 2,075,000 2,075,000 2,075,000 Personal/pawning/others 149,265,341 111,683,213 147,721,568 110,884,392
Gross total 362,608,207 293,708,714 361,064,434 292,909,893

308
National Savings Bank Annual Report 2017
Notes to the Financial Statements
23. Loans and receivables to other customers (contd.)23. Loans and receivables to other customers (contd.)
23. (c) Analysis by currency
Bank Group
As at 31 December 2017Rs. ’000
2016Rs. ’000
2017Rs. ’000
2016Rs. ’000
Sri Lankan Rupees 334,526,456 273,730,701 332,982,683 272,931,880United States Dollars 28,081,751 19,978,013 28,081,751 19,978,013
Gross total 362,608,207 293,708,714 361,064,434 292,909,893
23. (d) Movements in collective impairment charges during the year
Accounting policy
Individual assessment of impairment
For financial assets carried at amortised cost (such as amounts due from banks, loans and receivables to customers as well For financial assets carried at amortised cost (such as amounts due from banks, loans and receivables to customers as well as held-to-maturity investments), the Group first assesses individually whether objective evidence of impairment exists as held-to-maturity investments), the Group first assesses individually whether objective evidence of impairment exists for financial assets that are individually significant, or collectively for financial assets that are not individually significant. for financial assets that are individually significant, or collectively for financial assets that are not individually significant. If the Group determines that no objective evidence of impairment exists for an individually assessed financial asset, If the Group determines that no objective evidence of impairment exists for an individually assessed financial asset, it includes the asset in a group of financial assets with similar credit risk characteristics and collectively assesses them it includes the asset in a group of financial assets with similar credit risk characteristics and collectively assesses them for impairment. for impairment.
Assets that are individually assessed for impairment and for which an impairment loss is or continues to be, recognised Assets that are individually assessed for impairment and for which an impairment loss is or continues to be, recognised are not included in a collective assessment of impairment. are not included in a collective assessment of impairment.
If there is objective evidence that an impairment loss has been incurred, the amount of the loss is measured as the If there is objective evidence that an impairment loss has been incurred, the amount of the loss is measured as the difference between the assets’ carrying amount and the present value of estimated future cash flows (excluding future difference between the assets’ carrying amount and the present value of estimated future cash flows (excluding future expected credit losses that have not yet been incurred). The carrying amount of the asset is reduced through the use expected credit losses that have not yet been incurred). The carrying amount of the asset is reduced through the use of a provision account and the amount of the loss is recognised in the Income Statement. Interest income continues to of a provision account and the amount of the loss is recognised in the Income Statement. Interest income continues to be accrued on the reduced carrying amount at the rate of interest used to discount the future cash flows for the purpose be accrued on the reduced carrying amount at the rate of interest used to discount the future cash flows for the purpose of measuring the impairment loss. The interest income is recorded as part of “Interest and similar income”. of measuring the impairment loss. The interest income is recorded as part of “Interest and similar income”.
The present value of the estimated future cash flows is discounted at the financial asset’s original EIR. If a loan has a The present value of the estimated future cash flows is discounted at the financial asset’s original EIR. If a loan has a variable interest rate, the discount rate for measuring any impairment loss is the current EIR. If the Group has reclassified variable interest rate, the discount rate for measuring any impairment loss is the current EIR. If the Group has reclassified trading assets to loans and receivables, the discount rate for measuring any impairment loss is the new EIR determined at trading assets to loans and receivables, the discount rate for measuring any impairment loss is the new EIR determined at the reclassification date. The calculation of the present value of the estimated future cash flows of a collateralised financial the reclassification date. The calculation of the present value of the estimated future cash flows of a collateralised financial asset reflects the cash flows that may result from foreclosure less costs for obtaining and selling the collateral, whether or asset reflects the cash flows that may result from foreclosure less costs for obtaining and selling the collateral, whether or not foreclosure is probable.not foreclosure is probable.
Loans together with the associated allowance are written off when there is no realistic prospect of future recovery and Loans together with the associated allowance are written off when there is no realistic prospect of future recovery and all collateral has been realised or has been transferred to the Group. If, in a subsequent year, the amount of the estimated all collateral has been realised or has been transferred to the Group. If, in a subsequent year, the amount of the estimated impairment loss increased or decreased because of an event occurring after the impairment was recognised, the previously impairment loss increased or decreased because of an event occurring after the impairment was recognised, the previously recognised impairment loss is increased or reduced by adjusting the allowance account. If a future write-off is later recognised impairment loss is increased or reduced by adjusting the allowance account. If a future write-off is later recovered, the recovery is credited to the “Credit loss expense”.recovered, the recovery is credited to the “Credit loss expense”.

309
National Savings Bank Annual Report 2017
Notes to the Financial Statements
23. Loans and receivables to other customers (contd.)23. Loans and receivables to other customers (contd.)
23. (d) Movements in collective impairment charges during the year (contd.)
Collective assessment of impairment
If the Group determines that no objective evidence of impairment exists for an individually assessed financial asset, If the Group determines that no objective evidence of impairment exists for an individually assessed financial asset, it includes the asset in a group of financial assets with similar credit risk characteristics and collectively assesses them it includes the asset in a group of financial assets with similar credit risk characteristics and collectively assesses them for impairment. for impairment.
For the purpose of a collective evaluation of impairment, financial assets are grouped on the basis of the Group’s internal For the purpose of a collective evaluation of impairment, financial assets are grouped on the basis of the Group’s internal credit grading system that considers credit risk characteristics such as asset type, industry, geographical location, collateral credit grading system that considers credit risk characteristics such as asset type, industry, geographical location, collateral type, past-due status and other relevant factors.type, past-due status and other relevant factors.
Future cash flows on a group of financial assets that are collectively evaluated for impairment are estimated on the basis of Future cash flows on a group of financial assets that are collectively evaluated for impairment are estimated on the basis of historical loss experience for assets with credit risk characteristics similar to those in the Group. Historical loss experience historical loss experience for assets with credit risk characteristics similar to those in the Group. Historical loss experience is adjusted on the basis of current observable date to reflect the effect of current conditions on which the historical loss is adjusted on the basis of current observable date to reflect the effect of current conditions on which the historical loss experience is based and to remove the effect of conditions in the historical period that do not exist currently. Estimates of experience is based and to remove the effect of conditions in the historical period that do not exist currently. Estimates of changes in future cash flows reflect and are directionally consistent with, changes in related observable data from year to changes in future cash flows reflect and are directionally consistent with, changes in related observable data from year to year (such as changes in unemployment rates, property prices, commodity prices, payment status or other factors that are year (such as changes in unemployment rates, property prices, commodity prices, payment status or other factors that are indicative of incurred losses in the Group and their magnitude). The methodology and assumptions used for estimating indicative of incurred losses in the Group and their magnitude). The methodology and assumptions used for estimating future cash flows are reviewed regularly to reduce any differences between loss estimates and actual loss experience.future cash flows are reviewed regularly to reduce any differences between loss estimates and actual loss experience.
Impairment of renegotiated loans
Where possible, the Bank seeks to restructure loans rather than to take possession of collateral. This may involve extending Where possible, the Bank seeks to restructure loans rather than to take possession of collateral. This may involve extending the payment arrangements and the agreement of new loan conditions. Once the terms have been renegotiated any the payment arrangements and the agreement of new loan conditions. Once the terms have been renegotiated any impairment is measured using the original EIR as calculated before the modification of terms and the loan is no longer impairment is measured using the original EIR as calculated before the modification of terms and the loan is no longer considered past due. Management continually reviews renegotiated loans to ensure that all criteria are met and that considered past due. Management continually reviews renegotiated loans to ensure that all criteria are met and that future payments are likely to occur. The loans continue to be subject to an individual or collective impairment assessment, future payments are likely to occur. The loans continue to be subject to an individual or collective impairment assessment, calculated using the loan’s original EIR.calculated using the loan’s original EIR.
Collateral valuation
The Group uses collateral where possible to mitigate the risk on financial assets. The collateral comes in various forms such The Group uses collateral where possible to mitigate the risk on financial assets. The collateral comes in various forms such as cash, gold, Government Securities. To the extent possible, the Bank uses active market data for valuing financial assets as cash, gold, Government Securities. To the extent possible, the Bank uses active market data for valuing financial assets held as collaterals.held as collaterals.
Bank Group
As at 31 December 2017Rs. ’000
2016Rs. ’000
2017Rs. ’000
2016Rs. ’000
Collective impairment Opening balance 1,731,772 3,092,209 1,731,772 3,092,209 Charge to Income Statement (Note 10) 693,233 (99,693) 693,233 (99,693) Net write-off during the year (126,664) (1,260,744) (126,664) (1,260,744)
Closing balance 2,298,341 1,731,772 2,298,341 1,731,772

310
National Savings Bank Annual Report 2017
Notes to the Financial Statements
24. Financial investments – available for sale24. Financial investments – available for sale
Accounting policy
Available-for-sale investments include equity and debt securities. Equity investments classified as available for sale are Available-for-sale investments include equity and debt securities. Equity investments classified as available for sale are those which are neither classified as held for trading nor designated at fair value through profit or loss. Debt Securities those which are neither classified as held for trading nor designated at fair value through profit or loss. Debt Securities in this category are those which are intended to be held for an indefinite period of time and which may be sold in response in this category are those which are intended to be held for an indefinite period of time and which may be sold in response to needs for liquidity or in response to changes in the market conditions.to needs for liquidity or in response to changes in the market conditions.
After initial measurement, available-for-sale financial investments are subsequently measured at fair value. Equity After initial measurement, available-for-sale financial investments are subsequently measured at fair value. Equity investments under AFS that do not have quoted market price and whose fair value cannot be reliably measured shall investments under AFS that do not have quoted market price and whose fair value cannot be reliably measured shall be measured at cost.be measured at cost.
Unrealised gains and losses are recognised directly in equity (other comprehensive income) in the “available-for-sale Unrealised gains and losses are recognised directly in equity (other comprehensive income) in the “available-for-sale reserve”. When the investment is disposed of, the cumulative gain or loss previously recognised in equity is recognised reserve”. When the investment is disposed of, the cumulative gain or loss previously recognised in equity is recognised in the Income Statement in “net gain/(loss) from financial investment”. Where the Group holds more than one investment in the Income Statement in “net gain/(loss) from financial investment”. Where the Group holds more than one investment in the same security they are deemed to be disposed of on a first-in first-out basis. Interest earned whilst holding in the same security they are deemed to be disposed of on a first-in first-out basis. Interest earned whilst holding available-for-sale financial investments is required as interest income using the EIR. Dividends earned whilst holding available-for-sale financial investments is required as interest income using the EIR. Dividends earned whilst holding available-for-sale financial investments are recognised in the Income Statement as “other operating income” when the right available-for-sale financial investments are recognised in the Income Statement as “other operating income” when the right of the payment has been established. The losses arising from impairment of such investments are recognised in the Income of the payment has been established. The losses arising from impairment of such investments are recognised in the Income Statement in “impairment losses on financial investments” and removed from the “available-for-sale reserve”.Statement in “impairment losses on financial investments” and removed from the “available-for-sale reserve”.
Impairment of available-for-sale financial investments
For available-for-sale financial investments including debt securities, the Group assesses at each reporting date whether For available-for-sale financial investments including debt securities, the Group assesses at each reporting date whether there is objective evidence that an investment is impaired.there is objective evidence that an investment is impaired.
In the case of debt instruments classified as available for sale, the Group assesses individually whether there is objective In the case of debt instruments classified as available for sale, the Group assesses individually whether there is objective evidence of impairment based on the same criteria as financial asset carried at amortised cost. However, the amount evidence of impairment based on the same criteria as financial asset carried at amortised cost. However, the amount recorded for impairment is the cumulative loss measured as the difference between the amortised cost and the current recorded for impairment is the cumulative loss measured as the difference between the amortised cost and the current fair value, less any impairment loss on that investment previously recognised in the Income Statement. Future interest fair value, less any impairment loss on that investment previously recognised in the Income Statement. Future interest income is based on the reduced carrying amount and is accrued using the rate of interest used to discount the future cash income is based on the reduced carrying amount and is accrued using the rate of interest used to discount the future cash flows for the purpose of measuring the impairment loss. The interest income is recorded as part of “Interest and similar flows for the purpose of measuring the impairment loss. The interest income is recorded as part of “Interest and similar income”. If, in a subsequent period, the fair value of a debt instrument increased and the increase can be objectively income”. If, in a subsequent period, the fair value of a debt instrument increased and the increase can be objectively related to a credit event occurring after the impairment loss was recognised in the Income Statement, the impairment related to a credit event occurring after the impairment loss was recognised in the Income Statement, the impairment loss is reversed through the Income Statement.loss is reversed through the Income Statement.
In the case of equity investments classified as available for sale, objective evidence would also include a “significant” In the case of equity investments classified as available for sale, objective evidence would also include a “significant” or “prolonged” decline in the fair value of the investment below its cost. The Group treats “significant” generally as 20% or “prolonged” decline in the fair value of the investment below its cost. The Group treats “significant” generally as 20% and “prolonged” generally as greater than six months. Where there is evidence of impairment, the cumulative loss and “prolonged” generally as greater than six months. Where there is evidence of impairment, the cumulative loss measured as the difference between the acquisition cost and the current fair value, less any impairment loss on that measured as the difference between the acquisition cost and the current fair value, less any impairment loss on that investment previously recognised in the other comprehensive income is removed from equity and recognised in the Income investment previously recognised in the other comprehensive income is removed from equity and recognised in the Income Statement. Impairment losses on equity investments are not reversed through the Income Statement; increases Statement. Impairment losses on equity investments are not reversed through the Income Statement; increases in the fair value after impairment are recognised in Other Comprehensive Income. in the fair value after impairment are recognised in Other Comprehensive Income.
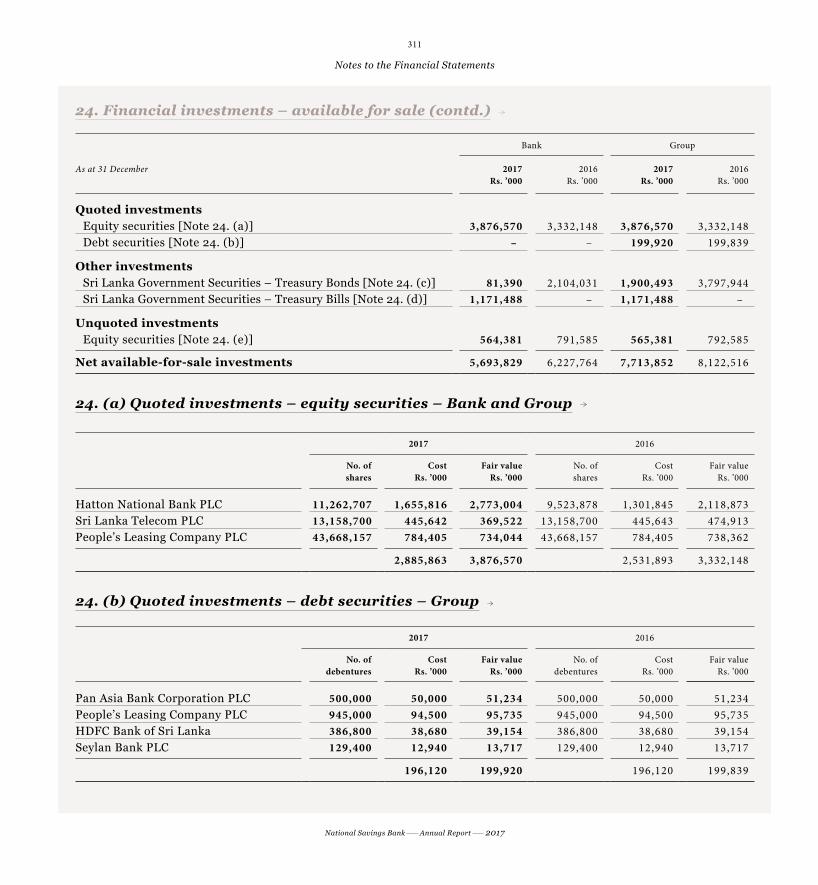
311
National Savings Bank Annual Report 2017
Notes to the Financial Statements
24. Financial investments – available for sale (contd.)24. Financial investments – available for sale (contd.)
Bank Group
As at 31 December 2017Rs. ’000
2016Rs. ’000
2017Rs. ’000
2016Rs. ’000
Quoted investmentsEquity securities [Note 24. (a)] 3,876,570 3,332,148 3,876,570 3,332,148 Debt securities [Note 24. (b)] – – 199,920 199,839
Other investmentsSri Lanka Government Securities – Treasury Bonds [Note 24. (c)] 81,390 2,104,031 1,900,493 3,797,944 Sri Lanka Government Securities – Treasury Bills [Note 24. (d)] 1,171,488 – 1,171,488 –
Unquoted investmentsEquity securities [Note 24. (e)] 564,381 791,585 565,381 792,585
Net available-for-sale investments 5,693,829 6,227,764 7,713,852 8,122,516
24. (a) Quoted investments – equity securities – Bank and Group
2017 2016
No. of shares
CostRs. ’000
Fair valueRs. ’000
No. of shares
CostRs. ’000
Fair valueRs. ’000
Hatton National Bank PLC 11,262,707 1,655,816 2,773,004 9,523,878 1,301,845 2,118,873 Sri Lanka Telecom PLC 13,158,700 445,642 369,522 13,158,700 445,643 474,913 People’s Leasing Company PLC 43,668,157 784,405 734,044 43,668,157 784,405 738,362
2,885,863 3,876,570 2,531,893 3,332,148
24. (b) Quoted investments – debt securities – Group
2017 2016
No. of debentures
CostRs. ’000
Fair valueRs. ’000
No. of debentures
CostRs. ’000
Fair valueRs. ’000
Pan Asia Bank Corporation PLC 500,000 50,000 51,234 500,000 50,000 51,234People’s Leasing Company PLC 945,000 94,500 95,735 945,000 94,500 95,735HDFC Bank of Sri Lanka 386,800 38,680 39,154 386,800 38,680 39,154Seylan Bank PLC 129,400 12,940 13,717 129,400 12,940 13,717
196,120 199,920 196,120 199,839

312
National Savings Bank Annual Report 2017
Notes to the Financial Statements
24. Financial investments – available for sale (contd.)24. Financial investments – available for sale (contd.)
24. (c) Other investments – Treasury Bonds
2017 – Bank 2016 – Bank
Face value
Rs. ’000
Cost of investment
Rs. ’000
Fair value
Rs. ’000
Face value
Rs. ’000
Cost of investment
Rs. ’000
Fair value
Rs. ’000
Sri Lanka Government Securities – Treasury Bonds 76,000 74,709 81,390 2,175,000 2,012,176 2,104,031
74,709 81,390 2,012,176 2,104,031
2017 – Group 2016 – Group
Face value
Rs. ’000
Cost of investment
Rs. ’000
Fair value
Rs. ’000
Face value
Rs. ’000
Cost of investment
Rs. ’000
Fair value
Rs. ’000
Sri Lanka Government Securities – Treasury Bonds 1,751,000 2,037,829 1,900,493 3,850,000 3,975,296 3,797,944
2,037,829 1,900,493 3,975,296 3,797,944
24. (d) Other investments – Treasury Bills
2017 – Bank and Group 2016 – Bank and Group
Face value
Rs. ’000
Cost of investment
Rs. ’000
Fair value
Rs. ’000
Face value
Rs. ’000
Cost of investment
Rs. ’000
Fair value
Rs. ’000
Sri Lanka Government Securities – Treasury Bills 1,200,000 1,164,059 1,171,488 – – –
1,164,059 1,171,488 – –
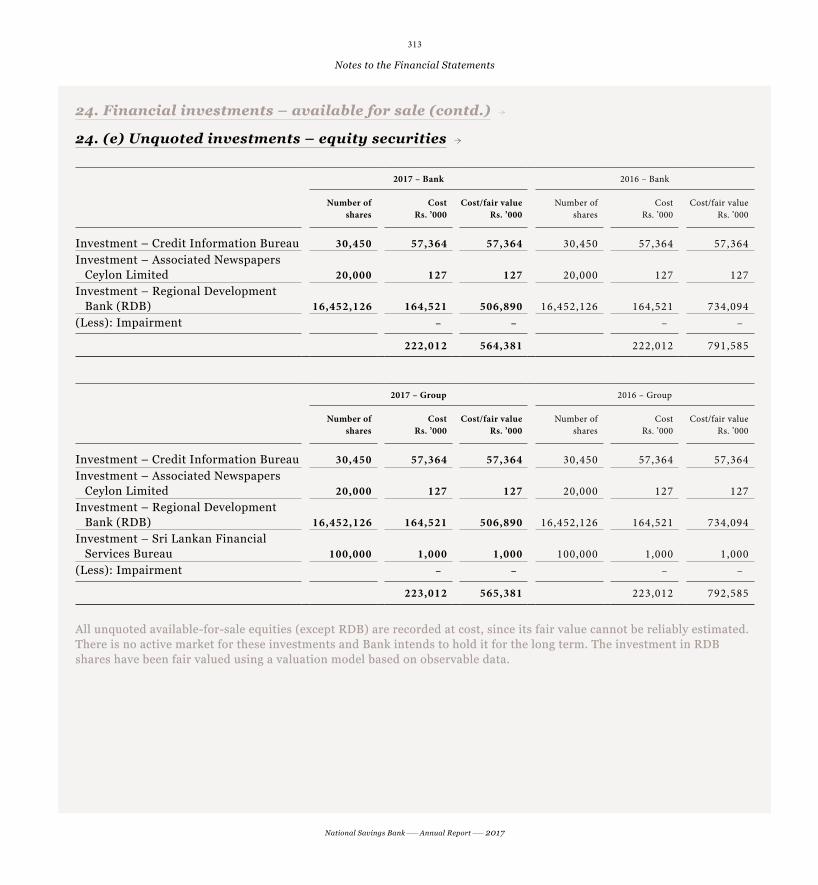
313
National Savings Bank Annual Report 2017
Notes to the Financial Statements
24. Financial investments – available for sale (contd.)24. Financial investments – available for sale (contd.)
24. (e) Unquoted investments – equity securities
2017 – Bank 2016 – Bank
Number of shares
CostRs. ’000
Cost/fair valueRs. ’000
Number of shares
CostRs. ’000
Cost/fair valueRs. ’000
Investment – Credit Information Bureau 30,450 57,364 57,364 30,450 57,364 57,364Investment – Associated Newspapers Ceylon Limited 20,000 127 127 20,000 127 127Investment – Regional Development Bank (RDB) 16,452,126 164,521 506,890 16,452,126 164,521 734,094(Less): Impairment – – – –
222,012 564,381 222,012 791,585
2017 – Group 2016 – Group
Number of shares
CostRs. ’000
Cost/fair valueRs. ’000
Number of shares
CostRs. ’000
Cost/fair valueRs. ’000
Investment – Credit Information Bureau 30,450 57,364 57,364 30,450 57,364 57,364Investment – Associated Newspapers Ceylon Limited 20,000 127 127 20,000 127 127Investment – Regional Development Bank (RDB) 16,452,126 164,521 506,890 16,452,126 164,521 734,094Investment – Sri Lankan Financial Services Bureau 100,000 1,000 1,000 100,000 1,000 1,000(Less): Impairment – – – –
223,012 565,381 223,012 792,585
All unquoted available-for-sale equities (except RDB) are recorded at cost, since its fair value cannot be reliably estimated. All unquoted available-for-sale equities (except RDB) are recorded at cost, since its fair value cannot be reliably estimated. There is no active market for these investments and Bank intends to hold it for the long term. The investment in RDB There is no active market for these investments and Bank intends to hold it for the long term. The investment in RDB shares have been fair valued using a valuation model based on observable data.shares have been fair valued using a valuation model based on observable data.

314
National Savings Bank Annual Report 2017
Notes to the Financial Statements
25. Financial investments – held to maturity25. Financial investments – held to maturity
Accounting policy
Held-to-maturity financial investments are non-derivative financial assets with fixed or determinable payments and fixed Held-to-maturity financial investments are non-derivative financial assets with fixed or determinable payments and fixed maturities, which the Group has the intention and ability to hold to maturity. After initial measurement, held-to-maturity maturities, which the Group has the intention and ability to hold to maturity. After initial measurement, held-to-maturity financial investments are subsequently measured at amortised cost using the EIR, less impairment. Amortised cost is financial investments are subsequently measured at amortised cost using the EIR, less impairment. Amortised cost is calculated by taking into account any discount or premium on acquisition and fees that are an integral part of the EIR. calculated by taking into account any discount or premium on acquisition and fees that are an integral part of the EIR. The amortisation is included in “interest and similar income” in the Income Statement. The losses arising from impairment The amortisation is included in “interest and similar income” in the Income Statement. The losses arising from impairment of such investments are recognised in the Income Statement line “impairment charge for loans and other losses”.of such investments are recognised in the Income Statement line “impairment charge for loans and other losses”.
If the Group were to sell or reclassify more than an insignificant amount of held-to-maturity investments before maturity If the Group were to sell or reclassify more than an insignificant amount of held-to-maturity investments before maturity (other than in certain specific circumstances), the entire category would be tainted and would have to be reclassified as (other than in certain specific circumstances), the entire category would be tainted and would have to be reclassified as available for sale. Furthermore, the Group would be prohibited from classifying any financial asset as held to maturity available for sale. Furthermore, the Group would be prohibited from classifying any financial asset as held to maturity during the following two years:during the following two years:
Bank Group
As at 31 December 2017Rs. ’000
2016Rs. ’000
2017Rs. ’000
2016Rs. ’000
Sri Lanka Government Securities Treasury Bills 35,115,115 17,279,328 35,115,115 17,279,328 Treasury Bonds 450,001,836 430,456,075 453,653,149 432,256,631Sri Lanka Development Bond – USD 59,156,126 58,088,995 59,156,126 58,088,995(Less): Impairment – – – –
Net held-to-maturity investments 544,273,077 505,824,398 547,924,390 507,624,954
The Bank has pledged Treasury Bills and Treasury Bonds held to maturity of Rs. 48,382 Mn. as collateral as at The Bank has pledged Treasury Bills and Treasury Bonds held to maturity of Rs. 48,382 Mn. as collateral as at 31 December 2017 (2016: Rs. 63,413 Mn.) and Rs. 56,229 Mn. for the Group (2016: Rs. 73,809 Mn.).31 December 2017 (2016: Rs. 63,413 Mn.) and Rs. 56,229 Mn. for the Group (2016: Rs. 73,809 Mn.).

315
National Savings Bank Annual Report 2017
Notes to the Financial Statements
26. Investments in subsidiaries26. Investments in subsidiaries
Accounting policy
Investments in subsidiary companies are accounted at cost less allowance for impairment in Financial Statements of Investments in subsidiary companies are accounted at cost less allowance for impairment in Financial Statements of the Bank. The net assets of subsidiary company are reviewed at each reporting date to determine whether there is any the Bank. The net assets of subsidiary company are reviewed at each reporting date to determine whether there is any indication of impairment. If any such indication exists, then the recoverable amount of investment is estimated and the indication of impairment. If any such indication exists, then the recoverable amount of investment is estimated and the impairment loss is recognised to the extent of its loss in net assets. impairment loss is recognised to the extent of its loss in net assets.
As at 31 December 2017 2016 2017 2016
Holding
%
Holding
%
Cost*
Rs. ’000
Directors’ valuation**
Rs. ’000
Cost
Rs. ’000
Directors’ valuation**
Rs. ’000
Unquoted equity shares NSB Fund Management Co. Limited 100 100 900,000 1,944,687 150,000 1,691,209 (90,000,000 ordinary shares of Rs. 10.00 each)(Less): Impairment – – – –
Net total 900,000 1,944,687 150,000 1,691,209
* The subsidiary has issued Rs. 750 Mn. worth of shares as bonus dividend during the year.
** The Director's valuation of investments in subsidiary has been carried out on net asset basis as at 31 December 2017 based on audited Financial Statements.
27. Property, plant and equipment27. Property, plant and equipment
Accounting policy
Basis of recognition
Property, plant and equipment are recognised if it is probable that future benefits associated with the asset will flow to Property, plant and equipment are recognised if it is probable that future benefits associated with the asset will flow to the Group and cost of the asset can be reliably measured. Property, plant and equipment are initially measured at cost the Group and cost of the asset can be reliably measured. Property, plant and equipment are initially measured at cost including costs directly attributable to the acquisition of the asset.including costs directly attributable to the acquisition of the asset.
Basis of measurementAn item of property, plant and equipment that qualifies for recognition as an asset is initially measured at cost. Cost An item of property, plant and equipment that qualifies for recognition as an asset is initially measured at cost. Cost includes expenditure that is directly attributable to the acquisition of the asset and subsequent costs. The self-constructed includes expenditure that is directly attributable to the acquisition of the asset and subsequent costs. The self-constructed assets includes the cost of materials and direct labour, any other costs directly attributable to bring the asset to a working assets includes the cost of materials and direct labour, any other costs directly attributable to bring the asset to a working condition for its intended use and the cost of dismantling and removing the items and restoring the site on which they are condition for its intended use and the cost of dismantling and removing the items and restoring the site on which they are located and capitalised borrowing costs. Purchased software which is integral to the functionality of the related equipment located and capitalised borrowing costs. Purchased software which is integral to the functionality of the related equipment is capitalised as part of computer equipment.is capitalised as part of computer equipment.
When parts of an item of property, plant and equipment have different useful lives, they are accounted for as separate When parts of an item of property, plant and equipment have different useful lives, they are accounted for as separate items (major components) of property, plant and equipment.items (major components) of property, plant and equipment.
316
National Savings Bank Annual Report 2017
Notes to the Financial Statements
27. Property, plant and equipment (contd.)27. Property, plant and equipment (contd.)
Cost modelThe Group applies cost model to property, plant and equipment except for freehold land and buildings and records at The Group applies cost model to property, plant and equipment except for freehold land and buildings and records at cost of purchase or construction together with any incidental expenses thereon less accumulated depreciation and any cost of purchase or construction together with any incidental expenses thereon less accumulated depreciation and any accumulated impairment losses.accumulated impairment losses.
Revaluation modelThe Group applies the revaluation model to the entire class of freehold land and buildings. Such properties are carried The Group applies the revaluation model to the entire class of freehold land and buildings. Such properties are carried at a revalued amount, being their fair value at the date of revaluation less any subsequent accumulated depreciation and at a revalued amount, being their fair value at the date of revaluation less any subsequent accumulated depreciation and subsequent accumulated impairment losses. Freehold land and buildings of the Group are revalued every three years subsequent accumulated impairment losses. Freehold land and buildings of the Group are revalued every three years or more frequently, if the fair values are substantially different from their carrying amounts to ensure that the carrying or more frequently, if the fair values are substantially different from their carrying amounts to ensure that the carrying amounts do not differ materially from the fair values at the reporting date.amounts do not differ materially from the fair values at the reporting date.
On revaluation of an asset, any increase in the carrying amount is recognised in Other Comprehensive Income and On revaluation of an asset, any increase in the carrying amount is recognised in Other Comprehensive Income and accumulated in equity, under capital reserve or used to reverse a previous revaluation decrease relating to the same asset, accumulated in equity, under capital reserve or used to reverse a previous revaluation decrease relating to the same asset, which was charged to Income Statement. In this circumstance, the increase is recognised as income to the extent of the which was charged to Income Statement. In this circumstance, the increase is recognised as income to the extent of the previous write down. Any decrease in the carrying amount is recognised as an expense in the Income Statement or debited previous write down. Any decrease in the carrying amount is recognised as an expense in the Income Statement or debited in the Other Comprehensive Income to the extent of any credit balance existing in the capital reserve in respect of that in the Other Comprehensive Income to the extent of any credit balance existing in the capital reserve in respect of that asset. The decrease recognised in other comprehensive income reduces the amount accumulated in equity under capital asset. The decrease recognised in other comprehensive income reduces the amount accumulated in equity under capital reserves. Any balance remaining in the revaluation reserve in respect of an asset is transferred directly to retained earnings reserves. Any balance remaining in the revaluation reserve in respect of an asset is transferred directly to retained earnings on retirement or disposal of the asset.on retirement or disposal of the asset.
DerecognitionProperty, plant and equipment are derecognised on disposal or when no future economic benefits are expected from its Property, plant and equipment are derecognised on disposal or when no future economic benefits are expected from its use. Any gain or loss arising on derecognition of the asset (calculated as the difference between the net disposal proceeds use. Any gain or loss arising on derecognition of the asset (calculated as the difference between the net disposal proceeds and the carrying amount of the asset) is recognised in “other operating income” in the Income Statement in the year the and the carrying amount of the asset) is recognised in “other operating income” in the Income Statement in the year the asset is derecognised.asset is derecognised.
Capital work-in-progressThese are expenses of capital nature directly incurred in the construction of buildings, major plant and machinery and These are expenses of capital nature directly incurred in the construction of buildings, major plant and machinery and system development, awaiting capitalisation. These are stated in the Statement of Financial Position at cost less any system development, awaiting capitalisation. These are stated in the Statement of Financial Position at cost less any accumulated impairment losses. Capital work-in-progress is transferred to the relevant asset when it is in the location and accumulated impairment losses. Capital work-in-progress is transferred to the relevant asset when it is in the location and condition necessary for it to be capable of operating in the manner intended by Management.condition necessary for it to be capable of operating in the manner intended by Management.
Borrowing CostsThere were no capitalised borrowing costs related to the acquisition of property, plant and equipment by the Bank.There were no capitalised borrowing costs related to the acquisition of property, plant and equipment by the Bank.

317
National Savings Bank Annual Report 2017
Notes to the Financial Statements
27. Property, plant and equipment (contd.)27. Property, plant and equipment (contd.)
DepreciationDepreciation is recognised in profit or loss on the straight-line method to write down the cost of property and equipment to Depreciation is recognised in profit or loss on the straight-line method to write down the cost of property and equipment to their residual values over their estimated useful lives. Land is not depreciated. Depreciation rates for the identified classes their residual values over their estimated useful lives. Land is not depreciated. Depreciation rates for the identified classes of assets are as follows:of assets are as follows:
Improvement to rent/leasehold buildingEffective from 1 January 2017 the Bank has decided to capitalise the improvement to rent/leasehold building. Effective from 1 January 2017 the Bank has decided to capitalise the improvement to rent/leasehold building. The improvement will be amortised over the lease period effective from same date.The improvement will be amortised over the lease period effective from same date.
Category of asset Depreciation rate per annum (%)
Leasehold properties, improvement to rent/leasehold over the period of lease
Freehold buildings 2.5% p.a.
Office and sundry equipment 10% p.a.
Motor vehicles 20% p.a.
Computer hardware and software 20% p.a.
Furniture and fittings 10% p.a.
Effective from 1 January 2017 the rate of depreciation on computer hardware and software has been revised from Effective from 1 January 2017 the rate of depreciation on computer hardware and software has been revised from 25% – 20% considering the useful life of the item. 25% – 20% considering the useful life of the item.
The Group provides depreciation of an assets commence from the date when they are available for use to the date of The Group provides depreciation of an assets commence from the date when they are available for use to the date of disposal of the asset.disposal of the asset.
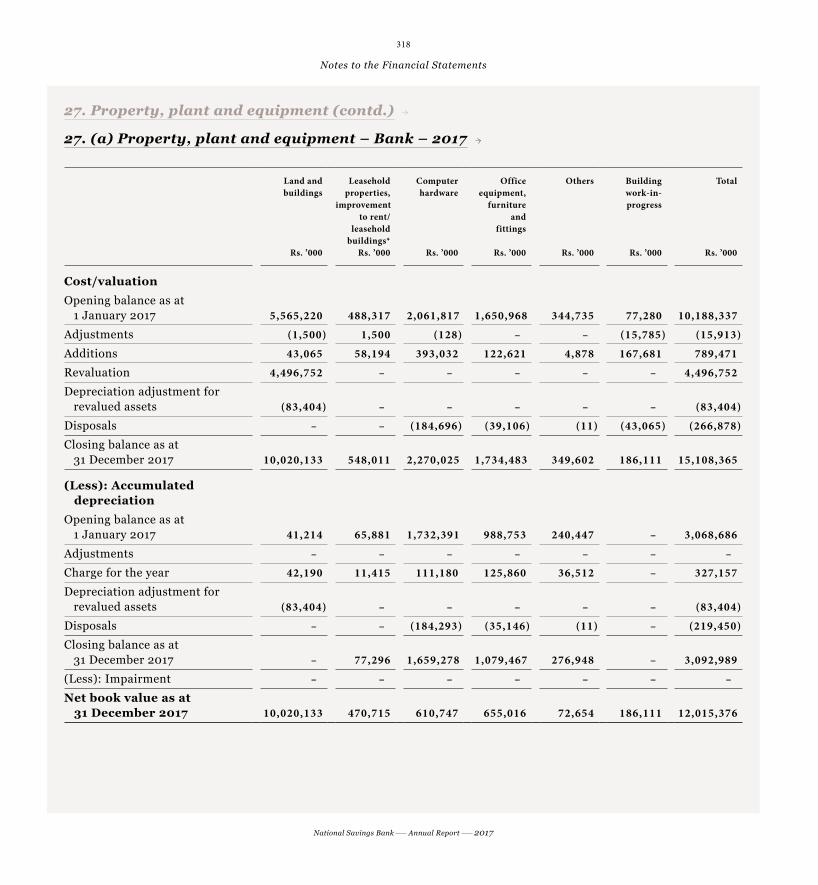
318
National Savings Bank Annual Report 2017
Notes to the Financial Statements
27. Property, plant and equipment (contd.)27. Property, plant and equipment (contd.)
27. (a) Property, plant and equipment – Bank – 2017
Land and buildings
Rs. ’000
Leasehold properties,
improvement to rent/
leasehold buildings*
Rs. ’000
Computer hardware
Rs. ’000
Office equipment,
furniture and
fittings
Rs. ’000
Others
Rs. ’000
Building work-in- progress
Rs. ’000
Total
Rs. ’000
Cost/valuation
Opening balance as at 1 January 2017 5,565,220 488,317 2,061,817 1,650,968 344,735 77,280 10,188,337
Adjustments (1,500) 1,500 (128) – – (15,785) (15,913)
Additions 43,065 58,194 393,032 122,621 4,878 167,681 789,471
Revaluation 4,496,752 – – – – – 4,496,752
Depreciation adjustment for revalued assets (83,404) – – – – – (83,404)
Disposals – – (184,696) (39,106) (11) (43,065) (266,878)
Closing balance as at 31 December 2017 10,020,133 548,011 2,270,025 1,734,483 349,602 186,111 15,108,365
(Less): Accumulated depreciation
Opening balance as at 1 January 2017 41,214 65,881 1,732,391 988,753 240,447 – 3,068,686
Adjustments – – – – – – –
Charge for the year 42,190 11,415 111,180 125,860 36,512 – 327,157
Depreciation adjustment for revalued assets (83,404) – – – – – (83,404)
Disposals – – (184,293) (35,146) (11) – (219,450)
Closing balance as at 31 December 2017 – 77,296 1,659,278 1,079,467 276,948 – 3,092,989
(Less): Impairment – – – – – – –
Net book value as at 31 December 2017 10,020,133 470,715 610,747 655,016 72,654 186,111 12,015,376

319
National Savings Bank Annual Report 2017
Notes to the Financial Statements
27. Property, plant and equipment (contd.)27. Property, plant and equipment (contd.)
27. (a) Property, plant and equipment – Bank – 2016
Land and buildings
Rs. ’000
Leasehold properties,
improvement to rent/
leasehold buildings*
Rs. ’000
Computer hardware
Rs. ’000
Office equipment,
furniture and fittings
Rs. ’000
Others
Rs. ’000
Building work-in- progress
Rs. ’000
Total
Rs. ’000
Cost/valuationOpening balance as at 1 January 2016 5,498,292 474,060 1,877,980 1,512,787 290,826 134,375 9,788,320Adjustments (35,475) – (16,661) – – (46,268) (98,404)Additions 102,403 14,257 208,230 180,577 53,914 56,101 615,482Revaluation – – – – – – –Disposals – – (7,732) (42,396) (5) (66,928) (117,061)
Closing balance as at 31 December 2016 5,565,220 488,317 2,061,817 1,650,968 344,735 77,280 10,188,337
(Less): Accumulated depreciationOpening balance as at 1 January 2016 – 58,683 1,639,704 915,173 207,690 – 2,821,250Adjustments – – (3,371) – – – (3,371)Charge for the year 41,214 7,198 103,790 115,289 32,762 – 300,253Disposals – – (7,732) (41,709) (5) – (49,446)Closing balance as at 31 December 2016 41,214 65,881 1,732,391 988,753 240,447 – 3,068,686(Less): Impairment – – – – – – –Net book value as at 31 December 2016 5,524,006 422,436 329,426 662,215 104,288 77,280 7,119,651
* Leasehold properties, improvement to rent/leasehold buildings include working progress of improvement to rent/leasehold building amounting 5.3 Mn. as at 31 December 2017.

320
National Savings Bank Annual Report 2017
Notes to the Financial Statements
27. Property, plant and equipment (contd.)27. Property, plant and equipment (contd.)
27. (b) Property, plant and equipment – Group – 2017
Land and buildings
Rs. ’000
Leasehold properties,
improvement to rent/
leasehold buildings*
Rs. ’000
Computer hardware
Rs. ’000
Office equipment,
furniture and
fittings
Rs. ’000
Others
Rs. ’000
Building work-in- progress
Rs. ’000
Total
Rs. ’000
Cost/valuation
Opening balance as at 1 January 2017 5,565,220 488,317 2,065,843 1,652,758 344,734 77,444 10,194,317
Adjustments (1,500) 1,500 (128) – – (15,949) (16,077)
Additions 43,065 58,194 394,787 122,914 4,878 167,681 791,519
Revaluation 4,496,752 – – – – – 4,496,752
Depreciation adjustment for revalued assets (83,404) – – – – – (83,404)
Disposals – – (184,937) (39,154) (11) (43,065) (267,167)
Closing balance as at 31 December 2017 10,020,133 548,011 2,275,565 1,736,518 349,601 186,111 15,115,940
(Less): Accumulated depreciation
Opening balance as at 1 January 2017 41,214 65,881 1,735,142 989,810 240,447 – 3,072,494
Adjustments – – – – – – –
Charge for the year 42,190 11,415 111,776 126,015 36,512 – 327,908
Depreciation adjustment for revalued assets (83,404) – – – – – (83,404)
Disposals – – (184,534) (35,192) (11) – (219,737)
Closing balance as at 31 December 2017 – 77,296 1,662,384 1,080,633 276,948 – 3,097,261
(Less): Impairment – – – – – – –
Net book value as at 31 December 2017 10,020,133 470,715 613,181 655,886 72,653 186,111 12,018,679

321
National Savings Bank Annual Report 2017
Notes to the Financial Statements
27. Property, plant and equipment (contd.)27. Property, plant and equipment (contd.)
27. (b) Property, plant and equipment – Group – 2016
Land and buildings
Rs. ’000
Leasehold properties,
improvement to rent/
leasehold buildings*
Rs. ’000
Computer hardware
Rs. ’000
Office equipment,
furniture and fittings
Rs. ’000
Others
Rs. ’000
Building work-in- progress
Rs. ’000
Total
Rs. ’000
Cost/valuationOpening balance as at 1 January 2016 5,498,292 474,060 1,883,308 1,514,177 290,825 134,375 9,795,038Adjustments (35,475) – (16,661) – – (46,268) (98,404)Additions 102,403 14,257 208,230 180,995 53,914 56,265 616,064Revaluation – – – – – – –Disposals – – (9,034) (42,414) (5) (66,928) (118,381)
Closing balance as at 31 December 2016 5,565,220 488,317 2,065,843 1,652,758 344,734 77,444 10,194,317
(Less): Accumulated depreciationOpening balance as at 1 January 2016 – 58,683 1,643,238 916,135 207,690 – 2,825,746Adjustments – – (3,371) – – – (3,371)Charge for the year 41,214 7,198 104,309 115,400 32,762 – 300,883Disposals – – (9,034) (41,725) (5) – (50,764)Closing balance as at 31 December 2016 41,214 65,881 1,735,142 989,810 240,447 – 3,072,494(Less): Impairment – – – – – – –Net book value as at 31 December 2016 5,524,006 422,436 330,701 662,948 104,287 77,444 7,121,823
* Leasehold properties, improvement to rent/leasehold buildings include working progress of improvement to rent/leasehold building amounting 5.3 Mn. as at 31 December 2017.
27. (c) Revaluation
The Bank has revalued its land and buildings, by professionally qualified independent valuers. The revaluation was carried out by taking into account the observable prices in active market or recent market transactions on arm’s length basis. Accordingly a revaluation surplus, amounting to Rs. 4,508.48 Mn. had been credited to the revaluation reserve account in 2017 and Rs. 11.73 Mn. had been adjusted to the same in relation to the prior year.

322
National Savings Bank Annual Report 2017
Notes to the Financial Statements
27. Property, plant and equipment (contd.)27. Property, plant and equipment (contd.)
27. (d) Land and buildings of the Bank
Land and building balance include freehold land value of Rs. 7,996.2 Mn.Land and building balance include freehold land value of Rs. 7,996.2 Mn.
27. (e) Property, plant and equipment pledged as security for liabilities
There were no items of property, plant and equipment pledged as securities for liabilities.There were no items of property, plant and equipment pledged as securities for liabilities.
27. (f) Fully-depreciated property, plant and equipment
The initial cost of fully-depreciated property, plant and equipment, which are still in use as at reporting date is as follows:The initial cost of fully-depreciated property, plant and equipment, which are still in use as at reporting date is as follows:
Group
As at 31 December 2017Rs. ’000
2016Rs. ’000
Computer hardware 1,370,615 1,525,529 Office equipment, furniture and fittings 271,677 270,382 Intangible assets 433,977 401,879 Others – sundry equipments 27,840 160,881
28. Intangible assets28. Intangible assets
Accounting policy
The Group’s intangible assets consist of the value of purchased computer software.The Group’s intangible assets consist of the value of purchased computer software.
Basis of recognition
An intangible asset is recognised only when its cost can be measured reliably and it is probable that the expected future An intangible asset is recognised only when its cost can be measured reliably and it is probable that the expected future economic benefits that are attributable to it will flow to the Group.economic benefits that are attributable to it will flow to the Group.
Basis of measurement
Intangible assets acquired separately are measured on initial recognition at cost. The cost of intangible assets acquired Intangible assets acquired separately are measured on initial recognition at cost. The cost of intangible assets acquired in a business combination is their fair value as at the date of acquisition. Following initial recognition, intangible assets in a business combination is their fair value as at the date of acquisition. Following initial recognition, intangible assets are carried at cost less any accumulated amortisation and any accumulated impairment losses.are carried at cost less any accumulated amortisation and any accumulated impairment losses.

323
National Savings Bank Annual Report 2017
Notes to the Financial Statements
28. Intangible assets (contd.)28. Intangible assets (contd.)
Useful economic life and amortisation
The useful lives of intangible assets are assessed to be either finite or indefinite. Intangible assets with finite lives are The useful lives of intangible assets are assessed to be either finite or indefinite. Intangible assets with finite lives are amortised over the useful economic life. The amortisation period and the amortisation method for an intangible asset amortised over the useful economic life. The amortisation period and the amortisation method for an intangible asset with a finite useful life are reviewed at least at each financial year end. Changes in the expected useful life or the expected with a finite useful life are reviewed at least at each financial year end. Changes in the expected useful life or the expected pattern of consumption of future economic benefits embodied in the asset are accounted for by changing the amortisation pattern of consumption of future economic benefits embodied in the asset are accounted for by changing the amortisation period or method, as appropriate, and they are treated as changes in accounting estimates. The amortisation expense period or method, as appropriate, and they are treated as changes in accounting estimates. The amortisation expense on intangible assets with finite lives is recognised in the Income Statement in the expense category consistent with the on intangible assets with finite lives is recognised in the Income Statement in the expense category consistent with the function of the intangible asset. function of the intangible asset.
Derecognition Intangible assets are derecognised on disposal or when no future economic benefits are expected from its use. Any gain Intangible assets are derecognised on disposal or when no future economic benefits are expected from its use. Any gain or loss arising on derecognition of the asset (calculated as the difference between the net disposal proceeds and the or loss arising on derecognition of the asset (calculated as the difference between the net disposal proceeds and the carrying amount of the asset) is recognised in ‘Other operating income’ in the Income Statement in the year the asset carrying amount of the asset) is recognised in ‘Other operating income’ in the Income Statement in the year the asset is derecognised. is derecognised.
The Group does not possess intangible assets with indefinite useful economic life. The estimated economic life of the The Group does not possess intangible assets with indefinite useful economic life. The estimated economic life of the Group’s computer software is four years (25% per annum).Group’s computer software is four years (25% per annum).
Bank Group
As at 31 December 2017Rs. ’000
2016Rs. ’000
2017Rs. ’000
2016Rs. ’000
CostOpening balance 639,336 504,410 641,306 506,380Additions 319,428 134,926 319,828 134,926Disposals – – – –
Closing balance 958,764 639,336 961,134 641,306
(Less): Accumulated amortisationOpening balance 482,065 446,553 484,035 448,523Charge for the year 96,391 35,512 96,444 35,512Disposals – – – –
Closing balance 578,456 482,065 580,479 484,035
Net book value 380,308 157,271 380,655 157,271

324
National Savings Bank Annual Report 2017
Notes to the Financial Statements
29. Deferred tax assets/liabilities29. Deferred tax assets/liabilities
Accounting policy
Detailed discussion on deferred tax is given in Note 13 on page 289.Detailed discussion on deferred tax is given in Note 13 on page 289.
Bank Group
As at 31 December 2017Rs. ’000
2016Rs. ’000
2017Rs. ’000
2016Rs. ’000
29. (a) Deferred tax assets
Deferred tax assets – – 588 228Income Statement – – (588) 360
Deferred tax assets – – – 588
29. (b) Deferred tax liabilities
Deferred tax liabilities 416,180 504,423 415,592 504,423Income Statement 90,883 (88,243) 91,546 (88,243)
Net deferred tax liabilities 507,063 416,180 507,138 416,180
30. Other assets30. Other assets
Bank Group
As at 31 December 2017Rs. ’000
2016Rs. ’000
2017Rs. ’000
2016Rs. ’000
Notional Tax/WHT receivable [refer Note 4. (e)] 7,184,079 5,813,616 7,212,333 5,833,897Receivables 2,195,402 3,601,388 2,448,403 3,710,443Receivable from treasury on interest (senior citizen) 8,150,352 4,332,737 8,150,352 4,332,737Deposits and prepayments 363,458 199,139 363,458 199,139Advance payment to Treasury [refer Note (a)] 4,480,000 4,800,000 4,480,000 4,800,000Advance payment made to pension II [refer Note 34. (a) 2] 46,384 80,656 46,384 80,656Sundry debtors 27,436 35,022 27,436 35,022Prepaid employee compensation 3,115,069 2,362,379 3,115,069 2,362,379Other assets 133,509 536,502 133,509 536,502
Total 25,695,689 21,761,440 25,976,944 21,890,777

325
National Savings Bank Annual Report 2017
Notes to the Financial Statements
30. Other assets (contd.)30. Other assets (contd.)
Note (a)At the request of Treasury, the Bank paid an advance of Rs. 6,000 Mn. in 2012 and Rs. 2,000 Mn. in 2013 as confirmed by At the request of Treasury, the Bank paid an advance of Rs. 6,000 Mn. in 2012 and Rs. 2,000 Mn. in 2013 as confirmed by the Treasury to be set off against the profit within a period of six years starting from 2014. Effective from 1 January 2016, the Treasury to be set off against the profit within a period of six years starting from 2014. Effective from 1 January 2016, Treasury has agreed to set off the balance amount of Rs. 5,333 Mn. against the profit within a period of 10 years. There after Treasury has agreed to set off the balance amount of Rs. 5,333 Mn. against the profit within a period of 10 years. There after Treasury has agreed to set off the balance amount of Rs. 4,800 Mn. against the profit within a period of 15 years effective Treasury has agreed to set off the balance amount of Rs. 4,800 Mn. against the profit within a period of 15 years effective from 1 January 2017.from 1 January 2017.
31. Due to banks31. Due to banks
Accounting policy
Due to banks represents overdrafts, call money borrowings and Repos by the subsidiary. Subsequent to initial recognition Due to banks represents overdrafts, call money borrowings and Repos by the subsidiary. Subsequent to initial recognition deposits are measured at their amortised cost using EIR method. Interest paid/payable on these dues are recognised in the deposits are measured at their amortised cost using EIR method. Interest paid/payable on these dues are recognised in the Income Statement under interest expense.Income Statement under interest expense.
Bank Group
As at 31 December 2017Rs. ’000
2016Rs. ’000
2017Rs. ’000
2016Rs. ’000
Securities sold under repurchase (Repo) agreements – – 647,994 2,743,282Other facilities 180,439 115,391 180,439 115,391
Total 180,439 115,391 828,433 2,858,673
32. Due to other customers32. Due to other customers
Accounting policy
Due to other customers include savings deposits and term deposits. Subsequent to initial recognition deposits are Due to other customers include savings deposits and term deposits. Subsequent to initial recognition deposits are measured at their amortised cost using EIR method. Interest paid/payable on deposits are recognised in the Income measured at their amortised cost using EIR method. Interest paid/payable on deposits are recognised in the Income Statement under interest expense.Statement under interest expense.
Bank Group
As at 31 December 2017Rs. ’000
2016Rs. ’000
2017Rs. ’000
2016Rs. ’000
Amount due to other customers 737,212,640 657,280,315 737,212,640 657,280,315
Total 737,212,640 657,280,315 737,212,640 657,280,315

326
National Savings Bank Annual Report 2017
Notes to the Financial Statements
32. Due to other customers (contd.)32. Due to other customers (contd.)
32. (a) Analysis by product
Bank Group
As at 31 December 2017Rs. ’000
2016Rs. ’000
2017Rs. ’000
2016Rs. ’000
Savings deposits 188,191,882 176,347,004 188,191,882 176,347,004Fixed deposits 549,020,758 480,933,311 549,020,758 480,933,311
Total 737,212,640 657,280,315 737,212,640 657,280,315
32. (b) Analysis by currency
Bank Group
As at 31 December 2017Rs. ’000
2016Rs. ’000
2017Rs. ’000
2016Rs. ’000
Sri Lankan Rupee 727,849,199 648,802,789 727,849,199 648,802,789United States Dollar 5,924,264 5,330,985 5,924,264 5,330,985Euro 1,211,334 1,245,906 1,211,334 1,245,906Great Britain Pound 1,207,599 1,076,387 1,207,599 1,076,387Australian Dollar 1,020,083 824,248 1,020,083 824,248Japanese Yen 161 – 161 –
Total 737,212,640 657,280,315 737,212,640 657,280,315

327
National Savings Bank Annual Report 2017
Notes to the Financial Statements
33. Other borrowings33. Other borrowings
Accounting policy
33.1 Securities sold under repurchase agreements
Securities sold under agreements to repurchase at a specified future date are not derecognised from the Statement of Securities sold under agreements to repurchase at a specified future date are not derecognised from the Statement of Financial Position as the Group retains substantially all the risks and rewards of ownership. The corresponding cash Financial Position as the Group retains substantially all the risks and rewards of ownership. The corresponding cash received is recognised in the Consolidated Statement of Financial Position as financial liability reflecting as a loan received received is recognised in the Consolidated Statement of Financial Position as financial liability reflecting as a loan received by the Group, including accrued interest as a liability within “Securities sold under repurchase agreements”, reflecting the by the Group, including accrued interest as a liability within “Securities sold under repurchase agreements”, reflecting the transaction’s economic substance. The difference between the sale and repurchase prices is treated as interest expenses transaction’s economic substance. The difference between the sale and repurchase prices is treated as interest expenses and is accrued over the life of agreement using the EIR.and is accrued over the life of agreement using the EIR.
33.2 Senior notes issued
These represent the funds borrowed by the Bank for long-term funding requirement. It consists of borrowings through These represent the funds borrowed by the Bank for long-term funding requirement. It consists of borrowings through international bonds (USD denominated). Subsequent to initial recognition debt securities issued are measured at their international bonds (USD denominated). Subsequent to initial recognition debt securities issued are measured at their amortised cost using EIR method. Interest paid/payable is recognised in profit or loss.amortised cost using EIR method. Interest paid/payable is recognised in profit or loss.
Foreign currency denominated debt securities as at the reporting date are translated to the functional currency at the Foreign currency denominated debt securities as at the reporting date are translated to the functional currency at the middle exchange rate of the functional currency at that date. Foreign currency differences arising on retranslation at the middle exchange rate of the functional currency at that date. Foreign currency differences arising on retranslation at the reporting date are recognised in profit or loss.reporting date are recognised in profit or loss.
Bank Group
As at 31 December 2017Rs. ’000
2016Rs. ’000
2017Rs. ’000
2016Rs. ’000
Securities sold under repurchase (Repo) agreements 61,253,161 54,111,728 66,069,353 59,701,246 Senior note issued [Note 33. (a)] 156,702,616 152,928,181 156,702,616 152,928,181
Total 217,955,777 207,039,909 222,771,969 212,629,427
33. (a) Senior note issued
Senior note issued Interest payable frequency
Issued date Maturity date Coupon rate%
2017Rs. ’000
2016Rs. ’000
750 Million US Dollar senior note Semi-annually 18.09.2013 18.09.2018 8.875 117,831,970 114,980,416 250 Million US Dollar senior note Semi-annually 10.09.2014 10.09.2019 5.150 38,870,646 37,947,765
156,702,616 152,928,181

328
National Savings Bank Annual Report 2017
Notes to the Financial Statements
34. Other liabilities34. Other liabilities
Accounting policy
Other liabilities include provisions made in account of interests, fees and expenses, pensions, leave encashment and other Other liabilities include provisions made in account of interests, fees and expenses, pensions, leave encashment and other expenses. These liabilities are recorded at amounts expected to be payable at reporting date.expenses. These liabilities are recorded at amounts expected to be payable at reporting date.
Bank Group
As at 31 December 2017Rs. ’000
2016Rs. ’000
2017Rs. ’000
2016Rs. ’000
Sundry creditors 119,903 91,375 124,903 92,487 Interest payable – 88,054 – 88,054 Provision for pension scheme I [Note 34. (a) 1] 2,750,601 1,252,553 2,750,601 1,252,553 Provision for medical assistance scheme [Note 34. (a) 3] 960,830 644,377 960,830 644,377 Provision for gratuity [Note 34. (a) 4] – – 1,234 1,260 Unamortised day one difference currency swaps (refer Note 19.2) 1,099,322 2,448,670 1,099,322 2,448,670 Other payables 4,131,769 4,075,027 4,170,571 4,081,104
Total 9,062,425 8,600,056 9,107,460 8,608,506
34. (a) Defined benefit plans
The Bank has two separate pension schemes established, Pension Scheme I for permanent employees joined before 1 October 1995 and Pension Scheme II for permanent employees joined on or after 1 October 1995 and a Medical Assistance Scheme for retired employees.
The assets of these schemes are held independently of the Bank’s assets and administered by Boards of Trustees/Managers, representing the management and the employees, as provided in the trust deed/rules of the respective funds.
All the funds are subject to annual audits independent to the audit of the Bank, by a firm of Chartered Accountants appointed by the members and actuarial valuations are carried out at least once in every two years, as per the rules governing these funds.
34. (a) 1. National Savings Bank Employees’ Pension Scheme I
Pension Scheme I
An actuarial valuation was carried out by Mr Piyal S Goonetilleke, fellow of Society of Actuaries (USA) of Piyal S Goonetilleke & Associates, on 31 December 2017.
Projected Unit Credit Method was used to allocate the actuarial present value of the projected benefits earned by employees to date of 31 December 2017.

329
National Savings Bank Annual Report 2017
Notes to the Financial Statements
34. Other liabilities (contd.)34. Other liabilities (contd.)
34. (a) Defined benefit plans (contd.)
34. (a) 1. National Savings Bank Employees’ Pension Scheme I (contd.)
Bank Group
2017Rs. ’000
2016Rs. ’000
2017Rs. ’000
2016Rs. ’000
(a) Net asset/(liability) recognised in Statement of Financial PositionFair value of plan assets 13,552,607 13,198,392 13,552,607 13,198,392 Defined benefit obligation (16,303,208) (14,450,945) (16,303,208) (14,450,945)
Total (2,750,601) (1,252,553) (2,750,601) (1,252,553)
(b) Amount recognised in Income StatementCurrent service cost 137,244 155,778 137,244 155,981 Interest cost on benefit obligation 254,833 421,816 254,833 421,816
Net benefit expense 392,077 577,594 392,077 577,797
(c) Amount recognised in Other Comprehensive Income (OCI)Provision adjustment – (796,913) – (796,913)Experience (gain)/loss 526,139 1,017,720 526,139 1,017,720 (Gain)/loss due to changes in assumptions 1,062,775 (2,400,266) 1,062,775 (2,400,266)Actuarial gain/(loss) on plan assets (90,866) 84,779 (90,866) 84,779 Difference in interest income on plan assets – 153,482 – 153,482
Total 1,498,048 (1,941,199) 1,498,048 (1,941,199)
(d) Changes in fair value of plan assets are as follows:
Opening fair value of plan assets 13,198,392 12,189,981 13,198,392 12,189,981 Expected return on plan assets 1,479,280 966,365 1,479,280 966,365 Actual employer contribution 392,077 1,642,381 392,077 1,642,381 Benefits paid (1,608,008) (1,515,555) (1,608,008) (1,515,555)Actuarial gain/(loss) on plan assets 90,866 (84,779) 90,866 (84,779)
Closing fair value of plan assets 13,552,607 13,198,392 13,552,607 13,198,392

330
National Savings Bank Annual Report 2017
Notes to the Financial Statements
Bank Group
2017Rs. ’000
2016Rs. ’000
2017Rs. ’000
2016Rs. ’000
(e) Changes in present value of defined benefit obligation are as follows:Opening defined benefit obligation 14,450,945 15,651,403 14,450,945 15,651,403 Interest cost 1,734,113 1,541,663 1,734,113 1,541,663 Current service cost 137,243 155,980 137,243 155,980 Benefits paid (1,608,008) (1,515,555) (1,608,008) (1,515,555)(Gain)/loss due to changes in assumptions 1,062,775 (2,400,266) 1,062,775 (2,400,266)Actuarial (gain)/loss on obligation 526,140 1,017,720 526,140 1,017,720
Closing defined benefit obligation 16,303,208 14,450,945 16,303,208 14,450,945
(f) Plan assets consists of followings:Treasury Bonds 7,438,650 7,114,705 7,438,650 7,114,705 Treasury Bills 237,424 2,577,678 237,424 2,577,678 Fixed deposits 267,939 673,231 267,939 673,231 Securities purchased under resale agreements 242,285 262,843 242,285 262,843 Debentures 4,699,545 2,230,133 4,699,545 2,230,133 Trust Certificate 100,000 – 100,000 – Cash at Bank of Ceylon 52 11,194 52 11,194
Other assets 566,712 328,609 566,712 328,609
Total 13,552,607 13,198,392 13,552,607 13,198,392
Pension Scheme I2017
Pension Scheme I2016
(g) Actuarial assumptionFuture salary increment rate (%) 6.50 6.50Discount rate (%) 11.00 12.00Increase in future Cost of Living Allowance (COLA) (%) 4.50 4.50Mortality GA 1983 Mortality table GA 1983 Mortality tableRetirement age 57 years 57 yearsNormal form of payment Monthly Monthly
34. Other liabilities (contd.)34. Other liabilities (contd.)
34. (a) Defined benefit plans (contd.)
34. (a) 1. National Savings Bank Employees’ Pension Scheme I (contd.)
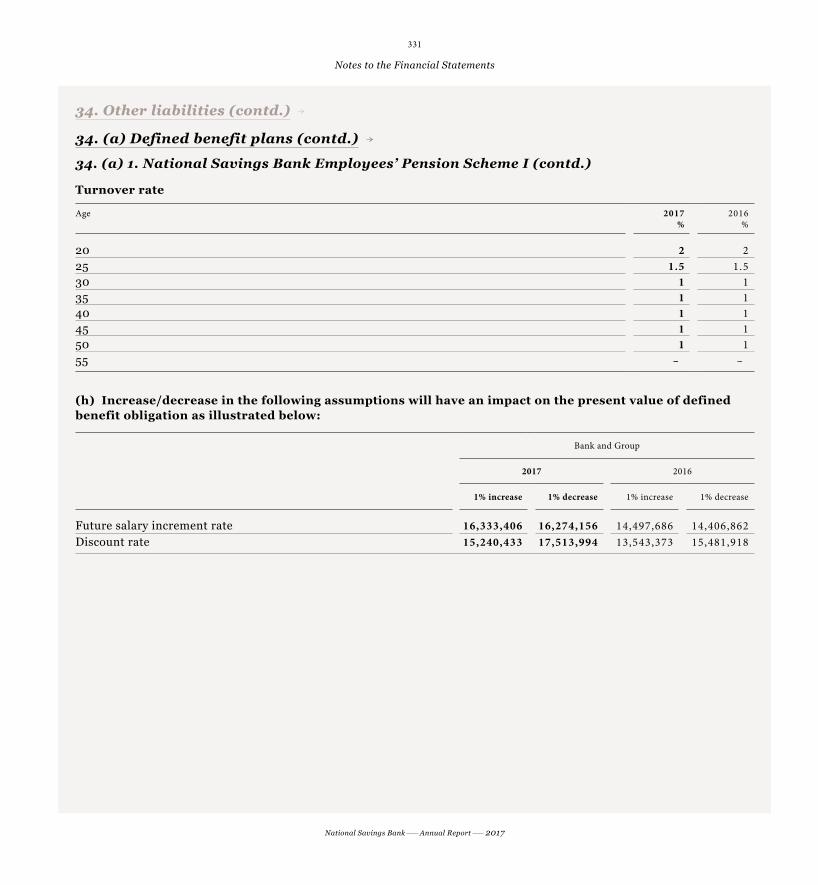
331
National Savings Bank Annual Report 2017
Notes to the Financial Statements
Turnover rate
Age 2017 %
2016 %
20 2 2 25 1.5 1.5 30 1 1 35 1 1 40 1 1 45 1 1 50 1 1 55 – –
(h) Increase/decrease in the following assumptions will have an impact on the present value of defined benefit obligation as illustrated below:
Bank and Group
2017 2016
1% increase 1% decrease 1% increase 1% decrease
Future salary increment rate 16,333,406 16,274,156 14,497,686 14,406,862Discount rate 15,240,433 17,513,994 13,543,373 15,481,918
34. Other liabilities (contd.)34. Other liabilities (contd.)
34. (a) Defined benefit plans (contd.)
34. (a) 1. National Savings Bank Employees’ Pension Scheme I (contd.)

332
National Savings Bank Annual Report 2017
Notes to the Financial Statements
34. Other liabilities (contd.)34. Other liabilities (contd.)
34. (a) Defined benefit plans (contd.)
34. (a) 2. National Savings Bank Employee’s Pension Scheme II
An actuarial valuation was carried out by Mr Piyal S Goonetilleke, fellow of Society of Actuaries (USA) of Piyal S Goonetilleke & Associates, on 31 December 2017.
Projected Unit Credit Method was used to allocate the actuarial present value of the projected benefits earned by employees to date of 31 December 2017.
Bank Group
As at 31 December 2017Rs. ’000
2016Rs. ’000
2017Rs. ’000
2016Rs. ’000
(a) Net asset/(liability) recognised in Statement of Financial PositionFair value of plan assets 1,527,607 1,086,586 1,527,607 1,086,586 Defined benefit obligation (1,481,223) (1,005,930) (1,481,223) (1,005,930)
Total 46,384 80,656 46,384 80,656
(b) Amount recognised in Income StatementCurrent service cost 106,574 152,794 106,906 153,075 Interest cost on benefit obligation (9,334) 98,964 (9,334) 98,964
Net benefit expense 97,240 251,758 97,572 252,039
(c) Amount recognised in Other Comprehensive Income (OCI)Provision adjustment – – – – Experience (gain)/loss 16,090 23,289 16,090 23,289 (Gain)/loss due to changes in assumptions 236,887 (507,585) 236,887 (507,585)Actuarial gain/(loss) on plan assets 4,947 (51,278) 4,947 (51,278)Difference in interest income on plan assets – 2,916 – 2,916
257,924 (532,658) 257,924 (532,658)

333
National Savings Bank Annual Report 2017
Notes to the Financial Statements
34. Other liabilities (contd.)34. Other liabilities (contd.)
34. (a) Defined benefit plans (contd.)
34. (a) 2. National Savings Bank Employee’s Pension Scheme II (contd.)
Bank Group
As at 31 December 2017Rs. ’000
2016Rs. ’000
2017Rs. ’000
2016Rs. ’000
(d) Changes in fair value of plan assets are as follows:Opening fair value of plan assets 1,086,586 218,065 1,086,586 218,065 Expected return on plan assets 130,046 18,360 130,046 18,360 Actual employer contribution 321,223 802,686 321,223 802,686 Benefits paid (5,302) (3,804) (5,302) (3,804)Actuarial gain/(loss) on plan assets (4,947) 51,278 (4,947) 51,278
Closing fair value of plan assets 1,527,607 1,086,586 1,527,607 1,086,586
(e) Changes in present value of defined benefit obligation are as follows:Opening defined benefit obligation 1,005,930 1,220,714 1,005,930 1,220,714 Interest cost 120,712 120,240 120,712 120,240 Current service cost 106,906 153,075 106,906 153,075 Benefits paid (5,302) (3,804) (5,302) (3,804)(Gain)/loss due to changes in assumptions 236,887 (507,585) 236,887 (507,585)Actuarial (gain)/loss on obligation 16,090 23,289 16,090 23,289
Closing defined benefit obligation 1,481,223 1,005,930 1,481,223 1,005,930
(f) Plan assets consists of followings:Treasury Bonds 1,376,780 937,115 1,376,780 937,115 Treasury Bills – 65,000 – 65,000 Fixed Deposits 140,747 63,487 140,747 63,487 Securities purchased under resale agreements 2,161 – 2,161 – Savings 1,006 186 1,006 186 Other assets 6,913 20,798 6,913 20,798
Total 1,527,607 1,086,586 1,527,607 1,086,586

334
National Savings Bank Annual Report 2017
Notes to the Financial Statements
34. Other liabilities (contd.)34. Other liabilities (contd.)
34. (a) Defined benefit plans (contd.)
34. (a) 2. National Savings Bank Employee’s Pension Scheme II (contd.)
2017%
2016%
(g) Actuarial assumptionFuture salary increment rate 6.50 6.50Discount rate 11.00 12.00Increase in future Cost of Living Allowances (COLA) 4.50 4.50Mortality GA 1983 Mortality table GA 1983 Mortality table Retirement age 57 years 57 years Normal form of payment Monthly Monthly
Turnover rate
Age % %
20 2 2 25 1.5 1.5 30 1 1 35 1 1 40 1 1 45 1 1 50 1 1 55 – –
(h) Increase/decrease in the following assumptions will have an impact on the present value of defined benefit obligation as illustrated below:
Bank and Group
2017 2016
1% increase 1% decrease 1% increase 1% decrease
Future salary increment rate 1,666,712 1,323,749 1,145,953 887,635 Discount rate 1,244,336 1,784,570 846,718 1,208,269
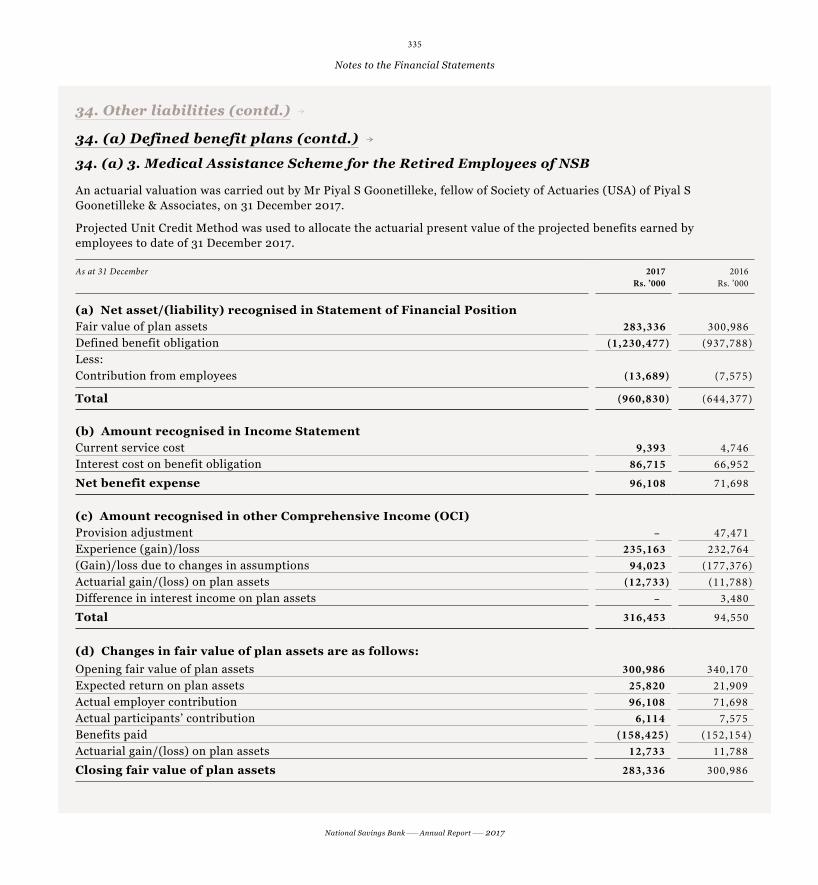
335
National Savings Bank Annual Report 2017
Notes to the Financial Statements
34. Other liabilities (contd.)34. Other liabilities (contd.)
34. (a) Defined benefit plans (contd.)
34. (a) 3. Medical Assistance Scheme for the Retired Employees of NSB
An actuarial valuation was carried out by Mr Piyal S Goonetilleke, fellow of Society of Actuaries (USA) of Piyal S Goonetilleke & Associates, on 31 December 2017.
Projected Unit Credit Method was used to allocate the actuarial present value of the projected benefits earned by employees to date of 31 December 2017.
As at 31 December 2017Rs. ’000
2016Rs. ’000
(a) Net asset/(liability) recognised in Statement of Financial PositionFair value of plan assets 283,336 300,986 Defined benefit obligation (1,230,477) (937,788)Less:Contribution from employees (13,689) (7,575)
Total (960,830) (644,377)
(b) Amount recognised in Income StatementCurrent service cost 9,393 4,746 Interest cost on benefit obligation 86,715 66,952
Net benefit expense 96,108 71,698
(c) Amount recognised in other Comprehensive Income (OCI) Provision adjustment – 47,471 Experience (gain)/loss 235,163 232,764 (Gain)/loss due to changes in assumptions 94,023 (177,376)Actuarial gain/(loss) on plan assets (12,733) (11,788)Difference in interest income on plan assets – 3,480
Total 316,453 94,550
(d) Changes in fair value of plan assets are as follows:Opening fair value of plan assets 300,986 340,170 Expected return on plan assets 25,820 21,909 Actual employer contribution 96,108 71,698 Actual participants’ contribution 6,114 7,575 Benefits paid (158,425) (152,154)Actuarial gain/(loss) on plan assets 12,733 11,788
Closing fair value of plan assets 283,336 300,986

336
National Savings Bank Annual Report 2017
Notes to the Financial Statements
As at 31 December 2017Rs. ’000
2016Rs. ’000
(e) Changes in present value of defined benefit obligation are as follows:Opening defined benefit obligation 937,788 937,468 Interest cost 112,535 92,341 Current service cost 9,393 4,746 Benefits paid (158,425) (152,154)(Gain)/loss due to changes in assumptions 94,023 (177,376)Actuarial (gain)/loss on obligation 235,163 232,764
Closing defined benefit obligation 1,230,477 937,788
(f) Plan assets consists of followings:Treasury Bonds 154,270 121,764 Treasury Bills – 234,960 Fixed Deposits 99,224 6,005 Securities purchased under resale agreements 7,615 18,450 Trust Certificate 83,342 – Savings 484 265 Other payable (61,599) (80,458)
Total 283,336 300,986
(g) Actuarial Assumption
2017 2016% %
Medical cost inflation rate 5.00 5.00 Discount rate 11.00 12.00
34. Other liabilities (contd.)34. Other liabilities (contd.)
34. (a) Defined benefit plans (contd.)
34. (a) 3. Medical Assistance Scheme for the Retired Employees of NSB (contd.)

337
National Savings Bank Annual Report 2017
Notes to the Financial Statements
34. Other liabilities (contd.)34. Other liabilities (contd.)
34. (a) Defined benefit plans (contd.)
34. (a) 4. Gratuity plan – Bank and Group
BankWith the establishment of Pension Scheme II, employees who joined the Bank on or after 1 October 1995 are become members of the Pension Scheme II, thus are not entitle to the rights and privileges under Service Gratuity Scheme. However, where there are payment of termination gratuity before the entitlement pension of Bank recognise the expense on cash basis.
GroupThe staff members of the subsidiary company is not entitled for pension scheme and hence they are continue to the members of Gratuity plan as per the provision of Gratuity Act No. 12 of 1983.
2017 2016
BankRs. ’000
GroupRs. ’000
BankRs. ’000
GroupRs. ’000
(a) Net benefit expense (recognised under personal expenses)Current service cost – 119 – 115 Interest cost on benefit obligation – 125 – 132
Net benefit expense – 244 – 247
(b) Provision for gratuityDefined benefit obligation as at 1 January – 1,260 – 1,346 Interest cost – 125 – 132 Current service cost – 119 – 115 Benefits paid – – – – Actuarial (gain)/loss on obligation (recognised in OCI) – (270) – (333)
Defined benefit obligation at 31 December – 1,234 – 1,260

338
National Savings Bank Annual Report 2017
Notes to the Financial Statements
(c) Actuarial assumption
Group
2017%
2016%
Future salary increment rate 6.59 6.50Discount rate 10.63 10.00Mortality 0 0
Staff turnover rate and average future working lifetime Age group 30-34 35-39 40<Staff turnover rate 0% 0% 0%Average future working lifetime – Years 30 23 16
(d) Increase/decrease in the following assumptions will have an impact on the present value of defined benefit obligation as illustrated below:
Group
2017 2016
1% increase 1% decrease 1% increase 1% decrease
Future salary increment rate 183 219 226 190 Discount rate 226 191 183 220
AssumptionsFinancial assumptions – Rate of discount, salary increment rate
Demographic assumptions – Mortality, staff turn over, disability, retirement age
34. Other liabilities (contd.)34. Other liabilities (contd.)
34. (a) Defined benefit plans (contd.)
34. (a) 4. Gratuity plan – Bank and Group (contd.)
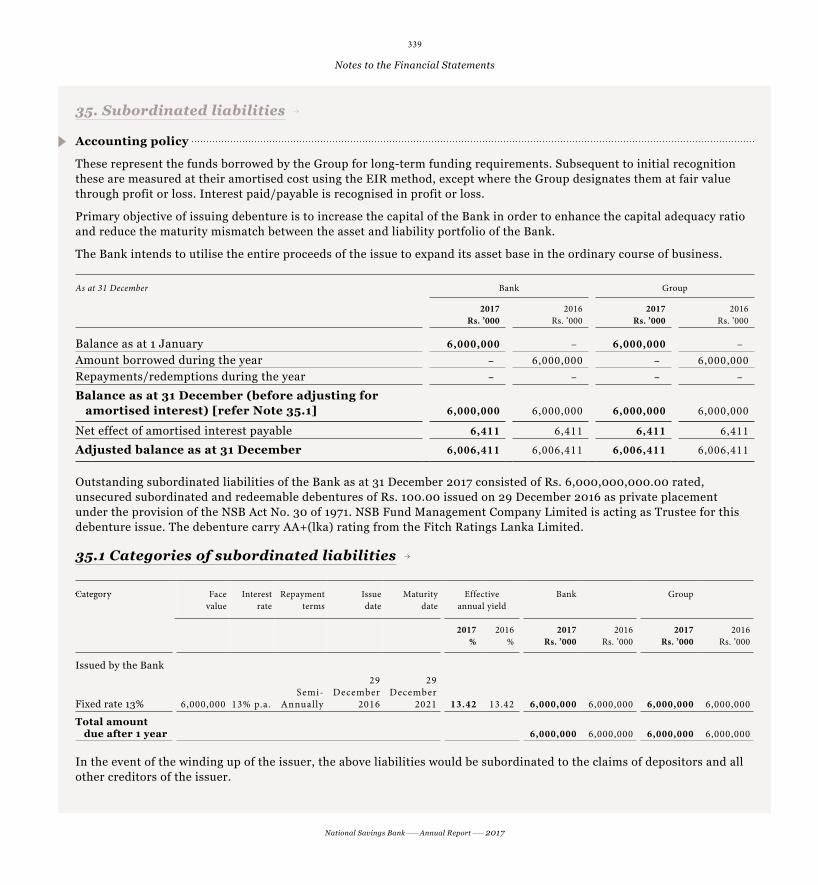
339
National Savings Bank Annual Report 2017
Notes to the Financial Statements
35. Subordinated liabilities35. Subordinated liabilities
Accounting policy
These represent the funds borrowed by the Group for long-term funding requirements. Subsequent to initial recognition these are measured at their amortised cost using the EIR method, except where the Group designates them at fair value through profit or loss. Interest paid/payable is recognised in profit or loss.
Primary objective of issuing debenture is to increase the capital of the Bank in order to enhance the capital adequacy ratio and reduce the maturity mismatch between the asset and liability portfolio of the Bank.
The Bank intends to utilise the entire proceeds of the issue to expand its asset base in the ordinary course of business.
As at 31 December Bank Group
2017Rs. ’000
2016Rs. ’000
2017Rs. ’000
2016Rs. ’000
Balance as at 1 January 6,000,000 – 6,000,000 – Amount borrowed during the year – 6,000,000 – 6,000,000 Repayments/redemptions during the year – – – –
Balance as at 31 December (before adjusting for amortised interest) [refer Note 35.1] 6,000,000 6,000,000 6,000,000 6,000,000
Net effect of amortised interest payable 6,411 6,411 6,411 6,411
Adjusted balance as at 31 December 6,006,411 6,006,411 6,006,411 6,006,411 Outstanding subordinated liabilities of the Bank as at 31 December 2017 consisted of Rs. 6,000,000,000.00 rated, unsecured subordinated and redeemable debentures of Rs. 100.00 issued on 29 December 2016 as private placement under the provision of the NSB Act No. 30 of 1971. NSB Fund Management Company Limited is acting as Trustee for this debenture issue. The debenture carry AA+(lka) rating from the Fitch Ratings Lanka Limited.
35.1 Categories of subordinated liabilities
Category Face value
Interest rate
Repayment terms
Issue date
Maturity date
Effective annual yield
Bank Group
2017%
2016%
2017Rs. ’000
2016Rs. ’000
2017Rs. ’000
2016Rs. ’000
Issued by the Bank
Fixed rate 13% 6,000,000 13% p.a.Semi-
Annually
29December
2016
29 December
2021 13.42 13.42 6,000,000 6,000,000 6,000,000 6,000,000
Total amount due after 1 year 6,000,000 6,000,000 6,000,000 6,000,000
In the event of the winding up of the issuer, the above liabilities would be subordinated to the claims of depositors and all other creditors of the issuer.

340
National Savings Bank Annual Report 2017
Notes to the Financial Statements
36. Stated capital/Assigned capital36. Stated capital/Assigned capital
As at 31 DecemberBank Group
2017Rs. ’000
2016Rs. ’000
2017Rs. ’000
2016Rs. ’000
Authorised One billion ordinary Share of Rs. 10.00 each As at 1 January 10,000,000 10,000,000 10,000,000 10,000,000
Balance as at 1 January (issued and fully paid)620 million ordinary shares of Rs. 10.00 each 6,200,000 3,200,000 6,200,000 3,200,000
Issue of ordinary shares during the year50 million ordinary shares of Rs. 10.00 each 500,000 3,000,000 500,000 3,000,000
Total 6,700,000 6,200,000 6,700,000 6,200,000
As per Section 47 of NSB Act subsection 3, Bank has issued 50 Mn. ordinary shares of Rs. 10.00 using unclaimed deposit reserve to the Secretary to the Treasury on 31 December 2017 (Refer Note 38.1 unclaimed deposit reserve on page 342).
37. Statutory reserve fund37. Statutory reserve fund
The statutory reserve fund is maintained as per the requirements under Section 20 (1) of the Banking Act No. 30 of 1988. Accordingly, the fund is built up by allocating a sum equivalent to not less than 5% of the profit after tax, but before declaring any dividend or any profit that are transferred to elsewhere until the reserve is equal to 50% of the Bank’s stated capital and thereafter sum equivalent to 2% of such profit until the amount of said reserve fund is equal to the stated capital of the Bank.
The balance in the statutory reserve fund will be used only for the purposes specified in the Section 20 (2) of the Banking Act No. 30 of 1988.
As at 31 December
Bank Group
2017Rs. ’000
2016Rs. ’000
2017Rs. ’000
2016Rs. ’000
Opening balance 2,522,467 2,047,581 2,522,467 2,047,581 Transfer during the period – 5% of profit after tax 480,485 474,886 480,485 474,886
Closing balance 3,002,952 2,522,467 3,002,952 2,522,467

341
National Savings Bank Annual Report 2017
Notes to the Financial Statements
38. Other reserves38. Other reserves
Bank – 2017
Opening balance at 1 January 2017
Rs. ’000
Movement/transfersRs. ’000
Closing balance at31 December 2017
Rs. ’000
General reserve 15,740,879 2,000,000 17,740,879 Revaluation reserve 3,296,565 4,496,752 7,793,317 Available-for-sale reserve 1,378,818 (33,581) 1,345,237 Cash flow hedging reserve 1,850 290,074 291,924 Other reserves (refer Notes 38.1 and 38.2) 725,695 392,891 1,118,586
Total 21,143,806 7,146,136 28,289,941
Bank – 2016
Opening balance at 1 January 2016
Rs. ’000
Movement/transfersRs. ’000
Closing balance at 31 December 2016
Rs. ’000
General reserve 18,839,027 (3,098,147) 15,740,879Revaluation reserve 3,296,565 – 3,296,565Available-for-sale reserve 1,631,862 (253,044) 1,378,818Cash flow hedging reserve 139,106 (137,256) 1,850Other reserves (refer Notes 38.1 and 38.2) 3,269,686 (2,543,992) 725,695
Total 27,176,246 (6,032,439) 21,143,806
Group – 2017
Opening balance at 1 January 2017
Rs. ’000
Movement/transfersRs. ’000
Closing balance at31 December 2017
Rs. ’000
General reserve 15,740,879 2,000,000 17,740,879Revaluation reserve 3,296,565 4,496,752 7,793,317Available-for-sale reserve 1,096,758 131,662 1,228,420Cash flow hedging reserve 1,850 290,074 291,924Other reserves (refer Notes 38.1, 38.2 and 38.3) 1,219,656 483,590 1,703,246
Total 21,355,707 7,402,077 28,757,786

342
National Savings Bank Annual Report 2017
Notes to the Financial Statements
38. Other reserves (contd.)38. Other reserves (contd.)
Group – 2016
Opening balance at 1 January 2016
Rs. ’000
Movement/transfersRs. ’000
Closing balance at31 December 2016
Rs. ’000
General reserve 18,839,027 (3,098,147) 15,740,879Revaluation reserve 3,296,565 – 3,296,565Available-for-sale reserve 1,452,761 (356,003) 1,096,758Cash flow hedging reserve 139,106 (137,256) 1,850Other reserves (refer Notes 38.1, 38.2 and 38.3) 3,743,793 (2,524,138) 1,219,656
Total 27,471,252 (6,115,544) 21,355,707
38.1 Unclaimed deposit reserve
Bank Group
As at 31 December 2017Rs. ’000
2016Rs. ’000
2017Rs. ’000
2016Rs. ’000
Opening Balance 723,509 3,267,505 723,509 3,267,505 Transferred to share capital (500,000) (3,000,000) (500,000) (3,000,000)
Transferred during the year 892,892 456,004 892,892 456,004
Closing balance 1,116,401 723,509 1,116,401 723,509
In terms of the Section 47 of the National Savings Bank Act No. 30 of 1971 as amended by the Section 30 of the National Savings Bank (Amendment) Act No. 28 of 1995, where an amount lain dormant in a savings or deposit account for a period of ten years, it should be transferred to, unclaimed deposit reserve. Accordingly, amount transferred (net) to the reserve during the year 2017, was Rs. 892.9 Mn.
38.2 Special reserve
Bank Group
As at 31 December 2017Rs. ’000
2016Rs. ’000
2017Rs. ’000
2016Rs. ’000
Opening balance 2,186 2,182 2,186 2,182 Transferred during the year (1) 4 (1) 4
Closing balance 2,185 2,186 2,185 2,186

343
National Savings Bank Annual Report 2017
Notes to the Financial Statements
38. Other reserves (contd.)38. Other reserves (contd.)
38.2 Special reserve (contd.)
The special reserve represents the amount transferred from the dormant accounts of customers where the aggregate of the amount dormant is less than Rs. 10.00 (ten rupees).
The whole or such part of the monies lying to the credit of “special reserve” and “unclaimed deposit reserve” may be capitalised and shares to the value of money capitalised may be issued in the name of Secretary to the Treasury. The entirety of the issue and fully-paid share capital of Rs. 6,700 Mn. reflected in the Statement of Financial Position was issued by capitalising the unclaimed deposit reserve time to time.
38.3 Special risk reserve – (NSB Fund Management Company Limited)
Bank Group
As at 31 December 2017Rs. ’000
2016Rs. ’000
2017Rs. ’000
2016Rs. ’000
Opening balance – – 493,961 474,107 Transferred during the year – 25% of profit after tax – – 90,699 19,854
Closing balance – – 584,660 493,961
In order to promote the safety, soundness and the stability of the Primary Dealer (PD) system and to build-up PD capital base, Primary Dealers (PDs) are required to annually transfer a percentage of their profit after tax to a special risk reserve as follows, with effect from 1 July 2004.
I. 50% of the profit after tax annually by the PDs who maintain capital funds less than Rs. 400 Mn.
II. 25% of the profit after tax annually by the PDs who maintain capital funds in excess of Rs. 400 Mn.
Other reserves
Bank Group
As at 31 December 2017Rs. ’000
2016Rs. ’000
2017Rs. ’000
2016Rs. ’000
Total other reserves 1,118,586 725,695 1,703,246 1,219,656

344
National Savings Bank Annual Report 2017
Notes to the Financial Statements
39. Contingent liabilities and commitments 39. Contingent liabilities and commitments
Accounting policy
Contingent liabilities are possible obligations whose existence will be confirmed only by uncertain future event or present Contingent liabilities are possible obligations whose existence will be confirmed only by uncertain future event or present obligation where the transfer of economic benefit is not probable or cannot be reliably measured as defined in the obligation where the transfer of economic benefit is not probable or cannot be reliably measured as defined in the Sri Lanka Accounting Standard LKAS 37 on – Sri Lanka Accounting Standard LKAS 37 on – ——Provisions, Contingent Liabilities and Contingent AssetsProvisions, Contingent Liabilities and Contingent Assets˜̃..
To meet the financial needs of customers, the Bank enters into various irrevocable commitments and contingent liabilities. To meet the financial needs of customers, the Bank enters into various irrevocable commitments and contingent liabilities. These consist of finance guarantees, letters of credit and other undrawn commitments to lend. Letters of credit and These consist of finance guarantees, letters of credit and other undrawn commitments to lend. Letters of credit and guarantees commit the Bank to make payments on behalf of customers in the event of a specific act, generally related to the guarantees commit the Bank to make payments on behalf of customers in the event of a specific act, generally related to the import or export of goods. Guarantees and stand by letters of credit carry a similar credit risk to loans.import or export of goods. Guarantees and stand by letters of credit carry a similar credit risk to loans.
Contingent liabilities are not recognised in the Statement of Financial Position but are disclosed unless its occurrence is remote.Contingent liabilities are not recognised in the Statement of Financial Position but are disclosed unless its occurrence is remote.
Bank Group
As at 31 December 2017Rs. ’000
2016Rs. ’000
2017Rs. ’000
2016Rs. ’000
CommitmentsCommitment for unutilised credit facilities 14,963,565 22,727,130 14,963,565 22,727,130 Other commitments indirect credit facilities 78,648 74,149 78,648 74,149 Capital commitments (Note 39.1) 1,260,213 468,580 1,260,213 468,580
16,302,426 23,269,859 16,302,426 23,269,859
Contingent liabilitiesDocumentary credit 276,003 109,948 276,003 109,948 Guarantees 1,741,883 1,590,253 1,741,883 1,590,253
2,017,886 1,700,201 2,017,886 1,700,201
Total commitment and contingencies 18,320,312 24,970,060 18,320,312 24,970,060

345
National Savings Bank Annual Report 2017
Notes to the Financial Statements
39. Contingent liabilities and commitments (contd.)39. Contingent liabilities and commitments (contd.)
39.1 Capital commitments
Capital expenditure approved by the Board of Directors, for which provisions have not been made in the Financial Statements are detailed below:
Bank Group
As at 31 December 2017Rs. ’000
2016Rs. ’000
2017Rs. ’000
2016Rs. ’000
Approved and contracted for 1,187,213 408,380 1,187,213 408,380
Approved but not contracted for 73,000 60,200 73,000 60,200
1,260,213 468,580 1,260,213 468,580
40. Related party disclosures40. Related party disclosures
Accounting policy
The financial dealings carried out with the Government of Sri Lanka and state-controlled entities for the year and as of the The financial dealings carried out with the Government of Sri Lanka and state-controlled entities for the year and as of the date of the Statement of Financial Position are disclosed below on a collective basis:date of the Statement of Financial Position are disclosed below on a collective basis:
40. (a) Transactions with state and state controlled entities
Bank Group
As at 31 December 2017Rs. ’000
2016Rs. ’000
2017Rs. ’000
2016Rs. ’000
AssetsLoans to Government 2,075,000 2,075,000 2,075,000 2,075,000 Investments made on Government Securities 550,064,186 525,123,106 556,857,496 535,630,193 Investments on state and state-controlled entities 151,145,775 127,543,373 151,145,775 127,543,373 Securities purchased under resale agreements 1,660,634 2,220,500 1,672,197 2,232,062 Tax receivable (Notional Tax) 7,184,079 5,813,616 7,212,333 5,833,897 Postmaster-General’s current account 351,107 314,534 351,107 314,534 Advance payment to Government 4,480,000 4,800,000 4,480,000 4,800,000 Other receivables from Government 8,426,009 5,919,297 8,426,009 5,919,297
725,386,790 673,809,427 732,219,917 684,348,357

346
National Savings Bank Annual Report 2017
Notes to the Financial Statements
Bank Group
As at 31 December 2017Rs. ’000
2016Rs. ’000
2017Rs. ’000
2016Rs. ’000
LiabilitiesDue to other customers 2,198,575 – 2,198,575 –
Securities sold under repurchase agreements 51,917,316 21,708,120 27,297,637 27,297,637
Taxes paidIncome tax 4,419,019 3,805,271 4,595,065 3,834,995 Value added tax 3,082,619 2,405,618 3,168,299 2,423,091 Nation building tax 411,016 385,670 422,440 388,482 Contribution to consolidated fund – dividend/levy 5,111,114 12,026,000 5,111,114 12,027,650
13,023,768 18,622,560 13,296,918 18,674,217
40. (b) Transactions with subsidiary company (NSB Fund Management Company Limited)
The Bank has contributed Rs. 900 Mn. towards the share capital of the Company. The Company invested its funds in Treasury Bills, Treasury Bonds and Repos during the year on a regular basis. All investment in Treasury Bills and Treasury Bonds of the Bank are being made through the NSB Fund Management Company Limited, on which a service charge of Rs. 58.7 Mn. has been made (Rs. 52.6 Mn. in 2016). Bank received dividend of Rs. 922.35 Mn. during the Year (Rs. 14.85 Mn. in 2016).
The Bank holds following balances with NSB Fund Management Company Limited, as at the reporting date:
Bank
As at 31 December 2017Rs. ’000
2016Rs. ’000
AssetsInter-company current account 51 300 Securities purchased under resale agreement 1,564,600 810,000 Interest receivable on securities purchased under resale agreement 1,326 383 Other receivable 955 1,764
LiabilitiesOther payable 750 –
40. Related party disclosures (contd.)40. Related party disclosures (contd.)
40. (a) Transactions with state and state controlled entities (contd.)
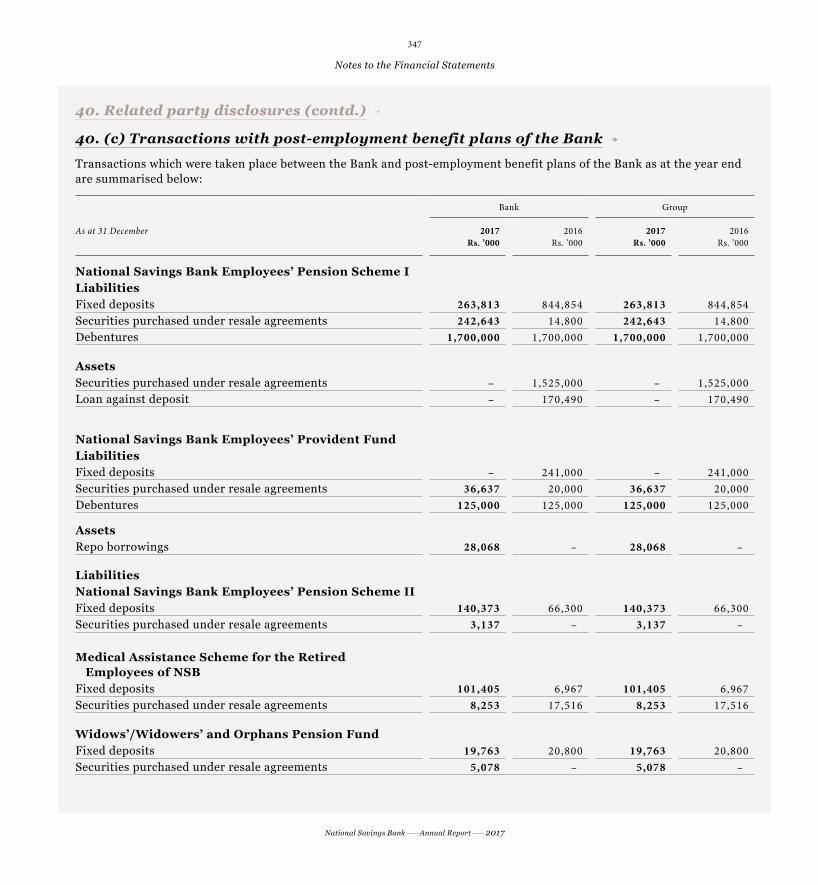
347
National Savings Bank Annual Report 2017
Notes to the Financial Statements
40. Related party disclosures (contd.)40. Related party disclosures (contd.)
40. (c) Transactions with post-employment benefit plans of the Bank
Transactions which were taken place between the Bank and post-employment benefit plans of the Bank as at the year end are summarised below:
Bank Group
As at 31 December 2017Rs. ’000
2016Rs. ’000
2017Rs. ’000
2016Rs. ’000
National Savings Bank Employees’ Pension Scheme ILiabilitiesFixed deposits 263,813 844,854 263,813 844,854 Securities purchased under resale agreements 242,643 14,800 242,643 14,800 Debentures 1,700,000 1,700,000 1,700,000 1,700,000
AssetsSecurities purchased under resale agreements – 1,525,000 – 1,525,000 Loan against deposit – 170,490 – 170,490
National Savings Bank Employees’ Provident FundLiabilitiesFixed deposits – 241,000 – 241,000 Securities purchased under resale agreements 36,637 20,000 36,637 20,000 Debentures 125,000 125,000 125,000 125,000
AssetsRepo borrowings 28,068 – 28,068 –
LiabilitiesNational Savings Bank Employees’ Pension Scheme IIFixed deposits 140,373 66,300 140,373 66,300 Securities purchased under resale agreements 3,137 – 3,137 –
Medical Assistance Scheme for the Retired Employees of NSBFixed deposits 101,405 6,967 101,405 6,967 Securities purchased under resale agreements 8,253 17,516 8,253 17,516
Widows’/Widowers’ and Orphans Pension FundFixed deposits 19,763 20,800 19,763 20,800 Securities purchased under resale agreements 5,078 – 5,078 –
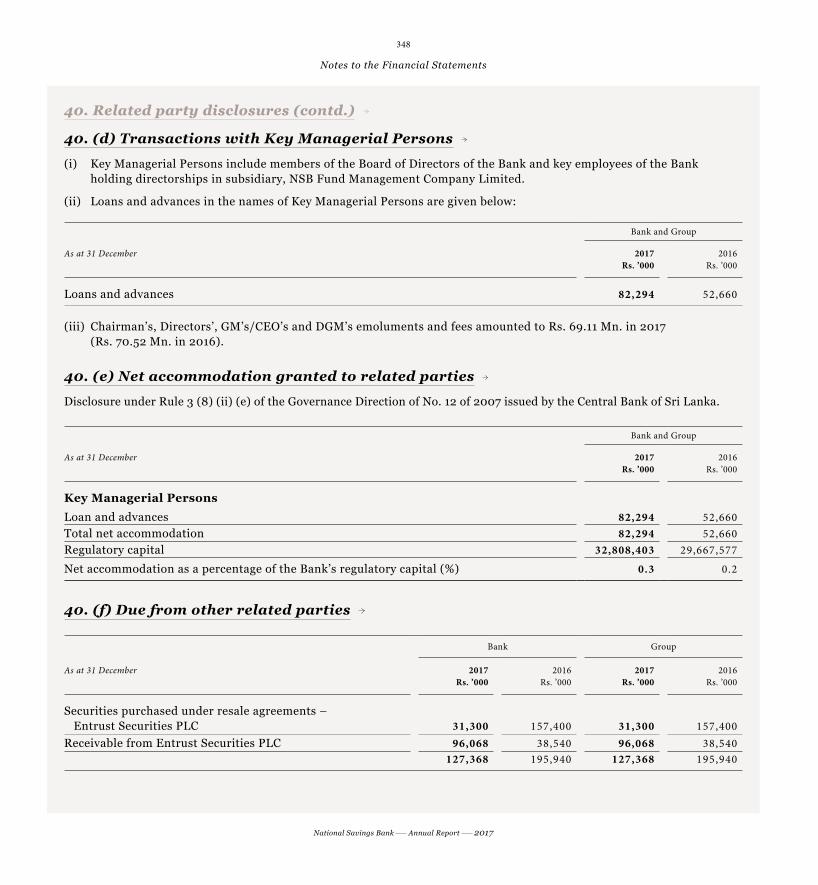
348
National Savings Bank Annual Report 2017
Notes to the Financial Statements
40. Related party disclosures (contd.)40. Related party disclosures (contd.)
40. (d) Transactions with Key Managerial Persons
(i) Key Managerial Persons include members of the Board of Directors of the Bank and key employees of the Bank holding directorships in subsidiary, NSB Fund Management Company Limited.
(ii) Loans and advances in the names of Key Managerial Persons are given below:
Bank and Group
As at 31 December 2017Rs. ’000
2016Rs. ’000
Loans and advances 82,294 52,660
(iii) Chairman’s, Directors’, GM’s/CEO’s and DGM’s emoluments and fees amounted to Rs. 69.11 Mn. in 2017 (Rs. 70.52 Mn. in 2016).
40. (e) Net accommodation granted to related parties
Disclosure under Rule 3 (8) (ii) (e) of the Governance Direction of No. 12 of 2007 issued by the Central Bank of Sri Lanka.
Bank and Group
As at 31 December 2017Rs. ’000
2016Rs. ’000
Key Managerial Persons
Loan and advances 82,294 52,660 Total net accommodation 82,294 52,660 Regulatory capital 32,808,403 29,667,577
Net accommodation as a percentage of the Bank’s regulatory capital (%) 0.3 0.2
40. (f) Due from other related parties
Bank Group
As at 31 December 2017Rs. ’000
2016Rs. ’000
2017Rs. ’000
2016Rs. ’000
Securities purchased under resale agreements – Entrust Securities PLC 31,300 157,400 31,300 157,400 Receivable from Entrust Securities PLC 96,068 38,540 96,068 38,540
127,368 195,940 127,368 195,940

349
National Savings Bank Annual Report 2017
Notes to the Financial Statements
40. Related party disclosures (contd.)40. Related party disclosures (contd.)
40. (g) Due to other-related parties
Bank Group
As at 31 December 2017Rs. ’000
2016Rs. ’000
2017Rs. ’000
2016Rs. ’000
Repo Borrowings – Entrust Securities PLC – 2,637,795 – 2,637,795
Other Payable – Entrust Securities PLC 633,133 607,985 633,133 607,985
633,133 3,245,780 633,133 3,245,780
41. Net assets value per ordinary share41. Net assets value per ordinary share
Bank Group
As at 31 December 2017Rs. ’000
2016Rs. ’000
2017Rs. ’000
2016Rs. ’000
Amount used as the numeratorShareholders’ funds 40,221,778 32,245,580 41,266,465 33,786,788 Number of ordinary share used as the denominatorTotal number of shares 670,000 620,000 670,000 620,000
Net assets value per ordinary share (Rs.) 60.03 52.01 61.59 54.49
42. Non-cash items included in profit before tax42. Non-cash items included in profit before tax
Bank Group
For the year ended 31 December 2017Rs. ’000
2016Rs. ’000
2017Rs. ’000
2016Rs. ’000
Depreciation of property, plant and equipment 315,741 289,683 316,492 290,314 Amortisation of leasehold property/improvement 11,415 7,198 11,415 7,198 Amortisation of intangible assets 96,391 35,512 96,444 35,512 Impairment losses on loans and receivables 693,233 (99,693) 693,233 (99,693)Profit on disposal of property, plant and equipment (2,826) (70,016) (2,824) (70,014)Accretion of discounts and amortisation of premiums of investment securities (721,202) 1,048,604 (1,009,119) 1,165,960 Foreign currency revaluation (111,687) (16,726) (111,687) (16,726)Bonus share dividend received (750,000) – – –Gain from financial investments/others (707,491) (40,923) (724,991) (40,923)
Total (1,176,426) 1,153,639 (731,037) 1,271,628

350
National Savings Bank Annual Report 2017
Notes to the Financial Statements
43. Change in operating assets43. Change in operating assets
Bank Group
For the year ended 31 December 2017Rs. ’000
2016Rs. ’000
2017Rs. ’000
2016Rs. ’000
Change in derivative financial instruments 1,657,805 869,583 1,657,805 869,583 Net (increase)/decrease in debt securities, Treasury Bills and Bonds and equity shares held at FVTPL/HTM (23,930,314) 1,680,328 (21,398,172) (776,569)Net (increase)/decrease in loans and receivables to banks 4,119,507 (8,116,249) 3,862,838 (8,098,247)Net (increase)/decrease in loans and receivables to customers (69,026,157) (43,844,407) (68,281,204) (43,040,691)Change in other assets (3,802,125) (5,351,671) (3,954,044) (5,454,009)
Total (90,981,284) (54,762,416) (88,112,777) (56,499,933)
44. Change in operating liabilities44. Change in operating liabilities
Bank Group
For the year ended 31 December 2017Rs. ’000
2016Rs. ’000
2017Rs. ’000
2016Rs. ’000
Change in derivative financial instruments 956,937 – 956,937 –Change in deposits from banks, customers and debt securities issued 80,874,270 61,504,606 78,778,982 64,212,785
Change in other liabilities (757,526) 106,892 (720,668) 103,812
Total 81,073,681 61,611,498 79,015,251 64,316,597
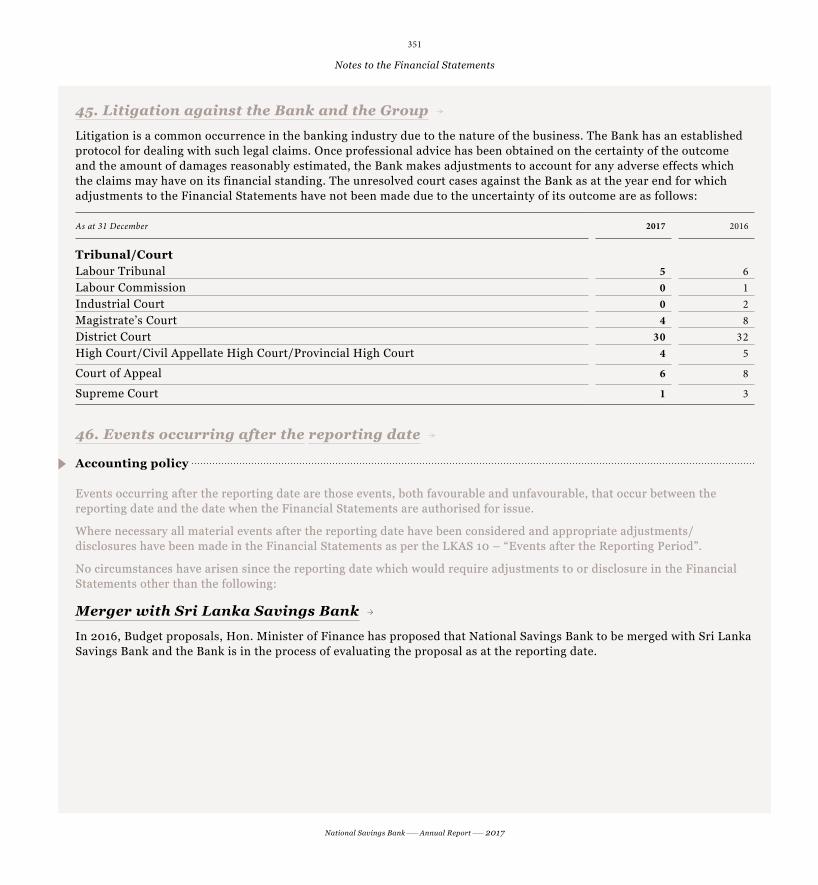
351
National Savings Bank Annual Report 2017
Notes to the Financial Statements
45. Litigation against the Bank and the Group45. Litigation against the Bank and the Group
Litigation is a common occurrence in the banking industry due to the nature of the business. The Bank has an established protocol for dealing with such legal claims. Once professional advice has been obtained on the certainty of the outcome and the amount of damages reasonably estimated, the Bank makes adjustments to account for any adverse effects which the claims may have on its financial standing. The unresolved court cases against the Bank as at the year end for which adjustments to the Financial Statements have not been made due to the uncertainty of its outcome are as follows:
As at 31 December 2017 2016
Tribunal/CourtLabour Tribunal 5 6Labour Commission 0 1Industrial Court 0 2Magistrate’s Court 4 8District Court 30 32High Court/Civil Appellate High Court/Provincial High Court 4 5
Court of Appeal 6 8
Supreme Court 1 3
46. Events occurring after the46. Events occurring after the reporting datereporting date
Accounting policy
Events occurring after the reporting date are those events, both favourable and unfavourable, that occur between the Events occurring after the reporting date are those events, both favourable and unfavourable, that occur between the reporting date and the date when the Financial Statements are authorised for issue.reporting date and the date when the Financial Statements are authorised for issue.
Where necessary all material events after the reporting date have been considered and appropriate adjustments/Where necessary all material events after the reporting date have been considered and appropriate adjustments/disclosures have been made in the Financial Statements as per the LKAS 10 – “Events after the Reporting Period”.disclosures have been made in the Financial Statements as per the LKAS 10 – “Events after the Reporting Period”.
No circumstances have arisen since the reporting date which would require adjustments to or disclosure in the Financial No circumstances have arisen since the reporting date which would require adjustments to or disclosure in the Financial Statements other than the following: Statements other than the following:
Merger with Sri Lanka Savings Bank
In 2016, Budget proposals, Hon. Minister of Finance has proposed that National Savings Bank to be merged with Sri Lanka Savings Bank and the Bank is in the process of evaluating the proposal as at the reporting date.
352
National Savings Bank Annual Report 2017
Notes to the Financial Statements
47. Comparative figures 47. Comparative figures
The comparative information is reclassified wherever necessary, to comply with the current year’s classification in order to provide a better presentation.
There were no reclassifications during the year.
48. Financial risk management48. Financial risk management
48.1 Risk management framework
Integrated risk management framework of NSB encompasses policies and procedures covering various risks, mechanism to identify such risks, and effective measures to manage and mitigate risks.
Risk management framework of the Bank begins with the oversight of the Board of Directors. It has set-up Board Integrated Risk Management Committee (BIRMC) to assist the Board of Directors in discharging its risk management responsibility. The Risk Management Division (RMD) independently reports to the Board through BIRMC. These Management Committees review regular reports from respective Business Divisions and RMD, to ensure adequacy and effectiveness of Bank’s risk management with meticulous focus.
The following executive management subcommittees, are responsible for the coordination of risk matters for each of the areas of risk management with meticulous focus:
zz Operational Risk Management Committee
zz Asset and Liability Management Committee
zz Credit Committee
zz Investment Committee
zz IT Steering Committee
zz Human Resource Committee
zz Performance Review Committee
zz Marketing Committee
zz Management Committee
Internal Audit Division engages both regular and ad hoc reviews of risk management controls and procedures and the results are reported to the Board Audit Committee (BAC).

353
National Savings Bank Annual Report 2017
Notes to the Financial Statements
48. Financial risk management (contd.)48. Financial risk management (contd.)
48.2 Broad risk categories in focus
The Bank is exposed to the following key risks from financial instruments:
a. Credit risk
b. Liquidity risk
c. Market risk –
(i) Foreign exchange risk
(ii) Equity risk
(iii) Interest rate risk
d. Operational risk
(a) Credit risk
Credit risk is the risk of losses resulting from the failure of a borrower or counterparty to honour its financial or contractual obligations to the Bank which could materialise from the banking book and both on or off-balance sheet. The on-balance sheet credit risk arises mainly from notional value of financial products such as retail loans, corporate loans, loans to banks and financial institutions, loans to State-Owned Enterprises (SOEs) and loans to the Government. The off-balance sheet credit risk arises from undrawn loan commitments.
i. Credit risk exposures of the Bank
The total credit exposure which is 38.5% of the Bank’s total assets is the second major line of business (the investment in risk free securities is 54.8% of total assets). Hence the magnitude of credit risk is comparatively moderate to the Bank, albeit the fact that the Bank considers credit risk as a major type of risk.
The credit exposure of the Bank is created from two main categories i.e., “lending to banks” and “lending to other customers” such as corporate and retail borrowers, Government and Government institutions.
Net exposure to credit risk
The following tables show the maximum exposure and net exposure (fair value of any collateral held, value of risk-free investments, Government guarantees and impairment provision made were deducted in arriving the net exposure) to credit risk by class of financial assets.

354
National Savings Bank Annual Report 2017
Notes to the Financial Statements
48. Financial risk management (contd.)48. Financial risk management (contd.)
48.2 Broad risk categories in focus (contd.)
As at 31 December 2017 2016
Maximum exposure to
credit riskRs. ’000
Net exposure
Rs. ’000
Maximum exposure to
credit riskRs. ’000
Netexposure
Rs. ’000
BankCash and cash equivalents 3,849,627 2,904,867 4,619,699 3,938,171 Balances with central banks – – – –Placements with banks 23,438,104 23,438,104 19,013,572 19,013,572 Derivative financial instruments 1,360,714 1,360,714 2,728,445 2,728,445 Other financial assets – held for trading 6,472,314 2,357,336 20,290,588 3,095,911 Financial assets designated at fair value through profit or loss – – – –Loans and receivables to banks 27,714,565 24,947,881 31,834,072 29,429,326 Loans and receivables to other customers 360,309,866 108,372,745 291,976,942 86,307,208 Financial assets – available for sale 5,693,829 4,440,951 6,227,764 4,123,732 Financial assets – held to maturity 544,273,077 – 505,824,398 –
Gross total 973,112,095 167,822,598 882,515,480 148,636,365
As at 31 December 2017 2016
Maximum exposure to
credit riskRs. ’000
Net exposure
Rs. ’000
Maximum exposure to
credit riskRs. ’000
Netexposure
Rs. ’000
GroupCash and cash equivalents 3,854,086 2,909,317 4,627,629 3,936,092 Balances with central banks 94 94 477 477 Placements with banks 23,438,104 23,438,104 19,013,572 19,013,572 Derivative financial instruments 1,360,714 1,360,714 2,728,445 2,728,445 Other financial assets – held for trading 9,389,950 2,357,336 27,303,207 3,095,911 Financial assets designated at fair value through profit or loss – – – –Loans and receivables from banks 27,971,234 25,204,551 31,834,072 29,429,326 Loans and receivables from other customers 358,766,093 108,372,745 291,178,121 86,307,208 Financial assets – available for sale 7,713,852 4,641,872 8,122,516 4,324,572 Financial assets – held to maturity 547,924,390 – 507,624,954 –
Gross total 980,418,517 168,284,733 892,432,992 148,835,603

355
National Savings Bank Annual Report 2017
Notes to the Financial Statements
48. Financial risk management (contd.)48. Financial risk management (contd.)
48.2 Broad risk categories in focus (contd.)
ii. Management of the credit portfolio
Collateral and other credit enhancement
The amount and type of collateral required depends as an assessment of the credit risk of the counterparty. Guidelines are in place covering the accessibility and valuation of each type of collateral.
The main type of collateral obtained are as follows:
a. for corporate lending – Government guarantees, mortgages over immovable and movable fixed assets, inventory, corporate and personal guarantees
b. for retail lending – mortgage over residential property, gold, personal guarantees, vehicles.
Concentration of credit risk by product and sector
The Bank monitors the concentration of credit risk by product and sectors. An analysis of concentration risk of the Bank portfolio (Loans and receivables to other customers) is given below:
Concentration by product
Bank Group
As at 31 December 2017Rs. ’000
2016Rs. ’000
2017Rs. ’000
2016Rs. ’000
Loans and receivables to other customersPawning 23,939,944 20,852,188 23,939,944 20,852,188 Staff loans 5,057,767 4,090,448 5,057,767 4,090,448
Term loans – Short term 684,797 – 684,797 – Long term 321,221,287 257,549,045 321,221,287 257,549,045 Securities purchased under resale agreements 2,826,289 2,496,838 1,282,516 1,698,017
Others –Securitisation/Trust certificates 3,083,997 2,695,185 3,083,997 2,695,185 Loan to Government 2,075,000 2,075,000 2,075,000 2,075,000 Others 3,719,127 3,950,010 3,719,127 3,950,010
Gross total 362,608,207 293,708,714 361,064,434 292,909,893

356
National Savings Bank Annual Report 2017
Notes to the Financial Statements
48. Financial risk management (contd.)48. Financial risk management (contd.)
48.2 Broad risk categories in focus (contd.)
Concentration by sector
Bank Group
As at 31 December 2017Rs. ’000
2016Rs. ’000
2017Rs. ’000
2016Rs. ’000
Loans and receivables to other customersAgriculture and fishing 14,282,395 10,869,217 14,282,395 10,869,217 Manufacturing 505,113 505,113 505,113 505,113 Tourism 49,042 81,090 49,042 81,090 Transport 1,042,138 983,022 1,042,138 983,022 Construction/housing 67,530,740 65,006,143 67,530,740 65,006,143 Traders 1,239,568 1,237,814 1,239,568 1,237,814 Financial and business services 10,169,034 6,899,422 10,169,034 6,899,422 Infrastructure –
Road development and others 76,080,169 60,412,604 76,080,169 60,412,604 Power and energy 8,525,567 10,254,573 8,525,567 10,254,573
Other servicesEducation 31,844,099 23,701,503 31,844,099 23,701,503
Other customers –Government 2,075,000 2,075,000 2,075,000 2,075,000 Personal/pawning/others 149,265,341 111,683,213 147,721,568 110,884,392
Gross total 362,608,207 293,708,714 361,064,434 292,909,893
Credit quality by classes of financial assets
As at 31 December 2017 Neither past duenor impaired
Rs. ’000
Past due butnot impaired
Rs. ’000
Individuallyimpaired
Rs. ’000
Total
Rs. ’000
AssetsCash and cash equivalents 3,849,627 – – 3,849,627 Placements with banks 23,438,104 – – 23,438,104 Derivative financial instruments 1,360,714 – – 1,360,714 Other financial assets – held for trading 6,472,314 – – 6,472,314 Loans and receivables to banks 27,714,565 – – 27,714,565 Loans and receivables to other customers (gross)* 335,414,770 27,193,437 – 362,608,207 Financial investments – available for sale 5,693,829 – – 5,693,829 Financial investments – held to maturity 544,273,077 – – 544,273,077
948,216,999 27,193,437 – 975,410,436
* Collectively assessed for the impairment.

357
National Savings Bank Annual Report 2017
Notes to the Financial Statements
48. Financial risk management (contd.)48. Financial risk management (contd.)
48.2 Broad risk categories in focus (contd.)
Aging analysis of past due (i.e., facilities in arrears of 1 day and above) but not impaired loans, by class of financial assets.
Past due but not impaired
As at 31 December 2017 1 to 30 days
Rs. ’000
31 to 60 days
Rs. ’000
61 to 89 days
Rs. ’000
More than 90 days
Rs. ’000
Total
Rs. ’000
Loans and receivables to other customers (gross) 18,897,148 4,101,928 1,052,673 3,141,688 27,193,437
69% 15% 4% 12% 100%
Credit quality by class of financial assets
As at 31 December 2016 Neither past duenor impaired
Rs. ’000
Past due butnot impaired
Rs. ’000
IndividuallyimpairedRs. ’000
Total
Rs. ’000
AssetsCash and cash equivalents 4,619,699 – – 4,619,699 Placements with banks 19,013,572 – – 19,013,572 Derivative financial instruments 2,728,445 – – 2,728,445 Other financial assets – held for trading 20,290,588 – – 20,290,588 Loans and receivables to banks 31,834,072 – – 31,834,072 Loans and receivables to other customers (gross)* 268,252,090 25,456,624 – 293,708,714 Financial investments – available for sale 6,227,764 – – 6,227,764 Financial investments – held to maturity 505,824,398 – – 505,824,398
858,790,628 25,456,624 – 884,247,252
* Collectively assessed for the impairment.
Aging analysis of past due (i.e., facilities in arrears of 1 day and above) but not impaired loans, by class of financial assets.
Past due but not impaired
As at 31 December 2016 1 to 30 daysRs. ’000
31 to 60 daysRs. ’000
61 to 89 daysRs. ’000
More than 90 daysRs. ’000
TotalRs. ’000
Loans and receivables to other customers (gross) 15,572,198 4,029,783 466,969 5,387,675 25,456,624
61% 16% 2% 21% 100%

358
National Savings Bank Annual Report 2017
Notes to the Financial Statements
48. Financial risk management (contd.)48. Financial risk management (contd.)
48.2 Broad risk categories in focus (contd.)
(b) Liquidity risk
Liquidity risk is the Bank’s inability to meet “on” or “off ” balance sheet contractual and contingent financial obligations as they fall due, without incurring material losses.
Concentration of liquid assets
The Bank’s regulatory requirement to invest 60% of its deposits in Government Securities forces the Bank to maintain a high Statutory Liquid Assets Ratio. Currently, the Bank maintains a liquidity ratio at 73.4% which is well above the statutory requirement of 20%. The investment in Government Securities represents 88.4% from the total liquid assets of the Bank.
Bank Group
As at 31 December 2017Rs. ’000
2016Rs. ’000
2017Rs. ’000
2016Rs. ’000
Liquidly assets ratio –Year end 73.4 72.6 – – 30 June 74.1 75.2 – – Year beginning 72.6 81.1 – –
Gross loans and receivables to deposit 52.9 49.5 52.8 49.4
Net loans and receivables to total assets 38.3 35.5 38.0 35.0
(c) Market risk
Market risk to the Bank stems from movements in market prices, in particular, changes in interest rates, foreign exchange rates and equity prices. Market risk is often propagated by other forms of financial risk such as credit and market liquidity risk. The risk of losses would arise from on-balance sheet as well as off-balance sheet activities.
Sources of market risk to NSB
The exposure to market risk arises to National Savings Bank from the following sources:
zz Treasury securities portfolio (Government Securities and other permitted fixed income securities) zz Repo and reverse repo transaction zz Bank’s operations in foreign currency zz Equity investments zz Derivatives zz Rate sensitive assets liabilities mismatch
(i) Foreign exchange risk
Foreign exchange risk (also known as exchange rate risk or currency risk) is a financial risk posed by an exposure to unanticipated changes in the exchange rate between two currencies. The Bank has entered in to swap and forward foreign exchange contract to minimise the foreign exchange risk (refer Note 19).

359
National Savings Bank Annual Report 2017
Notes to the Financial Statements
48. Financial risk management (contd.)48. Financial risk management (contd.)
48.2 Broad risk categories in focus (contd.)
(ii) Equity risk
Equity risk is the risk that one’s investments will depreciate because of stock market dynamic causing one to lose money.
The investment in equity represents 0.7% of the total assets while investments in quoted and unquoted equity are 0.6% and 0.1% respectively. Hence, the Bank does not have a major exposure to equity risk. However, the adverse movements in the stock market affected the return on equity investments. The investment in unquoted companies are made due to policy decisions on market and economic development and strategic reasons.
(iii) Interest rate risk
Interest rate risk is the risk that an investment’s value will change in the absolute level of interest rates, in the spread between two rates, in the shape of the yield curve or in any other interest rate relationships. The Bank’s major source of funding is deposits which represent 73.2% of total on-balance sheet liabilities. of this, 25.5% represents savings deposits where 74.5% represents term deposits.
Bank’s interest rate sensitivity report as at 31 December 2017 is presented below:
Bank 0-1 monthRs. ’000
0-3 monthsRs. ’000
0-6 monthsRs. ’000
0-12 monthsRs. ’000
Interest bearing assets 24,623,909 55,545,413 117,380,701 317,160,492Bank balances and placements 1,008,772 5,089,312 11,196,556 23,820,867Other financial assets – held for trading 1,840 91,793 112,824 243,775Loans and receivables to bank 2,852,671 3,056,673 3,133,604 9,672,848Loans and receivables to other customers 14,598,625 22,722,801 33,705,077 90,557,830Financial investments – available for sale – 942 1,173,177 1,173,177Financial investments – held to maturity 6,162,001 24,583,892 68,059,463 191,691,995
Interest bearing liabilities 199,860,658 456,013,831 585,765,770 901,999,449
Due to banks 180,439 180,439 180,439 180,439Due to other customers 141,589,236 391,222,111 520,951,317 722,143,176Other borrowings 58,090,983 64,611,281 64,627,603 179,669,423Subordinated liabilities – – 6,411 6,411
Net rate sensitive assets (liabilities) (175,236,749) (400,468,418) (468,385,069) (584,838,957)
Interest rate sensitivity ratio (%) 12 12 20 35

360
National Savings Bank Annual Report 2017
Notes to the Financial Statements
48. Financial risk management (contd.)48. Financial risk management (contd.)
48.2 Broad risk categories in focus (contd.)
Group’s interest rate sensitivity report as at 31 December 2017 is presented below:
Group 0-1 monthRs. ’000
0-3 monthsRs. ’000
0-6 monthsRs. ’000
0-12 monthsRs. ’000
Interest bearing assets 24,733,224 55,873,361 118,297,374 317,688,693 Bank balances and placements 1,008,772 5,089,312 11,196,556 23,820,867 Other financial assets – held for trading 11,055 119,439 362,206 936,629 Loans and receivables to bank 2,938,228 3,313,343 3,390,273 9,929,518 Loans and receivables to other customers 14,601,636 22,731,835 33,718,484 89,014,056 Financial investments – available for sale – 942 1,258,300 1,428,546 Financial investments – held to maturity 6,173,533 24,618,490 68,371,555 192,559,077
Interest bearing liabilities 201,826,112 460,344,267 590,474,124 907,463,634
Due to banks 918,412 828,433 828,433 828,433 Due to other customers 141,589,236 391,222,111 520,951,317 722,143,176 Other borrowings 59,318,464 68,293,723 68,687,963 184,485,614 Subordinated liabilities – – 6,411 6,411
Net rate sensitive assets (liabilities) (177,092,888) (404,470,906) (472,176,750) (589,774,941)
Interest rate sensitivity ratio (%) 12 12 20 35
Bank’s interest rate sensitivity report as at 31 December 2016 is presented below:
Bank 0-1 monthRs. ’000
0-3 monthsRs. ’000
0-6 monthsRs. ’000
0-12 monthsRs. ’000
Interest bearing assets 39,406,492 67,316,653 150,571,506 209,818,308 Bank balances and placements 6,078,068 7,918,434 11,247,714 21,224,972 Other financial assets – held for trading 139,446 799,686 1,246,754 2,332,650 Loans and receivables to bank 2,839,753 3,122,269 4,344,333 12,389,001 Loans and receivables to other customers 11,439,739 17,663,032 26,793,434 54,413,298 Financial investment – available for sale 22,800 70,422 82,383 82,383 Financial investment – held to maturity 18,886,686 37,742,810 106,856,888 119,376,004
Interest bearing liabilities 153,559,463 401,743,980 524,858,634 689,298,959
Due to banks 115,391 115,391 115,391 115,391 Due to other customers 121,412,238 359,588,812 469,593,750 631,721,042 Other borrowings 32,031,834 42,039,777 55,143,082 57,456,115 Subordinated liabilities – – 6,411 6,411
Net rate sensitive assets (liabilities) (114,152,971) (334,427,327) (374,287,128) (479,480,651)
Interest rate sensitivity ratio (%) 26 17 29 30
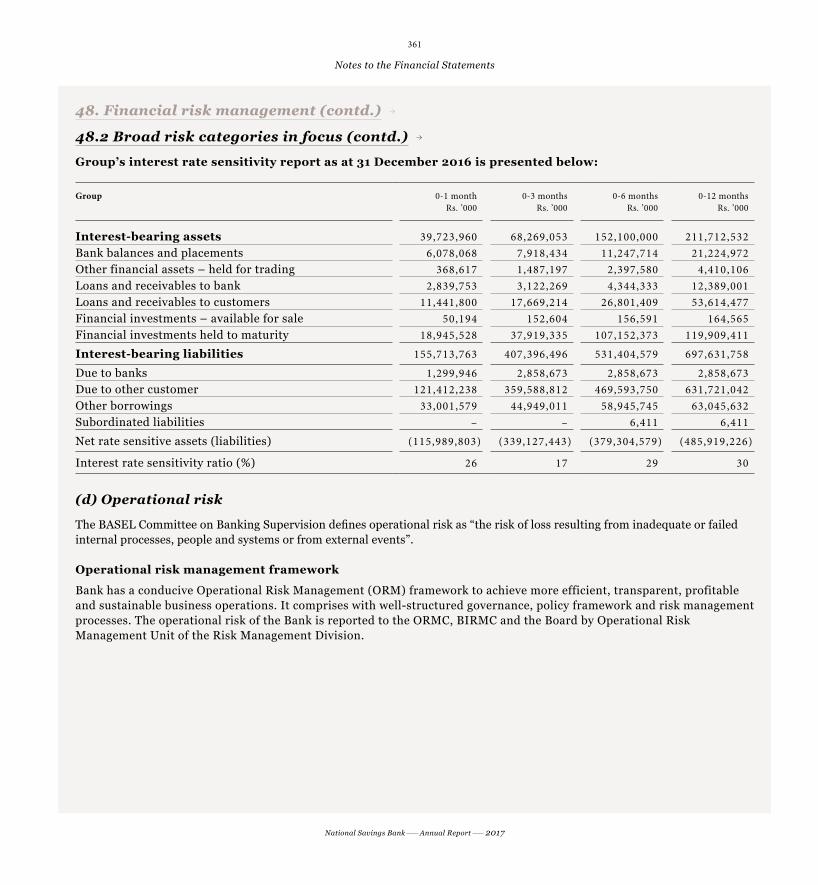
361
National Savings Bank Annual Report 2017
Notes to the Financial Statements
48. Financial risk management (contd.)48. Financial risk management (contd.)
48.2 Broad risk categories in focus (contd.)
Group’s interest rate sensitivity report as at 31 December 2016 is presented below:
Group 0-1 monthRs. ’000
0-3 monthsRs. ’000
0-6 monthsRs. ’000
0-12 monthsRs. ’000
Interest-bearing assets 39,723,960 68,269,053 152,100,000 211,712,532 Bank balances and placements 6,078,068 7,918,434 11,247,714 21,224,972 Other financial assets – held for trading 368,617 1,487,197 2,397,580 4,410,106 Loans and receivables to bank 2,839,753 3,122,269 4,344,333 12,389,001 Loans and receivables to customers 11,441,800 17,669,214 26,801,409 53,614,477 Financial investments – available for sale 50,194 152,604 156,591 164,565 Financial investments held to maturity 18,945,528 37,919,335 107,152,373 119,909,411
Interest-bearing liabilities 155,713,763 407,396,496 531,404,579 697,631,758
Due to banks 1,299,946 2,858,673 2,858,673 2,858,673 Due to other customer 121,412,238 359,588,812 469,593,750 631,721,042 Other borrowings 33,001,579 44,949,011 58,945,745 63,045,632 Subordinated liabilities – – 6,411 6,411
Net rate sensitive assets (liabilities) (115,989,803) (339,127,443) (379,304,579) (485,919,226)
Interest rate sensitivity ratio (%) 26 17 29 30
(d) Operational risk
The BASEL Committee on Banking Supervision defines operational risk as “the risk of loss resulting from inadequate or failed internal processes, people and systems or from external events”.
Operational risk management framework
Bank has a conducive Operational Risk Management (ORM) framework to achieve more efficient, transparent, profitable and sustainable business operations. It comprises with well-structured governance, policy framework and risk management processes. The operational risk of the Bank is reported to the ORMC, BIRMC and the Board by Operational Risk Management Unit of the Risk Management Division.

362
National Savings Bank Annual Report 2017
Notes to the Financial Statements
49. Maturity analysis49. Maturity analysis
Bank Up to 3 months
Rs. ’000
3 - 12 months
Rs. ’000
1 - 3 years
Rs. ’000
3 - 5 years
Rs. ’000
More than 5 years
Rs. ’000
Total as at 31.12.2017
Rs. ’000
Total as at 31.12.2016
Rs. ’000
Assets with contractual maturity (interest-bearing asset)Cash and cash equivalents 382,763 – – – – 382,763 2,211,401 Placements with banks 4,706,549 18,731,555 – – – 23,438,104 19,013,572 Other financial assets – held for trading 91,793 151,982 535,258 3,335,945 – 4,114,978 17,194,677 Financial investments – available for sale 942 1,172,235 – 26,045 53,657 1,252,878 2,104,032 Loans and receivables to banks 3,056,673 6,616,175 17,241,717 800,000 – 27,714,565 31,834,072 Loans and receivables to other customers 22,722,801 67,835,029 83,264,461 57,112,104 129,375,471 360,309,866 291,976,942 Financial investments – held to maturity 24,583,892 167,108,102 77,891,419 93,900,259 180,789,405 544,273,077 505,824,398
55,545,413 261,615,078 178,932,855 155,174,353 310,218,533 961,486,232 870,159,094
Other asset (non-interest-bearing asset)Cash and cash equivalents 3,466,864 – – – – 3,466,864 2,408,298 Balances with central banks – – – – – – – Derivative financial instruments 650 1,360,064 – – – 1,360,714 2,728,445 Other financial assets – held for trading 589,334 1,768,002 – – – 2,357,336 3,095,911 Financial investments – available for sale – – – – 4,440,951 4,440,951 4,123,732 Investments in subsidiaries – – – – 900,000 900,000 150,000 Property, plant and equipment – – – – 12,015,376 12,015,376 7,119,651 Intangible assets – – – – 380,308 380,308 157,271 Other assets 712,063 7,168,611 7,173,278 5,004,266 5,637,471 25,695,689 21,761,440
4,768,911 10,296,677 7,173,278 5,004,266 23,374,106 50,617,238 41,544,748
Total asset 60,314,324 271,911,755 186,106,133 160,178,619 333,592,639 1,012,103,470 911,703,842
Liabilities with contractual maturity (interest-bearing liability)Due to banks 180,439 – – – – 180,439 115,391 Due to other customers 391,222,111 330,921,064 8,725,472 4,138,492 2,205,501 737,212,640 657,280,315 Other borrowings 64,611,281 115,058,141 38,286,355 – – 217,955,777 207,039,909 Subordinated liabilities – 6,411 – 6,000,000 – 6,006,411 6,006,411
456,013,831 445,985,616 47,011,827 10,138,492 2,205,501 961,355,267 870,442,026
Other liabilities (non-interest-bearing liability)Current tax liabilities 956,937 – – – – 956,937 – Deferred tax liabilities – – – – 507,063 507,063 416,180 Other liabilities 2,288,755 2,500,117 480,835 474,946 3,317,771 9,062,425 8,600,056 State capital/assigned capital – – – – 6,700,000 6,700,000 6,200,000 Statutory reserve fund – – – – 3,002,952 3,002,952 2,522,467 Other reserves – – – – 28,289,941 28,289,941 21,143,806 Retained earnings – – – – 2,228,885 2,228,885 2,379,307
3,245,692 2,500,117 480,835 474,946 44,046,612 50,748,203 41,261,816
Total liabilities 459,259,523 448,485,733 47,492,662 10,613,438 46,252,113 1,012,103,470 911,703,842

363
National Savings Bank Annual Report 2017
Notes to the Financial Statements
49. Maturity analysis (contd.)49. Maturity analysis (contd.)
Group Up to 3 months
Rs. ’000
3 - 12 months
Rs. ’000
1 - 3 years
Rs. ’000
3 - 5 years
Rs. ’000
More than 5 years
Rs. ’000
Total as at 31.12.2017
Rs. ’000
Total as at 31.12.2016
Rs. ’000
Assets with contractual maturity (interest-bearing asset)Cash and cash equivalents 382,763 – – – – 382,763 2,211,401 Placements with banks 4,706,549 18,731,555 – – – 23,438,104 19,013,572 Other financial assets – held for trading 119,439 817,191 966,361 4,433,644 695,979 7,032,614 24,207,296 Financial investments – available for sale 942 1,427,604 744,564 865,955 232,836 3,271,901 3,997,784 Loans and receivables to banks 3,313,342 6,616,175 17,241,717 800,000 – 27,971,234 31,834,072 Loans and receivables to other customers 22,731,835 66,282,222 83,264,461 57,112,104 129,375,471 358,766,093 291,178,121 Financial investments – held to maturity 24,618,490 167,940,586 78,430,928 95,273,989 181,660,397 547,924,390 507,624,954
55,873,360 261,815,333 180,648,031 158,485,692 311,964,683 968,787,100 880,067,200
Other asset (non-interest-bearing asset)Cash and cash equivalents 3,471,323 – – – – 3,471,323 2,416,228 Balances with central banks 94 – – – – 94 477 Derivative financial instruments 650 1,360,064 – – – 1,360,714 2,728,445 Other financial assets – held for trading 589,334 1,768,002 – – – 2,357,336 3,095,911 Financial investments – available for sale – – – – 4,441,951 4,441,951 4,124,732 Property, plant and equipment – – – – 12,018,679 12,018,679 7,121,823 Intangible assets – – – – 380,655 380,655 157,271 Deferred tax assets – – – – – – 588 Other assets 855,666 7,196,866 7,282,677 5,004,266 5,637,470 25,976,944 21,890,777
4,917,067 10,324,932 7,282,677 5,004,266 22,478,755 50,007,697 41,536,253
Total asset 60,790,427 272,140,265 187,930,708 163,489,958 334,443,438 1,018,794,797 921,603,453
Liabilities with contractual maturity (interest-bearing liability)Due to banks 828,433 – – – – 828,433 2,858,673 Due to other customers 391,222,111 330,921,064 8,725,472 4,138,492 2,205,501 737,212,640 657,280,315 Other borrowings 68,293,723 116,191,891 38,286,355 – – 222,771,969 212,629,427 Subordinated liabilities – 6,411 – 6,000,000 – 6,006,411 6,006,411
460,344,267 447,119,366 47,011,827 10,138,492 2,205,501 966,819,453 878,774,826
Other liabilities (non-interest-bearing liability)Derivative liabilities 956,937 – – – – 956,937 – Current tax liabilities – 137,344 – – – 137,344 17,153 Deferred tax liabilities – – – – 507,138 507,138 416,180 Other liabilities 2,301,971 2,530,702 480,835 474,946 3,319,006 9,107,460 8,608,506 State capital/assigned capital – – – – 6,700,000 6,700,000 6,200,000 Statutory reserve fund – – – – 3,002,952 3,002,952 2,522,467 Other reserves – – – – 28,757,786 28,757,786 21,355,707 Retained earnings – – – – 2,805,727 2,805,727 3,708,614
3,258,908 2,668,046 480,835 474,946 45,092,609 51,975,344 42,828,627
Total liabilities 463,603,175 449,787,412 47,492,662 10,613,438 47,298,110 1,018,794,797 921,603,453

364
National Savings Bank Annual Report 2017
Notes to the Financial Statements
50. Fair value of financial instruments50. Fair value of financial instruments
50.1 Financial instruments recorded at fair value
Accounting policy
The following is a description of how fair values are determined for financial instruments that are recorded at fair value The following is a description of how fair values are determined for financial instruments that are recorded at fair value using valuation techniques. These incorporate the Group's estimate of assumptions that a market participant would make using valuation techniques. These incorporate the Group's estimate of assumptions that a market participant would make when valuing the instruments.when valuing the instruments.
Derivativesi. Forward exchange purchasesBank value the forward exchange purchase contracts using the quoted prices available for similar contract for the market.
ii. Foreign currency swapsDerivative products (Foreign Currency swaps/Cash Flow Hedges) valued using valuation techniques incorporating various inputs such as foreign exchange spot rates and foreign exchange forward rates.
Financial assets held for tradingi. Government Treasury Bills and BondsFinancial assets held for trading are valued using a valuation technique consists of Government Treasury Bills and Treasury Bonds. The Bank values the securities using discounted cash flow valuation models which incorporate observable data. Observable inputs include assumptions regarding current rates of interest, broker statements and market data publishing by Central Bank of Sri Lanka.
ii. Equity securitiesThe Bank values the equity securities using the quoted prices available for the identical securities in active market.
Financial assets available for salesThe Bank values the quoted equity securities using the quoted prices available for the identical securities in active market.
The unquoted equity securities have been fair valued using a valuation model based on observable data.
50.2 Determination of fair value and fair value hierarchy
The Bank uses the following hierarchy for determining and disclosing the fair value of financial instruments by valuation technique:
Level 1: Quoted (unadjusted) price in active markets for identical assets or liabilities.
Level 2: Other techniques for which all inputs which have a significant effect on the recorded fair value are observable, either directly or indirectly.
Level 3: Techniques which use inputs that have a significant effect on the recorded fair value that are not based on observable market data.

365
National Savings Bank Annual Report 2017
Notes to the Financial Statements
50. Fair value of financial instruments (contd.)50. Fair value of financial instruments (contd.)
50.2 Determination of fair value and fair value hierarchy (contd.)
The following table shows an analysis of financial instruments recorded at fair value by level of the fair value hierarchy:
Bank
As at 31 December 2017 Level 1Rs. ’000
Level 2Rs. ’000
Level 3Rs. ’000
TotalRs. ’000
Derivative financial instruments Forward exchange purchases 650 – – 650 Foreign currency swaps – – 1,360,064 1,360,064
Financial assets – held for trading Government Treasury Bills and Bonds 4,114,978 – – 4,114,978 Equity securities 2,357,336 – – 2,357,336
Available for sale Equity securities – quoted 3,876,570 – – 3,876,570 Other investments – Government Securities 1,252,878 – – 1,252,878 Equity securities – unquoted – 506,890 – 506,890
Total financial assets 11,602,412 506,890 1,360,064 13,469,366
Bank
As at 31 December 2016 Level 1Rs. ’000
Level 2Rs. ’000
Level 3Rs. ’000
TotalRs. ’000
Derivative financial instruments Forward exchange purchases 27,750 – – 27,750 Foreign currency swaps – – 2,700,695 2,700,695
Financial assets – held for trading Government Treasury Bills and Bonds 17,194,677 – – 17,194,677 Equity securities 3,095,911 – – 3,095,911
Available for sale Equity securities – quoted 3,332,148 – – 3,332,148 Other investment – Government Securities 2,104,031 – – 2,104,031
Equity securities – unquoted – 734,094 – 734,094
Total financial assets 25,754,518 734,094 2,700,695 29,189,306

366
National Savings Bank Annual Report 2017
Notes to the Financial Statements
50. Fair value of financial instruments (contd.)50. Fair value of financial instruments (contd.)
50.2 Determination of fair value and fair value hierarchy (contd.)
Group
As at 31 December 2017 Level 1Rs. ’000
Level 2Rs. ’000
Level 3Rs. ’000
TotalRs. ’000
Derivative financial instruments Forward exchange purchases 650 – – 650 Foreign currency swaps – – 1,360,064 1,360,064
Financial assets – held for trading Government Treasury Bills and Bonds 7,032,614 – – 7,032,614 Equity securities 2,357,336 – – 2,357,336
Available for sale Equity securities – quoted 3,876,570 – – 3,876,570 Debt securities – debenture – 199,920 – 199,920 Other investment – Government Securities 3,071,981 – – 3,071,981 Equity securities – unquoted – 506,890 – 506,890
Total financial assets 16,339,150 706,810 1,360,064 18,406,025
Group
As at 31 December 2016 Level 1Rs. ’000
Level 2Rs. ’000
Level 3Rs. ’000
TotalRs. ’000
Derivative financial instruments Forward exchange purchases 27,750 – – 27,750 Foreign currency swaps – – 2,700,695 2,700,695
Financial assets – held for trading Government Treasury Bills and Bonds 24,207,296 – – 24,207,296 Equity securities 3,095,911 – – 3,095,911
Available for sale Equity securities – quoted 3,332,148 – – 3,332,148 Debt securities – debenture – 199,839 – 199,839 Other Investment – Government Securities 3,797,944 – – 3,797,944 Equity securities – unquoted – 734,094 – 734,094
Total financial assets 34,461,049 933,933 2,700,695 38,095,677

367
National Savings Bank Annual Report 2017
Notes to the Financial Statements
50. Fair value of financial instruments (contd.)50. Fair value of financial instruments (contd.)
50.3 Fair value of financial instruments – Bank
As at 31 December 2017 2016
Carrying amountRs. ’000
Fair valueRs. ’000
Carrying amountRs. ’000
Fair valueRs. ’000
Financial assetsCash and cash equivalents 3,849,627 3,849,627 4,619,699 4,619,699 Balances with central banks – – – – Placement with banks 23,438,104 23,438,104 19,013,572 19,013,572 Derivative financial instruments 1,360,714 1,360,714 2,728,445 2,728,445 Other financial assets – held for trading 6,472,314 6,472,314 20,290,588 20,290,588 Loans and receivable to banks 27,714,565 27,579,470 31,834,072 30,571,117 Loans and receivable to other customers 360,309,866 360,506,041 291,976,942 289,348,586 Financial investments – available for sale 5,693,829 5,693,829 6,227,764 6,227,764 Financial investments – held to maturity 544,273,077 543,880,618 505,824,398 474,362,481
Total financial assets 973,112,095 972,780,717 882,515,480 847,162,253
Financial liabilitiesDue to banks 180,439 180,439 115,391 115,391 Derivative financial instruments 956,937 956,937 – – Due to other customers 737,212,640 735,574,071 657,280,315 655,297,898 Other borrowings 217,955,777 217,955,777 207,039,909 207,039,909
Subordinated liabilities 6,006,411 6,006,411 6,006,411 6,006,411
Total financial liabilities 962,312,203 960,673,636 870,442,026 868,459,609
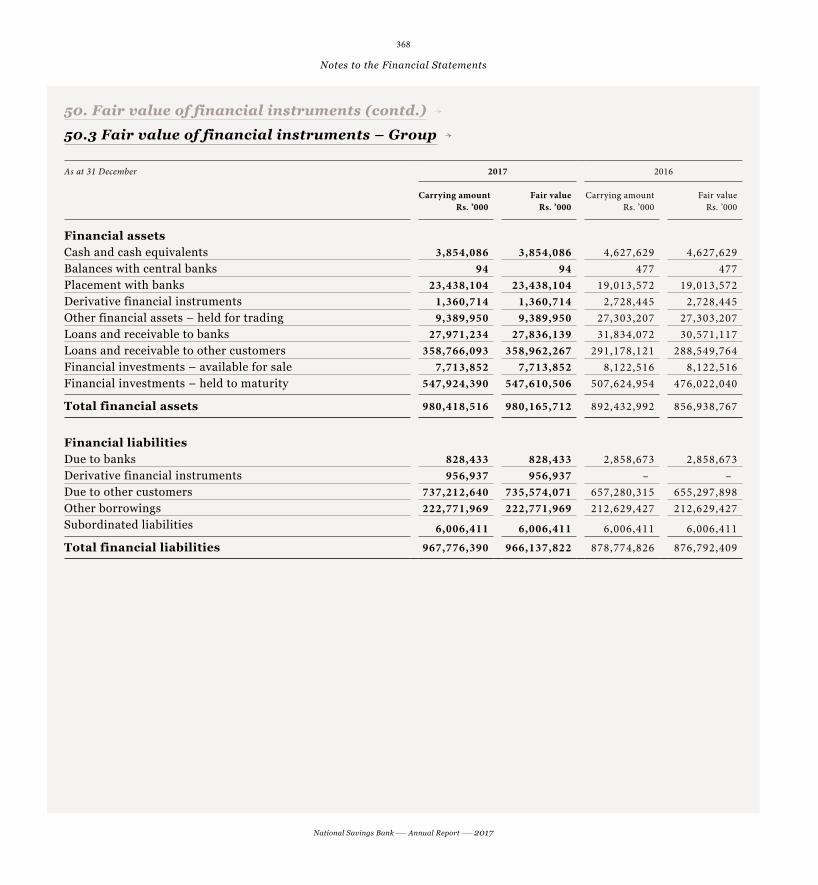
368
National Savings Bank Annual Report 2017
Notes to the Financial Statements
50. Fair value of financial instruments (contd.)50. Fair value of financial instruments (contd.)
50.3 Fair value of financial instruments – Group
As at 31 December 2017 2016
Carrying amountRs. ’000
Fair valueRs. ’000
Carrying amountRs. ’000
Fair valueRs. ’000
Financial assetsCash and cash equivalents 3,854,086 3,854,086 4,627,629 4,627,629 Balances with central banks 94 94 477 477 Placement with banks 23,438,104 23,438,104 19,013,572 19,013,572 Derivative financial instruments 1,360,714 1,360,714 2,728,445 2,728,445 Other financial assets – held for trading 9,389,950 9,389,950 27,303,207 27,303,207 Loans and receivable to banks 27,971,234 27,836,139 31,834,072 30,571,117 Loans and receivable to other customers 358,766,093 358,962,267 291,178,121 288,549,764 Financial investments – available for sale 7,713,852 7,713,852 8,122,516 8,122,516 Financial investments – held to maturity 547,924,390 547,610,506 507,624,954 476,022,040
Total financial assets 980,418,516 980,165,712 892,432,992 856,938,767
Financial liabilitiesDue to banks 828,433 828,433 2,858,673 2,858,673 Derivative financial instruments 956,937 956,937 – – Due to other customers 737,212,640 735,574,071 657,280,315 655,297,898
Other borrowings 222,771,969 222,771,969 212,629,427 212,629,427 Subordinated liabilities 6,006,411 6,006,411 6,006,411 6,006,411
Total financial liabilities 967,776,390 966,137,822 878,774,826 876,792,409
369
National Savings Bank Annual Report 2017
Notes to the Financial Statements
50. Fair value of financial instruments (contd.)50. Fair value of financial instruments (contd.)
50.4 Determination of fair value and fair value hierarchy
Fair value of financial assets and liabilities not carried at fair value
The following describes the methodologies and assumptions used to determine the fair values for those financial instruments which are not recorded at faire value in the Financial Statements.
Assets for which fair value approximates carrying value
For financial assets and financial liabilities that have a short-term maturity (original maturities less than a year). It is assumed that the carrying amount approximate their fair values. This assumption is also applied to savings deposits without specific maturity.
Long-term deposits accepted from customers for which periodical interest is paid and loans and receivables granted to customers with a variable rate are also considered to be carried at fair value in the books.
Fixed rate financial instruments
Carrying amounts are considered as fair values for short-term credit facilities. In fair valuing held-to-maturity securities, rates published by the CBSL for similar trading securities were used. Loans and receivables with fixed interest rates were fair valued using market rates at which fresh loans were granted during the fourth quarter of the reporting year. Conversely, fixed deposits with original tenure above one year and interest paid at maturity were discounted using current market rates offered to customers during the fourth quarter of the reporting year.
51. Capital management (as per regulatory reporting)51. Capital management (as per regulatory reporting)
Objective
The Bank is required to manage its capital in order to meet the regulatory requirements and hold sufficient capital buffers to meet the strategic objectives which are aligned with the risk appetite of the Bank.
Regulatory capital
Central Bank of Sri Lanka sets and monitors regulatory capital requirement on both consolidated and solo basis. Basel II guidelines were revoked and with effect from 1 July 2017, the Bank is required to comply with the provisions of the Basel III Direction in respect of regulatory capital and capital to cover any additional risk. The Basel III capital regulations, which are planned to be implemented on a staggered basis by 2019 starting from mid-2017, will continue to be based on the three-mutually reinforcing Pillars introduced under Basel II, i.e., minimum capital requirement, supervisory review process and market discipline.
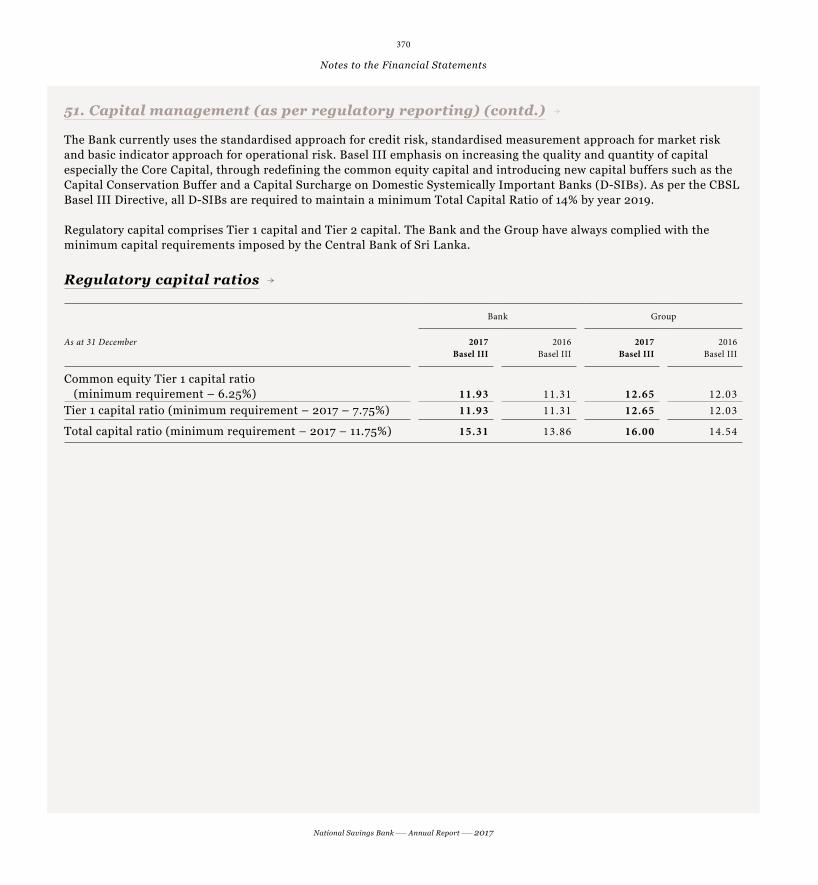
370
National Savings Bank Annual Report 2017
Notes to the Financial Statements
The Bank currently uses the standardised approach for credit risk, standardised measurement approach for market risk and basic indicator approach for operational risk. Basel III emphasis on increasing the quality and quantity of capital especially the Core Capital, through redefining the common equity capital and introducing new capital buffers such as the Capital Conservation Buffer and a Capital Surcharge on Domestic Systemically Important Banks (D-SIBs). As per the CBSL Basel III Directive, all D-SIBs are required to maintain a minimum Total Capital Ratio of 14% by year 2019. Regulatory capital comprises Tier 1 capital and Tier 2 capital. The Bank and the Group have always complied with the minimum capital requirements imposed by the Central Bank of Sri Lanka.
Regulatory capital ratios
Bank Group
As at 31 December 2017Basel III
2016Basel III
2017Basel III
2016Basel III
Common equity Tier 1 capital ratio (minimum requirement – 6.25%) 11.93 11.31 12.65 12.03Tier 1 capital ratio (minimum requirement – 2017 – 7.75%) 11.93 11.31 12.65 12.03
Total capital ratio (minimum requirement – 2017 – 11.75%) 15.31 13.86 16.00 14.54
51. Capital management (as per regulatory reporting) (contd.)51. Capital management (as per regulatory reporting) (contd.)

Supplementary Information
Products and Services – 372
Statement of Comprehensive Income in US Dollars – 376
Statement of Financial Position in US Dollars – 378
Basel III Disclosures as per Schedule III of Banking Act Direction No. 1 of 2016 – 379
Other Disclosure Requirements – 392
Statistical Indicators 2008–2017 – 397
Analysis of Deposits – 399
GRI Content Index – 400
Correspondent Banks – 404
Exchange Companies – 405
Eurogiro Members – 407
Glossary of Financial and Banking Terms – 408
Corporate Information – 412

372
National Savings Bank Annual Report 2017
Products and ServicesProducts and Services1. Deposit Product Portfolio1. Deposit Product Portfolio
Savings Products
Ordinary Savings Account
The Bank offers ordinary savings accounts to anyone aged over seven years, with a minimum deposit of Rs. 100.00. An account holder can make deposits or withdrawals at NSB branch or through SMS/Internet-banking facility.
“Hapan” Children’s Savings Account
The “Hapan” and “Punchi Hapan” are children’s savings accounts designed for those between the ages of 8-16 and 1-7 years, respectively. Deposits in both the said accounts are paid a 1% more interest than what the Bank pays to other savings accounts.
“Ithuru Mithuru” Savings Account
The “Ithuru Mithuru” savings account is a savings scheme designed for the purpose of fostering the habit of savings in youth aged between 16-30 years, and the Bank offers it 0.5% more interest than what it pays for an ordinary savings account. A customer who saves with an “Ithuru Mithuru” account can enjoy this higher interest rate up until he/she reaches the age of 35.
“Sthree” Savings Account
The “Sthree” savings account is designed specifically for women who play different roles in life aged over 16 years with more privileges to celebrate the achievements of life and lend a hand to shoulder their responsibilities to transform them as heiress to a better tomorrow. Sthree account holder entitles to a 1% interest rate reduction on pawning advances and now the reduction has been extended to the Eco/Personal/Buddhi loans as well, and these loans are now referred to as “Diriya Sthree Loans”.
“NSB Pension +” Account
The “NSB Pension +” is a contributory pension scheme that allows holders to invest any amount into the account over a period of time, or make a lump sum investment. With a minimum balance of Rs. 100,000.00 in the account, account holder will start receiving a pension, upon reaching the age of 55 years.
“Happy” Savings Account
With a “Happy” Savings Account, the more you save; the higher the interest you will be paid, up to maximum of 7% interest offers with absolutely no restrictions on withdrawals. This account can be opened by anyone aged over 16 years, with a minimum initial deposit of Rs. 1,000.00.
“Smile” Savings Account
Any person above the age of 16 years can open and operate a “Smile” account either individually or jointly. This account can be opened with an initial deposit of Rs. 100.00. Deposits and withdrawals can be made at any NSB branch or Post-Sub Post Office, islandwide.
“Pas Avurudu” Savings Account
This is a high interest-bearing NSB savings scheme for customers of all ages who prefer long term savings plans. A customer has to continually make a monthly deposit of Rs. 100.00/200.00/300.00/400.00/500.00 or any multiple of Rs. 1,000.00, over a 60 month period, on any convenient day in a given calendar month.
Term Deposits
The Bank also accepts tenure-based deposits of fixed amounts for different maturity periods. A term deposit customer may withdraw his/her money before the expiry of the relevant maturity period in accordance with the applicable premature rates. Tenures range from three months to five years, and they indeed are targeted at children, senior citizens, societies and corporates.
Fixed Deposits (FDs)
Any person of over 16 years of age can open a NSB Fixed Deposit Account, either individually or jointly with someone, while parents/guardians can open and operate an account, on behalf a child, provided the child concerned is below 16 years old. The minimum amount required to open a 12-month FD is Rs. 1, 000.00, and if one wants to open a monthly-interest earning 12-month FD, then, the minimum
GRI 102-2

373
National Savings Bank Annual Report 2017
Products and Services
amount is the Rs. 25,000.00. Fixed Deposit Accounts can be opened for, 3/6/12/24/36 or 60-months maturity periods. What’s more, a FD customer can raise a loan against the deposit.
Gaurawa Fixed Deposits Account
Any Senior Citizen aged over 55 years can open a Gaurawa Fixed Deposit Account, which will earn for the customer a monthly interest, which will always be 0.5% above the rate paid to the Bank’s normal FD customer. The minimum deposit, a senior citizen can deposit in a Gaurawa FD Account is Rs. 25,000.00, while the maximum is Rs. 20 Mn.
Prarthana Children’s Savings Certificate
A long-term deposit scheme for kids with attractive interest rates paid in upfront. The “Prarthana” Savings Certificate matures when the account holder reaches 16 years of age.
Senior Citizens’ Special Fixed Deposit
It is a fixed deposit for senior citizens aged over 60 years. The maximum amount that can be deposited in a Senior Citizen’s Special Fixed Deposit is Rs. 1.5 Mn., while a holder of the deposit will earn 15% as interest, upon maturity.
Foreign Currency Savings Accounts/ Term Deposits
The Bank offers Personal Foreign Currency Accounts (PFCAs) to both resident and non-resident Sri Lankans. PFCAs can be opened by any Sri Lankan national employed abroad or by any resident citizen who is either in possession of foreign currency or is receiving foreign currency remittances. Inward Investment Accounts (IIAs) are on offer for Investment purpose.
2. Lending Portfolio2. Lending Portfolio
Retail Lending
Home/Property Loans
The Bank offers home loans to people who intent to construct, renovate, purchase or repair a home, to purchase a land to build a house on as well as to pay off a home loan
obtained from another financial institution. The following are the home loan products which are available for different customer segments:
z Ge Dora
z Alankara
z Home Loans for Government Employees
z Sonduru Piyasa – for low income groups
Personal Loans
The Bank offers personal loans to its customers for meeting the costs; associated with the purchase of consumer goods, healthcare, travel abroad, solar panels and education. The Bank obtains the security interest over properties such as primary mortgage of the borrower’s property, item purchased, surrender value of the borrowers’ life insurance policy or Government Securities they own. This loan is also available with personal guarantors. The repayment period and the amount of a loan are dependent on the nature of the collateral provided and the prospective borrower’s circumstances. The following personal loans are available:
z Normal Personal Loan
z Buddhi Loan
z Special Pension Loan
z Charika Loan
z Eco Loan
Auto Loan
Auto Loans are granted to purchase unregistered vehicle, and registered vehicle. This loan can also be raised to pay-off an auto loan obtained from another legitimate source. An auto loan will be released within two or three days of making an application.
Loans Against Deposits – Speed Loans
Speed loans are loans granted against the deposits of an account holder. The Bank offers speed loans of up to 90% of a customer’s deposits with the Bank, while the deposits will serve as security.
374
National Savings Bank Annual Report 2017
Products and Services
ECO Loan
NSB Eco loan is designed to provide financial assistance to those who are interested having a solar power generation system installed in their homes, enabling them to go green and save on their electricity bills, at the same time.
Pawning
The Bank provides instant loans for short-term credit needs at comparatively low rates of interest, against the security of jewellery and fully-automated machinery is used to check the valued gold articles. Part payment on pawned articles is also possible.
Corporate Lending
The Bank is also engaged in corporate lending for long-term infrastructure or other development projects, in the areas of power-generation, telecommunication, healthcare, highway and irrigation etc. Such loans will be granted in the form direct loans to a bank/financial institution, either as part of a syndicated loan or to private corporate entities/State-Owned Enterprises (SOE), as a direct loan.
3. Other Services3. Other Services
Money Changing Business
With the approval of the Central Bank of Sri Lanka to engage in Money Changing Business, NSB has commenced this business at selected branches. Therefore, the customers who possess Foreign Currency Notes could encash them and also customers who travel abroad could purchase foreign currency notes at the selected branches at competitive exchange rates.
Remittance Services
“NSB U-Trust” is the Bank’s foreign currency remittance service. Through this service, Sri Lankans working abroad can remit their earnings to their families back home. In fact, money can be sent either to a NSB account or to an account elsewhere. A beneficiary can also collect his/her remittance, over the counter, at any NSB branch or main Post Office.
Trade Finance Services
The Bank facilitates import trade transactions targeting the retail sector; especially importation of motor vehicles. Issuance of Letters of Credit (LC), handling import bills under LC, issuance of shipping and air freight guarantees, collection of bills and forward exchange bookings are the services offered at all the branches under trade financing.
Treasury Services
This services include money market activities, trading in Government securities and Derivative transactions.
Card Services
Shopping + ATM Card
The Bank issues “Shopping + ATM Cards’’ connected to customers’ savings accounts which provides easy access to cash by enabling the customers to make ATMs withdrawals and pay for their purchases.
NSB Easy Card
The “NSB Easy Card” is a master card that is issued against the balance in customer’s fixed deposit account, with credit limit of up to 80% of the deposit balance. Additionally, cardholders can also withdraw cash with their NSB Easy Card from any ATM with Master card logo, including all NSB ATMs.
NSB Reach
“NSB Reach” is the Bank’s POS device-based savings mobilisation programme, which has enabled mostly under banked people to save from where they are, without going through the hassle of visiting a branch, as its tag line “Your Address is Our Address” says.
NSB iSaver
NSB iSaver is a digital innovation which is expected to provide customer convenience through Mobitel standalone and all franchisee outlets at any time during the day. Thisinnovative service is expected to further inculcate the habit of savings amongst Sri Lanka’s populace, thus resulting in wealth creation and mobility of funds for investment.
375
National Savings Bank Annual Report 2017
Now from anywhere and at anytime you can deposit to your NSB Savings Account through your nearest mCash retailers islandwide from the NSB iSaver Service.
Advantages of NSB iSaver:
z Extended operational hours
z Hassle-free customer convenience
z Low cost on deposits mobilisation
No fee will be charged from the Savings Account Holders or Third Party Depositor.
Guarantees
This is an instrument, which amounts to an unconditional undertaking by the Bank, to discharge the liability of a depositor; in the event of his/her failing to discharge the obligation. The following types of guarantees can be issued against deposits on the request of the customer: Performance Bonds, Bid Bonds, Retention Bonds, Retention Guarantees, Tender Bonds and Advance Payment Guarantees.
Standing Order
A standing order will enable you to authorise the Bank to make a series of payments on your behalf to a names payee or beneficiary by debiting your savings account with a fixed payment amount. Standing order within the NSB accounts are free of charge.
Safety Deposit Locker
NSB provides you with a safe and trusted place for safekeeping of your valued belongings. You will receive the facility to store your valuable belongings and documents under safe custody at a nominal annual rental at selected branches. Safety Lockers are available in three sizes as Small, Medium and Large.
Utility Bill Payments
Utility Bill Payment services are available at NSB and you can pay utility bills at any of our branches island wide. Bills will be updated online as soon as you pay your bill.
SMS Banking
SMS Banking service is available to any NSB savings account holder. With SMS Banking, customers can pay their utility bills and transfer funds between NSB accounts.
Internet Banking
The Bank also provides the Internet Banking facility to its customers. Indeed, internet banking allows NSB customers to check their account balances, transfer funds from their accounts to any account, no matter which bank the transferee’s account is, on top of reloading facility and paying utility bills, online.
Collection Centres at School
NSB was involved in establishing collection centres at Schools, where children learn the habit of savings and get used to leadership role within the school.
NSB Call Centre
The NSB Call Centre provides assistance to customers to contact the Bank and inquire about the Bank’s activities. Indeed, any person can come to the Call Centre on 2379379 and get information related to any NSB product or service. As well, they can reach it via email, Skype too. What’s more, web-chatting too is possible, if they so wish to.
Products and Services

376
National Savings Bank Annual Report 2017
Bank Group
For the year ended 31 December 2017US $ ’000
2016US $ ’000
Change %
2017US $ ’000
2016US $ ’000
Change %
Gross income 703,628 583,634 21 705,188 587,904 20
Interest income 674,802 576,895 17 680,321 581,922 17 Less: Interest expenses 511,942 406,833 26 515,484 410,377 26
Net interest income 162,860 170,062 (4) 164,837 171,545 (4)Fee and commission income 5,109 4,342 18 5,124 4,348 18 Less: Fee and commission expenses 712 918 (22) 738 936 (21)
Net fee and commission income 4,397 3,424 28 4,386 3,412 29 Net gain/(loss) from trading 7,873 (262) (3,102) 9,925 (914) (1,186)Net gain/(loss) from financial instruments designated at fair value through profit or loss – – – – – – Net gain/(loss) from financial investments 4,617 273 1,590 4,617 273 1,590 Other operating income (net) 11,227 2,386 371 5,201 2,275 129
Total operating income 190,974 175,883 9 188,966 176,591 7 Less: Impairment charge for loans and other losses 4,524 (666) (780) 4,524 (666) (780)
Net operating income 186,450 176,549 6 184,442 177,257 4
Less: ExpensesPersonnel expenses 44,942 41,639 8 45,153 41,847 8 Other expenses 27,155 27,436 (1) 26,804 27,171 (1)
Operating profit before value added tax (VAT) and nation building tax (NBT) 114,353 107,474 6 112,485 108,239 4 Less: Value added tax on financial services 20,118 16,064 25 20,677 16,181 28 Nation building tax on financial services 2,682 2,575 4 2,757 2,594 6
Operating profit after value added tax (VAT) and nation building tax (NBT) 91,553 88,835 3 89,051 89,464 (0)
Profit before Income tax 91,553 88,835 3 89,051 89,464 (0)Less: Income tax expenses 28,839 25,411 13 29,988 25,609 17
Profit for the year 62,714 63,424 (1) 59,063 63,855 (8)
Profit attributable to:Equity holders of the Bank 62,714 63,424 (1) 59,063 63,855 (8)
Profit for the year 62,714 63,424 (1) 59,063 63,855 (8)
Earnings per share on profit Basic earnings per ordinary share (Rs.) 0.10 0.20 (49) 0.10 0.20 (52)Diluted earnings per ordinary share (Rs.) 0.10 0.20 (49) 0.10 0.20 (52)
Statement of Comprehensive Income in US DollarsStatement of Comprehensive Income in US Dollars
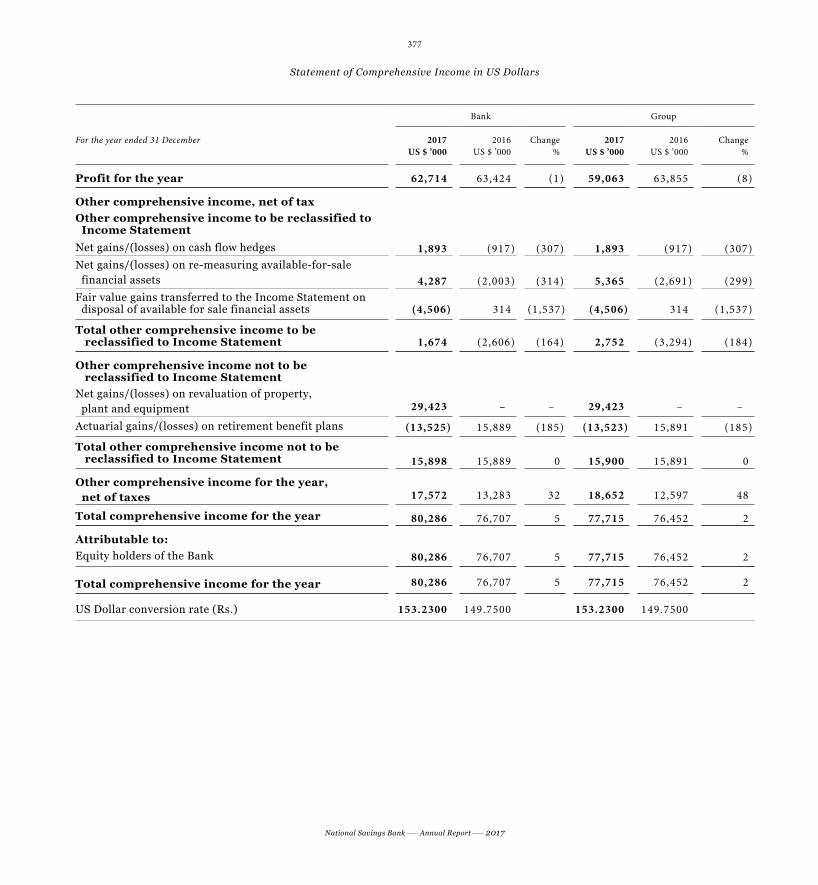
377
National Savings Bank Annual Report 2017
Bank Group
For the year ended 31 December 2017US $ ’000
2016US $ ’000
Change %
2017US $ ’000
2016US $ ’000
Change %
Profit for the year 62,714 63,424 (1) 59,063 63,855 (8)
Other comprehensive income, net of taxOther comprehensive income to be reclassified to Income StatementNet gains/(losses) on cash flow hedges 1,893 (917) (307) 1,893 (917) (307)Net gains/(losses) on re-measuring available-for-sale financial assets 4,287 (2,003) (314) 5,365 (2,691) (299)Fair value gains transferred to the Income Statement on disposal of available for sale financial assets (4,506) 314 (1,537) (4,506) 314 (1,537)
Total other comprehensive income to be reclassified to Income Statement 1,674 (2,606) (164) 2,752 (3,294) (184)
Other comprehensive income not to be reclassified to Income StatementNet gains/(losses) on revaluation of property, plant and equipment 29,423 – – 29,423 – –
Actuarial gains/(losses) on retirement benefit plans (13,525) 15,889 (185) (13,523) 15,891 (185)
Total other comprehensive income not to be reclassified to Income Statement 15,898 15,889 0 15,900 15,891 0
Other comprehensive income for the year, net of taxes 17,572 13,283 32 18,652 12,597 48
Total comprehensive income for the year 80,286 76,707 5 77,715 76,452 2
Attributable to:Equity holders of the Bank 80,286 76,707 5 77,715 76,452 2
Total comprehensive income for the year 80,286 76,707 5 77,715 76,452 2
US Dollar conversion rate (Rs.) 153.2300 149.7500 153.2300 149.7500
Statement of Comprehensive Income in US Dollars

378
National Savings Bank Annual Report 2017
Bank Group
As at 31 December 2017US $ ’000
2016US $ ’000
Change %
2017US $ ’000
2016US $ ’000
Change %
AssetsCash and cash equivalents 25,123 30,849 (19) 25,152 30,902 (19)Balances with central banks – – – 1 3 (81)Placements with banks 152,960 126,969 20 152,960 126,969 20 Derivative financial instruments 8,880 18,220 (51) 8,880 18,220 (51)Other financial assets held for trading 42,239 135,496 (69) 61,280 182,326 (66)Financial assets designated at fair value through profit or loss – – – – – – Loans and receivables to banks 180,869 212,581 (15) 182,544 212,581 (14)Loans and receivables to other customers 2,351,432 1,949,763 21 2,341,357 1,944,428 20 Financial investments – available for sale 37,159 41,588 (11) 50,342 54,241 (7)Financial investments – held to maturity 3,552,000 3,377,792 5 3,575,830 3,389,816 5 Investments in subsidiaries 5,874 1,002 486 – – – Property, plant and equipment 78,414 47,544 65 78,436 47,558 65 Intangible assets 2,482 1,050 136 2,484 1,050 137 Deferred tax assets – – – – 4 (100)Other assets 167,694 145,318 15 169,529 146,182 16
Total assets 6,605,126 6,088,173 8 6,648,795 6,154,281 8
LiabilitiesDue to banks 1,178 771 53 5,406 19,090 (72)Derivative financial instruments 6,245 – 100 6,245 – 100 Due to other customers 4,811,150 4,389,184 10 4,811,151 4,389,184 10 Other borrowings 1,422,409 1,382,570 3 1,453,840 1,419,896 2 Current tax liabilities – – – 896 115 683 Deferred tax liabilities 3,309 2,779 19 3,310 2,779 19 Other liabilities 59,143 57,429 3 59,437 57,486 3
Subordinated liabilities 39,199 40,110 (2) 39,199 40,110 (2)
Total liabilities 6,342,633 5,872,843 8 6,379,484 5,928,660 8
EquityStated capital/Assigned capital 43,725 41,402 6 43,725 41,402 6 Statutory reserve fund 19,598 16,845 16 19,598 16,845 16 Retained earnings 14,546 15,889 (8) 18,311 24,765 (26)Other reserves 184,624 141,194 31 187,677 142,609 32 Total equity of the owners of the parent 262,493 215,330 22 269,311 225,621 19
Total equity 262,493 215,330 22 269,311 225,621 19
Total equity and liabilities 6,605,126 6,088,173 8 6,648,795 6,154,281 8
Contingent liabilities and commitments 119,561 166,745 (28) 119,561 166,745 (28)
US Dollar conversion rate (Rs.) 153.2300 149.7500 153.2300 149.7500
Statement of Financial Position in US DollarsStatement of Financial Position in US Dollars

379
National Savings Bank Annual Report 2017
Basel III Disclosures as per Schedule III of Basel III Disclosures as per Schedule III of Banking Act Direction No. 1 of 2016Banking Act Direction No. 1 of 2016
Basel III – Minimum Disclosure Requirements under Pillar IIIBasel III – Minimum Disclosure Requirements under Pillar III
Key Regulatory Ratios – Capital and Liquidity
Item Bank Group
31.12.2017 31.12.2016 31.12.2017 31.12.2016
Regulatory Capital (Rs. ’000)Common Equity Tier 1 25,564,909 21,725,576 27,370,741 23,484,317Tier 1 Capital 25,564,909 21,725,576 27,370,741 23,484,317Total Capital 32,808,403 26,634,140 34,605,855 28,387,739
Regulatory Capital Ratios (%)Common Equity Tier 1 Capital Ratio (Minimum Requirement – 6.25%) 11.93 11.31 12.65 12.03Tier 1 Capital Ratio(Minimum Requirement – 7.75%) 11.93 11.31 12.65 12.03Total Capital Ratio (Minimum Requirement – 11.75%) 15.31 13.86 16.00 14.54
Regulatory LiquidityStatutory Liquid Assets (Rs. ’000) 509,079,407 460,877,014 N/A N/AStatutory Liquid Assets Ratio (Minimum Requirement – 20%) – – N/A N/ADomestic banking unit (%) 73.44 72.56 N/A N/AOff-shore banking unit (%) – – N/A N/ALiquidity Coverage Ratio (%) – Rupee (Minimum Requirement – 2017 – 80%, 2016 – 70%) 377.57 379.26 N/A N/ALiquidity Coverage Ratio (%) – All Currencies (Minimum Requirement – 2017 – 80%, 2016 – 70%) 376.18 393.96 N/A N/A
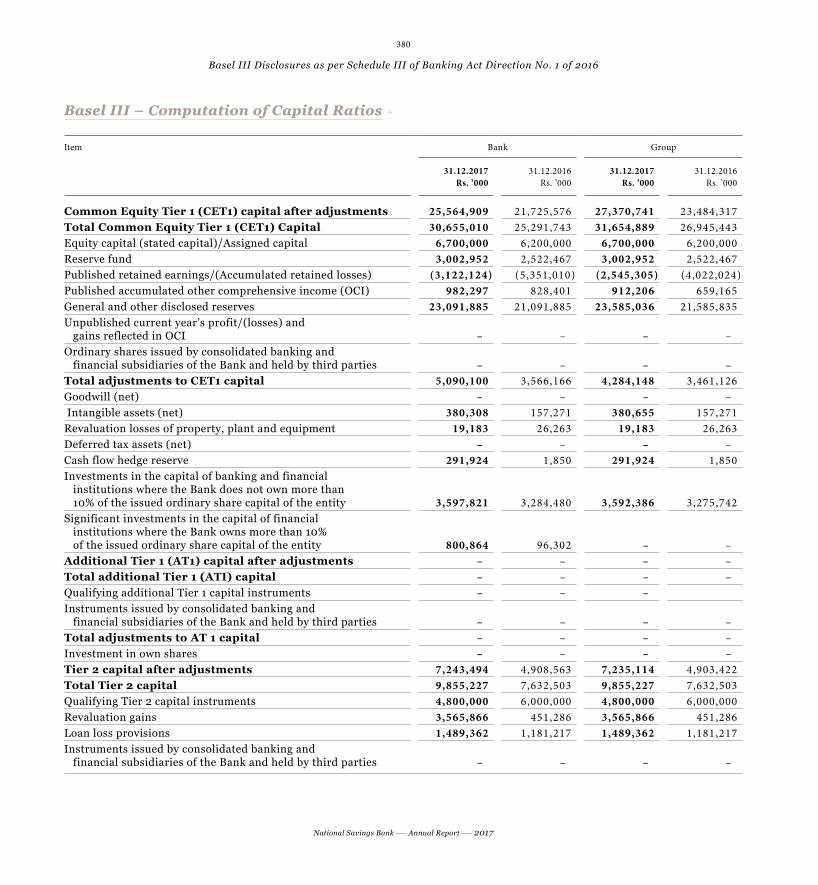
380
National Savings Bank Annual Report 2017
Basel III Disclosures as per Schedule III of Banking Act Direction No. 1 of 2016
Basel III – Computation of Capital RatiosBasel III – Computation of Capital Ratios
Item Bank Group
31.12.2017Rs. ’000
31.12.2016Rs. ’000
31.12.2017Rs. ’000
31.12.2016Rs. ’000
Common Equity Tier 1 (CET1) capital after adjustments 25,564,909 21,725,576 27,370,741 23,484,317Total Common Equity Tier 1 (CET1) Capital 30,655,010 25,291,743 31,654,889 26,945,443Equity capital (stated capital)/Assigned capital 6,700,000 6,200,000 6,700,000 6,200,000Reserve fund 3,002,952 2,522,467 3,002,952 2,522,467Published retained earnings/(Accumulated retained losses) (3,122,124) (5,351,010) (2,545,305) (4,022,024)Published accumulated other comprehensive income (OCI) 982,297 828,401 912,206 659,165General and other disclosed reserves 23,091,885 21,091,885 23,585,036 21,585,835Unpublished current year’s profit/(losses) and gains reflected in OCI – – – –Ordinary shares issued by consolidated banking and financial subsidiaries of the Bank and held by third parties – – – –Total adjustments to CET1 capital 5,090,100 3,566,166 4,284,148 3,461,126Goodwill (net) – – – – Intangible assets (net) 380,308 157,271 380,655 157,271Revaluation losses of property, plant and equipment 19,183 26,263 19,183 26,263Deferred tax assets (net) – – – –Cash flow hedge reserve 291,924 1,850 291,924 1,850Investments in the capital of banking and financial institutions where the Bank does not own more than 10% of the issued ordinary share capital of the entity 3,597,821 3,284,480 3,592,386 3,275,742Significant investments in the capital of financial institutions where the Bank owns more than 10% of the issued ordinary share capital of the entity 800,864 96,302 – –Additional Tier 1 (AT1) capital after adjustments – – – –Total additional Tier 1 (ATI) capital – – – –Qualifying additional Tier 1 capital instruments – – –Instruments issued by consolidated banking and financial subsidiaries of the Bank and held by third parties – – – –Total adjustments to AT 1 capital – – – –Investment in own shares – – – –Tier 2 capital after adjustments 7,243,494 4,908,563 7,235,114 4,903,422Total Tier 2 capital 9,855,227 7,632,503 9,855,227 7,632,503Qualifying Tier 2 capital instruments 4,800,000 6,000,000 4,800,000 6,000,000Revaluation gains 3,565,866 451,286 3,565,866 451,286Loan loss provisions 1,489,362 1,181,217 1,489,362 1,181,217Instruments issued by consolidated banking and financial subsidiaries of the Bank and held by third parties – – – –
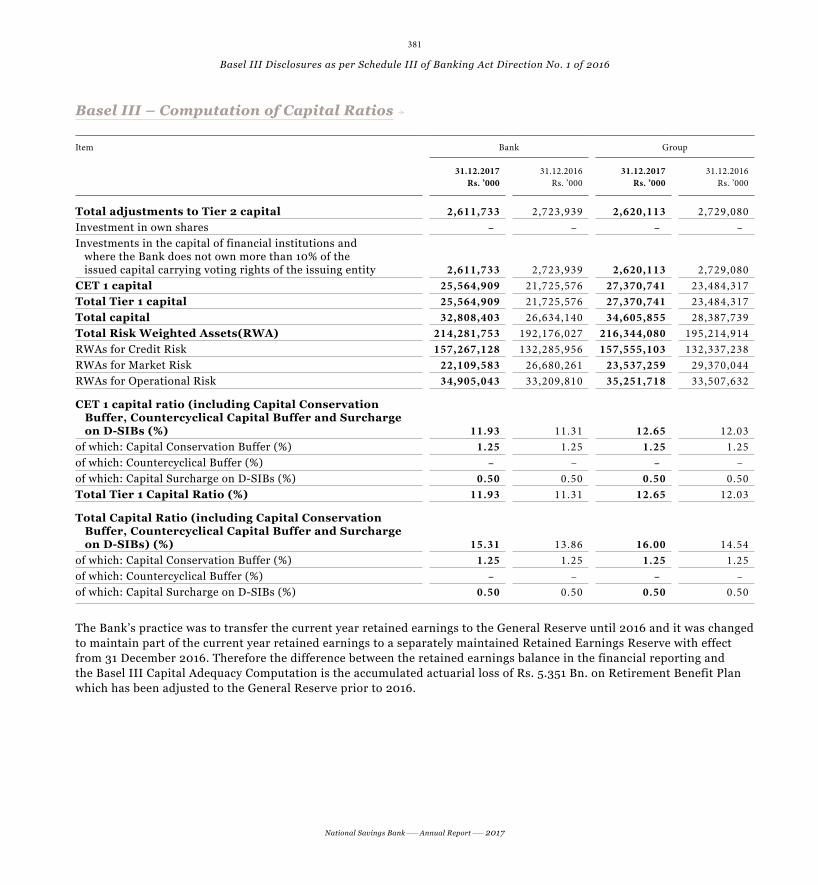
381
National Savings Bank Annual Report 2017
Basel III Disclosures as per Schedule III of Banking Act Direction No. 1 of 2016
Item Bank Group
31.12.2017Rs. ’000
31.12.2016Rs. ’000
31.12.2017Rs. ’000
31.12.2016Rs. ’000
Total adjustments to Tier 2 capital 2,611,733 2,723,939 2,620,113 2,729,080Investment in own shares – – – –Investments in the capital of financial institutions and where the Bank does not own more than 10% of the issued capital carrying voting rights of the issuing entity 2,611,733 2,723,939 2,620,113 2,729,080CET 1 capital 25,564,909 21,725,576 27,370,741 23,484,317Total Tier 1 capital 25,564,909 21,725,576 27,370,741 23,484,317Total capital 32,808,403 26,634,140 34,605,855 28,387,739Total Risk Weighted Assets(RWA) 214,281,753 192,176,027 216,344,080 195,214,914RWAs for Credit Risk 157,267,128 132,285,956 157,555,103 132,337,238RWAs for Market Risk 22,109,583 26,680,261 23,537,259 29,370,044RWAs for Operational Risk 34,905,043 33,209,810 35,251,718 33,507,632
CET 1 capital ratio (including Capital Conservation Buffer, Countercyclical Capital Buffer and Surcharge on D-SIBs (%) 11.93 11.31 12.65 12.03of which: Capital Conservation Buffer (%) 1.25 1.25 1.25 1.25of which: Countercyclical Buffer (%) – – – –of which: Capital Surcharge on D-SIBs (%) 0.50 0.50 0.50 0.50Total Tier 1 Capital Ratio (%) 11.93 11.31 12.65 12.03
Total Capital Ratio (including Capital Conservation Buffer, Countercyclical Capital Buffer and Surcharge on D-SIBs) (%) 15.31 13.86 16.00 14.54of which: Capital Conservation Buffer (%) 1.25 1.25 1.25 1.25of which: Countercyclical Buffer (%) – – – –of which: Capital Surcharge on D-SIBs (%) 0.50 0.50 0.50 0.50
The Bank’s practice was to transfer the current year retained earnings to the General Reserve until 2016 and it was changed to maintain part of the current year retained earnings to a separately maintained Retained Earnings Reserve with effect from 31 December 2016. Therefore the difference between the retained earnings balance in the financial reporting and the Basel III Capital Adequacy Computation is the accumulated actuarial loss of Rs. 5.351 Bn. on Retirement Benefit Plan which has been adjusted to the General Reserve prior to 2016.
Basel III – Computation of Capital RatiosBasel III – Computation of Capital Ratios

382
National Savings Bank Annual Report 2017
Basel III Disclosures as per Schedule III of Banking Act Direction No. 1 of 2016
Basel III – Computation of Liquidity Coverage Ratio (Bank) – All CurrencyBasel III – Computation of Liquidity Coverage Ratio (Bank) – All Currency
Item 2017 2016
Total unweighted
valueRs. ’000
Total weighted
valueRs. ’000
Total unweighted
valueRs. ’000
Total weighted
valueRs. ’000
Total Stock of High-Quality Liquid Assets (HQLA) 430,221,226 426,508,743 386,476,434 384,358,309Total Adjusted Level 1A Assets 431,889,252 431,889,252 385,053,885 385,053,885Level 1 Assets 422,446,260 422,446,260 381,890,184 381,890,184Total Adjusted Level 2A Assets 500,000 425,000 500,000 425,000Level 2A Assets 500,000 425,000 500,000 425,000Total Adjusted Level 2B Assets 7,274,966 3,637,483 4,086,250 2,043,125Level 2B Assets 7,274,966 3,637,483 4,086,250 2,043,125Total Cash Outflows 812,037,851 126,236,382 716,823,579 114,590,449Deposits 611,264,221 61,126,422 546,065,547 54,606,555Unsecured wholesale funding 114,458,122 58,912,164 103,797,493 53,548,512Secured funding transactions 57,193,088 – 31,587,170 –Undrawn portion of committed (irrevocable) facilities and other contingent funding obligations 24,722,883 1,798,259 32,429,006 3,491,019Additional requirements 4,399,537 4,399,537 2,944,363 2,944,363Total Cash Inflows 25,850,376 12,858,108 26,069,178 17,027,987Maturing secured lending transactions backed by collateral 7,704,694 2,115,566 6,570,488 1,672,088Committed facilities – – – –Other inflows by counterparty which are maturing within 30 days 15,514,164 10,742,542 18,615,686 15,059,224Operational deposits 2,631,518 – 586,329 –Other cash inflows – – 296,675 296,675Liquidity Coverage Ratio (%) stock of High Quality Liquid Assets/Total Net Cash Outflow over the next 30 calendar days)*100 376.18 393.96

383
National Savings Bank Annual Report 2017
Basel III Disclosures as per Schedule III of Banking Act Direction No. 1 of 2016
Main features of Regulatory Capital InstrumentsMain features of Regulatory Capital Instruments
Description of the capital instrument
Issuer National Savings BankUnique identifierGoverning law(s) of the instrument Sri LankaOriginal date of issuance 29 December 2016Par value of instrument 100Perpetual or dated DatedOriginal maturity date 29 December 2021Amount recognised in regulatory capital (Rs. ’000) 4,800,000 Accounting classification(equity/liability) Liability
Issuer call subject to prior supervisory approvalOptional call date, contingent call dates and redemption amount (Rs. ’000) N/ASubsequent call dates N/A
Coupons/dividendsFixed or floating dividend/coupon FixedCoupon rate and any related index 13%Non-cumulative or cumulative Non-cumulative
Convertible or non-convertibleIf convertible, conversion trigger(s) N/AIf convertible, fully or partially N/AIf convertible, mandatory or optional N/AIf convertible, conversion rate N/A
Summary Discussion on Adequacy/Meeting Current and Future Capital RequirementsSummary Discussion on Adequacy/Meeting Current and Future Capital Requirements
For summary discussion on Adequacy/Meeting Current and Future Capital Requirements, refer Risk Management Report on pages 236 to 238.
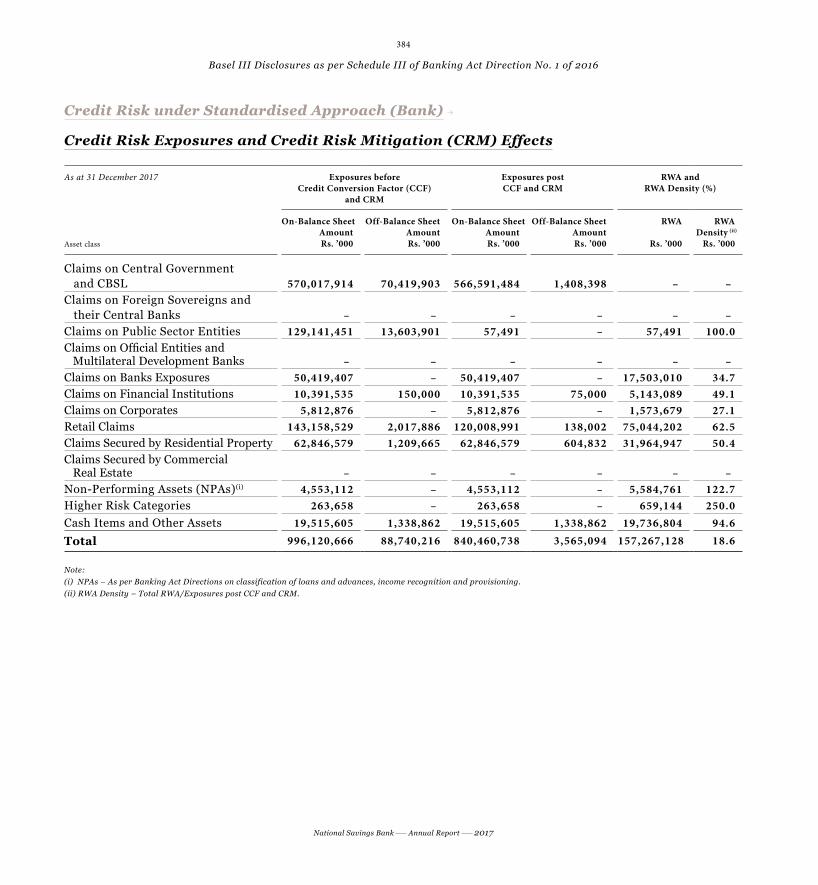
384
National Savings Bank Annual Report 2017
Basel III Disclosures as per Schedule III of Banking Act Direction No. 1 of 2016
Credit Risk under Standardised Approach (Bank)Credit Risk under Standardised Approach (Bank)
Credit Risk Exposures and Credit Risk Mitigation (CRM) Effects
As at 31 December 2017 Exposures before Credit Conversion Factor (CCF)
and CRM
Exposures post CCF and CRM
RWA and RWA Density (%)
Asset class
On-Balance Sheet AmountRs. ’000
Off-Balance Sheet AmountRs. ’000
On-Balance Sheet AmountRs. ’000
Off-Balance Sheet AmountRs. ’000
RWA
Rs. ’000
RWA Density (ii)
Rs. ’000
Claims on Central Government and CBSL 570,017,914 70,419,903 566,591,484 1,408,398 – –Claims on Foreign Sovereigns and their Central Banks – – – – – –Claims on Public Sector Entities 129,141,451 13,603,901 57,491 – 57,491 100.0Claims on Official Entities and Multilateral Development Banks – – – – – –Claims on Banks Exposures 50,419,407 – 50,419,407 – 17,503,010 34.7Claims on Financial Institutions 10,391,535 150,000 10,391,535 75,000 5,143,089 49.1Claims on Corporates 5,812,876 – 5,812,876 – 1,573,679 27.1Retail Claims 143,158,529 2,017,886 120,008,991 138,002 75,044,202 62.5Claims Secured by Residential Property 62,846,579 1,209,665 62,846,579 604,832 31,964,947 50.4Claims Secured by Commercial Real Estate – – – – – –Non-Performing Assets (NPAs)(i) 4,553,112 – 4,553,112 – 5,584,761 122.7Higher Risk Categories 263,658 – 263,658 – 659,144 250.0Cash Items and Other Assets 19,515,605 1,338,862 19,515,605 1,338,862 19,736,804 94.6Total 996,120,666 88,740,216 840,460,738 3,565,094 157,267,128 18.6
Note:(i) NPAs – As per Banking Act Directions on classification of loans and advances, income recognition and provisioning.(ii) RWA Density – Total RWA/Exposures post CCF and CRM.

385
National Savings Bank Annual Report 2017
Basel III Disclosures as per Schedule III of Banking Act Direction No. 1 of 2016
Credit Risk under Standardised Approach (Group)Credit Risk under Standardised Approach (Group)
Credit Risk Exposures and Credit Risk Mitigation (CRM) Effects
As at 31 December 2017 Exposures before Credit Conversion Factor (CCF)
and CRM
Exposures post CCF and CRM
RWA and RWA Density (%)
Asset class
On-Balance Sheet AmountRs. ’000
Off-Balance Sheet AmountRs. ’000
On-Balance Sheet AmountRs. ’000
Off-Balance Sheet AmountRs. ’000
RWA
Rs. ’000
RWA Density (ii)
Rs. ’000
Claims on Central Government and CBSL 573,853,573 70,419,903 570,427,144 1,408,398 – –Claims on Foreign Sovereigns and their Central Banks – – – – – –Claims on Public Sector Entities 129,141,451 13,603,901 57,491 – 57,491 100.0Claims on Official Entities and Multilateral Development Banks – – – – – –Claims on Banks Exposures 50,429,947 – 50,429,947 – 17,506,172 34.7Claims on Financial Institutions 10,393,805 150,000 10,393,805 75,000 5,143,836 49.1Claims on Corporates 5,813,876 – 5,813,876 – 1,574,679 27.1Retail Claims 143,158,529 2,017,886 120,008,991 138,002 75,044,202 62.5Claims Secured by Residential Property 62,846,579 1,209,665 62,846,579 604,832 31,964,947 50.4Claims Secured by Commercial Real Estate – – – – – –Non-Performing Assets (NPAs)(i) 4,553,112 – 4,553,112 – 5,584,761 122.7Higher Risk Categories 273,707 – 273,707 – 684,269 250.0Cash Items and Other Assets 19,773,557 1,338,862 19,773,557 1,338,862 19,994,747 94.7Total 1,000,238,138 88,740,216 844,578,210 3,565,094 157,555,103 18.6
Note:(i) NPAs – As per Banking Act Directions on classification of loans and advances, income recognition and provisioning.(ii) RWA Density – Total RWA/Exposures post CCF and CRM.

386
National Savings Bank Annual Report 2017
Basel III Disclosures as per Schedule III of Banking Act Direction No. 1 of 2016
Credit Risk under Standardised Approach: Exposures by Asset Classes and Credit Risk under Standardised Approach: Exposures by Asset Classes and Risk Weights (Bank)Risk Weights (Bank)
As at 31 December 2017Description (Post CCF and CRM)
Risk weight
Asset classes
0%
Rs. ’000
20%
Rs. ’000
50%
Rs. ’000
75%
Rs. ’000
100%
Rs. ’000
150%
Rs. ’000
>150%
Rs. ’000
Total Credit Exposures
AmountRs. ’000
Claims on Central Government and CBSL 567,999,882 – – – – – – 567,999,882
Claims on Foreign Sovereigns and their Central Banks – – – – – – – –
Claims on Public Sector Entities – – – – 57,491 – – 57,491
Claims on Official Entities and Multilateral Development Banks – – – – – – – –
Claims on Banks Exposures – 34,741,494 10,246,404 – 5,431,509 – – 50,419,407
Claims on Financial Institutions – 2,037,595 7,386,738 – 1,042,201 – – 10,466,535
Claims on Corporates – 4,524,266 1,239,568 – 49,042 – – 5,812,876
Retail Claims 16,472,684 4,930,053 – 98,744,256 – – – 120,146,993
Claims Secured by Residential Property – – 62,972,929 – 478,482 – – 63,451,412
Claims Secured by Commercial Real Estate – – – – – – – –
Non-Performing Assets (NPAs) – – 60,180 – 2,369,455 2,123,477 4,553,112
Higher Risk Categories – – – – – – 263,658 263,658
Cash Items and Other Assets 951,842 207,275 – – 19,695,349 – 20,854,466
Total 585,424,408 46,440,684 81,905,820 98,744,256 29,123,529 2,123,477 263,658 844,025,832

387
National Savings Bank Annual Report 2017
Basel III Disclosures as per Schedule III of Banking Act Direction No. 1 of 2016
Credit Risk under Standardised Approach: Exposures by Asset Classes and Credit Risk under Standardised Approach: Exposures by Asset Classes and Risk Weights (Group)Risk Weights (Group)
As at 31 December 2017Description (Post CCF & CRM)
Risk weight
Asset classes
0%
Rs. ’000
20%
Rs. ’000
50%
Rs. ’000
75%
Rs. ’000
100%
Rs. ’000
150%
Rs. ’000
>150%
Rs. ’000
Total Credit Exposures
AmountRs. ’000
Claims on Central Government and CBSL 571,835,542 – – – – – – 571,835,542
Claims on Foreign Sovereigns and their Central Banks – – – – – – – –
Claims on Public Sector Entities – – – – 57,491 – – 57,491
Claims on Official Entities and Multilateral Development Banks – – – – – – – –
Claims on Banks Exposures – 34,748,520 10,249,917 – 5,431,509 – – 50,429,947
Claims on Financial Institutions – 2,038,891 7,387,713 – 1,042,201 – – 10,468,805
Claims on Corporates – 4,524,266 1,239,568 – 50,042 – – 5,813,876
Retail Claims 16,472,684 4,930,053 – 98,744,256 – – – 120,146,993
Claims Secured by Residential Property – – 62,972,929 – 478,482 – – 63,451,412
Claims Secured by Commercial Real Estate – – – – – – – –
Non-Performing Assets (NPAs) – – 60,180 – 2,369,455 2,123,477 – 4,553,112
Higher Risk Categories – – – – – – 273,707 273,707
Cash Items and Other Assets 951,852 207,275 – – 19,953,292 – – 21,112,419
Total 589,260,078 46,449,007 81,910,308 98,744,256 29,382,472 2,123,477 273,707 848,143,304

388
National Savings Bank Annual Report 2017
Market Risk under Standardised Measurement MethodMarket Risk under Standardised Measurement Method
Bank Group
Item RWAAmount as at
31.12.2017Rs. ’000
RWAAmount as at
31.12.2017Rs. ’000
(a) RWA for Interest Rate Risk 1,334,454 2,752,740General Interest Rate Risk 1,334,454 2,738,653(i) Net long or short position 1,334,454 2,738,653(ii) Horizontal disallowance – –(iii) Vertical disallowance – –(iv) Options – –Specific Interest Rate Risk – 14,086
(b) RWA for Equity 4,768,080 4,777,470(i) General Equity Risk 2,547,998 2,553,434(ii) Specific Equity Risk 2,220,081 2,224,036
(c) RWA for Foreign Exchange and Gold 16,007,049 16,007,049Capital Charge for Market Risk [(a)+(b)+(c)] *CAR 2,597,876 2,765,628
Operational Risk under Basic Indicator Approach Operational Risk under Basic Indicator Approach
Bank
Capital Charge Factor
%
Gross income as at 31.12.2017
Rs. ’000
Capital Charge 1st yearRs. ’000
2nd yearRs. ’000
3rd yearRs. ’000
The Basic Indicator Approach 15 27,996,613 26,227,552 27,802,685 –Capital Charge – – – – 4,101,342Risk Weighted Amount for Operational Risk – – – – 34,905,043
Group
Capital Charge Factor
%
Gross income as at 31.12.2017
Rs. ’000Capital Charge 1st year
Rs. ’000 2nd year
Rs. ’000 3rd yearRs. ’000
The Basic Indicator Approach 15 28,263,087 26,333,652 28,244,798 –Capital Charge – – – – 4,142,077Risk Weighted Amount for Operational Risk – – – – 35,251,718
Basel III Disclosures as per Schedule III of Banking Act Direction No. 1 of 2016
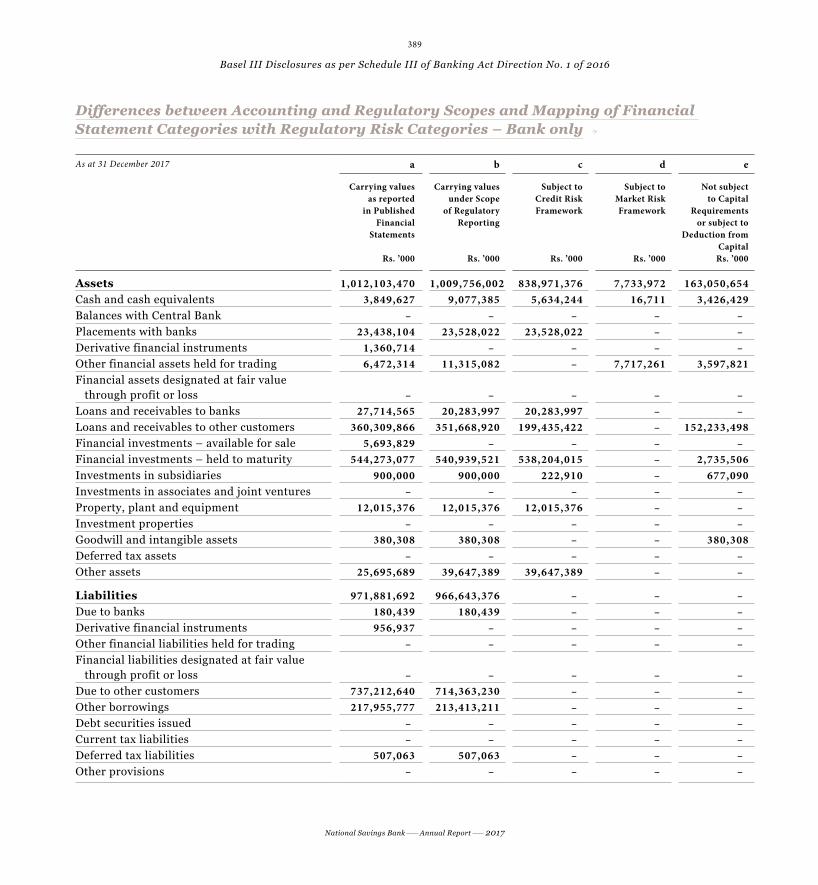
389
National Savings Bank Annual Report 2017
Differences between Accounting and Regulatory Scopes and Mapping of Financial Differences between Accounting and Regulatory Scopes and Mapping of Financial Statement Categories with Regulatory Risk Categories – Bank onlyStatement Categories with Regulatory Risk Categories – Bank only
As at 31 December 2017 a b c d e
Carrying values as reported
in Published Financial
Statements
Rs. ’000
Carrying values under Scope
of Regulatory Reporting
Rs. ’000
Subject to Credit Risk Framework
Rs. ’000
Subject to Market Risk Framework
Rs. ’000
Not subject to Capital
Requirements or subject to
Deduction from Capital
Rs. ’000
Assets 1,012,103,470 1,009,756,002 838,971,376 7,733,972 163,050,654Cash and cash equivalents 3,849,627 9,077,385 5,634,244 16,711 3,426,429Balances with Central Bank – – – – –Placements with banks 23,438,104 23,528,022 23,528,022 – –Derivative financial instruments 1,360,714 – – – –Other financial assets held for trading 6,472,314 11,315,082 – 7,717,261 3,597,821Financial assets designated at fair value through profit or loss – – – – –Loans and receivables to banks 27,714,565 20,283,997 20,283,997 – –Loans and receivables to other customers 360,309,866 351,668,920 199,435,422 – 152,233,498Financial investments – available for sale 5,693,829 – – – –Financial investments – held to maturity 544,273,077 540,939,521 538,204,015 – 2,735,506Investments in subsidiaries 900,000 900,000 222,910 – 677,090Investments in associates and joint ventures – – – – –Property, plant and equipment 12,015,376 12,015,376 12,015,376 – –Investment properties – – – – –Goodwill and intangible assets 380,308 380,308 – – 380,308Deferred tax assets – – – – –Other assets 25,695,689 39,647,389 39,647,389 – –
Liabilities 971,881,692 966,643,376 – – –Due to banks 180,439 180,439 – – –Derivative financial instruments 956,937 – – – –Other financial liabilities held for trading – – – – –Financial liabilities designated at fair value through profit or loss – – – – –Due to other customers 737,212,640 714,363,230 – – –Other borrowings 217,955,777 213,413,211 – – –Debt securities issued – – – – –Current tax liabilities – – – – –Deferred tax liabilities 507,063 507,063 – – –Other provisions – – – – –
Basel III Disclosures as per Schedule III of Banking Act Direction No. 1 of 2016

390
National Savings Bank Annual Report 2017
As at 31 December 2017 a b c d e
Carrying values as reported
in Published Financial
Statements
Rs. ’000
Carrying values under Scope
of Regulatory Reporting
Rs. ’000
Subject to Credit Risk Framework
Rs. ’000
Subject to Market Risk Framework
Rs. ’000
Not subject to Capital
Requirements or subject to
Deduction from Capital
Rs. ’000
Other liabilities 9,062,425 32,179,434 – – –Due to subsidiaries – – – – –Subordinated term debt 6,006,411 6,000,000 – – –
Off-balance sheet liabilities 18,320,312 88,740,216 3,565,094 – –Guarantees 1,741,883 1,741,883 –Performance bonds – – – – –Letters of credit 276,003 276,003 138,002
Other contingent items – – – – –Undrawn loan commitments 15,042,213 14,963,565 679,832Other commitments 1,260,213 71,758,765 2,747,260
Shareholders’ equity 6,700,000 6,700,000Equity capital(stated capital)/Assigned capital – – – – –of which amount eligible for CET 1 6,700,000 6,700,000of which amount eligible for AT 1 – – – – –Retained earnings 2,228,885 – – – –Accumulated other comprehensive income 1,637,161 – – – –Other reserves 29,655,733 36,412,625 – – –
Total shareholders’ equity 40,221,778 43,112,625 – – –
Basel III Disclosures as per Schedule III of Banking Act Direction No. 1 of 2016
Differences between Accounting and Regulatory Scopes and Mapping of Financial Differences between Accounting and Regulatory Scopes and Mapping of Financial Statement Categories with Regulatory Risk Categories – Bank only (contd.)Statement Categories with Regulatory Risk Categories – Bank only (contd.)
391
National Savings Bank Annual Report 2017
The carrying value of loans and advances in the published Financial Statements has been subject to impairment provisions based on the principles of “Incurred loss” as per LKAS 39 – (refer Note 23 for details). Carrying value of regulatory reporting is as per the Banking Act Direction No. 3 of 2008 Classification of Loans and Advances, Income Recognition and Provisioning issued by the CBSL are “time/delinquency based”. As a result, the LKAS 39 – recognises delinquency pattern of a loan much earlier when compared to the CBSL Guidelines and also computes the impairment provision based on the historical loss experience of loans. Investment securities are carried at “Cost” for regulatory reporting purposes while they classified as “Available for sale” carried at fair value or “Held to maturity” carried at amortised cost using Effective Interest Rate (EIR) under the LKAS 39. The “Fair value” is defined as the best estimate of the price that would be received to sell an asset or be paid to transfer a liability in an orderly transaction between market participants at the measurement date. A variety of valuation techniques combined with the range of plausible market parameters as at a given point in time may still generate unexpected uncertainty beyond fair value. Refer Note 50 for details on valuation methodologies. Debentures and trust certificates are classified as Loans and Receivable to bank or other customers in Financial Reporting in contrast to Held to Maturity in Regulatory Reporting.
A “Day 1 difference” is recognised as per LKAS 39 in contrary to regulatory reporting, when the transaction price differs from the fair value of other observable current market transactions in the same instrument. E.g. Employee loans below market rates.
Derivatives are financial instruments which derive values in response to changes in interest rates, financial instrument prices, commodity prices, foreign exchange rates, credit risk and indices. The fair value of these derivative financial instruments is determined using forward pricing models. The positive fair value changes of these financial instruments as at the balance sheet date are reported as assets while the negative fair value changes are reported as liabilities. The details of derivative financial instruments have been disclosed in Note 19 to the Financial Statements.
Explanations of significant differences between accounting and Explanations of significant differences between accounting and regulatory exposure amounts regulatory exposure amounts
Basel III Disclosures as per Schedule III of Banking Act Direction No. 1 of 2016
Bank’s Risk Management Approach and Risk Management Related to Bank’s Risk Management Approach and Risk Management Related to Key Risk ExposuresKey Risk Exposures
Bank’s Risk Management Approach and Risk Management Related to Key Risk Exposures are explained in Risk Management Report on page 201 to 238.

392
National Savings Bank Annual Report 2017
Other Disclosure RequirementsOther Disclosure RequirementsDisclosure Requirements under the Prescribed Format Issued by the Central Bank of Sri Lanka for Preparation of Annual Financial Statements of Licensed Specialised Banks.
Disclosure Requirements Description Page Number/s
1. Information about the significance of financial instruments for financial position and performance
1.1 Statement of financial position1.1.1 Disclosures on categories of financial assets and financial
liabilities.Notes to the Financial Statements:Note 15 – Analysis of financial instruments by measurement basis
292-295
1.1.2 Other disclosuresi. Special disclosures about financial assets and financial
liabilities designated to be measured at fair value through profit or loss, including disclosures about credit risk and market risk, changes in fair values attributable to these risks and the methods of measurement.
Significant accounting policies: Note 2.3.2.1 Financial assets at fair value through profit or loss (FVTPL)
270
Note 2.3.3.1 Financial liabilities at fair value through profit or loss (FVTPL)
271
ii. Reclassifications of financial instruments from one category to another.
Significant Accounting Policies: Note 2.3.4 Reclassification of financial instruments
272
iii. Information about financial assets pledged as collateral and about financial or non-financial assets held as collateral.
Notes to the Financial Statements:Note 25 – Financial investments held to maturity
314
iv. Reconciliation of the allowance account for credit losses by class of financial assets.
Note 23 (d) Movements in collective impairment charges during the year
309
v. Information about compound financial instruments with multiple embedded derivatives.
The Bank does not have financial instruments with multiple embedded derivatives
vi. Breaches of terms of loan agreements. None
1.2 Statement of comprehensive income1.2.1 Disclosures on items of income, expense, gains and losses. Notes to the Financial Statements:
Notes 3-13 to the Financial Statements282-291
1.2.2 Other disclosuresi. Total interest income and total interest expense for those
financial instruments that are not measured at fair value through profit and loss.
Notes to the Financial Statements:Note 4 Net interest income
283-284
ii. Fee income and expense. Notes to the Financial Statements:Notes 5 Net fee and commission income
284
iii. Amount of impairment losses by class of financial assets. Notes to the Financial Statements:Notes 10 Impairment of loans and other losses
286-287
iv. Interest income on impaired financial assets. Notes to the Financial Statements:Notes 4 (a) Net interest income
283
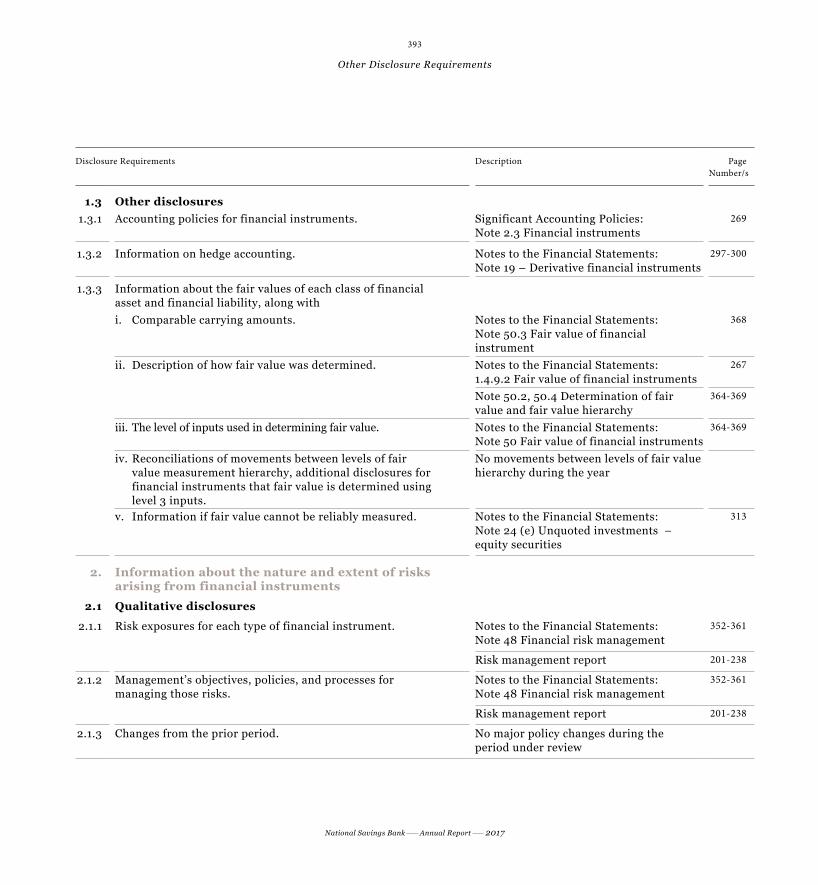
393
National Savings Bank Annual Report 2017
Disclosure Requirements Description Page Number/s
1.3 Other disclosures1.3.1 Accounting policies for financial instruments. Significant Accounting Policies:
Note 2.3 Financial instruments 269
1.3.2 Information on hedge accounting. Notes to the Financial Statements:Note 19 – Derivative financial instruments
297-300
1.3.3 Information about the fair values of each class of financial asset and financial liability, along withi. Comparable carrying amounts. Notes to the Financial Statements:
Note 50.3 Fair value of financial instrument
368
ii. Description of how fair value was determined. Notes to the Financial Statements:1.4.9.2 Fair value of financial instruments
267
Note 50.2, 50.4 Determination of fair value and fair value hierarchy
364-369
iii. The level of inputs used in determining fair value. Notes to the Financial Statements:Note 50 Fair value of financial instruments
364-369
iv. Reconciliations of movements between levels of fair value measurement hierarchy, additional disclosures for financial instruments that fair value is determined using level 3 inputs.
No movements between levels of fair value hierarchy during the year
v. Information if fair value cannot be reliably measured. Notes to the Financial Statements:Note 24 (e) Unquoted investments – equity securities
313
2. Information about the nature and extent of risks arising from financial instruments
2.1 Qualitative disclosures
2.1.1 Risk exposures for each type of financial instrument. Notes to the Financial Statements:Note 48 Financial risk management
352-361
Risk management report 201-238
2.1.2 Management’s objectives, policies, and processes for managing those risks.
Notes to the Financial Statements:Note 48 Financial risk management
352-361
Risk management report 201-238
2.1.3 Changes from the prior period. No major policy changes during the period under review
Other Disclosure Requirements

394
National Savings Bank Annual Report 2017
Disclosure Requirements Description Page Number/s
2.2 Quantitative disclosures
2.2.1 Summary of quantitative data about exposure to each risk at the reporting date.
Notes to the Financial Statements:Note 48 Financial risk management
352-361
Risk management report 201-238
2.2.2 Disclosures about credit risk, liquidity risk, market risk, operational risk, interest rate risk and how these risks are managed.
i. Credit risk
(a) Maximum amount of exposure (before deducting the value of collateral), description of collateral, information about credit quality of financial assets that are neither past due nor impaired and information about credit quality of financial assets.
Notes to the Financial Statements:Note 48 Financial risk management
352-361
(b) For financial assets that are past due or impaired, disclosures on age, factors considered in determining as impaired and the description of collateral on each class of financial asset.
Notes to the Financial Statements:Note 48.2 Broad risk categories in focus
353-361
(c) Information about collateral or other credit enhancements obtained or called.
Notes to the Financial Statements:Note 48.2 (a) Broad risk categories in focus – credit risk
353
(d) Other disclosures as required by the Banking Act Direction No. 7 of 2011 on Integrated Risk Management Framework for Licensed Banks.
Risk management report 201-238
ii. Liquidity risk
(a) A maturity analysis of financial liabilities. Notes to the Financial Statements:Note 49 Maturity analysis
362-363
(b) Description of approach to risk management. Notes to the Financial Statements:Note 48.2 Broad risk categories in focusRisk management report
353-361
(c) Other disclosures as required by the Banking Act Direction No. 7 of 2011 on Integrated Risk Management Framework for Licensed Banks.
Risk management report 201-238
iii. Market risk
(a) A sensitivity analysis of each type of market risk to which the entity is exposed.
Notes to the Financial Statements:Note 48.2 Broad risk categories in focus
353-361
(b) Additional information, if the sensitivity analysis is not representative of the entity's risk exposure.
Risk management report 201-238
(c) Other disclosures as required by the Banking Act Direction No. 7 of 2011 on Integrated Risk Management Framework for Licensed Banks.
Risk management report 201-238
Other Disclosure Requirements
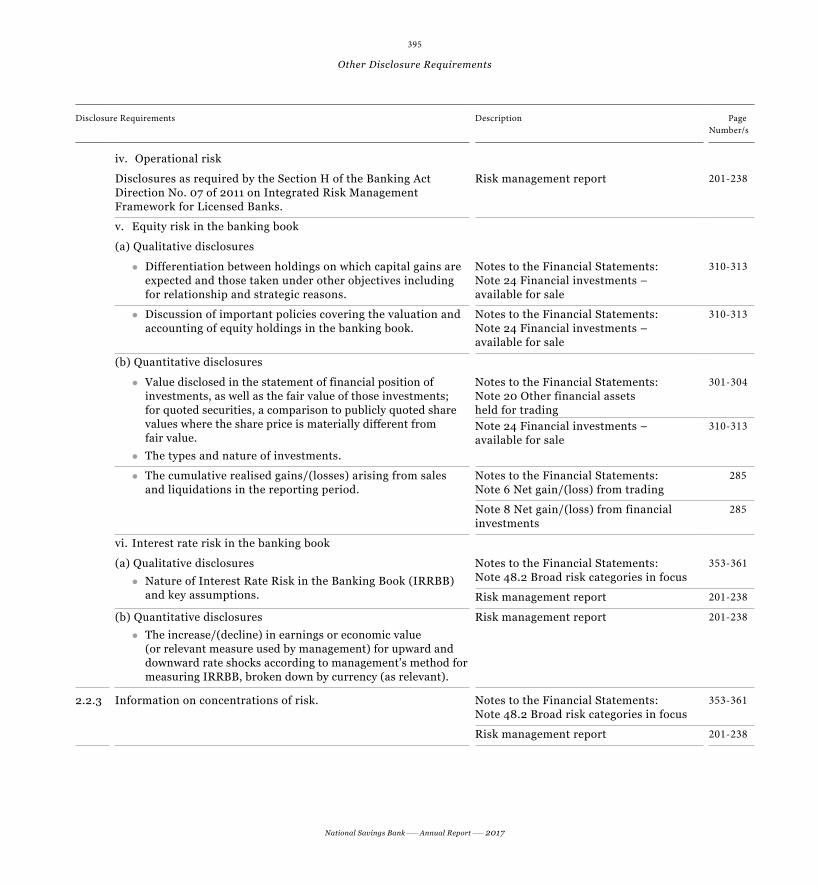
395
National Savings Bank Annual Report 2017
Disclosure Requirements Description Page Number/s
iv. Operational risk
Disclosures as required by the Section H of the Banking Act Direction No. 07 of 2011 on Integrated Risk Management Framework for Licensed Banks.
Risk management report 201-238
v. Equity risk in the banking book
(a) Qualitative disclosures
z Differentiation between holdings on which capital gains are expected and those taken under other objectives including for relationship and strategic reasons.
Notes to the Financial Statements:Note 24 Financial investments – available for sale
310-313
z Discussion of important policies covering the valuation and accounting of equity holdings in the banking book.
Notes to the Financial Statements:Note 24 Financial investments – available for sale
310-313
(b) Quantitative disclosures
z Value disclosed in the statement of financial position of investments, as well as the fair value of those investments; for quoted securities, a comparison to publicly quoted share values where the share price is materially different from fair value.
z The types and nature of investments.
Notes to the Financial Statements:Note 20 Other financial assets held for trading
301-304
Note 24 Financial investments – available for sale
310-313
z The cumulative realised gains/(losses) arising from sales and liquidations in the reporting period.
Notes to the Financial Statements:Note 6 Net gain/(loss) from trading
285
Note 8 Net gain/(loss) from financial investments
285
vi. Interest rate risk in the banking book
(a) Qualitative disclosures
z Nature of Interest Rate Risk in the Banking Book (IRRBB) and key assumptions.
Notes to the Financial Statements:Note 48.2 Broad risk categories in focus
353-361
Risk management report 201-238
(b) Quantitative disclosures
z The increase/(decline) in earnings or economic value (or relevant measure used by management) for upward and downward rate shocks according to management’s method for measuring IRRBB, broken down by currency (as relevant).
Risk management report 201-238
2.2.3 Information on concentrations of risk. Notes to the Financial Statements:Note 48.2 Broad risk categories in focus
353-361
Risk management report 201-238
Other Disclosure Requirements

396
National Savings Bank Annual Report 2017
Disclosure Requirements Description Page Number/s
3. Other disclosures
3.1 Capital structure
i. Qualitative disclosures
z Summary information on the terms and conditions of the main features of all capital instruments, especially in the case of innovative, complex or hybrid capital instruments.
Basel III disclosures as per schedule III of Banking Act Direction No. 1 of 2016
379-391
Risk management report 201-238
ii. Quantitative disclosures. Notes to the Financial Statements:Note 51 Capital management
369-370
Risk management report 201-238
(a) The amount of Tier 1 capital, with separate disclosure of:
z Paid-up share capital/common stock z Reserves z Non-controlling interests in the equity of subsidiaries z Innovative instruments z Other capital instruments z Deductions from Tier 1 capital
Basel III disclosures as per schedule III of Banking Act Direction No. 1 of 2016
379-391
Risk management report 201-238
(b) The total amount of Tier 2 and Tier 3 capital 379-391
(c) Other deductions from capital 379-391
(d) Total eligible capital 379-391
3.1.2 Capital adequacy
i. Qualitative disclosures
z A summary discussion of the Bank’s approach to assessing the adequacy of its capital to support current and future activities.
Risk management report 201-238
ii. Quantitative disclosures. Risk management report 201-238
(a) Capital requirements for credit risk, market risk and operational risk.
Risk management report 201-238
(b) Total and Tier 1 capital ratio. Risk management report 201-238
Other Disclosure Requirements

397
National Savings Bank Annual Report 2017
2008Rs. Mn.
2009Rs. Mn.
2010Rs. Mn.
2011Rs. Mn.
2012Rs. Mn.
2013Rs. Mn.
2014Rs. Mn.
2015Rs. Mn.
2016Rs. Mn.
2017Rs. Mn.
Operating resultsGross income 41,247 49,803 50,070 46,545 52,903 65,573 77,890 79,282 87,399 107,817 Interest income 40,834 49,046 48,142 47,096 52,531 64,248 74,023 78,128 86,390 103,400 Interest expenses 31,190 36,067 31,487 29,296 39,142 54,141 52,642 51,146 60,923 78,445 Net interest income 9,643 12,979 16,655 17,800 13,389 10,107 21,380 26,983 25,467 24,955 Other income 413 757 1,929 (578) 347 1,292 3,798 1,043 872 4,308 Operating expenses, provisions and VAT 6,956 6,792 8,807 7,967 7,396 9,120 14,706 14,991 13,036 15,234 Profit before tax 3,100 6,943 9,777 9,255 6,340 2,279 10,472 13,034 13,303 14,029 Income tax 2,041 3,229 4,386 3,193 2,578 1,095 3,606 4,361 3,805 4,419 Profit after tax 1,059 3,714 5,391 6,062 3,763 1,184 6,867 8,672 9,498 9,610 Contribution to the Government 4,287 7,277 10,107 7,970 6,327 4,731 11,043 11,015 19,251 13,440
Assets (Rs. Mn.)Cash and short-term funds 1,146 855 1,355 1,398 1,466 1,546 1,927 3,240 4,620 3,850Loans and investments 277,157 335,520 395,334 455,914 492,009 632,187 757,182 821,494 878,046 970,162Property, plant and equipment/lease-hold property/intangible assets 3,006 3,584 4,971 5,247 5,264 5,692 5,594 7,025 7,277 12,396Other assets 13,010 14,463 2,733 3,415 10,075 14,943 14,764 16,320 21,761 25,696
Total 294,319 354,422 404,393 465,974 508,813 654,368 779,466 848,079 911,704 1,012,103
Liabilities and shareholder’s funds (Rs. Mn.)
Total deposits 259,562 313,007 364,430 421,849 457,650 501,890 554,060 595,776 657,280 737,213
Repo/borrowings/ subordinated liabilities 6,205 8,730 11,436 16,270 22,958 120,561 191,192 207,101 213,162 224,143Differed taxation 56 84 27 96 123 143 270 504 416 507Other liabilities 13,497 14,841 5,997 4,707 4,314 9,557 10,684 12,274 8,600 10,019Shareholders’ funds 15,000 17,760 22,503 23,052 23,767 22,217 23,260 32,424 32,246 40,222
Total 294,319 354,422 404,393 465,974 508,813 654,368 779,466 848,079 911,704 1,012,103
Statistical Indicators 2008-2017Statistical Indicators 2008-2017

398
National Savings Bank Annual Report 2017
2008 2009 2010 2011 2012 2013 2014 2015 2016 2017
Ratios
Income growth (%) 33.8 20.7 0.5 (7.0) 13.7 24.0 18.8 1.8 10.2 23.4 Interest margin (%) 3.4 4.0 4.4 4.1 2.7 1.7 3.0 3.3 2.9 2.6 NIM/gross income (%) 23.4 26.1 33.3 38.2 25.3 15.4 27.4 34.0 29.1 23.1 Personnel cost/gross income (%) 7.5 6.9 7.4 8.9 7.7 6.4 6.2 7.5 7.1 6.4 Overheads (excluding provisions)/ gross income (%) 11.2 10.7 12.0 13.5 12.0 10.9 11.9 13.3 12.0 10.3 Profit before tax/gross income (%) 7.5 13.9 19.5 19.9 12.0 3.5 13.4 16.4 15.2 13.0 Contribution to the GOSL/ gross income (%) 10.4 14.6 20.2 17.1 12.0 7.2 14.2 13.9 22.0 12.5 Cost to deposits (%) 2.4 2.7 2.7 2.0 1.7 1.6 2.1 2.3 2.1 2.1 Cost to income with VAT (%) 58.5 55.5 48.9 45.4 52.8 67.7 44.8 46.1 50.1 49.9 Cost to income without VAT (%) 46.1 38.8 32.4 36.4 46.1 62.2 36.7 37.4 39.6 38.0Return on average shareholders’ funds (ROE) (%) 7.5 22.7 27.3 26.6 16.1 5.2 30.2 31.2 29.4 26.5 Return on average assets (ROA) 1.1 2.1 2.6 2.1 1.3 0.4 1.5 1.6 1.5 1.5 NPL (gross) 1.7 3.8 2.6 2.6 2.4 6.5 7.6 3.5 1.6 1.3 NPL (net) 1.1 3.0 1.8 1.9 1.8 6.7 7.6 3.4 1.5 1.2 Capital adequacy – Tier 1 (Minimum 5%) 23.2 25.1 22.2 20.0 20.4 18.5 20.5 17.9 12.5 – Capital adequacy – Tier 2 (Minimum 10%) 17.7 21.5 19.2 17.7 19.1 16.7 19.0 16.4 14.7 – Basel III – Tier 1 (Minimum 7.75%) – – – – – – – – 11.3 11.9Basel III - total capital (Minimum 11.75%) – – – – – – – – 13.9 15.3Liquidity coverage ratio (Minimum 80%) – – – – – – – 445.9 394.0 376.2Deposits as percentage of assets 88.2 88.3 88.0 90.5 89.9 76.7 71.1 70.3 72.1 72.8Profit per employee (Rs. ’000) 1,077 2,382 3,205 2,826 2,026 774 3,119 3,585 3,034 3,139Deposit per employee (Rs. ’000) 90,157 107,378 116,513 128,809 146,261 170,537 164,997 163,855 149,927 164,961
Other information
Number of employees 2,879 2,915 3,050 3,275 3,129 2,943 3,358 3,636 4,384 4,470Number of branches 137 157 186 210 219 229 236 245 250 253Number of post offices/ sub-post offices 4,045 4,055 4,053 4,058 4,053 4,063 4,063 4,063 4,061 4,062Number of account holders (Million) 15.6 16.3 16.7 17.0 17.4 17.9 18.3 18.8 19.3 19.9
*Note: Highlighted information is based on LKAS/SLFRS
Statistical Indicators 2008-2017

399
National Savings Bank Annual Report 2017
Analysis of DepositsAnalysis of Deposits
2008 Rs. Mn.
2009Rs. Mn.
2010Rs. Mn.
2011Rs. Mn.
2012Rs. Mn.
2013Rs. Mn.
2014Rs. Mn.
2015Rs. Mn.
2016Rs. Mn.
2017Rs. Mn.
Local currency depositsSavings 71,667 79,280 94,118 105,108 106,177 113,165 139,384 160,814 173,583 185,201 Time 185,755 230,147 266,007 311,569 345,794 379,969 408,309 427,588 475,220 542,647
257,422 309,427 360,125 416,677 451,971 493,134 547,692 588,402 648,803 727,849 Growth % 10.0 20.2 13.5 15.7 8.5 9.1 11.1 7.4 10.3 12.2
Foreign currency depositsSavings 826 1,255 1,517 1,750 1,963 2,101 2,215 2,568 2,764 2,990 Time 1,314 2,325 2,788 3,422 3,717 6,654 4,153 4,806 5,714 6,373
2,140 3,580 4,305 5,172 5,679 8,755 6,368 7,373 8,478 9,364 Growth % 59.3 67.3 20.3 20.1 9.8 54.2 -27.3 15.8 15.0 10.5
Total deposits 259,562 313,007 364,430 421,849 457,650 501,890 554,060 595,776 657,280 737,213
Growth % 10.3 20.6 13.5 15.8 8.5 9.7 10.4 7.5 10.3 12.2
*Note: Highlighted information is based on LKAS/SLFRS.

400
National Savings Bank Annual Report 2017
GRI Indicator Disclosures Page Nos. Remarks/Omission
GRI GENERAL STANDARD DISCLOSURESGRI Standard 102-1 Name of the organisation 9102-2 Activities, brands, products and services 265, 372102-3 Location of headquarters 412102-4 Location of operations 100102-5 Ownership and legal form 412102-6 Markets served 100102-7 Scale of the organisation 15-16102-8 Information on employees and other workers 108-111102-9 Supply chain 134102-10 Significant changes to the organisation and its supply chain 10102-11 Precautionary principle or approach 52-62102-12 External initiatives 10102-13 Membership of associations 131102-14 Statement from senior decision-maker 21102-16 Values, principles, standards and norms of behaviour 94102-18 Governance structure 167102-40 List of stakeholder groups 46-51102-41 Collective bargaining agreements 120102-42 Identifying and selecting stakeholders 47102-43 Approach to stakeholder engagement 48-49102-44 Key topics and concerns raised 48-49102-45 Entities included in the Consolidated Financial Statements 10102-46 Defining report content and topic boundaries 10102-47 List of material topics 53-54102-48 Restatements of information 10102-49 Changes in reporting 10102-50 Reporting period 10102-51 Date of most recent report 10102-52 Reporting cycle 10102-53 Contact point for questions regarding the report 11102-54 Claims of reporting in accordance with the GRI Standards 10102-55 GRI content index 400102-56 External assurance 152
GRI SPECIFIC DISCLOSURESEconomic PerformanceGRI 103: Management Approach103-1 Explanation of the material topic and its boundary 52-62103-2 The management approach and its components 52-62103-3 Evaluation of the management approach 52-62
GRI Content Index GRI Content Index
GRI 102-55

401
National Savings Bank Annual Report 2017
GRI Indicator Disclosures Page Nos. Remarks/Omission
GRI 201: Economic Performance201-1 Direct economic value generated and distributed 74201-3 Defined benefit plan obligations and other retirement plans 115
Market PresenceGRI 103: Management Approach103-1 Explanation of the material topic and its boundary 52-62103-2 The management approach and its components 52-62103-3 Evaluation of the management approach 52-62
GRI 202: Market Presence202-1 Ratios of standard entry level wage by gender compared to local minimum wage 114202-2 Proportion of senior management hired from the local community 112
Indirect Economic ImpactsGRI 103: Management Approach103-1 Explanation of the material topic and its boundary 52-62103-2 The management approach and its components 52-62103-3 Evaluation of the management approach 52-62
GRI 203: Indirect Economic Impacts203-1 Infrastructure investments and services supported 136
Procurement PracticesGRI 103: Management Approach103-1 Explanation of the material topic and its boundary 52-62103-2 The management approach and its components 52-62103-3 Evaluation of the management approach 52-62
GRI 204: Procurement Practices204-1 Proportion of spending on local suppliers 134-135
Anti-corruptionGRI 103: Management Approach103-1 Explanation of the material topic and its boundary 52-62103-2 The management approach and its components 52-62103-3 Evaluation of the management approach 52-62
GRI 205: Anti-corruption 205-2 Communication and training about anti-corruption policies and procedures 119,125205-3 Confirmed incidents of corruption and actions taken 125
Anti-competitive BehaviourGRI 103: Management Approach103-1 Explanation of the material topic and its boundary 52-62103-2 The management approach and its components 52-62103-3 Evaluation of the management approach 52-62
GRI Content Index:
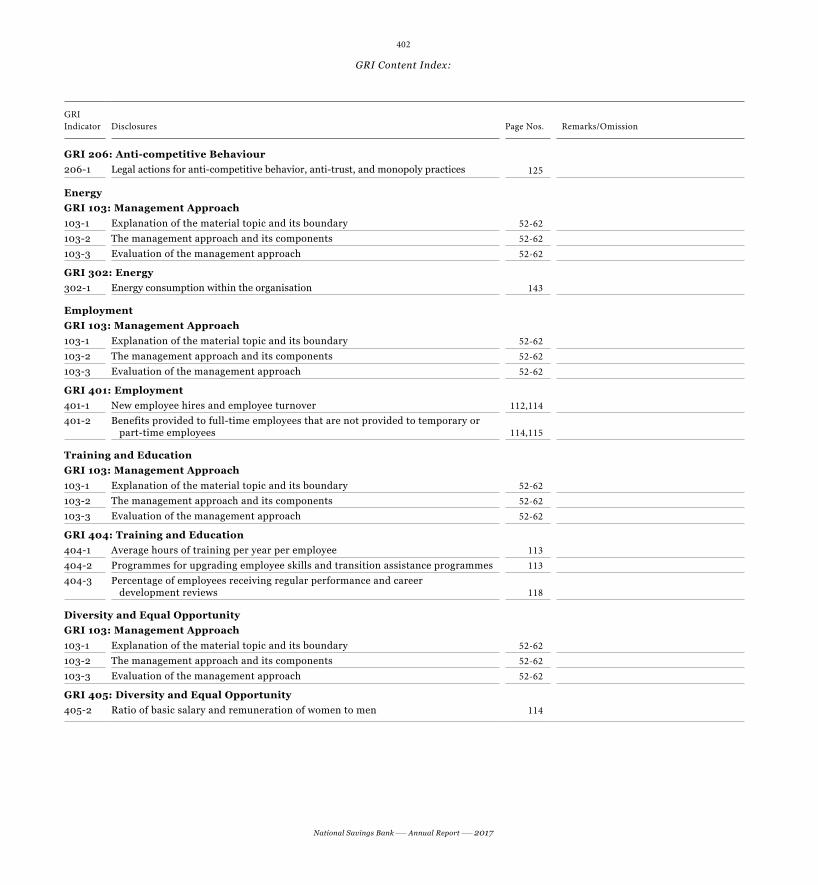
402
National Savings Bank Annual Report 2017
GRI Indicator Disclosures Page Nos. Remarks/Omission
GRI 206: Anti-competitive Behaviour206-1 Legal actions for anti-competitive behavior, anti-trust, and monopoly practices 125
EnergyGRI 103: Management Approach103-1 Explanation of the material topic and its boundary 52-62103-2 The management approach and its components 52-62103-3 Evaluation of the management approach 52-62
GRI 302: Energy302-1 Energy consumption within the organisation 143
EmploymentGRI 103: Management Approach103-1 Explanation of the material topic and its boundary 52-62103-2 The management approach and its components 52-62103-3 Evaluation of the management approach 52-62
GRI 401: Employment401-1 New employee hires and employee turnover 112,114401-2 Benefits provided to full-time employees that are not provided to temporary or
part-time employees 114,115
Training and EducationGRI 103: Management Approach103-1 Explanation of the material topic and its boundary 52-62103-2 The management approach and its components 52-62103-3 Evaluation of the management approach 52-62
GRI 404: Training and Education404-1 Average hours of training per year per employee 113404-2 Programmes for upgrading employee skills and transition assistance programmes 113404-3 Percentage of employees receiving regular performance and career
development reviews 118
Diversity and Equal OpportunityGRI 103: Management Approach103-1 Explanation of the material topic and its boundary 52-62103-2 The management approach and its components 52-62103-3 Evaluation of the management approach 52-62
GRI 405: Diversity and Equal Opportunity405-2 Ratio of basic salary and remuneration of women to men 114
GRI Content Index:

403
National Savings Bank Annual Report 2017
GRI Indicator Disclosures Page Nos. Remarks/Omission
Non-discriminationGRI 103: Management Approach103-1 Explanation of the material topic and its boundary 52-62103-2 The management approach and its components 52-62103-3 Evaluation of the management approach 52-62
GRI 406: Non-discrimination406-1 Incidents of discrimination and corrective actions taken 119
Freedom of Association and Collective BargainingGRI 103: Management Approach103-1 Explanation of the material topic and its boundary 52-62103-2 The management approach and its components 52-62103-3 Evaluation of the management approach 52-62
GRI 407: Freedom of Association and Collective Bargaining407-1 Operations and suppliers in which the right to freedom of association and
collective bargaining may be at risk 120
Local CommunitiesGRI 103: Management Approach103-1 Explanation of the material topic and its boundary 52-62103-2 The management approach and its components 52-62103-3 Evaluation of the management approach 52-62
GRI 413: Local Communities413-1 Operations with local community engagement, impact assessments, and
development programmes 135-139
Marketing and LabelingGRI 103: Management Approach103-1 Explanation of the material topic and its boundary 52-62103-2 The management approach and its components 52-62103-3 Evaluation of the management approach 52-62
GRI 417: Marketing and Labelling417-2 Incidents of non-compliance concerning product and service information and labelling 131417-3 Incidents of non-compliance concerning marketing communications 131
Customer PrivacyGRI 103: Management Approach103-1 Explanation of the material topic and its boundary 52-62103-2 The management approach and its components 52-62103-3 Evaluation of the management approach 52-62
GRI 418: Customer Privacy418-1 Substantiated complaints concerning breaches of customer privacy and losses of
customer data 131
GRI Content Index:

404
National Savings Bank Annual Report 2017
Bank of CeylonBank of Ceylon
No. 01, Devonshire Squre LondonEC2M4WDTel: +0207 377 18888Fax: +44 207 377 [email protected]: BCEYGB2L
Banca Popolare Banca Popolare
De SondrioDe Sondrio
Piazza Garibaldi 1623100,Sondrlom SO,ItalyTel: +39 0342528111Tel: +39 [email protected]: POSOIT22
Citi Bank NA Citi Bank NA
388, Greenwich StreetNew York, NY 10013USATel: +800-285-3000www.citibank.comSWIFT: CITIUS33
Commonwealth BankCommonwealth Bank
Sydney, NSW 2001.AustraliaGPO Box: 5227,Tel: +61 299993283www.commbank.com.auSWIFT: CTBAAU2S
Deutsche PostbankDeutsche Postbank
AG., Friedrich-Elbart-Allee53113 Bonn,Germany.Tel: +114-126, 49 22855005500www.postbank.deSWIFT: PBNKDEFF
Deutsche Bank Trust Deutsche Bank Trust
Company AmericasCompany Americas
No. 60, Wall Street,New York, NY 10005,USATel: +1 212 2502500Tel: +1 212 7970291www.deutsche-bank.comSWIFT: BKTRUS33
Deutsche Bank AGDeutsche Bank AG
P.O.Box: 60202Frankfurt am Main, Germany.Tel: +49 6991000Fax: +49 6991034225www.deutsche-bank.cemSWIFT: DEUTDEFF
KEB – Hana BankKEB – Hana Bank
55, Eulji-ro, Jung-gu, SeoulRepublic of KoreaTel: +82-02-2002-1111www.hanabank.comSWIFT: HNBNKRSE
Kookmin BankKookmin Bank
9-1, Namdaemunno 2-Ga,Jung-GuSeoul 100-092Tel: +82-(2)-2073-2869www.kbstar.comSWIFT: CZNBKRSE
The Bank of Tokyo-The Bank of Tokyo-
Mitsubishi UFJ, Ltd.Mitsubishi UFJ, Ltd.
2-7-1, Marunouchi, Chiyoda-ku, Tokyo, 100-8388, JapanTel : +81-3-3240-1111www.bk.mufg.jp
Unicredito SPAUnicredito SPA
Piazza Gae Aulenti 3Tower A20154 Milano, ItalyTel: +39 02 88 621Tel: +39 02 88 623 340www. unicreditgroup.euSWIFT: UNCRITMM
Woori BankWoori Bank
1-203, Hoehyeon-dong, Jung-gu, SeoulTel: +82-2-2006 5000www.wooribank.comSWIFT: HVBK KR SE
Correspondent BanksCorrespondent Banks
DBS Bank, Singapore DBS Bank, Singapore
(The Development Bank of (The Development Bank of
Singapore Ltd.)Singapore Ltd.)
2 Changi Business Park Crescent, Lobby A No.04-01 DBS Asia Hub, Singapore 486029,Tel: +65-6-2222200Fax: +65-6-8789010www.dbs.com
PostFinance Ltd.PostFinance Ltd.
Mingerstrasse 20, 3030 Berne,Switzerland,Tel: +41-8-4888710SWIFT: POFICHBEXXX
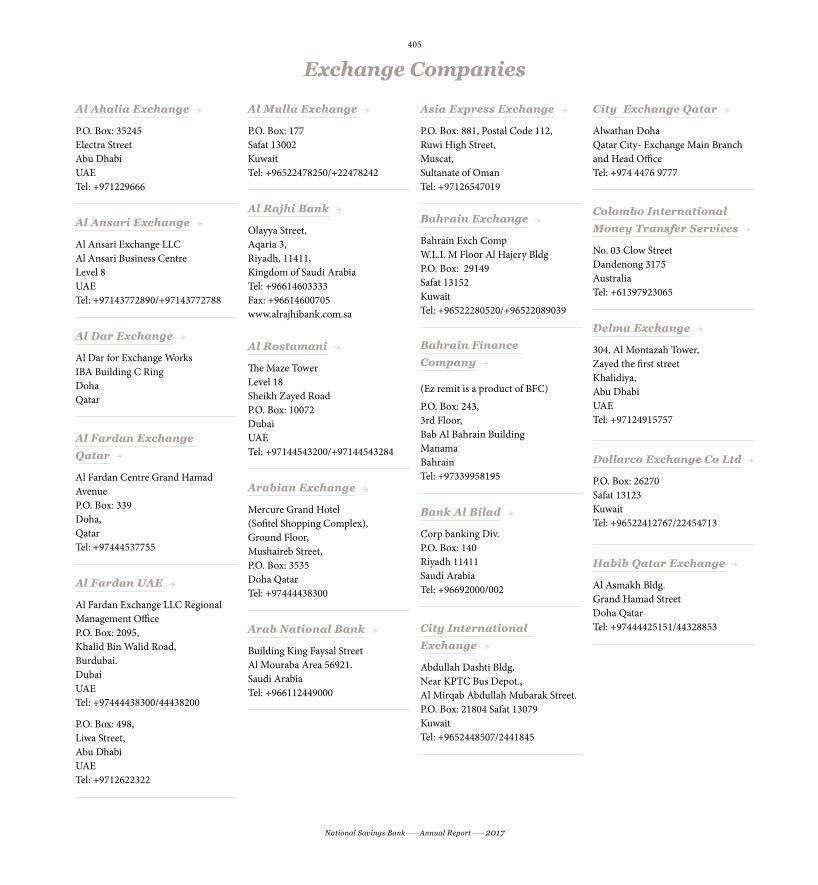
405
National Savings Bank Annual Report 2017
Al Ahalia ExchangeAl Ahalia Exchange
P.O. Box: 35245Electra StreetAbu Dhabi UAETel: +971229666
Al Ansari ExchangeAl Ansari Exchange
Al Ansari Exchange LLCAl Ansari Business Centre Level 8UAE Tel: +97143772890/+97143772788
Al Dar ExchangeAl Dar Exchange
Al Dar for Exchange WorksIBA Building C RingDoha Qatar
Al Fardan Exchange Al Fardan Exchange
QatarQatar
Al Fardan Centre Grand Hamad AvenueP.O. Box: 339Doha, Qatar Tel: +97444537755
Al Fardan UAEAl Fardan UAE
Al Fardan Exchange LLC Regional Management Office P.O. Box: 2095, Khalid Bin Walid Road, Burdubai. DubaiUAE Tel: +97444438300/44438200
P.O. Box: 498,Liwa Street, Abu Dhabi UAETel: +9712622322
Al Mulla ExchangeAl Mulla Exchange
P.O. Box: 177Safat 13002KuwaitTel: +96522478250/+22478242
Al Rajhi BankAl Rajhi Bank
Olayya Street,Aqaria 3,Riyadh, 11411,Kingdom of Saudi ArabiaTel: +96614603333Fax: +96614600705www.alrajhibank.com.sa
Al RostamaniAl Rostamani
The Maze Tower Level 18Sheikh Zayed RoadP.O. Box: 10072Dubai UAE Tel: +97144543200/+97144543284
Arabian ExchangeArabian Exchange
Mercure Grand Hotel(Sofitel Shopping Complex),Ground Floor, Mushaireb Street, P.O. Box: 3535 Doha Qatar Tel: +97444438300
Arab National BankArab National Bank
Building King Faysal StreetAl Mouraba Area 56921. Saudi Arabia Tel: +966112449000
Asia Express ExchangeAsia Express Exchange
P.O. Box: 881, Postal Code 112, Ruwi High Street,Muscat,Sultanate of OmanTel: +97126547019
Bahrain ExchangeBahrain Exchange
Bahrain Exch Comp W.L.L M Floor Al Hajery Bldg P.O. Box: 29149 Safat 13152 KuwaitTel: +96522280520/+96522089039
Bahrain Finance Bahrain Finance
CompanyCompany
(Ez remit is a product of BFC)
P.O. Box: 243,3rd Floor, Bab Al Bahrain Building Manama BahrainTel: +97339958195
Bank Al BiladBank Al Bilad
Corp banking Div.P.O. Box: 140 Riyadh 11411Saudi ArabiaTel: +96692000/002
City International City International
ExchangeExchange
Abdullah Dashti Bldg. Near KPTC Bus Depot., Al Mirqab Abdullah Mubarak Street. P.O. Box: 21804 Safat 13079 KuwaitTel: +9652448507/2441845
City Exchange QatarCity Exchange Qatar
Alwathan DohaQatar City- Exchange Main Branch and Head Office Tel: +974 4476 9777
Colombo International Colombo International
Money Transfer ServicesMoney Transfer Services
No. 03 Clow StreetDandenong 3175AustraliaTel: +61397923065
Delma ExchangeDelma Exchange
304, Al Montazah Tower, Zayed the first street Khalidiya, Abu Dhabi UAETel: +97124915757
Dollarco Exchange Co LtdDollarco Exchange Co Ltd
P.O. Box: 26270Safat 13123 KuwaitTel: +96522412767/22454713
Habib Qatar ExchangeHabib Qatar Exchange
Al Asmakh Bldg. Grand Hamad Street Doha QatarTel: +97444425151/44328853
Exchange CompaniesExchange Companies

406
National Savings Bank Annual Report 2017
Index Index ExchangeExchange/former /former
Habib Habib ExchangeExchange UAE UAE
Office 201, 2nd Floor, Sons of Jassim Darwish Building,Zayed 1st Street Khalidiyah P.O. Box: 2370 Abu Dhabi UAETel: +97126272656
Instant CashInstant Cash
Instant Cash FZE P.O. Box: 3014 Dubai UAETel: +971 4 2059000 Ext: 260
Kapruka Pty LimitedKapruka Pty Limited
2251, Princes Highway, MulgraveAustralia Tel: +61395445060/95432123
Majan ExchangeMajan Exchange
P.O. Box: 583P.C. 117RuwiSultanate of OmanTel: +96824794017/18
National Exchange National Exchange
CompanyCompany
Via Ferruccio 30,00185RomeItaliaTel: +390644341221(Direct)
Oman & UAE ExchangeOman & UAE Exchange
P.O. Box: 1116Al HamriyahP.C. 131Muscat Sultanate of OmanTel: +96824796533
Samba Financial GroupSamba Financial Group
Samba Financial GroupP.O. Box: 833Riyadh 11421Kingdom of Saudi ArabiaTel: +966112117473/966112117424
TransfastTransfast
44, Wall Street 4th Floor New York NY10005Trans-Fast GCC 903Al Thurayya 2 Dubai Media City DubaiUAETel: +97144587251
UAE Exchange – UAEUAE Exchange – UAE
UAE Exchange Centre LLC P.O. Box: 170, 5th Floor, Tamouh Tower (Building No. 12), Marina Square, Al Reem Island,Abu Dhabi,UAETel: +97124945406
UnistreamUnistream
20Verhnyaya Maskovka Street Building 2127083MoscowRussiaTel: +74955179260
ValutransValutrans
Valutrans SPA Via M Gioia 16820125 Milan ItalyTel: +390291431306
Exchange Companies
Wall StreetWall Street
Wall Street Exchange Center LLC2201, Twin TowersBaniyas RoadDubai UAETel: +97142284889/+971508764289/ +971504801659
Xpress MoneyXpress Money
Xpress Money Services Limited.6th FloorAl Ameri Building TecomP.O. Box: 643996Sheikh Zayed RoadDubai UAETel: +97148186000 ext 6132 / +97148186227

407
National Savings Bank Annual Report 2017
Eurogiro MembersEurogiro Members
La Banque PostaleLa Banque Postale
FranceFrance
115 Rue de sevres CP.P210 75275 Paris Cedex 06FranceTel: +33157754947
Poste Italiane S.P.A.Poste Italiane S.P.A.
Poste ItalianeS.P.A. VialeEuropa 17500144 RomaItalyTel: +390659583470/+39065942478
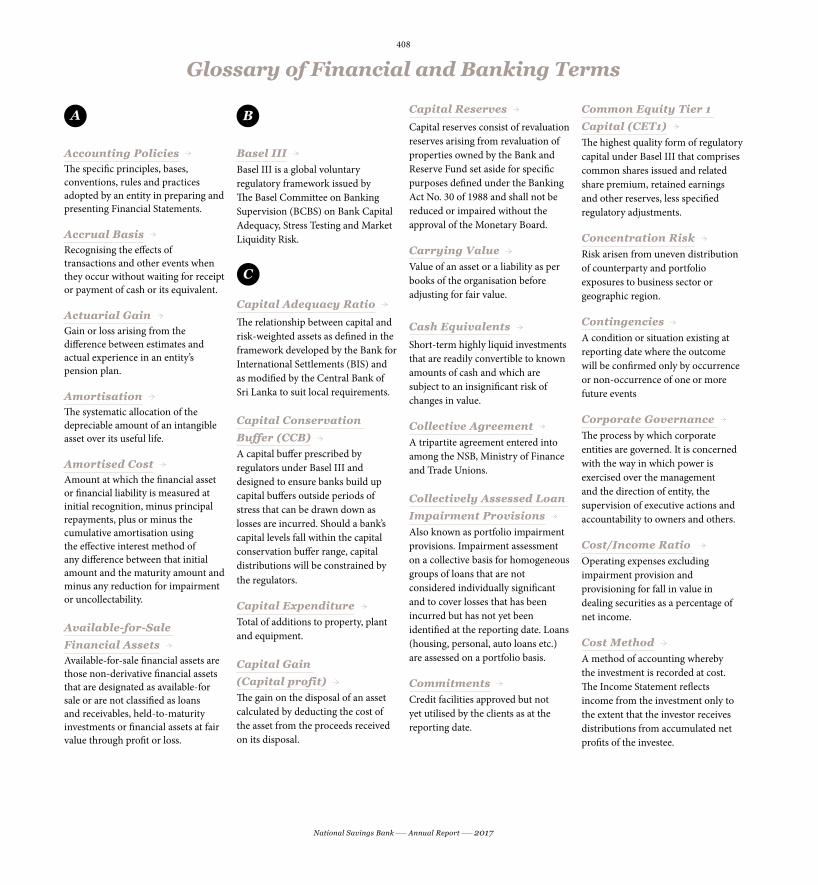
408
National Savings Bank Annual Report 2017
A
Accounting PoliciesAccounting Policies The specific principles, bases, conventions, rules and practices adopted by an entity in preparing and presenting Financial Statements.
Accrual BasisAccrual Basis Recognising the effects of transactions and other events when they occur without waiting for receipt or payment of cash or its equivalent.
Actuarial GainActuarial Gain Gain or loss arising from the difference between estimates and actual experience in an entity’s pension plan.
AmortisationAmortisation The systematic allocation of the depreciable amount of an intangible asset over its useful life.
Amortised CostAmortised Cost Amount at which the financial asset or financial liability is measured at initial recognition, minus principal repayments, plus or minus the cumulative amortisation using the effective interest method of any difference between that initial amount and the maturity amount and minus any reduction for impairment or uncollectability.
Available-for-Sale Available-for-Sale
Financial AssetsFinancial Assets Available-for-sale financial assets are those non-derivative financial assets that are designated as available-for sale or are not classified as loans and receivables, held-to-maturity investments or financial assets at fair value through profit or loss.
B
Basel IIIBasel III Basel III is a global voluntary regulatory framework issued by The Basel Committee on Banking Supervision (BCBS) on Bank Capital Adequacy, Stress Testing and Market Liquidity Risk.
C
Capital Adequacy RatioCapital Adequacy Ratio
The relationship between capital and risk-weighted assets as defined in the framework developed by the Bank for International Settlements (BIS) and as modified by the Central Bank of Sri Lanka to suit local requirements.
Capital Conservation Capital Conservation
Buffer (CCB)Buffer (CCB) A capital buffer prescribed by regulators under Basel III and designed to ensure banks build up capital buffers outside periods of stress that can be drawn down as losses are incurred. Should a bank’s capital levels fall within the capital conservation buffer range, capital distributions will be constrained by the regulators.
Capital ExpenditureCapital Expenditure Total of additions to property, plant and equipment.
Capital Gain Capital Gain
(Capital profit)(Capital profit) The gain on the disposal of an asset calculated by deducting the cost of the asset from the proceeds received on its disposal.
Capital ReservesCapital Reserves
Capital reserves consist of revaluation reserves arising from revaluation of properties owned by the Bank and Reserve Fund set aside for specific purposes defined under the Banking Act No. 30 of 1988 and shall not be reduced or impaired without the approval of the Monetary Board.
Carrying ValueCarrying Value Value of an asset or a liability as per books of the organisation before adjusting for fair value.
Cash EquivalentsCash Equivalents
Short-term highly liquid investments that are readily convertible to known amounts of cash and which are subject to an insignificant risk of changes in value.
Collective AgreementCollective Agreement A tripartite agreement entered into among the NSB, Ministry of Finance and Trade Unions.
Collectively Assessed Loan Collectively Assessed Loan
Impairment ProvisionsImpairment Provisions Also known as portfolio impairment provisions. Impairment assessment on a collective basis for homogeneous groups of loans that are not considered individually significant and to cover losses that has been incurred but has not yet been identified at the reporting date. Loans (housing, personal, auto loans etc.) are assessed on a portfolio basis.
CommitmentsCommitments Credit facilities approved but not yet utilised by the clients as at the reporting date.
Common Equity Tier 1 Common Equity Tier 1
Capital (CET1)Capital (CET1) The highest quality form of regulatory capital under Basel III that comprises common shares issued and related share premium, retained earnings and other reserves, less specified regulatory adjustments.
Concentration RiskConcentration Risk Risk arisen from uneven distribution of counterparty and portfolio exposures to business sector or geographic region.
ContingenciesContingencies A condition or situation existing at reporting date where the outcome will be confirmed only by occurrence or non-occurrence of one or more future events
Corporate Governance Corporate Governance The process by which corporate entities are governed. It is concerned with the way in which power is exercised over the management and the direction of entity, the supervision of executive actions and accountability to owners and others.
Cost/Income Ratio Cost/Income Ratio Operating expenses excluding impairment provision and provisioning for fall in value in dealing securities as a percentage of net income.
Cost MethodCost Method A method of accounting whereby the investment is recorded at cost. The Income Statement reflects income from the investment only to the extent that the investor receives distributions from accumulated net profits of the investee.
Glossary of Financial and Banking TermsGlossary of Financial and Banking Terms

409
National Savings Bank Annual Report 2017
Glossary of Financial and Banking Terms
Credit RatingsCredit Ratings An evaluation of a corporate’s ability to repay its obligation or the likelihood of not defaulting, carried out by an independent rating agency.
Credit RiskCredit Risk Credit risk or default risk is most simply defined as the potential that a borrower or counterparty will fail to meet its obligations in accordance with agreed terms and conditions.
Customer DepositsCustomer Deposits Money deposited by account holders. Such funds are recorded as liabilities.
D
Dealing SecuritiesDealing Securities Marketable securities that are acquired and held with the intention of reselling them in the short-term.
DebentureDebenture A medium-term debt instrument issued by a corporate entity.
Deferred TaxDeferred Tax Sum set aside for tax in the Financial Statements that will become payable in a financial year other than the current financial year.
DepreciationDepreciation The systematic allocation of the depreciable amount of an asset over its useful life.
DerecognitionDerecognition Removal of previously recognised financial assets or financial liability from an entity’s statement of financial position.
DerivativeDerivative Financial contract of which the value is derived from the value of underlined assets.
E
Earnings per Ordinary Earnings per Ordinary
Share (EPS)Share (EPS) Profit attributable to ordinary shareholders divided by the number of ordinary shares in issue.
Economic Value Added Economic Value Added
(EVA)(EVA) A measure of productivity which takes into consideration cost of total invested equity.
Effective Income Effective Income Tax RateTax Rate Provision for taxation divided by the profit before taxation
Effective Interest RateEffective Interest Rate Rate that exactly discounts estimated future cash payments or receipts through the expected life of the financial instruments or when appropriate a shorter period to the net carrying amount of the financial asset or financial liability
Equity MethodEquity Method The equity method is a method of accounting whereby the investment is initially recognised at cost and adjusted thereafter for the post-acquisition changes in the investor’s share of net assets of the investee. The profit or loss of the investor includes the investor’s share of the profit or loss of the investee.
Equity RiskEquity Risk Risk of depreciating equity investments due to stock market dynamics
Exchange Gain/LossExchange Gain/Loss Profit earned on foreign currency transactions arising from the difference in foreign exchange rates between the transaction/last Reporting date and the settlement/ Reporting date. Also arises from trading in foreign currencies.
F
Fair ValueFair Value The amount for which an asset could be exchanged or a liability settled, between knowledgeable, willing parties in an arm’s length transaction.
Financial AssetFinancial Asset Is any asset that is cash, an equity instrument of another entity or a contractual right to receive cash or another financial asset from another entity.
Financial Asset or Financial Financial Asset or Financial
Liability at Fair Value Liability at Fair Value
through Profit or Lossthrough Profit or Loss Financial asset or financial liability that is held-for-trading or upon initial recognition designated by the entity as ‘at fair value through profit or loss’.
Financial InstrumentFinancial Instrument Financial instrument is any contract that gives rise to a financial asset of one entity and a financial liability or equity instrument of another entity.
Financial LiabilityFinancial Liability Is a contractual obligation to deliver cash or another financial asset to another entity.
Foreclosed PropertiesForeclosed Properties Properties acquired in full or partial; satisfaction of debts.
Foreign Currency RiskForeign Currency Risk Risk exists in transaction other than the local currency. Adverse movements in foreign exchange rates may decline the value of Assets/ Liabilities held in terms of foreign currency.
Foreign Exchange Foreign Exchange
ContractContract Agreement between two parties to exchange one currency for another at a future date at a rate agreed upon today.
G
General ProvisionsGeneral Provisions These are provisions made on loans and advances for anticipated losses on aggregate exposures where credit losses cannot yet be determined on an individual facility basis.
GroupGroup A group is a parent and all its subsidiaries.
GuaranteesGuarantees Three party agreement involving a promise by one party (the guarantor) to fulfill the obligations of a person owing a debt if that person fails to perform.
H
HedgingHedging A strategy under which transactions are effected with the aim of providing cover against the risk of unfavourable price movements (interest rates and prices of commodities etc.).
Held-to-Maturity Held-to-Maturity
Investments (HTM)Investments (HTM) Non-derivative financial assets with fixed or determinable payments and fixed maturity that an entity has the positive intention and ability to hold to maturity.
Held-for-Trading (HFT)Held-for-Trading (HFT) Debt and equity investments that are purchased with the intent of selling them within a short period of time (usually less than one year).
I
ICCAPICCAP Process by which the Bank ensures additional capital is provided for banking risks other than those covered in Pillar 1.
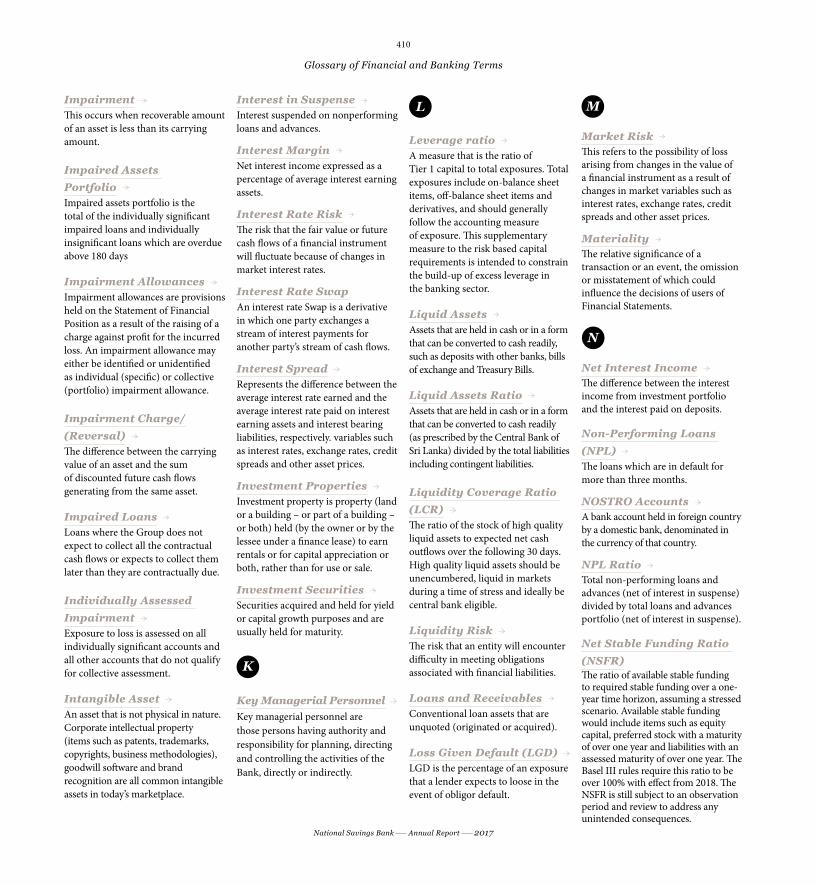
410
National Savings Bank Annual Report 2017
ImpairmentImpairment This occurs when recoverable amount of an asset is less than its carrying amount.
Impaired Assets Impaired Assets
PortfolioPortfolio Impaired assets portfolio is the total of the individually significant impaired loans and individually insignificant loans which are overdue above 180 days
Impairment AllowancesImpairment Allowances Impairment allowances are provisions held on the Statement of Financial Position as a result of the raising of a charge against profit for the incurred loss. An impairment allowance may either be identified or unidentified as individual (specific) or collective (portfolio) impairment allowance.
Impairment Charge/Impairment Charge/
(Reversal)(Reversal) The difference between the carrying value of an asset and the sum of discounted future cash flows generating from the same asset.
Impaired LoansImpaired Loans Loans where the Group does not expect to collect all the contractual cash flows or expects to collect them later than they are contractually due.
Individually Assessed Individually Assessed
ImpairmentImpairment Exposure to loss is assessed on all individually significant accounts and all other accounts that do not qualify for collective assessment.
Intangible AssetIntangible Asset An asset that is not physical in nature. Corporate intellectual property (items such as patents, trademarks, copyrights, business methodologies), goodwill software and brand recognition are all common intangible assets in today’s marketplace.
Interest in SuspenseInterest in Suspense Interest suspended on nonperforming loans and advances.
Interest MarginInterest Margin Net interest income expressed as a percentage of average interest earning assets.
Interest Rate RiskInterest Rate Risk The risk that the fair value or future cash flows of a financial instrument will fluctuate because of changes in market interest rates.
Interest Rate SwapInterest Rate SwapAn interest rate Swap is a derivative in which one party exchanges a stream of interest payments for another party’s stream of cash flows.
Interest SpreadInterest Spread Represents the difference between the average interest rate earned and the average interest rate paid on interest earning assets and interest bearing liabilities, respectively. variables such as interest rates, exchange rates, credit spreads and other asset prices.
Investment PropertiesInvestment Properties Investment property is property (land or a building – or part of a building – or both) held (by the owner or by the lessee under a finance lease) to earn rentals or for capital appreciation or both, rather than for use or sale.
Investment SecuritiesInvestment Securities Securities acquired and held for yield or capital growth purposes and are usually held for maturity.
K
Key Managerial PersonnelKey Managerial Personnel Key managerial personnel are those persons having authority and responsibility for planning, directing and controlling the activities of the Bank, directly or indirectly.
L
Leverage ratioLeverage ratio A measure that is the ratio of Tier 1 capital to total exposures. Total exposures include on-balance sheet items, off-balance sheet items and derivatives, and should generally follow the accounting measure of exposure. This supplementary measure to the risk based capital requirements is intended to constrain the build-up of excess leverage in the banking sector.
Liquid AssetsLiquid Assets Assets that are held in cash or in a form that can be converted to cash readily, such as deposits with other banks, bills of exchange and Treasury Bills.
Liquid Assets RatioLiquid Assets Ratio Assets that are held in cash or in a form that can be converted to cash readily (as prescribed by the Central Bank of Sri Lanka) divided by the total liabilities including contingent liabilities.
Liquidity Coverage Ratio Liquidity Coverage Ratio
(LCR)(LCR) The ratio of the stock of high quality liquid assets to expected net cash outflows over the following 30 days. High quality liquid assets should be unencumbered, liquid in markets during a time of stress and ideally be central bank eligible.
Liquidity RiskLiquidity Risk The risk that an entity will encounter difficulty in meeting obligations associated with financial liabilities.
Loans and ReceivablesLoans and Receivables Conventional loan assets that are unquoted (originated or acquired).
Loss Given Default (LGD)Loss Given Default (LGD) LGD is the percentage of an exposure that a lender expects to loose in the event of obligor default.
M
Market RiskMarket Risk This refers to the possibility of loss arising from changes in the value of a financial instrument as a result of changes in market variables such as interest rates, exchange rates, credit spreads and other asset prices.
MaterialityMateriality The relative significance of a transaction or an event, the omission or misstatement of which could influence the decisions of users of Financial Statements.
N
Net Interest IncomeNet Interest Income The difference between the interest income from investment portfolio and the interest paid on deposits.
Non-Performing Loans Non-Performing Loans
(NPL)(NPL) The loans which are in default for more than three months.
NOSTRO AccountsNOSTRO Accounts A bank account held in foreign country by a domestic bank, denominated in the currency of that country.
NPL RatioNPL Ratio Total non-performing loans and advances (net of interest in suspense) divided by total loans and advances portfolio (net of interest in suspense).
Net Stable Funding Ratio Net Stable Funding Ratio
(NSFR)(NSFR)The ratio of available stable funding to required stable funding over a one-year time horizon, assuming a stressed scenario. Available stable funding would include items such as equity capital, preferred stock with a maturity of over one year and liabilities with an assessed maturity of over one year. The Basel III rules require this ratio to be over 100% with effect from 2018. The NSFR is still subject to an observation period and review to address any unintended consequences.
Glossary of Financial and Banking Terms
411
National Savings Bank Annual Report 2017
O
Off-Balance Sheet Off-Balance Sheet
TransactionsTransactions Transactions that are not recognised as assets or liabilities in the Statement of Financial Position, but which give rise to contingencies and commitments.
Operational RiskOperational Risk This refers to the risk of loss resulting from inadequate or failed internal processes, people and systems or from external events.
P
ParentParent A parent is an entity that has one or more subsidiaries.
PortfolioPortfolio A pool of investments including investment in Government Securities, loans and advances, equities, etc.
Probability of Default Probability of Default
(PD)(PD) PD is an internal estimate for each borrower grade of the likelihood that an obligor will default on an obligation.
Provision CoverProvision Cover Total provisions for loan losses expressed as a percentage of net non-performing loans and advances before discounting for provisions on non-performing loans and advances.
R
Return on Assets (ROA)Return on Assets (ROA) Net income expressed as a percentage of average total assets, used along with ROE, as a measure of profitability and as a basis of intra-industry performance comparison.
Return on Equity (ROA)Return on Equity (ROA) Net income, less preferred share dividends if any, expressed as a percentage of average ordinary shareholders’ equity.
Related PartiesRelated Parties Parties where one party has the ability to control the other party or exercise significant influence over the other party in making financial and operating decisions, directly or indirectly as per the Sri Lanka Accounting Standard No. 30 on ‘Related Party Disclosures’.
REPOsREPOs Repurchase agreements. Securities sold to lenders with the commitment to buy back on a later date at a fixed price plus interest.
Revenue ReserveRevenue Reserve Reserves set aside for future distribution and investment.
Risk Weighted AssetsRisk Weighted Assets The sum of total of assets as per the statement of financial position and the credit equivalent of off-balance sheet exposures multiplied by the relevant risk weighting factors. All the risk components are considered together to correct the nominal value of financial assets.
Rupee LoanRupee Loan Rupee securities issued by the Central Bank of Sri Lanka on behalf of the Government of Sri Lanka.
S
Shareholders’ FundsShareholders’ Funds A capital reserve created as per the provisions of the Banking Act No. 30 of 1988.
Single Borrower LimitSingle Borrower Limit 33% of the regulatory capital base.
Statutory Reserve FundStatutory Reserve Fund A capital reserve created as per the provisions of the Banking Act No. 30 of 1988.
Stress TestStress Test Integrated test that shows to varying degrees whether the Bank can withstand unforeseen scenarios of varying severity.
SubsidiarySubsidiary An entity, including an unincorporated entity such as a partnership, which is controlled by another entity known as the parent.
Substance Over FormSubstance Over Form The consideration that the accounting treatment and the presentation in Financial Statements of transactions and events should be governed by their substance and financial reality and not merely by legal form.
Swaps (Currency)Swaps (Currency) The simultaneous purchase of an amount of a currency for spot settlement and the sale of the same amount of the same currency for forward settlement. Alternatively a simultaneous spot sale and forward purchase of a currency.
T
Tier 1 Capital (Core Tier 1 Capital (Core
Capital)Capital) Core measure of the financial strength of the Bank representing permanent shareholders’ equity and reserves created or increased by appropriations of retained earnings or other surpluses.
Glossary of Financial and Banking Terms
Tier 2 Capital Tier 2 Capital
(Supplementary Capital)(Supplementary Capital) Supplementary capital representing revaluation gains, general provisions and other capital instruments which combine certain characteristics of equity and debt such as hybrid capital instruments and subordinated term debts.
Total CapitalTotal Capital Total Capital is a summation of the core capital (Tier 1) and the supplementary capital (Tier 2).
Treasury BillTreasury Bill A short-term debt instrument issued on auction basis by the Central Bank of Sri Lanka on behalf of the Government of Sri Lanka.
U
Unit TrustUnit Trust An undertaking formed to invest in securities under the terms of a trust deed.
Useful life Useful life is the period over which an asset is expected to be available for use by an entity or the number of production or similar units expected to be obtained from the asset by an entity.
V
Value AddedValue Added Wealth created by providing banking and other services less the cost of providing such services. The value added is allocated among the employees, the providers of capital, to Government by way of taxes and retained for expansion and growth.

412
National Savings Bank Annual Report 2017
Name of the Bank
National Savings Bank
Legal Form GRI 102-5
A Government-owned bank incorporated in Sri Lanka by the National Savings Bank Act No. 30 of 1971 and was granted the status of the Licensed Specialised Bank in terms of the Banking Act No. 30 of 1988.
Registered Office and Head Office GRI 102-3
“Savings House”, No. 255, Galle Road, Colombo 03, Sri Lanka. Tel: 94 11 2573008-15 Fax: 94 11 2573178E-mail: [email protected]: http://www.nsb.lkSwift Code: NSBALKLX
VAT Registration Number
4 09046266-7000
Service Outlets
253 Branches 286 ATMs
Agency Network
653 Post Offices and 3,409 Sub-Post Offices throughout the Island.
Credit Rating
The Bank has been assigned AAA (lka) long-term credit rating by the Fitch Rating Lanka (Pvt) Limited. B+ Stable International Credit Rating from Standard and Poors.B+ Stable International Credit Rating by Fitch Ratings.
Board of Directors
Aswin De Silva – Chairman D L P R Abeyaratne – Director (Ex Officio)Suranga Naullage – Director Ajith Pathirana – DirectorA K Seneviratne – Director (Ex Officio) Anil Rajakaruna – Director Chandima Hemachandra – Director
General Manager/CEO
S D N Perera
Board Secretary
Ms M A P Muhandiram
Board Audit Committee
D L P R Abeyaratne – Chairman A K Seneviratne – Member Anil Rajakaruna – Member
Board Human Resource and Remuneration Committee
Aswin De Silva – Chairman D L P R Abeyaratne – Member Ajith Pathirana – Member
Board Nomination Committee
D L P R Abeyaratne – Chairman Ajith Pathirana – MemberA K Seneviratne – Member
Board Integrated Risk Management Committee
A K Seneviratne – Chairman Suranga Naullage – Member Anil Rajakaruna – Member
Board Credit Committee
Aswin De Silva – ChairmanAjith Pathirana – MemberChandima Hemachandra – Member
Board Information Technology Strategy Committee
Aswin De Silva – ChairmanD L P R Abeyaratne – MemberChandima Hemachandra – Member
Compliance Officer
Ms I K L Sasi Mahendran
Auditors
Auditor General
Subsidiary Name of the Company
NSB Fund Management Co. Limited
Registered Office and Head Office
1st Floor, “Savings House”, National Savings Bank, No. 255, Galle Road, Colombo 03, Sri Lanka.Tel.: 94 11 2564601, 2467731 Fax: 94 11 2564706 E-mail: [email protected] Code: NSBFLKLXXXX
Corporate InformationCorporate Information
Board of Directors
Aswin De Silva – ChairmanD L P R Abeyaratne – DirectorSuranga Naullage – DirectorS D N Perera – DirectorAjith Pathirana – Director Ravi Amarasekera – DirectorDammika Ambewela – DirectorNimal Jayasundara – DirectorD S W Samarasekera – Director Yasas De Silva – DirectorSrilal Fernando – Director
Chief Executive Officer
Ms G V A D D Silva
Auditors
Auditor General
Company Secretary
Ms Farzana Aniff