| no. 1 app for banking & ssc preparation website: email · data related to human resource...
TRANSCRIPT
1 Adda247 | No. 1 APP for Banking & SSC Preparation Website:store.adda247.com | Email:[email protected]

2 Adda247 | No. 1 APP for Banking & SSC Preparation Website:store.adda247.com | Email:[email protected]
3 Adda247 | No. 1 APP for Banking & SSC Preparation Website:store.adda247.com | Email:[email protected]
Directions (1–5): This data is regarding total number of employees working in Administration
(admin), Operations (Ops.) and other departments of corporate divisions of Companies A and B.
The total number of employees working in both the companies together is 4800. The respective ratio
of number of employees in Companies A and B is 5 : 7. Each employee works in only one of the 3
Departments
i.e. “ops”, “Admin” and “others”.
In company A, 70% of the total employees are males. 60% of the total male employees work in ‘Ops’
out of the remaining male employees, 1
8 th work in ‘Admin’. Out of the total female employees, 24%
work in ‘Admin’ and 5
8th of the remaining female employees work in ‘Ops’.
In company B, 80% of the total employees are males. 65% of the total male employees work in ‘Ops’.
Number of male employees who work in other departments in Company B is 20% more than the
male employees who work in ‘Other Departments’ in company A. Number of female employees who
work in Ops in Company B are less than the number of male employees who work for ‘Ops’ in the
same company by 75%. Out of the remaining female employees, 1
4 work in ‘Admin’.
Q1. What per cent of the total number of male employees in company A work in ‘other’
departments?
(a) 45 (b) 25 (c) 30
(d) 35 (e) 40
Q2. What per cent the total number of female employees in company B work in administration
department?
(a) 18.5 (b) 8.75 (c) 14
(d) 16 (e) 19
Q3. What is the total number of female employees who work on Ops in Company A and B
together?
(a) 681 (b) 781 (c) 689
(d) 649 (e) 788
Q4. What is the difference between the average number of males working in ‘Admin’ in both the
companies together and average number of females working ‘Other Departments’ in both the
companies together?
(a) 26 (b) 36 (c) 16
(d) 24 (e) 14

4 Adda247 | No. 1 APP for Banking & SSC Preparation Website:store.adda247.com | Email:[email protected]
Q5. In company B, what is the respective ratio between the total number of employees (both male
and female) who work in ‘Admin’ and the total number of employees (both male and female) who
work in ‘Other Department’ in the same company?
(a) 2 : 3 (b) 1 : 3 (c) 1 : 4
(d) 3 : 5 (e) 1 : 5
Solution(1-5):
For company A , Total = 2000
Male (1400) Female (600)
Ops 840 285
Admin 70 144
Other 490 171
For Company B –, Total = 2800
Male (2240) Female (560)
Ops 1456 364
Admin 196 49
Other 588 147
S1. Ans.(d)
Sol. Required % = 490
1400× 100 = 35%
S2. Ans.(b)
Sol.Required % = 49
560× 100 = 8.75%
S3. Ans.(d)
Sol.Required no. of female = 285 + 364 = 649
S4. Ans.(a)
Sol. Required difference =171+147
2−
70+196
2
= 159 – 133
= 26
S5. Ans.(b)
Sol. Required Ratio = (196 + 49) : (588 + 147)
= 245 : 735
= 1 : 3

5 Adda247 | No. 1 APP for Banking & SSC Preparation Website:store.adda247.com | Email:[email protected]
Directions (6-10): Study the table and answer the given questions.
Data related to Human Resource Dept. of a multinational company (X) which has 145 offices across 8
countries.
Countries Offices Total Employees Respective Ratio of male
& female employees % of post graduate
A 16 2568 5 : 7 75
B 18 2880 11 : 5 65
C 14 2310 10 : 11 40
D 22 3575 3 : 2 60
E 13 2054 7 : 6 50
F 17 2788 20 : 21 75
G 24 3720 8 : 7 55
H 21 3360 8 : 6 80
Q6. The number of male post graduate employees in country H is 1800. If number of female post
graduates increase by 50% in the next year, what % of female employees in that particular country
is post graduate? (Given that all other data remain same)
(a) 76.8% (b) 74% (c) 92.5%
(d) 90% (e) 80%
Q7. In which country, is the percentage of women employees to number of employees (both male
& female) is ranked third lowest?
(a) E (b) B (c) H
(d) F (e) A
Q8. What is the ratio between total number of male employees in countries B and H together and
total number of post graduate employees in same countries?
(a) 76 : 65 (b) 86 : 85 (c) 75 : 76
(d)65 : 76 (e)12 : 33
Q9. What is the difference between average number of post graduate employees in countries A, B
and D together and average number of post graduate employees in countries F, G and H together?
(a) 294 (b) 282 (c) 284
(d) 280 (e) 200
Q10. Which country has the 2nd highest number of average employees per office?
(a) D (b) H (c) G
(d) A (e) F

6 Adda247 | No. 1 APP for Banking & SSC Preparation Website:store.adda247.com | Email:[email protected]
S6. Ans.(c) Sol.
Graduate = 3360 ×4
5= 2688
Female graduate = 2688 – 1800 = 888
Female employee = 3360 ×6
14= 1440
Female graduate next year = 888 ×3
2= 1332
% of female graduate =1332
1440× 100 = 92.5%
S7. Ans.(c)
Sol.
A ⇒7
12× 100 = 58.34% B ⇒
5
16× 100 = 31.25%
C ⇒11
21× 100 = 52.4% D ⇒
2
5× 100 = 40%
E ⇒6
13× 100 = 46.15% F ⇒
21
41× 100 = 51.22%
G⇒7
15× 100 = 46.67% H ⇒
6
14× 100 = 42.86%
Clearly, H is the third lowest.
S8. Ans.(d)
Sol. 11
16× 2880 +
8
14× 3360
2880 ×65
100+ 3360 ×
4
5
=1980 + 1920
1872 + 2688=
3900
4560
= 65 : 76
S9. Ans.(a)
Sol.
A ⇒2568 ×3
4= 1926 F ⇒2788 ×
3
4= 2091
B ⇒2880 ×65
100= 1872 G ⇒3720 ×
55
100= 2046
D ⇒3575 ×3
5= 2145 H ⇒3360 ×
4
5= 2688
A + B + D = 5943 F + G + H = 6825
Diff. = 6825 – 5943 = 882
Avg. = 882
3= 294
S10. Ans.(e)
Sol.
A ⇒2568
16= 160.5 B ⇒
2880
18= 160 C ⇒
2310
14= 165
D ⇒3575
22= 162 E ⇒
2054
13= 158 F ⇒
2788
17= 164
H ⇒3360
21= 160 G ⇒
3720
24= 155
2nd highest avg. no. of employees per office = F

7 Adda247 | No. 1 APP for Banking & SSC Preparation Website:store.adda247.com | Email:[email protected]
Directions (11-15): The table given below shows the no. of units produced of six different items by
a company, the mark-up % on each unit and the discount offered on the marked-up price of each
unit.
The cost price of all the items is same and fixed at Rs 100.
The line graph shows the estimated percentage of items sold by the company on the normal
discounted price.
The bar graph shows the percentage of cost price at which the company sold the remaining no. of
items.( means the company sold the remaining no. of items at a price lower than the cost price)
A B C D E F
Production
Unit
200 160 80 140 180 150
Mark Up % 50 60 80 40 60 45
Discount % 20 25 40 15 20 20
8075
90
80
70
60
0
10
20
30
40
50
60
70
80
90
100
A B C D E F
Esti
mat
ed
Sal
es
% o
ut
of
Tota
l P
rod
uct
ion
Series 1
60
30
90
40
70
80

8 Adda247 | No. 1 APP for Banking & SSC Preparation Website:store.adda247.com | Email:[email protected]
Q11. Find profit % of A and B together in year 2015if it is known that B sold only 90% of goods of
what he actually estimated to sell in year 2015.
(a) 0.33% (b) 0.44% (c) 0.55%
(d) 0.60% (e) None of these
Q12. In year 2016 E has increased his discount % by 10 basis point and which lead to increasein its
estimated salesby 20 basis point. Apart from that everything else remains same then what is the
difference in profit in year 2015 to 2016.
(a) 504 (b) 508 (c) 512
(d) 516 (e) 520
Q13. In year 2016 C decreased the discount % by 10 basis point due to which its sales reduced to
80% of total production of year 2015. By how much % profit will increase or decrease in 2016
compare to year 2015. (Approximately)
(a) Increased by 200% (b) Decreased by 210% (c) Increased by 203%
(d) Increased by 207% (e) Decreased by 207%
Q14. What is the difference between the absolute profit of A, B and C together and D, E and F
together in year 2015
(a) 750 (b) 800 (c) 900
(d) 1000 (e) None of these
Q15. What is the profit % of all the companies together in year 2015. (Approximately)
(a) 4.9% (b) 4.6% (c) 5.1%
(d) 4.7% (e) 5.4%
S11. Ans.(a)
Sol.
A’s selling price per unit =100×150
100×
80
100= 120
A’s sales in unit = 200 ×80
100= 160
A’s SP of 160 Unit = 160 × 120 = 19200
A’s SP of Remaining unit = (200 − 160) × 100 ×60
100= 2400
B’s Selling price per unit =100×160
100×
75
100= 120
B’s Sales in Unit = (160 ×75
100) ×
90
100= 108
B’s total SP = 108 × 120 + [(160 − 108) × 100 ×30
100] = 14520
Total SP (A + B) = 19200 + 2400 + 14520 = 36120
Total CP (A + B) = (200 + 160) × 100= 36000
Required Profit % = (36120−36000
36000) × 100 = 0.33%

9 Adda247 | No. 1 APP for Banking & SSC Preparation Website:store.adda247.com | Email:[email protected]
S12. Ans.(a)
Sol.
E’s total SP in year 2016
= [(100 ×160
100) ×
70
100] × (180 ×
90
100) + (100 ×
70
100×
180 × 10
100)
= 19404
E’s total SP in year 2015
= [(100 ×160
100) ×
80
100] × (180 ×
70
100) + (100 ×
70
100×
(180 × 30)
100)
= 19908
Required answer = 19908 − 19404
= 504
S13. Ans.(c)
Sol.
SP of C in year 2016
= [(100 ×180
100) ×
70
100] × (80 ×
80
100) + (80 ×
20
100) × (100 ×
90
100)
= 9504
Profit of C in year 2016 = 9504 − 80 × 100
= 1504
SP of C in year 2015 = [(100 ×180
100) ×
60
100] × (80 ×
90
100) + (80 ×
10
100) × (100 ×
90
100)
= 8496
Profit of C in year 2015 = 8496 − 80 × 100
= 496
Required % =1504−496
496= 203.22% ~ 203%
S14. Ans.(c)
Sol.
A’s SP in year 2015
= (200 ×80
100) × (100 ×
150
100×
80
100) + (200 ×
20
100) × (100 ×
60
100)
= 21600
B’s SP in year 2015 =
= (160 ×75
100) × (100 ×
160
100×
75
100) + (160 ×
25
100) × (100 ×
30
100)
= 15600
C’s SP in year 2015 s
= (80 ×90
100) × (100 ×
180
100×
60
100) + (80 ×
10
100) × (100 ×
90
100)
= 8496

10 Adda247 | No. 1 APP for Banking & SSC Preparation Website:store.adda247.com | Email:[email protected]
Total (A + B + C) = 21600 + 15600 + 8496 = 45696 Profit = 45696 − 20000 − 16000 − 8000 = 1696
D’s SP in year 2015 = (140 ×80
100) × (100 ×
140
100×
85
100) + (140 ×
20
100) × (100 ×
40
100)
= 14448
E’s SP in year 2015 = (180 ×70
100) × (100 ×
160
100×
80
100) + (180 ×
30
100) × (100 ×
70
100)
= 19908
F’s SP in year 2015 = (150 ×60
100) × (100 ×
145
100×
80
100) + (150 ×
40
100) × (100 ×
80
100)
= 15240 Total SP (D + E + F) = 1448 + 19908 + 15240 = 49596 Profit = 49596 − 14000 − 18000 − 15000 = 2596 Required answer = 2596 − 1696 = 900 S15. Ans.(d) Sol. total profit = 2596+ 1696 = 4292 Total CP = 20000+ 16000+ 8000 + 14000 + 18000+ 15000 = 91000
Required profit % =4292
91000× 100
= 4.716 ~ 4.72% Direction (16-20): Study the graph to answer the questions. Total investment (in Rs. thousand) of Gaurav and Rishabh in 6 schemes (M, N, O, P,Q and R) investment
0
20
40
60
80
100
120
M N O P Q R
To
tal
inv
est
men
t
Schemes

11 Adda247 | No. 1 APP for Banking & SSC Preparation Website:store.adda247.com | Email:[email protected]
Percentage of Gaurav’s Investment out of total investment
Q16. Scheme M offers simple interest at a certain rate of interest (per cent per annum). If the
difference between the interest earned by Gaurav and Rishabh from scheme M after 4 yr is Rs.
4435.20, what is the rate of interest (per cent per annum)?
(a) 17.5 (b) 18 (c) 16.5
(d) 20 (e) 15
Q17. What is the respective ratio between total amount invested by Gaurav in schemes O and Q
together and total amount invested by Rishabh in the same scheme together?
(a) 31 : 44 (b) 31 : 42 (c) 27 : 44
(d) 35 : 48 (e) 29 : 38
Q18. If scheme O offers compound interest (compounded annually) at 12% per annum, then what
is the difference between interest earned by Gaurav and Rishabh from scheme O after 2 yr?
(a) Rs. 1628.16 (b) Rs. 1584.38 (c) Rs. 1672.74
(d) Rs. 1536.58 (e) Rs. 1722.96
Q19. Rishabh invested in scheme R for 4 yr. If scheme R offers simple interest at 7% per annum
for the first two years and then compound interest at 10% per annum (compound annually) for the
3rd and 4th year, then what will be the interest earned by Rishabh after 4 yr?
(a) Rs. 13548.64 (b) Rs. 13112.064 (c) Rs. 12242.5
(d) Rs. 12364 (e) Rs. 11886
0
10
20
30
40
50
60
70
M N O P Q R
% o
f in
vest
men
t
Schemes

12 Adda247 | No. 1 APP for Banking & SSC Preparation Website:store.adda247.com | Email:[email protected]
Q20. Amount invested by Gaurav in scheme S is equal to the amount invested by him in scheme
N. The rate of interest per annum of schemes S and N are same. The only difference is scheme S
offers compound interest (compounded annually), whereas the scheme N offers simple interest. If
the difference between the interest earned by Gaurav from both the schemes after 2 yr is Rs.
349.92, then what is the rate of interest?
(a) 9% (b) 5% (c) 13%
(d) 11% (e) 7%
S16. Ans.(c)
Sol.
Amount invested by Gaurav in scheme M = 54% of 84000
= Rs. 45360
∴ Amount invested by Rishabh in scheme M = 84000 – 45360
= Rs. 38640
Let the required rate be r% per annum. Then,
=45360 × 𝑟 × 4
100−
38640 × 𝑟 × 4
100= 4435.20
⇒6720 × r × 4 = 443520
⇒ r = 16.5%
S17. Ans.(a)
Sol.
Required ratio = (Total amount invested by Gaurav in schemes O and Q together) : (Total amount
invested by Rishabh in schemes O and Q together)
= (40% of 32000 + 42% of 64000) : (60% of 32000 + 58% of 64000)
= 39680 : 56320 = 31 : 44
S18. Ans.(a)
Sol.
Difference of amount invested by Gaurav and Rishabh in
Scheme O = 60% of 32000 – 40% of 32000 = 20% of 32000
= Rs. 6400
∴ Required difference in their interest
= 6400 [(1 +12
100)
2
− 1] = 6400 × 0.2544 = 𝑅𝑠. 1628.16
S19. Ans.(b)
Sol.
Amount invested by Rishabh in investment R
= (100 – 64)% of 96000 = 36% of 96000 = Rs. 34560
Then, total interest earned by Rishabh after 4 year
=34560 × 7 × 2
100+ 21% of (34560 + SIoffirst 2 years)
= 4838.40 + 8273.664 = Rs. 13112.064

13 Adda247 | No. 1 APP for Banking & SSC Preparation Website:store.adda247.com | Email:[email protected]
S20. Ans.(a)
Sol.
Amount invested by Gaurav in each of scheme S and N
= 60% of 72000 = 43200
Let the rate of interest be r% per annum.
Then, according to the question,
349.92 =43200 × 𝑟2
1002
𝑜𝑟, 𝑟2 = 81
∴r = 9%
Directions (21–25): The graph suggests the no. of consumers and consumption of electricity units
in five years. Electricity units are given in Lacs while the no. of consumers aregiven in thousand.
Read the graph and answer the question.
Q21. What is the ratio of electricity consumption per consumer in 2012 to the same in 2015?
(a) 39 : 44 (b) 77 : 79 (c) 11 : 19
(d) 9 : 7 (e) None of the above
Q22. If no of consumers in 2016 is 120% more than in 2011 while the consumption remain same as
in 2015, then what will be the impact of no of units consumed by a consumer in 2016 when
compared to electricity consumption per consumer in 2015?
(a) + 42 units (b) + 36 Units (c) – 36units
(d) – 42 units (e) None of the above
225250
300350
375
200
325
450
575550
0
100
200
300
400
500
600
700
2011 2012 2013 2014 2015
Consumers (In thousand) Units(in Lacs)

14 Adda247 | No. 1 APP for Banking & SSC Preparation Website:store.adda247.com | Email:[email protected]
Q23. Electricity consumption in 2012 will be approximately how many times the total no. of
consumer all over the years?
(a) 3 (b) 21.5 (c) 2.5
(d) 4 (e) None of the above
Q24. Total no of units in 2011 and 2013 are approximately what % more or less than Total units in
2012 & 2014 together?
(a) 20% more (b) 24% more (c) 29% less
(d) 28% less (e) None of the above
Q25. In which of the following year, the ratio of unit consumtion to the no. of consumers is
maximum?
(a) 2011 (b) 2015 (c) 2014
(d) 2013 (e) 2012
S21. Ans.(a)
Sol. 325
250550
375
=325 × 375
250 × 550= 39 ∶ 44
S22. Ans.(c)
Sol.
2016 : No. of consumers = 220
100[225] = 495 thousand
Electricity consumption = 550 Lacs
∴ Electricity consumption per consumer = 550×100000
495×1000
= 111 units per consumer
2015 : Electricity consumption per consumer = 550×100000
375000
≈ 147 units per consumer
Hence, the Impact is reduction of 36 units per consumer
S23. Ans.(b)
Sol.
Total consumer all over the year = 225 + 250 + 300 + 350 + 375 = 1500 thousand
Desired value = 325×100000
1500000= 21.5 times approx
S24. Ans.(d)
Sol.
Total units in 2011 and 2013 = 650 Lacs
Total units in 2012 and 2014 = 900 Lacs
Desired value =250
900× 100 ≈ 28%approx

15 Adda247 | No. 1 APP for Banking & SSC Preparation Website:store.adda247.com | Email:[email protected]
S25. Ans.(c)
Sol.It is clear from the graph that unit consumption is highest in 2014 while consumers-electricity
units difference is maximum as well. Hence, Ratio of unit consumption to the number of consumers
is maximum in 2014.
Directions (26-30): The following information is about performance of Akhilesh in SBI PO mains
exam. Read the information carefully and answer the following question.
The exam consists of 200 marks, with 5 sections i.e. Reasoning, quant, English, G.A., Computers.
Akhilesh attempted 22 questions in Reasoning with an accuracy of 773
11% . Each question of
reasoning consists of 2 marks with a negative marking of 25%. (if right question is of 2 mark, then 0.5
mark will be deducted for each wrong answer).
Each section of the exam have the 25% of negative marking for each wrong question. The total
number of questions in reasoning is 30. Each question of computer consists of 1
2 marks and maximum
marks in computer are 10. Total 16 questions are attempted by Akhileshin computer with the ratio of
right questions to wrong questions 3 : 1.
The number of questions in English is equal to maximum marks of English. Akhilesh attempted 26
questions with 50% accuracy. The number of questions attempted in English is 65% of the total
number of questions in English.
GA section consists of 40 questions with each question 0.75 marks. Akhilesh attempted 23 questions
out of which 8 are wrong. Quant section contains 40 questions out of which Akhilesh attempted 35
questions and got 52.5 marks.
Q26. Another student arunoday attempted 70% questions in the same exam, then find the number
of questions left by arunoday.
(a) 119 (b) 68 (c) 51
(d) 65 (e) None of these
Q27. Find the marks obtained by Akhilesh in GA.
(a) 8.75 (b) 9.25 (c) 9.75
(d) 10.75 (e) None of these
Q28. The number of correct questions in reasoning is how much more than the number of
incorrect questions in the same subject?
(a) 12 (b) 7 (c) 18
(d) 9 (e) None of these
Q29. Find the total marks obtained by Akhilesh in the exam.
(a) 101 (b) 105 (c) 109
(d) 102 (e) None of these

16 Adda247 | No. 1 APP for Banking & SSC Preparation Website:store.adda247.com | Email:[email protected]
Q30. Find the total number of incorrect questions attempted by Akhilesh in the exam.
(a) 27 (b) 15 (c) 28
(d) 18 (e) None of these
S26. Ans.(c)
Sol. Total number of question = 170, no of questions left= 170 – 119=51
S27. Ans.(c)
Sol.Marks in GA = 9.75
S28. Ans.(a)
Sol. 17 – 5 = 12
S29. Ans.(c)
Sol.Total marks obtained = 109
S30. Ans.(e)
Sol. Total number of incorrect questions = 122 – 85=37
Directions (31-35): Study the following graph carefully and answer the questions given below it.
Percentage of profit earned by two companies Sony and H.P. over the given years
% 𝑃𝑟𝑜𝑓𝑖𝑡 = 𝐼𝑛𝑐𝑜𝑚𝑒 − 𝐸𝑥𝑝𝑒𝑛𝑑𝑖𝑡𝑢𝑟𝑒
𝐸𝑥𝑝𝑒𝑛𝑑𝑖𝑡𝑢𝑟𝑒 × 100
0
10
20
30
40
50
60
2007 2008 2009 2010 2011 2012
Sony
HP

17 Adda247 | No. 1 APP for Banking & SSC Preparation Website:store.adda247.com | Email:[email protected]
Q31. Expenditure of Company HP in 2008 and 2009 are Rs. 12 lakhs and Rs. 14.5 lakh respectively.
What was the total income of Company B in 2008 and 2009 together (in lakh rupees)?
(a)35 lac (b)37.65 lac (c)40 lac
(d)37.95 lac (e)None of these
Q32. Ratio of expenditure of companies Sony and HP in 2011 was 3 : 4 respectively. What was the
respective ratio of their incomes in 2011?
(a)2 : 3 (b)23 : 37 (c)43 : 56
(d)29 : 46 (e)39 : 56
Q33. Total expenditure of Company Sony in all the years together was 82.5 lakhs. What was the
total income of the Company in all the years together?
(a)38 lac (b)40 lac (c)45 lac
(d) Cannot determined (e)None of these
Q34. If the expenditures of Companies Sony and HP in 2012 were equal and the total income of
the two companies was Rs. 5.7 lakh, What was the total expenditure of the two companies in 2012?
(a)4 lac (b)5 lac (c)6 lac
(d)8 lac (e)10 lac
Q35. If the income of Company HP in 2009 and 2010 were in the ratio of 2 : 3 respectively. What
was the respective ratio of expenditure of that Company in these two years?
(a) 2 : 3 (b)4 : 5 (c)29 : 45
(d)39 : 55 (e)None of these
S31. Ans.(d)
Sol.
Income of HP = 𝐼1 in 2008
∴ 35 =𝐼1 − 12
12× 100
𝐼1 = Rs. 16.2 L
In 2009, Let Income = 𝐼2
∴ 50 =𝐼2 − 14.5
14.5× 100
𝐼2 = 21.75 L
∴total income = 21.75 𝐿 + 16.2 𝐿 = 37.95 𝐿

18 Adda247 | No. 1 APP for Banking & SSC Preparation Website:store.adda247.com | Email:[email protected]
S32. Ans.(e)
Sol.
Let the respective expenditures of both Sony and HP be Rs. 3𝑥 and Rs. 4𝑥 lakhs.
∴ 𝐼𝑠𝑜𝑛𝑦𝑖𝑛 2011 ⇒ 30 =𝐼1 − 3𝑥
3𝑥× 100
or, 𝐼1 = 3.9𝑥
𝐴𝑔𝑎𝑖𝑛, 𝐼𝐻𝑃 𝑖𝑛 2011 ⇒ 40 =𝐼2 − 4𝑥
4𝑥× 100
⇒ 𝐼2 = 5.6𝑥
Desired ratio ⇒ 𝐼𝑠𝑜𝑛𝑦 ∶ 𝐼𝐻𝑃 = 3.9𝑥 ∶ 5.6𝑥
=39 : 56
S33. Ans.(d)
Sol.It can’t be determined as data given are inadequate.
S34. Ans.(a)
Sol.
Let expenditure of both Sony and HP in 2012 beRs. 𝑥 lakhs & their respective incomes be Rs. 𝐼1&𝐼2
lakhs.
∴ Profit% for Sony = 40
& Profit% for HP = 45
∴40 =𝐼1−𝑥
𝑥× 100 … (𝑖)
&45 =𝐼2−𝑥
𝑥× 100 … (𝑖𝑖)
From (i) and (ii)
𝑥 = Rs. 2L
∴ Total expenditure = 2 × 2 = Rs. 4 lakh
S35. Ans.(c)
Sol.
Let the income be Rs. 2𝑥and Rs. 3𝑥lakhs respectively in 2009 and 2010 for HP.
∴In 2009,
50 =2𝑥 − 𝐸1
𝐸1× 100
⇒ 1.5 𝐸1 = 2𝑥
⇒ 𝐸1 =2𝑥
1.5 𝐿𝑎𝑘ℎ
In 2010,
45 =3𝑥 − 𝐸2
𝐸2× 100
⇒ 𝐸2 =3𝑥
1.45
∴2𝑥
1.5∶
3𝑥
1.45= 29 ∶ 45.

19 Adda247 | No. 1 APP for Banking & SSC Preparation Website:store.adda247.com | Email:[email protected]
Directions (36-40): Study the given graph carefully to answer the questions that follow:
Q36. What is the average number of people using mobile service of JIO for all the years together?
(a) 162
3 (b) 14444
1
6 (c)16666
2
3
(d) 141
6 (e) None of these
Q37. The total number of people using all the three mobile services in the year 2017 is what per
cent of the total number of people using all the three mobile services in the year 2018?(rounded off
to two digits after decimal)
(a) 89.72 (b) 93.46 (c) 88.18
(d) 91.67 (e) None of these
Q38. The number of people using mobile service of Idea in the year 2016 forms approximately
what per cent of the total number of people using all the three mobile services in that year?
(a) 18 (b) 26 (c) 11
(d) 23 (e) 29
Q39. What is the ratio of the number of people using mobile service of AIRTEL in the year 2015 to
that of those using the same service in the year 2014?
(a) 8 : 7 (b) 3 : 2 (c) 19 : 13
(d) 15 : 11 (e) None of these
0
10
20
30
40
50
60
70
2014 2015 2016 2017 2018 2019
No
. o
f P
eo
ple
(in
th
ou
san
ds)
Year
IDEA
JIO
Airtel

20 Adda247 | No. 1 APP for Banking & SSC Preparation Website:store.adda247.com | Email:[email protected]
Q40. What is the total number of people using mobile service ofJIO in the years 2018 and 2019
together?
(a) 35,000 (b) 30,000 (c) 45,000
(d) 25,000 (e) None of these
S36. Ans.(c)
Sol. Average =1
6× [5 + 10 + 25 + 20 + 25 + 15] × 1000
=100000
6= 16666
2
3
S37. Ans.(d)
Sol. Required % =55
60× 100 = 91.67%
S38. Ans.(a)
Sol. Required % =10
55× 100 = 18% (approx.)
S39. Ans.(b)
Sol. Required Ratio = 15 : 10 = 3 : 2
S40. Ans.(e)
Sol. Required no. of people = (25 + 15) × 1000 = 40000
Directions(41-45): Study the given information carefully to answer the questions that follow:
An organization consists of 2400 employees working in different departments, viz HR, Marketing, IT,
Production and Accounts. The ration of male to female employees in the organization is 5 : 3. Twelve
percent of the males work in the HR department. Twenty four percent of the females work in the
Accounts department. The ratio of males to females working in the HR department is 6:11. One-ninth
of the females work in the IT department. Forty two percent of the males work in the Production
department. The number of females working in the production department is 10 percent of the males
working in the same. The remaining females work in the marketing department. The total number of
employees working in the IT department is 285. Twenty two percent of the males work in the
Marketing and the remaining work in the Accounts department.
Q41. The number of males working in the IT department forms approximately what percent of the
total number of males in the organization?
(a) 5 (b) 12 (c) 21
(d) 4 (e) 18
Q42. What is the difference between males in Accounts department and Males in IT department?
(a) 10 (b) 15 (c) 18
(d) 16 (e) None of these
21 Adda247 | No. 1 APP for Banking & SSC Preparation Website:store.adda247.com | Email:[email protected]
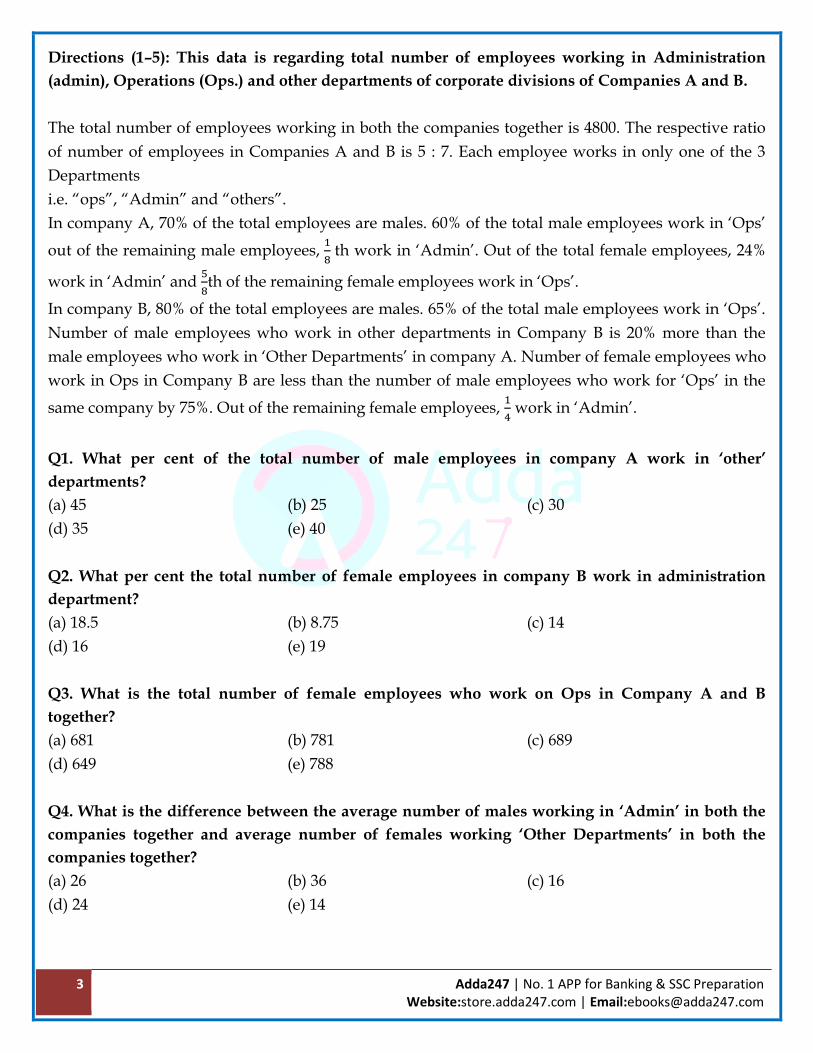
Q43. The total number of employees working in the Accounts department forms what percent of
the total number of employees in the organization?
(a) 19.34 (b) 16.29 (c) 11.47
(d) 23.15 (e) None of these
Q44. The number of females working in the Production department forms what percent of the
total number of females in the organization?
(a) 7 (b) 2 (c) 4
(d) 15 (e) None of these
Q45. What is the total number of females working in the HR and Marketing departments together?
(a) 363 (b) 433 (c) 545
(d) 521 (e) None of these
Solutions (41–45):
Total no. of employees = 2400
No. of males = 5
8× 2400 = 1500
& No. of females = 900
Males (HR) = 12% of 1500 = 180
Females (HR) = 11
6× 180 = 330
∴ Females (Accounts) = 24% of 900 = 216
&Females (IT) = 1
9× 900 = 100
No. of Males in IT = 285 – 100 = 185
∴ No. of males in Production = 42% of 1500
= 630
Females (Production) = 10% of 630 = 63
Males (Marketing) = 22×1500
100= 330
No. of females in Marketing = (900 – 330 – 216 – 100 – 63)
= 191
No. of Male in Accounts = 1500 – 180 – 185 – 630 – 330
= 175
S41. Ans.(b)
Sol. Desired% = 185
1500× 100 = 12.33% ≈ 12%
S42. Ans.(a)
Sol. No. of males in accounts = 175
No. of males in IT = 185
Difference = 10

22 Adda247 | No. 1 APP for Banking & SSC Preparation Website:store.adda247.com | Email:[email protected]
S43. Ans.(b)
Sol. Reqd. % = (216+175)
2400× 100 = 16.29%
S44. Ans.(a)
Required %=63
900× 100 = 7%
S45. Ans.(d)
Sol. Females in (HR + Marketing) = 330 + 191 = 521
Directions (46-50): Read the given bar graph and answer the following questions.
Q46. Approximately how many students taking a loan from UCO in 2009 and PNB in 2010 were
defaulters if 23% from UCO in 2009 and 20% from PNB in 2010 have defaulted?
(a) 630 (b) 650 (c) 600
(d) 750 (e) 840
Q47. In 2007, no of defaulters in SBI was 5%. However each year no of defaulters increases by 10%
in number. What will be the difference between the number of defaulters of SBI in the year 2009
and 2012?
(a) 1500 (b) 2000 (c) 1325
(d) 1456 (e) Cannot be determined
0
1000
2000
3000
4000
5000
6000
SBI PNB BOB UCO OBC
Number of Students taking fresh education loan from different Banks
2008
2009
2010
2011
2012

23 Adda247 | No. 1 APP for Banking & SSC Preparation Website:store.adda247.com | Email:[email protected]
Q48. In which of the following years, the difference in no. of students taking loan from Bank BOB
from the previous year is highest?
(a) 2008 (b) 2009 (c) 2010
(d)2012 (e) None of these
Q49. If on average, Rs. 175000 per students education loan sanctioned by OBC bank all over the
year. What will be total amount sanctioned by OBC in all given years?
(a) 1055600000 (b) 1055800000 (c) 1620000000
(d) 1050000000 (e) None of the above
Q50. What is the ratio of Number of students taking Education Loans from SBI and BOB together
in all the years and the total no of students taking Education loans in 2010 and 2011 together?
(a) 8 : 5 (b) 5 : 7 (c) 7 : 5
(d) 9 : 7 (e) None of these
S46. Ans.(a)
Sol.
Students taking loan from UCO in 2009 = 1000
Defaulters (UCO) = 23% of 1000 = 230
Person taking loan from PNB in 2010 = 2000
Defaulters (PNB) = 20% of 2000 = 400
Total desired defaulters = 230 + 400 = 630
S47. Ans.(e)
Sol.Cannot be determined because no. of students taking a loan from SBI in 2007 is unknown.
S48. Ans.(b)
Sol.From graph, it is clear that in 2009, difference between no. of students taking a loan is highest as
compared to previous year.
S49. Ans.(e)
Sol.No. of students taking education loan from OBC bank all over the year
= 1000 + 1000 + 1500 + 2000 + 1500= 7000
Total loan amount sanctioned over the years = 7000 × 1,75,000
= Rs. 1,22,50,00,000
S50. Ans.(c)
Sol.
SBI : 2500 + 3000 + 4500 + 4000 + 5000 = 19000
BOB : 2500 + 3500 + 4000 + 4500 + 5000 = 19500

24 Adda247 | No. 1 APP for Banking & SSC Preparation Website:store.adda247.com | Email:[email protected]
Total no. of students taking loan in 2010 = 13500
Total no. of students taking loan in 2011 = 14000
Desired ratio = 19000+19500
13500+14000=
38500
27500=
7
5
Directions (51-55): Study the following line graph carefully and answer the questions given below.
Q51.What is the approx difference between the percentage literacy rate increased in male from
1951 to 1991 and percentage literacy rate increased in female from 1971 to 2001.
(a) 15% (b) 10% (c) 5%
(d) 20% (e) 2%
Q52.In which of the census years percentage increase given in male literacy rate was the highest
with respect to previous census year?
(a) 1981 (b) 1991 (c) 2001
(d) 1961 (e) None of these
Q53.In which of the given census years was the percentage increase in the literacy rate of females
the lowest with respect to that of previous census year?
(a) 1981 (b) 1991 (c) 2001
(d) Data inadequate (e) None of these
Q54.In which of the given census years was the percentage increase in the number of males the
highest with respect to the previous census year?
(a) 1981 (b) 1991 (c) 2001
(d) Data inadequate (e) None of these
8.8615.35
21.97
29.76
39.29
53.97
18.33
28.3
39.5543.57
52.21
64.84
27.16
40.445.96
56.38
64.13
75.26
0
10
20
30
40
50
60
70
80
1951 1961 1971 1981 1991 2001
% of literacy rate from 1951 to 2001Female Persons Males

25 Adda247 | No. 1 APP for Banking & SSC Preparation Website:store.adda247.com | Email:[email protected]
Q55.What is the ratio of percentage literacy rate increased of male from (1961-1981) to literacy rate
increased of person in 1971?
(a) 1 : 1 (b) 1 : 2 (c) 2 : 1
(d) 1 : 3 (e) 3 : 1
S51. Ans.(b)
Sol.
Required difference = (53.97−21.97
21.97) × 100 − (
64.13−27.16
27.16× 100)
= (32
21.97× 100) −
36.97
27.16× 100
≈ 146 – 136
≈ 10%
S52. Ans.(d)
Sol.
Percentage increase in the literacy rate of male in
1961 = 48.74%
1971 = 13.76%
1981 = 22.67%
1991 = 13.74%
2001 = 17.35%
∴Required year = 1961
S53. Ans.(b)
Sol.
Percentage increase in the literacy rate of female
In 1961 = 73.25%
In 1971 = 43.12%
In 1981 = 35.45%
In 1991 = 32.02%
In 2001 = 37.36%
S54. Ans.(d)
Sol.
Since, the number of males are not specified, we can not get the required value.
S55. Ans.(a)
Sol.
Required ratio = (56.38−40.4
40.4× 100) ∶ 39.55
= 39.55 : 39.55
= 1 : 1

26 Adda247 | No. 1 APP for Banking & SSC Preparation Website:store.adda247.com | Email:[email protected]
Directions (56-60): Study the following graph carefully and answer the questions given below.
Number of TV sets sold over the years
Q56. What was the average number of Y-type TV sets sold by the company in 2011, 2012, 2014 and
2015 together?
(a) 32869 (b) 36250 (c) 35600
(d) 39827 (e) 42686
Q57. The number of X-type TV sets sold in 2011 was exactly what percent of the number of Y-type
TV sets sold in 2015?
(a) 331
2% (b) 32
1
3% (c) 37
1
2%
(d) 451
2% (e) 53
1
2%
Q58. What is the percentage increase in the sale of Y-type TV sets from 2011 to 2014?
(a) 25% (b) 622
3% (c) 53
1
3%
(d) 662
3% (e) 49%
Q59. In which of the following years was the percentage increase/decrease of sale of X-type TV
sets the maximum from the previous year?
(a) 2014 (b) 2012 (c) 2015
(d) 2011 (e) 2010
Q60. In which of the following years was the difference between the sales of X-type TV sets and Y-
type TV sets the maximum?
(a) 2010 and 2012 (b) 2013 and 2014 (c) 2011 and 2012
(d) 2014 and 2013 (e) 2012 and 2013
0
10
20
30
40
50
60
2010 2011 2012 2013 2014 2015
Nu
mb
er
of
TV
se
ts s
old
(in
th
ou
san
ds)
Year
Type X Type Y

27 Adda247 | No. 1 APP for Banking & SSC Preparation Website:store.adda247.com | Email:[email protected]
S56. Ans.(b)
Sol. Required average = (30 + 25 + 50 + 40)
4× 1000
= 36.25 × 1000 = 36250
S57. Ans.(c)
Sol. Required % = 15
40× 100 = 37
1
2%
S58. Ans.(d)
Sol. Required % increase = 50 − 30
30× 100
=200
3% = 66
2
3%
S59. Ans.(b)
Sol. In year 2011 = 15 − 20
20× 100
= −5
20× 100 = −25%
In year 2012 = 40 − 15
15× 100 = 166
2
3%
In year 2013 = 45 – 40
40× 100 = 12.5%
In year 2014 = 37.5 − 45
45× 100 = −16.67%
In year 2015 = 30 − 37.5
37.5× 100 = −20%
S60. Ans.(c)
Sol. From the graph the maximum difference is in the year 2011 and 2012.
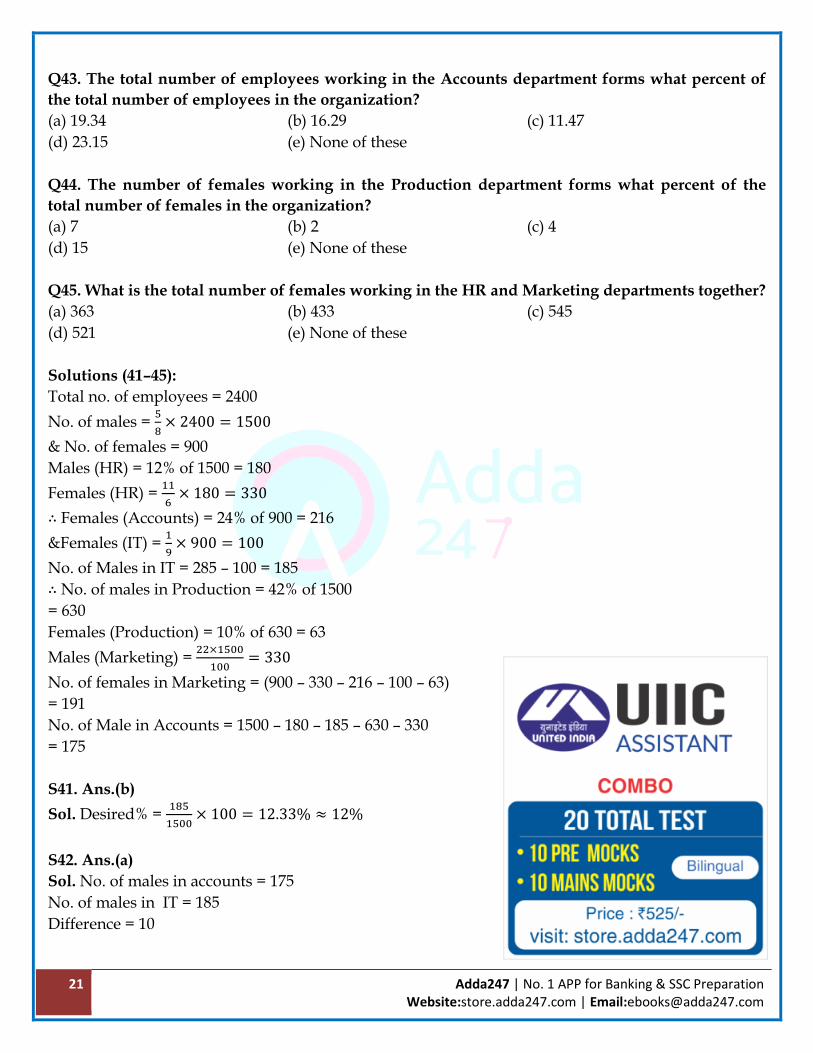
Directions (61-65): Study the following pie-charts carefully and answer the questions given below
them.
The entire fund that an organization gets from different sources is equal to Rs. 16 crore.
Internal Source, 8%
NGOs, 12%
Ministry of Home
Affairs, 42%
Government Agencies,
38%
Sources of funds in the organisation
28 Adda247 | No. 1 APP for Banking & SSC Preparation Website:store.adda247.com | Email:[email protected]
Q61. What is the difference between the fund acquired by the organization from NGOs and that
from Government Agencies?
(a) Rs. 43268000 (b) Rs. 38650000 (c) Rs. 46800000
(d) Rs. 52860000 (e) None of the above
Q62. If the organization managed Building Maintenance from the Ministry of Home Affairs fund
only, how much fund from the Ministry of Home Affairs would still be left for other use?
(a) Rs. 2.72 crore (b) Rs. 7.23 crore (c) Rs. 5.20 crore
(d) Rs. 3.06 crore (e) Rs. 8.03 crore
Q63. If the Scholarship has to be paid out of the fund from Government Agencies, find what is the
approximate percentage of Government Agencies fund used for this purpose.
(a) 42.11% (b) 38.6% (c) 31.23%
(d) 48.3% (e) 52%
Q64. What is the total amount used by the organization for Payment?
(a) Rs. 4.8 crore (b) Rs. 6.3 crore (c) Rs. 5.6 crore
(d) Rs. 9.73 crore (e) None of the above
Q65. What is the amount of fund acquired by the organization from Ministry of Home Affairs?
(a) 6.25 crores (b) 6.2 crores (c) 6.72 crores
(d) 9.25 crores (e) None of the above
S61. Ans.(e)
Sol. Required fund = (38 – 12)% of 160000000
= Rs. 41600000
Scholarship, 16%
Building Maintenance,
25%
Reserved, 24%
Payment, 35%
Use of fund by the organisation

29 Adda247 | No. 1 APP for Banking & SSC Preparation Website:store.adda247.com | Email:[email protected]
S62. Ans.(a)
Sol. Required remaining amount
= 42% of 16 cr – 25% of 16 cr
= 17% of 16 cr
= 2.72 crore
S63. Ans.(a)
Sol. Required % = 16
38× 100 = 42.11%
S64. Ans.(c)
Sol. Required amount = 35% of 16 crore
= 35 × 16
100 = Rs. 5.6 crore
S65. Ans.(c)
Sol. Fund acquired = 42% of 16 crore
= 42 × 16
100 = Rs. 6.72 crore
Directions (66-70): Study the following table carefully and answer the questions given below:
Number of Cars (in thousands) of different Models and colours sold in two Metro Cities in a year
Type Metro M Metro H
Colour Colour
Black Red Blue White Silver Black Red Blue White Silver
A 40 25 55 75 15 45 32 40 60 20
B 20 35 60 80 20 30 37 39 81 35
C 35 30 50 90 35 40 42 41 6 37
D 45 40 45 85 40 35 39 37 90 42
E 50 35 35 60 30 50 44 43 77 22
F 55 42 40 65 52 47 34 45 87 17
Q66.The difference between the white-coloured cars sold in the two metros of which of the
following models is the minimum?
(a) A (b) C (c) D
(d) F (e) None of these
Q67. The total number of blue-coloured cars of Model E and D sold in metro H is exactly equal to
the number of white-coloured cars of which model in Metro M?
(a) B (b) F (c) C
(d) A (e) None of these

30 Adda247 | No. 1 APP for Banking & SSC Preparation Website:store.adda247.com | Email:[email protected]
Q68. What is the difference between the number of blue-colours cars of model ‘C’ sold in Metro M
and number of red-colour cars of Model ‘F’ sold in Metro H?
(a) 8,000 (b) 10,000 (c) 12,000
(d) 15,000 (e) None of these
Q69. The total number of silver-coloured cars sold in Metro H is approximately what percentage of
that in Metro M?
(a) 130 (b) 140 (c) 90
(d) 100 (e) 110
Q70. In metro M the number of cars sold was maximum for which of thecolour-model
combinations?
(a) White-C (b) Blue-B (c) Silver-B
(d) White-D (e) Silver-F
S66. Ans.(e)
Sol.
A ⇒ 75 – 60 = 15 B ⇒ 81 – 80 = 1 C ⇒ 90 – 6 = 84
D ⇒ 90 – 85 = 5 E ⇒ 77 – 60 = 17 F ⇒ 87 – 65 = 22
Required model = B
S67. Ans.(a)
Sol. Blue coloured car of
Model E and D sold in Metro H = 43 + 37 = 80,000
Which is equal to white coloured car of B model in metro M
S68. Ans.(e)
Sol. Required difference = 50 – 34 = 16000
S69. Ans.(c)
Sol. Required % = 173
192× 100 ≈ 90%.
S70. Ans.(a)
Sol.
White C – 90
Blue B – 60
Silver B – 20
White D – 85
Silver F – 52

31 Adda247 | No. 1 APP for Banking & SSC Preparation Website:store.adda247.com | Email:[email protected]
Direction (71–75): Study the following table carefully to answer the questions that follow:
Number of Orders cancelled by five different e-commerce companies in six different years
e-Com
Years
P Q R S T
2011 240 405 305 365 640
2012 420 600 470 446 258
2013 600 680 546 430 610
2014 160 208 708 550 586
2015 140 640 656 250 654
2016 290 363 880 195 483
Q71. What was the difference between the highest number of Order cancelled by Company-
Q and the lowest number of Order cancelled by Company-T out of all the six years?
(a) 325 (b) 422 (c) 596
(d) 416 (e) None of these
Q72.What was the approximate percentage increase in number of Order cancelled by
Company-S in the year 2014 as compared to previous year?
(a) 57 (b) 44 (c) 125
(d) 28 (e) 95
Q73. What was the average number of Order cancelled by the Companies P,R, S and T in the
year 2014?
(a) 405 (b) 551.5 (c) 501
(d) 488 (e) None of these
Q74.In 2016, 40% Order are cancelled by Company-R due to bad weather and others by
packaging fault. How many orders are cancelled by Company-R due to packaging fault?
(a) 548 (b) 468 (c) 568
(d) 528 (e) None of these
Q75.What is the approximate percentage of cancelled Order by Companies P and R in 2013
as compared to cancelled orders by Company-S in 2011?
(a) 340 (b) 314 (c) 280
(d) 265 (e) 384
S71. Ans.(b)
Sol.Highest number of Order cancelled by Company-Q = 680
Lowest number of Order cancelled by Company-T = 258
Required difference = 680 – 258 = 422

32 Adda247 | No. 1 APP for Banking & SSC Preparation Website:store.adda247.com | Email:[email protected]
S72. Ans.(d)
Sol. Number of Order cancelled by Company-S in the year 2013 = 430
Number of Order cancelled by Company-S in the year 2014 = 550
Required percentage = 550−430
430× 100= 28 (approx)
S73. Ans.(c)
Sol.Required average = (160 + 708 + 550 + 586) ÷ 4
= 2004 ÷ 4 = 501
S74.Ans.(d)
Sol.Total number of Order are cancelled by Company R in 2016 = 880
Order are cancelled by Company-R due to packaging fault = 60%
Required number = 60% of 880
= 528
S75.Ans.(b)
Sol.Cancelled Order by Company’s P and R in 2013 = 600 + 546 = 1146
Cancelled Order by Company-S in 2011 = 365
Required percentage = 600+546
365× 100 = 314(approx.)
Directions (76-80): Study the bar graph carefully and answer the following questions.
The number of male and female probationary officers in various banks
0
1
2
3
4
5
6
7
8
9
10
SBI BOI HDFC PNB ICIC
In thousand
Male Female

33 Adda247 | No. 1 APP for Banking & SSC Preparation Website:store.adda247.com | Email:[email protected]
Q76.What is the total number of employees in the given six banks?
(a) 60000 (b) 56000 (c) 58000
(d) 62000 (e) 59000
Q77.What is the ratio of male to female probationary officers in all six banks?
(a) 5 : 4 (b) 3 : 2 (c) 2 : 3
(d) 7 : 8 (e) 4 : 5
Q78.In HDFC 40% males and 30% females are unmarried, then what is the ratio of the married
males to the married females in HDFC?
(a) 7 : 5 (b) 5 : 7 (c) 12 : 13
(d) 2 : 3 (e) 3 : 5
Q79.If the number of married male probaionary officers in ICICI is euqal to that in PNB, which is
40% of the male probabtionary officers in PNB, then what is the percentage of married male
probationary officers in ICIC with respect to the total number of probationary officers in ICIC?
(a) 25.51% (b) 28% (c) 27.91%
(d) 22% (e) 23.33%
Q80.The male probationary officers in PNB is what per cent more than the female probationary
officers in BOI?
(a) 74.8% (b) 74% (c) 75%
(d) 75.4% (e) 78%
S76. Ans.(a)
Sol. Total employees of the given six banks
= (8 + 9 + 3 + 4 + 6 + 5 + 6 + 7 + 5 + 7) × 1000 = 60000
S77. Ans.(d)
Sol. Ratio of male to female probationary officers in all six banks
= (8000 + 3000 + 5000 + 7000 + 5000) : (9000 + 4000 + 6000 + 6000 + 7000)
= 28000 : 32000 = 7 : 8
S78.Ans (b)
Sol. Unmarried males in HDFC = 5000 ×40
100= 2000
∴ Married males = (5000 – 2000) = 3000
Unmarried females in HDFC = 6000 ×30
100= 1800
∴ Married females = (6000 – 1800) = 4200
∴ Required ratio = 3000 : 4200 = 5 : 7

34 Adda247 | No. 1 APP for Banking & SSC Preparation Website:store.adda247.com | Email:[email protected]
S79. Ans.(e)
Sol. Number of male married probationary officers in ICICI
= Number of male married probationary officers in PNB
= Male probationary officers in PNB ×40
100= 7000 ×
40
100= 2800
∴The percentage of married male probationary officers in ICICI w.r.t to the total probationary officers
in ICICI
=2800 × 100
7000 + 5000= 23.33%
S80. Ans.(c)
Sol. Required% =7000 − 4000
4000× 100%
= 75% more than female probationary officers in BOI
Directions (81-85): The table given below shows the monthly salary of six employees working in a
leading manufacturing firm.
Years→
Employees↓
2011 2012 2013 2014 2015 2016
Richali 19200 20500 23400 25000 26600 28200
Piyush 28500 30100 31800 33000 34900 36000
Ritesh 22600 24000 26400 28100 29800 31000
Aditi 23000 24500 26100 27000 29300 31200
Krishna 24800 26000 27900 29100 30800 33000
Raksha 31500 35800 36600 40200 44000 45800
Q81. What is the difference between average monthly income of Aditi all over the years and
monthly income of Raksha in 2015?
(a) Rs. 17250 (b) Rs. 18150 (c) Rs. 17510
(d) Rs. 17150 (e) None of these
Q82. Monthly salary of Ritesh in 2016 contributes for what percent in total monthly salary of
Richali, Piyush and Krishna together in 2016? (approximately)
(a) 30% (b) 32% (c) 38%
(d) 42% (e) 28%
Q83. Find the ratio of annual salary of Aditi in 2012 and Raksha in 2014 together to that of Piyush
in 2013 and Richali in 2011 together?
(a) 6 :7 (b) 7 : 6 (c) 5 : 4
(d) 3 : 2 (e) None of these
35 Adda247 | No. 1 APP for Banking & SSC Preparation Website:store.adda247.com | Email:[email protected]
Q84. Monthly salary of Piyush and Krishna together in 2013 is by what percent more or less than
that of Aditi and Raksha together in 2015? (approximately)
(a) 19% more (b) 16% less (c) 19% less
(d) 16% more (e) 29% less
Q85. In 2015, Raksha donated 5% of her monthly salary, she then lent out 20% of remaining salary
on CI at 5% for 3 years. Find the interest (approx.) earned by her after 3 years?
(a) Rs. 1381 (b) Rs. 1318 (c) Rs. 1418
(d) Rs. 1315 (e) Rs. 1300
S81. Ans.(d)
Sol. Average monthly income of Aditi = 1
6× 161100 = 26850 Rs.
∴Required difference = 44000 – 26850 = Rs. 17150
S82. Ans.(b)
Sol. Required percentage = 31000
97200× 100 ≈ 32%
S83. Ans.(e)
Sol. Required ratio = (24500+40200)×12
(31800+19200)×12=
647
510
S84. Ans.(c)
Sol. Monthly salary of Piyush and Krishan = 31800 + 27900 = 59700
Monthly salary of Adity and Raksha = 29300 + 44000 = 73300
∴Required percentage = 13600
73300× 100 ≈ 19% less.
S85. Ans.(b)
Sol. 20% of amount left after donation = 1
5×
95
100× 44000
= Rs. 8360
∴ C.I. after 3 years = 8360 [(1 +5
100)
3
− 1]
= 8360 × 0.1576
≈ Rs. 1318
Directions (86-90): A team of 5 players participated in a tournament and played four matches (1 to
4). The following table gives partial information about their individual scores and the total runs
scored by the team in each match.
Each column has two values missing. These are the runs scored by the two lowest scorers
in that match. None of the two missing values is more than 10% of the total runs scored in
that match.

36 Adda247 | No. 1 APP for Banking & SSC Preparation Website:store.adda247.com | Email:[email protected]
Match-1 Match-2 Match-3 Match-4
Runs scored by player
Ajinkya 100 53
Pandya 88 65 52
Cheteswar 100
Dhawan 72 75 20 56
Virat 60 78
Total 270 300 240 200
Q86. What is the maximum possible percentage contribution of Ajinkya in the total runs
scored in the four matches (approximately)?
(a) 20% (b) 22% (c) 17%
(d) 23% (e) Cannot be determined
Q87.What is the maximum possible percentage contribution of Viratin the total
runsscored in the four matches?
(a) 18% (b) 19.9% (c) 18.6%
(d) 20.2% (e) Cannot be determined
Q88. If the absolute difference between the total runs scored by Ajinkya and Cheteshwar in the
Four matches is minimum possible then what is the ratio of Ajinkya and Cheteshwar’s total runs
scored by them in the four matches.
(a) 187:189 (b) 189:187 (c) 183:187
(d) 189:188 (e) Cannot be determined
Q89.If the absolute difference between the total runs scored by Ajinkya and Cheteshwar in the
four matches is minimum possible then what is the absolute difference between total runs scored
by Pandya and Virat in the four matches?
(a) 32 (b) 37 (c)35
(d) 27 (e) Cannot be determined
Q90. The players are ranked 1 to 5 on the basis of the total runs scored by them in the four
matches, with the highest scorer getting Rank 1. If it is known that no two players scored the same
number of total runs, how many players are there whose ranks can be exactly determined?
(a) 0 (b) 1 (c) 3
(d) 5 (e) Cannot be determined

37 Adda247 | No. 1 APP for Banking & SSC Preparation Website:store.adda247.com | Email:[email protected]
S86. Ans. (a)
Sol.
Maximum possible runs scored by Ajinkya in Match-1 = 27
Maximum possible runs scored by Ajinkya in Match-3 = 19 (less than 20)
Maximum possible percentage contribution: 27 + 100 + 19 + 53
270 + 300 + 240 + 200× 100% =
199
1010× 100% = 19.7%
= 20% approx.
S87. Ans. (c)
Sol.
Maximum possible runs scored by Virat in Match-2 = 30
Maximum possible runs scored by Virat in Match-4 = 20
Maximum possible percentage contribution: 60 + 30 + 78 + 20
270 + 300 + 240 + 200× 100%
= 188
1010× 100% = 18.6%
S88. Ans. (b)
Sol.
Maximum possible total runs scored by Cheteshwar in the four matches = 27 + 30 + 110 + 20 = 187.
Total runs scored by Ajinkya in the four matches is in the range of 189 to 199
Hence,
In such a case minimum possible
Total runs scored by Ajinkya in the four matches = 23 + 100 + 13 + 53 = 89
Difference = 189 – 187 = 2 (minimum possible)
So Required ratio is 189: 187
S89. Ans. (b)
Sol.
Maximum possible total runs scored by Cheteshwar in
the four matches= 27 + 30 + 110 + 20 = 187.
In such a case minimum possible total runs scored by
Ajinkya in the four matches
= 23 + 100 + 13 + 53 = 189.
Difference = 189 – 187 = 2 (minimum possible)
Subsequently total runs scored by Pandya in the four
matches = 88 + 65 + 19 + 52 = 224.
Also, total runs scored by Virat in the four matches
= 60 + 30 + 78 + 19 = 187
Absolute difference = 224 – 187 = 37
38 Adda247 | No. 1 APP for Banking & SSC Preparation Website:store.adda247.com | Email:[email protected]
S90. Ans.(c)
Sol.
Individual ranges for total score:
Ajinkya-> 189-199
Pandya-> 218-224
Cheteshwar-> 182-187
Dhawan-> 223
Virat-> 187-188
Least total will be of Cheteshwar (Rank 5)
2nd least will be Virat (Rank 4)
Rank 3 must be of Ajinkya
It is not possible to determine the exact ranks of Pandya and Dhawan
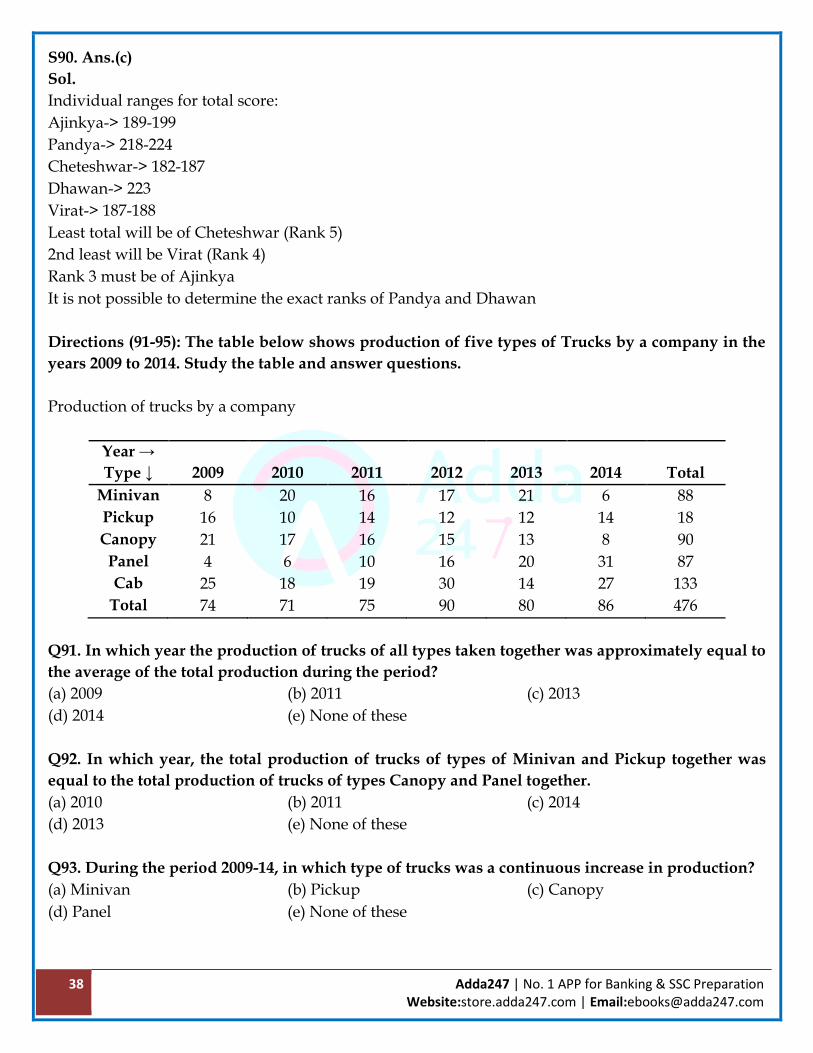
Directions (91-95): The table below shows production of five types of Trucks by a company in the
years 2009 to 2014. Study the table and answer questions.
Production of trucks by a company
Year →
Type ↓
2009
2010
2011
2012
2013
2014
Total
Minivan 8 20 16 17 21 6 88
Pickup 16 10 14 12 12 14 18
Canopy 21 17 16 15 13 8 90
Panel 4 6 10 16 20 31 87
Cab 25 18 19 30 14 27 133
Total 74 71 75 90 80 86 476
Q91. In which year the production of trucks of all types taken together was approximately equal to
the average of the total production during the period?
(a) 2009 (b) 2011 (c) 2013
(d) 2014 (e) None of these
Q92. In which year, the total production of trucks of types of Minivan and Pickup together was
equal to the total production of trucks of types Canopy and Panel together.
(a) 2010 (b) 2011 (c) 2014
(d) 2013 (e) None of these
Q93. During the period 2009-14, in which type of trucks was a continuous increase in production?
(a) Minivan (b) Pickup (c) Canopy
(d) Panel (e) None of these

39 Adda247 | No. 1 APP for Banking & SSC Preparation Website:store.adda247.com | Email:[email protected]
Q94. The production of which type of trucks was 25% of the total production of all types of trucks during 2013? (a)Panel (b) Canopy (c) Pickup (d)Minivan (e) None of these Q95. The per cent increase in total production of all types of trucks in 2012 to that in 2011 was? (a) 15 (b) 20 (c) 25 (d) 30 (e) None of these S91. Ans.(c)
Sol. Average of the total production during the period =476
6≈ 80 which is equal to the total
production in 2013. S92. Ans.(d) Sol. Answer will be 2013. S93. Ans.(d) Sol. Answer is Panel S94. Ans.(a) Sol. 25% of 80 = 20 = production of Panel’s car in 2013. S95. Ans.(b)
Sol. Required percent increase =90−75
75× 100 = 20%
Directions (96-100): Study the following graph to answer the given questions.
Percent profit earned by two companies over the given years
% profit =Income − Expenditure
Expenditure× 100
30
10
30
45
30
40
25
30
40
20
60
70
2005-06 2006-07 2007-08 2008-09 2009-10 2010-11
Company M Company N

40 Adda247 | No. 1 APP for Banking & SSC Preparation Website:store.adda247.com | Email:[email protected]
Q96. For Company M, its income in 2009-10 was equal to its expenditure in 2010-11, what was the
ratio of its respective incomes in these two years?
(a) 4:5 (b) 3:4 (c) 5:7
(d) Cannot be determined (e) None of these
Q97. If the income of Company M in 2006-07was equal to the expenditure of Company N in 2009-
10 what was the ratio of their respective profits?
(a) 13:15 (b) 15:26 (c) 13:26
(d) Cannot be determined (e) None of these
Q98. What was the difference in the expenditures of the two companies in 2007-08?
(a) 10 (b) 100 (c) 1000
(d) Cannot be determined (e) None of these
Q99. In 2010-11 the income of Company N was Rs. 119 crores. What was its expenditure in that
year?
(a) Rs. 76.8 crore (b) Rs. 64 crore (c) Rs. 70 crore
(d) Cannot be determined (e) None of these
Q100. For Company N, in which year is the percent of increase in percent profit over that of
previous year the highest?
(a) 2011-12 (b) 2007-08 (c) 2010-11
(d) Cannot be determined (e) None of these
S96. Ans.(c)
Sol.
𝐼𝑀 2009 − 10 = 𝐸𝑀 2010 − 11 =𝐼𝑀 2010−11
1.4
𝐼𝑀 2009−10: 𝐼𝑀 2010−11 =10
14= 5 ∶ 7.
S97. Ans.(e)
Sol. Suppose in the year 2006-07 expenditure of Company M = Rs. a
Then profit earned by Company M in this year = Rs. (10% of a)
Hence, income of Company M = Rs. (110% of a)
Again, expenditure of Company N in 2009-10 = Rs. 𝑎 × 110
100
Hence, profit earned by Company N in 2009-10
= 𝑅𝑠.𝑎 × 110
100×
60
100
Thus, required ratio
=
10
100× 𝑎
𝑎×110
100×
60
100
=10
66= 5 ∶ 33.

41 Adda247 | No. 1 APP for Banking & SSC Preparation Website:store.adda247.com | Email:[email protected]
S98. Ans.(d)
Sol. The given graph depicts only the percent profit earned by the two companies over the given
years. Hence, these information are insufficient to answer the question.
S99. Ans.(c)
Sol. In 2010-11, profit earned by Company N was 70%
Therefore, 170% of expenditure Rs. 119 crore
Thus, required expenditure = 119
170× 100 = Rs. 70 Crores
S100. Ans.(e)
Sol. Percent of increase in percent profit over that of the previous year for the given years is as
follows:
Year
2006-07: (30−25)
25× 100 = 20%
2007-08: (40−30)
30× 100 = 33.33%
2008-09: = (20−40)
40× 100 = -50%
2009-10: (60−20)
20× 100 = 200%
2010-11: (70−60)
60× 100 = 16.66%
Directions (101-105): Study the graphs carefully to answer the questions that follow.
Total number of children in 6 different schools and the percentage of girls in them
0
500
1000
1500
2000
2500
3000
3500
P Q R S T U
Nu
mb
er
of
Ch
ild
ern
s
Schools

42 Adda247 | No. 1 APP for Banking & SSC Preparation Website:store.adda247.com | Email:[email protected]
Q101. What is the total percentage of boys in schools R and U together? (rounded off to two digits after decimal) (a) 78.55 (b) 72.45 (c) 76.28 (d) 75.83 (e) None of these Q102. What is the total number of boys in school T? (a) 500 (b) 600 (c) 750 (d) 850 (e) None of these Q103. The total number of students in school R, is approximately what per cent of the total number of students in school S? (a) 89 (b) 75 (c) 78 (d) 82 (e) 94 Q104. What is the average number of boys in schools P and Q together? (a) 1425 (b) 1575 (c) 1450 (d) 1625 (e) None of these Q105. What is the respective ratio of the number of girls in schools P to the number of girls in school Q? (a) 27 : 20 (b) 17 : 21 (c) 20 : 27 (d) 21 : 17 (e) None of these S101. Ans.(d) Sol. Number of boys in school R and U together
=2000 × 72.5
100+
1000 × 82.5
100
= 1450 + 825 = 2275
∴Required percentage =2275
3000× 100 = 75.83%
0
5
10
15
20
25
30
35
40
45
50
P Q R S T U
Perc
en
tag
e o
f G
irls
Schools

43 Adda247 | No. 1 APP for Banking & SSC Preparation Website:store.adda247.com | Email:[email protected]
S102. Ans.(c)
Sol. Number of boys in school T =1250 × 60
100= 750
S103. Ans.(a)
Sol. Total number of students in school R = 2000
Total number of students in school S = 2250
∴Required percentage =2000
2250× 100 ≈ 89
S104. Ans.(b)
Sol. Required average =1
2(
2500 × 60
100+
3000 × 55
100)
=1
2(1500 + 1650) =
1
2× 3150 = 1575
S105. Ans.(c)
Sol. Required ratio =2500 × 40
100∶
3000 × 45
100
= 25 ×40 : 30 × 45
= 100 : 135 = 20 : 27
Directions (106-110): Study the graph and answer the following questions.
Power Supply Position in UP (in billion KWH)
Q106. What was the approximate percentage increase in supply of power between 2009-10 and
2013-14?
(a) 56% (b) 145% (c) 43%
(d) 85% (e) None of these
7884 88
102109
118 120129
137145
170
6675 83
8697 99 105
115124
130
151
0
25
50
75
100
125
150
175
200
2003-04 2004-05 2005-06 2006-07 2007-08 2008-09 2009-10 2010-11 2011-12 2012-13 2013-14
Requirement Supply
44 Adda247 | No. 1 APP for Banking & SSC Preparation Website:store.adda247.com | Email:[email protected]
Q107. The cumulative shortfall between requirement and supply from 2009 to the end of 2014 was
(in billion)
(a) 56 (b) 85 (c) 45
(d) 76 (e) None of these
Q108. The requirement of power in 2013-14 was approximately how many times the availability of
supply in 2007-08?
(a) 2.6 (b) 1.75 (c) 2.75
(d) 2.0 (e) None of these
Q109. The percentage of growth in power requirement from 2008-09 to 2013-14 was less than the
percentage of growth in power requirement from 2003-04 to 2008-09 by what figure?
(a) 3 (b) 4 (c) 15
(d) 7 (e) None of these
Q110. Between 2008-09 and 2012-13, the power generation has generally logged behind power
demand by how many years?
(a) 1 (b) 2 (c) 3
(d) 4 (e) None of these
S106. Ans.(c)
Sol. In 2009-10 is 105 while in 2013-14 is 151.
So percentage increases is 151−105
105× 100 =
46
105× 100 = 43%
S107. Ans.(d)
Sol. Total requirement = 120 + 129 + 137 + 145 + 170 = 701
Total supply = 105 + 115 + 124 + 130 + 151 = 625
Difference = 701 - 625 = 76
S108. Ans.(b)
Sol. 170 = 97 × x
So, 𝑥 =170
97= 1.75
S109. Ans.(d)
Sol. In 2008-09 to 2013-14, % Growth =170−118
118× 100 ≈ 44%
In 2003-04 to 2008-09 growth=118−78
78=
40
78× 100 ≈ 51%
So, more ≈ 51 - 44 = 7%
S110. Ans.(c)
Sol. In 2008-09 demand was 118 which completed in 2012-
2013 means 3 years.

45 Adda247 | No. 1 APP for Banking & SSC Preparation Website:store.adda247.com | Email:[email protected]
Directions (111-115): Dominos prepares Pizzas of three different types – Cheese, Onion and
Chicken.
The production of the three types over a period of six Months has been expressed in the bar-graph
provided below. Study the graph and answer the questions based on it.
Order of three different types of Dominos Pizzas over the Months (in lakh orders)
Q111. For which of the following Months the percentage of rise/fall in Order from the previous
Month is the maximum for the Onion flavor?
(a) February (b) March (c) April
(d) May (e) June
Q112. For which type was the average annual Order maximum in the given period?
(a) Cheese only (b) Onion only (c) Chicken only
(d) Cheese and Onion (e) Cheese and Chicken
Q113. The total Order of Chicken type in March and April is what percentage of the total Order of
Cheese type in January and February?
(a) 96.67% (b) 102.25% (c) 115.57%
(d) 120% (e) 133.33%
Q114. What is the difference between the average Order of Cheese type in January, February and
March and the average Order of Onion type in April, May and June?
(a) 50,000 orders (b) 80,000 orders (c) 2,40,000 orders
(d) 3,30,000 orders (e) 5,00,000orders
50
40
55
45
60
50
55
60
50
55
50
55
45
50
60 60
45
40
0
10
20
30
40
50
60
January February March April May June
Cheese Onion Chicken

46 Adda247 | No. 1 APP for Banking & SSC Preparation Website:store.adda247.com | Email:[email protected]
Q115. What was the approximate decline in the Order of Chicken type in June as compared to the
Order in April?
(a) 50% (b) 42% (c) 33%
(d) 25% (e) 22.5%
S111. Ans.(b)
Sol. The percentage rise/fall in Order from the previous Month for Onion type during various
Months are:
In February = [(60−55)
55× 100] % = 9.09% (increase)
In March = [(60−50)
60× 100] % = 16.67% (decrease)
In April = [(55−50)
55× 100] % = 10% (increase)
In May = [(55−50)
55× 100] % = 9.09% (decrease)
In June = [(55−50)
50× 100] % = 10% (increase)
∴Maximum change is decrease of 16.67% during March.
S112. Ans.(b)
Sol. Average annual Orders over the given period for various types are:
For Cheese type = [1
6× (50 + 40 + 55 + 45 + 60 + 50)] lakh orders = 50 lakh orders.
For Onion type = [1
6× (55 + 60 + 50 + 55 + 50 + 55)] lakh orders
= 54.17 lakh orders.
For Chicken type = [1
6× (45 + 50 + 60 + 60 + 45 + 40)] lakh orders = 50 lakh orders.
∴ Maximum average Order is for Onion type.
S113. Ans.(e)
Sol. Required percentage = [(60 + 60)
(50 + 40)× 100] % = (
120
90× 100) % = 133.33%.
S114. Ans.(e)
Sol. Average Order of Cheese type in January, February and March = [1
3× (50 + 40 + 55)]
= (145
3) lakh orders.
Average Order of Onion type in April, May and June = [1
3× (55 + 50 + 55)]
= (160
3) lakh orders.
∴ Difference = (160
3−
145
3) =
15
3= 5 lakh orders = 5,00,000 orders.

47 Adda247 | No. 1 APP for Banking & SSC Preparation Website:store.adda247.com | Email:[email protected]
S115. Ans.(c)
Sol. Percentage decline in the Order of type Chicken in June as compared to the Order in April =
[(60 − 40)
60× 100] % = (
20
60× 100) % = 33.33% ≈ 33%.
Directions (116-120): Study the following Graph carefully and answer the questions given below:
Preferences of People in Playing Different Games Over the Years (in Hundred)
Q116. In the year 2016, the people preferring to play Tennis is what percent of the people prefer to
play Cricket, Football and Tennis together in that year?
(a) 22.76% (b) 20.58% (c) 42. 24%
(d) 25% (e) None of these
Q117. How many people have preferred to play Cricket in all the years together?
(a) 217500 (b) 224500 (c) 247500
(d) 175600 (e) None of these
Q118. What is the respective ratio of the number of people prefer to play cricket in 2011, 2013 and
2015 to the number of people prefer to play Tennis in the year 2013, 2015 and 2016?
(a) 2 : 1 (b) 45 : 33 (c) 44 : 31
(d) 48 : 31 (e) None of these
Q119. From 2011 to 2016, the total number of people who preferred to play Football was what
percent more or less than the total number of people who preferred to play Tennis during same
period?
(a) 5.24% (b) 6.24% (c) 7.24%
(d) 8.24% (e) 10%
0
50
100
150
200
250
300
350
400
450
500
2011 2012 2013 2014 2015 2016
Cricket
Football
Tennis

48 Adda247 | No. 1 APP for Banking & SSC Preparation Website:store.adda247.com | Email:[email protected]
Q120. The no. of people prefer to play tennis in 2016 is what percent fewer than the number of people preferring to play tennis in 2015?
(a) 234
11% (b) 36
4
11% (c) 42
7
13%
(d) 339
13% (e) None of these
S116. Ans.(b) Sol.
Desired% =175
350 + 325 + 175× 100 =
175
850× 100 = 20.58%
S117. Ans.(a) Sol. Total people playing cricket over all years = 2,17,500 S118. Ans.(d) Sol.
Ratio =400 + 450 + 350
325 + 275 + 175=
1200
775= 48 ∶ 31
S119. Ans.(c) Sol.
Desired % =1850 − 1725
1725× 100 =
125
1725× 100 = 7.24%
S120. Ans.(b) Sol.
Desired % =275 − 175
275× 100 =
400
11= 36
4
11%
Directions (121–125): Read the given bar graph and answer the following questions.
0
1000
2000
3000
4000
5000
6000
SBI PNB BOB UCO OBC
Number of Students taking fresh education loan from different Banks
2008
2009
2010
2011
2012

49 Adda247 | No. 1 APP for Banking & SSC Preparation Website:store.adda247.com | Email:[email protected]
Q121. Approximately how many students taking a loan from UCO in 2009 and PNB in 2010 were
defaulters if 23% from UCO in 2009 and 20% from PNB in 2010 have defaulted?
(a) 630 (b) 650 (c) 600
(d) 750 (e) 840
Q122. In 2007, no of defaulters in SBI was 5%. However each year no of defaulters increases by
10% in number. What will be the difference between the number of defaulters of SBI in the
Month 2009 and 2012?
(a) 1500 (b) 2000 (c) 1325
(d) 1456 (e) Cannot be determined
Q123. In which of the following years, the difference in no. of students taking loan from Bank
BOB from the previous year is highest?
(a) 2008 (b) 2009 (c) 2010
(d) 2012 (e) None of these
Q124. If on average, Rs. 175000 per students education loan sanctioned by OBC bank all over the
years. What will be total amount sanctioned by OBC in all given years?
(a) 1055600000 (b) 1055800000 (c) 1620000000
(d) 1050000000 (e) None of the above
Q125. What is the ratio of Number of students taking Education Loans from SBI and BOB together
in all the Years and the total no of students taking Education loans in 2010 and 2011 together?
(a) 8 : 5 (b) 5 : 7 (c) 7 : 5
(d) 9 : 7 (e) None of these
S121. Ans.(a)
Sol.
Students taking loan from UCO in 2009 = 1000
Defaulters (UCO) = 23% of 1000 = 230
Person taking loan from PNB in 2010 = 2000
Defaulters (PNB) = 20% of 2000 = 400
Total desired defaulters = 230 + 400 = 630
S122. Ans.(e)
Sol. Cannot be determined because no. of students
taking a loan from SBI in 2007 is unknown.

50 Adda247 | No. 1 APP for Banking & SSC Preparation Website:store.adda247.com | Email:[email protected]
S123. Ans.(b)
Sol. From graph, it is clear that in 2009, difference between no. of students taking a loan is highest as
compared to previous year.
S124. Ans.(e)
Sol. No. of students taking education loan from OBC bank all over the year
= 1000 + 1000 + 1500 + 2000 + 1500 = 7000
Total loan amount sanctioned over the years = 7000 × 1,75,000
= Rs. 1,22,50,00,000
S125. Ans.(c)
Sol.
SBI : 2500 + 3000 + 4500 + 4000 + 5000 = 19000
BOB : 2500 + 3500 + 4000 + 4500 + 5000 = 19500
Total no. of students taking loan in 2010 = 13500
Total no. of students taking loan in 2011 = 14000
Desired ratio = 19000+19500
13500+14000=
38500
27500=
7
5
Directions (126-130): Study the following Radar graph carefully and answer the questions given
below.
Number of students studying in different universities in a year (Numbers in Lac).
30
40
42.5
25
27.5
37.5
30
25
37.5
35
0
10
20
30
40
50P
Q
RS
T
Males
Females

51 Adda247 | No. 1 APP for Banking & SSC Preparation Website:store.adda247.com | Email:[email protected]
Q126. What is the average number of females in all the universities together?
(a) 3300000 (b) 350000 (c) 320000
(d) 3200000 (e) None of these
Q127. What is the total number of students (males and females together) in University P and R
together?
(a) 1300000 (b) 1350000 (c) 1400000
(d) 14500000 (e) None of these
Q128. What is the respective ratio of the number of females from University P and Q together to
the number of males in the Universities R and T together?
(a) 27 : 32 (b) 27 : 28 (c) 25 : 28
(d) 28 : 27 (e) None of these
Q129. The number of males in University Q are what per cent of the total number of students
(males and females together) in University S?
(a) 68 (b) 62 (c) 66
(d) 64 (e) None of these
Q130. If the total number of males in University T increases by 50%, what would be the total
number of students (males and females together) in that university?
(a) 7526000 (b) 76250000 (c) 7625000
(d) 75260000 (e) None of these
S126.Ans.(a)
Sol.
Required No. =37.5+30+25+37.5+35
5=
165
5 lakhs = 3300000
S127. Ans.(e)
Sol. Required No.(30 + 37.5 + 42.5 + 25)
=135 lakhs = 13500000
S128. Ans.(b)
Sol. Required Ratio = (37.5 + 30) : (42.5 + 27.5)
= 27 : 28
S129. Ans.(d)
Sol. Required % =40
25 + 37.5× 100
= 64%

52 Adda247 | No. 1 APP for Banking & SSC Preparation Website:store.adda247.com | Email:[email protected]
S130. Ans.(c)
Sol. Required no. = (27.5 ×150
100) + 35
= 76.25 lakhs
= 7,62,5000
Directions (131-135): Study the graph carefully to answer the questions that follow.
Q131. If profit for company Y in 2012 is 2000 and expenditure in 2013 for company Y is 50,000, then what is the total revenue in 2013 for Y? Give that total revenue = expenditure + profit.
(a) 52600 (b) 54200 (c) 53280
(d) 55800 (e) None of these
Q132. If profit in year 2015 for company Z is 3000 and profit of company X in 2013 is equal to profit of company Z in 2014 then what is the profit of company X in 2013
(a) 1500 (b) 4000 (c) 3500
(d) 2000 (e) 2500
0
10
20
30
40
50
60
2011
2012
2013
2014
2015
2016
PERCENT INCREASE IN PROFIT OF THREE COMPANIES OVER THE YEARS
COMPANY X
COMPANY Y
COMPANY Z

53 Adda247 | No. 1 APP for Banking & SSC Preparation Website:store.adda247.com | Email:[email protected]
Q133. What is the average percentage increase in profit for company Y over all the years.
(a) 49% (b) 32% (c) 23%
(d) 38% (e) 35%
Q134. What was the approximate percent increase in percent increase of profit of company X in the
year 2014 from its previous year
(a) 60% (b) 65% (c) 55% (d) 50% (e) 70%
Q135. If profit earned by company Y in 2014 is 27,000 and by company Z in 2014 is 43500 then what is the total profit earned by them in year 2013?
(a) 25,000 (b) 35,000 (c) 40,000
(d) 50,000 (e) None of these
S131. Ans.(a)
Sol. Profit in 2013 = 2000 ×130
100
= 2600 Total revenue = 50,000 + 2600
= 52600
S132. Ans.(d)
Sol. Profit of company X in 2013 = 3000 × 100
150
= 2000
S133. Ans.(e)
Sol. Required average = 45 + 25 + 30 + 35 + 35 + 40
6
=210
6
= 35%
S134. Ans.(a)
Sol. Required percentage = 40 − 25
25× 100
= 15
25× 100
= 60%
S135. Ans.(d)
Sol. Profit earned by Y in 2013 = 27000 × 100
135
= 20,000
Profit earned by Z in 2013 = 43500 × 100
145
= 30,000
Total profit = 50,000

54 Adda247 | No. 1 APP for Banking & SSC Preparation Website:store.adda247.com | Email:[email protected]
Directions (136-140): Study the following graph carefully and answer the following question.
The graph below represents the production (in tonnes) and sales (in tonnes) of a company X from
2010-2015
Q136. If production of company X and another company Y is in the ratio 14 : 13 in year 2014 then
production of company Y in 2014 is what percent more or less than production of company X in
2010.
(a) 131
3% (b) 33
1
3% (c) 66
2
3%
(d) 162
3% (e) None of these
Q137. If production of company X in 2016 is 120% of its production in 2015 then what is the ratio of
sales company X in 2010 to the production of company X in 2016.
(a) 7
9 (b)
13
20 (c)
20
13
(d) 5
13 (e)
7
13
Q138. If production cost is Rs. 1,500 per tonne and sale is at the rate of Rs. 2,800 per tonne over all
years then what is the ratio of profit or loss of company X in 2013 to the profit or loss in year 2014.
(Profit = Income through sales – Production cost)
(a) 59
70 (b)
20
23 (c)
53
94
(d) 27
38 (e) None of these
0
100
200
300
400
500
600
700
8002010
2011
2012
2013
2014
2015
Production Sales

55 Adda247 | No. 1 APP for Banking & SSC Preparation Website:store.adda247.com | Email:[email protected]
Q139. If production cost in year 2013 is 150 per tonne and production cost increases by 10% every
year after 2013 then what is the average production cost of company X over all years after year
2013?
(a) 12,20,239 (b) 1,16,737.5 (c) 2,22,467
(d) 1,33,647 (e) None of these
Q140. If 35% of production of company X in 2010 is added to the sale of company X in 2012 then
total sale of company X in 2012 is what percent of the total sale of company X over all the years
now? (approximately)
(a) 14% (b) 18% (c) 35%
(d) 28% (e) 24%
S136. Ans.(a)
Sol. Production of company Y in 2014 = 700
14× 13 = 650
Required percentage = 100
750× 100
=40
3%
131
3% less
S137. Ans.(d)
Sol. Production of company X in 2016 = 120
100× 650 = 780
Required ratio = 300
780
=5
13
S138. Ans.(a)
Sol. Cost of production in 2013 = 1500 × 550
= Rs. 8,25,000
Total Income through sales = 2800 × 400
= Rs. 11, 20,000
Profit in 2013 = 11,20,000 − 8,25,000
= Rs. 2,95,000
Cost of production in 2014 = Rs. 1500 × 700
= Rs. 10,50,000
Total Income through sales = Rs. 2800 × 500
= Rs. 14,00,000
Profit in 2014 = 3,50,000
Required ratio = 295
350=
59
70
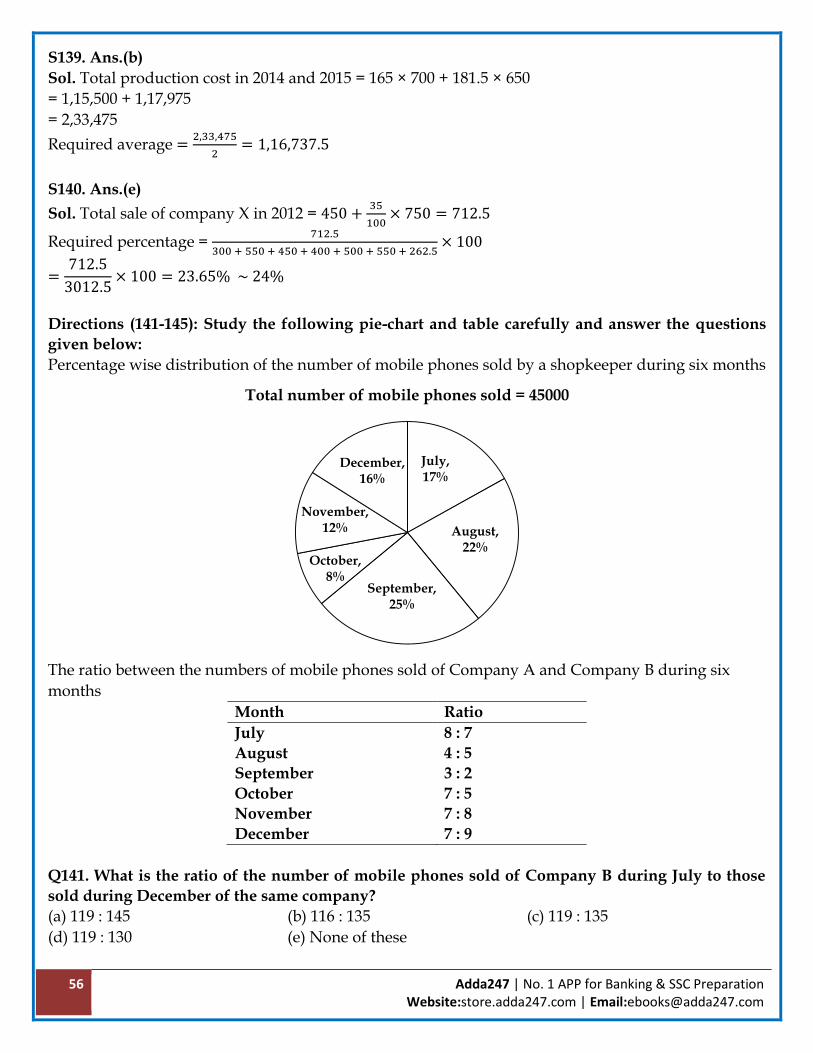
56 Adda247 | No. 1 APP for Banking & SSC Preparation Website:store.adda247.com | Email:[email protected]
S139. Ans.(b)
Sol. Total production cost in 2014 and 2015 = 165 × 700 + 181.5 × 650
= 1,15,500 + 1,17,975
= 2,33,475
Required average =2,33,475
2= 1,16,737.5
S140. Ans.(e)
Sol. Total sale of company X in 2012 = 450 +35
100× 750 = 712.5
Required percentage = 712.5
300 + 550 + 450 + 400 + 500 + 550 + 262.5× 100
=712.5
3012.5× 100 = 23.65% ~ 24%
Directions (141-145): Study the following pie-chart and table carefully and answer the questions
given below:
Percentage wise distribution of the number of mobile phones sold by a shopkeeper during six months
The ratio between the numbers of mobile phones sold of Company A and Company B during six
months
Month Ratio
July 8 : 7
August 4 : 5
September 3 : 2
October 7 : 5
November 7 : 8
December 7 : 9
Q141. What is the ratio of the number of mobile phones sold of Company B during July to those
sold during December of the same company?
(a) 119 : 145 (b) 116 : 135 (c) 119 : 135
(d) 119 : 130 (e) None of these
July, 17%
August, 22%
September, 25%
October, 8%
November, 12%
December, 16%
Total number of mobile phones sold = 45000

57 Adda247 | No. 1 APP for Banking & SSC Preparation Website:store.adda247.com | Email:[email protected]
Q142. If 35% of the mobile phones sold by Company A during November were sold at a discount,
how many mobile phones of Company A during that month were sold without a discount?
(a) 882 (b) 1635 (c) 1638
(d) 885 (e) None of these
Q143. If the shopkeeper earned a profit of Rs. 433 on each mobile phone sold of Company B
during October, what was his total profit earned on the mobile phones of that company during the
same month?
(a) Rs. 6,49,900 (b) Rs. 6,45,900 (c) Rs. 6,49,400
(d)Rs. 6,49,500 (e) None of these
Q144. The number of mobile phones sold of Company A during July is approximately what
percent of the number of mobile phones sold of Company A during December?
(a) 110 (b) 140 (c) 150
(d) 105 (e) 130
Q145. What is the total number of mobile phones sold of Company B during August and
September together?
(a) 10000 (b) 15000 (c) 10500
(d) 9500 (e) None of these
S141. Ans.(c)
Sol.
Total number of mobiles sold in the month of July = 45000 ×17
100 = 7650
Mobile phones sold by Company B in the month of July = 7650 ×7
15 = 3570
Total numbers of mobile phones sold in the month of December = 45000 ×16
100 = 7200
Mobile phones sold by Company B in the month of December = 7200 ×9
16 = 4050
∴ Required ratio = 3570
4050=
357
405=
119
135 = 119 : 135
S142. Ans.(c)
Sol.
Number of mobile phones sold in the month of November = 45000 ×12
100 = 5400
Number of mobile phones sold by Company A in the month of November = 5400 ×7
15 = 2520
∴ Number of mobile phones sold without discount in the month of November by Company A
= 2520 ×65
100 = 2520 × 0.65 = 1638
S143. Ans. (d)
Sol.
Number of mobile phones sold in the month of October = 45000 ×8
100 = 3600
∴ Number of mobile phones sold by Company B in the month of October = 3600 × 5
12 = 1500
∴ Total profit earned by Company B in the month of October = 1500 × 433 = 649500

58 Adda247 | No. 1 APP for Banking & SSC Preparation Website:store.adda247.com | Email:[email protected]
S144. Ans.(e)
Sol.
Number of mobile phones sold in the month of July = 45000 ×17
100 = 7650
Number of mobile phones sold by Company A in the month of July = 7650 ×8
15 = 4080
Number of mobile phones sold in the month of December = 45000 ×16
100 = 7200
Number of mobile phones sold by Company A in the month of December = 7200 ×7
16 = 3150
∴ Required % = 4080
3150× 100 = 129.52 ≈ 130
S145. Ans.(a)
Sol.
Number of mobile phones sold in the month of August = 22
100× 45000 = 9900
Number of mobile phones sold in the month of September = 25
100× 45000 =
1
4× 45000 = 11250
Number of mobile phones sold by Company B in the month of August = 9900 ×5
9 = 5500
Number of mobile phones sold by Company B in September = 11250 ×2
5 = 4500
Total number of mobile phones sold in August and September by Company B = 5500 + 4500
= 10000
Directions (146-150): These questions based on the following graphs
Classification of appeared candidates in a competitive test from different states and qualified
candidates from those states.
Appeared candidates = 45000.
A15%
B11%
C8%
D17%
E9%
F18%
G22%

59 Adda247 | No. 1 APP for Banking & SSC Preparation Website:store.adda247.com | Email:[email protected]
Qualified candidates = 9000
Q146. What is the ratio of the number of appeared candidates from states C and E together to that of the appeared candidates from sates A and F together? (a) 17 : 33 (b) 11 : 13 (c) 13 : 27 (d) 17 : 27 (e) None of these Q147. In which state, the percentage of qualifies candidates with respect to that of appeared candidates is minimum? (a) C (b) F (c) D (d) E (e) G Q148. What is the difference between the number of qualified candidates of states D and those of G? (a) 690 (b) 670 (c) 780 (d) 720 (e) None of these Q149. What is the percentage of qualified candidates with respect to appeared candidates from states B and C taken together? (rounded to two decimal places) (a) 23.11 (b) 24.21 (c) 21.24 (d) 23 (e) None of these Q150. What is the ratio between the number of candidates qualified from states B and D together to the number of candidates appeared from states ‘C’, respectively? (a) 8 : 37 (b) 11 : 12 (c) 37 : 40 (d) 7 : 37 (e) None of these S146. Ans.(a)
Sol. Required ratio =8 + 9
15 + 18= 17: 33.
S147. Ans.(e) Sol. Here, do not find the ratio of number of qualified candidates that of the appeared. Simply check the ratio of % qualified candidates with respect to the appeared is the least for which state. Ans. = G.
A18%
B16%
C7%
D21%
E14%
F11%
G13%

60 Adda247 | No. 1 APP for Banking & SSC Preparation Website:store.adda247.com | Email:[email protected]
S148. Ans.(d) Sol. Required difference = (21 - 13)% of 9000 = 720. S149. Ans.(b)
Sol. Required % =(16 + 7)% 𝑜𝑓 9000
(11 + 8)% 𝑜𝑓 45000× 100 = 24.21%
S150. Ans.(c)
Sol. Required ratio =(16 + 21)% 𝑜𝑓 9000
8% 𝑜𝑓 45000 = 37 : 40
Directions (151-155): Study the following pie-charts carefully and answer the questions given below it. The entire fund that school gets from different sources in equal to Rs. 500 lakh
Q151. What is the difference between the funds acquired by school from NGO’s and internal sources? (a) Rs. 50 lakh (b) Rs. 45 lakh (c) Rs. 75 lakh (d) Rs. 25 lakh (e) None of these
Donation35%
Internal sources
5%
Govt. agencies45%
NGO's 15%
Sources of funds in school
Reserved 35%
Scholarship15%
Payment 30%
School maintenance
20%
Uses of funds by school

61 Adda247 | No. 1 APP for Banking & SSC Preparation Website:store.adda247.com | Email:[email protected]
Q152. If the school managed school maintenance from the government agencies fund only, then how much fund from government agencies would still left for other use? (a) Rs. 120 lakh (b) Rs. 150 lakh (c) Rs. 110 lakh (d)Rs. 95 lakh (e) None of these Q153. If scholarship has to be paid out of the donation fund, then what is the approximate per cent of donation fund used for his purpose? (a) 43% (b) 53% (c) 37% (d) 45% (e) 32% Q154. What is the total amount used by the school for payment? (a) Rs. 100 lakh (b) Rs. 110 lakh (c) Rs. 150 lakh (d) Rs. 140 lakh (e) None of these Q155. What amount of the fund is acquired by the school from government agencies? (a) Rs. 220 lakh (b) Rs. 310 lakh (c) Rs. 255 lakh (d) Rs. 225 lakh (e) None of these S151. Ans.(a) Sol. Required difference = (Percentage of fund acquired from NGO-Percentage of fund acquired from internal sources) of 500 lakh
= (15 - 5)% of 500 lakh =500 × 10
100lakh = Rs. 50 lakh
S152. Ans.(e) Sol. Fund from government agencies
=500 × 45
100 = Rs. 225 lakh
Expenses in school maintenance
=500 × 20
100 = Rs. 100 lakh
∴ Remaining found = (225 - 100) lakh = Rs. 125 lakh S153. Ans.(a)
Sol. Fund from donation =500 × 35
100 = Rs. 175 lakh
Scholarship amount =15 × 500
100 = Rs. 75 lakh
∴ Required percentage =75
175× 100 = 42.85%
= 43% (approx.) S154. Ans.(c) Sol. Total amount used by the school for payment
=500 × 30
100 = Rs. 150 lakh
S155. Ans.(d) Sol. Fund acquired from government agencies
=500 × 45
100 = Rs. 225 lakh
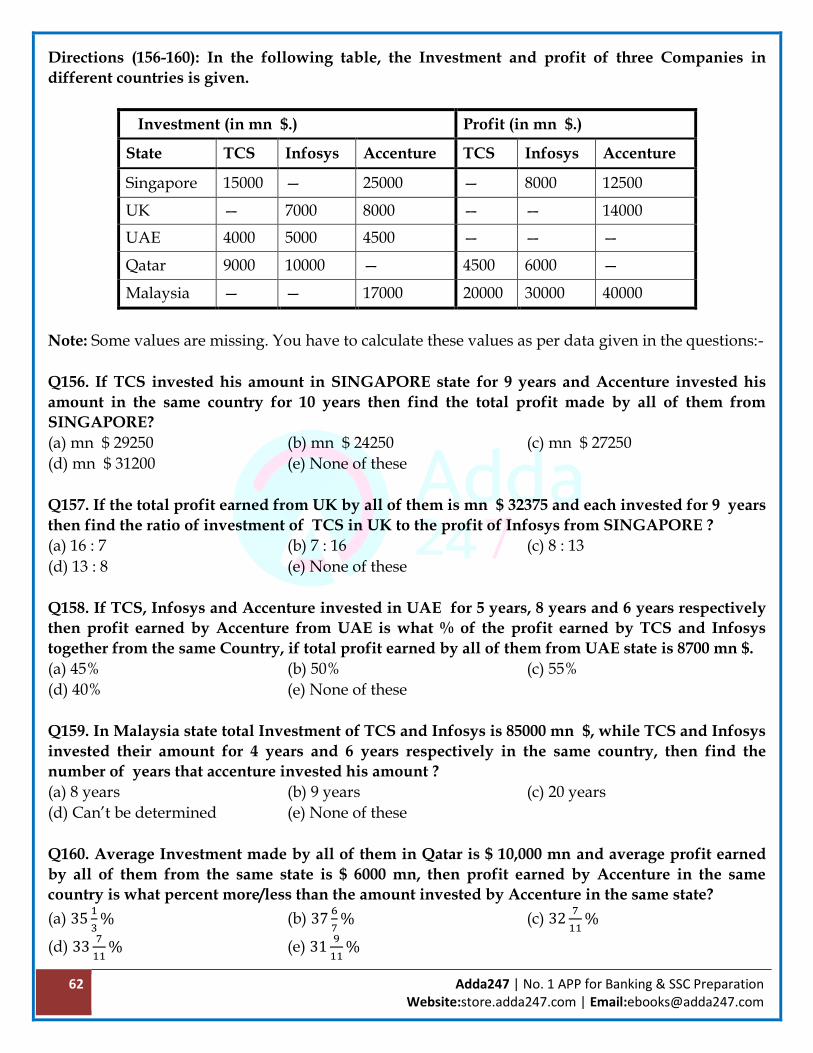
62 Adda247 | No. 1 APP for Banking & SSC Preparation Website:store.adda247.com | Email:[email protected]
Directions (156-160): In the following table, the Investment and profit of three Companies in
different countries is given.
Investment (in mn $.) Profit (in mn $.)
State TCS Infosys Accenture TCS Infosys Accenture
Singapore 15000 — 25000 — 8000 12500
UK — 7000 8000 — — 14000
UAE 4000 5000 4500 — — —
Qatar 9000 10000 — 4500 6000 —
Malaysia — — 17000 20000 30000 40000
Note: Some values are missing. You have to calculate these values as per data given in the questions:-
Q156. If TCS invested his amount in SINGAPORE state for 9 years and Accenture invested his
amount in the same country for 10 years then find the total profit made by all of them from
SINGAPORE?
(a) mn $ 29250 (b) mn $ 24250 (c) mn $ 27250
(d) mn $ 31200 (e) None of these
Q157. If the total profit earned from UK by all of them is mn $ 32375 and each invested for 9 years
then find the ratio of investment of TCS in UK to the profit of Infosys from SINGAPORE ?
(a) 16 : 7 (b) 7 : 16 (c) 8 : 13
(d) 13 : 8 (e) None of these
Q158. If TCS, Infosys and Accenture invested in UAE for 5 years, 8 years and 6 years respectively
then profit earned by Accenture from UAE is what % of the profit earned by TCS and Infosys
together from the same Country, if total profit earned by all of them from UAE state is 8700 mn $.
(a) 45% (b) 50% (c) 55%
(d) 40% (e) None of these
Q159. In Malaysia state total Investment of TCS and Infosys is 85000 mn $, while TCS and Infosys
invested their amount for 4 years and 6 years respectively in the same country, then find the
number of years that accenture invested his amount ?
(a) 8 years (b) 9 years (c) 20 years
(d) Can’t be determined (e) None of these
Q160. Average Investment made by all of them in Qatar is $ 10,000 mn and average profit earned
by all of them from the same state is $ 6000 mn, then profit earned by Accenture in the same
country is what percent more/less than the amount invested by Accenture in the same state?
(a) 351
3% (b) 37
6
7% (c) 32
7
11%
(d) 337
11% (e) 31
9
11%
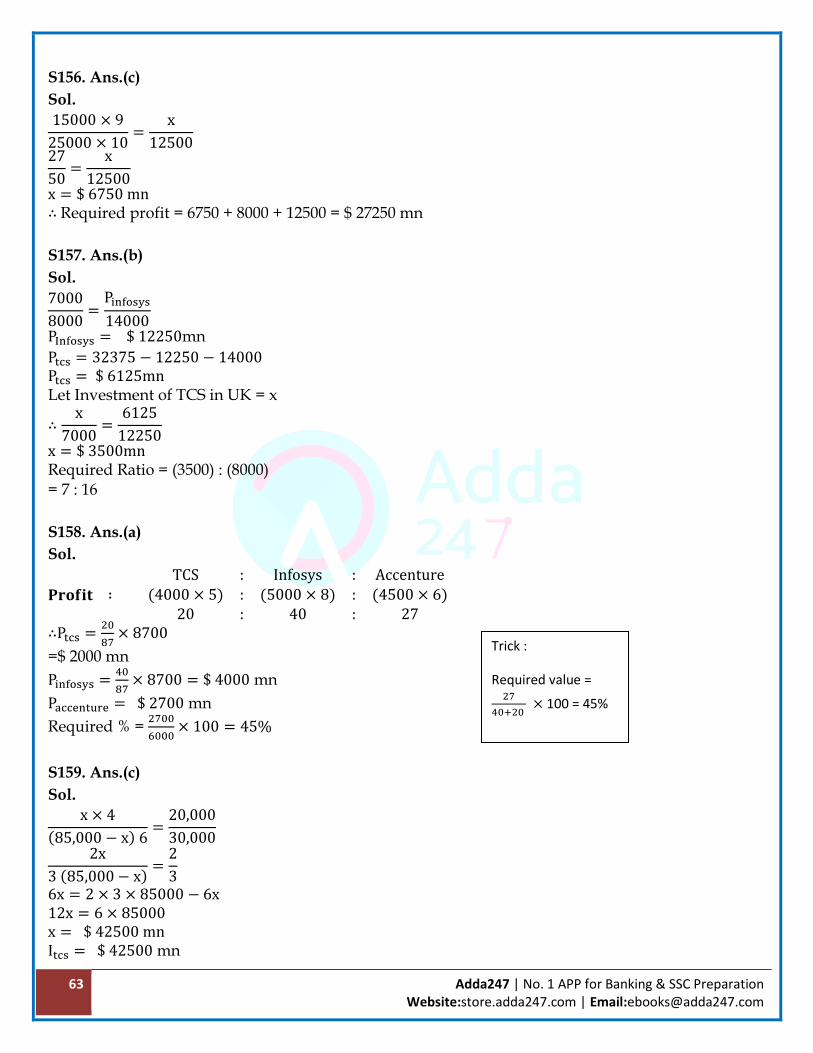
63 Adda247 | No. 1 APP for Banking & SSC Preparation Website:store.adda247.com | Email:[email protected]
S156. Ans.(c)
Sol.
15000 × 9
25000 × 10=
x
12500
27
50=
x
12500
x = $ 6750 mn ∴ Required profit = 6750 + 8000 + 12500 = $ 27250 mn
S157. Ans.(b)
Sol.
7000
8000=
Pinfosys
14000
PInfosys = $ 12250mn
Ptcs = 32375 − 12250 − 14000 Ptcs = $ 6125mn Let Investment of TCS in UK = x
∴x
7000=
6125
12250
x = $ 3500mn Required Ratio = (3500) : (8000) = 7 : 16
S158. Ans.(a)
Sol.
𝐏𝐫𝐨𝐟𝐢𝐭 ∶
TCS : Infosys : Accenture(4000 × 5) : (5000 × 8) : (4500 × 6)
20 : 40 : 27
∴Ptcs =20
87× 8700
=$ 2000 mn
Pinfosys =40
87× 8700 = $ 4000 mn
Paccenture = $ 2700 mn
Required % = 2700
6000× 100 = 45%
S159. Ans.(c)
Sol.
x × 4
(85,000 − x) 6=
20,000
30,000
2x
3 (85,000 − x)=
2
3
6x = 2 × 3 × 85000 − 6x 12x = 6 × 85000 x = $ 42500 mn Itcs = $ 42500 mn
Trick :
Required value = 27
40+20 × 100 = 45%

64 Adda247 | No. 1 APP for Banking & SSC Preparation Website:store.adda247.com | Email:[email protected]
∴ Iinfosys = $ 42500 mn
Let Required years = y
∴ 42500× 6
17,000× y=
30,000
40,000
y = 20 years
S160. Ans.(e)
Sol.
Iaccenture = 30000 − 9000 − 10000
= $ 11000 mn
Paccenture = 18000 − 4500 − 6000
= $ 7500 mn
Required % = 11000−7500
11000× 100
= 319
11%
Directions (161-165): A person purchased 5 Gadgets from a shop and sold them online. Given
below is the data showing cost price, selling price and profit/loss percentage.
C.P. (in Rs.) Profit/Loss% S.P. (in Rs.)
Smartphone 32445 — 40556.25
Laptop — Profit-15% 40940
Tablet 22150 Loss-12% —
Digital camera 28295 — 31140
Smart Watch — Profit-25% 7075
Q161. Cost price of Laptop is what percent of selling price of Tablet? (approximate)
(a) 138% (b) 182% (c) 142%
(d) 154% (e) 186%
Q162. If there has been a profit of 12% on Tablet instead of 12% loss. Then the new S.P. is how
much more than the original S.P.?
(a) 5216 (b) 5396 (c) 5336
(d) 5316 (e) None of these
Q163. Profit percentage on Digital camera is what percent more/less than profit percentage on
Laptop?
(a) 50% more (b) 33.34% less (c) 33.67% more
(d) 50% less (e) 150% less

65 Adda247 | No. 1 APP for Banking & SSC Preparation Website:store.adda247.com | Email:[email protected]
Q164. What is the ratio between profit percentage of Smart Watch to profit percentage of
Smartphone?
(a) 5 : 3 (b) 3 : 2 (c) 3 : 5
(d) 2 : 5 (e) None of these
Q165. What is the overall profit/loss percentage? (approximate)
(a) 22.12% profit (b) 12.12% profit (c) 14.14% profit
(d) 33.12% loss (e) 15.15% loss
S161. Ans.(b)
Sol. Let cost price of Laptop = 𝑥
𝑥 ×(100 + 15)
100= 40940
𝑥 = 35600
Selling price of Tablet = 22150 ×(100−12)
100= 19492
Required percentage =35600
19492 × 100 ≈ 182%
S162. Ans.(d)
Sol. Original S.P.= 22150 ×88
100= 19492
New S.P.= 22150 ×(100+12)
100= 24808
Difference = 5316
S163. Ans.(b)
Sol. Percentage profit on Digital camera =31140−28295
28295× 100 = 10.05%
Profit percentage on Laptop = 15%
Required percentage =(15−10)
15× 100 =
100
3= 33.34% 𝑙𝑒𝑠𝑠
S164. Ans.(e)
Sol. Profit percentage on 𝑆𝑚𝑎𝑟𝑡𝑝ℎ𝑜𝑛𝑒 =40556.25−32445
32445× 100 = 25%
Profit percentage on Smart Watch= 25%
Required Ratio = 1 ∶ 1
S165. Ans.(b)
Sol. Overall cost price of all items together = 32445 + 35600 + 22150 + 28295 + 5660 = 124150
Overall selling price of all items together = 40556.25 + 40940 + 19492 + 31140 + 7075 = 139203.25
Profit percentage =139203.25−124150
124150× 100 ≈ 12.12% profit

66 Adda247 | No. 1 APP for Banking & SSC Preparation Website:store.adda247.com | Email:[email protected]
Directions (166-170): Study the table and answer the given questions.
Data related to the number of employees in five different companies in December 2012
Company Total
number of
Employees
Out of total number of employees
Percentage
Of Science
graduates
Percentage of
Commerce
graduates
Percentage
of Arts
graduates
M 1050 32% – –
N 700 – 31% 40%
O – 30% 30% –
P – – 40% 20%
Q – 35% 50% –
Note:
(I) Employees of the given companies can be categorised only in three types: Science graduates,
Commerce graduates and Arts graduates
(II) A few values are missing in the table (indicated –). A candidate is expected to calculate the
missing value, if it is required to answer the given question, on the basis of the given data and
information.
Q166. What is the difference between the number of Arts graduate employees and Science
graduate employees in Company N?
(a) 87 (b) 89 (c) 77
(d) 81 (e) 73
Q167. The average number of Arts graduate employees and commerce graduate employees in
Company Q was 312. What was the total number of employees in Company Q?
(a) 920 (b) 960 (c) 1120
(d) 1040 (e) 1080
Q168. If the ratio of the number of Commerce graduate employees to that of Arts graduate
employees in Company M was 10 : 7, what was the number of Arts graduate employees in M?
(a) 294 (b) 266 (c) 280
(d) 308 (e) 322

67 Adda247 | No. 1 APP for Banking & SSC Preparation Website:store.adda247.com | Email:[email protected]
Q169. The total number of employees in Company N increased by 20% from December 2012 to
December 2013. If 20% of the total number of employees in Company N in December 2013 were
Science graduates, what was the number of Science graduate employees in company N in
December 2013?
(a) 224 (b) 266 (c) 294
(d) 252 (e) 168
Q170. The total number of employees in Company P was 3 times the total number of employees in
Company O. If the difference between the number of Arts graduate employees in Company P and
that in Company O was 180, what was the total number of employees in Company O?
(a) 1200 (b) 1440 (c) 720
(d) 900 (e) 1080
S166. Ans.(c)
Sol. Total number of employees in company N = 700
Percentage of Science graduate employees = [100 – (31 + 40)] = 29%
Now, percentage difference between Arts graduate and science graduate employees
= (40 – 29)% = 11%
11% of 700 = 77
Therefore, difference = 77
S167. Ans.(b)
Sol. The percentage of Arts graduate employees in Company Q = 100 – 35 – 50 = 15%
Now, the percentage of Arts graduate employees and Commerce and Arts = 50 + 15 = 65%
Average = 312
Therefore, the total number of employees in commerce and Arts = 2 × 312
Let the total employees in Company Q be x
Then, 65% of x = 2 × 312
x = 960
S168. Ans.(a)
Sol. The percentage of commerce graduate and Arts graduate employees in company M
= 100 – 32 = 68%
Now, the percentage of Arts graduate employees = 68 × 7
17= 28%
the percentage of Commerce graduate employees = 68 × 10
17= 40%
The number of arts graduate employees in company M = 1050 × 28
100= 294
S169. Ans.(e)
Sol. The number of employees in company N in December 2012 = 700
The number of employees in company N in December 2013 = 700 × 120
100= 840
Number of Science graduate employees in company N in December 2013 = 20 × 840
100= 168

68 Adda247 | No. 1 APP for Banking & SSC Preparation Website:store.adda247.com | Email:[email protected]
S170. Ans.(d)
Sol. The percentage of Arts graduate employees in company O = 100 – 30 – 30 = 40%
The percentage difference between Arts graduate employees in company O and P = 40 – 20 = 20%
Now, let the number of employees in company O be x
Then, x × 20% = 180
x = 900
Directions (171-175): Study the table carefully and answer the given questions.
Data related to number of candidates appeared and qualified in a competitive exam from 2 states
during 5 years
Years
State P State Q
Number of
appeared
candidates
Percentage of
appeared
candidates who
qualified
Number of
appeared
candidates
Percentage of
appeared
candidates who
qualified
2006 450 60% – 30%
2007 600 43% – 45%
2008 – 60% 280 60%
2009 480 70% 550 50%
2010 380 – 400 –
Q171. Out of the number of qualified candidates from State P in 2008, the respective ratio of male
and female candidates is 11 : 7. If the number of female qualified candidates from State P in 2008
is 126, what is the number of appeared candidates (both male and female) from State P in 2008?
(a) 630 (b) 510 (c) 570
(d) 690 (e) 540
Q172. The number of appeared candidates from State Q increased by 100% from 2006 to 2007. If
the total number of qualified candidates from State Q in 2006 and 2007 together is 408, what is the
number of appeared candidates from State Q in 2006?
(a) 380 (b) 360 (c) 340
(d) 320 (e) 300
Q173. What is the difference between the number of qualified candidates from State P in 2006 and
that in 2007?
(a) 12 (b) 22 (c) 14
(d) 24 (e) 16
Q174. If the average number of qualified candidates from State Q in 2008, 2009 and 2010 is 210,
what is the number of qualified candidates from State Q in 2010?
(a) 191 (b) 195 (c) 183
(d) 187 (e) 179

69 Adda247 | No. 1 APP for Banking & SSC Preparation Website:store.adda247.com | Email:[email protected]
Q175. If the respective between the number of qualified candidates from State P in 2009 and 2010 is 14 : 9, what is the number of qualified candidates from State P in 2010?
(a) 252 (b) 207 (c) 216
(d) 234 (e) 198
S171. Ans.(e)
Sol. No. of qualified candidates in 2008 =3𝑥
5
No. of female qualified from state P
=7
18×
3𝑥
5
=7𝑥
30
7𝑥
30= 126
𝑥 = 30 × 18 = 540 ∴ Required no. of appeared candidates = 540
S172. Ans.(c)
Sol. Let no. of appeared candidates from state Q in 2006 = 100
Let no. of appeared candidates from state in 2007 = 200 ∴ 30 + 90 → 408
1 →408
120
100 →408
120× 100 = 340
S173. Ans.(a)
Sol. Required difference =60
100× 450 −
43
100× 600
= 270 – 258
= 12
S174. Ans.(d)
Sol. Let required no. of candidates = x
∴28 × 6 + 55 × 5 + 𝑥
3= 210
168 + 275 + x = 630
x = 630 – 443
x = 187
S175. Ans.(c) Sol. 48 × 7
𝑥=
14
9
x = 24 × 9
x = 216

70 Adda247 | No. 1 APP for Banking & SSC Preparation Website:store.adda247.com | Email:[email protected]
Directions (176-180): In the following table, investments and profit of three persons is given for
different years in a joint business.
Investments (in Rs.) Profit (in Rs.)
Year A B C A B C
2012 25500 31500 34500 127500 — 172500
2013 — 7500 — — 18750 138750
2014 — 10050 12000 — — 21000
2015 — — 13500 75000 66000 36000
2016 16500 45000 — — — —
Note:
1. Apart from year 2015, they invested the amounts for same period.
2. Some values are missing. You have to calculate these value as per given data.
Q176. If the total profit in 2014 is 59587.50Rs. , then find the ratio of the investment of B in 2013 to
the investment of A in 2014.
(a) 5 : 8 (b) 10 : 27 (c) 5 : 7
(d) 5 : 9 (e) None of these
Q177. In year 2015, A and B invested their amount for 6 months and 4 months respectively and B
investedRs.24750 then find the number of months that C invested his amount for?
(a) 3 months (b) 6 months (c) 2 months
(d) 4 months (e) 1 month
Q178. Total profit earned by B in year 2012 is how much less (in Rs.) than the profit earned by him
in the year 2014?
(a) Rs. 176575.5 (b) Rs. 139912.5 (c) Rs. 193825
(d) Rs. 185050 (e) None of these
Q179. Investment made by A in 2016 is approximately what % more/less than the investment made
by C in 2013?
(a) 31% (b) 70% (c) 40%
(d) 68% (e) 79%
Q180. Total profit earned by all in 2016 is 578340Rs. and the ratio of investment made by A and B
together and investment made by B and C together is 123 : 137. Then find the difference between
the profit made by A and C in 2016 ?
(a) 47628 (b) 59428 (c) 69478
(d) 45928 (e) None of these

71 Adda247 | No. 1 APP for Banking & SSC Preparation Website:store.adda247.com | Email:[email protected]
S176. Ans.(a)
Sol. Let profit of B in 2014 = x
∴12000
21000=
10.050
𝑥
x = 17587.5 Rs.
Profit of A in 2014 = 59587.5 – 178587.5 – 21000
= 21000 Rs.
∴ Required Ratio = (7500) :(12×21
21) × 1000
= 7500 : 12000
= 5 : 8
S177. Ans.(d)
Sol. Let C invested for x months, then
24750 × 4
13500 × 𝑥=
66000
36000
⇒ x = 4
S178. Ans.(b)
Sol. Let profit earned by B in year 2012 = 𝑥
Profit earned by B in year 2014 = 𝑦
31500
𝑥=
34500
172500
x = 157500 Rs.
And, 12000
21000=
10050
𝑦
y = 17587.5 Rs.
Required Difference = 157500 - 17587.5 =139912.5
S179. Ans.(b)
Sol. Required % = 55500−16500
55500× 100
≈ 70%
S180. Ans.(a)
Sol.
Investment made by C in 2016 =(16500 + 45000)
123× 137 − 45000
= 23500 Rs.
Ratio of their investment = 165 : 450 : 235
= 33 : 90 : 47
Difference= (47 − 33)
170× 578340 = 47628

72 Adda247 | No. 1 APP for Banking & SSC Preparation Website:store.adda247.com | Email:[email protected]
Directions (181-185): The following bar graph shows the production (in lakh tonnes) of 3
companies A, B and C in different years. Study the graph and answer the following questions:
Q181. The average production (in lakh tonnes) of company A over the given years is:
(a) 32 (b) 36 (c) 38
(d) 35 (e) None of these
Q182. The total production of all 3 companies together in 2008 is what percent more/less than that
in 2006? (rounded off to two decimal points)
(a) 4.67% (b) 5.17% (c) 5.67%
(d) 4.17% (e) 6.67%
Q183. The total production of all 3 companies together is 2nd lowest in
(a) 2005 (b) 2006 (c) 2007
(d) 2008 (e) 2009
Q184. What is the percentage decrease in total production of all 3 companies together in 2007 as
compared to previous year?
(a) 10.5% (b) 11.5% (c) 9.5%
(d) 12.5% (e) None of these
Q185. What is the ratio of total production of company B to that of company C in all years
together?
(a) 38 : 35 (b) 38 : 37 (c) 35 : 38
(d) 37 : 38 (e) None of these
0
10
20
30
40
502005
2006
20072008
2009A
B
C

73 Adda247 | No. 1 APP for Banking & SSC Preparation Website:store.adda247.com | Email:[email protected]
S181. Ans.(c)
Sol. Required average = 190
5= 38 lakh tonnes
S182. Ans.(d)
Sol. Required percentage =(125−120)
120× 100 = 4.17%
S183. Ans.(c)
Sol. Total production is 2nd lowest in 2007 i.e. 105 lakh tonnes
S184. Ans.(d)
Sol. Required percentage =15
120× 100 = 12.5%
S185. Ans.(d)
Sol. Required ratio = 185
190= 37 ∶ 38
Directions (186-190): Read the following graph and table carefully and answer the questions given
below.
Total number of admitted students in different years
Year Total number of students
2005 12560
2006 14820
2007 13850
2008 16580
2009 11220
0
10
20
30
40
50
602005
2006
20072008
2009
Percentage of admitted students in different discipline from 2005 to 2009
Science Commerce Art

74 Adda247 | No. 1 APP for Banking & SSC Preparation Website:store.adda247.com | Email:[email protected]
Q186. What is the average number of students in Arts in 2008 and 2009 together?
(a) 5182 (b) 5475 (c) 5318
(d) 5267 (e) None of these
Q187. The number of students in Science in 2008 is approximately what percent of the number of
students in commerce in 2006?
(a) 67 (b) 72 (c) 63
(d) 58 (e) 78
Q188. What is the difference between the number of students in Science in 2006 and number of
students of Commerce in 2008?
(a) 1625 (b) 1546 (c) 1871
(d) 1781 (e) None of these
Q189. What is the difference between the number of students in Arts in 2008 and number of
students in Science in 2006?
(a) 3210 (b) 3103 (c) 3325
(d) 3014 (e) None of these
Q190. What is the total number of students in Commerce in all the years?
(a) 28026 (b) 21642 (c) 22510
(d) 19441 (e) None of these
S186. Ans.(d)
Sol. Average =10534
2= 5267.
S187. Ans.(a)
Sol. Required percent =4974
7410× 100 = 67% (approx.)
S188. Ans.(c)
Sol. Difference = 5187 – 3316 = 1871.
S189. Ans.(b)
Sol. Difference = 8290 – 5187 = 3103
S190. Ans.(e)
Sol. Total number = 20826.

75 Adda247 | No. 1 APP for Banking & SSC Preparation Website:store.adda247.com | Email:[email protected]
Directions (191-195): There are five students who appeared for RBI Grade B exam. Paper consists
of 100 questions with 1 mark for each correct answer and 0.25 marks for each wrong answer.
Students Questions attempted Right Questions Wrong Questions Marks obtained
Aditya 78 – – 70.5
Puskar 92 76 – –
Anshuman 98 – 36 –
Alka – 30 – 27.25
Avanish 56 – – 53.50
Q191. Difference between total right number of questions of all students together and total wrong
no. of questions of all students together is
(a) 141 (b) 161 (c) 223
(d) 156 (e) None of these
Q192. Marks obtained by Aditya and Puskar together is what % of the marks obtained by
Anshuman, Avanish and Alka together? (rounded off to 2 decimal places)
(a) 106.54% (b) 91.16% (c) 95.20%
(d) 96.71% (e) 101.71%
Q193. If the penalty of wrong answer is 0.33 then marks obtained by Aditya, Anshuman and
Puskar together is
(a) 192.21 (b) 224.19 (c) 190.86
(d) 219.14 (e) 194.22
Q194. If the passing % marks in the exam is 50 marks than at least how many questions has to be
answered right by Puskar? (He attempted 92 questions)
(a) 58 (b) 56 (c) 59
(d) 55 (e) 60
Q195. What is the percent of marks obtained by all of them together?
(a) 59.03% (b) 53.15% (c) 52.53%
(d) 45.05% (e) 55.25%
S191. Ans.(c)
Sol. Required difference = (72 + 76 + 62 + 30 + 54) – (6 + 16 + 36 + 11 + 2)
= 294 – 71 = 223
S192. Ans.(a)
Sol. Required % =70.5+72
53+27.25+53.50× 100
= 106.54%

76 Adda247 | No. 1 APP for Banking & SSC Preparation Website:store.adda247.com | Email:[email protected]
S193. Ans.(c)
Sol. Required marks = (72 + 76 + 62) – 0.33 (6 + 16 + 36) = 190.86
S194. Ans.(c)
Sol. By options
Let right Questions = 59
∴ marks = 92 −1
4(92 − 59) = 50.75
S195. Ans.(e)
Sol. Required % =70.5 + 72 + 53 + 27.25 + 53.50
500 × 100 = 55.25%
Directions (196-200): Seven companies A, B, C, D, E, F and G are engaged in production of two
items I and II. Comparative data about production of these items by the companies is given in the
following graph and table. Study them carefully and answer the questions given below.
Percentage of the total production produced by the seven companies
Cost of the total production (both items together) by seven companies = Rs 25 crores
Ratio of production between items I and II and the per cent profit earned for the two items
Company Ratio of
Production
Per cent profit earned
Item I Item II Item I Item II A 2 3 25 20 B 3 2 32 35 C 4 1 20 22 D 3 5 15 25 E 5 3 28 30 F 1 4 35 25 G 1 2 30. 24
A, 15%
B, 11%
C, 22%
D, 8%
E, 27%
F, 5%
G, 12%

77 Adda247 | No. 1 APP for Banking & SSC Preparation Website:store.adda247.com | Email:[email protected]
Q196. What is the total cost of the production of item I by companies A and C together in Rs crore?
(a) 9.25 (b) 5.9 (c) 4.1625
(d) 4.9 (e) None of these
Q197. What is the amount of profit earned by company D on item II?
(a) Rs 3.125cr (b) Rs 31.25 cr (c) Rs 3.125 lakhs
(d) Rs 31.25 lakhs (e) None of these
Q198. Cost of production of item I by company F is what per cent of the cost of production of item
II by company D?
(a) 16% (b) 33.33% (c) 66.67%
(d) 20% (e) None of these
Q199. What is the ratio of the cost of production of item I by company A to the cost of production
of item I by company D?
(a) 3 : 5 (b) 1 : 2 (c) 2 : 1
(d) 2 : 3 (e) None of these
Q200. What is the total of the profit earned by company B on production of item I and the profit
earned by company A on production of item II?
(a) Rs 9.78 cr (b) Rs 97.8 lakhs (c) Rs 52.8 lakhs
(d) Rs 5.28 cr (e) None of these
S196. Ans.(b)
Sol. Total cost of production by company A =15
100× 25 = 3.75 crores = 3.75 crores
Total cost of production by Company C =22
100× 25 = 5.5 crores
Cost of production of item I by Company A =2
5× 3.75 = 1.5 crores
Cost of production of item I by Company C =4
5× 5.5 = 4.4 crores
∴ Required total cost = 1.5 + 4.4 = 5.9 crores
S197. Ans.(d)
Sol. Required profit earned =25
100×
5
8×
8
100× 25 = 0.3125 crores
= 31.25 lakhs
S198. Ans.(d)
Sol. Required %
=
5
100×
1
5× 25
8
100×
5
8× 25
× 100
=0.25
1.25× 100 = 20%

78 Adda247 | No. 1 APP for Banking & SSC Preparation Website:store.adda247.com | Email:[email protected]
S199. Ans.(c)
Sol. Required Ratio
=
15
100×
2
5× 25
8
100×
3
8× 25
=30
500×
800
24
=5 × 8
5 × 4
= 2 : 1
S200. Ans.(b)
Sol. Required total profit
= (32
100×
3
5×
11
100× 25) + (
20
100×
3
5×
15
100× 25)
= 0.528 + 0.45
= 0.978 crores
= 97.8 lakhs

79 Adda247 | No. 1 APP for Banking & SSC Preparation Website:store.adda247.com | Email:[email protected]