, kwak, s., lewis, s. j., wade, k. h., relton, c. l
TRANSCRIPT

Cho, Y., Kwak, S., Lewis, S. J., Wade, K. H., Relton, C. L., Smith, G. D., &Shin, M-J. (2018). Exploring the utility of alcohol flushing as an instrumentalvariable for alcohol intake in Koreans. Scientific Reports, 8(1), [458].https://doi.org/10.1038/s41598-017-18856-z
Publisher's PDF, also known as Version of record
License (if available):CC BY
Link to published version (if available):10.1038/s41598-017-18856-z
Link to publication record in Explore Bristol ResearchPDF-document
University of Bristol - Explore Bristol ResearchGeneral rights
This document is made available in accordance with publisher policies. Please cite only the publishedversion using the reference above. Full terms of use are available:http://www.bristol.ac.uk/pure/about/ebr-terms
brought to you by COREView metadata, citation and similar papers at core.ac.uk
provided by Explore Bristol Research

Supplementary Information file
Exploring the utility of alcohol flushing as an instrumental variable for alcohol intake in
Koreans
Yoonsu Cho, PhD 1,2; Soyoung Kwak, Ms 1; Sarah J. Lewis, PhD 2; Kaitlin H. Wade, PhD 2;
Caroline L. Relton, PhD 2, George Davey Smith, MD 2*, Min-Jeong Shin, PhD 1*
1 Department of Public Health Sciences, BK21PLUS Program in Embodiment: Health-Society
Interaction, Graduate School, Korea University, Seoul, Republic of Korea. 2 MRC Integrative
Epidemiology Unit, Population Health Sciences, Bristol Medical School, University of Bristol,
Bristol, UK.

Supplementary Method
Construction of the Genetic Risk Score and Mendelian randomization analysis
We constructed a genetic risk score (GRS) for each individual based on the number of risk
alleles of both ALDH2 rs671 and ADH1B rs1229984, previously related to alcohol flushing,
which allowed us to achieve higher power in Mendelian randomization (MR) analyses. The
extracted SNP data are described in Supplementary Table 4. We used the generated GRS as the
instrumental variable in MR analyses to assess the causal role of alcohol intake on the
hypertensive outcomes, using the same statistical methods as for main analyses.

Supplementary Figure legend
Supplementary Figure 1. Distribution of genetic risk score in the study sample. The
frequencies of genetic risk score (GRS) were approximately within normal distribution. The
means of GRS were 2.17 ± 0.77 in the alcohol flusher group and 1.56 ± 0.67 in the alcohol
non-flusher group, respectively.
.

Supplementary Figure 1.
0
200
400
600
800
1000
1200
1400
0 1 2 3 4
Fre
qu
ency
(N
)
Genetic risk score
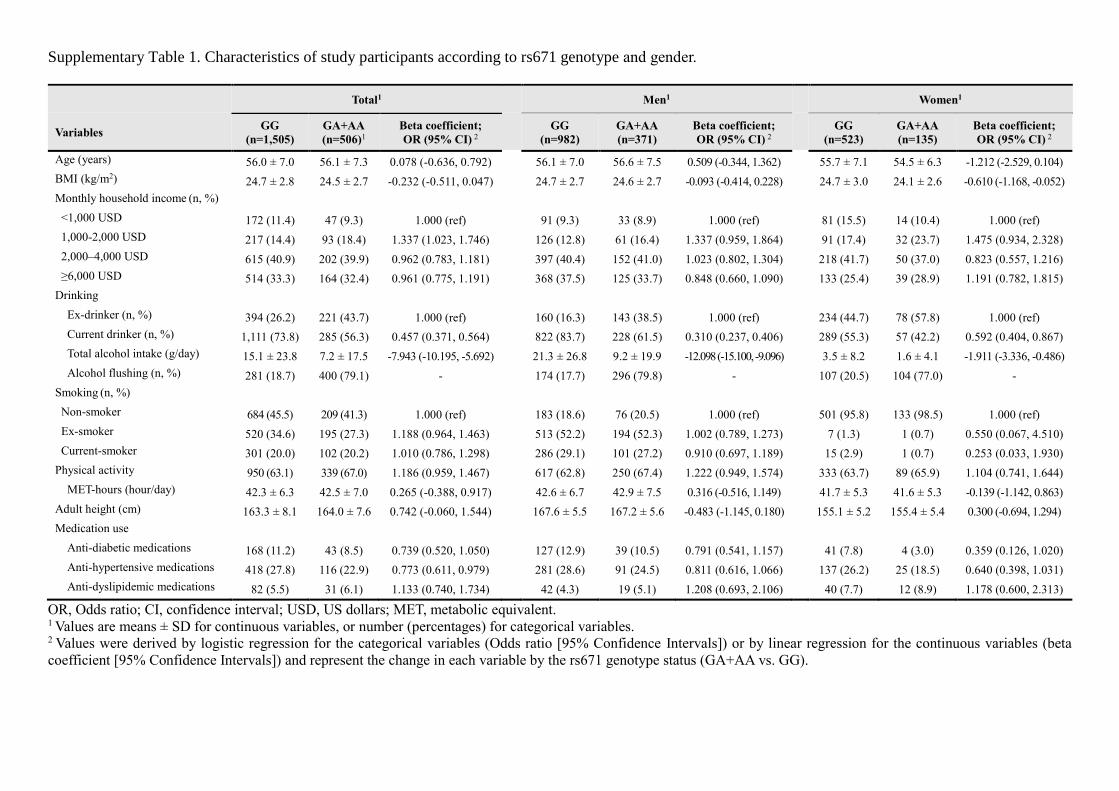
Supplementary Table 1. Characteristics of study participants according to rs671 genotype and gender.
Total1 Men1 Women1
Variables GG
(n=1,505)
GA+AA
(n=506)1
Beta coefficient;
OR (95% CI) 2
GG
(n=982)
GA+AA
(n=371)
Beta coefficient;
OR (95% CI) 2 GG
(n=523)
GA+AA
(n=135)
Beta coefficient;
OR (95% CI) 2
Age (years) 56.0 ± 7.0 56.1 ± 7.3 0.078 (-0.636, 0.792) 56.1 ± 7.0 56.6 ± 7.5 0.509 (-0.344, 1.362) 55.7 ± 7.1 54.5 ± 6.3 -1.212 (-2.529, 0.104)
BMI (kg/m2) 24.7 ± 2.8 24.5 ± 2.7 -0.232 (-0.511, 0.047) 24.7 ± 2.7 24.6 ± 2.7 -0.093 (-0.414, 0.228) 24.7 ± 3.0 24.1 ± 2.6 -0.610 (-1.168, -0.052)
Monthly household income (n, %)
<1,000 USD 172 (11.4) 47 (9.3) 1.000 (ref) 91 (9.3) 33 (8.9) 1.000 (ref) 81 (15.5) 14 (10.4) 1.000 (ref)
1,000-2,000 USD 217 (14.4) 93 (18.4) 1.337 (1.023, 1.746) 126 (12.8) 61 (16.4) 1.337 (0.959, 1.864) 91 (17.4) 32 (23.7) 1.475 (0.934, 2.328)
2,000–4,000 USD 615 (40.9) 202 (39.9) 0.962 (0.783, 1.181) 397 (40.4) 152 (41.0) 1.023 (0.802, 1.304) 218 (41.7) 50 (37.0) 0.823 (0.557, 1.216)
≥6,000 USD 514 (33.3) 164 (32.4) 0.961 (0.775, 1.191) 368 (37.5) 125 (33.7) 0.848 (0.660, 1.090) 133 (25.4) 39 (28.9) 1.191 (0.782, 1.815)
Drinking
Ex-drinker (n, %) 394 (26.2) 221 (43.7) 1.000 (ref) 160 (16.3) 143 (38.5) 1.000 (ref) 234 (44.7) 78 (57.8) 1.000 (ref)
Current drinker (n, %) 1,111 (73.8) 285 (56.3) 0.457 (0.371, 0.564) 822 (83.7) 228 (61.5) 0.310 (0.237, 0.406) 289 (55.3) 57 (42.2) 0.592 (0.404, 0.867)
Total alcohol intake (g/day) 15.1 ± 23.8 7.2 ± 17.5 -7.943 (-10.195, -5.692) 21.3 ± 26.8 9.2 ± 19.9 -12.098 (-15.100, -9.096) 3.5 ± 8.2 1.6 ± 4.1 -1.911 (-3.336, -0.486)
Alcohol flushing (n, %) 281 (18.7) 400 (79.1) - 174 (17.7) 296 (79.8) - 107 (20.5) 104 (77.0) -
Smoking (n, %)
Non-smoker 684 (45.5) 209 (41.3) 1.000 (ref) 183 (18.6) 76 (20.5) 1.000 (ref) 501 (95.8) 133 (98.5) 1.000 (ref)
Ex-smoker 520 (34.6) 195 (27.3) 1.188 (0.964, 1.463) 513 (52.2) 194 (52.3) 1.002 (0.789, 1.273) 7 (1.3) 1 (0.7) 0.550 (0.067, 4.510)
Current-smoker 301 (20.0) 102 (20.2) 1.010 (0.786, 1.298) 286 (29.1) 101 (27.2) 0.910 (0.697, 1.189) 15 (2.9) 1 (0.7) 0.253 (0.033, 1.930)
Physical activity 950 (63.1) 339 (67.0) 1.186 (0.959, 1.467) 617 (62.8) 250 (67.4) 1.222 (0.949, 1.574) 333 (63.7) 89 (65.9) 1.104 (0.741, 1.644)
MET-hours (hour/day) 42.3 ± 6.3 42.5 ± 7.0 0.265 (-0.388, 0.917) 42.6 ± 6.7 42.9 ± 7.5 0.316 (-0.516, 1.149) 41.7 ± 5.3 41.6 ± 5.3 -0.139 (-1.142, 0.863)
Adult height (cm) 163.3 ± 8.1 164.0 ± 7.6 0.742 (-0.060, 1.544) 167.6 ± 5.5 167.2 ± 5.6 -0.483 (-1.145, 0.180) 155.1 ± 5.2 155.4 ± 5.4 0.300 (-0.694, 1.294)
Medication use
Anti-diabetic medications 168 (11.2) 43 (8.5) 0.739 (0.520, 1.050) 127 (12.9) 39 (10.5) 0.791 (0.541, 1.157) 41 (7.8) 4 (3.0) 0.359 (0.126, 1.020)
Anti-hypertensive medications 418 (27.8) 116 (22.9) 0.773 (0.611, 0.979) 281 (28.6) 91 (24.5) 0.811 (0.616, 1.066) 137 (26.2) 25 (18.5) 0.640 (0.398, 1.031)
Anti-dyslipidemic medications 82 (5.5) 31 (6.1) 1.133 (0.740, 1.734) 42 (4.3) 19 (5.1) 1.208 (0.693, 2.106) 40 (7.7) 12 (8.9) 1.178 (0.600, 2.313)
OR, Odds ratio; CI, confidence interval; USD, US dollars; MET, metabolic equivalent. 1 Values are means ± SD for continuous variables, or number (percentages) for categorical variables. 2 Values were derived by logistic regression for the categorical variables (Odds ratio [95% Confidence Intervals]) or by linear regression for the continuous variables (beta
coefficient [95% Confidence Intervals]) and represent the change in each variable by the rs671 genotype status (GA+AA vs. GG).

Supplementary Table 2. Association of rs671 genotype with flushing among Korean men and women.
Ever drinkers Total (n=2,011) Men (n=1,112) Women (n=535)
N OR (95% CI) P-value N OR (95% CI) P-value N OR (95% CI) P-value
ALDH2 rs671
GG 1,505 1.00 (ref) 982 1.00 (ref) 523 1.00 (ref)
GA 487 16.9 (13.04, 21.90) <1.0×10⁻¹⁸ 356 18.70 (13.68, 25.56) <1.0×10⁻¹⁸ 131 13.23 (8.29, 21.11) <1.0×10⁻¹⁸
AA 19 41.28 (9.42, 180.98) 8.1×10⁻⁷ 15 73.39 (9.51, 566.57) 3.8×10⁻⁵ 4 13.63 (1.38, 134.98) 0.026
Dominant model (GG vs GA+AA) 2,011 17.35 (13.42, 22.44) <1.0×10⁻¹⁸ 1,112 19.41 (14.23, 26.48) <1.0×10⁻¹⁸ 535 13.24 (8.35, 21.01) <1.0×10⁻¹⁸
Recessive model (GG+GA vs AA) 2,011 17.96 (4.12, 78.30) 0.0001 1,112 29.40 (3.83, 225.53) 0.001 535 7.69 (0.78, 75.43) 0.080
Additive model 2,011 16.10 (12.48, 20.77) <1.0×10⁻¹⁸ 1,112 18.10 (13.30, 24.64) <1.0×10⁻¹⁸ 535 12.13 (7.69, 19.12) <1.0×10⁻¹⁸
OR, Odds ratio; CI, confidence interval
1ORs were obtained by logistic regression using rs671 genotype as an exposure. The reference genotype in the additive model was GG. All regression models were adjusted
for age, sex (for total subjects), income, MET-hour/day and smoking status and represent the odds of being an alcohol flusher (vs. non-flusher) with each genotype and model
of the rs671 genetic variant.

Supplementary Table 3. Instrumental variable estimates of alcohol intake (g/day) and hypertension based on alcohol flushing including those categorized as
“never-drinkers-but-flushers”.
Total
(n=2,595)
Men
(n=1,468)
Women
(n=1,127)
Diseases OR (95% CI)1 P-value2 OR (95% CI) P-value2 OR (95% CI) P-value2
Hypertension 1.023 (1.001, 1.045) 0.040 1.022 (1.005, 1.040) 0.012 0.994 (0.841, 1.174) 0.941
Blood pressure Beta coefficient
(95% CI) P-value
Beta coefficient
(95% CI) P-value
Beta coefficient
(95% CI) P-value
SBP (mmHg) 0.117 (-0.022, 0.256) 0.099 0.052 (-0.059, 0.164) 0.359 0.694 (-0.372, 1.760) 0.202
Adjusting treatment effect +10mmHg3 0.151 (0.001, 0.302) 0.048 0.088 (-0.032, 0.208) 0.149 0.690 (-0.462, 1.842) 0.241
Adjusting treatment effect +15mmHg3 0.169 (0.009, 0.328) 0.039 0.106 (-0.021, 0.234) 0.102 0.688 (-0.530, 1.906) 0.268
DBP (mmHg) 0.116 (0.028, 0.204) 0.010 0.073 (0.001, 0.146) 0.046 0.459 (-0.181, 1.098) 0.160
Adjusting treatment effect +5mmHg3 0.133 (0.041, 0.225) 0.005 0.091 (0.016, 0.167) 0.017 0.457 (-0.216, 1.129) 0.183
Adjusting treatment effect +10mmHg3 0.151 (0.050, 0.251) 0.003 0.110 (0.028, 0.191) 0.009 0.455 (-0.278, 1.188) 0.224
OR, odds ratio; CI, confidence interval; SBP, systolic blood pressure; DBP, diastolic blood pressure 1 ORs and beta coefficients by instrumental variable (IV) estimation were obtained from IV regressions with a two-stage least squares estimation method (in logistic and linear
regression models, respectively), using alcohol flushing as an instrument for alcohol intake. To predict the amount of alcohol intake, non-flushers were regarded as a reference
group. 2 P values were derived from IV regression analysis with adjustment for age, sex (for total subjects), income, MET-hour/day and smoking status. 3 To adjust treatment effect on blood pressure, sensible constants were added to the observed blood pressure values of all subjects on treatment (see Methods).

Supplementary Table 4. Association of genetic risk score with characteristics of study participants according to gender.
SD, Standard deviation; OR, Odds ratio; CI, Confidence intervals; USD, US dollars; MET, metabolic equivalent. 1 The unweighted genetic risk score was constructed by summation of the number of risk alleles in ALDH2 rs671 (G allele) an ADH1B in rs1229984 (C allele). 2 Values are percentages (%) for categorical variables (e.g. ALDH2 rs671 and ADH1B rs1229984), or means ± SD for continuous variables (e.g. genetic risk score). 3 Values were derived by logistic regression for the categorical variables (Odds ratio [95% Confidence Interval]) or by linear regression for the continuous variables (beta
coefficient [95% Confidence Intervals]) and represent the change in each variable by increase of genetic risk score.
Total
(n=2,011)
Men
(n=1,353)
Women
(n=658)
Genotypes Percentage or mean 2 Percentage or mean Percentage or mean
rs671 in ALDH2 (GG / AG+AA, %) 74.8 / 25.2 72.6 / 27.4 79.5 / 20.5
rs1229984 in ADH1B (TT+TC / CC, %) 94.0 / 6.0 93.9 / 6.1 94.2 / 5.8
Genetic risk score (mean ± SD)1 2.23 ± 0.77 2.19 ± 0.77 2.31 ± 0.74
Variables OR / Beta coefficient
(95% CI) 3 P-value OR / Beta coefficient
(95% CI) P-value
OR / Beta coefficient
(95% CI) P-value
Age (years) 0.066 (-0.339, 0.471) 0.751 0.002 (-0.490, 0.494) 0.994 0.315 (-0.405, 1.034) 0.390
Monthly household income (n, %)
<1,000 USD 1.000 (ref) -
1,000-2,000 USD 0.920 (0.785, 1.078) 0.301 0.928 (0.760, 1.133) 0.463 0.862 (0.661, 1.124) 0.272
2,000–4,000 USD 0.999 (0.889, 1.122) 0.985 1.014 (0.881, 1.166) 0.848 0.965 (0.782, 1.191) 0.741
≥6,000 USD 1.031 (0.913, 1.164) 0.625 1.014 (0.879, 1.169) 0.853 1.166 (0.921, 1.476) 0.201
Drinking
Ex-drinker 1.000 (ref) -
Current-drinker 1.256 (1.108, 1.424) 0.0004 1.585 (1.333, 1.884) 1.8 x ×10-7 1.078 (0.876, 1.325) 0.478
Total alcohol intake (g/day) 2.828 (1.542, 4.114) 0.00002 4.690 (2.939, 6.441) 1.7 x ×10-7 0.813 (0.034, 1.591) 0.041
Smoking (n, %)
Non-smoker 1.000 (ref) -
Ex-smoker 0.899 (0.798, 1.013) 0.081 0.986 (0.859, 1.131) 0.838 1.128 (0.440, 2.892) 0.803
Current-smoker 0.936 (0.812, 1.080) 0.367 1.006 (0.864, 1.172) 0.934 1.005 (0.514, 1.963) 0.989
Physical activity 0.947 (0.841, 1.067) 0.372 0.948 (0.822, 1.095) 0.469 0.943 (0.761, 1.170) 0.596
MET-hours (hour/day) -0.502 (-0.873, -0.132) 0.008 -0.492 (-0.972, -0.011) 0.045 -0.392 (-0.938, 0.154) 0.159
Adult height (cm) -0.731 (-1.185, -0.277) 0.002 -0.242 (-0.624, 0.140) 0.213 -0.073 (-0.615, 0.469) 0.792
Medication use
Anti-diabetic medications 1.076 (0.893, 1.296) 0.441 1.132 (0.918, 1.395) 0.246 1.002 (0.666, 1.508) 0.992
Anti-hypertensive medications 1.087 (0.956, 1.237) 0.204 1.131 (0.970, 1.320) 0.117 1.012 (0.796, 1.285) 0.925
Anti-dyslipidemic medications 0.891 (0.695, 1.143) 0.363 0.896 (0.642, 1.251) 0.519 0.823 (0.561, 1.207) 0.318

Supplementary Table 5. Instrumental variable estimates of alcohol intake (g/day) and hypertension based on genetic risk score1 for alcohol flushing.
Total
(n=2,011)
Men
(n=1,468)
Women
(n=1,127)
Diseases OR (95% CI)2 P-value3 OR (95% CI) P-value3 OR (95% CI) P-value3
Hypertension 1.035 (0.999, 1.072) 0.058 1.034 (1.002, 1.066) 0.012 1.024 (0.793, 1.322) 0.857
Blood pressure Beta coefficient
(95% CI) P-value
Beta coefficient
(95% CI) P-value
Beta coefficient
(95% CI) P-value
SBP (mmHg) 0.406 (0.146, 0.665) 0.002 0.386 (0.152, 0.620) 0.001 0.547 (-1.129, 2.224) 0.522
Adjusting treatment effect +10mmHg4 0.446 (0.165, 0.726) 0.002 0.435 (0.181, 0.689) 0.001 0.491 (-1.325, 2.307) 0.596
Adjusting treatment effect +15mmHg4 0.465 (0.169, 0.762) 0.002 0.459 (0.190, 0.729) 0.001 0.463 (-1.457, 2.383) 0.636
DBP (mmHg) 0.196 (0.042, 0.350) 0.013 0.166 (0.028, 0.304) 0.019 0.448 (-0.552, 1.447) 0.380
Adjusting treatment effect +5mmHg4 0.216 (0.054, 0.378) 0.009 0.190 (0.046, 0.335) 0.010 0.419 (-0.631, 1.470) 0.434
Adjusting treatment effect +10mmHg4 0.236 (0.059, 0.412) 0.009 0.215 (0.057, 0.373) 0.008 0.391 (-0.752, 1.534) 0.502
OR, odds ratio; CI, confidence interval; SBP, systolic blood pressure; DBP, diastolic blood pressure 1 The unweighted genetic risk score was constructed by summation of the number of risk alleles in ALDH2 rs671 (G allele) an ADH1B in rs1229984 (C allele). 2 ORs and beta coefficients by instrumental variable (IV) estimation were obtained from IV regressions with a two-stage least squares estimation method (in logistic and linear
regression models, respectively), using genetic risk score for alcohol flushing as an instrument for alcohol intake. To predict the amount of alcohol intake, 0 for genetic risk
score was regarded as a reference value. 3 P values were derived from IV regression analysis with adjustment for age, sex (for total subjects), income, MET-hour/day and smoking status. 4 To adjust treatment effect on blood pressure, sensible constants were added to the observed blood pressure values of all subjects on treatment (see Methods).
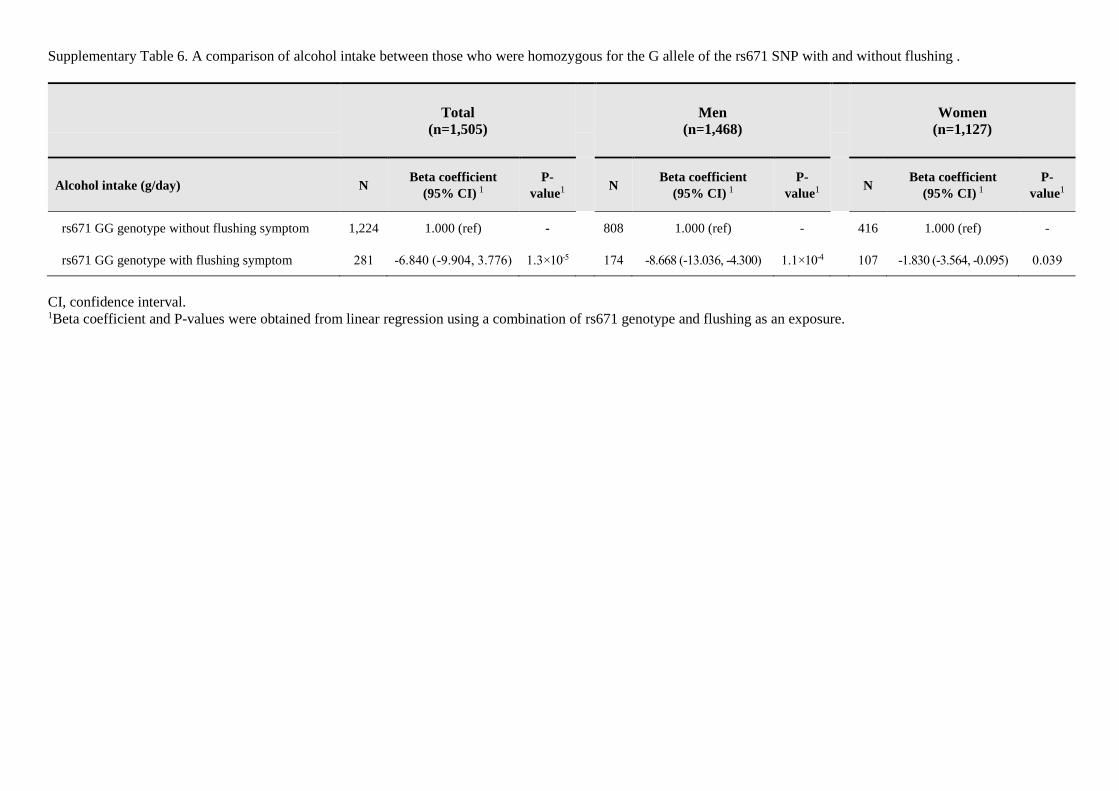
Supplementary Table 6. A comparison of alcohol intake between those who were homozygous for the G allele of the rs671 SNP with and without flushing .
Total
(n=1,505)
Men
(n=1,468)
Women
(n=1,127)
Alcohol intake (g/day) N Beta coefficient
(95% CI) 1
P-
value1 N
Beta coefficient
(95% CI) 1
P-
value1 N
Beta coefficient
(95% CI) 1
P-
value1
rs671 GG genotype without flushing symptom 1,224 1.000 (ref) - 808 1.000 (ref) - 416 1.000 (ref) -
rs671 GG genotype with flushing symptom 281 -6.840 (-9.904, 3.776) 1.3×10⁻⁵ 174 -8.668 (-13.036, -4.300) 1.1×10⁻⁴ 107 -1.830 (-3.564, -0.095) 0.039
CI, confidence interval. 1Beta coefficient and P-values were obtained from linear regression using a combination of rs671 genotype and flushing as an exposure.

Supplementary Table 7. Distribution of genotypes of the ALDH2 rs671 and ADH1B rs1229984 SNPs
according to flushing status.
Non-flusher
(n=1,330)
Flusher
(n=681)
rs1229984 rs6711 rs6711
GG GA AA GG GA AA
TT 668 (54.6) 56 (53.9) 0 (0.0) 179 (63.7) 226 (59.0) 11 (64.7)
TC 477 (39.0) 40 (38.5) 2 (0.4) 93 (33.1) 134 (35.0) 5 (29.4)
CC 79 (6.5) 8 (7.7) 0 (0.0) 9 (3.2) 23 (6.0) 21 (5.9)
1 Values are number of the participants and percentages (%).