k. srivastava and k. m. muraleedharan * ... (gatan precision etching coating system ... (neat):...
TRANSCRIPT

1
B. K. Srivastava and K. M. Muraleedharan *
Department of Chemistry, Indian Institute of Technology Madras, Chennai-600 036, India
Fax: +91 44 2257 4202; Tel: +91 44 2257 4233; E-mail: [email protected]
Table of contents: Page No.
General experimental information 2
General scheme 3
Experimental procedure & Spectral data 4-8
Gelation studies
Solvent preferences and CGC values 9-13
Variable temperature 1H NMR studies 14-15
IR studies 15-16
Rheology studies 17
Phase selective gelation studies 18-21
Powder XRD studies 22
SEM images of xerogels 23
Load bearing and Transparent gel images 24
1H & 13C NMR spectra of various compounds 25-30
References 31
Electronic Supplementary Material (ESI) for RSC Advances.This journal is © The Royal Society of Chemistry 2016
2
General experimental information:
Experiments which required anhydrous conditions were carried out under nitrogen
atmosphere in dry dichloromethane (DCM). Thin-layer chromatography (TLC) was
performed on 0.25 mm silica gel plates (60 F254 grade) from Merck, and were analyzed
using 254 nm UV light. Chromatographic separation was carried out on 100-200 mesh silica
gel in gravity mode. 1H NMR and 13C NMR spectra were recorded on Bruker Avance 400
MHz and 500 MHz instruments, and the chemical shifts () are reported in parts per million
(ppm) relative to tetramethylsilane (TMS) with coupling constant (J) values in Hertz (Hz).
The splitting patterns in 1H NMR spectra are reported as follows: s = singlet; d = doublet; t =
triplet; dd = doublet of doublet; m = multiplet, bs = broad singlet. 13C NMR data are reported
with the solvent peak (CDCl3, = 77.0 ppm) as the internal standard. Mass spectra were
recorded under ESI/HRMS at 60000 resolution using Thermoscientific Exactive mass
spectrometer. Infrared spectra were recorded using a Nicolet 6700 FT-IR spectrophotometer.
Powder X-Ray diffraction data was obtained on BRUKER D8-Advance diffractometer using
CuK radiation (λ=1.5418 Å) over the range of 0.5°< 2θ < 15° at room temperature. Samples
for SEM imaging were coated with Au-Pd (Gatan precision etching coating system (model
No. 682) operating at 5 KeV) and analyzed by FEI Quanta FEG 200 High Resolution
Scanning Electron Microscope operating at 10-30 kV. Rheological measurements were
performed with a stress-controlled rheometer (MCR 301) equipped with steel-coated parallel-
plate geometry (25 mm diameter). The gap distance was fixed at 1 mm and a solvent-trapping
device was placed above the plate to prevent solvent evaporation. All measurements were
done at 25°C. The synthetic strategy adopted to access various compounds reported here is
presented in Schemes 1 and 2. Detailed experimental procedures are given subsequently.

3
Synthesis of aryl-triazole peptide 1, and its derivatives 2 and 3
H2N CO2H
N CO2Bn
N NHON CO2Bn
N NN3
N CO2Bn
N NBocHN
N3 CO2H N3 CO2Bn
NaNO2 +HCl, 0oC
AcONa, NaN3
K2CO3, BnBr
CH3CN, 6 h, rt
Sodium Ascorbate, 10 mol%CuSO4.5H2O, 2 mol%
t-BuOH/H2O(1:1) 12 h rt
OH
1.Et3N, MsCl, CH2Cl20oC to rt 2 h
2. NaN3, DMF50oC, 12 h
1. PPh3, THF-H2O, 10 h 60oC
2. Boc2O 6 h rt
1.1 1.2 1.3
1.4 1.5 1.6
Scheme1. Synthesis of Building-block 1.6
Scheme 2. Synthesis of compounds 1, 2 and 3; a) EDCI (1equiv.), HOBt (1 equiv.), DIPEA (3 equiv.), 24 h, 0oC to rt, 95% b) (i) H2, Pd/C (10%), 4 h, rt, (ii) Lauryl amine, EDCI (1 equiv.), HOBt (1 equiv.), DIPEA (3 equiv.), 24 h, 0oC to rt, 87%, c) (i) Trifluoroacetic acid, DCM, 0oC to rt 3 h (ii) Lauroyl chloride (1.5 equiv.), DIPEA (3 equiv.) 0oC to rt 12 h, 85%.

4
General reaction procedures:
Debenzylation of Benzyl esters 1.6 and 1: To a solution of benzyl ester (1 equiv.) in methanol
(10 mL) taken in an RB flask, was added 10% Pd/C (20% w/w), and the mixture was stirred
under an atmosphere of hydrogen (H2 balloon) at room temperature for 4 h. The catalyst was
filtered through a celite bed, washed thoroughly with methanol and the filtrate was
evaporated under reduced pressure. The resulting residue was washed with hexane and dried
under high vacuum to get the corresponding acid as off-white solid.
Boc-deprotection of 1.6 and 1: To a solution of the Boc-protected precursor (1 equiv.) in dry
dichloromethane at 0oC was added TFA (0.5 mL). The mixture was gradually allowed to
warm to room temperature and was stirred until the starting material was completely
consumed as per TLC (~3 h). Subsequently, all the volatiles were removed under a stream of
nitrogen, toluene (1 mL) was added to the residue, and evaporated to dryness to get the amine
as trifluoroacetate salt.
Peptide coupling protocol
To a stirred mixture of the acid component (1.1 mmol), HOBt (1.2 mmol) and EDCI (1.2
mmol) in 5 mL of dry DCM was added DIPEA (3 mmol) at 0oC. After 1 h, the amine
trifluoroacetate salt (1 mmol) in dry DCM (5 mL) was added to it and the mixture was
continued to stir for 24 h at room temperature. Subsequently, the volatiles were removed
under reduced pressure, the residue dissolved in ethyl acetate, and the organic layer was
successively washed with 5% HCl (10 mL) and saturated sodium bicarbonate (10 mL). After
drying with sodium sulphate, the organic layer was evaporated under reduced pressure to get
the crude product which was further purified by column chromatography using ethyl acetate
/Hexane mixture in a gradient mode. The intermediates 1.2 and 1.3 used in Scheme 1 were
synthesized according to the literature protocol.1
Synthesis of individual compounds and their spectral data
Benzyl 2-(4-(hydroxymethyl)-1H-1,2,3-triazol-1-yl)benzoate (1.4):
To a solution of the azide 1.3 (8.8 g, 34.62 mmol) in 1:1 mixture of tBuOH/water (80 mL) in
a round bottom flask was added propargyl alcohol (2.0 mL, 34.62 mmol) drop-wise. The
mixture was stirred for 5 minutes and a solution of sodium ascorbate (2.05 g, 10.38 mmol) in
water (5 mL) and copper sulphate pentahydrate (0.26 g, 1.04 mmol) in water (2 mL) were

5
sequentially added to it. Stirring was continued for ~12 h till the starting materials were
completely consumed. After evaporating tBuOH, the residue was dissolved in ethyl acetate,
washed with water (3 x 50 mL), the combined organic portion dried using anhydrous sodium
sulphate, filtered, and evaporated to dryness. Purification of resulting residue was done by
column chromatography using 50% Ethyl acetate-hexane solvent system in a gradient mode
and the product was obtained as a viscous liquid (9.7 g, 90 %). Analytical data: Rf: 0.35 (50
% Ethylacetate- Hexane); 1H NMR (CDCl3, 400 MHz): δ 8.01 (dd, 1H, J = 7.7 Hz, 1.5 Hz),
7.73 (s, 1H) 7.63 (ddd, 1H, J = 7.6, 7.6, 1.6 Hz), 7.57 (ddd, 1H, J = 7.6, 7.6, 1.4 Hz), 7.42
(dd, 1H, J = 7.6, 1.2 Hz), 7.32-7.30 (m, 3H), 7.22-7.20 (m, 2H), 5.11 (s, 2H), 4.72 (s, 2H),
2.89 (bs, 1H); 13C NMR (CDCl3, 100 MHz): 165, 147.5, 136.0, 134.8, 132.8, 131.4, 129.9,
128.6 (2C), 128.49, 128.46 (2C), 127.4, 126.8, 123.8, 67.6, 56.1 IR (neat): 3371, 3151, 3033,
2926, 2876, 1720, 1455, 1292, 1276, 1124, 1078, 1021, 760, 700; HRMS (ESI) exact mass
calcd. for C17H15N3O3Na [M+Na]+ 332.1011, found [M+Na]+ 332.1004.
Benzyl 2-(4-(azido methyl)-1H-1,2,3-triazol-1-yl)benzoate (1.5):
To a stirred solution of the alcohol 1.4 (9 g, 29.09 mmol) in dry dicholoromethane (80 mL) at
0oC under nitrogen atmosphere was added triethylamine (8.1 mL, 58.19 mmol), followed by
mesyl chloride (3.38 mL, 43.63 mmol). The reaction was monitored by TLC, and after
complete consumption of starting materials (2 h), the mixture was washed with 5% NaHCO3
solution (50 mL) and brine (50 mL). The organic layer was dried over anhydrous Na2SO4 and
concentrated under reduced pressure to get the mesylate as a gummy solid. To a stirred
solution of this mesylate in DMF (40 mL) was added NaN3 (3.8 g, 58.19 mmol) and the
mixture was heated at 50oC for 12 h. The reaction mixture was diluted with ethyl acetate and
washed with water (3 x 50 mL), followed by brine (50 mL) and then dried over anhydrous
Na2SO4. It was filtered and concentrated under reduced pressure to get a residue which was
purified by chromatography on silica gel using 30% ethyl acetate- hexane system to afford
the azide 1.4 as a viscous liquid (6.8 g, 70 %). Analytical data: Rf: 0.82 ( 50 % Ethyl acetate-
Hexane); 1H NMR (CDCl3, 400 MHz): δ 8.06 (d, 1H, J = 7.4 Hz, ), 7.74 (s, 1H), 7.68 (app. t,
1H, J = 7.0 Hz), 7.61 (app. t, 1H, J = 7.3 Hz),7.47 (d, 1H, J = 7.0 Hz,), 7.33 (m, 3H), 7.25-
7.23 (m, 2H), 5.14 (s, 2H), 4.43 (s, 2H) 13C NMR (CDCl3, 100 MHz): 164.8, 142.4, 135.9,
134.8, 132.9, 131.5, 130.1, 128.62 (2C), 128.58, 128.51 (2C), 127.5, 126.9, 124.2, 67.6, 45.5;
IR(neat): 3150, 3020, 2930, 2873, 2132, 1725, 1458, 1292, 1278, 1124, 1078, 1021, 766,
700; HRMS (ESI) exact mass calcd. for C17H14N6O2Na [M+Na]+ 357.1075, found [M+Na]+
357.1074.

6
Benzyl 2-(4-(((tert-butoxycarbonyl) amino) methyl)-1H-1,2,3-triazol-1-yl)benzoate (1.6):
To a stirred solution of 1.5 (5 g, 14.95 mmol) in THF/H2O (3:1, 40 mL) was added
triphenylphosphine (4.7 g, 17.94 mmol). The mixture was stirred at room temperature for 30
minutes, heated to 60oC and continued stirring at the same temperature for 10 h. After
bringing it to room temperature, Boc2O (5.15 mL, 0.22 mmol) was added and stirring was
continued for 6 h. Excess solvent was then evaporated and the residue was purified by
column chromatography using 30% ethyl acetate-hexane solvent system to get 1.6 as a white
solid (4.25 g, 70 %). Analytical data: Rf: 0.56 ( 50 % Ethyl acetate- Hexane); m.p. 87-89 oC; 1H NMR (CDCl3, 400 MHz): 8.04-8.03 (d, 1H, J = 7.6 Hz), 7.69 (s, 1H), 7.68-7.59 (m, 2H),
7.44-7.42 (d, 1H, J = 7.6 Hz), 7.35-7.33 (m, 3H), 7.23-7.21 (m, 2H), 5.12 (s, 2H), 5.00 (broad
s, 1H), 4.34 (s, 2H), 1.44 (s, 9H) 13C NMR (CDCl3, 100 MHz): 165.0, 155.8, 145.2, 136.1,
134.9, 132.8, 131.5, 129.9, 128.6 (2C), 128.55, 128.51 (2C), 127.5, 126.8, 123.8, 79.7, 67.6,
36, 28.4 (3C); IR(neat) : 3439, 3151, 3015, 2975, 2851, 1716, 1510, 1455, 1363, 1288, 1263
1163, 1124, 1081, 870, 763, 700; HRMS (ESI) exact mass calcd. for C22H24N4O4Na
[M+Na]+ 431.1695, found [M+Na]+ 431.1699.
Benzyl 2-(4-((2-(4-(((tert-butoxycarbonyl) amino)methyl)-1H-1,2,3-triazol-1-
yl)benzamido)methyl)-1H-1,2,3-triazol-1-yl)benzoate (1):
To a stirred mixture of the acid 1.7 (0.5 g, 1.57 mmol), HOBt (0.25 g, 1.88 mmol) and EDCI
(0.36 g, 1.88 mmol) in dry dichloromethane (10 mL) at 0oC was added DIPEA (3 mmol).
After stirring for 1 h, the amine trifluoroacetate salt 1.8 (0.63 g, 1.57 mmol) in 5 mL of dry
dichloromethane was added, and stirring continued for 24 h at room temperature. All the
volatiles were then removed under reduced pressure, the residue dissolved in ethyl acetate
and washed successively with 5% HCl (3 x 10 mL) and saturated NaHCO3 (3 x 10 mL). After
drying with sodium sulphate, the organic layer was evaporated under reduced pressure to get
a residue which was purified by column chromatography using 80% ethyl acetate/hexane
system to get the product as a white solid (0.9 g, 95 %). Analytical data: Rf:, 0.13 ( 50 %
Ethyl acetate- Hexane); mp 98-100 oC 1H NMR (CDCl3, 400 MHz): 8.07-8.05 (d, 1H, J =
7.6 Hz), 7.79 (s, 1H), 7.77 (s, 1H), 7.71-7.66 (m, 2H), 7.63-7.53 (m, 4H), 7.47-7.45 (d, 1H, J
= 7.6 Hz), 7.28-7.25 (m, 3H), 7.18-7.16 (m, 2H) 6.39 (bs NH2, 1H), 5.31 (bs, 1H, NH1), 5.11
(s, 2H), 4.48 (s, 2H), 4.39 (s, 2H), 1.42 (s, 9H); 13C NMR (CDCl3, 100 MHz): 166.4, 164.9,
155.8, 146.0, 143.4, 136.1, 134.9, 134.3, 132.9, 132.4, 131.5, 131.2, 130.0, 129.9, 129.1,

7
128.5 (2C), 128.4 (2C), 128.4, 127.3, 127.1, 125.8, 124.7, 123.7, 79.7, 67.5, 36.0, 35.1, 28.3
(3C); IR(neat): 3449, 3151, 3015, 2975, 2926, 2855,1734, 1705, 1627, 1606, 1502, 1455,
1399, 1288, 1249, 1166, 1120, 1046, 767, 700; HRMS (ESI) exact mass calcd. for
C32H32N8O5Na [M+Na]+ 631.2393, found [M+Na]+ 631.2407.
Preparation of dipeptide derivative 2:
To a solution of 1 (1 mmol) in methanol (10 mL) in an RB flask was added 10% Pd/C (20%
w/w), and the mixture was stirred under an atmosphere of hydrogen (H2 balloon) at room
temperature for 6 h. The catalyst was filtered through a celite bed, washed thoroughly with
methanol and the filtrate was evaporated under reduced pressure get the free acid which was
directly used in the next step without further purification.
To a stirred solution containing mixture of the free acid generated above (0.5 g, 0.96 mmol),
HOBt (0.15 g, 1.15 mmol) and EDCI (0.22 g, 1.15 mmol) in 10 mL dry dichloromethane was
added DIPEA (0.5 mL, 2.88 mmol) at 0oC. After 1 h, lauryl amine (0.26 mL, 1.92 mmol) in
dry dichloromethane (2 mL) was added to the mixture and stirring continued for 24h at room
temperature. All the volatiles were then removed, the residue dissolved in ethyl acetate, and
washed successively with 5% HCl (3 x 10 mL) and saturated NaHCO3 (3 x 10 mL). After
drying with sodium sulphate, the organic layer was evaporated under reduced pressure to get
a residue which was purified by column chromatography using 80% ethyl acetate/hexane
solvent system to get the product as a solid (0.57 g, 87 %). Analytical data: Rf: 0.21 (50 %
Ethyl acetate- Hexane); mp 118-120 oC 1H NMR (CDCl3, 400 MHz): 7.83 (s, 1H), 7.79 (s,
1H),7.74-7.64 (m, 2H), 7.61-7.50 (m, 5H), 7.45-7.38 (m, 1H), 6.84 (bs, 1H), 6.52 ( br s, 1H),
5.40 (bs, 1H), 4.6 (s, 2H), 4.27 (s, 2H), 3.20 (m, 2H), 1.37 (m, 2H), 1.41 (s, 9H), 1.26-1.13
(m, 18H), 0.86 (t, 3H, 6.8 Hz); 13C NMR (CDCl3, 100 MHz): 166.48, 166.43, 155.7, 146.0,
144.0, 134.1, 133.8, 133.0, 132.56, 131.1, 130.8, 130, 129.9, 129.21, 129.15, 125.8,
125.7,124.7, 123.8, 79.7, 40.1, 36.0, 35.2, 31.9 29.6 (2C), 29.55, 29.51, 29.3, 29.2, 29.1,
28.4(3C), 26.8, 22.6, 14.1; IR (neat): 3442, 3287, 3149, 3017, 2925, 2856, 1700, 1663, 1654,
1640, 1606, 1557, 1539, 1525, 1508, 1459, 1214, 1165, 1045, 1019, 763, 669; HRMS (ESI)
exact mass calcd. for C37H51N9O4Na [M+Na]+ 708.3961, found [M+Na]+ 708.3973.
Preparation of dipeptide derivative 3:
To a stirred solution of 2 (1 mmol) in dry dichloromethane (5 mL) at 0oC was added TFA
(0.5 mL). The mixture was gradually allowed to warm to room temperature and stirred for

8
another 3h. After completion of the reaction as indicated by TLC, all the volatiles were
removed under a stream of nitrogen. Toluene was then added to the residue, and evaporated
to dryness to get the trifluoroacetate salt of the amine, which was used in the next step
without further purification.
To a stirred solution of the amine trifluoroacetate salt generated above (0.5 g, 0.82 mmol) and
DIPEA (0.42 mL, 2.47 mmol) in dry dichloromethane (10 mL) was added lauroyl chloride
(0.28 mL, 1.23 mmol) drop wise at 0 °C under N2 atmosphere. The reaction mixture was
warmed to room temperature and allowed to stir for 12 h. After completion of the reaction (as
per TLC), the mixture was washed with water and extracted with dichloromethane. The
organic layer was dried using Na2SO4, filtered, and evaporated under reduced pressure. The
residue was then purified by column chromatography on silica gel using 80% ethylacetate-
hexane solvent system in a gradient mode to get the product as a white solid (0.48 g, 85 %).
Analytical data: Rf: 0.21 (50 % Ethyl acetate- Hexane); mp 74-76 oC 1H NMR (CDCl3, 400
MHz): 8.10-8.01 (d, 1H, J = 6.8 Hz), 7.78 (s, 1H), 7.77 (s, 1H), 7.75-7.65 (m, 2H), 7.65-7.51
(m, 4H), 7.47-7.40 (d, 1H, J = 6.8 Hz), 7.27 (m, 3H), 7.21-7.14 (m, 2H) 6.66 (bs, 1H, NH2),
6.42 (bs, 1H, NH1), 5.11 (s, 2H), 4.49 (s, 2H), 4.46 (s, 2H), 2.15 (t, 2H, J = 7.6 Hz), 1.57 (m,
2H), 1.22 (m, 16H), 0.87 (t, 3H, J = 6.8 Hz); 13C NMR (CDCl3, 100 MHz): 173.5, 166.2,
164.9, 145.4, 143.4, 136.1, 134.9, 134.2, 132.9, 132.3, 131.4, 131.2, 130.0, 129.9, 129.4,
128.48(2C), 128.45(2C), 128.42, 127.4, 127.1, 125.8, 124.8, 124.0, 67.5, 36.4, 35.1, 34.8,
31.9, 29.6 (2C), 29.5, 29.33 (2C), 29.3, 25.6, 22.7, 14.1. IR (neat): 3445, 3152, 3017, 2956,
2931, 2856, 1721, 1663, 1603, 1519, 1510, 1459, 1425, 1290, 1264, 1217, 1126, 1042, 1016,
930, 766, 666; HRMS (ESI) exact mass calcd. for C39H46N8O4Na [M+Na]+ 713.3539, found
[M+Na]+ 713.3556.

9
Gelation studies
To perform the gelation test, a weighed amount of the gelator (mg) in a 5 mL vial was
dissolved in appropriate solvent (measured volume) by gentle heating. It was then allowed to
reach room temperature. Gelation is usually evident from the decreased mobility of the
solvent which can be confirmed by inverting the vial; instead of flowing down, it remains
stable on the top which can be taken as the sign of gelation. This procedure is usually called
vial inversion method. Following this, Critical Gelation Concentration (CGC), which
represent the minimum amount of the gelator required to immobilize 1 mL of the solvent was
calculated.
Table 1. Critical gelation concentration values of organogelators 1 and 2 in different organic solvents; behaviour of 3 in these solvents is also shown. OG: opaque gel, TG: transparent gel, WG: weak gel, S: solution, P: precipitate
Organic solvents 1(CGC/ wt. %) 2(CGC/ wt. %) 3
Benzene 1.5 (OG) 1.2 (TG) P
Toluene 0.6 (OG) 1.0 (TG) P
m-Xylene 0.3 (OG) 0.8 (TG) P
Mesitylene 0.1 (TG) 0.5 (TG) P
Carbon
tetrachloride
.08 (TG) 1.5 (TG) I
Ethylacetate-
Hexane (1:1)
0.5 (OG) 0.3 (TG) P
p-xylene 0.7 (OG) 0.6 (TG) S

10
Chlorobenzene 2.0 (OG) S S
Bromobenzene 2.0 (OG) S S
Chloroform-
hexane (1:1)
P 0.1 (TG) P
Diesel I 0.3 (TG) WG
Petrol I 0.1(TG) WG
Coconut oil I 0.5 (TG) P
Almond oil I 1.0 (TG) P
Groundnut oil I 1.0 (TG) P
Olive oil I 1.2 (TG) P
Dichloromethane
-Hexane (1:2)
P 0.5(TG) P
THF-Heptane
(1:4)
P 0.25(TG) P
Methanol S S S
Ethanol S S S

11
Isopropanol 2.5(OG) S S
Dodecanol 2(OG) S S
Figure 1. Gels of 1 and 2 in various solvents: a) 1 in CCl4; b) 1 in Mesitylene; c) 2 in DCM/Hexane (1:2); d) 2 in Mesitylene; e) 2 in Olive oil; f) 2 in Groundnut oil; g) 2 in Gingili oil; h) 2 in Almond oil; i) 2 in Coconut oil.
Gel Melting Temperature (Tgel)
The melting temperature/stability of gels formed by compounds 1 and 2 in different solvents
were determined by ‘ball dropping method’. Here, a small steel ball which weights 100 mg
was placed on the top of the specific gel formed from 1 mL of the solvent in a stoppered glass
vial. It was slowly heated with an eye on the ball situated on the top. Softening of the gel
under heat initiates downward movement of the ball and the temperature at which it reaches
the bottom of the vial is noted as the sol-gel phase transition temperature (Tg).
12
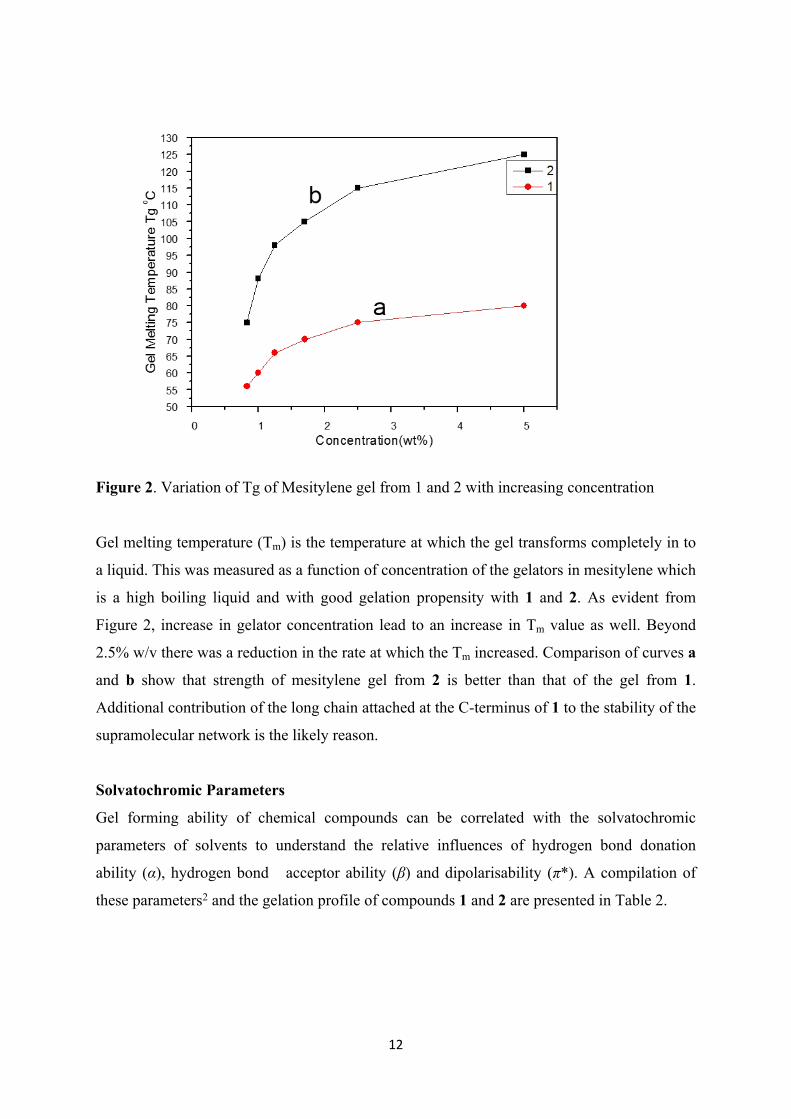
Figure 2. Variation of Tg of Mesitylene gel from 1 and 2 with increasing concentration
Gel melting temperature (Tm) is the temperature at which the gel transforms completely in to
a liquid. This was measured as a function of concentration of the gelators in mesitylene which
is a high boiling liquid and with good gelation propensity with 1 and 2. As evident from
Figure 2, increase in gelator concentration lead to an increase in Tm value as well. Beyond
2.5% w/v there was a reduction in the rate at which the Tm increased. Comparison of curves a
and b show that strength of mesitylene gel from 2 is better than that of the gel from 1.
Additional contribution of the long chain attached at the C-terminus of 1 to the stability of the
supramolecular network is the likely reason.
Solvatochromic Parameters
Gel forming ability of chemical compounds can be correlated with the solvatochromic
parameters of solvents to understand the relative influences of hydrogen bond donation
ability (α), hydrogen bond acceptor ability (β) and dipolarisability (π*). A compilation of
these parameters2 and the gelation profile of compounds 1 and 2 are presented in Table 2.

13
Table 2. Solvatochromic parameters of different solvents and gelation profiles of 1 and 2; G = Gel; S = sol; I = insoluble
S.No. solvents π*(solvent polarizability)
β(HBA) α(HBD) 1 2
1 cyclohexane 0.00 0.00 0.00 I G2 Carbon
tetrachloride0.28 0.00 0.00 G (0.08) G (1.5)
3 Dichloroethane 0.81 0.00 0.00 S S4 Dibromoethane 0.75 0.00 0.00 S S5 Mesitylene 0.41 0.00 G (0.1) G6 Iodobenzene 0.81 0.00 G G7 Toluene 0.54 0.11 0.00 G (0.6) G8 Benzene 0.59 0.10 0.00 G (1.5) G9 Chlorobenzene 0.71 0.07 0.00 G (2) S10 Bromobenzene 0.79 0.06 0.00 G (2) S11 Ethyl acetate 0.55 0.45 0.00 S S12 Tetrahydrofuran 0.58 0.55 0.00 S S13 Acetonitrile 0.75 0.31 0.19 S S14 DMF 0.88 0.69 0.00 S S15 DMSO 1.00 0.76 0.00 S S16 Methanol 0.60 0.62 0.93 S S17 Ethanol 0.54 0.77 0.83 S S18 Isopropanol 0.48 0.95 0.76 G(2.5) S19 t-butanol 0.41 1.01 0.68 S S20 Ethylene glycol 0.92 0.52 0.90 S S
Figure 3. 3D Kamlet-Taft plot for compound 1 with various organic solvents mentioned in Table 2, gels has been coded with red colour.

14
Variable temperature 1H NMR experiments:
Gel network is stable only below a certain temperature. This can be correlated with the
stability of secondary interactions which hold the supramolecular network responsible for
gelation. As can be anticipated, 1H NMR signals of protons involved in hydrogen bonded
interactions appear relatively downfield in 1H NMR spectrum. At higher temperatures, such
secondary interactions break down, which results in the upfield shifting of these signals. To
get a closer look into these, temperature-dependant 1H NMR study of 1 and 2 in Toluene-D8
was carried out and the results are presented in Figures 4 and 5. In general, the signals were
relatively sharper at temperatures above Tg.
Figure 4. Variable temperature 1H NMR (500 MHz) spectra of 1 in Toluene-d8.

15
Figure 5. Variable temperature 1HNMR (500 MHz) spectra of 2 in Toluene-d8.
IR experiments:
FT-IR is useful for understanding the hydrogen bonding pattern in self-assembled
systems. The FT-IR spectrum of 1 drop-casted from chloroform solution showed
transmission bands at 3447, 1656, and 1510 cm-1 (Figure 6(a) ) which are characteristic of
nonhydrogen bonded NH (stretching), carbonyl (stretching), and NH (bending) whereas its
xerogel (from toluene) had these bands at 3392, 1630, and 1533 cm-1 (Figure 6(b). Lowering
of stretching frequencies of NH and amide carbonyl and a slight increase in NH bending
frequency are clear indications of hydrogen bonding effects. Similarly FTIR of 2 from
chloroform (neat) showed transmission bands at 3440, 1655, and 1518 cm-1 which shifted to
3374, 1644 and 1526 cm-1 in the case of xerogel from toluene (Figure 6(c) and (d)). In
addition to this asymmetric and symmetric CH2 stretching frequencies appeared at 2927 and
2855 cm-1 in the case of neat sample whereas the toluene xerogel had these bands at 2925 and
2853 cm-1. This lowering of frequency indicates some rigidity of the alkyl chain because of
the Van der Waals association of CH2 units in the xerogel compared to that in the neat
sample. Thus, hydrogen bonding as well as Van der Waals interactions are playing crucial
roles in the self-assembly of 2.

16
Figure 6. a) IR spectrum of 1 (neat) from CHCl3, b) IR spectrum (KBr pellet) of the xerogel of 1 from Toluene c) IR spectrum of 2 (neat) from CHCl3 d) IR spectrum (KBr pellet) of the xerogel of 2 from Toluene.
Figure 7. 1)IR spectrum of toluene gel of 1 showing NH stretching transmission at 3400cm-1, carbonyl stretching transmission at 1642 cm-1, and NH bending transmission band at 1524 cm-1, 2) IR spectrum of toluene gel of 2 showing NH stretching transmission at 3382cm-1, carbonyl stretching transmission at 1643 cm-1, and NH bending transmission band at 1523 cm-1

17
Rheological experiments (Flow behaviour of Organogels)
Stress sweep experiment showing high yield stress value (269 Pa) for Petrol gel of 2 (2 %
w/v) is shown in Figure 8A, whereas the results from its frequency sweep experiment
indicating high strength over a wide range of frequency is shown in Figure 8B. Figure 9D
shows the frequency dependence of the storage modulus (G’) and loss modulus (G’’) of
carbon tetrachloride- and mesitylene gels of 1 observed in an oscillatory frequency sweep
experiment. For both the gels, G’ was higher than G’’ over the entire frequency range (0-200
rad/s). The storage modulus (G’) in carbon tetrachloride gel was in the order of 105 Pa
whereas that for mesitylene gel, of the order of 104 Pa, indicating that the former is one order
magnitude stronger than the latter. The yield stress value () of >100 Pa for these gels is also
an indication of their higher strength (Figure 9C).
A B
Figure 8. Results from stress sweep experiment (A) and frequency sweep experiment (B) with the petrol gel of 2 (2 wt%).
C D
Figure 9. Results from stress sweep experiment (C) and frequency sweep experiment (D) with carbon tetrachloride and Mesitylene gels of 1.

18
Phase selective gelation Studies
10 mg of the gelator (1 or 2) was added to a mixture of water (1 mL) and appropriate
aromatic solvent (toluene, p-xylene or mesitylene; 1 mL) in a vial. The mixture was heated
gently to dissolve the gelator and then allowed to cool to room temperature. This led to
gelation of the organic phase (stable to vial inversion), leaving the aqueous portion intact
(Figure 10). To know whether presence of metal salts/additives can affect phase selective
gelation, we have carried out a series of tests using aqueous solutions of potassium
dichromate, Potassium permanganate, and Nickel (II) chloride. As evident from images
shown in Figure 10A and Figure 10B, gelation was efficient in all cases without any
noticeable influence from these additives.
Figure 10A. Phase selective gelation of 1 with (a) Toluene from water, (b) p-xylene from water, (c) Mesitylene from water, (d) Mesitylene from aqueous solution of K2Cr2O7, (e) Mesitylene from aqueous solution of KMnO4, (f) Mesitylene from aqueous solution of Nickel (II) chloride.
Figure 10B. Phase selective gelation of 2 with (a) Toluene from water, (b) p-xylene from water, (c) Mesitylene from water, (d) Mesitylene from aqueous solution of K2Cr2O7, (e) Mesitylene from aqueous solution of KMnO4, (f) Mesitylene from aqueous solution of Nickel (II) chloride.

19
Removal of Rhodamine B dye from water.
Dye removal experiments were done under three difference conditions.
i) Gelation with 2 after the dye is partitioned into mesitylene: Mesitylene (1 mL) was added
to a solution of Rhodamine B dye in tap water (2 mL, 0.047 mM, Figure-11a) and shaken
well. This led to partitioning of the dye in the mesitylene layer as shown in Figure 11b. A
solution of 2 (15 mg in 0.1mL THF) was then added to it, which led to gelation of mesitylene
layer in less than 30 minutes (Figure 11c). The gel was stable on vial inversion as shown in
Figure 11d. It was possible to decant the water layer leaving the dye entrapped gel in the vial
as shown in Figure 11e and 11f. UV-Vis spectra presented in Figure 12 show the absorbance
of aqueous portion before (solid line) and after (dashed line) dye removal.
Figure 11. Removal of rhodamine B dye from water using organogelator 2 in mesitylene
Figure 12. UV-Vis spectrum absorbance of the aqueous portion before (solid line) and after (dashed line) dye removal; 0.047 mM solution of Rhodamine B dye was used.
ii) Partitioning of the dye to the pre-formed mesitylene gel of 2: The gel formed from 1 mL of
mesitylene and 1 % w/v of 2 was placed in the aqueous solution of the dye (0.047 mM, 1 mL)

20
in a vial. As shown in Figure 13, the colour of the aqueous layer disappeared in 4 h, after
which it was decanted. The UV-Vis spectra of the aqueous layer before and after the dye
removal are shown in Figure 14 It was possible to use the same gel multiple times, in present
case we used it three times (Figure 14)
Figure 13.a) 1mL of 0.047 mM Rhodamine in water, b) preformed Mesitylene gel (1 % w/v) was added, c) after 4 hours complete removal of dye, d) removal of water leaving transparent gel containing dye
Figure 14. Absorption spectra of 0.047 mM rhodamine B in water (black), first fraction after purification (red), second fraction after purification from same gel (blue), third fraction (green).
Selective removal of Rhodamine B dye from a mixture of Rhodamine B and Methylene blue
Figure 15. (a) Rhodamine B dye in water (0.03 mM, 2 mL) with mesitylene gel of 2 (1 wt%), (b) mixture of Rhodamine B dye (0.03 mM, 1 mL) and methylene blue (0.03 mM, 1mL) with

21
mesitylene gel of 2 (1 wt%), (c) methylene blue dye in water (0.03 mM, 2 mL) with mesitylene gel of 2 (1 wt%); d-f represent the status of a-c respectively after 18h.
Figure 15d and 15e clearly indicate trapping of dye by the mesitylene gel block
whereas 15f doesn’t show any colour change after same amount of time. Interestingly from a
mixture of two dyes, only one was selectively removed as is evident from Figure 15e, which
was further confirmed by UV-spectra recorded after 18 h (Figure 16).
Figure 16. UV spectrum of mixture of Rhodamine B dye (0.03 mM, 1 mL) and methylene blue (0.03 mM, 1mL) dye (black solid line) and UV spectrum of the same mixture after 18 h of addition of 1wt% mesitylene gel of 2 (red solid line).

22
Powder XRD details
Powder X-ray diffraction (PXRD) analysis of xerogels of 1 and 2 were done to get an insight
into the molecular packing which is responsible for solvent entrapment. Figure 17 and 18
shows the PXRD patterns of xerogels of 1 from CCl4 and 2 from toluene. The xerogel of 1
displayed three peaks at 2 3.66, 7.6, 10.95 corresponding to d-spacings of 24.14, 11.7, and
8.07 nm, respectively. The values fall in the ratio 1: 1/2: 1/3, indicating a layered structure.
The xerogel of 2 displayed three reflection peaks at 2 values 3.5, 7.5, 10.3 respectively
corresponding to d-spacings: 25.3(d), 11.86(~d/2), 8.5(d/3) which again indicates a layered
structure.
Fig
ure 17. PXRD spectrum of xerogel of 1 from CCl4

23
F
igure 18. XRD pattern of xerogel of 2 from Toluene
Scanning Electron Microscopic images
Figure 19. SEM images of xerogel of 1 from CCl4 (A), Toluene (B); scale bar 1 µm
Figure 20 (a). SEM images of xerogel of 2 from CCl4 (A), CHCl3-hexane (B), Toluene (C); scale bar 2 µm for A, B and 1 µm for C.

24
Figure 21 (b). SEM images of Rhodamine B dye entrapped xerogel of 2 from Mesitylene under condition 1 (A), under condition 2 (B); scale bar is 50 µm for A and B.
Load bearing Property and Transparent gel images
Figure 22. (a) Water (~250 mL) in a 250 mL RB flask kept upside down sealed with 1.5 mL (0.9% w/v) Mesitylene gel of 2, (b) same RB flask (as in (a)) after 2 weeks, (c) Mesitylene layer responsible for Load bearing (zoom in of (a)) , (d) Contraction of mesitylene layer after 2 weeks (still able to bear load of 250 mL of water).

25
Figure 23. (a) Thin layer of Mesitylene gel of 2 in a petri dish showing its transparent nature (b) Transparent cylinder formed from 3 mL (2% w/v) Mesitylene gel of 2 , (c) Transparent pillars made from 3 mL (2% w/v) Mesitylene gel of 2 showing its excellent strength.

26
Figure 24. 1H NMR (400 MHz) spectra of 1.4 in CDCl3
Figure 25. 13C NMR (100 MHz) spectra of 1.4 in CDCl3
Figure 26. 1H NMR (400 MHz) spectra of 1.5 in CDCl3

27
Figure 27. 13C NMR (100 MHz) spectra of 1.5 in CDCl3
Figure 28. 1H NMR (400 MHz) spectra of 1.6 in CDCl3

28
Figure 29. 13C NMR (100 MHz) spectra of 1.6 in CDCl3

29
Figure 30. 1H NMR (400 MHz) spectra of 1 in CDCl3
Figure 31. 13C NMR (100 MHz) spectra of 1 in CDCl3
Figure 32. 1H NMR (400 MHz) spectra of 2 in CDCl3

30
Figure 33. 13C NMR (100 MHz) spectra of 2 in CDCl3
Figure 34. 1H NMR (400 MHz) spectra of 3 in CDCl3

31
Figure 35. 13C NMR (100 MHz) spectra of 3 in CDCl3
Refrences:
1) S. S. More , D. Shanmughapriya , Y. Lingam and N. B. Patel, Synthetic Communications, 2009,
39, 2058.